overview of property taxes in connecticut20140929_state tax panel\20151027/ct...1. the property tax...
TRANSCRIPT
DISCUSSION DRAFT 1 10/27/2015
OVERVIEW
OF PROPERTY TAXES IN CONNECTICUT
MICHAEL E. BELL
MEB ASSOCIATES AND
RESEARCH PROFESSOR GEORGE WASHINGTON INSTITUTE OF PUBLIC POLICY
GEORGE WASHINGTON UNIVERSITY
PREPARED FOR THE CONNECTICUT TAX STUDY PANEL
DISCUSSION DRAFT October 27, 2015
*This paper would not have been possible without the input and support of David LeVasseur and Shirley Corona of the Office of Policy and Management. Additional valuable comments on earlier versions of this paper were provided by John Chaponis from the Connecticut Association of Assessing Officers, George Rafael from the Connecticut Conference of Municipalities, John Anderson from the University of Nebraska, Michael Fedele from the Fedele Group, LLC, Gregory Servodidio, Esq. from Connecticut Business and Industry Association and John Rappa and Rute Pinho of the Office of Legislative Research. Any remaining errors of omission or commission are the sole responsibility of the author.
DISCUSSION DRAFT 2 10/27/2015
Table of Contents
Findings 3
The Property Tax: A Good Source of Local Revenues 5
Revenue Stability 6
Neutrality 6
Simplicity 7
Equity 8
Accountability 8
The Role of Property Taxes in State and Local Finance 9
Property Taxes as a Share of State and Local Own-Source Revenue 9
Property Taxes as a Share of State and Local Tax Revenues 12
Property Taxes per $1,000 of Personal Income 14
Property Taxes Per Capita 16
Local Government Reliance on Property Taxes in Connecticut 18
Property Tax Variation Across Municipalities in Connecticut 19
Determining Property Tax Liabilities in Connecticut 23
Defining the Property Tax Base 23
Valuing the Property Tax Base 26
Determining Assessment Quality 31
Other Considerations in Ratio Studies 32
Appeals Process 36
Determining the Property Tax Rate 38
Property Tax Relief Mechanisms 38
State Provided Property Tax Relief Programs 39
State Provided Municipal Option Property Tax Relief Programs 45
Circuit Breaker 49
Outcomes of Property Tax Administration in Connecticut 51
Variation in Net Grand List Per Capita 51
Regressivity of the Connecticut Property Tax 53
Effective Property Tax Rates 54
Conclusion 62
Bibliography 63
DISCUSSION DRAFT 3 10/27/2015
Findings 1. The property tax base in Connecticut is generally broader than the property tax base in
other states because it includes selected personal property and motor vehicles. In addition, Connecticut provides very modest property tax relief.
2. Both the Connecticut state and local revenue system, and local revenue systems are more dependent on property taxes than most other states.
a. Property taxes account for a high share of state and local own-source revenues (5th) and state and local taxes (11th). Property taxes in Connecticut rank 8th nationally in terms of property taxes per $1,000 of state personal income and 2nd in terms of property taxes per capita.
b. For local governments in Connecticut, property taxes are high relative to personal income (4.4 percent), a large share of local own-source revenues (86 percent), and a large share of local tax revenues (98.9 percent).
3. Heavy reliance on one source of tax revenue a. Undermines political balance between opposing philosophies of tax equity –
ability to pay principle and benefits received principle of taxation b. Undermines the realization of the benefits of revenue diversification since
individual revenue sources differ in terms of their revenue raising capacity, stability over the business cycle, growth rate, equity, ease of administration, economic effects and acceptability by citizens. Lack of revenue diversity in Connecticut prevents achievement of these benefits of revenue diversification.
4. The 5-year assessment cycle in Connecticut undermines the equity of the property tax and distorts measures of assessment quality which are used to equalize between towns for differences in assessment practices.
5. The state provides 22 full property tax exemptions for certain types/uses of property (colleges, hospitals, churches, etc.); 66 partial exemptions based on the characteristics of the owner and property (veterans, blind, elderly, etc.); 15 exemptions intended to promote economic and housing development; and 11 miscellaneous exemptions. Most are not used extensively and, as a result, property tax relief provided to taxpayers is very modest in Connecticut.
6. The state provides 38 property tax relief options to local governments with 73.7 percent of these tax relief measures being used by 3 or fewer municipalities. No local option relief measure is used by a majority of municipalities. Locally provided property tax relief is very modest also.
7. Significant fiscal disparities exist across municipalities in Connecticut making it difficult for many municipalities to raise sufficient revenues to provide a given level of goods and services to their citizens.
a. There is significant variation across Connecticut municipalities in the relative importance of the property tax as a share of total local revenues ranging from 39.2 percent in Putnam to 94.3 percent in Warren.
b. Revenue raising capacity as measured by the Net Grand List per capita varies across municipalities in Connecticut from a high of $494,018 in Greenwich to a low of $27,873 in Hartford.
DISCUSSION DRAFT 4 10/27/2015
c. There is significant variation across Connecticut municipalities in property taxes per $1,000 personal income ranging from a high of $279.58 in New Canaan to a low of $24.48 in Winchester.
8. Property taxes in Connecticut are regressive. According to a study by the Connecticut Department of Revenue Services, the 752,202 households with the lowest income in the state pay 25.9 percent of all property taxes and the 357 households with the highest incomes pay 1.9 percent. This regressivity is confirmed by a study from the Institute on Taxation and Economic Policy.
9. According to a study from the Minnesota Center for Fiscal Excellence, the effective property tax rate for homestead and apartment properties in urban areas (Bridgeport) are among the ten highest in the US. Property taxes on industrial properties in urban areas (Bridgeport) are among the highest 20 states in the US. Effective property taxes in rural areas (Litchfield) are more competitive, especially for commercial and industrial properties.
10. Effective property tax rates are high in Connecticut with 11 of the 19 representative municipalities having effective tax rates over 2 percent and 2 having effective tax rates over 3 percent. High effective tax rates exacerbate the limitations of the property tax.
11. Property tax relief provided to residential property owners in Connecticut is very modest. Few properties receive property tax relief and the relief provided is generally modest. As a result, the effective property tax rate for properties receiving property tax relief is only slightly lower than the effective property tax rate for property not receiving any relief.
DISCUSSION DRAFT 5 10/27/2015
In Democracy in America Alexis de Tocqueville concludes that to understand America you first have to understand the township, the political and administrative foundation of government. “It is nonetheless in the township that the force of free peoples resides.” [de Tocqueville, p. 57]
The American political landscape is dominated by the belief that local governments are critical to governance. Local governments provide the goods and services that impact the daily lives of all citizens, e.g., the road network, sewerage systems, provision of potable water, public schools, etc. In addition, local governments promote democratic ideals and practices. The ability of local government to pursue policies and programs that respond to the preferences of local residents requires own-source revenues that a local government can use as it sees fit. [Bell, Brunori, Youngman, p. vii] The only revenue source capable of ensuring a strong and vibrant local government is the property tax. [Brunori, 2] The property tax is the major source of locally raised revenues in Connecticut.
The purpose of this paper is first to lay out the argument why property taxes are a good revenue source for local governments. Second, the paper documents the importance of property taxes in Connecticut and compares that with the importance of property taxes in other states. Then the administration of the property tax in Connecticut is described. Finally, to the extent possible, the paper reflects on how the overall system of property tax administration is working in Connecticut.
The Property Tax: A Good Source of Local Revenues Local officials have two fundamental decisions to make: 1) what level, quality and composition of public goods and services should be provided to local residents, and 2) how should the cost of providing those public goods and services be shared across the members of the community? How should elected officials distribute the cost of providing community services across taxpayers in a fair or equitable manner?
In public finance there are two basic approaches to sharing the cost of providing services across taxpayers in a fair manner. First, there is the ability-to-pay-principle of taxation. The case for ability-to-pay principle of taxation for the real property tax rests on the argument that while it is not a perfect correlation, there is a strong relationship between the value of one’s property and income, higher income families tend to live in higher valued residences. Thus, taxing property value is a proxy, albeit an imperfect one, for ability-to-pay taxes.
Second, there is the benefits-received principle of taxation. Since the property tax funds community services – e.g., public education, police, fire, streets – the level and quality of these site oriented services benefits property owners and increases the value of their property. This is supported by numerous studies identifying factors explaining the actual sales price of individual properties.
The property tax is considered to be roughly consistent with both approaches to taxation. The tax generates reliable revenues, while minimizing distortions of private
DISCUSSION DRAFT 6 10/27/2015
market decisions in a way that taxpayers and voters can understand and is done in an equitable manner. The property tax scores well on the following criteria for a good revenue source [NCSL] and should be an essential foundation for any local revenue system.
Revenue Stability
The property tax tends to be a stable revenue source because it is based on asset value, not an annual stream of income or sales. A stable tax generates revenues that change relatively more slowly than the economy. Since real estate markets reflect long-term asset values, which tend to respond slowly to annual changes in the level of economic activity (less than economic flows like sales, personal income and profits) the property tax tends to be more stable than the general sales tax or the personal income tax.
The property tax, because of this relative stability, represents a critical anchor for funding local governments. In a recent study of the impact of the Great Recession on local revenues generally, and property taxes specifically, Alm, Buschman and Sjoquist concluded that local government reliance on the property tax rather than more elastic revenues sources like income, sales, and excise taxes has helped local governments avoid some of the more severe difficulties experienced by many other governments in the current economic situation. (Alm et al., 2011, 323)
Giertz documented a similar stabilizing impact of the growth in property tax revenues as income and sales tax revenues declined, albeit more modestly, as a result of the stock market decline in 2000 and the recession of 2001. (Giertz, 2006) Neutrality
Neutrality in taxation requires taxes minimize unintended influence on private economic decisions. What is to be avoided, to the extent possible, is a tax that causes taxpayers to adjust their behavior to avoid or minimize their tax liabilities. To the extent that economic actors adjust their behavior to shift or avoid the tax, the tax has distorted private economic decisions and the economy is moved to a less efficient, or lower welfare, position because of the tax (Fisher, 1996, 303).
As a general rule, such inefficiencies are best avoided by a system with a broad tax base (e.g., allow few, if any, tax exemptions, deductions, and credits) combined with low rates (NCSL, 1992).
In this context, an ideal real property tax would be broad based and include all forms of real property, i.e., land and structures for both residential and commercial properties, agricultural land and property owned by governments and non-profit organizations alike. In addition, because the property tax often is assessed primarily

DISCUSSION DRAFT 7 10/27/2015
against real property,1 which, in the short-run, is immobile, there is little that property owners can do to avoid the tax. Thus, the tax has little impact on their economic decisions in the short-run. In this respect, the property tax tends to distort private economic decisions less than other local taxes – especially when the base of the tax is defined as broadly as possible. Simplicity
Taxes may cause distortions in the allocation of economic resources if they are complex and difficult to administer. In such a situation, the taxpayer may spend substantial resources to comply with the tax law, and the local jurisdiction may expend substantial resources administering it.
The property tax is generally considered to be taxpayer-passive because most
taxpayers face minimal compliance costs. Alternatively, the property tax is considered to have higher administrative costs for the local government associated with preparing and maintaining the tax roll, generating and delivering tax bills, collecting tax revenues and enforcing the property tax when it is not paid in a timely fashion. In addition, local assessors determine the taxable value of all the properties on a town’s Grand List.2 Relative to other potential local tax sources with tax bases that are annual flows that must be monitored and verified (high compliance costs for both taxpayers and the government), the property tax is relatively easy to administer and involves low taxpayer compliance costs, except perhaps in the case of commercial and industrial property and motor vehicles which may have higher compliance costs for both the taxpayer and the government.
Another virtue of the property tax, from the government's perspective, is that taxpayers cannot easily hide or move real property.3 In addition, the property provides collateral for the tax liability. If the property owner fails to pay the taxes a lien is placed on the property. That lien prevents the property from being sold or mortgaged until the tax liability is satisfied. If collection efforts are unsuccessful, a local government can ultimately seize and sell the property. The local government retains the taxes owed, penalties, interests, and administrative costs, and in Connecticut remits the remainder of the funds to the court and the property owner must apply to the court for monies. While property tax sales are often the last resort for local governments, such sales provide powerful incentives to comply with the law. 1 The property tax base in Connecticut is broader than that in most states because, in addition to real property, the Connecticut property tax base also includes motor vehicles and select personal property which must be valued annually. 2 The property tax is different from other state and local taxes because the tax base, estimated market value, must be estimated by the government. The property tax is a tax on an asset value which does not change hands annually. In contrast the base of the personal income tax or general sales tax are based on annual economic flows, e.g., income or retail sales. 3 For some types of personal property this may not be the case.
DISCUSSION DRAFT 8 10/27/2015
Equity
Horizontal equity means that similarly valued properties are treated the same by the property tax. Two residential properties valued at $100,000 would pay the same property tax. Vertical equity generally means that taxpayers with different income levels should pay different amounts of tax. The property tax, however, deals with property values, not income levels. In this context, vertical equity means that there are no inequities in the appraisal levels for groups of propertied defined by value. [Eckert, 516]
To achieve a fair allocation of the responsibility for financing local public services,
properties need to be assessed for tax purposes uniformly. Appraisal uniformity requires the equitable treatment of individual properties both within and between groups (property types, use classes, neighborhoods, etc.). When individual property valuations are at the same percentage of market value, they are most likely to be accepted as fair. To promote fairness, then, the ultimate policy objective should be to implement the property tax uniformly across all property use classes at 100 percent of market value, which promotes transparency, as well as, horizontal and vertical fairness. Dissimilar treatment of similar properties -- real differences in the taxation of equals -- undermines confidence in the property tax system. Accountability
The property tax improves accountability in local finance because the tax is generally more visible than other potential local taxes. Many property owners pay property taxes by writing one or two checks a year to their local governments. Each check is relatively large so the property owner is aware of the tax and has to plan for its payment.4 As a result, property taxes paid are relatively large payments that are more easily linked in the mind of the taxpayer to the level and quality of goods and services provided by the local government. The visibility of the property tax provides, to some extent, public pressure that tends to keep property taxes lower than they might otherwise be.
In conclusion, based on traditional criteria for evaluating a revenue system, the local property tax emerges as a very defensible source of local revenues. While most economists would embrace this conventional wisdom, this conventional wisdom is being re-evaluated in light of legislative efforts to limit the ability of local governments to raise revenues from the property tax and reduce property tax liabilities for preferred groups of property owners or land uses. The manner in which the property tax is administered
4 Cabral and Hoxby (2012) estimate about 31 percent of people pay their property taxes through an escrow account which reduces the visibility of the tax. This is in contrast to the situation with income taxes where the tax is withheld each pay period for most individuals. The taxpayer is generally not aware of the amount of the tax being withheld and often gets a refund when they file their income tax return. Similarly, sales taxes are less visible than property taxes. A sales tax is paid on each transaction, but the taxpayer often has no idea how much sales tax she pays annually.
DISCUSSION DRAFT 9 10/27/2015
greatly influences its productivity, neutrality, simplicity, equity and accountability. Bahl et al conclude that
“bad practice has overtaken many of the potential advantages of taxing property . . . In the United States, voter preferences in recent years appear to be to trade an equitable property tax for one where revenue growth is restrained.” [Bahl et al. 2010, 14]
Giertz is more direct
“rather than a broad-based, low-rate tax that treats all types of real property uniformly, the tax in most states is characterized by a bewildering array of constraints and preferences including classified bases, rate limits, revenue limits and caps, assessment exemptions, freezes and caps, circuit breakers, and special incentives for business.” [Giertz, 2006. 695]
This does not describe the situation with the property tax in Connecticut. The risk of such a “confusing and opaque jumble of special provisions that accumulate as the broad base of the property tax is destroyed” [Witte, 2009, 314] is not as great in Connecticut because of the broader nature of the tax base (real and select personal property and motor vehicles) and the limited amount of property tax relief provided.
The next two sections document the importance of the property tax in financing government in Connecticut and compares that reliance to other state and local revenue systems. That is followed by a description of the framework for administering the real property tax in Connecticut.
THE ROLE OF PROPERTY TAXES IN STATE AND LOCAL FINANCE
State and local governments across the country generally have their own budget accounting and reporting systems. Such systems may even vary across local governments within the same state. In order to compare state and local revenue numbers across jurisdictions, researchers typically rely on data from Government Finances prepared annually by the US Census Bureau. The Census Bureau collects data from individual state and local governments and reconfigures that data in a manner that is consistent across state and local governments. This section reports on the relative importance of property taxes in the state and local revenue system across states and across Connecticut. Property Taxes as a Share of State and Local Own-Source Revenues
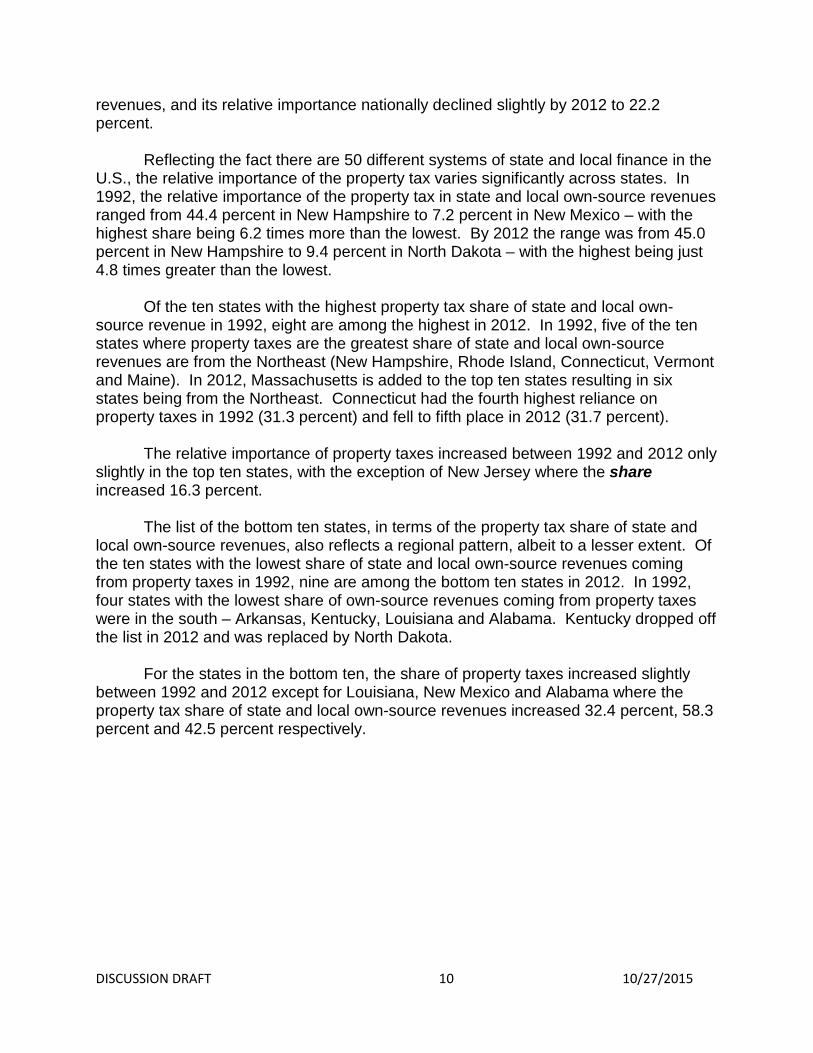
Table 1 reports the share of state and local own-source revenues attributable to the property tax (total state and local property taxes) for the ten states most dependent and the ten states least dependent on property taxes in 1992 and 2012. Nationally, in 1992 property taxes accounted for 22.5 percent of total state and local own-source
DISCUSSION DRAFT 10 10/27/2015
revenues, and its relative importance nationally declined slightly by 2012 to 22.2 percent.
Reflecting the fact there are 50 different systems of state and local finance in the
U.S., the relative importance of the property tax varies significantly across states. In 1992, the relative importance of the property tax in state and local own-source revenues ranged from 44.4 percent in New Hampshire to 7.2 percent in New Mexico – with the highest share being 6.2 times more than the lowest. By 2012 the range was from 45.0 percent in New Hampshire to 9.4 percent in North Dakota – with the highest being just 4.8 times greater than the lowest.
Of the ten states with the highest property tax share of state and local own-
source revenue in 1992, eight are among the highest in 2012. In 1992, five of the ten states where property taxes are the greatest share of state and local own-source revenues are from the Northeast (New Hampshire, Rhode Island, Connecticut, Vermont and Maine). In 2012, Massachusetts is added to the top ten states resulting in six states being from the Northeast. Connecticut had the fourth highest reliance on property taxes in 1992 (31.3 percent) and fell to fifth place in 2012 (31.7 percent).
The relative importance of property taxes increased between 1992 and 2012 only slightly in the top ten states, with the exception of New Jersey where the share increased 16.3 percent.
The list of the bottom ten states, in terms of the property tax share of state and
local own-source revenues, also reflects a regional pattern, albeit to a lesser extent. Of the ten states with the lowest share of state and local own-source revenues coming from property taxes in 1992, nine are among the bottom ten states in 2012. In 1992, four states with the lowest share of own-source revenues coming from property taxes were in the south – Arkansas, Kentucky, Louisiana and Alabama. Kentucky dropped off the list in 2012 and was replaced by North Dakota.
For the states in the bottom ten, the share of property taxes increased slightly
between 1992 and 2012 except for Louisiana, New Mexico and Alabama where the property tax share of state and local own-source revenues increased 32.4 percent, 58.3 percent and 42.5 percent respectively.
DISCUSSION DRAFT 11 10/27/2015
Table 1 Property Taxes as a Share of State/Local Own-Source Revenues, Selected States
Top Ten States 1992 2012
New Hampshire 44.4% New Hampshire 45.0% New Jersey 31.9% New Jersey 37.1% Rhode Island 31.8% Rhode Island 31.9% Connecticut 31.3% Vermont 31.8% Michigan 30.4% Connecticut 31.7% Vermont 29.7% Illinois 29.7% Illinois 28.9% Maine 29.2% Maine 27.6% Texas 28.1% Texas 27.3% Massachusetts 27.5% Oregon 26.7% Wisconsin 27.1%
Bottom Ten States 1992 2012
Arkansas 12.1% Louisiana 13.5% West Virginia 12.1% West Virginia 13.2% Kentucky 11.8% Arkansas 13.1% Hawaii 11.8% Hawaii 12.9% Alaska 10.7% New Mexico 11.4% Louisiana 10.2% Oklahoma 11.0% Oklahoma 9.7% Alaska 10.8% Delaware 8.9% Alabama 10.4% Alabama 7.3% Delaware 10.1% New Mexico 7.2% North Dakota 9.4%
Exhibit 1992 2012
United States 22.5% United States 22.2% Sources: Data for 2012 come from the Bureau of Census, http://factfinder.census.gov/faces/tableservices/jsf/pages/productview.xhtml?src=bkmk; data for 1992 come from Bureau of Census, State and Local Government Finances by Level of Government and State: 1991-92.
DISCUSSION DRAFT 12 10/27/2015
Property Taxes as a Share of State and Local Tax Revenues
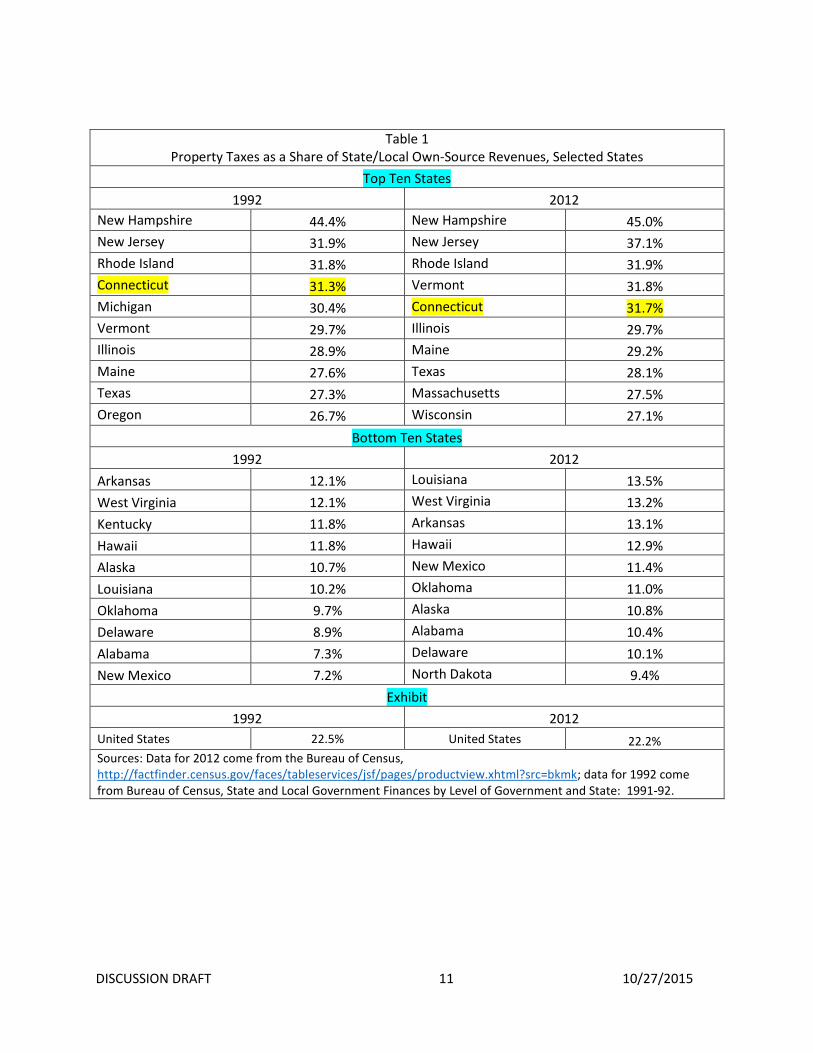
Table 2 reports information on the property tax share of state and local tax revenue for the top and bottom ten states in 1992 and 2012. On average nationally, in 1992 property taxes accounted for 32.1 percent of state and local taxes and that share was unchanged in 2012.
Again, there is diversity across states in the share of state and local tax revenues
attributable to the property tax. In 1992 the share ranged from 60.1 percent in New Hampshire to 12.1 percent in Alabama – with the highest share being just under five times the lowest. By 2012 the range was from 64.7 percent in New Hampshire to 12.0 percent in North Dakota – with the highest share being 5.4 times the lowest.
Of the ten states with the highest share of state and local taxes coming from
property taxes in 1992, six are in the top ten states in 2012. Of those six states, five experienced increases in the property tax share of state and local taxes and only Montana experienced a slight decline. Four of the top ten states in 2012 are from the Northeast – New Hampshire, Rhode Island, Vermont, and Maine. In 1992, Connecticut ranked tenth (39.1 percent), but fell out of the top ten states in 2012 with 37.8 percent of total state and local taxes attributable to property taxes.
Of the ten states least dependent on property taxes for tax revenues in 1992, eight are still in the bottom ten states in 2012. North Carolina and Louisiana dropped out of the bottom ten in 2012 and were replaced by Alaska and North Dakota. The share of state and local taxes coming from property taxes increased from 1992 to 2012 for all of the eight states on both the 1992 and 2012 list, with two increasing the property tax share of state and local tax revenues by nearly 50 percent or more – New Mexico (increasing by 54.9 percent) and Alabama (increasing by 48.8 percent).
DISCUSSION DRAFT 13 10/27/2015
Table 2 Property Taxes as a Share of State and Local Tax Revenue, Selected States
1992
2012 Top Ten States
New Hampshire 60.1%
New Hampshire 64.7% Michigan 43.7%
New Jersey 48.1%
New Jersey 43.3%
Rhode Island 44.9% Wyoming 42.5%
Vermont 42.9%
Rhode Island 42.1%
Texas 41.2% Vermont 41.7%
Maine 38.7%
Oregon 41.2%
Illinois 38.4% Montana 40.0%
Montana 38.1%
Texas 39.3%
Florida 38.1% Connecticut 39.1%
Wisconsin 37.9%
Bottom Ten States North Carolina 20.6%
Kentucky 20.8%
West Virginia 17.7%
West Virginia 20.3% Arkansas 17.2%
New Mexico 18.9%
Kentucky 16.9%
Arkansas 18.8% Louisiana 16.7%
Alabama 18.0%
Hawaii 16.4%
Hawaii 17.7% Oklahoma 14.9%
Alaska 17.4%
Delaware 14.1%
Oklahoma 17.3% New Mexico 12.2%
Delaware 16.6%
Alabama 12.1%
North Dakota 12.0% Exhibit
United States 32.1%
Connecticut 37.8%
United States 32.1%
Sources: Data for 2012 come from the Bureau of Census, http://factfinder.census.gov/faces/tableservices/jsf/pages/productview.xhtml?src=bkmk; data for 1992 come from Bureau of Census, State and Local Government Finances by Level of Government and State: 1991-92.
DISCUSSION DRAFT 14 10/27/2015
Property Taxes per $1,000 of Personal Income
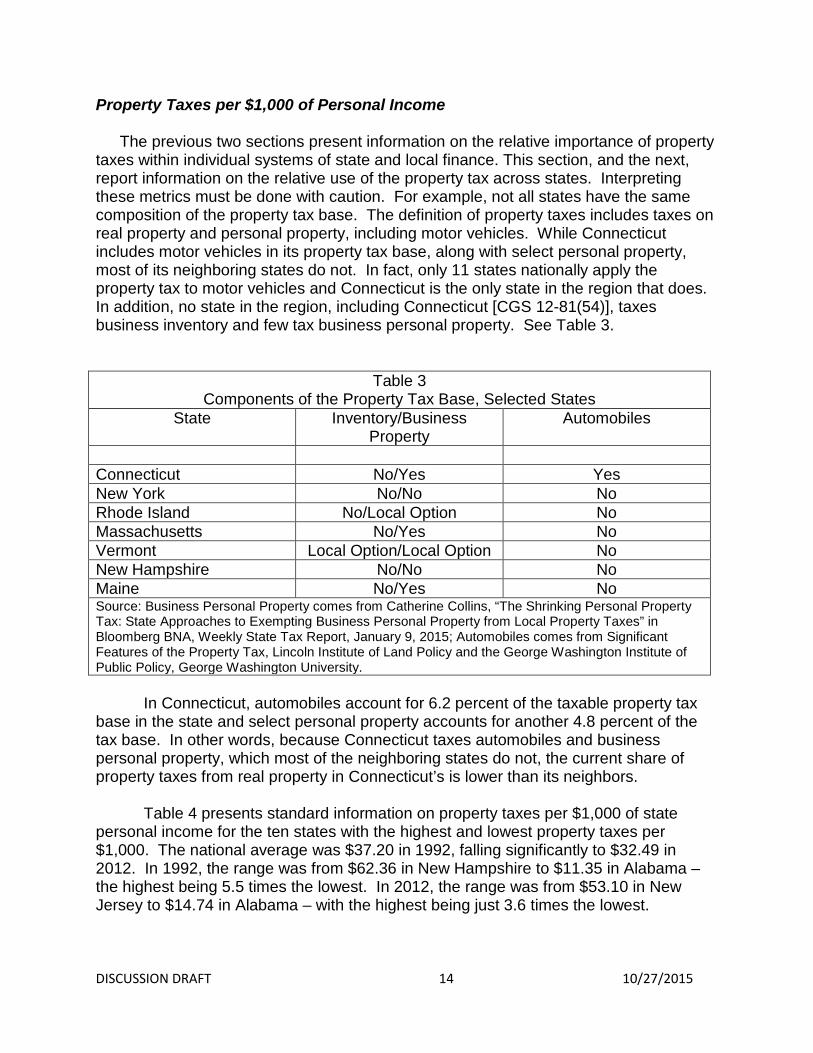
The previous two sections present information on the relative importance of property taxes within individual systems of state and local finance. This section, and the next, report information on the relative use of the property tax across states. Interpreting these metrics must be done with caution. For example, not all states have the same composition of the property tax base. The definition of property taxes includes taxes on real property and personal property, including motor vehicles. While Connecticut includes motor vehicles in its property tax base, along with select personal property, most of its neighboring states do not. In fact, only 11 states nationally apply the property tax to motor vehicles and Connecticut is the only state in the region that does. In addition, no state in the region, including Connecticut [CGS 12-81(54)], taxes business inventory and few tax business personal property. See Table 3.
Table 3 Components of the Property Tax Base, Selected States
State Inventory/Business Property
Automobiles
Connecticut No/Yes Yes New York No/No No Rhode Island No/Local Option No Massachusetts No/Yes No Vermont Local Option/Local Option No New Hampshire No/No No Maine No/Yes No Source: Business Personal Property comes from Catherine Collins, “The Shrinking Personal Property Tax: State Approaches to Exempting Business Personal Property from Local Property Taxes” in Bloomberg BNA, Weekly State Tax Report, January 9, 2015; Automobiles comes from Significant Features of the Property Tax, Lincoln Institute of Land Policy and the George Washington Institute of Public Policy, George Washington University.
In Connecticut, automobiles account for 6.2 percent of the taxable property tax
base in the state and select personal property accounts for another 4.8 percent of the tax base. In other words, because Connecticut taxes automobiles and business personal property, which most of the neighboring states do not, the current share of property taxes from real property in Connecticut’s is lower than its neighbors.
Table 4 presents standard information on property taxes per $1,000 of state
personal income for the ten states with the highest and lowest property taxes per $1,000. The national average was $37.20 in 1992, falling significantly to $32.49 in 2012. In 1992, the range was from $62.36 in New Hampshire to $11.35 in Alabama – the highest being 5.5 times the lowest. In 2012, the range was from $53.10 in New Jersey to $14.74 in Alabama – with the highest being just 3.6 times the lowest.
DISCUSSION DRAFT 15 10/27/2015
In 1992, five of the top ten states were in the Northeast and the number increased to six states in 2012 (adding Connecticut). New Jersey is the only state in the top ten in 1992 ($49.77) that experienced an increase in property taxes per $1,000 personal income in 2012 ($53.10). All other states experienced a decrease in property taxes per $1,000 personal income. While Connecticut experienced a decrease from $45.85 in 1992 (which was not in the top ten) to $43.99 in 2012, it was ranked eighth in 2012.
In 1992, six of the bottom ten states where in the South – North Carolina, Tennessee, Kentucky, Louisiana, Arkansas, and Alabama. By 2012 North Carolina had dropped out of the bottom ten states. While all but one of the top ten states experienced a decline the property tax share of personal income from 1992 to 2012, six of the states in the bottom ten experienced increases in property taxes as a share of personal income with the property tax share in New Mexico and Alabama increasing

DISCUSSION DRAFT 16 10/27/2015
26.2 and 29.9 percent respectively.
But as discussed above, the property tax base for Connecticut is broader than neighboring states because its base includes automobiles and business personal property, which are not generally included in the other states, and property tax relief in Connecticut is modest. As a result, real properties in Connecticut are currently paying a smaller share of property taxes than in neighboring states.
Property Taxes Per Capita
Table 5 presents information on property taxes per capita for the top and bottom ten states in 1992 and 2012. In 1992 the national average was $702.09 per capita
Table 4 Property Taxes Per $1,000 of Personal Income, Selected States
1992
2012 Top Ten States
New Hampshire $ 62.36
New Jersey $ 53.10 Wyoming $ 59.24
New Hampshire $ 52.58
Vermont $ 53.43
Vermont $ 49.44 New York $ 52.58
Rhode Island $ 48.70
Alaska $ 52.33
New York $ 45.66 Michigan $ 51.29
Wyoming $ 45.29
Oregon $ 50.01
Maine $ 44.60 New Jersey $ 49.77
Connecticut $ 43.99
Rhode Island $ 48.94
Illinois $ 43.27 Maine $ 47.45
Wisconsin $ 41.67
Bottom Ten States North Carolina $ 22.52
Hawaii $ 21.03
Tennessee $ 21.40
North Dakota $ 20.63 West Virginia $ 20.65
Tennessee $ 20.52
Kentucky $ 19.21
Kentucky $ 20.05 Louisiana $ 18.51
Louisiana $ 19.73
Arkansas $ 18.04
New Mexico $ 19.15 Delaware $ 16.13
Arkansas $ 18.66
Oklahoma $ 15.78
Delaware $ 17.15 New Mexico $ 15.17
Oklahoma $ 14.79
Alabama $ 11.35
Alabama $ 14.74 Exhibit
Connecticut $ 45.86 United States $ 37.20
United States $ 32.49
Sources: Data for 2012 come from the Bureau of Census, http://factfinder.census.gov/faces/tableservices/jsf/pages/productview.xhtml?src=bkmk and Bureau of Economic Analysis, http://www.bea.gov/newsreleases/regional/spi/2014/spi0314.htm; data for 1992 come from Bureau of Census, State and Local Government Finances by Level of Government and State: 1991-92.
DISCUSSION DRAFT 17 10/27/2015
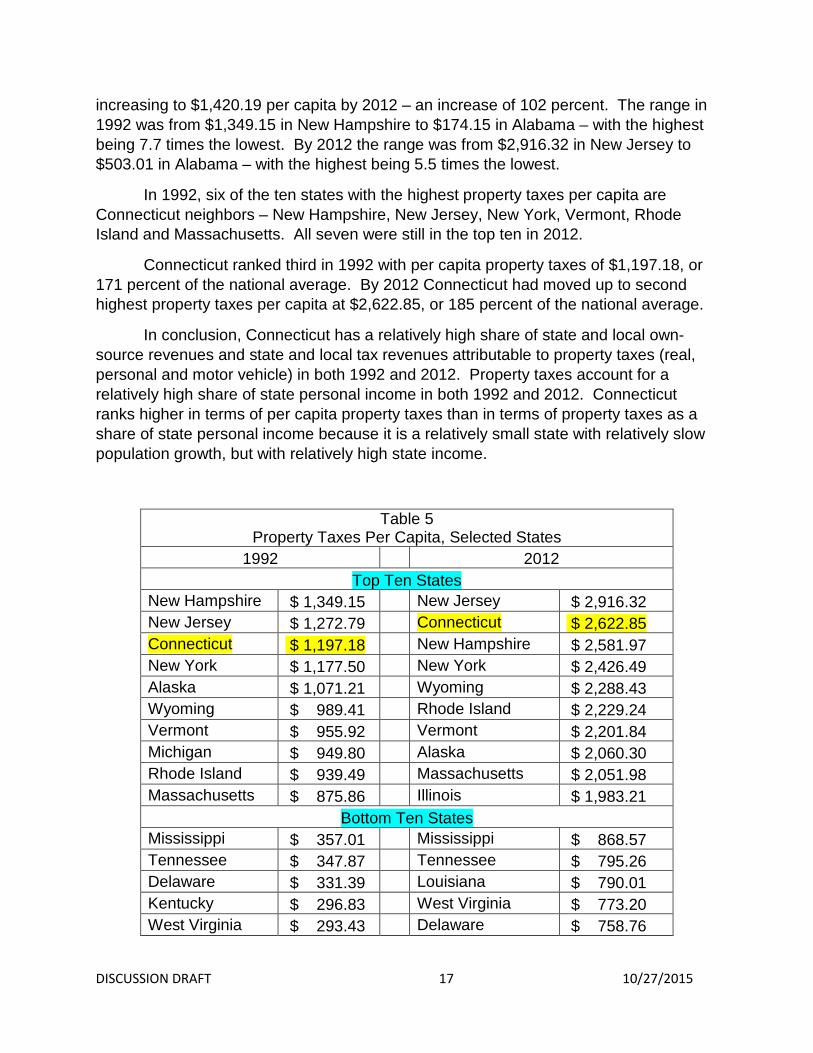
increasing to $1,420.19 per capita by 2012 – an increase of 102 percent. The range in 1992 was from $1,349.15 in New Hampshire to $174.15 in Alabama – with the highest being 7.7 times the lowest. By 2012 the range was from $2,916.32 in New Jersey to $503.01 in Alabama – with the highest being 5.5 times the lowest.
In 1992, six of the ten states with the highest property taxes per capita are Connecticut neighbors – New Hampshire, New Jersey, New York, Vermont, Rhode Island and Massachusetts. All seven were still in the top ten in 2012.
Connecticut ranked third in 1992 with per capita property taxes of $1,197.18, or 171 percent of the national average. By 2012 Connecticut had moved up to second highest property taxes per capita at $2,622.85, or 185 percent of the national average.
In conclusion, Connecticut has a relatively high share of state and local own-source revenues and state and local tax revenues attributable to property taxes (real, personal and motor vehicle) in both 1992 and 2012. Property taxes account for a relatively high share of state personal income in both 1992 and 2012. Connecticut ranks higher in terms of per capita property taxes than in terms of property taxes as a share of state personal income because it is a relatively small state with relatively slow population growth, but with relatively high state income.
Table 5 Property Taxes Per Capita, Selected States
1992
2012 Top Ten States
New Hampshire $ 1,349.15
New Jersey $ 2,916.32 New Jersey $ 1,272.79
Connecticut $ 2,622.85
Connecticut $ 1,197.18
New Hampshire $ 2,581.97 New York $ 1,177.50
New York $ 2,426.49
Alaska $ 1,071.21
Wyoming $ 2,288.43 Wyoming $ 989.41
Rhode Island $ 2,229.24
Vermont $ 955.92
Vermont $ 2,201.84 Michigan $ 949.80
Alaska $ 2,060.30
Rhode Island $ 939.49
Massachusetts $ 2,051.98 Massachusetts $ 875.86
Illinois $ 1,983.21
Bottom Ten States Mississippi $ 357.01
Mississippi $ 868.57
Tennessee $ 347.87
Tennessee $ 795.26 Delaware $ 331.39
Louisiana $ 790.01
Kentucky $ 296.83
West Virginia $ 773.20 West Virginia $ 293.43
Delaware $ 758.76

DISCUSSION DRAFT 18 10/27/2015
LOCAL GOVERNMENT RELIANCE ON PROPERTY TAXES
IN CONNECTICUT
Local governments in Connecticut rely more heavily on the property tax to fund the provision of local public goods and services than local governments in other states. Local property taxes in Connecticut are relatively high at 4.4 percent of state personal income. Among the other New England states Maine (4.4 percent) and New Hampshire (4.8 percent) have similarly high property taxes relative to personal income. Rhode Island property taxes are even higher, accounting for nearly five percent of personal income (4.9 percent). Massachusetts is somewhat lower at just under four percent (3.7 percent). Vermont is the lowest in the region with property taxes accounting for 1.5 percent of personal income. The neighboring states of New Jersey (5.3 percent) and New York (4.6 percent) have property taxes as a share of personal income that are higher than those in Connecticut. In Pennsylvania property taxes take less personal income (3 percent). Nationally, property taxes account for an average of 3.2 percent of personal income.
Local property taxes as a share of own-source general revenue are also high in Connecticut, which is more reliant on property taxes than all of the other states and the District of Columbia. Local property taxes account for 86 percent of own-source general revenues. Most of the other New England states are also highly reliant on property taxes by this measure. Maine, Massachusetts, New Hampshire, and Rhode Island all have property taxes as a share of own source revenues greater than 75 percent. Vermont is less reliant on local property taxes at 56 percent. The neighboring state of New Jersey is also high at 79 percent, but New York and Pennsylvania are less reliant on property taxes, in the range of 45 to 50 percent. Nationally, property taxes on average account for 47.2 percent of local own source revenues.
Finally, local property taxes as a share of own-source taxes are high with Connecticut among the highest states by this measure, very highly reliant on property
Louisiana $ 276.21
Kentucky $ 714.10 Arkansas $ 260.91
New Mexico $ 683.65
Oklahoma $ 242.45
Arkansas $ 661.16 New Mexico $ 217.46
Oklahoma $ 600.49
Alabama $ 174.15
Alabama $ 530.01
Exhibit United States $ 702.09
United States $ 1,420.19
Sources: Data for 2012 come from the Bureau of Census, http://factfinder.census.gov/faces/tableservices/jsf/pages/productview.xhtml?src=bkmk and population data from the 2015 Statistical Abstract of the US; data for 1992 come from Bureau of Census, State and Local Government Finances by Level of Government and State: 1991-92.
DISCUSSION DRAFT 19 10/27/2015
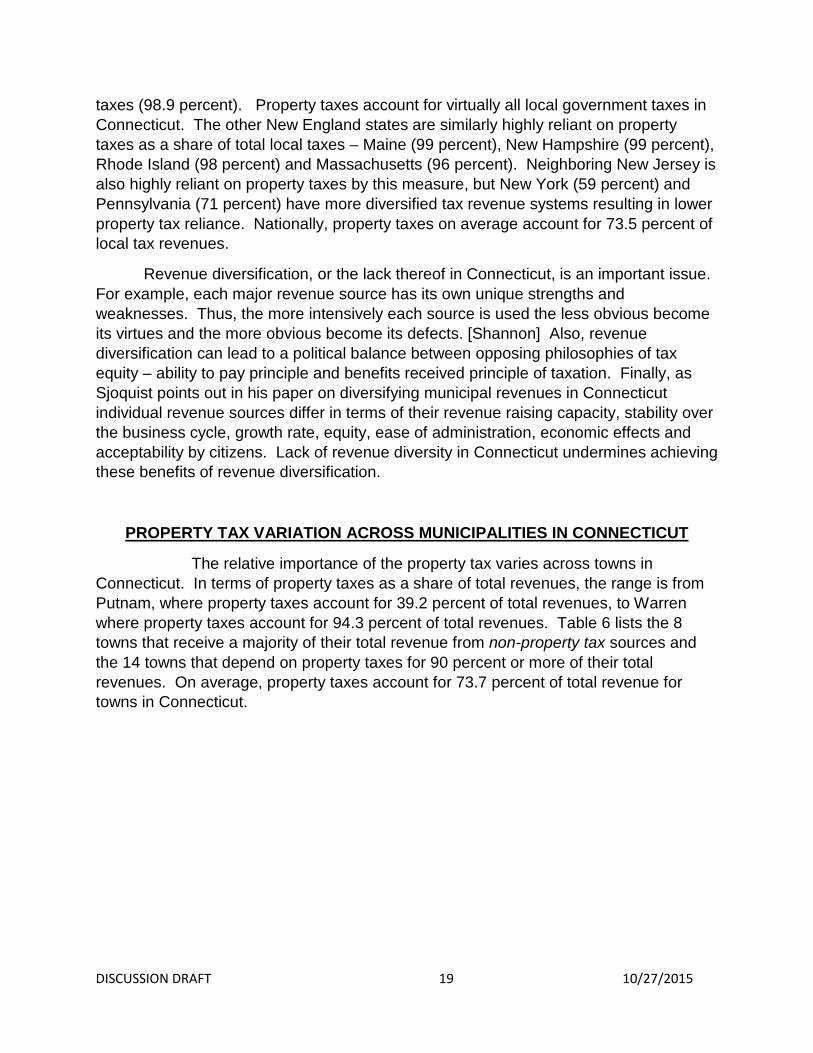
taxes (98.9 percent). Property taxes account for virtually all local government taxes in Connecticut. The other New England states are similarly highly reliant on property taxes as a share of total local taxes – Maine (99 percent), New Hampshire (99 percent), Rhode Island (98 percent) and Massachusetts (96 percent). Neighboring New Jersey is also highly reliant on property taxes by this measure, but New York (59 percent) and Pennsylvania (71 percent) have more diversified tax revenue systems resulting in lower property tax reliance. Nationally, property taxes on average account for 73.5 percent of local tax revenues.
Revenue diversification, or the lack thereof in Connecticut, is an important issue. For example, each major revenue source has its own unique strengths and weaknesses. Thus, the more intensively each source is used the less obvious become its virtues and the more obvious become its defects. [Shannon] Also, revenue diversification can lead to a political balance between opposing philosophies of tax equity – ability to pay principle and benefits received principle of taxation. Finally, as Sjoquist points out in his paper on diversifying municipal revenues in Connecticut individual revenue sources differ in terms of their revenue raising capacity, stability over the business cycle, growth rate, equity, ease of administration, economic effects and acceptability by citizens. Lack of revenue diversity in Connecticut undermines achieving these benefits of revenue diversification.
PROPERTY TAX VARIATION ACROSS MUNICIPALITIES IN CONNECTICUT
The relative importance of the property tax varies across towns in Connecticut. In terms of property taxes as a share of total revenues, the range is from Putnam, where property taxes account for 39.2 percent of total revenues, to Warren where property taxes account for 94.3 percent of total revenues. Table 6 lists the 8 towns that receive a majority of their total revenue from non-property tax sources and the 14 towns that depend on property taxes for 90 percent or more of their total revenues. On average, property taxes account for 73.7 percent of total revenue for towns in Connecticut.

DISCUSSION DRAFT 20 10/27/2015
Table 6 Property Tax Revenues as a Share of
Total Revenues for Connecticut Towns, 2013 Putnam 39.2% Essex 90.2% Windham 44.6% Easton 90.4% New Haven 45.6% Redding 90.4% Hartford 46.0% Middlebury 90.9% Plainfield 47.6% Southbury 91.2% New Britain 48.4% Haddam 91.3% Ansonia 49.1% Washington 91.9% New London 49.1% Roxbury 93.2%
Woodbury 93.2%
Goshen 93.4%
Old Lyme 93.4%
Lyme 93.5%
Bridgewater 93.7%
Warren 94.3%
Source: Municipal Fiscal Indicators, OPM
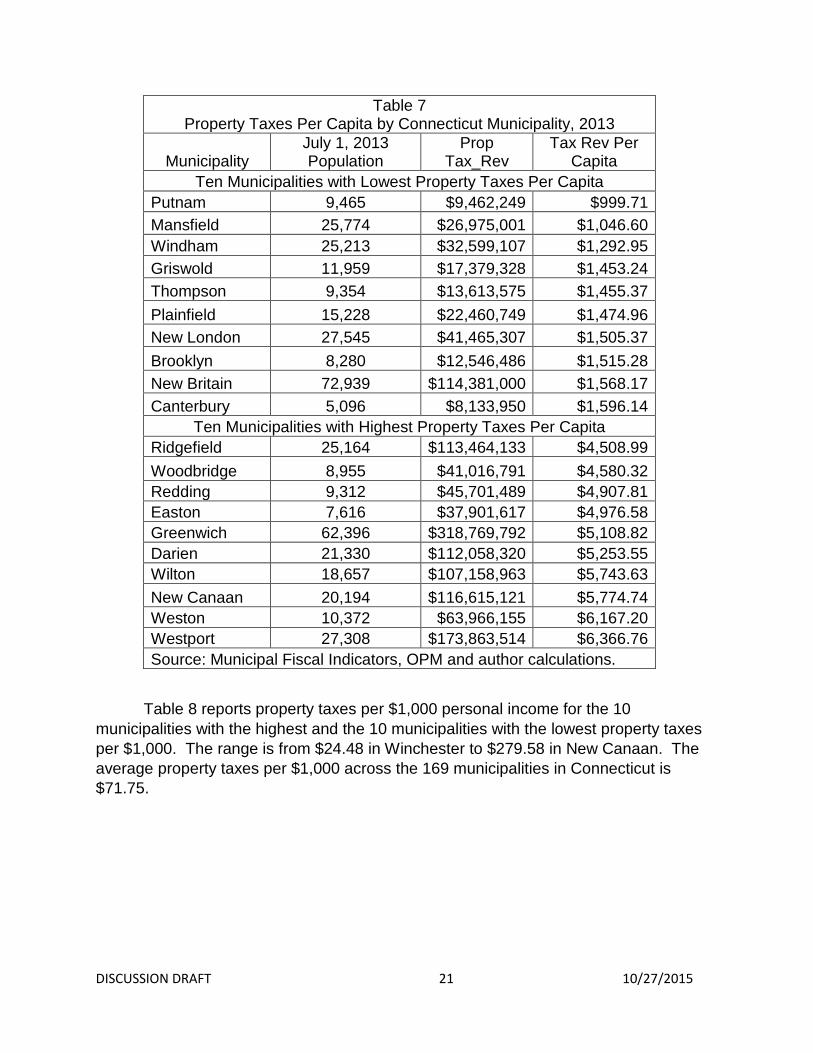
Table 7 reports property taxes per capita for the 10 municipalities with the highest and the 10 municipalities with the lowest per capita property taxes. The range is from $999.71 in Putnam to $6,366.76 in Westport. On average, property taxes per capita in Connecticut are $2,748.19.
DISCUSSION DRAFT 21 10/27/2015
Table 7 Property Taxes Per Capita by Connecticut Municipality, 2013
Municipality July 1, 2013 Population
Prop Tax_Rev
Tax Rev Per Capita
Ten Municipalities with Lowest Property Taxes Per Capita Putnam 9,465 $9,462,249 $999.71 Mansfield 25,774 $26,975,001 $1,046.60 Windham 25,213 $32,599,107 $1,292.95 Griswold 11,959 $17,379,328 $1,453.24 Thompson 9,354 $13,613,575 $1,455.37 Plainfield 15,228 $22,460,749 $1,474.96 New London 27,545 $41,465,307 $1,505.37 Brooklyn 8,280 $12,546,486 $1,515.28 New Britain 72,939 $114,381,000 $1,568.17 Canterbury 5,096 $8,133,950 $1,596.14
Ten Municipalities with Highest Property Taxes Per Capita Ridgefield 25,164 $113,464,133 $4,508.99 Woodbridge 8,955 $41,016,791 $4,580.32 Redding 9,312 $45,701,489 $4,907.81 Easton 7,616 $37,901,617 $4,976.58 Greenwich 62,396 $318,769,792 $5,108.82 Darien 21,330 $112,058,320 $5,253.55 Wilton 18,657 $107,158,963 $5,743.63 New Canaan 20,194 $116,615,121 $5,774.74 Weston 10,372 $63,966,155 $6,167.20 Westport 27,308 $173,863,514 $6,366.76 Source: Municipal Fiscal Indicators, OPM and author calculations.
Table 8 reports property taxes per $1,000 personal income for the 10 municipalities with the highest and the 10 municipalities with the lowest property taxes per $1,000. The range is from $24.48 in Winchester to $279.58 in New Canaan. The average property taxes per $1,000 across the 169 municipalities in Connecticut is $71.75.

DISCUSSION DRAFT 22 10/27/2015
Table 8 Property Taxes Per $1,000 Personal Income by
Connecticut Municipality, 2013
Municipality Prop Tax Rev Personal Income Tax Per $1,000
Ten Municipalities with the Lowest Property Taxes Per $1,000 Winchester $20,900,669 $853,793,838 $ 24.48 Putnam $9,462,249 $359,206,215 $ 26.34
Somers $19,088,274 $641,538,360 $ 29.75 New Fairfield $41,855,046 $1,379,109,210 $ 30.35 Wethersfield $75,019,911 $2,418,401,260 $ 31.02 Mansfield $26,975,001 $844,691,302 $ 31.93 West Haven $88,645,476 $2,613,859,310 $ 33.91 Plainfield $22,460,749 $650,524,932 $ 34.53 Waterbury $224,710,000 $6,122,772,376 $ 36.70 Norwich $64,821,000 $1,765,867,149 $ 36.71
Ten Municipalities with the Highest Property Taxes Per $1,000 Westbrook $23,608,365 $183,713,412 $ 128.51 Hartland $4,781,424 $35,415,089 $ 135.01 Windsor $82,159,015 $591,495,174 $ 138.90 Marlborough $17,705,831 $125,095,812 $ 141.54 Old Lyme $31,007,655 $208,149,864 $ 148.97 Weston $63,966,155 $426,600,360 $ 149.94 Wilton $107,158,963 $651,427,812 $ 164.50 Waterford $73,303,784 $411,945,600 $ 177.95 Redding $45,701,489 $224,344,704 $ 203.71 New Canaan $116,615,121 $417,107,070 $ 279.58 Source: Municipal Fiscal Indicators, OPM and author calculations.
Municipalities with high property taxes per capita also tend to have high property taxes per $1,000 with a correlation coefficient of 0.608. The significant variation across towns in Connecticut in property taxes per $1,000 of personal income reflects significant variation across towns in the capacity to raise revenues from the property tax to provide services to their citizens.
DISCUSSION DRAFT 23 10/27/2015
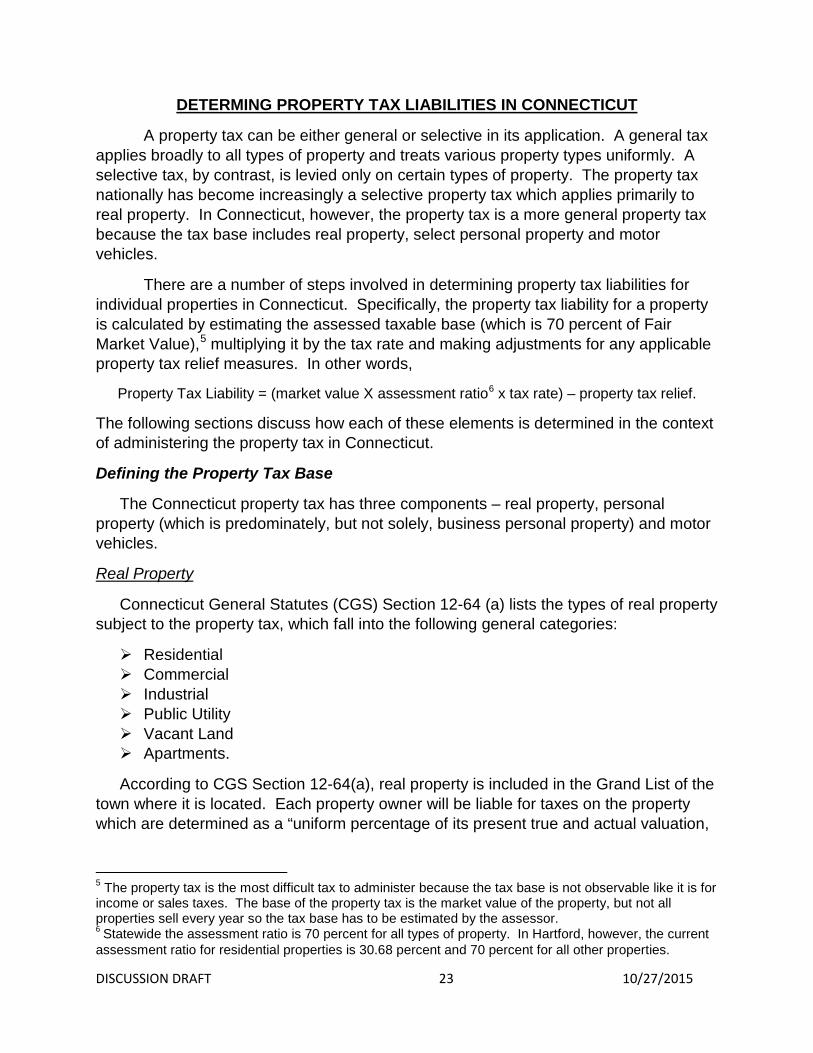
DETERMING PROPERTY TAX LIABILITIES IN CONNECTICUT
A property tax can be either general or selective in its application. A general tax applies broadly to all types of property and treats various property types uniformly. A selective tax, by contrast, is levied only on certain types of property. The property tax nationally has become increasingly a selective property tax which applies primarily to real property. In Connecticut, however, the property tax is a more general property tax because the tax base includes real property, select personal property and motor vehicles.
There are a number of steps involved in determining property tax liabilities for individual properties in Connecticut. Specifically, the property tax liability for a property is calculated by estimating the assessed taxable base (which is 70 percent of Fair Market Value),5 multiplying it by the tax rate and making adjustments for any applicable property tax relief measures. In other words,
Property Tax Liability = (market value X assessment ratio6 x tax rate) – property tax relief.
The following sections discuss how each of these elements is determined in the context of administering the property tax in Connecticut.
Defining the Property Tax Base
The Connecticut property tax has three components – real property, personal property (which is predominately, but not solely, business personal property) and motor vehicles.
Real Property
Connecticut General Statutes (CGS) Section 12-64 (a) lists the types of real property subject to the property tax, which fall into the following general categories:
Residential Commercial Industrial Public Utility Vacant Land Apartments.
According to CGS Section 12-64(a), real property is included in the Grand List of the town where it is located. Each property owner will be liable for taxes on the property which are determined as a “uniform percentage of its present true and actual valuation,
5 The property tax is the most difficult tax to administer because the tax base is not observable like it is for income or sales taxes. The base of the property tax is the market value of the property, but not all properties sell every year so the tax base has to be estimated by the assessor. 6 Statewide the assessment ratio is 70 percent for all types of property. In Hartford, however, the current assessment ratio for residential properties is 30.68 percent and 70 percent for all other properties.
DISCUSSION DRAFT 24 10/27/2015
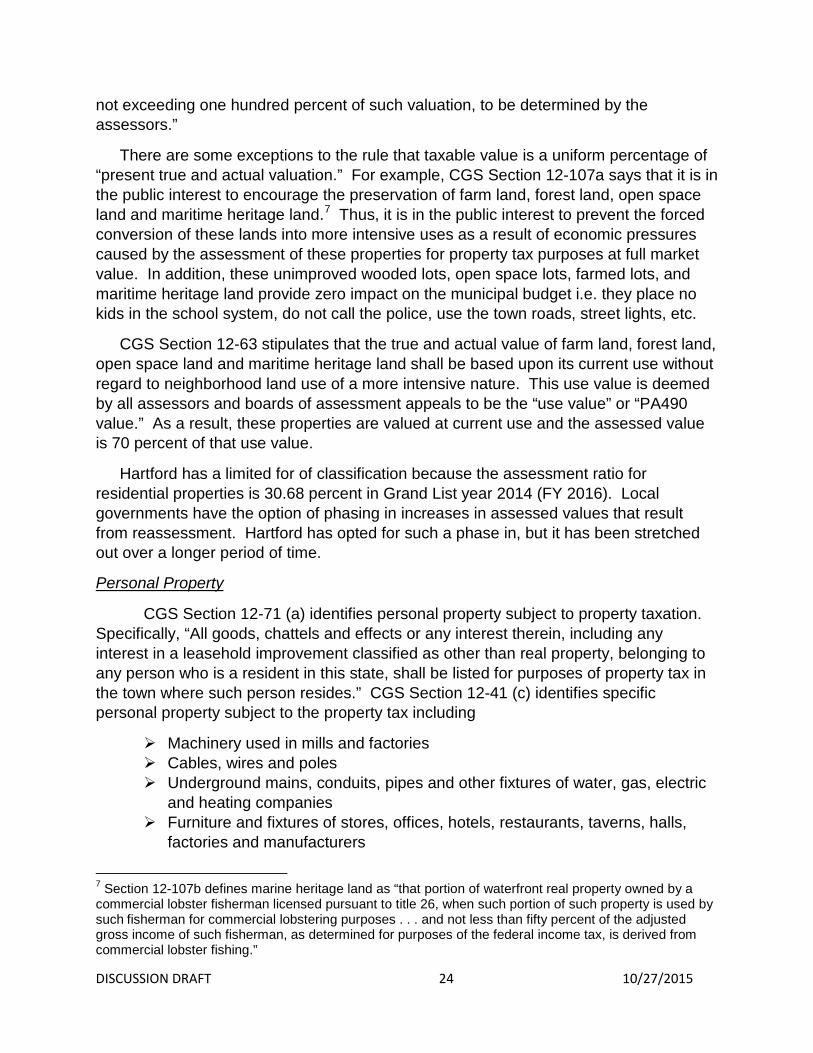
not exceeding one hundred percent of such valuation, to be determined by the assessors.”
There are some exceptions to the rule that taxable value is a uniform percentage of “present true and actual valuation.” For example, CGS Section 12-107a says that it is in the public interest to encourage the preservation of farm land, forest land, open space land and maritime heritage land.7 Thus, it is in the public interest to prevent the forced conversion of these lands into more intensive uses as a result of economic pressures caused by the assessment of these properties for property tax purposes at full market value. In addition, these unimproved wooded lots, open space lots, farmed lots, and maritime heritage land provide zero impact on the municipal budget i.e. they place no kids in the school system, do not call the police, use the town roads, street lights, etc.
CGS Section 12-63 stipulates that the true and actual value of farm land, forest land, open space land and maritime heritage land shall be based upon its current use without regard to neighborhood land use of a more intensive nature. This use value is deemed by all assessors and boards of assessment appeals to be the “use value” or “PA490 value.” As a result, these properties are valued at current use and the assessed value is 70 percent of that use value.
Hartford has a limited for of classification because the assessment ratio for residential properties is 30.68 percent in Grand List year 2014 (FY 2016). Local governments have the option of phasing in increases in assessed values that result from reassessment. Hartford has opted for such a phase in, but it has been stretched out over a longer period of time.
Personal Property
CGS Section 12-71 (a) identifies personal property subject to property taxation. Specifically, “All goods, chattels and effects or any interest therein, including any interest in a leasehold improvement classified as other than real property, belonging to any person who is a resident in this state, shall be listed for purposes of property tax in the town where such person resides.” CGS Section 12-41 (c) identifies specific personal property subject to the property tax including
Machinery used in mills and factories Cables, wires and poles Underground mains, conduits, pipes and other fixtures of water, gas, electric
and heating companies Furniture and fixtures of stores, offices, hotels, restaurants, taverns, halls,
factories and manufacturers
7 Section 12-107b defines marine heritage land as “that portion of waterfront real property owned by a commercial lobster fisherman licensed pursuant to title 26, when such portion of such property is used by such fisherman for commercial lobstering purposes . . . and not less than fifty percent of the adjusted gross income of such fisherman, as determined for purposes of the federal income tax, is derived from commercial lobster fishing.”
DISCUSSION DRAFT 25 10/27/2015
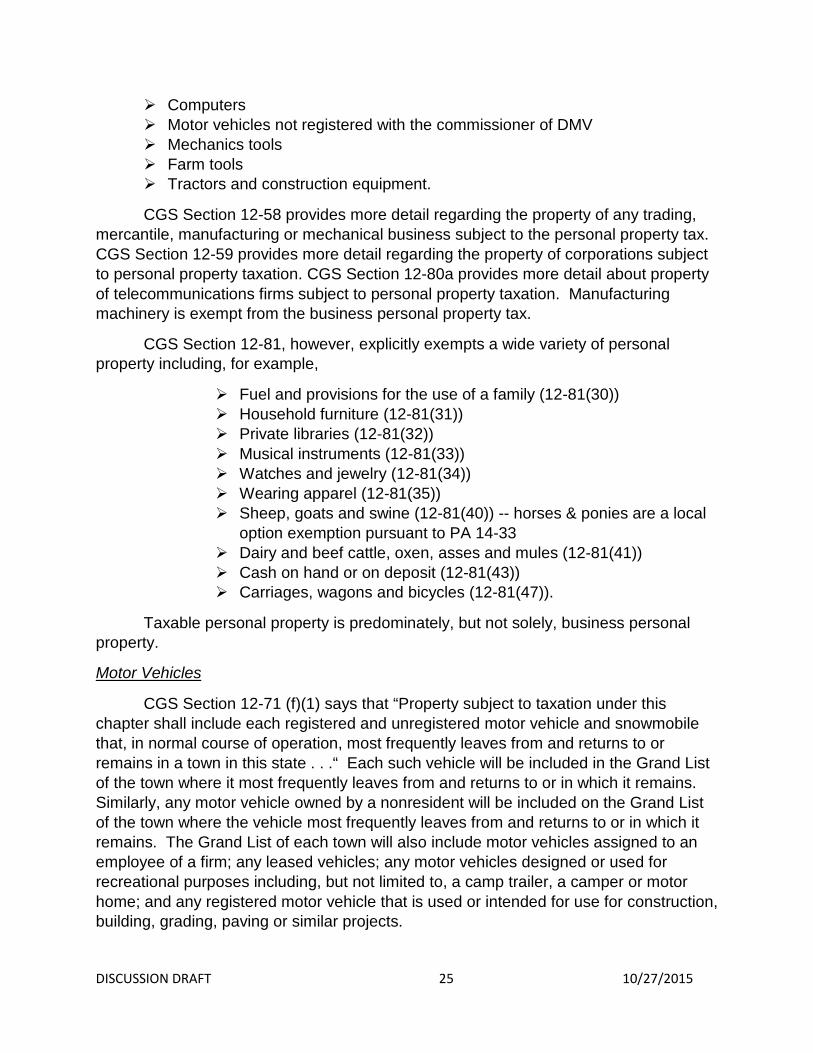
Computers Motor vehicles not registered with the commissioner of DMV Mechanics tools Farm tools Tractors and construction equipment.
CGS Section 12-58 provides more detail regarding the property of any trading, mercantile, manufacturing or mechanical business subject to the personal property tax. CGS Section 12-59 provides more detail regarding the property of corporations subject to personal property taxation. CGS Section 12-80a provides more detail about property of telecommunications firms subject to personal property taxation. Manufacturing machinery is exempt from the business personal property tax.
CGS Section 12-81, however, explicitly exempts a wide variety of personal property including, for example,
Fuel and provisions for the use of a family (12-81(30)) Household furniture (12-81(31)) Private libraries (12-81(32)) Musical instruments (12-81(33)) Watches and jewelry (12-81(34)) Wearing apparel (12-81(35)) Sheep, goats and swine (12-81(40)) -- horses & ponies are a local
option exemption pursuant to PA 14-33 Dairy and beef cattle, oxen, asses and mules (12-81(41)) Cash on hand or on deposit (12-81(43)) Carriages, wagons and bicycles (12-81(47)).
Taxable personal property is predominately, but not solely, business personal property.
Motor Vehicles
CGS Section 12-71 (f)(1) says that “Property subject to taxation under this chapter shall include each registered and unregistered motor vehicle and snowmobile that, in normal course of operation, most frequently leaves from and returns to or remains in a town in this state . . .“ Each such vehicle will be included in the Grand List of the town where it most frequently leaves from and returns to or in which it remains. Similarly, any motor vehicle owned by a nonresident will be included on the Grand List of the town where the vehicle most frequently leaves from and returns to or in which it remains. The Grand List of each town will also include motor vehicles assigned to an employee of a firm; any leased vehicles; any motor vehicles designed or used for recreational purposes including, but not limited to, a camp trailer, a camper or motor home; and any registered motor vehicle that is used or intended for use for construction, building, grading, paving or similar projects.
DISCUSSION DRAFT 26 10/27/2015
Taxable motor vehicles include
Passenger motor vehicles Commercial vehicles and trailers Farm vehicles Public service, interstate or service buses Motorcycles & ATVS Snowmobiles All trailers (Camp, landscape, boat, snow mobile, horse/livestock) Hearses, limousines and school buses.
Valuing the Property Tax Base
Real Property
The process of determining property tax liabilities for each property starts with the assessor estimating its “present true and actual valuation” or market value of all property within the corporate limits as of a specific date and those values remain in place for a period of 5 years until such time as the town implements a new town-wide revaluation.8 In between the 5-year intervals for town wide revaluation, the assessment stays the same unless the situation of the property changes. Specifically, there are three situations that could trigger a reassessment as a result of new construction, demolition or destruction. The assessor will reassess the property to reflect these changes, but utilizing the same specific date as all other properties in town. The tax is then applied to a uniform percent of that value. CGS Section 12-62 (b) says “Each such municipality shall assess all property for purposes of the local property tax at a uniform rate of seventy percent of present true and actual value . . “
In the terminology of the assessors, the appraised value is their best estimate of the market value of a property. The assessed value is 70 percent of this amount. Finally, the taxable value is the assessed value minus any applicable property tax relief provided. All real property in a town is reassessed every five years.9
8 Revaluation is done differently across the country. Connecticut mandates a 5-year cycle, but some states do an annual revaluation, 3-yr cycle, 5, 10, and others like NJ use a sales ratio and COD to determine when values are no longer fair, uniform and equitable. When a municipality in Connecticut implements a town-wide revaluation every 5 years that the municipality is required, pursuant to CGS 12-62i, to meet “performance based revaluation testing standards” and submit such certification (that details their overall median, COD, PRD, an unsold property test, and includes a listing of all sold properties that took place in town) to the Office of Policy and Management. 9 Legislation permits municipalities to extend the period of reassessment. For example, 13 municipalities chose to delay their 2010 revaluation to 2011 in accordance with PA 09-60. While most municipalities comply with the 5 year reassessment cycle, a growing number of municipalities extend the 5 year cycle as a result of general or specific delay bills passed by the general assembly.

DISCUSSION DRAFT 27 10/27/2015
Connecticut utilizes the three traditional approaches to estimating the market value of individual properties that do not sell during the tax year:10
the sales approach; the cost approach; and the income approach.
The valuation process in Connecticut starts with the cost approach to valuation.
The cost approach that is most widely utilized in Connecticut is not your standard cost approach that utilizes national sources or developers. It is what is commonly referred to as a “Market Driven Cost Approach”, “CAMA (Computer Assisted Mass Appraisal) System, or a “Mass Appraisal Algorithm”. While it functions like a traditional cost approach, the valuation information (tables in the algorithm) are set based on the local market. For example, in a town with 500 sales per year the assessor makes calculated adjustments to the CAMA system/algorithm until it is producing values that are similar to that of the 500 qualified sales (with a tested COD of less than 10). Once recalibrated with the new sales information, the CAMA system is applied to the remaining properties in town to ensure each property is assessed fairly.
In using the cost method, the assessor first determines the market value of the
land by examining sales of comparable land. Next, the assessor estimates the cost of replacing a building at the time of reassessment based on recent sales information. When applied to existing buildings, this replacement cost is depreciated according to the building’s age and functional or economic obsolescence and upkeep is added back.
There are actually three different approaches to implementing the cost approach to
valuation. Specifically, the assessor may use the reproduction cost approach which estimates the current cost of
reproducing exactly the existing structure, less accrued depreciation; the historical cost approach to valuation, which starts with the actual historical
cost of building a structure and applies trending factors to that data; and the replacement cost approach, which seeks to estimate the cost of replacing a
structure with one that would serve the same functions, but which would be constructed using current building technology and materials. The sales approach to valuation involves a comparison of a property being
valued with similar properties that actually sold recently in an arm’s-length transaction – a sale between a willing buyer and a willing seller who are unrelated. All differences, minor and major, are enumerated and evaluated according to the judgment of the assessor. The value of the property being assessed for tax purposes is thereby related to the prices of comparable properties that have sold.
10 Many towns in Connecticut contract with professional valuation firms to conduct revaluations for their town. According to Section 12-2c the Office of Policy and Management must certify all companies that perform any valuation for a municipality for assessment purposes.

DISCUSSION DRAFT 28 10/27/2015
This method is used generally for valuing residential and small apartment/commercial properties. It is based on the principle that the value of a property tends to be set by the cost of buying an equally desirable substitute property. Adjustments may be made to reflect differences between the property being valued for tax purposes and the comparable sales being used to determine value. Such adjustments may reflect physical differences (e.g., square footage, lot size, number of garages, baths, bedrooms, etc.) and economic conditions (age and condition of the property), location and time of sale, financing, etc. The adjustments may be expressed on a lump-sum or percentage basis and are applied to the properties that sold.
Finally, the income approach to valuation is used to estimate the market value of investment properties, including industrial properties, commercial buildings as well as larger apartment buildings. For these properties, the market value is estimated by looking at the relationship between the net income generated by the property and the relevant capitalization rate.
The income approach starts by looking at the relationship between the underlying asset and the stream of income it generates. An example might be a bank account. If you put $1,000 in the bank and the interest rate is 5 percent then the bank will pay you $50 per year in income. The fundamental relationship involved in this example is
Income = value x interest rate.
In this example, the value of the asset is the $1,000 in the bank account and the interest rate is 5 percent so the annual income generated is $50.
This same relationship is used to determine the value of the underlying asset when the interest rate and annual flow of income are known, but the market value of the asset is not known. Rearranging the above relationships yields
value = income/interest rate.
Thus, if a property yields an annual net income of $1 million and the applicable interest (capitalization) rate is 10 percent, the value of the property for tax purposes would be $10 million ($1 million/0.1 = $10 million).
In applying the income approach to valuation the first step is to estimate annual net income for the property being valued. This requires information on the income and operating expenses for the property being valued. Typically, this information is obtained from schedules sent to the property owner by the assessor.
The second step in applying the income approach to valuation is to estimate the capitalization rate to be applied to the annual net income to calculate the estimated market value of the property. Just as fluctuations in construction costs influence the value of property under the cost approach, market trends in the rate of return on money invested, vacancy factors, rent controls, or other lease agreements and other variations
DISCUSSION DRAFT 29 10/27/2015
in capital costs and risk estimates will influence the determination of the appropriate interest rate to use in capitalizing net income to estimate market value of a property. As a result, different capitalization rates may be used on similar properties in different neighborhoods or towns, or may be utilized for the same property over time as market conditions change.
In principle any property could be valued with the sales, cost or income approach and the expectation would be that the values would be the same. However, the sales approach is used often for residential housing as is the cost approach. The cost approach is also used for some commercial and tax exempt properties. The income approach is used for properties that generate predictable streams of income and are typically purchased by investors for their income stream.
Personal Property
CGS Section 12-40 requires the assessor in each town to advertise on or before October 15 each year a notice requiring all persons in the town liable to pay taxes to bring in a declaration of the taxable personal property belonging to them and their estimated value on the first day of October in that year. There is a penalty equal to 25 percent of the assessment of personal property if a person fails to file a declaration of personal property on or before November 1. CGS 12-42 enables the assessor to grant an extension to the November 1 filing deadline, or not more than 45 days, to personal property owners who show good cause for a delay in filing.
The value of business personal property is self-reported, by the person (business) owning the property, on the personal property declaration (form M-15) which is utilized statewide. The M-15 instructs the property owner to begin with their original acquisition cost and depreciate that value based on a sliding scale depreciation table that drops a certain percentage each year until the depreciated value falls to 30 percent. This original cost times depreciation per year is similar to how businesses write off personal property expenses on their IRS returns. Also, the M-15 form contains an accelerated depreciation table for “computers, electronic data processing equipment, printers, etc.” that drops to a 20 percent residual value in five years because peripheral computer equipment has a short live/value. Assessors then take 70 percent of the depreciated value in order to determine the taxable assessed value as listed on the Grand List. [CGS Section 12-71 (b)]
Local assessors have the right to audit the values provided by the property owner within three years of the filing. CGS 12-53(b) provides that any omitted property shall be assessed and a 25 percent penalty will be added. In contrast to real property which is valued on a 5 year cycle, personal property is valued annually.
Motor Vehicles
CGS Section 12-71d indicates that the Office of Policy and Management will recommend a schedule of motor vehicle values which will be used by assessors in each
DISCUSSION DRAFT 30 10/27/2015
municipality in determining the assessed value of a motor vehicle for purposes of property taxation. The value for each motor vehicle listed represents 100 percent of the average retail price applicable to such motor vehicle as of October 1 each year. Again, in contrast to real property which is valued on a 5 year cycle, motor vehicles are valued annually.
Summary
The sections above define the property tax base for the various components of the Grand List for each town and how they are valued. Appendix Table 1 summarizes the outcome of the process by reporting the value of each key component of the Grand List for each town. Appendix Table 2 reports the share of Grand List value attributable to each component for each town. The conclusion is that there are vast differences across municipalities in the composition of the property tax base and the frequency in which those components are valued.
The residential property share of the total Grand List value ranges from 93.8 percent in Weston to just 20.2 percent in Hartford. Residential properties account for more than 90 percent of the total Grand List value in two other municipalities – Sherman (92.3 percent) and Lyme (90.4 percent) – and less than 50 percent of total Grand List value in seven other municipalities – Waterbury (49.4 percent), New London (47.9 percent), North Canaan (45.6 percent), Killingly (45.5 percent), Windsor Locks (45.4 percent), New Haven (44.2 percent) and Waterford (43.1 percent). The median residential share of Grand List value is 76.3 percent.
The next component of the Grand List is commercial, industrial and public utility property (CIP). The share of value attributable to these classes of land use ranges from 49.2 percent in Hartford to just 0.4 percent in Roxbury. The CIP share of Grand List value is one-third or more in 3 additional cities – New London (39.8 percent), New Haven (38.9 percent) and Stamford (33.3 percent) – and one percent or less in three additional municipalities – Weston ( 1.0 percent), Lyme (0.9 percent) and Sherman (0.7 percent). The median share of Grand List value is 10.8 percent.
The next component of the Grand List is apartments. The share of Grand List value attributable to apartments ranges from a high of 12.9 percent in Hartford (the only municipality with a share greater than 10 percent) to a low of zero percent in 46 municipalities. The median share of Grand List value attributable to apartments is 0.5 percent.
The next component of the Grand List is motor vehicles. The share of Grand List value attributable to motor vehicles ranges from 12.5 percent in Windsor Locks to 2.4 percent in Greenwich.11 There are 14 additional municipalities where motor vehicles account for 10 percent or more of Grand List value and 27 municipalities where motor 11 The relative importance of motor vehicles in the Windsor Locks Grand List reflects the fact that there are a number of rental car agencies located at the Bradley International Airport and their entire fleet is assessed in Windsor Locks.

DISCUSSION DRAFT 31 10/27/2015
vehicles account for 5 percent or less of Grand List value. The median share of Grand List value attributable to motor vehicles is 7.6 percent.
The next component of the Grand List is personal property. The share of Grand List value accounted for by business personal property ranges from 24.4 percent in Waterford (which is home to three nuclear power plants) to a low of 0.8 percent in New Canaan and Weston. There are 20 additional municipalities where business personal property accounts for 10 percent or more of Grand List value and 21 more municipalities where the share is 2 percent or less. The median share of Grand List value attributable to business personal property is 4.4 percent.
The Other category is the last element of the Grand List. There are seven municipalities where the other category accounts for more than ten percent of the Grand List value – Warren (31.7 percent), Cornwall (23.4 percent), Salisbury (21.3 percent), Norfolk (20.0 percent), Canaan (18.5 percent), Washington (17.1 percent) and Durham (14.5 percent). There are 8 municipalities where the other category accounts for zero percent of Grand List value and another 43 municipalities where the share is 1.0 percent or less. The median share of Grand List value attributable to the other category is 2.0 percent.
Determining Assessment Quality
The property tax is the only major tax whose base must be estimated, rather than observed. Thus, by its very nature, the valuation of property is a subjective process which is part science and part art. Assessing property requires the talents of highly trained and experienced personnel. However, since no two individuals have exactly the same experiences, individual assessors may differ in the weights they assign different abstract factors – e.g., view, neighborhood quality, etc. – which may influence the value of a particular property.12 The Office of Policy and Management (OPM) prepares an annual assessment-sales ratio study calculating the coefficient of dispersion and price related differential for each town to measure the horizontal and vertical equity of property tax administration across towns. The primary purpose of the assessment/sales ratio study is to adjust for differences in assessment levels across towns to calculate an equalized net grand list used to allocate some state grants across towns. All states have similar programs because state aid should be distributed according to differences in capacity, not differences in property tax administration.
There are three dimensions of assessment uniformity measured in
assessment/sales ratio studies:
12 This is only an issue in towns with large assessment staffs.

DISCUSSION DRAFT 32 10/27/2015
1) The first step is to determine how close actual assessed values are to the target of market value.13 Three measures of central tendency are typically computed:
a) an average assessment/sales ratio which is the mean of the assessment/sales ratios for each individual property;
b) the median of the individual ratios, which is the value in the middle of the ratios when sorted into ascending or descending order; and
c) the weighted average which is the total of assessed value divided by the total sales value of all the properties.
In practice the median ratio is used most often, albeit some jurisdictions use the
mean ratio. Bell and Bowman (1991, 357) found that while there are differences when using the mean vs the median ratio, the differences often are not critical. OPM uses the median ratio in its assessment/sales ratio study.
2) The next step is to determine the extent to which similar properties are treated the same. This is a measure of horizontal uniformity – properties of equal value are treated equally – and measures how individual properties are clustered around the measure of central tendency. The most commonly used measure of horizontal uniformity is the Coefficient of Dispersion (COD).14 Typically, CODs of less than 15 for residential properties indicate good assessment uniformity, while CODs of less than 20 for income producing properties and vacant land indicate good assessment uniformity. [Eckert, 540] 3) The final step is to determine if there is a systematic bias in valuing high- or low-valued properties. The statistical measure used to gauge vertical assessment uniformity is the Price Related Differential (PRD).15 The PRD tests to see if higher and lower valued properties are assessed at the same level. According to the International Association of Assessing Officers (IAAO) the PRD should range between 0.98 and 1.03 to indicate vertical uniformity in assessments. A PRD greater than 1 indicates an under valuation of high value properties, while a value less than 1 indicates under valuation of low valued properties.
Other Issues to Consider in Ratio Studies
The purpose of an assessment/sales ratio study is to compare the actual market value of a property to its gross assessed value determined by the assessor. Only arm’s length sales transactions between a willing buyer and a willing seller are included in the assessment ratio studies. [Eckert, 23]
13 In Connecticut the appraised value of a property is the estimated market value of the property. Assessed value in Connecticut is 70 percent of the appraised value. 14 The coefficient of dispersion is the average absolute deviation of individual-parcel ratios from the median ratio, expressed as a percentage of the median (or mean) ratio. [Eckert, 534-35] 15 The Price Related Differential is calculated by dividing the mean ratio by the weighted (or aggregate) mean ratio. [Eckert, 539-40]

DISCUSSION DRAFT 33 10/27/2015
Use of arm’s length transactions is important to ensure that the transactions
reflect true market value. Arm’s length transactions only take place between parties that have no kind of business or family connection to one another and are not acting out of distress. For instance, purchasing a property from a company owned by a relative, even if both entities are not affiliated parties, would not be considered a true arm’s length transaction. In a similar manner, properties purchased at a tax sale, judicial sale or the sale of foreclosed properties do not represent arm’s length sales because they are made under duress and there is not a willing seller and willing buyer.
Assessors in each town identify non-arm’s length sales which OPM excludes from their assessment/sales ratio study because the assessor determines they are sales between related parties, to and from financial institutions or government agencies or sales with extreme ratios (which indicate abnormal transactions). Table 9 lists the codes given to properties determined by the assessor to be non-arms-length sales. There are 33 reasons that a property sale may be determined to be a non-arm’s length sale that cannot be used in OPM’s assessment/sale ratio study.
Table 9
Codes for Non-arms-length Sales Not Used in Assessment/Sales Ratio Study Code Defined Code Defined
00 Verified Sale by Deed or Assurance 15 Government sale 01 Family sale 16 Sale to/from charitable org 02 Love & affection 17 Sale parcel in two towns 03 Intra corporation 18 In lieu of foreclosure 04 Transfer of convenience 19 Right of way sale 05 Deed 6 months from agreement 20 Csale of cemetery lot 06 Portion of property sold 21 Sale - other than cash 07 Prop substantially changed 22 Sale including household goods 08 Sale of undivided/part interest 23 Influenced by zoning change 09 Tax sale 24 Plottage 0A Verified land sale 25 Other 0B Beach sale 26 Unverified sale 10 Conveyance per last will & testament 28 Use assessment ie farming 11 Judicial sale 29 Sales of no consideration 12 Sale of non-bid to abutter 30 Sale at public or private auction 13 Bankruptcy 31 Estate sale 14 Sale of foreclosed property
Assessors reported 35,940 sales to OPM for the 2012 assessment year. Of those, 12,700 (or more than 35 percent of total sales) were classified by the assessors as non-arm’s length sales according to the codes in the table above. Of those non-arm’s length sales, two codes account for 57.8 of total non-arm’s length sales.

DISCUSSION DRAFT 34 10/27/2015
Specifically, code 14 (sale of foreclosed property) accounts for 21.9 percent of all non-arm’s length sales and code 25 (other)16 accounts for 35.9 percent of all non-arm’s length sales. Table 10 summarizes the findings of the OPM assessment/sales ratio for representative small cities, wealthy suburbs and rural towns in Connecticut. The results of an appraisal/sales ratio comparing the sales price to the estimated market value of a property (the appraised value in Connecticut) and using the median ratio to calculate the coefficient of dispersion are also presented in Table 10. The results are very consistent for the coefficient of dispersion and the price related differential for residential, CIP (commercial, industrial and public utility) and vacant land parcels. The results of the OPM assessment/sales ratio are essentially the same as the approach using appraised values across all property types – residential, CIP and vacant. The only place where the two approaches differ is in the calculation of the mean and median values which are measures of central tendency. This merely reflects the fact that the OPM ratio study compares assessed value to sales price and the other approach compares the appraised value to sales price for each property and the assessed value is 70 percent of the appraised value.
For the OPM study if assessed value reflected 70 percent of the market value the ratio should approach 0.7 while for the study using appraised value study the ratio should be around 1.0. Of the results presented in Table 10, there is only one town which has a mean below 0.7 – Plainville (.687 for commercial properties). All other towns have means in excess of 0.7. Similarly, the median for the second approach is below 1.0 in only three towns and all are for vacant land – Torrington (.895), Litchfield (.861) and New Canaan (.981).
While these measures of central tendency exceed the assessment/sales ratio target of 0.7 and the appraisal/sales ratio of 1.0, they are more difficult to interpret in Connecticut than other states. The ratios are distorted by the 5-year assessment cycle in Connecticut and cannot be interpreted as a measure of assessment quality. For example, if a property is valued in 2012 it keeps that estimated market value until it is re-valued in 2017. However, because market conditions change over time, the actual market price of that house may increase or fall over the five years. As a result, the estimated market value from 2012 will be less than/greater than the actual sales price in 2014 or 2015. In a market experiencing declines in property values, the 5-year
16 According to OPM, the other category is defined as short sales and sales that have an assessment/sales ratio that is either too high or too low. For example, the “Other” category includes properties that sold but the value differs from what was assessed. This might be a property which the assessor lists as a 2,400 sf colonial that sells for $75,000 more than the assessor had valued the property. But the assessor might look at the MLS listing to see that they finished a 600 sf room over the garage and now it’s a 3,000 sf colonial. Other properties included in this category might include property that was under construction and only assessed as a vacant lot, but when it sold it has a fully complete home that the assessor still needed to pick up or a property that was assessed at use value (PA 490) which it’s assessed based on “use value” and not its FMV although that should have been coded as “28”.
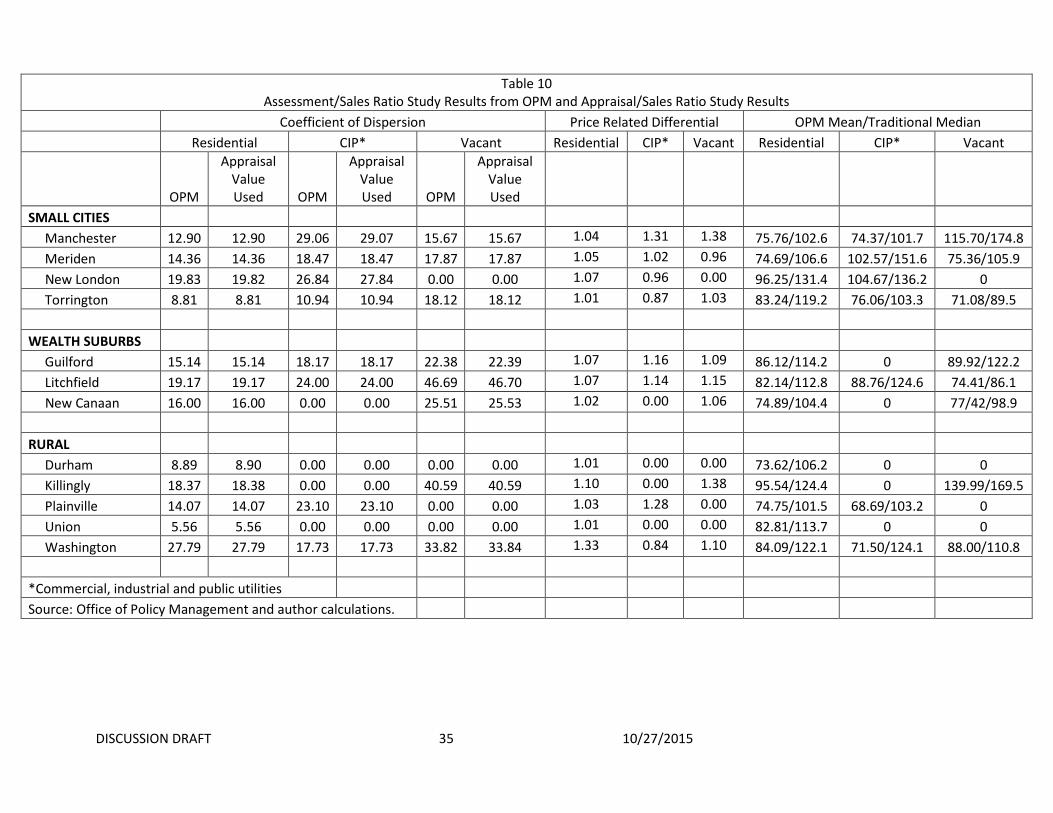
DISCUSSION DRAFT 35 10/27/2015
Table 10 Assessment/Sales Ratio Study Results from OPM and Appraisal/Sales Ratio Study Results
Coefficient of Dispersion Price Related Differential OPM Mean/Traditional Median
Residential CIP* Vacant Residential CIP* Vacant Residential CIP* Vacant
OPM
Appraisal Value Used OPM
Appraisal Value Used OPM
Appraisal Value Used
SMALL CITIES
Manchester 12.90 12.90 29.06 29.07 15.67 15.67 1.04 1.31 1.38 75.76/102.6 74.37/101.7 115.70/174.8
Meriden 14.36 14.36 18.47 18.47 17.87 17.87 1.05 1.02 0.96 74.69/106.6 102.57/151.6 75.36/105.9 New London 19.83 19.82 26.84 27.84 0.00 0.00 1.07 0.96 0.00 96.25/131.4 104.67/136.2 0 Torrington 8.81 8.81 10.94 10.94 18.12 18.12 1.01 0.87 1.03 83.24/119.2 76.06/103.3 71.08/89.5
WEALTH SUBURBS
Guilford 15.14 15.14 18.17 18.17 22.38 22.39 1.07 1.16 1.09 86.12/114.2 0 89.92/122.2
Litchfield 19.17 19.17 24.00 24.00 46.69 46.70 1.07 1.14 1.15 82.14/112.8 88.76/124.6 74.41/86.1 New Canaan 16.00 16.00 0.00 0.00 25.51 25.53 1.02 0.00 1.06 74.89/104.4 0 77/42/98.9
RURAL
Durham 8.89 8.90 0.00 0.00 0.00 0.00 1.01 0.00 0.00 73.62/106.2 0 0
Killingly 18.37 18.38 0.00 0.00 40.59 40.59 1.10 0.00 1.38 95.54/124.4 0 139.99/169.5 Plainville 14.07 14.07 23.10 23.10 0.00 0.00 1.03 1.28 0.00 74.75/101.5 68.69/103.2 0 Union 5.56 5.56 0.00 0.00 0.00 0.00 1.01 0.00 0.00 82.81/113.7 0 0 Washington 27.79 27.79 17.73 17.73 33.82 33.84 1.33 0.84 1.10 84.09/122.1 71.50/124.1 88.00/110.8
*Commercial, industrial and public utilities
Source: Office of Policy Management and author calculations.
DISCUSSION DRAFT 36 10/27/2015
assessment cycle distorts the assessment/sales ratios over time giving it an upward bias. Thus, equalization for those towns that do not revalue each year does not reflect differences in assessment quality. Rather, the assessment/sales ratio is distorted by where the town is in the reassessment cycle and how markets have changed over time. Assessment accuracy is only determined by The Performance Based Revaluation Standards Certification, which is filed every five years when the town reassesses. These distortions would be corrected if Connecticut moved to annual reassessment.
If a property owner is not satisfied with the estimated assessed value of her property, she has the right to appeal the assessment. The appeals process is described in the next section.
Appeals Process
The property tax is the most difficult and challenging state and local tax to administer. The income tax is based on the annual income of an individual or business. The sales tax is based on the amount of taxable sales taking place annually. These are both annual flows that are well documented. Alternatively, the property tax is based on the estimated selling price a property. Property does not change hands annually so the value has to be estimated by the assessor.
Because the base of the real property tax is estimated, it is important there is a process for the property owner to challenge the estimated market value of his/her property. An appeals process is a critical part of the property tax system. Such an appeals process provides the opportunity for an aggrieved property owner to pursue relief and it provides information on the functioning of the assessment system. A well-functioning appeals process should be easily accessible and generally low cost for the property owner. Consistent with best practices, Connecticut has a three-step appeals process.
The first step in this process is when initial revaluations are determined and sent to the property owner. At that point the property owner is invited to meet the assessor or representative from the revaluation company to discuss the proposed valuation. This is an opportunity for the property owner to identify errors on the property record card and to present an alternative opinion of value. This is not a legislatively mandated process but most jurisdictions follow this practice before finalizing proposed values.
DISCUSSION DRAFT 37 10/27/2015
Board of Assessment Appeals
Boards of Assessment Appeals, created by the General Statutes of Connecticut, represent the second opportunity to appeal one’s property valuation.17 The board of assessment appeals in each town meets at least once in September for the sole purpose of hearing appeals related to the assessment of motor vehicles. In addition, the board of assessment appeals in each town meets in March to hear appeals related to the assessment of real property. (CGS Section 12-110)
Each person owning property can contest the valuation of that property assigned by the assessor by filing a written appeal not later than February 20. The board will then notify each aggrieved taxpayer who filed a written appeal in the proper form and in a timely manner, no later than March first of the date, time and place of the appeal hearing. The board will determine all appeals for which the board conducts an appeal hearing and send written notification of the final determination of such appeals to each person within one week of the determination. (CGS Section 12-111)
The boards have additional specific powers which they may exercise at their discretion:
1. Administer oaths in cases coming before them 2. Correct clerical omissions or mistakes in the assessment of taxes 3. Add to the assessment lists the names of people who own taxable property in the
town, but have been omitted from the list 4. Increase the number, quantity or amount of property in any person’s list18 5. Reduce the list of any person appearing before the board by decreasing the
valuation, quantity or amount of any item 6. Make a supplemental list of any taxable property omitted by the assessors 7. Add 25 percent to the value of any additional or supplemental lists of personal
property as a penalty 8. Elect not to conduct appeal hearing for any commercial, industrial, utility or
apartment properties with assessment greater than $1,000,000. [Connecticut Association of Assessors, 2009, p. 5]
Superior Court
If the taxpayer is not satisfied with the finding of the Board of Assessment Appeals, they have two months from the time of notification of the determination of the Board of Assessment Appeals for a final appeal to the Superior Court for the judicial district in which the town or city is located. The court has the power to grant relief in which case the applicant shall be reimbursed by the town for any overpayment of taxes together with interest and any costs awarded by the court. Alternatively, if the court 17 Sections 12-110 to 12-117. 18 When a board increases the assessment, or quantity thereof, they must mail to the owner, at the last known address, within one week of the decision, a written or printed notice to appear before such board at a specific time and place and show cause why such property should not be added to such grand list.
DISCUSSION DRAFT 38 10/27/2015
finds the appeal is made without probably cause, it may assess the applicant double or triple the costs, but in practice it does not award costs to either side.
Determining the Property Tax Rate
Once the value of each component of the Grand List is determined by the assessor, the city councils or boards of finance in each town set the property tax rate to be used in calculating the property tax liability for each property, motor vehicle and business personal property.19 The property tax rate is typically expressed in mills, or taxes per $1,000 of value. A property tax rate of 24.00 mills is equivalent to 2.4 percent.
CGS Section 12-122 requires the selectmen in each town provide an itemized estimate of the current expenses of the departments of the town for the coming year and those estimates will be altered or approved by the voters at a town meeting. The selectmen, city councils and board of finance in each town consider other estimated yearly income of the town and then set a property tax rate which must be sufficient to pay the estimated expenses of the town in the coming year.
The process of setting the property tax rate can be a contentious process because of the political nature of the municipal budget process. Some communities are more willing to raise property tax rates than others. This could simply reflect the increased demand for local services and the relative wealth of their residents. Alternatively, many municipalities have a harder time approving budgets that increase the mill rate because of taxpayer dissatisfaction. This is particularly true during economic downturns, when there is more scrutiny of town budgets.
PROPERTY TAX RELIEF MECHANISMS
Efforts to reduce property tax liabilities include both direct and indirect property tax relief for property owners: Direct property tax relief reduces the tax liabilities for individual property owners;
and Indirect property tax relief reduces reliance on property taxes generally by
providing local governments access to alternative own-source revenues and increasing reliance on state grants.
Local governments in Connecticut have a high reliance on the property tax as
described above, but they have a low reliance on user charges, other taxes and state grants. In 2012 current charges accounted for 27.5 percent of total local own-source revenues in the US; the comparable figure for Connecticut was 10.1 percent. Alternatively, in 2012 property taxes accounted for 73.5 percent of total local taxes in
19 New legislation caps the property tax rate on motor vehicles at 32 mills for assessment year beginning October 1, 2015 and 29.38 mills for each assessment year thereafter.
DISCUSSION DRAFT 39 10/27/2015
the U.S.; the comparable figure for Connecticut was 98.8 percent. Finally, intergovernmental transfers accounted for 37.0 percent of total local general revenues nationally, but just 29.1 percent in Connecticut. In short, local tax and own-source revenues in Connecticut are less diverse than local government tax and own-source revenues nationally.
Direct property tax relief programs reduce or eliminate the property tax liability for individual properties depending on the use of the property and the characteristics of the owner. For example, as mentioned above farm land, forest land, open space land and marine heritage land are taxed at use value, not market value. In addition, some properties are entirely exempt from paying property taxes. This group includes certain property uses/owners that are typically exempt from property taxation by most state and local governments – e.g., property belonging to private hospitals, schools, private colleges and universities, and religious organizations.
The purpose of this section is to briefly describe the plethora of direct property tax relief measures available in Connecticut which provide preferential treatment to individual properties based on the characteristics/use of the property and the characteristics of the property owner. These direct property tax relief programs fall into two general categories – property tax relief provided by the state20 and property tax relief options available to local governments. These are discussed in the next two sections.
State Provided Property Tax Relief Programs
There is no single place one can go to find a comprehensive list of state provided property tax relief mechanisms. As a start, Connecticut is one of just over a dozen states that annually prepares a tax expenditure report that includes a section on property tax expenditures. This is the first place to look for state programs that reduce or eliminate property taxes on individual properties based on the characteristics of the property or the property owner.
CGS Section 12-7(b)(e) requires the Office of Fiscal Analysis (OFA) to prepare biennially a report on tax expenditures, “which the law defines as any exemption, exclusion, deduction or credit created under the general statutes or public act which result in less tax revenue to the state or municipalities than they would otherwise receive.” [OFA, p. 1]
OFA developed guidelines for what is determined to be a tax expenditure if it:
1. Impacts a statewide tax; 2. Results in reduced tax revenue; 3. Is not an appropriation; 4. Is included in the definition of a tax base;
20 The lost revenue of some state imposed exemptions may be partially reimbursed by the state to the municipalities where the exempt properties are located.
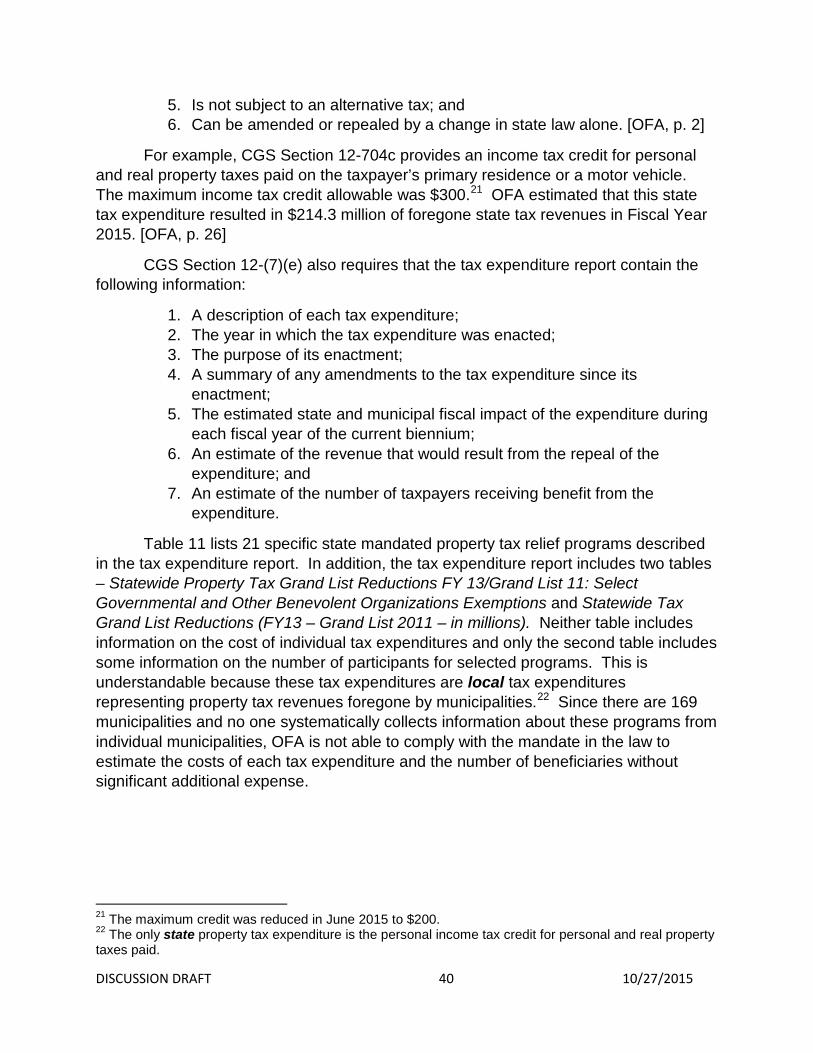
DISCUSSION DRAFT 40 10/27/2015
5. Is not subject to an alternative tax; and 6. Can be amended or repealed by a change in state law alone. [OFA, p. 2]
For example, CGS Section 12-704c provides an income tax credit for personal and real property taxes paid on the taxpayer’s primary residence or a motor vehicle. The maximum income tax credit allowable was $300.21 OFA estimated that this state tax expenditure resulted in $214.3 million of foregone state tax revenues in Fiscal Year 2015. [OFA, p. 26]
CGS Section 12-(7)(e) also requires that the tax expenditure report contain the following information:
1. A description of each tax expenditure; 2. The year in which the tax expenditure was enacted; 3. The purpose of its enactment; 4. A summary of any amendments to the tax expenditure since its
enactment; 5. The estimated state and municipal fiscal impact of the expenditure during
each fiscal year of the current biennium; 6. An estimate of the revenue that would result from the repeal of the
expenditure; and 7. An estimate of the number of taxpayers receiving benefit from the
expenditure.
Table 11 lists 21 specific state mandated property tax relief programs described in the tax expenditure report. In addition, the tax expenditure report includes two tables – Statewide Property Tax Grand List Reductions FY 13/Grand List 11: Select Governmental and Other Benevolent Organizations Exemptions and Statewide Tax Grand List Reductions (FY13 – Grand List 2011 – in millions). Neither table includes information on the cost of individual tax expenditures and only the second table includes some information on the number of participants for selected programs. This is understandable because these tax expenditures are local tax expenditures representing property tax revenues foregone by municipalities.22 Since there are 169 municipalities and no one systematically collects information about these programs from individual municipalities, OFA is not able to comply with the mandate in the law to estimate the costs of each tax expenditure and the number of beneficiaries without significant additional expense.
21 The maximum credit was reduced in June 2015 to $200. 22 The only state property tax expenditure is the personal income tax credit for personal and real property taxes paid.

DISCUSSION DRAFT 41 10/27/2015
Table 11 State Property Tax Exemptions
Described in Connecticut Tax Expenditure Report, 2014 Section 12-81(1) Federally-owned property Section 12-81(2) State-owned property Section 12-81(4) Municipally-owned property Section 12-81(5) Property held by trustees for public purpose Section 12-81(6) Property of volunteer fire companies
Section 12-81(7) Property devoted to scientific, educational, literary, historical or charitable purposes
Section 12-81(8) Specific enumerated Colleges Section 12-81(9) Personal property loaned educational institutions Section 12-81(10) property owned by horticultural societies Section 12-81(11) Cemetery property Section 12-81(12) Personal property of religious organizations Section 12-81(13) Real and personal property of houses of religious worship
Section 12-81(14) Real and personal property religious organization used for a school, a non-profit camp or recreational facility for religious purposes, a parish house, orphan asylum
Section 12-81(15) Dwelling house and land of officiating clergymen Section 12-81(16) Hospitals and sanatoriums Section 12-81(18) Property of veterans' associations Section 12-81(27) Grand army posts Section 12-81(29) the Red Cross Section 12-81(45) Connecticut National Guard Section 12-81(48) Airport improvements Section 12-81(49) Nonprofit camps or recreational facilities charitable purposes Source: OFA, Connecticut Tax Expenditure Report, January 2014, pp. 194-198.
The Office of Policy and Management does collect information on some of the programs listed in the tax expenditure report. Specifically, Table 12 reports information from OPM regarding the amount the state paid to individual local governments to reimburse them for property taxes lost because of a state property tax relief program. For example, the state paid local governments $115.4 million in partial reimbursement for property taxes foregone by municipalities because of state mandated property tax exemptions for private colleges and hospitals. This amount, however, is not a property tax expenditure, it is a state appropriation that goes through the normal budgetary process. This would be excluded as a tax expenditure according to item 3 of the OFA guidelines described above. The unreimbursed amount of property taxes foregone because of these exemptions is a local tax expenditure, which could be estimated from the OPM data.

DISCUSSION DRAFT 42 10/27/2015
Table 12 State Property Tax Reimbursements to Municipalities, 2014
Property Tax Relief Program Amount Reimbursed by the State Elderly homeowner $20,504,900 Elderly freeze $171,356 Totally disabled $400,000 State owned property $78,320,158 College and hospitals $115,431,737 Source: Office of Policy and Management
Since a tax expenditure is revenue foregone because of a provision in the CGS the tax expenditure report on property tax expenditures would benefit from more clarity about what is a state property tax expenditure, what is a local property tax expenditure, and what is a state reimbursement that goes through the normal budgetary and appropriation process.
The tax expenditure report, however, is not a comprehensive list of all state provided property tax relief mechanisms. The report mentions, but does not list separately, property tax relief programs that provide partial exemptions for property occupied as dwelling places by the blind (exempts $3,000 of value), veterans (exempts $1,000 of value)23, disabled veterans (a sliding scale which exempts between $1,500 and $3,000 of value depending on degree of disability and age),24 totally disabled (exempts $1,000 of value), elderly and specified relatives.25
Connecticut statutes also require the veteran’s and disabled veteran’s exemptions to grow when the town’s Grand List grows. For example, in Colchester and Andover the veteran exemption is now $2,000 and not $1,000 and in Madison it is now $6,000 instead of $1,000. The Disabled Veteran exemption has doubled as well in Colchester and Andover.
State mandated exemptions fall into three basic categories
23 The surviving spouse or minor child of a veteran shall have $1,000 of property exempt from property taxation. 24 CGS 12-81(20) provides for a sliding scale of benefits for disabled veterans based on disability ratings by the Veterans’ Administration of the United States amounting to ten per cent or more of total disability, provided such exemption shall be fifteen hundred dollars in any case in which such rating is between ten per cent and twenty-five per cent; two thousand dollars in any case in which such rating is more than twenty-five per cent but not more than fifty per cent; twenty-five hundred dollars in any case in which such rating is more than fifty per cent but not more than seventy-five per cent; and three thousand dollars in any case in which such person has attained sixty-five years of age or such rating is more than seventy-five percent. Disabled veterans with severe disability shall have $10,000 of value of the dwelling house exempt from property taxation. 25 For example, parents of veterans can have $1,000 of property belonging to them exempt from property taxation.
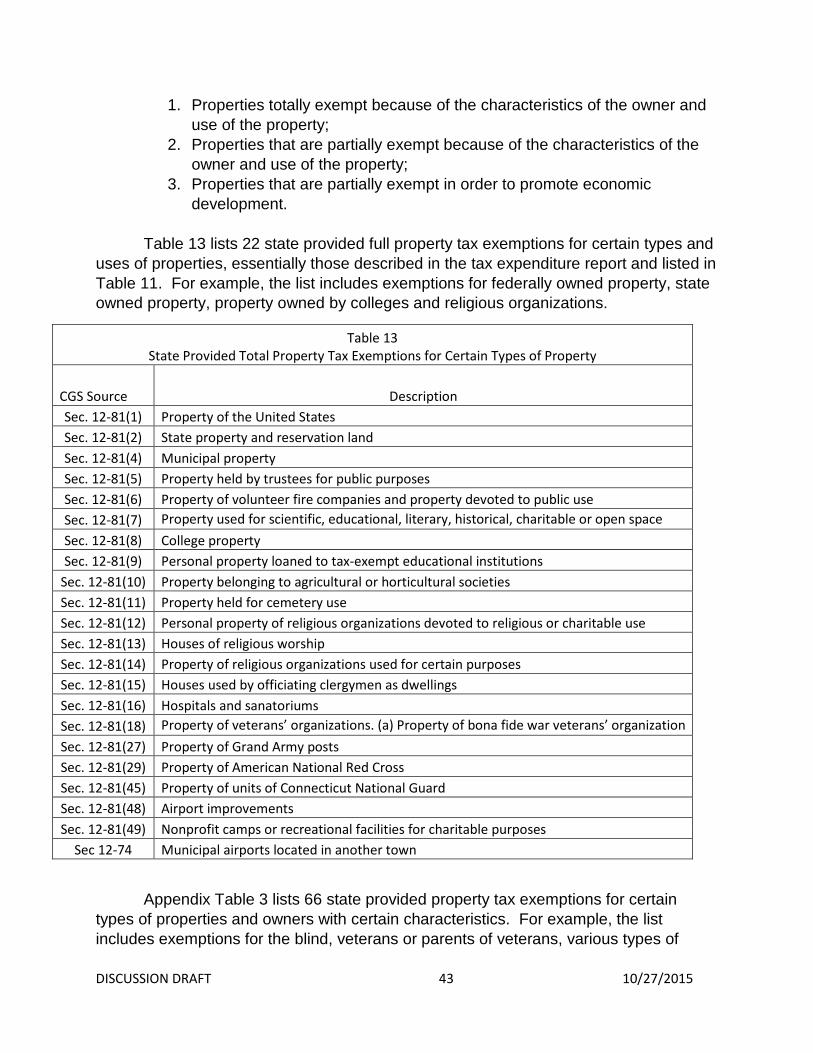
DISCUSSION DRAFT 43 10/27/2015
1. Properties totally exempt because of the characteristics of the owner and use of the property;
2. Properties that are partially exempt because of the characteristics of the owner and use of the property;
3. Properties that are partially exempt in order to promote economic development.
Table 13 lists 22 state provided full property tax exemptions for certain types and uses of properties, essentially those described in the tax expenditure report and listed in Table 11. For example, the list includes exemptions for federally owned property, state owned property, property owned by colleges and religious organizations.
Table 13 State Provided Total Property Tax Exemptions for Certain Types of Property
CGS Source Description Sec. 12-81(1) Property of the United States Sec. 12-81(2) State property and reservation land Sec. 12-81(4) Municipal property Sec. 12-81(5) Property held by trustees for public purposes Sec. 12-81(6) Property of volunteer fire companies and property devoted to public use Sec. 12-81(7) Property used for scientific, educational, literary, historical, charitable or open space Sec. 12-81(8) College property Sec. 12-81(9) Personal property loaned to tax-exempt educational institutions
Sec. 12-81(10) Property belonging to agricultural or horticultural societies Sec. 12-81(11) Property held for cemetery use Sec. 12-81(12) Personal property of religious organizations devoted to religious or charitable use Sec. 12-81(13) Houses of religious worship Sec. 12-81(14) Property of religious organizations used for certain purposes Sec. 12-81(15) Houses used by officiating clergymen as dwellings Sec. 12-81(16) Hospitals and sanatoriums Sec. 12-81(18) Property of veterans’ organizations. (a) Property of bona fide war veterans’ organization Sec. 12-81(27) Property of Grand Army posts Sec. 12-81(29) Property of American National Red Cross Sec. 12-81(45) Property of units of Connecticut National Guard Sec. 12-81(48) Airport improvements Sec. 12-81(49) Nonprofit camps or recreational facilities for charitable purposes
Sec 12-74 Municipal airports located in another town
Appendix Table 3 lists 66 state provided property tax exemptions for certain types of properties and owners with certain characteristics. For example, the list includes exemptions for the blind, veterans or parents of veterans, various types of

DISCUSSION DRAFT 44 10/27/2015
personal property and a wide range of other types of personal and real property. Typically, relief is provided through exempting some portion of the value of the real property owned by these beneficiaries from property taxation. The amount exempted is generally very modest ranging from $1,000 to $10,000 typically.
Table 14 lists 15 state provided property tax exemptions intended to promote economic and housing development. Six of these exemptions are state provided options for local governments.
Table 14
State Provided Property Tax Exemptions for Promote Economic and Development CGS Source Description Sec. 7-498 Town/City Development Act Sec. 8-215 Department of Housing, Moderate Income Housing - Municipal Option Sec. 8-380 Department of Housing Deferment - Local Option Sec. 8-58 Connecticut Housing Authority
Sec. 12-65 Multi-family fixed assessment Sec. 12-65b(1) Fixed assessment for 7 years if investment is $3 million or more - Local Option Sec. 12-65b(2) Fixed assessment for 2 years if investment is $500,000 or more - Local Option Sec. 12-65b(3) Fixed assessment for 3 years if investment is $25,000 or more but not more than 50% - Local Option
Sec. 12-65e Fixed assessment for 11 years for rehabilitation Sec. 12-65g Fixed assessment for 5 years for physically disabled
Sec. 32-602( c) Capitol City Economic Development Authority Sec. 32-666a Fixed assessments - Adriaen's Landing & Capitol City Project
Sec. 32-70 Enterprise zone Sec. 32-71 enterprise zone fixed assessments
Sec. 32-71a Electric generating facility - Local Option
Finally, Table 15 lists 11 miscellaneous state provided property tax exemptions based on the type of business being carried out.
In summary, there are four groups of state provided property tax relief based on type of property, characteristics of the property owner or the type of business being carried out. In total, 124 property tax exemptions have been identified, albeit it cannot be claimed this is an exhaustive list. Property tax relief is generally very modest.

DISCUSSION DRAFT 45 10/27/2015
Table 15
Miscellaneous State Provided Property Tax Exemptions
CGS Source Description
Sec. 10a-191 State of Connecticut Health and Educational Facilities Authority
Sec. 12-241 Common carrier motor buses -- 100 percent exemption -- 50 percent for personal property
Sec. 12-245 Public air carrier
Sec. 12-255 Public Service Companies -- e.g. railroads
Sec. 12-268j Public Service Companies -- e.g. railroads
Sec. 12-76 Municipal Water Corporations
Sec. 12-77 Generation of water power
State Provided Municipal Option Property Tax Relief Programs
In addition to providing direct property tax relief itself, the state also provides property tax relief options for municipalities. Specifically, Table 16 lists 38 state provided municipal options for providing property tax relief to their citizens. It is difficult to know how these programs are being used by the 169 municipalities, however, because no one is responsible for systematically collecting that information.
Fortunately, the Connecticut Conference of Municipalities (CCM) collect information about the usage of state provided municipal property tax relief options. Specifically, CCM staff collected information through searches and contact with towns asking them which of the 38 property tax relief options provided by the state they actually use to provide property tax relief to their citizens. As this is being written, approximately 140 municipalities have responded to the informal survey. So far, of the 38 property tax relief options provided by the state to municipalities, 14, or 36.8 percent, are not used by any municipality. One state provided option is used by six municipalities, and another 13 state authorized property tax relief options are used by between 1 and 3 municipalities. In other words, 28 of the 38 property tax relief options provided by the state, 73.7 percent of the total, are used by 6 or fewer municipalities.
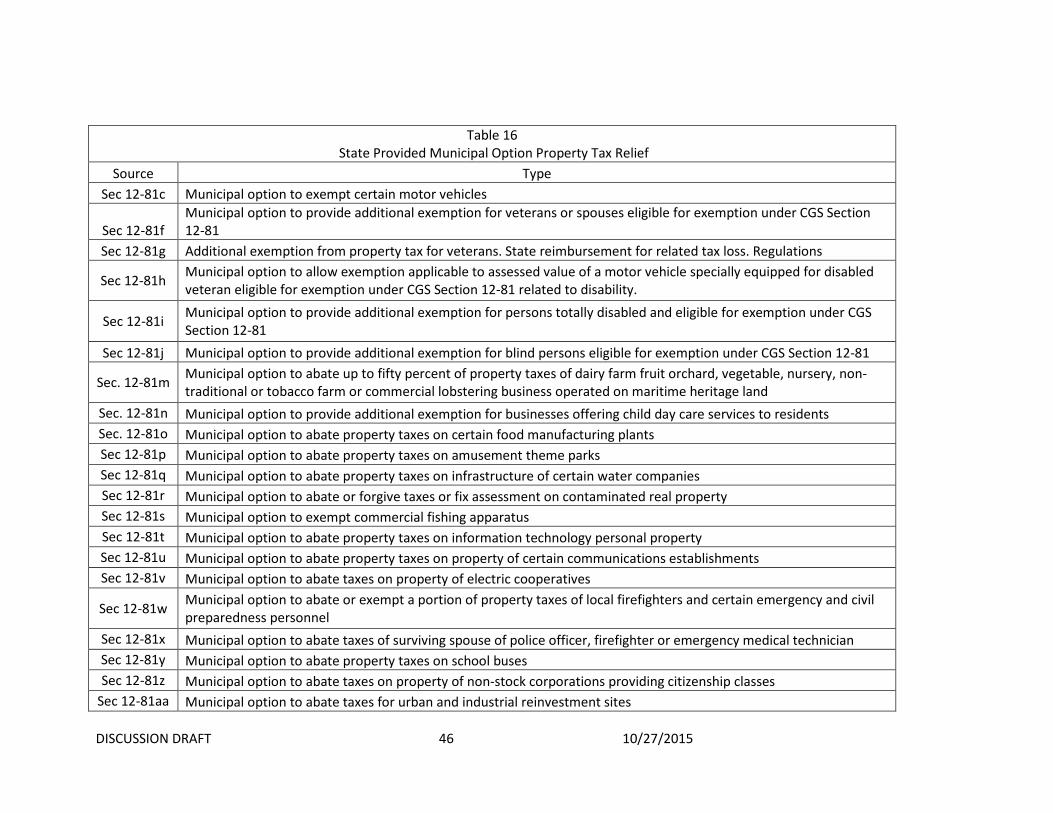
DISCUSSION DRAFT 46 10/27/2015
Table 16 State Provided Municipal Option Property Tax Relief
Source Type Sec 12-81c Municipal option to exempt certain motor vehicles
Sec 12-81f Municipal option to provide additional exemption for veterans or spouses eligible for exemption under CGS Section 12-81
Sec 12-81g Additional exemption from property tax for veterans. State reimbursement for related tax loss. Regulations
Sec 12-81h Municipal option to allow exemption applicable to assessed value of a motor vehicle specially equipped for disabled veteran eligible for exemption under CGS Section 12-81 related to disability.
Sec 12-81i Municipal option to provide additional exemption for persons totally disabled and eligible for exemption under CGS Section 12-81
Sec 12-81j Municipal option to provide additional exemption for blind persons eligible for exemption under CGS Section 12-81
Sec. 12-81m Municipal option to abate up to fifty percent of property taxes of dairy farm fruit orchard, vegetable, nursery, non-traditional or tobacco farm or commercial lobstering business operated on maritime heritage land
Sec. 12-81n Municipal option to provide additional exemption for businesses offering child day care services to residents Sec. 12-81o Municipal option to abate property taxes on certain food manufacturing plants Sec 12-81p Municipal option to abate property taxes on amusement theme parks Sec 12-81q Municipal option to abate property taxes on infrastructure of certain water companies Sec 12-81r Municipal option to abate or forgive taxes or fix assessment on contaminated real property Sec 12-81s Municipal option to exempt commercial fishing apparatus Sec 12-81t Municipal option to abate property taxes on information technology personal property Sec 12-81u Municipal option to abate property taxes on property of certain communications establishments Sec 12-81v Municipal option to abate taxes on property of electric cooperatives
Sec 12-81w Municipal option to abate or exempt a portion of property taxes of local firefighters and certain emergency and civil preparedness personnel
Sec 12-81x Municipal option to abate taxes of surviving spouse of police officer, firefighter or emergency medical technician Sec 12-81y Municipal option to abate property taxes on school buses Sec 12-81z Municipal option to abate taxes on property of non-stock corporations providing citizenship classes
Sec 12-81aa Municipal option to abate taxes for urban and industrial reinvestment sites
DISCUSSION DRAFT 47 10/27/2015
Sec 12-81bb Municipal option to provide property tax credits for affordable housing deed restrictions Sec 12-81dd Municipal option to abate real or personal property taxes paid by a nonprofit land conservation organization Sec 12-81ff Municipal option to abate property taxes on machinery used in connection with recycling Sec 12-81gg Municipal option to exempt horses and ponies from property taxation Sec 12-91 Additional optional exemption for farm buildings or buildings used for housing for seasonal employees Sec 12-124 Abatement of taxes and interest
Sec 12-124a Municipal option to abate taxes on residence exceeding eight per cent of occupants’ income Sec 12-125a Waiver of taxes on certain property held by suppliers of water Sec 12-126 Abatement or refund of tax on tangible personal property assessed in more than one municipality
Sec 12-127a Abatement of taxes on structures of historical or architectural merit Sec 12-129b Real property tax relief for certain persons sixty-five years of age or over
Sec 12-129n Optional municipal property tax relief program for certain homeowners age sixty-five or over or permanently and totally disabled
Sec 12-129r Municipal option to abate taxes on open space in exchange for transfer of development rights to municipality Sec 12-129s Municipal option to abate taxes on high mileage motor vehicles and hybrid passenger cars Sec 12-129t Municipal option to abate taxes on visitable housing Sec 12-129u Municipal option to abate taxes on historic agricultural structures Sec 12-170v Municipal option to provide real property tax relief to certain elderly homeowners

48
Table 17 provides information on state authorized local property tax relief mechanisms used by ten or more municipalities. The most popular tax relief option, used by 63 municipalities, or approximately 45 percent of the municipalities included in the survey so far, is property tax relief provided to certain homeowners age 65 or over or to permanently and totally disabled on their principal residence [CGS, Sec 12-129n]. Each municipality appoints a committee to make recommendations on the form and extent of property tax relief to be provided, but total property tax relief provided cannot exceed 10 percent of the previous year’s total real property tax assessment.
The second most popular state authorized property tax relief program, used by 56 municipalities, or 40.0 percent of municipalities responding to the CCM informal survey so far, exempts certain motor vehicles from the property tax [CGS, Sec 12-81c]. This provision authorizes municipal legislative bodies to exempt property owned by non-profit ambulance companies, including ambulances, and motor vehicles owned by the disabled that have been modified for use by that person.
CGS Section 12-129b provides tax relief for those who applied under this program not later than May 15, 1980. This is what is referred to as a “tax freeze” for the elderly. To receive benefits under this provision, the taxpayer must be
1. Sixty-five years of age or over or the surviving spouse 62 years or older on May 15, 1980 – making the taxpayer at least 97 or more as of May 15, 2015;26
2. Occupy the property as their home; 26 According to the Office of Policy and Management there are 63 taxpayers state-wide receiving this benefit.
Table 17 Municipal Usage of State Provided
Municipal Property Tax Relief Options Option
Number Using
Sec 12-129n 63 Sec 12-81c
56
Sec 12-129b 44 Sec 12-81f
41
Sec 12-91 23 Sec 12-81w 18 Sec 12-81m 13
Sec 12-81g 11 Sec 12-81j 10 Sec 12-81x 10 Source: Connecticut Conference of
Municipalities. Informal survey, 2015.

49
3. A resident of the state for a year before filing for relief; and 4. Have adjusted gross income (plus tax exempt interest), as determined
by the Internal Revenue Service, of not more than $6,000.
Relief provided by state authorized property tax relief options for municipalities is relatively modest, as is relief provided through state mechanisms focused on individuals. As a result, there are very modest differences between gross and net Grand List total values and the relative importance of individual components of the base.
Circuit Breaker
The programs discussed in the previous sections provide property tax relief based on characteristics of the property and the property owner, regardless of their economic circumstances. Another approach to providing direct property tax relief is the circuit breaker which targets property tax relief on those with high property tax liabilities relative to income.
The state of Connecticut provides property tax relief to elderly and totally disabled homeowners through a circuit breaker. The circuit breaker was created when the “tax freeze” was abolished (except for those grandfathered). It was created because the “tax freeze” was too costly. The circuit breaker has a maximum benefit of $1,000 for single taxpayer and $1,250 for a married taxpayer whereas the “tax freeze” originally had no ceiling as to the amount of the benefit. Later a $2,000 cap was installed.
The homeowner, when applying for benefits under this program, must document their taxable and non-taxable income, the total of which is called qualifying income.27 In making the application the homeowner will submit to the assessor a copy of their federal income tax return (if they file one) to substantiate their application. In addition, the applicant must provide other evidence of qualifying income to the assessor such as any 1099s sent from banks or dividends, SS-1099 from Social Security and W-2P pension payments. [CGS Sec. 12-170aa (f)]
In a circuit breaker, the amount of relief provided the taxpayer varies with their income level and their property tax liability. Table 18 presents a schedule of benefits provided by this program to qualified homeowners by income class for both married and non-married taxpayers. For example, a married homeowner whose total qualifying income is between $11,700 and $15,900 will receive a 40 percent reduction in their property tax liability up to a maximum $1,000 reduction. An unmarried homeowner with the same income level will qualify for a 30 percent reduction in their property tax liability up to a maximum $750 reduction. The amount of relief declines as income increases. A married homeowner with qualifying income of $28,900 or more, or an unmarried
27 This is generally a comprehensive measure of income, but Medicaid payments made on behalf of the homeowner or their spouse is excluded from this definition of qualifying income.

50
homeowner with qualifying income of $23,600 or more, will not qualify for property tax relief under this program.
The program also provides benefits to people that are homeowners who reside in a multiple-dwelling complex. The benefits only accrue to persons who are 65 years of age or older or who are totally disabled. The amount of the annual benefit is determined in relation to the assumed amount of the property tax liability applicable to the dwelling unit occupied by the applicant. [CGS Sec. 12-170aa (j)]
The state reimburses the local municipality for property tax revenues foregone because of this program. [CGS Sec. 12-170aa (g)] The Secretary of the Office of Management and Policy is required to submit, on or before March first, annually, a report concerning the state programs of tax relief for elderly homeowners and grants to elderly renters to the joint standing committee of the General Assembly. Such report shall be prepared in relation to qualified participants, benefits allowed and state payments to municipalities as reimbursement for property tax loss in the preceding calendar year, including data concerning (1) the total number of qualified participants in each of the state programs for elderly homeowners and the state program for elderly renters, and (2) total benefits allowed in each of such programs. [CGS Sec. 12-170bb]
The portion of local revenues foregone because of the circuit breaker that are reimbursed by the state government is a state grant that goes through the normal budget and appropriation process; the portion of local revenues foregone that is not reimbursed is a local property tax expenditure.
Table 18 Circuit Breaker Relief by Income Level for Married and
Non-Married Taxpayers
Qualifying Income Tax Reduction
As Percentage Of Property
Tax
Tax Reduction For Any Year
Over Not Exceeding
Married Homeowners
Maximum Minimum
$ 0 $ 11,700 50% $ 1,250 $ 400 11,700 15,900 40 1,000 350 15,900 19,700 30 750 250 19,700 23,600 20 500 150 23,600 28,900 10 250 150 28,900 None
51
Unmarried Homeowners
$ 0 $ 11,700 40% $ 1,000 $ 350 11,700 15,900 30 750 250 15,900 19,700 20 500 150 19,700 23,600 10 250 150 23,600 None
OUTCOMES OF PROPERTY TAX ADMINISTRATION IN CONNECTICUT
After valuing each property at market value and calculating the assessed value, which is 70 percent of the estimated market value, exemptions are applied and a net taxable value is determined for each property. The Net Grand List is what is used to calculate the tax liability for each property.28
Variations in Net Grand List Per Capita
Net Grand List per capita varies significantly across towns in Connecticut. The range is from the highest Net Grand list per capita in Greenwich, $494,018, to the lowest net Grand List per capita in Hartford, $27,873. In other words, the highest Net Grand list per capita is nearly 18 times greater than the lowest. See Table 19.
There are two important implications of such a disparity in property tax capacity across towns in Connecticut. Since the property tax is a critical source of local tax revenue, these disparities in capacity result in significant disparities in the ability of individual towns to raise revenues to fund provision of local goods and services for their citizens.
The New England Public Policy Center at the Federal Reserve Bank of Boston recently completed a study of municipal fiscal disparities in Connecticut [Zhao and Weiner]. They first measure the capacity of local governments to raise revenue to finance non-education expenditures. The approach calculates the amount of revenue each municipality would raise if all municipalities used the same standard mill rate. This standard mill rate is applied to the value of taxable real and personal property in each municipality measured by the equalized net grand list.
The second part of the process is to estimate the cost of providing a common quality and quantity of non-education public services. Their analysis identifies and assigns weights to five cost factors: the unemployment rate, population density, private-sector wage index, town maintenance road mileage and jobs per capita. 28 The net Grand List is used to calculate the property tax liability, but further property tax relief is provided if the property owner qualifies for the circuit breaker program. The circuit breaker is a reduction in the tax liability applied in the tax collector’s office and is not reflected in tax liabilities calculated from the Net Grand List.
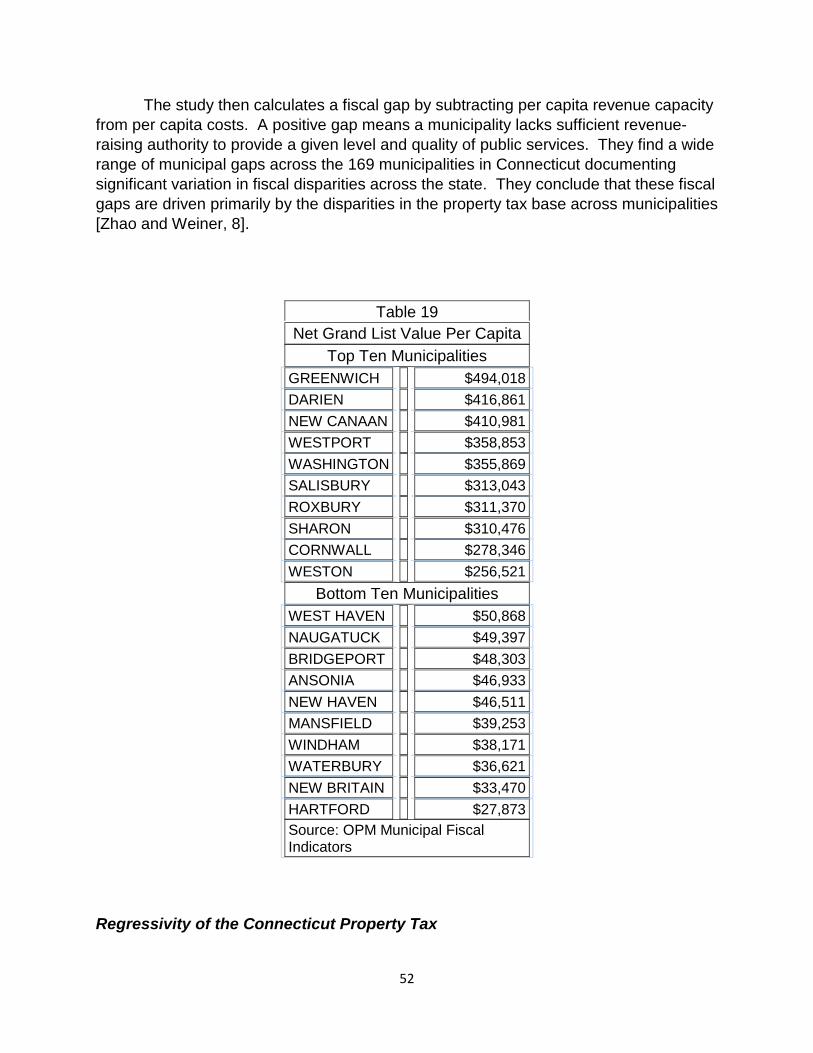
52
The study then calculates a fiscal gap by subtracting per capita revenue capacity from per capita costs. A positive gap means a municipality lacks sufficient revenue-raising authority to provide a given level and quality of public services. They find a wide range of municipal gaps across the 169 municipalities in Connecticut documenting significant variation in fiscal disparities across the state. They conclude that these fiscal gaps are driven primarily by the disparities in the property tax base across municipalities [Zhao and Weiner, 8].
Regressivity of the Connecticut Property Tax
Table 19 Net Grand List Value Per Capita
Top Ten Municipalities GREENWICH $494,018 DARIEN $416,861 NEW CANAAN $410,981 WESTPORT $358,853 WASHINGTON $355,869 SALISBURY $313,043 ROXBURY $311,370 SHARON $310,476 CORNWALL $278,346 WESTON $256,521
Bottom Ten Municipalities WEST HAVEN $50,868 NAUGATUCK $49,397 BRIDGEPORT $48,303 ANSONIA $46,933 NEW HAVEN $46,511 MANSFIELD $39,253 WINDHAM $38,171 WATERBURY $36,621 NEW BRITAIN $33,470 HARTFORD $27,873 Source: OPM Municipal Fiscal Indicators
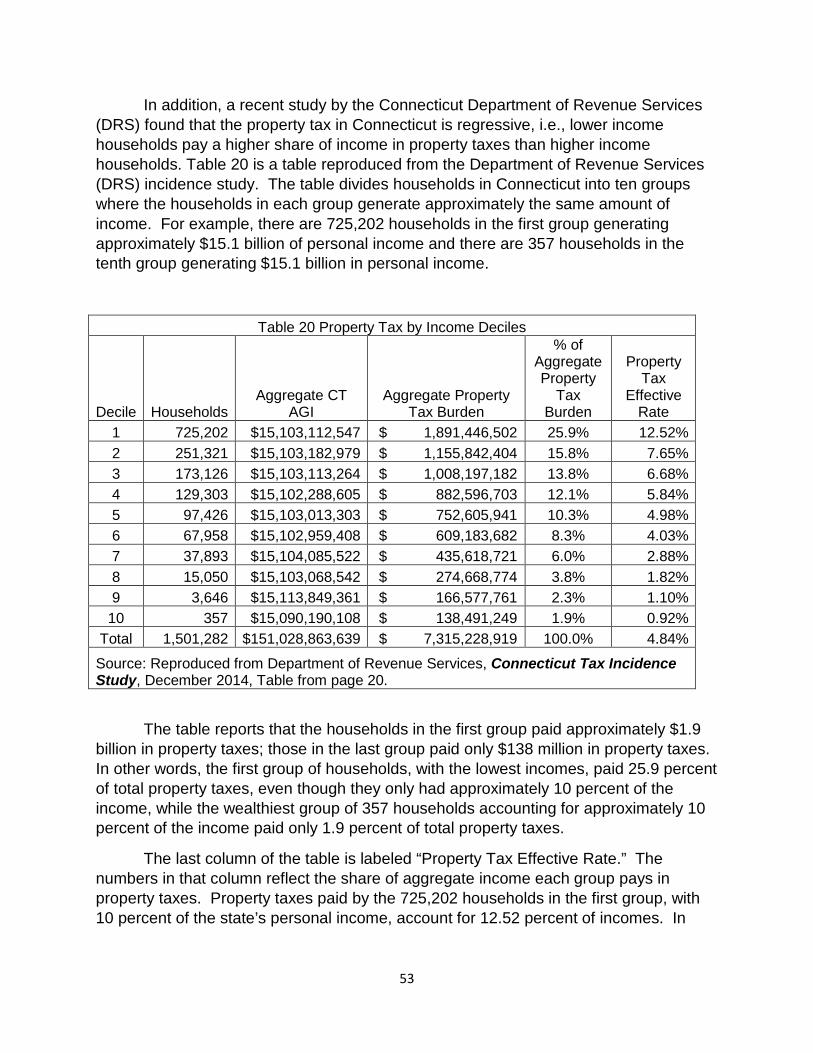
53
In addition, a recent study by the Connecticut Department of Revenue Services (DRS) found that the property tax in Connecticut is regressive, i.e., lower income households pay a higher share of income in property taxes than higher income households. Table 20 is a table reproduced from the Department of Revenue Services (DRS) incidence study. The table divides households in Connecticut into ten groups where the households in each group generate approximately the same amount of income. For example, there are 725,202 households in the first group generating approximately $15.1 billion of personal income and there are 357 households in the tenth group generating $15.1 billion in personal income.
Table 20 Property Tax by Income Deciles
Decile Households Aggregate CT
AGI Aggregate Property
Tax Burden
% of Aggregate Property
Tax Burden
Property Tax
Effective Rate
1 725,202 $15,103,112,547 $ 1,891,446,502 25.9% 12.52% 2 251,321 $15,103,182,979 $ 1,155,842,404 15.8% 7.65% 3 173,126 $15,103,113,264 $ 1,008,197,182 13.8% 6.68% 4 129,303 $15,102,288,605 $ 882,596,703 12.1% 5.84% 5 97,426 $15,103,013,303 $ 752,605,941 10.3% 4.98% 6 67,958 $15,102,959,408 $ 609,183,682 8.3% 4.03% 7 37,893 $15,104,085,522 $ 435,618,721 6.0% 2.88% 8 15,050 $15,103,068,542 $ 274,668,774 3.8% 1.82% 9 3,646 $15,113,849,361 $ 166,577,761 2.3% 1.10%
10 357 $15,090,190,108 $ 138,491,249 1.9% 0.92% Total 1,501,282 $151,028,863,639 $ 7,315,228,919 100.0% 4.84%
Source: Reproduced from Department of Revenue Services, Connecticut Tax Incidence Study, December 2014, Table from page 20.
The table reports that the households in the first group paid approximately $1.9 billion in property taxes; those in the last group paid only $138 million in property taxes. In other words, the first group of households, with the lowest incomes, paid 25.9 percent of total property taxes, even though they only had approximately 10 percent of the income, while the wealthiest group of 357 households accounting for approximately 10 percent of the income paid only 1.9 percent of total property taxes.
The last column of the table is labeled “Property Tax Effective Rate.” The numbers in that column reflect the share of aggregate income each group pays in property taxes. Property taxes paid by the 725,202 households in the first group, with 10 percent of the state’s personal income, account for 12.52 percent of incomes. In
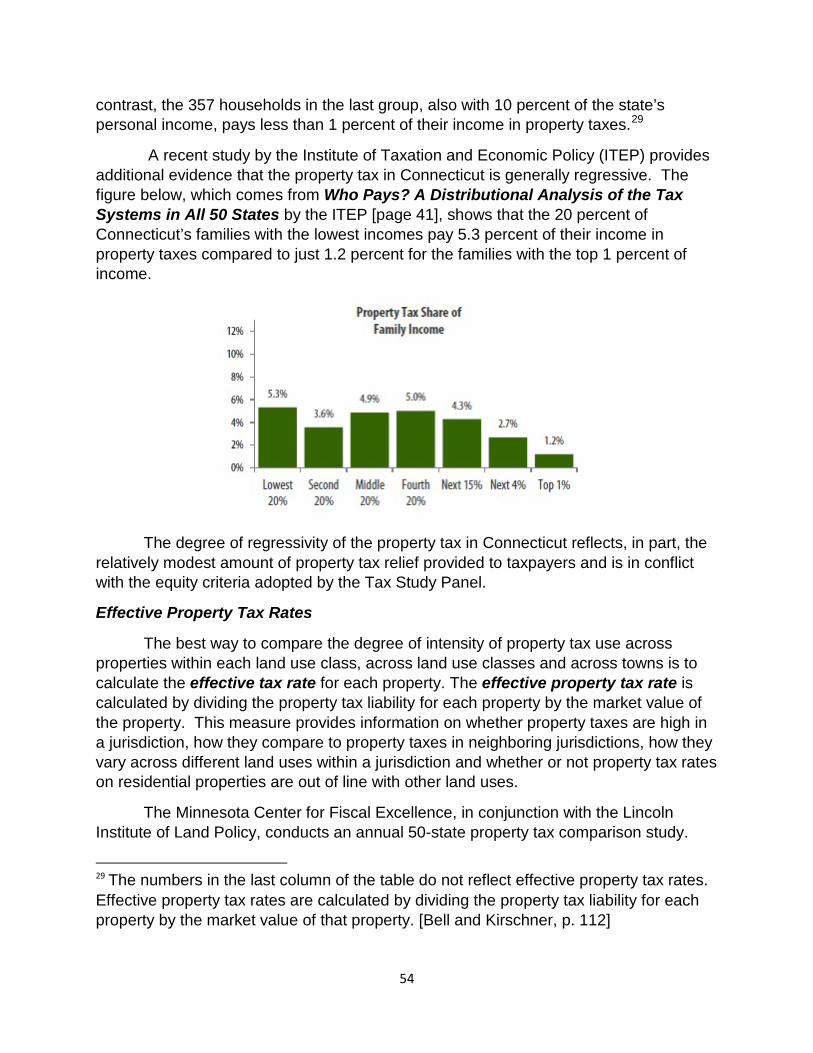
54
contrast, the 357 households in the last group, also with 10 percent of the state’s personal income, pays less than 1 percent of their income in property taxes.29
A recent study by the Institute of Taxation and Economic Policy (ITEP) provides additional evidence that the property tax in Connecticut is generally regressive. The figure below, which comes from Who Pays? A Distributional Analysis of the Tax Systems in All 50 States by the ITEP [page 41], shows that the 20 percent of Connecticut’s families with the lowest incomes pay 5.3 percent of their income in property taxes compared to just 1.2 percent for the families with the top 1 percent of income.
The degree of regressivity of the property tax in Connecticut reflects, in part, the relatively modest amount of property tax relief provided to taxpayers and is in conflict with the equity criteria adopted by the Tax Study Panel.
Effective Property Tax Rates
The best way to compare the degree of intensity of property tax use across properties within each land use class, across land use classes and across towns is to calculate the effective tax rate for each property. The effective property tax rate is calculated by dividing the property tax liability for each property by the market value of the property. This measure provides information on whether property taxes are high in a jurisdiction, how they compare to property taxes in neighboring jurisdictions, how they vary across different land uses within a jurisdiction and whether or not property tax rates on residential properties are out of line with other land uses.
The Minnesota Center for Fiscal Excellence, in conjunction with the Lincoln Institute of Land Policy, conducts an annual 50-state property tax comparison study.
29 The numbers in the last column of the table do not reflect effective property tax rates. Effective property tax rates are calculated by dividing the property tax liability for each property by the market value of that property. [Bell and Kirschner, p. 112]
55
The study compares effective property tax rates for four classes of property located in the largest city of each state: 1) residential homestead, 2) commercial property, 3) industrial property, and 4) apartments. In addition the study analyzes the effective tax rate for these use classes in a rural town in each state as well.
The study examines these four distinct classes of property using a standard set of assumptions about their “true” market value and the split between real and personal property. For example, the study calculates effective tax rates for residential homestead properties in rural areas that are valued at $70,000 and $150,000. Similarly, the study calculates effective property tax rates for commercial properties with an assumed total value of $1 million and personal property of $200,000 and commercial properties with an assumed valued at $25 million and $5 million of personal property; or an industrial property with an assumed value of $25 million, $12.5 million of machinery and equipment, $10 million in inventory and $2.5 million of fixtures.
The study reports the effective property tax rate for each type of property by first calculating the net property tax liability for each type of property in each urban municipality and each rural town. Specifically, the net local property tax for a given parcel of property is
Net Property Tax = TMV x SR x CR x TR - C
where
TMV is the true market value of a property which the study assumes for each property type
SR is the sales ratio for each type of property in each municipality or town
CR is the classification rate for each type of property in states with classification
TR is the total local tax rate for all taxing jurisdictions that “normally” levy against real and personal property (e.g. cities, counties, school districts and special districts) applied to each property to determine the tax liability
C is all general deductions/credits from the gross property tax calculations.30
Table 21 presents a summary of how Connecticut communities ranked in effective property tax rates for the various land uses examined. The urban area included in the study was Bridgeport and the rural area was Litchfield. The results indicate that effective tax rates for each of the different land uses are higher in urban areas than in rural areas relative to other states. Specifically, residential property in Bridgeport had the highest effective tax rate of any other city, but residential property in Litchfield ranked tenth and twelfth in terms of effective property tax rates relative to rural areas in other states. 30 Minnesota Center for Fiscal Excellence, pp. 46-49.
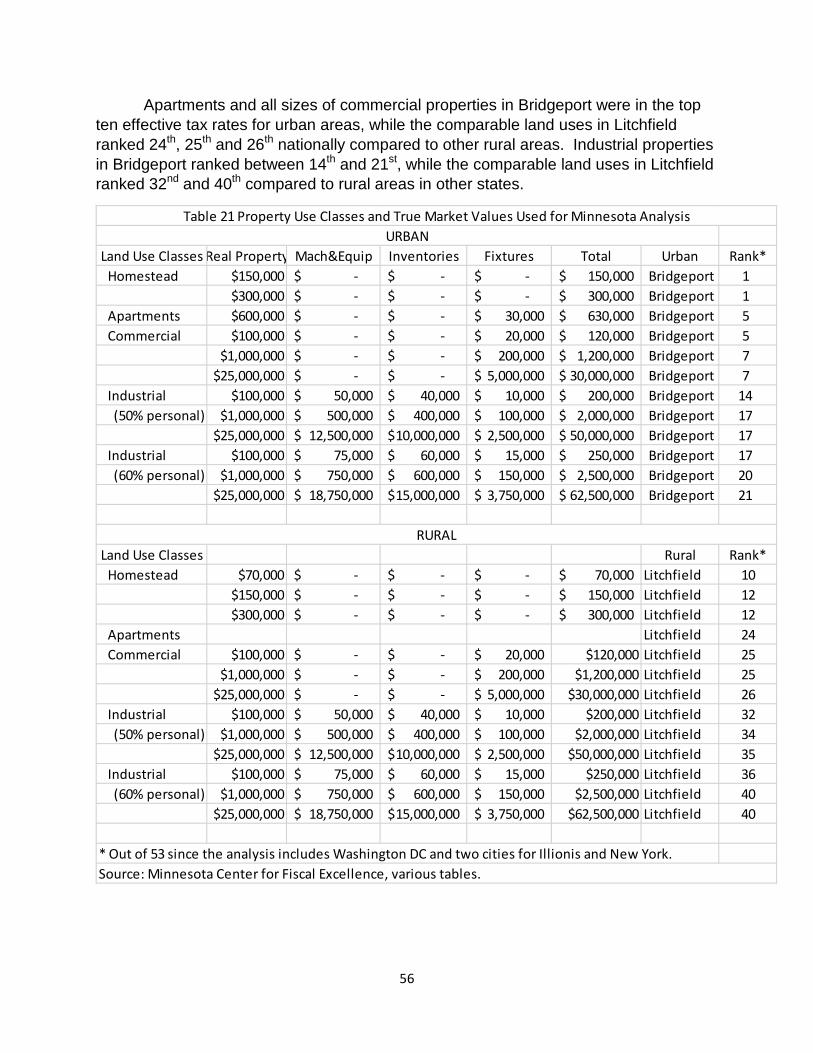
56
Apartments and all sizes of commercial properties in Bridgeport were in the top ten effective tax rates for urban areas, while the comparable land uses in Litchfield ranked 24th, 25th and 26th nationally compared to other rural areas. Industrial properties in Bridgeport ranked between 14th and 21st, while the comparable land uses in Litchfield ranked 32nd and 40th compared to rural areas in other states.
Land Use Classes Real Property Mach&Equip Inventories Fixtures Total Urban Rank* Homestead $150,000 -$ -$ -$ 150,000$ Bridgeport 1
$300,000 -$ -$ -$ 300,000$ Bridgeport 1 Apartments $600,000 -$ -$ 30,000$ 630,000$ Bridgeport 5 Commercial $100,000 -$ -$ 20,000$ 120,000$ Bridgeport 5 $1,000,000 -$ -$ 200,000$ 1,200,000$ Bridgeport 7
$25,000,000 -$ -$ 5,000,000$ 30,000,000$ Bridgeport 7 Industrial $100,000 50,000$ 40,000$ 10,000$ 200,000$ Bridgeport 14 (50% personal) $1,000,000 500,000$ 400,000$ 100,000$ 2,000,000$ Bridgeport 17
$25,000,000 12,500,000$ 10,000,000$ 2,500,000$ 50,000,000$ Bridgeport 17 Industrial $100,000 75,000$ 60,000$ 15,000$ 250,000$ Bridgeport 17 (60% personal) $1,000,000 750,000$ 600,000$ 150,000$ 2,500,000$ Bridgeport 20
$25,000,000 18,750,000$ 15,000,000$ 3,750,000$ 62,500,000$ Bridgeport 21
Land Use Classes Rural Rank* Homestead $70,000 -$ -$ -$ 70,000$ Litchfield 10
$150,000 -$ -$ -$ 150,000$ Litchfield 12$300,000 -$ -$ -$ 300,000$ Litchfield 12
Apartments Litchfield 24 Commercial $100,000 -$ -$ 20,000$ $120,000 Litchfield 25 $1,000,000 -$ -$ 200,000$ $1,200,000 Litchfield 25
$25,000,000 -$ -$ 5,000,000$ $30,000,000 Litchfield 26 Industrial $100,000 50,000$ 40,000$ 10,000$ $200,000 Litchfield 32 (50% personal) $1,000,000 500,000$ 400,000$ 100,000$ $2,000,000 Litchfield 34
$25,000,000 12,500,000$ 10,000,000$ 2,500,000$ $50,000,000 Litchfield 35 Industrial $100,000 75,000$ 60,000$ 15,000$ $250,000 Litchfield 36 (60% personal) $1,000,000 750,000$ 600,000$ 150,000$ $2,500,000 Litchfield 40
$25,000,000 18,750,000$ 15,000,000$ 3,750,000$ $62,500,000 Litchfield 40
* Out of 53 since the analysis includes Washington DC and two cities for Illionis and New York.
RURAL
Source: Minnesota Center for Fiscal Excellence, various tables.
Table 21 Property Use Classes and True Market Values Used for Minnesota AnalysisURBAN
57
Effective property tax rates vary across towns in Connecticut and, to some extent, within different land use categories for each town. Table 22 describes the composition of the 2012 Grand List of Coventry.
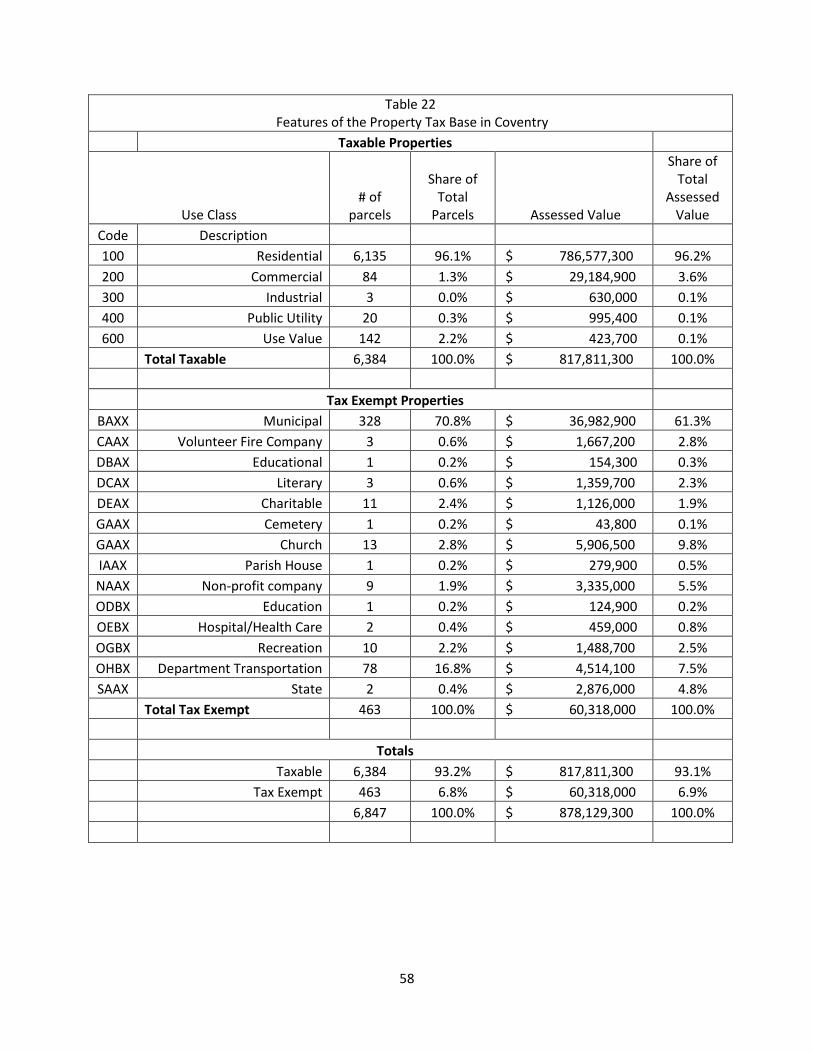
58
Table 22 Features of the Property Tax Base in Coventry
Taxable Properties
Use Class # of
parcels
Share of Total
Parcels Assessed Value
Share of Total
Assessed Value
Code Description 100 Residential 6,135 96.1% $ 786,577,300 96.2%
200 Commercial 84 1.3% $ 29,184,900 3.6% 300 Industrial 3 0.0% $ 630,000 0.1% 400 Public Utility 20 0.3% $ 995,400 0.1% 600 Use Value 142 2.2% $ 423,700 0.1%
Total Taxable 6,384 100.0% $ 817,811,300 100.0%
Tax Exempt Properties BAXX Municipal 328 70.8% $ 36,982,900 61.3%
CAAX Volunteer Fire Company 3 0.6% $ 1,667,200 2.8% DBAX Educational 1 0.2% $ 154,300 0.3% DCAX Literary 3 0.6% $ 1,359,700 2.3% DEAX Charitable 11 2.4% $ 1,126,000 1.9% GAAX Cemetery 1 0.2% $ 43,800 0.1% GAAX Church 13 2.8% $ 5,906,500 9.8% IAAX Parish House 1 0.2% $ 279,900 0.5% NAAX Non-profit company 9 1.9% $ 3,335,000 5.5% ODBX Education 1 0.2% $ 124,900 0.2% OEBX Hospital/Health Care 2 0.4% $ 459,000 0.8% OGBX Recreation 10 2.2% $ 1,488,700 2.5% OHBX Department Transportation 78 16.8% $ 4,514,100 7.5% SAAX State 2 0.4% $ 2,876,000 4.8%
Total Tax Exempt 463 100.0% $ 60,318,000 100.0%
Totals
Taxable 6,384 93.2% $ 817,811,300 93.1%
Tax Exempt 463 6.8% $ 60,318,000 6.9%
6,847 100.0% $ 878,129,300 100.0%
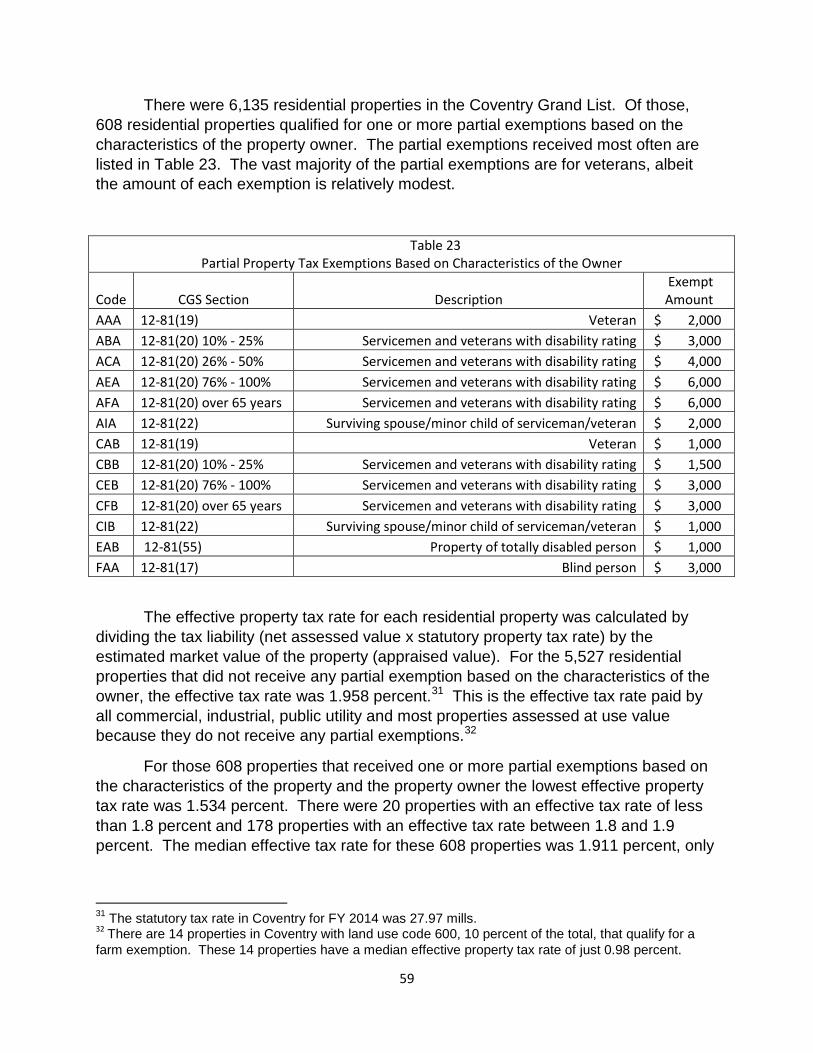
59
There were 6,135 residential properties in the Coventry Grand List. Of those, 608 residential properties qualified for one or more partial exemptions based on the characteristics of the property owner. The partial exemptions received most often are listed in Table 23. The vast majority of the partial exemptions are for veterans, albeit the amount of each exemption is relatively modest.
Table 23 Partial Property Tax Exemptions Based on Characteristics of the Owner
Code CGS Section Description Exempt Amount
AAA 12-81(19) Veteran $ 2,000 ABA 12-81(20) 10% - 25% Servicemen and veterans with disability rating $ 3,000 ACA 12-81(20) 26% - 50% Servicemen and veterans with disability rating $ 4,000 AEA 12-81(20) 76% - 100% Servicemen and veterans with disability rating $ 6,000 AFA 12-81(20) over 65 years Servicemen and veterans with disability rating $ 6,000 AIA 12-81(22) Surviving spouse/minor child of serviceman/veteran $ 2,000 CAB 12-81(19) Veteran $ 1,000 CBB 12-81(20) 10% - 25% Servicemen and veterans with disability rating $ 1,500 CEB 12-81(20) 76% - 100% Servicemen and veterans with disability rating $ 3,000 CFB 12-81(20) over 65 years Servicemen and veterans with disability rating $ 3,000 CIB 12-81(22) Surviving spouse/minor child of serviceman/veteran $ 1,000 EAB 12-81(55) Property of totally disabled person $ 1,000 FAA 12-81(17) Blind person $ 3,000
The effective property tax rate for each residential property was calculated by dividing the tax liability (net assessed value x statutory property tax rate) by the estimated market value of the property (appraised value). For the 5,527 residential properties that did not receive any partial exemption based on the characteristics of the owner, the effective tax rate was 1.958 percent.31 This is the effective tax rate paid by all commercial, industrial, public utility and most properties assessed at use value because they do not receive any partial exemptions.32
For those 608 properties that received one or more partial exemptions based on the characteristics of the property and the property owner the lowest effective property tax rate was 1.534 percent. There were 20 properties with an effective tax rate of less than 1.8 percent and 178 properties with an effective tax rate between 1.8 and 1.9 percent. The median effective tax rate for these 608 properties was 1.911 percent, only
31 The statutory tax rate in Coventry for FY 2014 was 27.97 mills. 32 There are 14 properties in Coventry with land use code 600, 10 percent of the total, that qualify for a farm exemption. These 14 properties have a median effective property tax rate of just 0.98 percent.
60
slightly lower than the effective tax rate on residential properties not qualifying for any partial exemptions.
In other words, there were over 400 residential properties that qualified for at least one partial exemption that had an effective property tax rate of 1.9 or higher. These tax relief programs provide very modest property tax relief to residential property owners. There is little variation in effective property tax rates within the residential use class and virtually no variation between the residential, commercial, industrial and public utility use classes.
Coventry’s Grand List includes 143 properties classified as PA-490, or properties valued at use value not market value. Of these properties, 14 qualify for a farm exemption which reduces their gross assessed value by 50 percent. The remaining 129 properties do not qualify for any property tax relief. The effective tax rate for those properties not qualifying for additional property tax relief have an effective property tax rate of 1.98 percent. For the 14 properties with additional property tax relief the median effective property tax rate is 0.98 percent.33
In contrast, for example, Washington DC provides an extensive mosaic of property tax relief mechanisms, especially for the elderly. As a result of these property tax relief programs, homeowners 65 years of age or older pay a median effective property tax rate of 0.23 percent. Non-elderly homeowners in the District who receive the homestead deduction pay a median effective property tax rate of approximately 0.63 percent, while non-homestead residential property and multi-family residential property pay a median effective tax rate of 0.85 percent. In other words, non-elderly homeowners pay a median effective property tax rate approximately 270 percent higher than that paid by elderly homeowners and about 75 percent of the rate paid by non-homestead residential and multi-family properties.
Table 24 presents information on the effective property tax rate for the representative cities examined here. Effective property tax rates are presented for properties that do not benefit from exemptions and those properties that do receive property tax relief through exemptions. Information is presented by type of property.
Table 24 indicates that for all properties in Bridgeport not receiving property tax relief through exemptions the effective property tax rate is 2.95 percent. For residential properties receiving relief through exemptions, the average effective property tax is reduced to 2.90 percent – very modest relief. Similarly, in Guilford, the effective property tax rate for properties not receiving relief through exemptions is 1.98 percent and for residential properties receiving relief through exemptions the average effective property tax rate is reduced to 1.91 percent; again, very modest relief.
33 All PA-490 properties are valued at use value, not market value. The additional property tax relief for the 14 properties that qualify for the farm exemption have their use value reduced by 50 percent before calculating their property tax liability.

61
Municipality
Eff. Tax Rate w/o
Relief100 200 300 400 500 600 800
Large CitiesBridgeport 2.95% 2.90% 2.14% 1.17% 2.64% 1.28%Hartford 2.28%* 1.95% 2.56% 1.72% 5.00%
Small CitiesManchester 2.76% 2.64% 2.58% 2.57% 2.54% 2.55% 2.66%Torrington 3.20% 3.01% 2.98% 2.93% 2.86% 2.95% 3.15% 1.28%
Wealthy SuburbsGlastonbury 2.53% 2.50% 2.49% 2.48% 2.33% 1.93%Guilford 1.98% 1.91% 1.97% 0.01%Litchfield 1.83% 1.79% 1.78% 1.79%New Canaan 1.12% 1.11% 1.11% 1.11% 1.11% 1.09% 1.11%
Mixed BaseHamden 3.41% 3.21% 3.07% 3.11% 3.28% 3.36% 3.37% 3.12%Middletown 2.28% 2.23% 2.23% 2.23% 2.19% 1.99%Norwich 2.86% 2.65% 2.58% 2.66% 2.72% 2.77% 2.29%Windsor 2.16% 2.10% 2.11% 2.05% 1.99% 2.05% 1.78% 1.76%
RuralBozrah 1.89% 1.83% 1.77%Durham 2.36% 2.20% 2.24% 2.34%Killingly 1.91% 1.83% 1.58% 0.91%North Cannan 1.93% 1.87% 1.91% 1.88%Plainfield 1.99% 1.94% 1.06% 1.97%Union 2.07% 2.00% 1.56%Washington 0.96% 0.94% 0.94%
*This is the effective tax rate for residential properties without exemptions. The effective property tax rate for other land uses without exemptions is 5.2 percent. Residential properties in Hartford have an assessmentratio of 30.68 precent instead of the 70 percent ratio for all other properties.
Table 24 Effective Property Tax Rates by Type of Property, Grand List 2014
Average Effective Tax Rate with Relief by Type of Property
62
Effective property tax rates are relatively high. Two municipalities have effective property tax rates for properties not receiving relief from exemptions above 3 percent; 9 have rates between 2 and 3 percent; 6 municipalities have rates just under 2 percent; and 2 municipalities have rates around 1 percent. Property tax relief from exemptions provided to residential properties result in lower average effective property tax rates, but they are only marginally below the rate for properties not receiving such relief.
CONCLUSION
In the final analysis, property taxes in Connecticut are high by most metrics. Only modest property tax relief is provided to taxpayers which contributes to the regressivity of the property tax in Connecticut. There is significant variation in property tax capacity across municipalities in the state resulting in significant fiscal gaps in the ability of individual towns to deliver goods and services to their citizens. Effective property tax rates are relatively high which exaggerates the limitations of the property tax.
63
Bibliography
Alm, James, Robert Buschman, and David L. Sjoquist (2011). “Rethinking Local Government Reliance on the Property Tax.” Regional Science and Urban Economics 41(4): 320–331.
Bahl, Roy, Jorge Martinez-Vazquez, and Joan Youngman (2010). “Whither the Property Tax: New Perspectives on a Fiscal Mainstay,” in Challenging the Conventional Wisdom on the Property Tax, edited by Roy Bahl, Jorge Martinez-Vazquez, and Joan Youngman. Cambridge: Lincoln Institute of Land Policy. 3–14.
Bell, Michael E. and John H. Bowman. 1991. “Gauging Assessment Uniformity: A Comparison of Measures,” Property Tax Journal, Volume 10, Number 4, December, pp. 345-60.
Bell, Michael E., David Brunori and Joan Youngman, 2010, The Property Tax and Local Autonomy, Lincoln Institute of Land Policy, Cambridge, MA.
Bell, Michael E. and Charlotte Kirschner, 2009. “A Reconnaissance of Alternative Measures of Effective Property Tax Rates,’ in Public Budgeting and Finance, Vol. 29, Number 2, Summer.
Brunori, David. 2013. Local Tax Policy: A Federalist Perspective, Washington DC: The Urban Institute Press, Third Edition.
Cabral, Marika and Caroline M. Hoxby. 2012. The hated Property Tax: Salience, Tax Rates, and Tax Revolts, National Bureau of Economic Research, NBER Working Paper No. w18514, November.
Connecticut Association of Assessing Officers, 2009. Handbook for Connecticut Boards of Assessment Appeals: A Guide to Property Tax Administration for Connecticut Municipal Boards of Assessment Appeals.
Connecticut Department of Revenue Services, 2014. Connecticut Tax Incidence, December.
de Tocqueville, Alexis, 2000, Democracy in America, University of Chicago Press, Chicago, Illinois.
Eckert, Joseph K. (editor), with technical editors Robert J. Gloudemans and Richard R Almy, 1990. Property Appraisal and Assessment Administration, Chicago, Illinois: International Association of Assessing Officers.
Fisher, Ronald C. (1996). State and Local Public Finance, Irwin.
Giertz, J. Fred (2006, September). The Property Tax Bound,” National Tax Journal 59(3): 695–705.
Institute on Taxation and Economic Policy. 2015. Who Pays? A Distributional Analysis of the Tax Systems in All 50 States, Washington DC.

64
Minnesota Center for Fiscal Excellence and Lincoln Institute of Land Policy. 2015. 50-State Property Tax Comparison Study, Cambridge, MA: Lincoln Institute of Land Policy, April.
National Conference of State Legislatures (NCSL). 1992. Principles of a High-Quality State Revenue System, 2d. ed. Washington DC: NCSL.
Office of Fiscal Analysis, 2014, Connecticut Tax Expenditure Report, Connecticut General Assembly, January.
Shannon, John. 1987. “State Revenue Diversification: The Search for Balance,” in Frederick D. Stocker (editor), The Quest for Balance in State-Local Revenue Structures, Lincoln Institute of Land Policy, Tax Policy Roundtable, Property Tax Papers Series #TPR-16.
U.S. Bureau of the Census, 2006, Government Finance and Employment Classification Manual, Washington DC. Witte, John F. (2009). “The Politics of the Property Tax Base.” In Erosion on the Property Tax Base: Trends, Causes and Consequences, edited by Nancy Y. Augustine, Michael E. Bell, David Brunori, and Joan M. Youngman, Cambridge, MA: Lincoln Institute of Land Policy. 307–33. Zhao, Bo and Jennifer Weiner, 2015. Measuring Municipal Fiscal Disparities in Connecticut, New England Public Policy Center, Research Report 15-1, Federal Reserve Bank of Boston, May.