overview of epa activities and research related to black
TRANSCRIPT

Overview of EPA activities and research related to black carbon
Gayle Hagler, Ph.D.U.S. EPA Office of Research and DevelopmentNational Risk Management Research Laboratory
Disclaimer: The views here represent those of the author and not necessarily of the United States Government
ADDRESSING THE CHALLENGES OF BLACK CARBON IN RUSSIA A Joint U.S. National Academies – Russian Academy of Sciences WorkshopApril 1-10, 2015

Purpose
2
The purpose of this international presentation is to give an overview of EPA activities related to black carbon (BC). This overview includes some summary information on how EPA defines BC, current knowledge on United States emissions and forecasted emission reductions, and ongoing research regarding measurement methodology, emissions characterization, and near-source research.

Outline
3
• US EPA interest in black carbon emissions and impacts
• Black carbon emissions in the United States – past and future
• Ongoing EPA research related to black carbon
• Measurement methods• Emissions characterization• Near-source air quality impacts
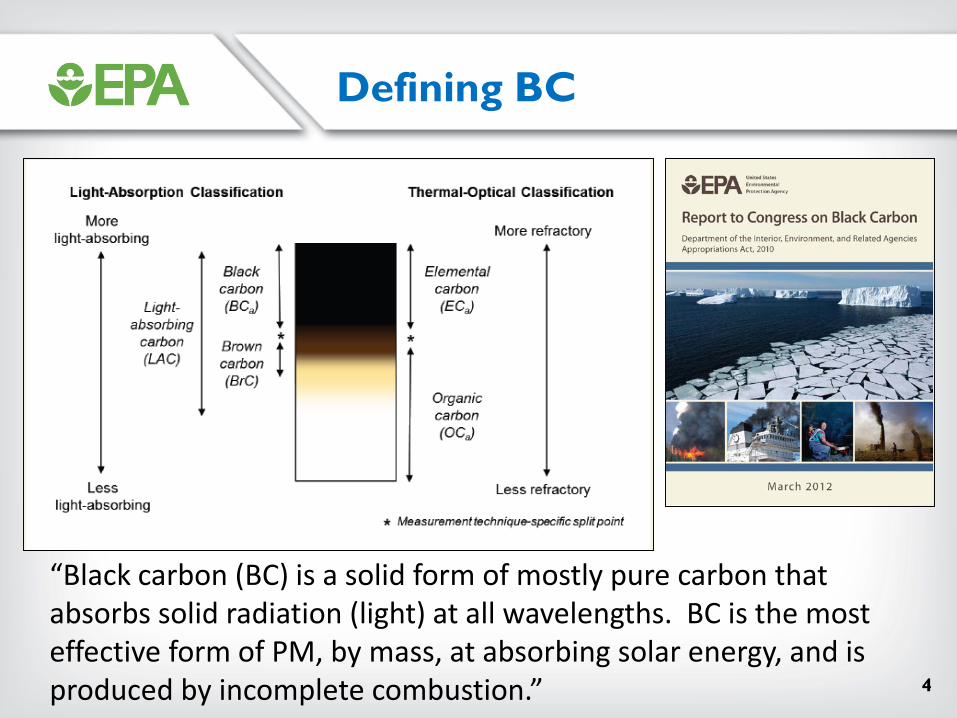
Defining BC
4
“Black carbon (BC) is a solid form of mostly pure carbon that absorbs solid radiation (light) at all wavelengths. BC is the most effective form of PM, by mass, at absorbing solar energy, and is produced by incomplete combustion.”

Interest in BC
5
• Health effects:• BC is an important component of PM2.5• Indicator of localized air pollution
impacts: elevated levels have been observed in close proximity to transportation sources
• Climate impacts• Direct effect through absorption of solar
radiation in the air, or deposited to snow/ice
• Indirect effect on cloud properties• Mitigation of BC as complementary and
providing increased effectiveness, than reduction in CO2 emissions alone, due to its short atmospheric residence time.

Climate and BC
6
Source: Bond et al. (2013)

United States Emissions
• In the US, there is estimated, in 2005, to be about 0.64 tons of BC emitted by all sources.
• Globally, about 8.4 million tons of BC is emitted.• Distribution of sources in US is different than globally for BC.• In the US, BC emissions, generally, are derived from PM2.5 emission
inventories, via use of speciation factors.

United States Emissions
• Organic carbon (OC) always co-emitted with BC, must be considered in any control and/or mitigation scenarios.
• Most of OC comes from open burning, and is considered to be reflective (cooling).
• How much of OC is light-absorbing (warming brown carbon, BrC)?

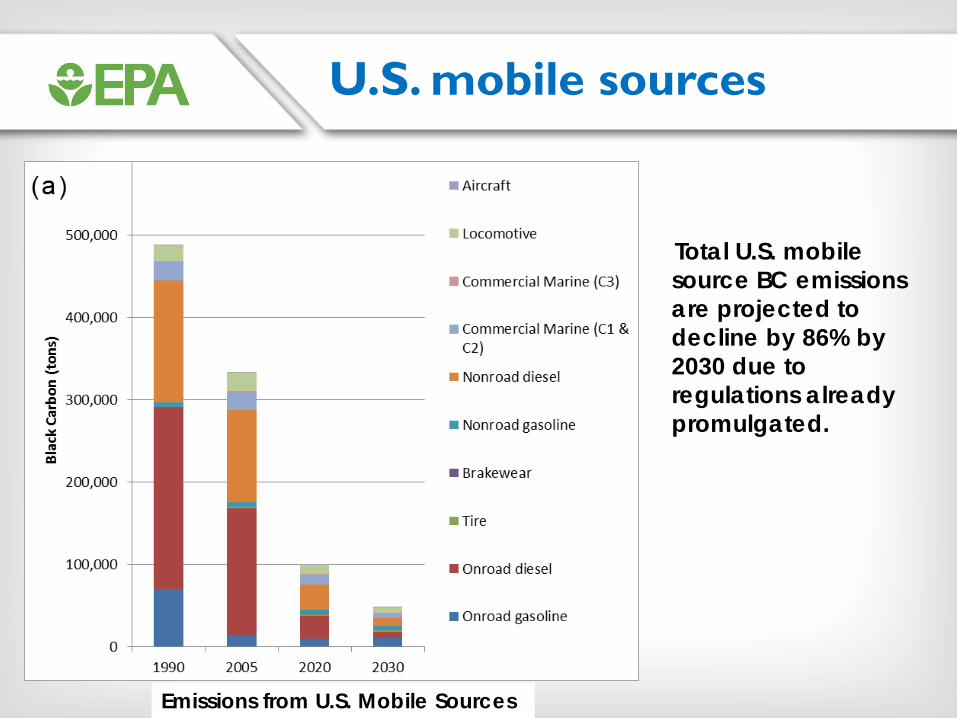
U.S. mobile sources
• U.S. mobile source BC comes mainly from diesels
• Gasoline exhaust is a smaller source of BC
U.S. Black Carbon Emissions from all Mobile Source Categories, 2005(total 333,400 tons)

U.S. mobile sources
BC emissions from U.S. mobile sources controlled by:
• Emissions standards for new engines• Requirements for diesel particulate filters (DPFs) in conjunction with ultra
low sulfur diesel (ULSD) fuel• Gasoline vehicle volatile organic compounds (VOCs, and other gaseous
pollutants) standards also reduce PM emissions• Standards for PM are “technology forcing.”• Reductions estimated from emissions models used in regulations
• On road BC, OC, PM inventory from MOVES (Motor Vehicle Emission Simulator) model
• Nonroad BC inventory from NONROAD model• Locomotive, marine, and aircraft emissions estimated by separate
models• Retrofit programs for in-use mobile diesel engines, such as EPA’s National Clean
Diesel Campaign and the SmartWay Transport Partnership Program

U.S. mobile sources
• On-road diesel PM standards – 2007 model year• 99% reduction in diesel PM for 2012 diesel trucks compared
to 1970 pre-control diesel trucks• On-road diesel PM and BC reduced by 91% and 95%
respectively from 2005-2030• Diesel particulate filters preferentially reduce BC• Earlier diesel PM standards also reduced BC• Fleet turnover needed to achieve full PM/BC reductions
• Standards for non-road diesels started in 2012• Standards for locomotives and commercial marine (categories 1
and 2 but not ocean going)
U.S. mobile sources
Total U.S. mobile source BC emissions are projected to decline by 86% by 2030 due to regulations already promulgated.
Emissions from U.S. Mobile Sources

EPA Research: Methods
13
Ambient comparisons of elemental carbon (EC) and BC often show fairly good agreement, although there are some exceptions.
70% of Studies
Source: EPA Report to Congress on Black Carbon

EPA Research: Methods
14
• Elemental carbon is commonly measured in US ambient networks and emission factors, using operationally defined thermal/optical transmittance (TOT) or thermal/optical reflectance (TOR) methods
Time (seconds)
0 150 300 450 600
FID
sig
nal
0
200
400
600
800
1000
Tem
pera
ture
(oC
)
0
250
500
750
1000
Lase
r sig
nal
0
500
1000
1500
2000He/O2He
λ= 632.8 nm
Organic carbon Elemental carbon
Flame ionization dector(FID)
EPA Research: Methods
15
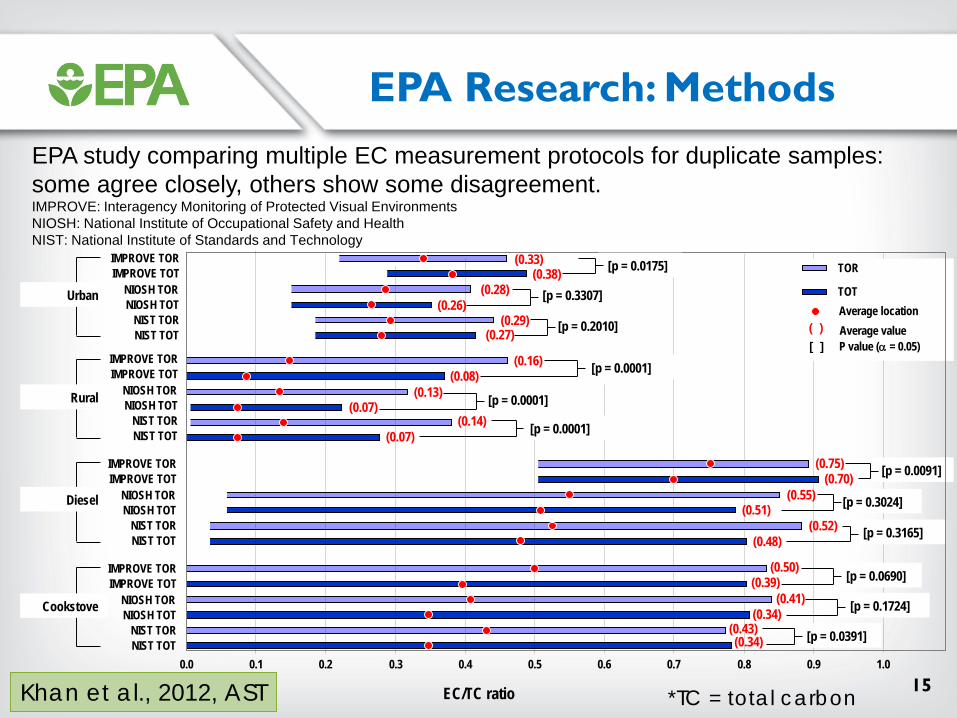
EPA study comparing multiple EC measurement protocols for duplicate samples: some agree closely, others show some disagreement.IMPROVE: Interagency Monitoring of Protected Visual EnvironmentsNIOSH: National Institute of Occupational Safety and HealthNIST: National Institute of Standards and Technology
[p = 0.0690]
[p = 0.1724]
[p = 0.0391]
[p = 0.0091]
[p = 0.3024]
[p = 0.3165]
0.0 0.1 0.2 0.3 0.4 0.5 0.6 0.7 0.8 0.9 1.0
NIST TOTNIST TOR
NIOSH TOTNIOSH TOR
IMPROVE TOTIMPROVE TOR
Cookstove
Diesel
Rural
Urban
EC/TC ratio
NIST TOTNIST TOR
NIOSH TOTNIOSH TOR
IMPROVE TOTIMPROVE TOR
NIST TOTNIST TOR
NIOSH TOTNIOSH TOR
IMPROVE TOTIMPROVE TOR
NIST TOTNIST TOR
NIOSH TOTNIOSH TOR
IMPROVE TOTIMPROVE TOR
TOR
TOTAverage location
(0.34)(0.43)
(0.34)(0.41)
(0.39)(0.50)
(0.48)
(0.51)
(0.07)
(0.07)(0.13)
(0.16)
(0.27)(0.29)
(0.26)(0.28)
(0.38)(0.33)
Average value( )P value (α = 0.05)
[p = 0.0175]
[ ]
[p = 0.3307]
[p = 0.2010]
[p = 0.0001]
[p = 0.0001]
[p = 0.0001]
(0.52)
(0.55)(0.70)
(0.75)
(0.14)
(0.08)
Khan et al., 2012, AST *TC = total carbon

EPA Research: Methods
16
Comparison of multiple BC instruments against thermal-optical EC for different source emissions
Holder et al., in preparation

EPA Research: Methods
17
Keen interest in high-time resolution measurements for dynamic monitoring environments
Dynamic emissions Isolating clustered sources Mobile monitoring
- Optical measurements (filter-based, photoacoustic, laser-induced incandescence) currently provide highest time resolution

EPA Research: Methods
18
Optimized noise-reduction algorithm (ONA) developed to maximize time resolution in filter-based continuous measurement (aethelometry)
18:00 00:00 06:00 12:00-2000
0
2000
4000
6000
8000
10000
12000
14000
aver
age
BC c
once
ntra
tion
(ng
m-3)
AE51 – 60 s data29% negative
Indoor air
09:00 12:00 15:00-1
-0.5
0
0.5
1
1.5
2x 10
5
time
aver
age
BC
con
cent
ratio
n (n
g m
-3)
AE51 - 1 s data32% negative
Cookstove emissions
07:00 07:30 08:00 08:30 09:00-5
0
5
10x 10
4
time
aver
age
BC
con
cent
ratio
n (n
g m
-3)
On-road sampling AE42 – 1 s data13.3% negative
Hagler et al., 2012, AAQR

EPA Research: Methods
19
Optimized noise-reduction algorithm (ONA) developed to maximize time resolution in filter-based continuous measurement (aethelometry)
Hagler et al., 2012, AAQR
18:00 00:00 06:00 12:00
0
5000
10000
15000
20000
time
aver
age
BC
con
cent
ratio
n (n
g m
-3)
originalAETH-ATNavg
18:00 00:00 06:00 12:000
20
40
60
80
100
120
140
time
# pt
s av
erag
ed
Reduction of negative values from 29% to ~0%, while retaining peak
Variable averaging window set by the incremental light attenuation output by aethelometers

EPA Research: Emission Studies
20
Ongoing field and laboratory research characterizing emissions, and updating emission factors in inventory, including:- Prescribed burns and wildfires (Brian Gullett, Amara Holder)- Aircraft emissions (John Kinsey)- Vehicle emissions – light and heavy-duty dynamometer (Rich Baldauf,
Tom Long)- Stationary source emissions (Tiffany Yelverton, Amara Holder)- Cookstoves (Jim Jetter, Amara Holder)
Diesel genset Open burning test facility
Pilot scale coal power pant
EPA Research: Emission Studies
21
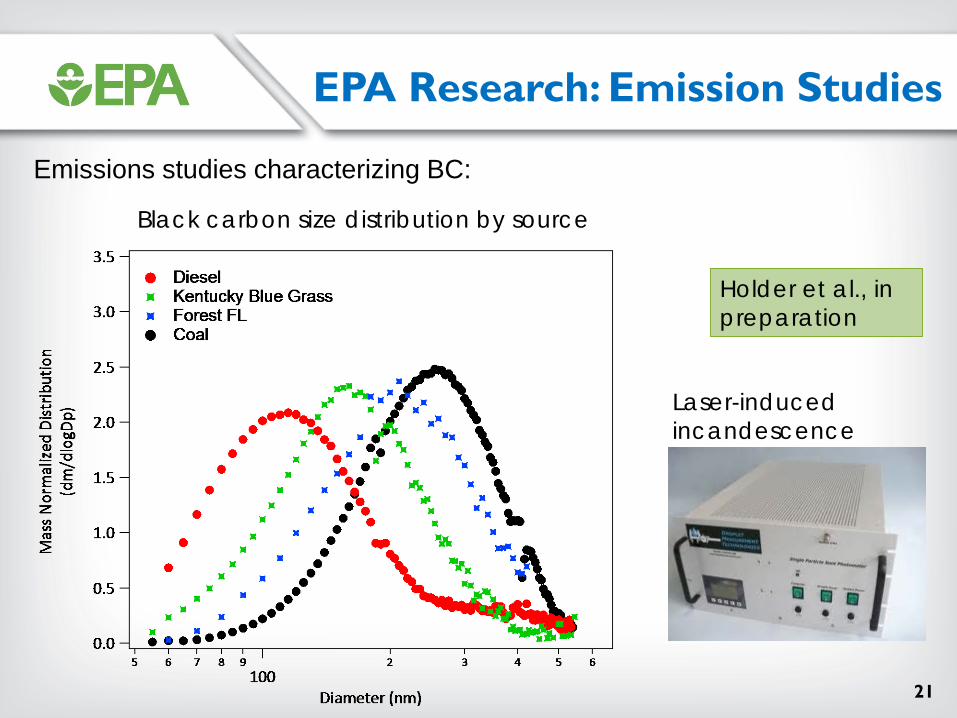
Emissions studies characterizing BC:
Black carbon size distribution by source
Holder et al., in preparation
Laser-induced incandescence
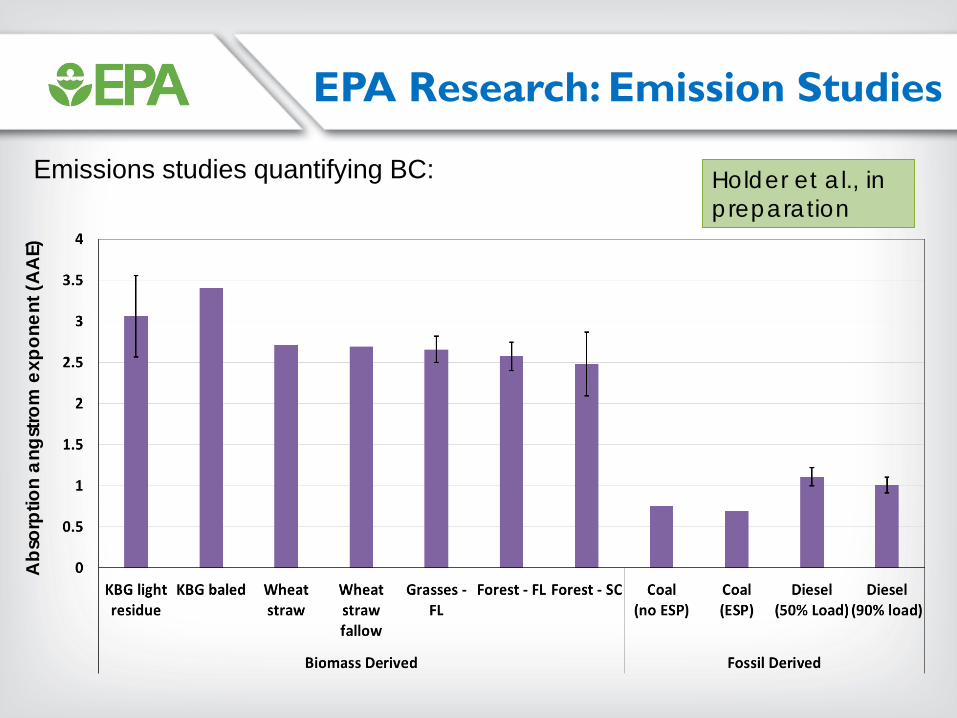
EPA Research: Emission Studies
Emissions studies quantifying BC: Holder et al., in preparation
Abs
orpt
ion
angs
trom
exp
onen
t (A
AE)

EPA Research: Emission StudiesProject lead: Brian Gullett
300
350
400
450
500
550
600
0.0
0.5
1.0
1.5
2.0
2.5
16:53 17:33 18:13 18:53 19:33
CO2
(ppm
)
PM2.
5an
d BC
(mg/
m3 )
PM2.5
Black Carbon
CO2
In situ sampling with AeroStat: integrated and real-time measurements
Image: aethlabs.com
EPA Research: Near-Source
24
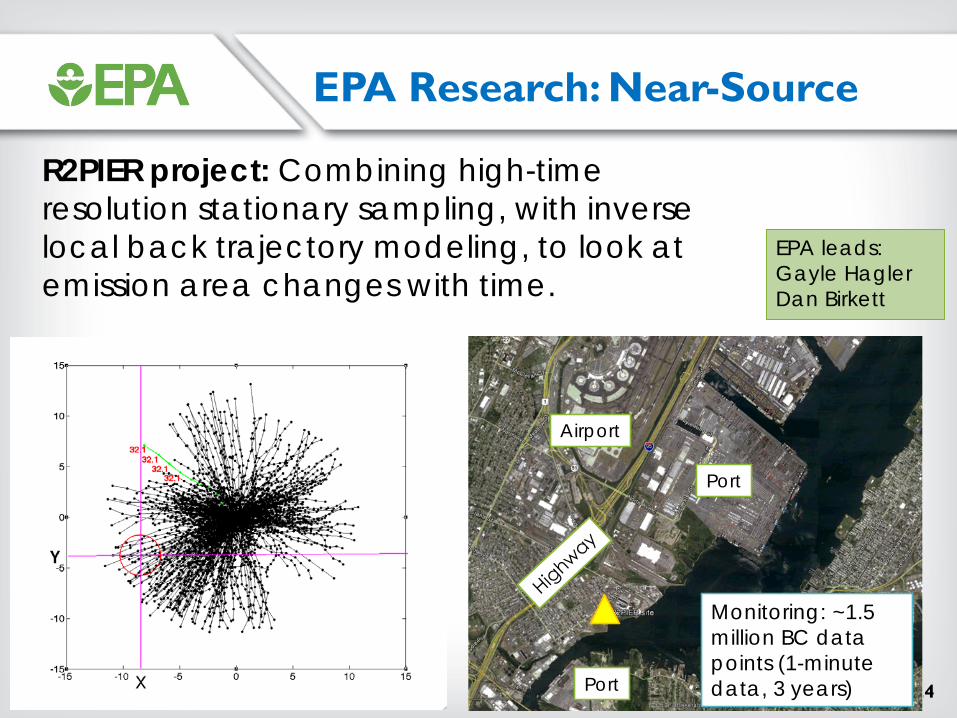
R2PIER project: Combining high-time resolution stationary sampling, with inverse local back trajectory modeling, to look at emission area changes with time.
Monitoring: ~1.5 million BC data points (1-minute data, 3 years)
Port
Airport
Port
EPA leads: Gayle HaglerDan Birkett

EPA Research: Near-Source
25
R2PIER study: example results for one month of the study
Monitoring: ~1.5 million BC data points (1-minute data, 3 years)
Port
Airport
Port
EPA leads: Gayle Hagler, Dan Birkett

EPA Research: Near-Source
26
Ongoing research on BC and co-emitted pollutant concentrations near highways, rail yards, ports; mitigation strategies
Example: Cicero Rail Yard Study (EPA Region 5 study)EPA ORD lead: Gayle Hagler

EPA Research: Near-Source
27
Ongoing research on BC and co-emitted pollutant concentrations near highways, rail yards, ports; mitigation strategies
Example: Cicero Rail Yard Study (EPA Region 5 study)Source: Cicero Rail Yard Study Final Report, 2014 (EPA/600/R/12/621)
*UFPs = ultrafine particles (<100 nm)

EPA Research: Near-Source
28
Ongoing research on BC and co-emitted pollutant concentrations near highways, rail yards, ports; mitigation strategies
Example: Las Vegas Near-Road Study Source: Kimbrough et al., in preparation
0.00
0.20
0.40
0.60
0.80
1.00
-100 0 100 200 300
Norm
aliz
ed c
once
ntra
tion
Distance (m)
Winds from westBC
PM2.5
Freeway (relative to sites)
~40% difference in BC
~20% difference in PM2.5
0.0
0.2
0.4
0.6
0.8
1.0
0 500 1000 1500
Heavy-duty traffic volume
20 m roadside site
Downwind conditions

EPA Research: Grantees
29
EPA’s extramural grant program: Website: https://www.epa.gov/research-grants/air-research-grants
New: Particulate Matter and Related Pollutants in a Changing WorldSeven of 13 future grants to investigate some aspect of wildfire impact on pollution and human health, e.g.:
• How climate and land use might change wildfire activity in the future• Assessment of future land use policies• How to appropriately model black and brown carbon from fires at
different scales
Clean Air Research Centers
2012: Measurements and Modeling for Quantifying Air Quality and Climate Impacts of Residential Biomass or Coal Combustion for Cooking, Heating and Lighting
2010: Black carbon’s role in global to local-scale climate and air quality
Summary
30
• U.S. BC emissions have been declining, and additional reductions are expected by 2030 due to controls on mobile diesel engines.
• Ongoing partnership by EPA in international collaborations focused on black carbon emissions.
• Controlling direct PM2.5 emissions from sources can be a highly effective air quality management strategy, with major public health benefits.
• Black carbon continues to be an important research focus for EPA’s Office of Research and Development• Measurement methodology• Characterization of aerosol optical and chemical
properties of emission sources.• Useful as an indicator of source emissions impact on local
air quality

Thank you!
31
• Many EPA colleagues noted on the slides – please feel free to directly reach out to them, or contact me and I am happy to help make connections for you.
Gayle HaglerEPA Office of Research and Development