overview alameda county housing needs - …€¦ · peak in 2009, and have steadily ... berkeley...
TRANSCRIPT

OVERVIEW
ALAMEDA COUNTY
HOUSING NEEDS
Transportation & Planning Committee 1-21-16
1

Outline 2
Housing Crisis/Needs
Problems
Habitability
Access
Affordability – Focus today
Contributing Factors
Responses
Next Steps

Affordable Housing Crisis
From 2010 to 2014, the Bay Area grew by 350,000
people.
Alameda County grew by 100,000 during
this period and is the fastest growing
County in the State.
3

Affordable Housing Crisis 4
New housing
units grew by only
40,000 between
2010-2014
Equivalent of 1
new unit for every
8.5 people
(Bay Area-wide)

Demand Outpacing Production 5

Demand Outpacing Production 6

Demand Outpacing Production 7

Affordable Housing Crisis 8
Vacancy rates during the recession hit a peak in 2009, and have steadily decreased since then.
As vacancy decreased, average rents increase from $1,200 to $2,200 per month.
Cassidy Turley Real Estate

Affordable Housing Crisis 9
Cassidy Turley Real Estate
Comparison of Market to FMR Studio 1 BR 2 BR 3 BR
2nd Quarter DTZ Report 1,704 1,974 2,121 2,933
2015 Fair Market Rents 1,039 1,260 1,585 2,213
Difference (665) (714) (536) (720)

Affordable Housing Crisis 10
There is a 58,680 unit shortfall for homes
affordable to very low- and extremely low-income
households in Alameda County alone.
- California Housing Partnership Study, 2014
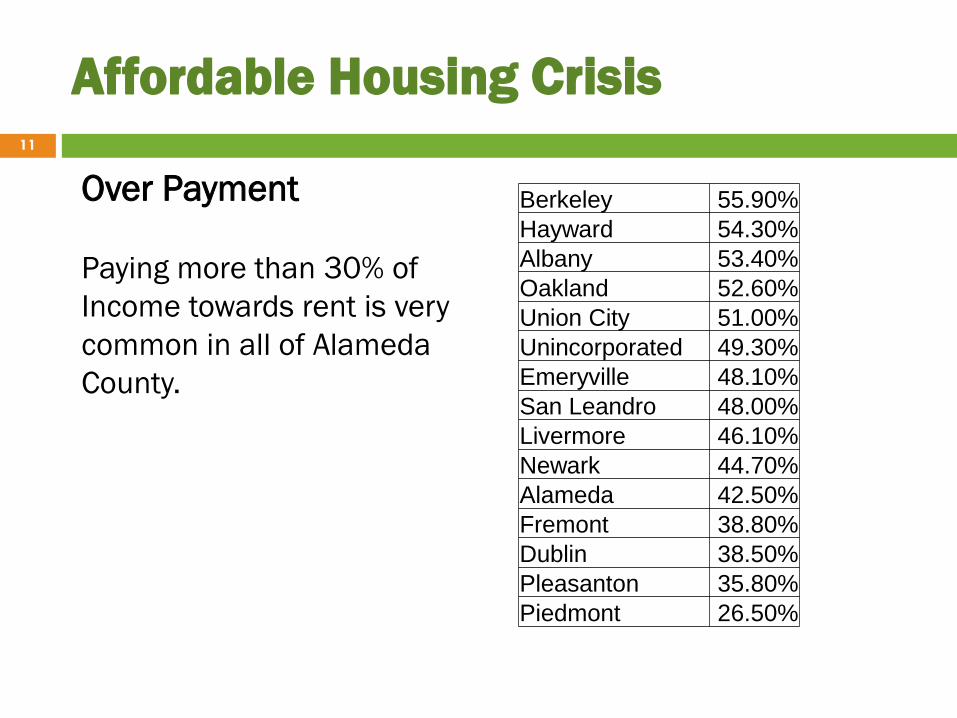
Berkeley 55.90%
Hayward 54.30%
Albany 53.40%
Oakland 52.60%
Union City 51.00%
Unincorporated 49.30%
Emeryville 48.10%
San Leandro 48.00%
Livermore 46.10%
Newark 44.70%
Alameda 42.50%
Fremont 38.80%
Dublin 38.50%
Pleasanton 35.80%
Piedmont 26.50%
Over Payment
Paying more than 30% of
Income towards rent is very
common in all of Alameda
County.
Affordable Housing Crisis 11

12
Affordable Housing Crisis
Housing Wage Gap:
Median Rent increased 11% while
Median Income Decreased 9% from 2005 - 2012

13
The Housing Wage
According to the National Low Income Housing Coalitions 2014 Out of Reach Report, the amount of income needed to afford a two bedroom Fair Market Rent, is $63,120 annually.
13

Sales Prices Higher Now Than Pre-
Recession 14
In most cases, home prices have recovered from pre-recession highs, and in four cities, prices have increased by more than 40%.
Only three cities had not yet surpassed 2006 highs by August 2015.
Median Sales PriceMarket High
2006
YTD 2015
(Jan - Aug)
%
Change
Alameda County-Wide 600$ $ 711 19%
Alameda 654$ $ 862 32%
Albany 575$ $ 868 51%
Berkeley 707$ $ 1,000 41%
Castro Valley 655$ $ 667 2%
Dublin 635$ $ 898 41%
Emeryville 426$ $ 445 4%
Fremont 645$ $ 902 40%
Hayward 565$ $ 702 24%
Livermore 615$ $ 689 12%
Newark 620$ $ 702 13%
Oakland 515$ $ 677 31%
Piedmont 1,362$ $ 1,750 28%
Pleasanton 770$ $ 957 24%
San Leandro 560$ $ 531 -5%
San Lorenzo 554$ $ 481 -13%
Sunol 835$ $ 825 -1%
Union City 635$ $ 720 13%
Source: Bay East Realtors Association, MLS Data
All
numbers
are in
Thousands

Exceptional Year Over Year Increases in
Median Sales Prices 15
County-wide
median sales
prices were
up 23% as of
August 2015.
Every city
had double
digit growth.
Median Sales Price 2014 YTD 2015
(Jan - Aug)% Change
Alameda County-wide 580$ $ 711 23%
Alameda 690$ $ 862 25%
Albany 656$ $ 868 32%
Berkeley 813$ $ 1,000 23%
Castro Valley 605$ $ 667 10%
Dublin 700$ $ 898 28%
Emeryville 390$ $ 445 14%
Fremont 720$ $ 902 25%
Hayward 425$ $ 702 65%
Livermore 494$ $ 689 39%
Newark 552$ $ 702 27%
Oakland 465$ $ 677 46%
Piedmont * 1,750$ N/A 0%
Pleasanton 835$ $ 957 15%
San Leandro 446$ $ 531 19%
San Lorenzo 435$ $ 481 11%
Sunol * 825$ N/A 0%
Union City 565$ $ 720 27%
* No 2015 Data
Source: Multiple Listing Service
All
numbers
are in
Thousands

Projected Additional Need for
Affordable Housing: RHNA 2014-21
16
Alameda County
Very
Low 0-
50%
Low 51-
80%
Moderate
81-120%
Above
Moderate
120%+
Total
Alameda 444 248 283 748 1,723
Albany 80 53 57 145 335
Berkeley 532 442 584 1,401 2,959
Dublin 796 446 425 618 2,285
Emeryville 276 211 259 752 1,498
Fremont 1,714 926 978 1,837 5,455
Hayward 851 480 608 1,981 3,920
Livermore 839 474 496 920 2,729
Newark 330 167 158 423 1,078
Oakland 2,059 2,075 2,815 7,816 14,765
Piedmont 24 14 15 7 60
Pleasanton 716 391 407 553 2,067
San Leandro 504 270 352 1,161 2,287
Union City 317 180 192 417 1,106
Alameda Couty Unincorporated 430 227 295 817 1,769
Total 9,912 6,604 7,924 19,596 44,036
Alameda County
Source: Association of Bay Area Governments (ABAG) 2013

2014-2021
Total
Very Low
(50% )
Low
(80%)
Alameda 1,723 444 248
Albany 335 80 53
Berkeley 2,959 532 442
Dublin 2,285 796 446
Emeryville 1,498 276 211
Fremont 5,455 1,714 926
Hayward 3,920 851 480
Livermore 2,729 839 474
Newark 1,078 330 167
Oakland 14,765 2059 2075
Piedmont 60 24 14
Pleasanton 2,067 716 391
San Leandro 2,287 504 270
Union City 1,106 317 180
Unincorporated 1,769 430 227
Alameda County-Wide 44,036 9,912 6,604 Source: Association of Bay Area Governments (ABAG) 2013
Regional Housing
Needs Allocations in
Alameda County for
Housing Element
Planning Period
2014 – 2021
Projected Additional Need for
Affordable Housing: RHNA 2014-21 17

10 Fastest Growing Professions 2010-2020 – Oakland/Fremont MSA
18
Change
2010 to 2020 2012 First Quarter Wages [1]
Occupational Title Percent
Growth
Median
Hourly
Wage
Median
Annual
Income
Income Category
Software Developers, Systems 27.9 $52.03 $108,211 Above Moderate
Software Developers, Apps 33.1 $49.15 $102,242 Above Moderate
Computer Systems Analysts 21 $45.43 $94,495 Moderate
Management Analysts 24.3 $45.18 $93,965 Moderate
Supervisors of Food Workers 21.2 $13.89 $28,900 Very Low
Cooks, Restaurant 22.5 $12.16 $25,286 Extremely Low
Food Preparation, Including Fast Food 21.9 $9.39 $19,535 Extremely Low
Dishwashers 22.5 $9.29 $19,315 Extremely Low
Cooks, Fast Food 22.8 $9.10 $18,934 Extremely Low
Waiters and Waitresses 22.7 $9.03 $18,786 Extremely Low
18

Reductions in Financing for Affordable
Housing
19
Local, state and federal disinvestment in affordable
housing has exacerbated the housing market’s failure
to provide for low income families.
Loss of Redevelopment: $56 million county-wide annually
Reduced HOME & CDBG funds: $9 million county-wide
Depleted statewide bonds
New potential state funding opportunities depend on
local investment.

89% DECREASE in State and Federal funding for
affordable homes in Alameda County 2008 -2013
Reductions in Financing for Affordable
Housing 20

The cumulative loss of all sources, including the RDA Housing Set Aside Funds, equals approximately 400 new affordable housing units per year serving approximately 1,000 low income people per year
Reductions in Financing for Affordable
Housing
Long term loss:
•Each unit is affordable for 55+ years – resulting in a cumulative annual loss, growing exponentially
•Cumulative loss over 5 years = 2,000 housing units serving 5,000+ people
•Cumulative loss over 10 years = 4,000 housing units serving 10,000 people
21

Rental Subsidy Levels not Keeping
Pace with Rents 22
The Alameda County Housing Authority opened
its Section 8 wait list for one week in August
2015 and received over 42,000 applications.
The Alameda City Housing Authority opened its
list in January 2015 and received over 30,000
applications.
Percentage of units leased decreasing.
HUD 2016 Fair Market Rents limits lower than
2015.

Impacts of Insufficient Affordable
Housing 23
Housing is increasingly unaffordable, especially for
very low and extremely low income people. Impacts:
Displacement of long term residents
Traffic and congestion impacts from commuters
moved to suburbs
Too much income spent on housing costs
Impact on ability to attract and retain employees
Homelessness
Undermines safety net

Impacts: Homelessness 24
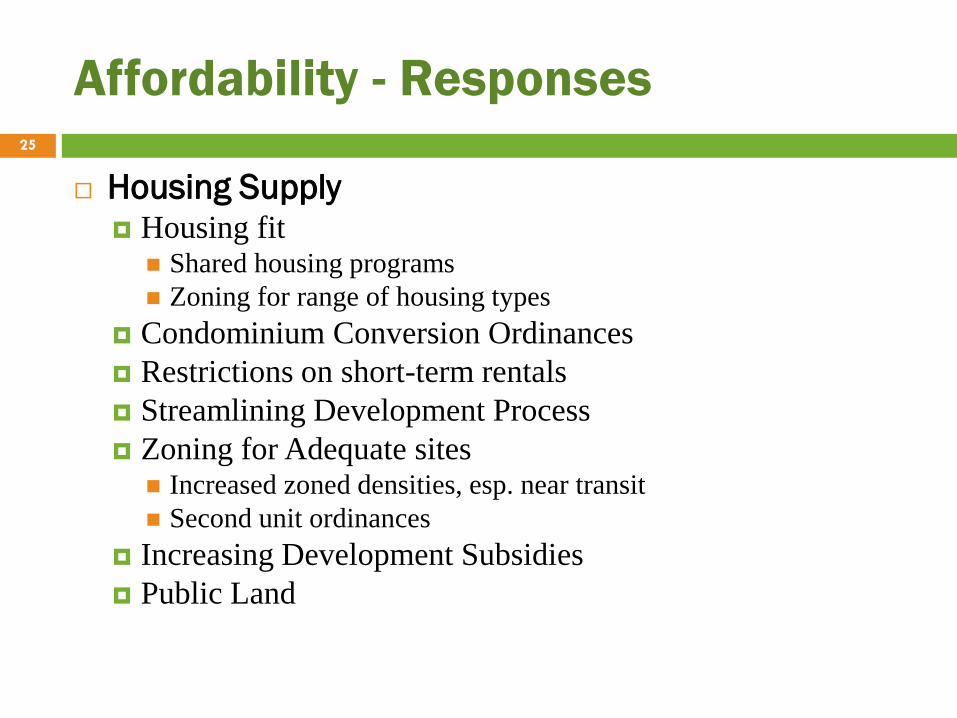
Affordability - Responses 25
Housing Supply Housing fit
Shared housing programs
Zoning for range of housing types
Condominium Conversion Ordinances
Restrictions on short-term rentals
Streamlining Development Process
Zoning for Adequate sites Increased zoned densities, esp. near transit
Second unit ordinances
Increasing Development Subsidies
Public Land

Affordability: Responses 26
Current County Responses:
Housing Supply
Unincorporated:
Second Unit Ordinance
Unincorporated sites to meet RHNA
Condo conversion ordinance
Priority Development Areas/TOD
Development Subsidies
Public Land:
Former RDA
Surplus Property Authority
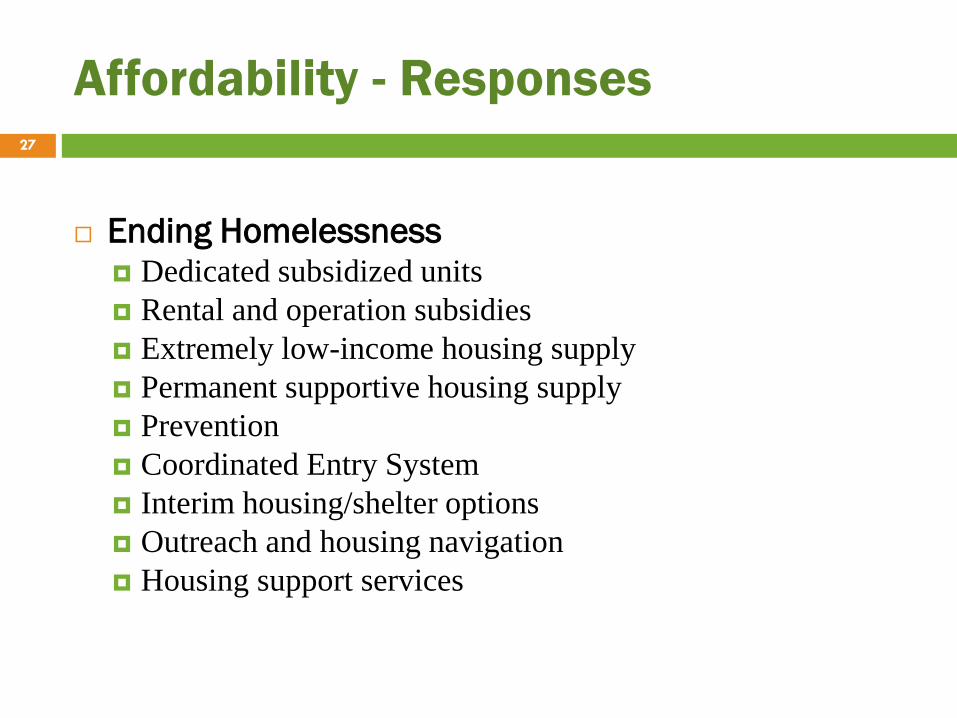
Affordability - Responses 27
Ending Homelessness Dedicated subsidized units
Rental and operation subsidies
Extremely low-income housing supply
Permanent supportive housing supply
Prevention
Coordinated Entry System
Interim housing/shelter options
Outreach and housing navigation
Housing support services

Affordability: Responses 28
Current County Responses:
Ending Homelessness
Targeted Subsidized Units
Rental Subsidy Programs
Permanent – Shelter Plus Care
Transitional – Rapid Rehousing
Outreach and housing navigation
Interim housing/shelter provision
Advocacy for funding
Coordinated Entry System underway

29

Affordability - Responses 30
Tenant Protections
Rent Stabilization/Control
Rental Housing
Mobile Home Parks
Rent Mediation
Eviction Controls
Relocation benefits
Tenant/Landlord information and referral
Fair Housing

Affordability: Responses 31
Current County Responses:
Tenant Protections
Unincorporated:
Mandatory notification of voluntary rent mediation services
Mobile Home Space Rent Stabilization
Tenant/Landlord voluntary mediation, I&R
Fair Housing investigation and I&R

Affordability - Responses 32
Subsidies Rental
Rent Subsidies
Development subsidies
Operating subsidies
Public land
Reduced or waived development fees
Reduced requirements (e.g. parking)
Homeownership Mortgage Credit Certificate program
Downpayment assistance programs
Development subsidies

Affordability: Responses 33
Current County Responses:
Subsidies
Pursue and advocate for State and Federal subsidies
HUD Fair Market Rent Local Study submitted
Local Housing Trust Fund
Mortgage Credit Certificate (MCC) program
‘Boomerang’ housing funding
Explore new sources to provide subsidies

Affordability: Responses 34
Alameda County Funds “Boomerang” Funds for Housing:
$9.8 Million in ‘boomerang’ one-time former-RDA housing funds for affordable housing
$3.9 Million in ‘boomerang’ one-time former-RDA non-housing funds for homeless response
FY 2016/17 – FY 2021 $5 Million annually for affordable housing and homeless response

Affordability: Responses 35
Exploring New Sources to provide subsidies:
After the November 2015 passage of the San Francisco housing bond by 73.5%, housing activists approached Supervisor Chan about conducting a poll to see if Alameda County might have an interest in putting a County housing bond on the ballot in 2016.
EBHO, NPH, and Supervisor Chan’s office have worked with Ruth Bernstein of EMC to commission and fund a poll of 500 voters in Alameda County on potential support for a $500 million housing bond that would benefit all areas of the County.
The results will be available in early February for discussion at a full Board retreat.

Next Steps 36
Committee discussion
Refer to full Board for discussion and direction to
staff for more detailed exploration of specific
needs and policy/program responses
Explore Housing General Obligation Bond

37
Questions?