overflow characteristics of - university of …9021/ce_154.pdf · in this report, the authors...
TRANSCRIPT


OVERFLOW CHARACTERISTICS OF CYLINDRICAL WEIRS
by
Hubert CHANSON
Senior Lecturer in Civil Engineering, The University of Queensland, Australia
and
J.S. MONTES
Senior Lecturer in Civil and Mechanical Engineering, The University of Tasmania, Australia
RESEARCH REPORT No. CE 154
Department of Civil Engineering
The University of Queensland
April, 1997 Synopsis :
The most common types of weirs are the broad-crested weir, the sharp-crested weir, the circular-crested
weir and nowadays the ogee crest weir. Advantages of the cylindrical weir shape include the stable
overflow pattern, the ease to pass floating debris, the simplicity of design compared to ogee crest design
and the associated lower costs. Related applications include roller gates and inflated rubber dams.
In this report, the authors describe new experiments of circular weir overflows, with eight cylinder sizes,
for several weir heights and for five types of inflow conditions : partially-developed inflow, fully-
developed inflow, upstream ramp, upstream undular hydraulic jump and upstream (breaking) hydraulic
jump. Within the range of the experiments, the cylinder size, the weir height D/R and the presence of an
upstream ramp had no effect on the discharge coefficient, flow depth at crest and energy dissipation. But
the inflow conditions had substantial effects on the discharge characteristics and flow properties at the
crest.
II
Résumé :
Les formes les plus classiques pour les crêtes de déversoirs sont : la paroi épaisse horizontale, la paroi
mince, la paroi en forme circulaire, la forme en ogée. Les déversoirs à crête circulaire permettent un
écoulement plus stable, facilitant le passage de débris flottants, avec des formes simples de construction.
Ce type de déversoir était courant à la fin du 19ème siècle et au début du 20ème siècle, avant l'apparition
des profiles de type Creager. Des cas relatés incluent les vannes roulantes ('roller gates') et les barrages en
caoutchouc inflatés.
Les auteurs présentent de nouveaux résultats expérimentaux, obtenus en laboratoire, avec huit rayons de
courbure, plusieurs hauteurs de déversoirs, et avec cinq types de conditions amonts : écoulement
partiellement dévelopé, écoulement complètement dévelopé, présence d'une rampe inclinée, ressaut
hydraulique ondulé en amont, ressaut hydraulique (déferlant) en amont. Dans le cadre des conditions
expérimentales, on montre que le rayon de courbure, la hauteur de déversoir et la présence d'une rampe
n'ont aucun effet sur l'écoulement. Par contre, les conditions d'écoulement amont influencent
considérablement les caractéristiques de l'écoulement sur la crête de déversoir.

III
TABLE OF CONTENTS
Page
Synopsis I
Résumé II
Table of contents III
Notation IV
1. Introduction 1-1
2. Experimental apparatus 2-1
3. Experimental results : flow patterns 3-1
4. Experimental results : discharge coefficients 4-1
5. Other experimental results 5-1
6. Discussion 6-1
7. Conclusion 7-1
8. Acknowledgements 8-1
References R-1
APPENDICES
Appendix A. Experimental configurations A-1
Appendix B. Experimental data B-1
Appendix C. Effect of upstream flow conditions on the discharge coefficient C-1
Appendix D. Flow conditions at a weir crest - Application to circular weirs D-1

IV
NOTATION
The following symbols are used in this report :
CD discharge coefficient (eq. (4-2));
D 1- circular weir height (m);
2- drop height (m);
d flow depth (m) measured perpendicular to the channel bed;
dc critical flow depth (m); in a rectangular channel : dc = 3
qw2/g ;
dconj flow depth (m) downstream of a hydraulic jump (i.e. conjugate depth);
dcrest flow depth (m) measured at the weir crest;
djump upstream flow depth (m) of a hydraulic jump;
dvc flow depth (m) downstream of a sluice gate measured at vena contracta;
d1 flow depth (m) upstream of the weir;
d2 flow depth (m) downstream of the weir;
d1B flow depth (m) at the first trough of an undular jump measured on the channel centreline;
d1C flow depth (m) at the first wave crest of an undular jump measured on the channel
centreline;
Fr Froude number defined as : Fr = V/ g*d ;
g gravity constant : g = 9.80 m/s2 in Brisbane, Australia;
H total head (m);
HW upstream total head (m) above crest : HW = H1 - zdam (or HW = H1 - D if the upstream
channel bed is taken as datum);
H1 total head (m) upstream of the weir;
H2 total head (m) downstream of the weir;
ho gate opening (m);
k constant of proportionality (see app. C);
k' constant of proportionality (see app. D);
ks equivalent sand roughness height (m) of the weir invert;

V
ks' equivalent sand roughness height (m) of the upstream channel bed;
Mo Morton number;
N exponent of velocity distribution power law;
P pressure (Pa);
Patm atmospheric pressure (Pa);
Pcrest invert pressure (Pa) at the crest;
Pv vapour pressure (Pa);
Qw water discharge (m3/s);
qw water discharge per unit width (m2/s);
R curvature radius (m) of crest;
Re Reynolds number;
u' longitudinal component of turbulent velocity fluctuation (m/s);
V velocity (m/s);
Vmax upstream free-surface velocity (m/s);
VS velocity (m/s) of the invert streamline at the crest;
Vs velocity (m/s) of the free-surface streamline at the crest;
v' lateral component of turbulent velocity fluctuation (m/s);
W channel width (m);
We Weber number;
X distance (m) between the hydraulic jump front and the weir : X = xdam - xjump ;
x distance (m) along the channel bottom from the channel intake;
xdam distance (m) from the channel intake of the cylindrical weir centreline;
xjump upstream position (m) of hydraulic jump measured from channel intake;
z vertical co-ordinate (m), positive upwards;
zdam dam crest elevation (m);
zo bed elevation (m);
α 1- channel slope;

VI
2- (with subscript) kinetic energy correction coefficient (or Coriolis coefficient);
αcrest kinetic energy correction coefficient of the flow at the crest;
α1 kinetic energy correction coefficient of the upstream flow;
∆H head loss (m);
∆z broad-crested weir height (m);
δ boundary layer thickness (m);
φ angular location on the circular weir invert : φ = 0 at the crest, φ < 0 upstream of the crest
and φ > 0 downstream of the crest;
φsep angular location of flow separation;
Λ mean pressure correction coefficient :
Λ =
⌡⌠
0
d
∂P∂y * dy
ρw * g * d ;
λ local bottom pressure correction coefficient;
µ dynamic viscosity (N.s/m2)
ρ density (kg/m3);
σ surface tension between air and water (N/m);
Subscript
crest flow conditions at the weir crest;
w water flow;
1 flow conditions upstream of weir;
2 flow conditions downstream of weir;
Abbreviations
F/D fully-developed inflow conditions;
HJ hydraulic jump;

VII
IFMD Inflatable Flexible Membrane Dam;
P/D partially-developed inflow conditions;
UJ undular hydraulic jump;
WES US Army Engineer Waterways Experiment Station.

1-1
1. Introduction
1.1 Presentation
Waters flowing over weirs and spillways are characterised by a rapidly-varied flow region near the weir
crest. The flow conditions at the weir crest are critical and act as the upstream control of the chute flow.
The most common types of weirs are the broad-crested weir, the sharp-crested weir, the circular-crested
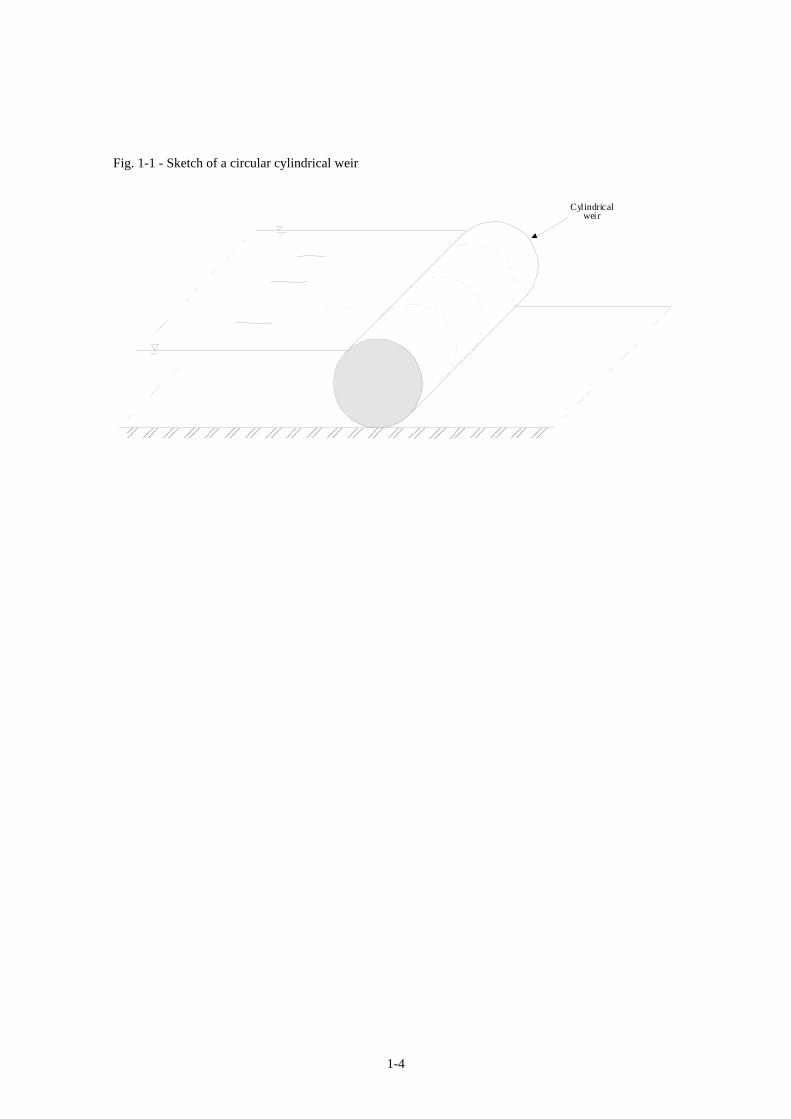
weir and nowadays the ogee crest weir. Advantages of the circular weir shape (fig. 1-1) are the stable
overflow pattern compared to sharp-crested weirs, the ease to pass floating debris, the simplicity of
design compared to ogee crest design and the associated lower cost. Circular-crested weirs have larger
discharge capacity (for identical upstream head) than broad-crested weirs and sharp-crested weirs.
Cylindrical weirs were common in the late 19th century and early 20th century prior to the introduction
of the ogee shape. During the 19th century, developments in improving weir discharge capacity lead to
the design of circular-crested weirs (e.g. work of H.E. BAZIN1, in France). In the early 20th century, the
ogee shape was introduced : e.g., the Creager profile2 (CREAGER 1917), the Scimemi profile
(SCIMEMI 1930).
More recent applications include roller gates and inflated flexible membrane dams (IFMD). Roller gates3
are hollow metal cylinders held in place at each end by concrete piers. They can be raised to allow the
flow underneath. For small overflows it is not economical to lift the gate and overflow is permitted. Large
roller gates were built in Germany during the late 19th and early 20th centuries. WEGMANN (1922) and
PETRIKAT (1958) presented several photographs. Large gates (built in the first half of the 20th century)
are still in use in USA and several new roller gates have been installed recently in Japan.
Inflated flexible membrane dams are a new form of weir. They are also called rubber dams. They are
used to raise the upstream water level by inflating the rubber membrane place across a stream or along a
weir crest. During large floods, the dam is deflated. Small overflows are usually allowed without dam
deflation and the overflow characteristics are somehow similar to that of circular weirs (ANWAR 1967,
1Henri Emile BAZIN (1829-1917), French hydraulic engineer who worked with H.P.G. DARCY at the beginning of his career. 2Interestingly CREAGER developed his ogee crest profile based on sharp-crested weir experiments performed by H.E. BAZIN (1888-1898). 3Also called cylindrical gates or rolling dams (WEGMANN 1922).
1-2
CHANSON 1996). These are nevertheless special areas of interest and need to be researched on their
own.
In the present study, the characteristics of cylindrical weirs are re-investigated, a particular emphasis
being the effects of the upstream flow conditions.
1.2 Dimensional analysis
The relevant parameters in the study of cylindrical weirs come from the following groups :
(A) Fluid properties and physical constants : the pressure above the flow Patm (Pa), the temperature of air
and water (K), the density of water ρw (kg/m3), the dynamic viscosity of water µw (N.s/m2), the surface
tension of air and water σ (N/m), the vapour pressure at the experiment temperature Pv (Pa), and the
acceleration of gravity g (m/s2).
(B) Channel geometry : the bed slope α, the channel width W (m), the roughness of the channel bottom
ks' (m).
(C) Weir geometry : the cylinder radius R (m), the crest height above channel bed D (m), the weir
roughness ks (m), the presence or absence of nappe ventilation (on the downstream face), the weir
geometry (e.g. upstream ramp) (fig. 2-1).
(D) Upstream flow properties : the upstream flow depth d1 (m), flow velocity V1 (m/s) (or discharge per
unit width qw (m2/s)), the type of inflow conditions (e.g. partially- or fully-developed), the boundary
layer thickness δ (m) for partially-developed inflow conditions, the characteristics of the upstream flow
turbulence (e.g. longitudinal and lateral components of the turbulent velocity fluctuations u'1 and v'1
(m/s)).
Taking into account all the above parameters, dimensional analysis yields :
F1(Patm, Pv, ρw, µw, σ, g, α, W, ks', R, D, ks, V1, d1, δ, ...) = 0 (1-1)
Dimensionless numbers
The above variables give the following dimensionless numbers :
- the dimensionless geometric variables α, W/R, ks'/R,
- the weir characteristics D/R, ks/R,

1-3
- the Froude number4 Fr = qw/ g * R3,
- the Reynolds number Re = ρw * qw/µw,
- the Weber number We = ρw * qw2/(σ * R),
- the cavitation parameter (Patm - Pv)/(ρw*qw2/R2),
- the dimensionless upstream flow variables d1/R, δ/d1, ...
Note that any combination of these numbers is also dimensionless and may be used to replace one of the
combinations : e.g., one parameter can be replaced by the Morton number Mo = (g * µw4)/(ρw * σ3)
since :
Mo = We3
Fr2 * Re4 (1-2)
The Morton number is a function only of fluid properties and gravity constant. For the same fluids (air
and water) in both model and prototype, Mo is a constant.
From the above considerations the relationship (1-1) may be rewritten in terms of dimensionless
parameters :
F2
⎝⎜⎛
⎠⎟⎞α ;
WR ;
ks'R ;
DR ;
ksR; Fr ; We ; Mo ;
Patm - Pv
ρw*qw
2
R2
; d1R ;
δd1
; ... = 0 (1-3)
1.3 Structure of the report
The authors investigated the overflow characteristics of circular weirs in laboratory for a wide range of
parameters : the cylinder radius (8 sizes), the weir height (2 < D/R < 9), the upstream flow conditions
(upstream ramp, partially- and fully-developed inflow, upstream hydraulic jumps). The experimental
setups are described in section 2. The results are presented in sections 3, 4 and 5. Discussion and
comparisons with other studies are presented in section 6. All the experimental data are given in
appendices A and B. Appendices C and D develop new formulations of the discharge coefficient and
flow depth at crest as functions of the flow parameters.
4Although the Froude number was named after the Englishman W. FROUDE, several French researchers used the dimensionless number beforehand. DUPUIT (1848) and BRESSE (1860) highlighted the significance of the number to differentiate between sub- and super-critical flows. BAZIN (1865) confirmed experimentally the findings. Ferdinand REECH introduced the dimensionless number for testing ships and propellers in 1852. The number is called the Reech-Froude number in France.
1-4
Fig. 1-1 - Sketch of a circular cylindrical weir
Cylindrical
weir

2-1
2. Experimental apparatus
2.1 Experimental channels
New experiments were performed in four channels to investigate a wide range of geometry and inflow
conditions (table 2-1, app. A).
The first channel (channel T1) is 0.301-m wide and 12-m long. It is horizontal and the sidewall height is
0.5-m. Both the bottom and sidewalls are made of perspex panels (2-m long). The intake is a smooth
three-dimensional convergent section of elliptical shape. The cylindrical weirs were placed 8-m
downstream of the channel entrance.
The second channel is a horizontal flume (channel QI) and the cylindrical weir was placed at the crest of
a broad-crested weir. The flume is 3.05-m long and 0.25-m wide, the bottom and sidewalls are made of
glass panels (3.05-m long), and the sidewall height is 0.18-m. The broad-crested weir, made of perspex,
is located 0.95-m downstream of the channel intake. The sill height is 0.0645-m, the horizontal crest
length is 0.425-m and the crest has a rounded upstream edge (28-mm radius) and a tapered downslope
(concave upwards) (fig. 2-1 and 2-2A). Further details on the channel were reported by ISAACS (1981)
and CHANSON (1995a).
Another flume (channel QII) is a 20-m long channel of uniform rectangular section. The channel width is
W = 0.25 m and the sidewall height is 0.255 m. Both walls and bed are made of glass panels (1.25 m long
each). The channel is supported on an elevated steel truss which spanned between main supports located
at the upstream end and 14 m downstream. The channel slope is adjustable with a geared-lifting
mechanism. Regulated flows are supplied from a constant head tank feeding an inlet transition to the
channel with a three-dimensional smooth convergent section. During all the experiments, the cylindrical
weirs were placed on the channel bed and the axis of the cylinders was located 11-m downstream of the
channel intake. For such a location the upstream flow was fully-developed for all experiments with a mild
slope (series QIIA) or exhibited an undular hydraulic jump for experiments with steeper slopes (series
QIIB) (fig. 2-1, 2-2B and 2-2C). Further details on the channel were reported by ISAACS and
MACINTOSH (1988) and CHANSON (1995a).
A series of experiments were performed in a 3.20-m long flume of uniform rectangular section (channel
QIII). The channel is horizontal and 0.25-m wide, and the sidewalls are 0.30-m high. Both walls and bed
are made of glass (3.20-m long panels). Regulated flows are supplied through an adjustable vertical

2-2
sluice gate. For some experiments, the sluice gate was fully-opened and the flow was subcritical in the
whole channel (experiments series QIIIA). With fully-opened gate, the upstream flow conditions were
disturbed because of poor performances of the calming section. During another series of experiments
(series QIIIB), the sluice gate opening was set between 20-mm and 80-mm. The experimentally observed
values for the coefficient of contraction (i.e. vena contracta) were equal to about 0.6. Such observations
are very close to the VON MISES' (1917) solution for the no-gravity case. For all experiments in channel
QIII, the cylinders laid on the channel bottom and their axis was located 2.55-m downstream of the sluice
gate, the horizontal channel ending with a free-overfall. Further details on channel QIII were reported by
CHANSON and QIAO (1994) and CHANSON (1995b).
Each flume is supplied with recirculating water supplied by a constant head tank.
2.2 The cylindrical weirs
Altogether eight different cylinders were tested (table 2-2).
Four cylinders were made of PVC pipes. They could be supported by vertical perspex supports (10-mm
thick) of various heights. The PVC cylinders were slitted and slided over the perspex plate.
Four models of cylindrical weirs were built in hollow concrete (fig. 2-3). Each cylinder was surfaced with
two coats of winding vernish and the surface finish was extremely smooth. The tolerance on the outside
diameters was 0.4 mm (i.e. ∆D < 0.4 mm). Each cylinder was equipped with a groove (12-mm deep, 5-
mm wide) to facilitate the installation of rectangular deflectors.
Remarks
The downstream face of the cylindrical weirs was not ventilated in all experiments.
No free-falling nappe ("jumping off" the weir) nor air cavity was ever observed with the cylindrical weirs
laid on the channel bottoms (e.g. experiments series QII and QIII). When the cylinders were supported
(e.g. experiments series T1A, T1B and T1C), separation on the downstream face was sometimes
observed (for a small number of experiments).

2-3
Table 2-1 - Summary of experimental flow conditions
Geometry Slope α qw d1 D Inflow Remarks
deg. m2/s m m conditions (1) (2) (3) (4) (5) (6) (7)
Channel T1 Horizontal channel (W = 0.301m). Series T1A and
T1B 0 P/D and
F/D Vertical perspex support (10-mm thick).
0.011 to 0.074
0.193 to 0.362
0.154, 0.204 & 0.254
Cylinder No. A.
0.008 to 0.071
0.183 to 0.352
0.154, 0.204 & 0.254
Cylinder No. B.
0.011 to 0.076
0.194 to 0.359
0.154, 0.204 & 0.254
Cylinder No. C.
0.001 to 0.072
0.181 to 0.359
0.154, 0.204 & 0.254
Cylinder No. D.
Series T1C 0 Ramp 30-degree upstream ramp. 0.003 to
0.073 0.173 to 0.3565
0.154, 0.204 & 0.254
Cylinder No. A.
0.006 to 0.072
0.183 to 0.3545
0.154, 0.204 & 0.254
Cylinder No. B.
0.005 to 0.075
0.176 to 0.3535
0.154, 0.204 & 0.254
Cylinder No. C.
0.005 to 0.073
0.185 to 0.3495
0.154, 0.204 & 0.254
Cylinder No. D.
Channel QI Weir Broad-crested weir channel (∆z = 0.0.0645 m, W = 0.25 m).
Series QI 0 0.0005 to 0.005
0.154 to 0.172
0.0835
Channel QII Long tilting flume (W = 0.25 m). Series QIIA 0.191 F/D Mild slope experiments.
0.0008 to 0.04
0.09 to 0.15
0.0835 Cylinder No. 1.
0.0008 to 0.12
0.11 to 0.23
0.1048 Cylinder No. 2.
0.002 to 0.06
0.16 to 0.235
0.1509 Cylinder No. 3.
0.0009 to 0.004
0.24 to 0.25
0.2332 Cylinder No. 4.
Series QIIB 0.191 to 0.97
UJ Steep slope experiments. Undular hydraulic jump upstream of weir.
0.004 to 0.040
0.096 to 0.151
0.0835 Cylinder No. 1.
0.085 to 0.035
0.127 to 0.169
0.1048 Cylinder No. 2.
Channel QIII Horizontal channel (W = 0.25m). Series QIIIA 0 P/D Sluice gate fully-opened.
0.0013 to 0.027
0.24 to 0.30
0.2332 Cylinder 4.
Series QIIIB 0 HJ Hydraulic jump upstream of weir. 0.05 to
0.14 0.186 to
0.254 0.1048 Cylinder No. 2. Sluice gate openings:
ho = 0.02, 0.03, 0.04, 0.05, 0.065 and 0.08 m.
Notes:
Cylinder characteristics are described in table 2-2.

2-4
Inflow conditions : F/D = fully-developed inflow; P/D = partially-developed inflow; Ramp = upstream
ramp (30-degrees); Weir = cylinder located on a weir crest; HJ = upstream hydraulic jump; UJ =
upstream undular hydraulic jump.
D : weir height; W : channel width.
Table 2-2 - Cylindrical weir characteristics
Cylinder No. Reference radius
R (+) Remarks
(m) (1) (2) (3) A 0.07905 Cylinder made of PVC pipe. B 0.0671 Cylinder made of PVC pipe. C 0.05704 Cylinder made of PVC pipe. D 0.0290 Cylinder made of PVC pipe. 1 0.04175 Cylinder built in concrete with a hollow core. 2 0.052375 Cylinder built in concrete with a hollow core. 3 0.0754375 Cylinder built in concrete with a hollow core. 4 0.116575 Cylinder built in concrete with a hollow core.
Note : (+) : curvature radius at crest
During a very small number of overflow experiments (series QI, QII and QIII), sidewall effects were
observed at nappe separation. In such rare cases, "end plates" were placed downstream of the cylinders
along each sidewall. The end plates acted as vein guides, limiting the sidewall disturbances to a narrow
region between the walls and the plates. The distance between one sidewall and the corresponding end
plate was about 30-mm. Most experiments were performed without end plates as the sidewall effects
were visually small (fig. 3-2B).
2.3 Instrumentation
The water discharge was measured either by a volume-to-time measurement using a calibrated 300 L tank
(channels QI and QII) or by a 90-degree V-notch weir (channels T1 and QIII). The percentage of error is
expected to be less than 5%.

2-5
The flow depths were measured using a pointer gauge. For the experiments series T1, the accuracy on
flow depth measurement was 0.2-mm. For the experiments series QI, QII and QIII, the pointer gauge was
connected to a MitutoyoTM digimatic caliper (Ref. No. 500-171), and the error on the flow depth was less
than 0.1-mm.
The pointer gauges were rail-mounted and the distance along the flume from the channel entrance was
measured with a metre line; the error was ∆x < 1 mm.
In addition photographs were taken during the experiments and used to visualise the flow patterns.
Comments
For each experiment. the total head was deduced from the bed elevation measurement and the flow depth
data as :
H = zo + d * cosα + qw
2
2 * g * d2 (2-1)
where zo is the bed elevation, qw is the discharge per unit width, d is the flow depth and α is the bed
slope.
Note that, before the experiments series QI, QII and QIII, the longitudinal bed profile of each flume was
checked by filling the flume with water (in absence of flow rate). The free-surface being perfectly still,
the bottom elevation was recorded every 10-cm. The survey was particularly important for an accurate
estimate of the upstream total head during the experiments series QIIA and QIIB in the tilting flume QII.
2.4 Experimental procedures
Several series of experiments were performed in the four flumes for a wide range of flow rates and with
various inflow conditions (table 2-1).
Experiments series T1A and T1B investigated the discharge characteristics of cylindrical weirs in a
horizontal channel with various support heights. Experiments series T1A and T1B were performed
independently. The inflow conditions were partially-developed and fully-developed. Experiments T1C
extended the results to include the effects of a 30-degree upstream ramp and they were performed at the
same period as experiments series T1B.

2-6
Experiments series QI described the overflow of a cylindrical weir located on a broad-crested weir. The
flow conditions are comparable to a roller gate or rubber dam placed at the crest of a weir (with
horizontal flat crest).
Experiments series QIIA and QIIB were performed in the tilting channel QII with different bed slopes :
mild slope (series QIIA) and steep slopes (series QIIB). For the mild slope experiments, the inflow
conditions were subcritical and fully-developed. During the steep slope experiments (series QIIB), an
undular hydraulic jump took place upstream of the weir. The location and characteristics of the jump
were controlled by the flow rate, bed slope and weir height. Visually, the presence of an undular
hydraulic jump and the resulting free-surface undulations (downstream of the jump front and upstream of
the weir) were observed to affect substantially the overflow pattern above the cylinders.
The overflow characteristics of a large cylinder (cylinder 4) were further investigated in the channel QIII
(experiments series QIIIA). The inflow conditions were partially-developed. In the same flume (channel
QIII), experiments series QIIIB investigated the effects of (breaking) hydraulic jumps upstream of a
cylindrical weir. The characteristics of the jump were controlled by the gate opening, flow rate and
overflow properties of the cylinders.
Fig. 2-1 - Sketch of the experimental channels and main definitions of symbols

2-7
Fig. 2-1 - Sketch of the experimental channels and main definitions of symbols
Channel QIIExperiments Series QIIB
d1d2
dcrest
RD
Circularcylinder
xdamxjump
Undular jump flow
d jump
Channel QI
xdam
d1
d2
dcrest
RDBroad-crested weir
Circularcylinder
zdam
Total Head Line
HW
Channel QIIIExperiments Series QIIIB
d1 d2
dcrest
D
Hydraulicjump
ho
Sluicegate
xdam
x jump
d jump dconj
Total Head Line
HW
Overfall

2-8
Fig. 2-2 - Photographs of the experiments
(A) View of channel QI and of the broad-crested weir (without cylinder) - Flow from the right
(foreground) to the left (background)
(B) Side view of cylinder No. 2 in channel QII - Flow from the left to the right
qw = 0.026 m2/s, W = 0.25 m, R = 0.0524 m, CD = 1.35, HW/R = 1

2-9
Fig. 2-2 - Photographs of the experiments
(C) Top view of cylinder No. 2 in channel QII - Flow from the left to the right
Same flow conditions as fig. 2-2(C) - Note dye injection upstream of the cylinder on the channel
centreline
Fig. 2-3 - Photographs of the cylinders 1 to 4 (cylinder 1 on the right, cylinder 4 on the left)

3-1
3. Experimental results : flow patterns
3.1 Presentation
Experiments were performed in four different flumes (channels T1, QI, QII and QIII) with eight cylinder
sizes (table 2-2) and for five types of inflow conditions (table 2-1) (see section 2). The experimental
results are regrouped in the following order : flow patterns (section 3), discharge coefficients (section 4),
and other experimental results : e.g., flow depth at crest and energy loss (section 5). The results are
further discussed and compared with other studies in section 6.
Full details of the experimental data are reported in the appendices A and B.
3.2 Flow patterns
Circular weirs without support
Considering a cylindrical weir sitting on the channel bed (i.e. without vertical support) (e.g. fig. 2-2 and
3-2), the flowing waters at low-to-medium overflows (i.e. HW/R < 1.6) are subjected to :
- a rapid change in streamline direction upstream of the weir,
- nappe adherence on the downstream face of the cylindrical weir, and
- nappe separation near the downstream bottom of the weir.
These features are illustrated on figures 2-2, 3-1 and 3-2.
Dye injection at various depths upstream of the weir showed that the change of streamline direction
occurs shortly upstream of the weir : i.e., at a distance of about one to two weir heights. The flow
redistribution is sometimes associated with the development of helicoidal vortices with horizontal axis
along the upstream base of the weir (e.g. fig. 3-3A) and by sidewall vortices of irregular shapes along the
upstream face of the weir (near the wall).
As the waters pass over the dam crest, the nappe free-surface remains smooth and clear, and the falling
nappe adheres to the weir face (fig. 2-2 and 3-2). This phenomenon (i.e. the two-dimensional nappe
flowing past the convex curved wall and adhering to the wall) is called a Coanda1 effect. It is not related
to gravity but it results from the superposition of two hydrodynamic phenomena. First the convex
1Named after Henri COANDA, Romanian scientist, who patented first the Coanda effect (COANDA 1932).

3-2
curvature of the wall imposes a modification of the pressure field within the nappe, inducing a suction
pressure on the wall. The second effect is related to fluid entrainment into the nappe by turbulent mixing.
The induced flow is directed towards the jet and leads to a force on the body normal to the flow
direction2. The resulting Coanda force acts on the wall surface in a direction normal to the flow direction
and it induces the nappe adherence (fig. 3-1) (see CHANSON 1996 for a complete review).
On the lower (downstream) quadrant of the cylinder, the nappe continues to adhere to the cylinder wall
despite the gravity effect opposing the Coanda force. Near the weir bottom, nappe separation takes place
(fig. 3-1). Usually the nappe separation occurs at the weir bottom because of the presence of the channel
bed. In some particular flow conditions, nappe separation might take further upstream, unconnected with
the channel bottom : this process is not yet fully understood (CHANSON 1996).
Circular weirs with support
For circular weirs with a vertical support, similar flow patterns were observed as for weirs without
support. A main difference was that, at large ratio head on crest to radius, nappe separation was observed
on the downstream face of the weir (before the nappe reached the downstream face of the support). Such
a separation occurred in absence of nappe ventilation. Unfortunately the characteristic conditions for
nappe separation were not recorded at the time.
It is worth noting that SARGINSON (1972) observed a similar behaviour with ventilated nappes (table 6-
1) : i.e., nappe separation on the downstream weir face for the ratio head on crest to radius exceeding a
critical value (see section 6).
3.3 Discussion
Suction pressure at the wall and the resulting nappe adherence causes the streamlines to become more
curved and the flow velocity to become higher. For that reason, the discharge coefficient of circular weir
is greater than that of sharp-crested weir and broad-crested weir (see section 4). A study (ESCANDE and
SANANES 1959) showed further that suction along the crest invert may contribute to an increase in
discharge by more than 15 to 20%.
2This process is also called Chilowsky effect.

3-3
Some researchers investigated the hydraulics of circular weirs (e.g. SARGINSON 1972, ROUVE and
INDLEKOFER 1974) and noted also the nappe adherence on the downstream weir face. Observations
indicated further that nappe ventilation helped the separation of the nappe. Another study (CHANSON
1996) proposed an analytical method to predict the wall suction pressure.
Tailwater effects at large overflows
At very-large overflows (typically HW/R > 2), the present study showed that (1) cylindrical weirs
without vertical support tended to act as an obstruction (i.e. bluff body) rather than a weir and (2) circular
weir with large support height tended to behave as sharp-crested weirs.
Further the tailwater conditions affected the overflow pattern. For large overflows, nappe separation and
flow recirculation was sometimes observed in the upper quadrant of the weir using dye injection (fig. 3-
2C and 3-3). On figures 3-3B and 3-3C, the flow patterns are sketched for two particular flow conditions.
Note that tailwater effects were previously mentioned by PETRIKAT (1958,1978) who reported full-
scale tests performed on a cylindrical weir (R = 1.75 m, W = 25 m) during large overflow (H1/R = 5, (d1-
d2)/R = 1.8).
For circular weirs with vertical supports, nappe separation was clearly observed at very-large overflows.
And, visually, the flow pattern looked similar to the overflow pattern of a sharp-crested weir.

3-4
Fig. 3-1 - Basic flow patterns of low overflow above a circular weir without vertical support
d1
d crest
R
Circularcylinder
Nappeadherence
Nappe sep aration
Fig. 3-2 - Photographs of the cylindrical weirs
(A) Channel QII, Cylinder 2 (R = 0.0524 m) : qw = 0.015 m2/s, W = 0.25 m, α = 0.71 deg., CD = 1.28,
dcrest/dc = 0.96, HW/D = 0.345 - Flow from the left to the right. Note the end plates on the right.

3-5
Fig. 3-2 - Photographs of the cylindrical weirs
(B) Top view - Flow from the left to the right - Same flow conditions as (A)
(C) Channel QII, Experiment series QIIB, Run RM1-[63] : cylinder 2 (R = 0.0524 m), qw = 0.015 m2/s,
W = 0.25 m, α = 0.57 deg., CD = 1.23, dcrest/dc = 0.99, HW/D = 0.350 - Flow from the left to the right.
Note dye injection highlighting flow recirculation region near the location of nappe separation

3-6
Fig. 3-3 - Sketches of particular flow patterns
0.06
45 m
0.0835 m
Channel QI, Run RM1-53
Broad-crested weir
0.17
2 m
0.0142 mq = 0.0052 m /s2
w
0.08
35 m
x = 11 m
Channel QII
Experiments Series QIIARef. RM1-59
Recirculationregion
0.15
51 m
0.0513 m
~ 0.06 m
Dividingstreamline
Experiments Series QIIARef. AS1-03
0.10
5 m
Channel QII
0.23
1 m
0.097 m
~ 0.1 to 0.13 mSeparation Hydraulic
jump

4-1
4. Experimental results : discharge coefficients
4.1 Introduction
In open channels, maximum flow rate is achieved at critical flow conditions (BELANGER 1828).
Considering an ideal-fluid flow over a weir in a rectangular channel, the maximum discharge per unit
width at a weir crest equals:
qw = g * ⎝⎛
⎠⎞2
3 * (H1 - zdam)3/2
ideal fluid flow (4-1)
where g is the gravity acceleration, H1 is the upstream total head and zdam is the weir crest elevation (see
fig. 2-1). Equations (4-1) derives from the Bernoulli equation assuming hydrostatic pressure distribution
at the crest.
In practice the observed discharge differs from equation (4-1) because the pressure distribution on the
crest is not hydrostatic and turbulent losses occur. Usually the flow rate is expressed as :
qw = CD * g * ⎝⎛
⎠⎞2
3 * (H1 - zdam)3/2
(4-2)
where CD is the discharge coefficient.
Basically CD is the ratio of the observed flow rate to the ideal discharge (eq. (4-1)). It equals unity for a
broad-crested weir.
4.2 Experimental results : general trends
Experimental observations of discharge coefficients are reported in figures 4-1 to 4-6.
Figure 4-1 presents the discharge coefficient as a function of HW/R where HW is the upstream head
above crest :
HW = H1 - zdam (4-3)
and R is the curvature radius of the crest (table 2-2).
Figure 4-1A shows experimental data obtained with four cylinder sizes, with and without vertical support
and no upstream ramp (channel T1, series T1A and T1B). Figure 4-1B presents data for four cylinder
sizes with experiments series QIIA, QIIB and QIIIB (channels QII and QIII).

4-2
Fig. 4-1 - Discharge coefficient CD as a function of the dimensionless upstream head above crest HW/R
(A) Channel T1, experiments series T1A and T1B (table 2-1)
0.75
0.85
0.95
1.05
1.15
1.25
1.35
1.45
0 0.5 1 1.5 2 2.5 3 3.5 4
Cyl. D (Series T1A and T1B)Cyl. C (Series T1A and T1B)Cyl. B (Series T1A and T1B)Cyl. A (Series T1A and T1B)
C
HW/R
D
No upstream ramp
(B) Channel QII, experiments series QIIA and QIIIA (table 2-1)
0.80
0.90
1.00
1.10
1.20
1.30
1.40
1.50
0 0.5 1 1.5 2 2.5 3 3.5
Cyl. 2 (Series QIIA) Cyl. 2 (Series QIIB) Cyl. 2 (Series QIIIB) Cyl. 2 (Series QIIC 90-deg.)Cyl. 2 (Series QIIC 57-deg.) Cyl. 2 (Series QIIC 30 deg.) Cyl. 2 (Series QIIC 0-deg.)
HW/R
CD
4-3
The results indicate consistently an increase of the discharge coefficient with increasing dimensionless
head above crest. The data show also that the discharge coefficient is mostly larger than unity : i.e., for a
given upstream head, the discharge on a circular weir is larger than that on a broad-crested weir.
The scatter of the data on figure 4-1B suggests further different discharge characteristics for different
types of inflow conditions. Such results could suggest potential scale effects if the inflow conditions are
not properly reproduced in models.
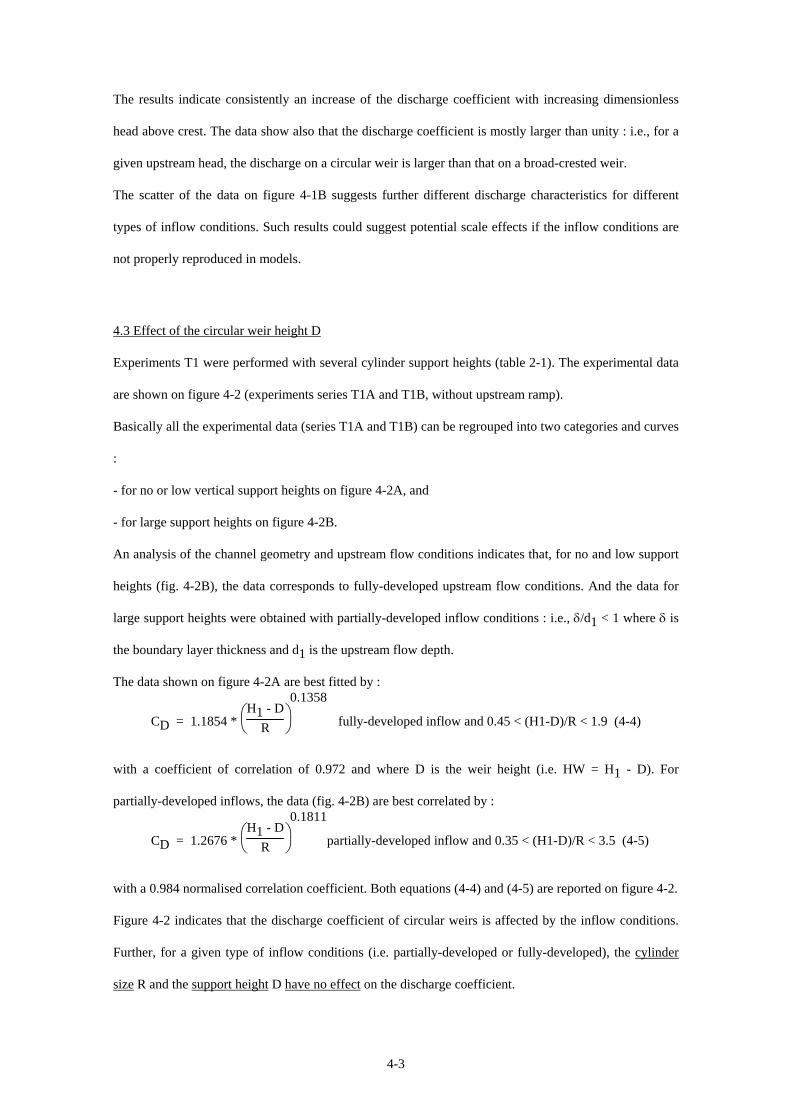
4.3 Effect of the circular weir height D
Experiments T1 were performed with several cylinder support heights (table 2-1). The experimental data
are shown on figure 4-2 (experiments series T1A and T1B, without upstream ramp).
Basically all the experimental data (series T1A and T1B) can be regrouped into two categories and curves
:
- for no or low vertical support heights on figure 4-2A, and
- for large support heights on figure 4-2B.
An analysis of the channel geometry and upstream flow conditions indicates that, for no and low support
heights (fig. 4-2B), the data corresponds to fully-developed upstream flow conditions. And the data for
large support heights were obtained with partially-developed inflow conditions : i.e., δ/d1 < 1 where δ is
the boundary layer thickness and d1 is the upstream flow depth.
The data shown on figure 4-2A are best fitted by :
CD = 1.1854 * ⎝⎛
⎠⎞H1 - D
R
0.1358
fully-developed inflow and 0.45 < (H1-D)/R < 1.9 (4-4)
with a coefficient of correlation of 0.972 and where D is the weir height (i.e. HW = H1 - D). For
partially-developed inflows, the data (fig. 4-2B) are best correlated by :
CD = 1.2676 * ⎝⎛
⎠⎞H1 - D
R
0.1811
partially-developed inflow and 0.35 < (H1-D)/R < 3.5 (4-5)
with a 0.984 normalised correlation coefficient. Both equations (4-4) and (4-5) are reported on figure 4-2.
Figure 4-2 indicates that the discharge coefficient of circular weirs is affected by the inflow conditions.
Further, for a given type of inflow conditions (i.e. partially-developed or fully-developed), the cylinder
size R and the support height D have no effect on the discharge coefficient.

4-4
Note that, for experiments series T1A and T1B, the flow conditions corresponding to the transition
between equations (4-4) and (4-5) are summarised in table 4-1. They are related to the upstream
boundary layer development and upstream flow depth, and not to the weir height or crest radius.
Table 4-1 - Flow conditions at transition between partially-developed and fully-developed inflow
conditions in experiments series T1A and T1B (vertical support, no upstream ramp)
Cylinder No. R (H1 - D)/R
m (1) (2) (3) A 0.079 2.9 B 0.067 3.4 C 0.057 4 D 0.029 < 5
Fig. 4-2 - Discharge coefficient of circular cylinders : effect of the vertical support height
(A) Experimental data for no or low support heights and fully-developed inflow conditions (experiments
series T1A and T1B)
0.75
0.85
0.95
1.05
1.15
1.25
1.35
1.45
0 0.5 1 1.5 2 2.5 3
Cyl. A (D/R=1.9)Cyl. A (D/R=2.6)Cyl. B (D/R=2.3)Cyl. B (D/R=3.0)Cyl. C (D/R=2.7)Cyl. C (D/R=3.6)EQ. (4-4)EQ. (4-5)
C
HW/R
Experiments series T1A and T1BD

4-5
Fig. 4-2 - Discharge coefficient of circular cylinders : effect of the vertical support height
(B) Experimental data for large support heights and partially-developed inflow conditions (experiments
series T1A and T1B)
0.75
0.85
0.95
1.05
1.15
1.25
1.35
1.45
0 0.5 1 1.5 2 2.5 3
Cyl. A (D/R=3.2) Cyl. B (D/R=3.8) Cyl. C (D/R=4.4)Cyl. D (D/R=5.3) Cyl. D (D/R=7.0) Cyl. D (D/R=8.7)EQ. (4-4) EQ. (4-5)
C
HW/R
Experiments series T1A and T1BD
4.4. Effect of upstream ramp
Experiments series T1B and T1C were performed specifically to investigate the effect of an upstream
ramp on the discharge characteristics. The results are shown in figure 4-3 where the discharge coefficient
for the experiments series T1C with the 30-degree upstream ramp is compared with equations (4-4) and
(4-5) (experiments series T1A and T1B, no ramp).
Figure 4-3 shows a broader scatter for the experimental data with ramp than for the experiments without
ramp (fig. 4-2). Overall the experimental results suggest that the upstream ramp has no or little effect on
the discharge capacity of circular weirs. Previous studies (e.g. MATTHEWS 1963, VO 1992, table 6-1)
reported a similar conclusion.
Although an upstream ramp does not improve the discharge coefficient, the ramp can facilitate the
passage of large debris (e.g. ice, trees) and it must be recommended in natural streams where floating
debris are common. Also, in natural rivers with sediment transport, siltation upstream of the weir could
form a pseudo-ramp upstream of the weir.

4-6
Fig. 4-3 - Discharge coefficient of circular cylinders : effect of the 30-degree upstream ramp
Comparison between experimental data with upstream ramp (experiments series T1C) and equations (4-
4) and (4-5) (no-ramp data)
0.75
0.85
0.95
1.05
1.15
1.25
1.35
1.45
0 0.5 1 1.5 2 2.5 3
Cyl. A (D/R=1.9)Cyl. A (D/R=2.6)Cyl. A (D/R=3.2)Cyl. B (D/R=2.3)Cyl. B (D/R=3.0)Cyl. B (D/R=3.8)Cyl. C (D/R=2.7)Cyl. C (D/R=3.6)Cyl. C (D/R=4.4)EQ. (4-4) F/D inflow & No rampEQ. (4-5) P/D inflow & No ramp
C
HW/R
Experiments series T1CD
4.5 Effect of upstream flow conditions
All experiments were performed with turbulent inflow conditions (i.e. Re > 1,000 to 5,000). Altogether
four types of inflow conditions were investigated : partially-developed and fully-developed inflow
conditions (series T1, QI, QIIA and QIIIA), inflow conditions disturbed by an undular hydraulic jump
(series QIIB) and inflows strongly disturbed by the presence of a hydraulic jump (series QIIIB) (e.g. fig.
2-1).
Upstream developing flow
Figure 4-1 shows the effect of inflow conditions : fully-developed inflow in figure 4-1A and partially-
developed inflow in figure 4-1B. Results indicate that, for a given ratio HW/R, larger discharge
coefficients are observed with fully-developed inflow than with partially-developed inflow.
Such a result can be predicted analytically (App. C). Applying the Bernoulli equation along the free-
surface streamline between the upstream flow location and the crest, the discharge coefficient can be
expressed in terms of the upstream flow depth, the flow depth at the crest dcrest, the weir crest height D

4-7
and the boundary layer characteristics. For an upstream flow with a developing bottom boundary layer,
the Bernoulli equation yields :
CD = dcrest
dc *
3 * ⎝⎜⎛
⎠⎟⎞1 -
23 *
dcrestdc
k2 - dcrest
2
d12 *
⎝⎜⎜⎛
⎠⎟⎟⎞
N + 1
N + 1 - δ
d1
2 (4-6)
where δ is the boundary layer thickness, k is a constant of proportionality, 1/N is the velocity distribution
power law exponent (see app. C) and dc is the critical flow depth in rectangular channel with hydrostatic
pressure distribution. As the ratio dcrest/dc is nearly independent of the upstream flow conditions (see
section 5), equation (4-6) implies that the discharge coefficient increases with increasing ratio δ/d1 for
given inflow conditions : i.e., CD is larger for fully-developed inflow conditions (i.e. δ/d1 = 1) that for
partially-developed inflows (i.e. δ/d1 < 0).
Upstream hydraulic jump
The effects of an upstream hydraulic jump were investigated in two channels : channels QII and QIII.
One series of experiments were performed with a normal hydraulic jump upstream of the weirs
(experiments series QIIIB). Another series was performed with an upstream undular hydraulic jump
(series QIIB). All the data are presented in appendix B. The main results are discussed below.
On figure 4-4, discharge coefficient data for one cylinder size (cylinder No. 2, R = 0.0524 m, D = 2*R)
are plotted for : a fully-developed subcritical upstream flow (series QIIA), a (stationary) undular
hydraulic jump upstream of the cylinder (series QIIB) and a (normal) hydraulic jump upstream of the
cylinder (series QIIIB). Figure 4-4 suggests that :
- an upstream undular hydraulic jump tends to increase the discharge coefficient of the weir,
- the presence of a normal hydraulic jump upstream of the cylinder reduces significantly the discharge
coefficient in most cases (see also discussion below).
Figure 4-5 shows the effect of the location of the upstream undular jump on the discharge coefficient for
several ratios of head above crest to dam height. The data are plotted as CD versus X/D, where X is the
distance from the jump front to the cylinder centreline :
X = xdam - xjump (4-7)

4-8
where xdam and xjump are defined on figure 2-1. On figure 4-5, the limiting values of CD for large
values of X/D (i.e. no undular jump) are shown also. The results (fig. 4-5) suggest that the presence of an
upstream undular jump tends to increase the discharge coefficient, and CD increases with decreasing
distance X/D for a given head on crest.
Figure 4-6 shows the relationship between CD and X/D when a normal hydraulic jump takes place
upstream of the cylinder. Visually the presence of a hydraulic jump disturbs substantially the inflow, and
such flow disturbances might explain the observed smaller discharge coefficients (than in absence of
upstream hydraulic jump). When the normal hydraulic jump is located close to the weir (i.e. X/D < 10),
the cylinder becomes "engulfed" into the jump roller and it ceases to act as a weir. The flow "perceives"
the cylinder as a form of apron or sill, and the discharge coefficient data are no longer meaningful.
Discussion
SCHODER and TURNER (1929) investigated the effects of inflow conditions on sharp-crested weirs.
Their results showed substantial modifications of the overflow characteristics when fences and screens
were installed in the upstream channel to induce large bottom velocities or large free-surface velocities.
LINDQUIST (1929) discussed these data, showing that the discharge coefficient was affected by the
upstream flow conditions. In his analysis, LINDQUIST demonstrated that CD was related to the kinetic
energy correction coefficient of the upstream flow.
4.6 Summary
The discharge coefficient of circular weirs has been investigated for a large number of cylinder sizes,
weir support heights and different types of inflow conditions. For the range of the experiments (table 2-
1), the results indicate that :
1- the cylinder size R, the dimensionless weir height D/R and the presence of an upstream ramp has no
effect on the discharge coefficient;
2- the type of inflow conditions is extremely important and affects substantially the discharge coefficient;
3- for a given ratio head on crest to curvature radius, the largest discharge coefficients are observed for
inflow conditions with an upstream undular hydraulic jump and the smallest CD are obtained for inflow
conditions with an upstream (normal) hydraulic jump;

4-9
4- for a given ratio head on crest to curvature radius, experiments with fully-developed inflow conditions
exhibit a larger discharge coefficient than for partially-developed inflow conditions and this trend can be
predicted analytically.
Fig. 4-4 - Effects of the inflow conditions on the discharge coefficient : fully-developed inflow (series
QIIA), upstream undular hydraulic jump (series QIIB), upstream hydraulic jump (series QIIIB)
Experiments series QIIA, QIIB and QIIIB, cylinder 2 (R = 0.0524 m)
0.90
1.00
1.10
1.20
1.30
1.40
1.50
1.60
0 0.5 1 1.5 2 2.5 3
Cyl. 2 (Series QIIA) Cyl. 2 (Series QIIB) Cyl. 2 (Series QIIIB)EQ. (4-4) F/D inflow EQ. (4-5) P/D inflow
HW/R
C
Series QIIIB
Series QIIA
Series QIIB
Data with HJ immediatlyupstream of weir
D

4-10
Fig. 4-5 - Effect of upstream undular hydraulic jump upstream of cylindrical weirs
Discharge coefficient as a function of the dimensionless distance of jump (experiments series QIIB)
1.15
1.20
1.25
1.30
1.35
1.40
40 60 80 100 120 140
HW/D = 0.61HW/D = 0.42HW/D = 0.35HW/D = 0.24
X/D
C
No undular jump limits
1.19
1.25
1.21
Effect of undular jump position on discharge coefficientCylinder 2, Channel QII, Series QIIB
D
Fig. 4-6 - Effect of (normal) hydraulic jump upstream of cylindrical weirs
Discharge coefficient as a function of the dimensionless distance of jump (experiments series QIIIB)
1.10
1.20
1.30
1.40
1.50
1.60
0 5 10 15 20 25 30
HW/D = 0.8HW/D = 0.93HW/D = 1.0HW/D = 1.15HW/D = 1.3HW/D = 1.5
X/D
CData with HJ immediatlyupstream of weir
Effect of upstream hydraulic jumpCylinder 2, Channel QIII, Series QIIIB
No HJ data
1.4
D

5-1
5. Other experimental results
5.1 Flow depth at weir crest
Introduction
In a rectangular horizontal channel with hydrostatic pressure distribution, the flow depth at critical flow
conditions equals :
dc = 3 qw
2
g (5-1)
dc is commonly called the critical flow depth.
At the crest of a cylindrical weir, critical flow might occur but the streamlines are curved and the pressure
distribution is not hydrostatic. In fact the streamline curvature implies that the pressure gradient is less
than hydrostatic. Further the velocity distribution is rapidly varied. For all these reasons, the flow depth at
the crest of circular cylindrical weirs is expected to differ from equation (5-1).
Experimental results
Careful measurements were performed to record the flow depth at the weir crest during the experiments
QI, QII and QIII. Typical results are presented on figures 5-1 and 5-2.
Figure 5-1 presents experimental data with fully-developed inflows (series QIIA) and partially-developed
inflows (series QIIIA). The general trend is a decrease of the ratio of the flow depth at crest to critical
depth dc with increasing dimensionless upstream head on crest HW/R, where HW is the head on crest
(eq. (4-3)) and R is the curvature radius of crest.
Further, for HW/R > 0.4, the flow depth at crest is smaller than dc. At large overflows (HW/R > 0.8),
dcrest/dc tends to a mean value of about 0.85. In comparison the ratio dcrest/dc equals 1.13 for a WES
ogee crest (table 6-4). Figure 5-1 might suggest furthermore that dcrest/dc decreases slightly with
increasing cylinder size for a given ratio HW/R.
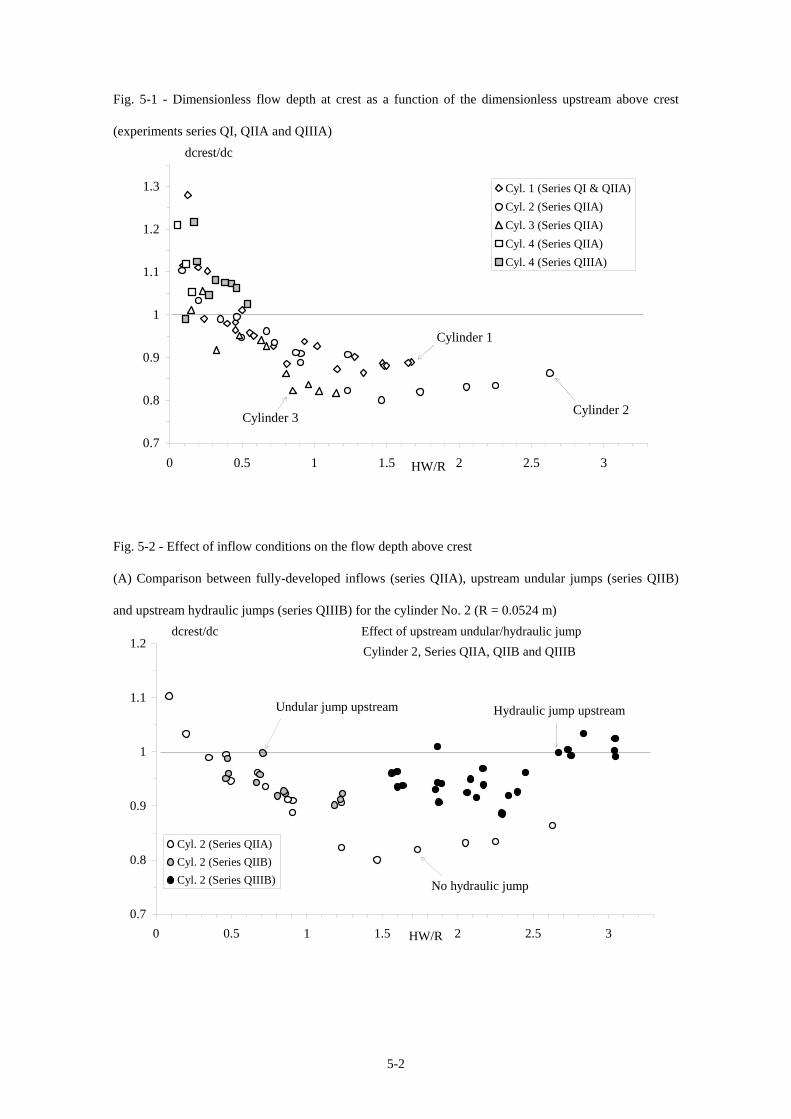
5-2
Fig. 5-1 - Dimensionless flow depth at crest as a function of the dimensionless upstream above crest
(experiments series QI, QIIA and QIIIA)
0.7
0.8
0.9
1
1.1
1.2
1.3
0 0.5 1 1.5 2 2.5 3
Cyl. 1 (Series QI & QIIA)Cyl. 2 (Series QIIA)Cyl. 3 (Series QIIA)Cyl. 4 (Series QIIA)Cyl. 4 (Series QIIIA)
HW/R
dcrest/dc
Cylinder 1
Cylinder 2Cylinder 3
Fig. 5-2 - Effect of inflow conditions on the flow depth above crest
(A) Comparison between fully-developed inflows (series QIIA), upstream undular jumps (series QIIB)
and upstream hydraulic jumps (series QIIIB) for the cylinder No. 2 (R = 0.0524 m)
0.7
0.8
0.9
1
1.1
1.2
0 0.5 1 1.5 2 2.5 3
Cyl. 2 (Series QIIA)Cyl. 2 (Series QIIB)Cyl. 2 (Series QIIIB)
HW/R
dcrest/dc
Undular jump upstream
No hydraulic jump
Hydraulic jump upstream
Effect of upstream undular/hydraulic jumpCylinder 2, Series QIIA, QIIB and QIIIB

5-3
Fig. 5-2 - Effect of inflow conditions on the flow depth above crest
(B) Comparison between fully-developed inflows (series QIIA) and upstream undular jumps (series
QIIB) for the cylinder No. 1 (R = 0.04325 m)
0.8
0.9
1
1.1
1.2
1.3
0 0.5 1 1.5 2 2.5 3
Cyl. 1 (Series QI & QIIA)Cyl. 1 (Series QIIB)
HW/R
dcrest/dc
No hydraulic jump
Undular jump upstream
Effect of upstream undular jumpCylinder 1, Series QI, QIIA and QIIB
Figure 5-2 shows the effect of different types of inflow conditions : fully-developed inflow (series QI and
QIIA), upstream undular hydraulic jump (series QIIB) and upstream (normal) hydraulic jump (series
QIIIB). The data suggest that the presence of an undular hydraulic jump upstream of a circular weir has
little effect on the flow depth at crest (fig. 5-2A and 5-2B). In presence of an upstream (breaking)
hydraulic jump, the flow depth at crest tends to be greater than without hydraulic jump, for a given
upstream head above crest and discharge (fig. 5-2A).
Note that, in presence of an upstream hydraulic jump (data series QIIIB), a careful analysis of the data
showed no consistent trend between the jump location and the flow depth at crest.
Discussion
For a given weir geometry (D, R), the upstream flow conditions, the discharge coefficient and the flow
depth at crest are related. Simple analytical developments (app. D) show that :

5-4
- the occurrence of critical flow conditions1 at the crest implies dcrest > dc, and
- for an ideal-fluid flow, the invert velocity at crest VS equals :
VSqw
dcrest
=
32 -
dcrestdc
- 12 *
⎝⎜⎛
⎠⎟⎞dc
d1
2
12 *
⎝⎜⎛
⎠⎟⎞dc
dcrest
2 -
dcR *
⎝⎜⎛
⎠⎟⎞dc
dcrest
(5-1)
where R is the curvature radius of the crest and d1 is the upstream flow depth.
Experimental results (fig. 5-1 and 5-2) indicate that dcrest/dc < 1 for HW/R > 0.4 : i.e., critical flow
conditions do not take place at the crest but they must occur upstream of the crest for HW/R > 0.4.
Further equation (5-1) is meaningful and valid only if : dcrest/dc < 2*R/dc. For the present experiments
(fig. 5-1 and 5-2), such a condition implies that HW/R < 0.8 (see app. D). For larger overflows (HW/R >
0.8), the experimental observations contradict equation (5-1), suggesting that the assumption of ideal-
fluid overflow becomes unacceptable for HW/R > 0.8 and D = 2*R.
5.2 Energy loss
Figure 5-3 presents the dimensionless head loss ∆H/D as a function of the dimensionless head on crest
HW/D, where ∆H = H1 - H2, H1 is the upstream total head and H2 is the downstream total head. H1 and
H2 are calculated using equation (2-1). The results are shown for experiments series QII and QIII, series
Q1 being presented for completeness (see below).
The experimental data indicate a decrease in energy dissipation with increasing head on crest. At very
low overflows (HW/D small), the head loss is nearly equal to the weir height D. For large overflows, the
rate of energy dissipation becomes much smaller.
The data show some large scatter. It must be noted that the calculations of the downstream total head (eq.
(2-1)) are not very accurate. Downstream of the cylinders, the water free-surface was very rough and
sometimes unstable, and the error on the flow depth measurement could be as large as 30%.
Note also that, for experiments series I (symbol (+) on fig. 5-3), the data are based on flow depth
measurements recorded at cross-sections located upstream and immediately downstream of the broad-
1defined as minimum specific energy flow conditions.

5-5
crested weir (fig. 2-1). At low overflows, friction losses on the downstream face of the flat-crested weir
are significant and the total head losses ∆H include the head loss at the cylinder plus the skin friction loss.
Fig. 5-3 - Energy dissipation at circular cylindrical weirs
Dimensionless head loss ∆H/D as a function of the dimensionless head above crest HW/D (series QI,
QIIA, QIIB, QIIIA and QIIIB)
0
0.5
1
1.5
0 0.2 0.4 0.6 0.8 1 1.2 1.4 1.6
Cyl. 1 (Series QI)Cyl. 1 (Series QIIA)Cyl. 1 (Series QIIB)Cyl. 2 (Series QIIA)Cyl. 2 (Series QIIB)Cyl. 2 (Series QIIIB)Cyl. 3 (Series QIIA)Cyl. 4 (Series QIIA)Cyl. 4 (Series QIIIA)
HW/D
∆H/D

6-1
6. Discussion
6.1 Presentation
The performances of circular cylindrical weirs are compared with previous investigations (table 6-1) and
other hydraulic structures (e.g. drop structure, ogee crest) in this section.
6.2 Overflow characteristics : comparison with circular-crested weirs
Past investigations
Several researchers investigated the discharge relationship of cylindrical weirs1 (table 6-1, fig. 6-1). The
results are reported in tables 6-2 and 6-3, and in figures 6-2 and 6-3.
Previous experimental studies showed that the discharge coefficient CD is close to unity (tables 6-2 and
6-3). And CD was primarily a function of the ratio of upstream head to crest radius HW/R, CD increasing
with increasing values of HW/R, where HW is the total head above crest (i.e. HW = H1 - D) and R is the
crest curvature radius.
Two studies (ESCANDE and SANANES 1959, ROUVE and INDLEKOFER 1974) investigated
particularly the effects of both nappe suction and nappe ventilation on the discharge characteristics (table
6-1). Both investigations showed that nappe suction prevented flow separation and lead to higher
discharge coefficients.
Several studies (e.g. SARGINSON 1972, ROUVE and INDLEKOFER 1974) showed that nappe
ventilation facilitated the separation of the flow when the pressure under the nappe became sub-
atmospheric. And, with ventilated nappes, lower discharge coefficients were observed typically for
HW/R > 1.5 to 2.
1also called cylindrical gate, roller weir, roller gate, round-crested weir, circular-crested weir.

6-2
Table 6-1 - Experimental investigations of discharge relationship above round-crested weirs
Reference R D - R H1-D
R Inflow
conditionsComments
(m) (m) (1) (2) (3) (4) (5) (6)
Circular-crested weirs REHBOCK (1929) -- -- -- -- Laboratory experiments. FAWER (1937) 0.0325 0 to
0.3325 0.5 to 3 -- Laboratory experiments. W = 0.303 m. Vertical
upstream slope. Steep downstream slope : 56 degrees. Flume length : 2.5 m.
ESCANDE and SANANES (1959)
Large-scale laboratory experiments. Weirs with suction slots. Upstream face : vertical. Downstream face : 45, 60 degrees.
0.0750 2.025 up to 13.3 -- Model B1 (W = 4 m). Slot width : 0.03 m. 0.0375 1.0125 up to 13.3 -- Model B2 (W = 1 m). Slot width : 0.018 m. 0.0750 1.1750 up to 6.7 -- Model B3 (W = 0.5 m). Slot width : 0.015 m. 0.0125 0.3375 up to 12 -- Model B4 (W = 0.1 m). Slot width : 0.0015 m. MATTHEW (1963) Laboratory experiments. 0.0254 -- 0.1 to 1 -- Vertical upstream face. 0.0254 -- 0.1 to 1 -- Upstream face with 45-degree slope. 0.0254 0 0.1 to 1 -- Upstream face with 45-degree slope. D = 0.0254 m.SARGINSON (1972) (d1-D)/R
= Laboratory experiments. Ventilated nappes. Liquids
: water, water + Lissapol N. 0.00315
to 0.0381 -- 0.2 to 10 -- Small-scale experiments.
0.03 to 0.068
-- 0.2 to 3 F/D Large-scale experiments. Flume length : 20-m.
ROUVE and INDLEKOFER (1974)
0.0102 to 0.148
0.21 to 0.96
0.1 to 4.5 -- Laboratory experiments (W = 0.599 m). Semi-circular crest. Upstream and downstream slopes : vertical. Ventilated nappes, non-ventilated nappes (with and without nappe separation) and nappe suction.
VO (1992) 0.0095 to 0.1516
1.01 to 1.07
0.33 to 18 P/D Laboratory experiments (W = 0.254 m). Circular crests. Upstream slope : 90, 85, 75, 60 degrees. Downstream slope : 45, 60, 75 degrees, and no slope (ventilated).
Notes : D : weir height; R : circular crest radius; (--) : information not available;
Inflow conditions : P/D = partially-developed inflow; F/D : fully-developed inflow.

6-3
Fig. 6-1 - Sketch of experiments with round-crested weirs

6-4
Table 6-2 - Empirical formulae of discharge coefficients above circular-crested weirs (laboratory studies
and theoretical results)
Reference CD Comments
(1) (2) (3) REHBOCK (1929)
0.552 + 0.177 * 30 - ⎝⎛
⎠⎞
5 - H1-zdam
R
2
As given in SARGINSON (1972).
FAWER (1937) 1 + 0.221*
H1-zdamR - 0.0260*⎝
⎛⎠⎞H1-zdam
R
2
Model data.
JAEGER (1956) 32 *
⎝⎜⎛
⎠⎟⎞R
H1-zdam +
43 -
⎝⎛
⎠⎞R
H1-zdam
2 +
43 *
RH1-zdam
Theoretical result validated with model data.
MATTHEW (1963) 1 + 0.230*
H1-zdamR - 0.010*⎝
⎛⎠⎞H1-zdam
R
2
- 0.0154*R
H1-zdam
Vertical upstream face.
1 + 0.240*
H1-zdamR - 0.028*⎝
⎛⎠⎞H1-zdam
R
2
- 0.0184*R
H1-zdam
Upstream face with 45-degree slope.
1 + 0.240*
H1-zdamR - 0.026*⎝
⎛⎠⎞H1-zdam
R
2 - 0.0181*
RH1-zdam
Upstream face with 45-degree slope. D = 0.0254 m.
MONTES (1964) 1.169 * ⎝
⎛⎠⎞H1-zdam
R
1/8
Re-analysis of data. 0.05 < (H1-zdam)/R < 1.2
SARGINSON (1972)
0.702 + 0.145* 33 - ⎝⎛
⎠⎞5.5 -
H1-zdamR
2
- 3.146*σ
ρw*g*(H1-zdam)*⎝⎜⎛
⎠⎟⎞
1 - ⎝⎛
⎠⎞1 + 1.2*
H1-zdamR
-4/9
+ 0.160*H1-zdam
D
for 0.034 < σ < 0.059 N/m and (H1-zdam)/R < 2 to 4
ROUVE and INDLEKOFER (1974)
Semicircular crest with ventilated nappe.
0.94440 + 0.35497*
H1-zdamR - 0.10791*⎝
⎛⎠⎞H1-zdam
R
2
+ 0.010309 * ⎝⎛
⎠⎞H1-zdam
R
3
for H1-zdam
R < 4.0
1.299 for
H1-zdamR > 4.0

6-5
Table 6-3 - Experimental data of discharge coefficients above circular-crested weirs (prototype spillway
models)
Reference CD Comments
(1) (2) (3) Circular-crested weirs (Prototype models)
Ref. : FAWER (1937)
Castillon dam (France) CD = 1.372 for (H1-zdam)/R = 2.18 Dantzig (Germany) CD = 1.252 for (H1-zdam)/R = 1.54
Darmstadt (Germany) CD = 1.447 for (H1-zdam)/R = 1.75 Pinet dam (France) CD = 1.304 for (H1-zdam)/R = 1.56
Puechabon (France) CD = 1.3486 for (H1-zdam)/R = 3.0
Note : re-analysis by the authors.
Table 6-4 - Overflow characteristics of ogee-shaped crest design
Ogee shape HW/R CD dcrest/dc Conditions Remarks
(1) (2) (3) (4) (5) BAZIN 1.035 Sharp-crested weir experiments
used by CREAGER to develop his ogee-crest 'Creager' profile.
Creager profile 1.11 Vertical upstream face 1.086 45° upstream face WES profile Ref. HDC-111-11, test ES-801. 2 1.3 1.1325 HW/D >> 1 2 1.137 HW/D = 4 2 1.1745 HW/D = 2 2 1.212 HW/D = 1
Notes : data at design flow conditions; D : dam height; R : crest curvature radius.
Ref.: CREAGER (1917), US Army Corps of Engineers (1995).
Comparison between past and present investigations : the discharge coefficient
Figure 6-2 compares previous experimental investigations and the present set of results. On figure 6-2 re-
analysed data from VO (1992) are shown for a ventilated nappe and no downstream slope.

6-6
Firstly figure 6-2 indicates a close agreement between past and present results. And all the data exhibit
the same trend : i.e., the discharge coefficient increases with increasing dimensionless head on crest, and
CD is larger than unity except for very low overflows (HW/R < 0.2 to 0.4).
It is worth mentioning that VO (1992) observed a maximum discharge coefficient for HW/R ~ 5 and, for
larger ratios HW/R, CD decreased and tended to sharp-crested weir values.
Note also that there is little information on the inflow conditions of past investigations (table 6-1).
Interestingly one set of data (SARGINSON 1972) was obtained with weirs placed at the end of a 20-m
long channel and the inflow conditions were fully-developed as checked by the writers. Figure 6-2
indicates a close agreement between SARGINSON's results and the present results for fully-developed
inflow conditions (eq. (4-4)).
Comparison between past and present investigations : the flow depth at crest
Figure 6-3 presents experimental measurements of the flow depth at the crest : i.e., at the location where
the crest is tangent to the channel bed. Circular weir data include past observations (table 6-1) and the re-
analysis of the data of VO (1992) (for 0.038 < R < 0.162 m). These are compared with the present set of
data (experiments series QIIA). On the same figure, the flow depth at the crest of a WES ogee shaped
weir is shown (for design flow conditions) (table 6-4).
The results (fig. 6-3) show :
- a similar trend between the authors' work and the re-analysis of VO's (1992) experiments, and
- some significant differences between the new set of data and some ancient investigations.
Discussion
It is worth noting that, although VO's (1992) data were obtained with partially-developed inflow
conditions, his measurements show the same trend as the authors' data (fig. 6-2 and 6-3).
Further the data of both VO and the authors indicate clearly that the ratio dcrest/dc is less than unity for
HW/R > 0.5. If dcrest < dc, simple analytical developments show that critical flow conditions (i.e.
minimum specific energy) must take place upstream of the weir crest and the flow is supercritical at the
crest (app. D).

6-7
Fig. 6-2 - Experimental observations of discharge coefficients above circular-crested weirs (tables 6-1, 6-
2 and 6-3) - Comparison with new circular cylindrical weir data : experiments series T1 (eq. (4-4) and (4-
5)) and series QIIA (cylinders 1, 2, 3 and 4)
0.8
1
1.2
1.4
0 1 2 3
REHBOCKFAWERJAEGERMATTHEW (vertical face)MATTHEW (45-deg. face)MONTESROUVESARGINSONPrototype models (circular crest)Present study (Series QIIA)Present study EQ. (4-4) F/DPresent study EQ. (4-5) P/DVO (1992)
C
HW/R
D
Fig. 6-3 - Experimental observations of crest flow depth on circular-crested weirs (table 6-1) and ogee
crest weir (table 6-4) - Comparison with circular cylindrical weir data (experiments series QIIA, cylinders
1, 2, 3 and 4)
0.7
0.8
0.9
1
1.1
1.2
1.3
0 1 2 3
ROUVEFAWERJAEGERVO (ventilated)Present study (Series QIIA)WES ogee shape
HW/R
dcrest/dc

6-8
Note furthermore that the ratio dcrest/dc is nearly constant for HW/R > 1. The authors obtained :
dcrest/dc ~ 0.85 while the re-analysis of VO's data indicates : dcrest/dc ~ 0.95 for HW/R > 1. The
different values might be accounted for the difference of inflow conditions
6.3 Energy loss : comparison with drop structures
The head loss at a circular cylindrical weir may be compared with the energy loss at a drop structure of
same height (fig. 6-4). Several researchers investigated experimentally the flow properties at drop
structures. One author (CHANSON 1995c, pp. 230-236) presented a detailed bibliographic review. Based
on the experimental results of RAND (1955) (valid for 0.045 < dc/D < 1), he showed that the
dimensionless head loss at a drop structure can be estimated as :
∆HH1
= 1 -
⎝⎜⎜⎛
⎠⎟⎟⎞0.54 * ⎝
⎛⎠⎞dc
D
0.275 + 1.71 * ⎝
⎛⎠⎞dc
D
-0.55
1.5 + Ddc
(6-1)
where ∆H = H1 - H2, H1 is the upstream total head (fig. 6-4), D is the drop height and dc is the critical
flow depth.
Equation (6-1) is shown on figure 6-5 and it is compared with the present set of data (series QI, QII and
QIII). The results indicate basically that the dimensionless head loss is smaller for a circular cylindrical
weir than for a drop structure of same height and for a given head on crest.
Note that, at large overflows, the tailwater free-surface was very disturbed and the present set of data is
not accurate.

6-9
Fig. 6-4 - Sketch of a drop structure
d c
critical flowcon ditions
recirculatoryflow mo tion
d2D
Total Head Lin e
DATUM
H1
H2
Fig. 6-5 - Head loss ∆H/dc as a function of the dimensionless head on crest HW/D - Comparison between
circular cylindrical weir data (series QI, QIIA, QIIB, QIIIA and QIIIB) and drop structure results (eq. (6-
1))
0.1
1
10
100
0.01 0.1 1 10
Cyl. 1 (series QI)
Cyl. 1 (series QIIA)
Cyl. 1 (series QIIB)
Cyl. 2 (series QIIA)
Cyl. 2 (series QIIB)
Cyl. 2 (series QIIIB)
Cyl. 3 (series QIIA)
Cyl. 4 (series QIIA)
Cyl. 4 (series QIIIA)
Drop structure (EQ. (6-1))HW/D
∆H/dc Comparison with drop structure

6-10
Fig. 6-6 - Sketch of flow separation at circular weirs
H1d1
Rsepφ
z
6.4 Nappe adherence and nappe separation
During the present study, nappe adherence on the downstream weir face was observed in most cases
(section 3). At large overflows, flow separation behind the weir was sometimes observed (fig. 6-6).
Past observations of circular weir overflows (table 6-4) indicated that the discharge coefficient becomes
lower when nappe separation takes place at or upstream of the crest. It is therefore important to predict
the flow conditions at nappe separation. Experimental results are summarised in table 6-5 and might be
used as general guidelines.
With suction slots on the weir crest, ESCANDE and SANANES (1959) showed that the conditions for
nappe separation depended on the suction discharge (i.e. water discharge in suction slot).

6-11
Table 6-5 - Experimental observations of nappe separation at circular-crested weirs
Reference Location of nappe separation
φsep (deg.) Flow conditions Remarks
(1) (2) (3) (4) ESCANDE and SANANES (1959)
Sucked nappes. Downstream slope : 45 deg..
φsep ~ 45 H1-zdamR = 5.2
Model B2.
φsep ~ 45 H1-zdamR = 2.2
Model B3.
SARGINSON (1972) φsep = 0 d1-zdamR = 2
3 < R < 38 mm. Ventilated nappes.
φsep < 0 d1-zdamR > 2
φsep = 0 d1-zdamR = 4
30 < R < 68 mm. Ventilated nappes.
φsep < 0 d1-zdamR > 4
RAMAMURTHY and VO (1993) φsep = 155 * ⎝
⎛⎠⎞H1-zdam
R
-0.28 - 90 1 <
H1-zdamR < 5
Upstream slope : vertical. No downstream slope. Ventilated flow.
φsep = 0 H1-zdamR = 5
Upstream slope : vertical. Downstream slope : 45 deg..
φsep < 0 H1-zdamR > 5
Notes : φsep : angular location of nappe separation in degrees (fig. 6-6).
φsep = 0 : nappe separation at crest; φsep > 0 : separation on the downstream face of crest invert.

7-1
7. Conclusion
The discharge characteristics of cylindrical weirs have been investigated in laboratory for a wide range of
flow conditions and configurations : i.e., eight cylinder sizes, several weir heights (2 < D/R < 9), and
several types of inflow conditions : fully-developed, partially-developed, upstream ramp, upstream
hydraulic jump, upstream undular hydraulic jump.
Experimental observations indicate that the overflow is characterised by nappe adherence on the
downstream cylinder face at low to medium overflows, and a rapid flow redistribution upstream of the
cylindrical weir. The flow properties are significantly affected by the upstream flow conditions, and
comparison with previous studies is difficult as most past investigations did not record the upstream flow
conditions nor consider their effects.
For the range of the experiments (table 2-1), the main findings are :
1- the cylinder size (i.e. radius of curvature R) has no effect on the discharge coefficient, dimensionless
flow depth at crest and dimensionless rate of energy dissipation;
2- the dimensionless weir height D/R has no effect on the discharge coefficient;
3- the presence of an upstream ramp has no effect on the discharge coefficient;
4- the upstream flow conditions are extremely important and the type of inflow conditions affects
substantially the overflow characteristics;
5- for a given ratio head on crest to curvature radius, the largest discharge coefficient is observed for
inflow conditions with an upstream undular hydraulic jump and the smallest CD is obtained for inflow
conditions with an upstream (normal) hydraulic jump; discharge coefficients for partially- and fully-
developed inflows are in between the extremes;
6- for a given ratio head on crest to curvature radius, experiments with fully-developed inflow conditions
exhibit a larger discharge coefficient that for partially-developed inflow conditions; this behaviour can be
predicted analytically (app. C);
7- the flow depth at the weir crest is usually lower than the critical depth (in rectangular channels) but for
very low discharges; for medium to large overflows (HW/R > 0.4), critical flow conditions take place
upstream of the weir crest (app. D); for large overflows (HW/R > 0.8), dcrest/dc is typically about 0.85.
8- energy dissipation is substantial.

8-1
8. Acknowledgements
The authors want to thank M. BUTTERWORTH and R. O'GRADY (University of Tasmania), and R.
McCONAGHY and A. SWINCER (University of Queensland) for their help and assistance.
The authors thank Professor A.S. RAMAMURTHY (Concordia University, Canada) for providing the
original data of his former Ph.D. student (VO 1992).

R-1
References
ANWAR, H.O. (1967). "Inflatable dams." Jl of Hyd. Div., ASCE, Vol. 93, No. HY3, pp. 99-119.
BAZIN, H. (1865). "Recherches Expérimentales sur l'Ecoulement de l'Eau dans les Canaux Découverts."
('Experimental Research on Water Flow in Open Channels.') Mémoires présentés par divers savants à
l'Académie des Sciences, Paris, France, Vol. 19, pp. 1-494 (in French).
BAZIN, H. (1888-1898). "Expériences Nouvelles sur l'Ecoulement par Déversoir." ('Recent Experiments
on the Flow of Water over Weirs.') Mémoires et Documents, Annales des Ponts et Chaussées, Paris,
France, 1888 : Sér. 6, Vol. 16, 2nd Sem., pp. 393-448; 1890 : Sér. 6, Vol. 19, 1st Sem., pp. 9-82; 1891
: Sér. 7, Vol. 2, 2nd Sem., pp. 445-520; 1894 : Sér. 7, Vol. 7, 1st Sem., pp. 249-357; 1896 : Sér. 7,
Vol. 12, 2nd Sem., pp. 645-731; 1898 : Sér. 7, Vol. 15, 2nd Sem., pp. 151-264 (in French).
BELANGER, J.B. (1828). "Essai sur la Solution Numérique de quelques Problèmes Relatifs au
Mouvement Permanent des Eaux Courantes." ('Essay on the Numerical Solution of Some Problems
relative to Steady Flow of Water.') Carilian-Goeury, Paris, France (in French).
BRESSE, J.A. (1860). "Cours de Mécanique Appliquée Professé à l'Ecole des Ponts et Chaussées."
('Course in Applied Mechanics lectured at the Pont-et-Chaussées Engineering School.') Mallet-
Bachelier, Paris, France (in French).
CHANSON, H. (1995a). "Flow Characteristics of Undular Hydraulic Jumps. Comparison with Near-
Critical Flows." Report CH45/95, Dept. of Civil Engineering, University of Queensland, Australia,
June, 202 pages (ISBN 0 86776 612 3).
CHANSON, H. (1995b). "Air Bubble Entrainment in Free-surface Turbulent Flows. Experimental
Investigations." Report CH46/95, Dept. of Civil Engineering, University of Queensland, Australia,
June, 368 pages (ISBN 0 86776 611 5).
CHANSON, H. (1995c). "Hydraulic Design of Stepped Cascades, Channels, Weirs and Spillways."
Pergamon, Oxford, UK, Jan., 292 pages (ISBN 0-08-041918-6).
CHANSON, H. (1996). "Some Hydraulic Aspects during Overflow above Inflatable Flexible Membrane
Dam." Report CH47/96, Dept. of Civil Engineering, University of Queensland, Australia, May, 60
pages (ISBN 0 86776 644 1).
CHANSON, H., and MONTES, J.S. (1995). "Characteristics of Undular Hydraulic Jumps. Experimental
Apparatus and Flow Patterns." Jl of Hyd. Engrg., ASCE, Vol. 121, No. 2, pp. 129-144.

R-2
CHANSON, H., and QIAO, G.L. (1994). "Air Bubble Entrainment and Gas Transfer at Hydraulic
Jumps." Research Report No. CE149, Dept. of Civil Engineering, University of Queensland,
Australia, Aug., 68 pages (ISBN 0 86776 5828).
CHOW, V.T. (1973). "Open Channel Hydraulics." McGraw-Hill International, New York, USA.
COANDA, H. (1932). "Procédé de Propulsion dans un Fluide." ('Propulsion Process in a Fluid') Brevet
Invent. Gr. Cl. 2, No. 762688, France (in French).
CREAGER, W.P. (1917). "Engineering of Masonry Dams." John Wiley & Sons, New York, USA.
DUPUIT, A.J.E. (1848). "Etudes Théoriques et Pratiques sur le Mouvement des Eaux Courantes."
('Theoretical and Practical Studies on Flow of Water.') Dunod, Paris, France (in French).
ESCANDE, L., and SANANES, F. (1959). "Etudes des Seuils Déversants à Fente Aspiratrice." ('Weirs
with Suction Slots.') Jl La Houille Blanche, Dec., No. Special B, pp. 892-902 (in French).
FAWER, C. (1937). "Etude de Quelques Ecoulements Permanents à Filets Courbes." ('Study of some
Steady Flows with Curved Streamlines.') Thesis, Lausanne, Switzerland, Imprimerie La Concorde,
127 pages (in French).
ISAACS, L.T. (1981). "Effects of Laminar Boundary Layer on a Model Broad-Crested Weir." Research
Report No. CE28, Dept. of Civil Eng., Univ. of Queensland, Brisbane, Australia, 20 pages.
ISAACS, L.T., and MACINTOSH, J.C. (1988). "Boundary Shear Stress Measurement in Open
Channels." Research Report No. CE85, Dept. of Civil Eng., Univ. of Queensland, Brisbane, Australia,
57 pages.
JAEGER, C. (1956). "Engineering Fluid Mechanics." Blackie & Son, Glascow, UK, 529 pages.
LINDQUIST, E.G.W. (1929). "Precise Weir Measurements - Discussion." Transactions, ASCE, Vol. 93,
pp. 1163-1176.
MATTHEW, G.D. (1963). "On the Influence of Curvature, Surface Tension and Viscosity on Flow over
Round-Crested Weirs." Proc. Instn. Civil. Engrs., London, Vol. 25, pp. 511-524. Discussion : 1964,
Vol. 28, pp. 557-569.
MONTES, J.S. (1964). "On the Influence of Curvature, Surface Tension and Viscosity on Flow over
Round-Crested Weirs. Discussion." Proc. Instn. Civil. Engrs., London, Vol. 28, pp. 562-563.
PETRIKAT, K. (1958). "Vibration Tests on Weirs and Bottom Gates." Water Power, Vol. 10, pp. 52-57,
pp. 99-104, pp. 147-149 & pp. 190-197.

R-3
PETRIKAT, K. (1978). "Model Tests on Weirs, Bottom Outlet Gates, Lock Gates and Harbours Moles."
M.A.N. Technical Bulletin, Nurnberg, Germany.
RAMAMURTHY, A.S., and VO, N.D. (1993). "Characteristics of Circular-Crested Weir." Jl of Hyd.
Engrg., ASCE, Vol. 119, No. 9, pp. 1055-1062.
RAMAMURTHY, A.S., VO, N.D., and BALACHANDAR, R. (1994). "A Note on Irrotational
Curvilinear Flow Past a Weir." Jl of Fluids Eng., Trans. ASME, Vol. 116, June, pp. 378-381.
RAND, W. (1955). "Flow Geometry at Straight Drop Spillways." Proceedings, ASCE, Vol. 81, No. 791,
Sept., pp. 1-13.
REHBOCK, T. (1929). "The River Hydraulic Laboratory of the Technical University of Karlsruhe." in
Hydraulic Laboratory Practice, ASME, New York, USA, pp. 111-242.
ROUVE, G., and INDLEKOFER, H. (1974). "Abfluss über geradlinige Wehre mit halbkreissförmigem
Überfallprofil." ('Discharge over Straight Weirs with Semicylindrical Crest.') Der Bauingenieur, Vol.
49, No. 7, pp. 250-256 (in German).
SARGINSON, E.J. (1972). "The Influence of Surface Tension on Weir Flow." Jl of Hyd. Res., IAHR,
Vol. 10, No. 4, pp. 431-446.
SCHODER, E.W., and TURNER, K.B. (1929). "Precise Weir Measurements." Transactions, ASCE, Vol.
93, pp. 999-1110. Discussion : Vol. 93, pp. 1111-1190.
SCIMEMI, E. (1930). "Sulla Forma delle Vene Tracimanti." ('The form of Flow over Weirs.') L'Energia
Elettrica, Milano, Vol. 7, No. 4, p. 293-305 (in Italian).
US Army Corps of Engineers (1995). "Hydraulic Design of Spillways." ASCE Press, New York USA,
120 pages.
VO, N.D. (1992). "Characteristics of Curvilinear Flow Past Circular-Crested Weirs." Ph.D. thesis,
Concordia Univ., Canada.
VON MISES, R. (1917). "Berechnung von Ausfluss und Uberfallzahlen." Z. ver. Deuts. Ing., Vol. 61, p.
447 (in German).
WEGMANN, E. (1922). "The Design and Construction of Dams." John Wiley & Sons, New York, USA,
7th edition.

A-1
Appendix A
EXPERIMENTAL CONFIGURATIONS
A.1 Presentation
Experiments were performed at the University of Tasmania (in 1991 and 1992) and at the University of
Queensland (in 1996). Altogether four different channels and eight cylinder sizes were used to test
extensively a wide range of flow conditions.
A.2 Experimental characteristics
A.2.1 Experimental channels
Experiments were performed in four laboratory channels. One flume (channel T1) is located in the
Hydraulics Laboratory at the University of Tasmania. Three flumes (channels QI, QII and QIII) are
located in the Hydraulics/Fluid Mechanics Laboratory at the University of Queensland. The
characteristics of each channel and a dimensioned sketch are presented in table A-1 and figure A-1
respectively.
A.2.2 Cylindrical weirs
Experiments at the University of Tasmania used four cylinders made of PVC pipe (cylinders A, B, C, and
D). The cylinders were supported by a vertical perspex support (10-mm thick). The PVC cylinders were
slitted and slided over the perspex plate. Note that the largest pipes were slightly flexible and hence the
reference radius was taken as the curvature radius at the crest.
At the University of Queensland, four hollow concrete cylinders were used (cylinders 1, 2, 3 and 4). The
cylinders were stiff and rigid, and their diameters were accurately measured +/- 0.4 mm. Note that the
concrete cylinders were made with a small groove (to insert a strip roughness element at later stages).
The main cylinder dimensions are listed in table A-2.
A.2.3 Experimental flow conditions
Table A-3 summarises the various experimental flow conditions which were investigated.

A-2
Basically, experiments series T1A and T1B investigated the discharge characteristics of cylindrical weirs
with various support heights. Experiments series T1A and T1B were performed independently in 1991
and 1992 respectively. Experiments T1C extended the results to include the effects of a 30-degree
upstream ramp. Experiments T1C were performed at the same period as experiments series T1B.
Experiments series QI investigated the overflow characteristics of a cylinder placed at the top of broad-
crested weir. Experiments series QII were performed with fully-developed inflow conditions (series
QIIA) and with an upstream undular hydraulic jump (series QIIB). Experiments series QIIIA investigated
the overflow characteristics of the largest cylinder (cylinder 4) in a horizontal channel while experiments
series QIIIB investigated the effects of normal hydraulic jump upstream of a cylindrical weir.
Experiments series QI, QII and QIII were performed during the same period.
Table A-1 - Characteristics of the experimental channels
Characteristics Channel T1 Channel QI Channel QII Channel QIII
(1) (2) (3) (4) Location : University of
Tasmania University of Queensland
University of Queensland
University of Queensland
Length (m) : 12 3.05 20 3.2 Width (m) : 0.301 0.25 0.25 0.25 Slope (degrees) : 0 0 0 to 5 0 Sidewall height (m) : 0.50 0.18 0.255 0.30 Construction material
Bottom : perspex glass glass glass Sidewalls : perspex glass glass glass
Intake geometry : Smooth convergent section
Smooth convergent section
Smooth convergent section
Sluice gate (0.25-m wide)

A-3
Table A-2 - Dimensions of the circular cylinders
Cylinder No. Major diameter Minor diameter Reference diameter
D Reference radius
R (m) (m) (m) (m)
(1) (2) (3) (4) (5)
A (1) 0.154 0.150 -- 0.07905 (+) B (1) 0.129 0.124 -- 0.0671 (+) C (1) 0.111 0.108 -- 0.05704 (+) D (1) 0.058 0.058 -- 0.0290 (+)
1 (2) 0.0837 (a) 0.0833 (b) 0.0835 0.04175
2 (2) 0.10475 (a) 0.10475 (b) 0.10475 0.052375
3 (2) 0.15125 (b) 0.15050 (a) 0.150875 0.0754375
4 (2) 0.2350 (b) 0.23130 (a) 0.23315 0.116575
Notes :
(1) : cylinders made of PVC pipes
(2) : cylinders built in concrete with a hollow core and a rectangular groove to install deflectors
(a) : diameter (measured at groove axis)
(b) : diameter (measured 90-degree to groove axis)
(+) : curvature radius at crest
Table A-3 - Summary of the experimental flow conditions
Experiments Channel Upstream flow conditions Comments
(1) (2) (3) (4) Series T1A channel T1 Cylindrical weirs with various
support heights Horizontal channel flow
Cylinder centreline location : xdam = 8 m.
Series T1B channel T1 Cylindrical weirs with various support heights
Horizontal channel flow
Cylinder centreline location : xdam = 8 m.
Series T1C channel T1 Effect of upstream ramp Horizontal channel flow
Cylinder centreline location : xdam = 8 m. 30-degree upstream ramp.
Series QI channel QI Cylinders placed at the top of a broad-crested weir
Cylinder centreline location : xdam = 1.2 m.
Series QIIA channel QII Fully-developed inflow conditions
Mild slope : α = 0.191 degrees. Cylinder centreline location : xdam = 11 m.
Series QIIB channel QII Undular hydraulic jump upstream of cylinder
Steep slope : α up to 0.97 degrees. Cylinder centreline location : xdam = 11 m.
Series QIIIA channel QIII Horizontal channel flow Cylinder centreline location : xdam = 2.55 m. Series QIIIB channel QIII Hydraulic jump upstream of
cylinder Sluice gate opening : 0.02 to 0.08 m. Cylinder centreline location : xdam = 2.55 m.

A-4
Fig. A-1 - Dimensioned sketch of the experiments
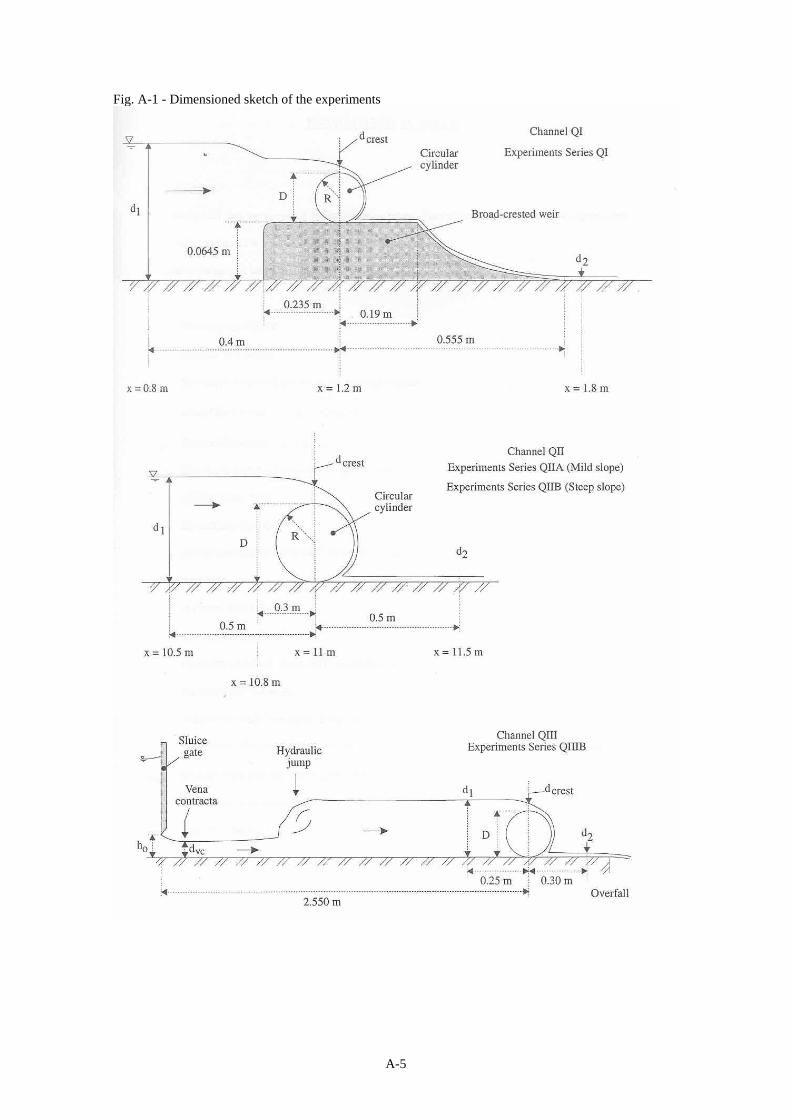
A-5
Fig. A-1 - Dimensioned sketch of the experiments

B-1
Appendix B
EXPERIMENTAL DATA
B.1 Presentation
The experimental data are presented in the following tables. They are regrouped by series of experiments
(as defined in appendix A).
The notation is defined below and illustrated in figure A-1 :
CD discharge coefficient
D cylinder weir height
d flow depth measured normal to the channel bottom;
dc critical flow depth : i.e, dc = 3
qw2/g
dcrest flow depth measured at cylinder crest
djump flow depth measured immediately upstream of hydraulic jump
d1 upstream flow depth
d2 downstream flow depth
g gravity constant (g = 9.80 m/s2 in Brisbane, Australia)
H total head
H1 upstream total head
H2 downstream total head
HW Upstream total head above weir crest elevation : HW = H1 - zdam
qw discharge per unit width
R radius of cylinder (reference radius, appendix A, table A-2)
X longitudinal distance between the jump front and the cylinder centreline (X = xdam - xjump)
xdam distance from channel intake to the cylindrical weir centreline
xjump distance from channel intake to hydraulic jump front
zdam dam crest elevation
α channel slope

B-2
∆H total head loss between the upstream and downstream locations : ∆H = H1 - H2

B-3
Table B-1 - Experimental data - Experiments series T1A and T1B
Ref. qw α R D d1 HW
R CD Support Type
m2/s deg. m m m (1) (2) (3) (4) (5) (6) (7) (8) (9)
Series T1A Cylinder D
TA91-1 0.0083 0 0.029 0.154 0.1806 0.921 1.11 Vertical 0.0090 0.1820 0.970 1.12 0.0098 0.1836 1.026 1.12 0.0119 0.1872 1.152 1.15 0.0149 0.1918 1.314 1.17 0.0153 0.1920 1.321 1.19 0.0181 0.1962 1.470 1.21 0.0211 0.2002 1.613 1.23 0.0238 0.2034 1.727 1.24 0.0240 0.2034 1.728 1.26 0.0263 0.2062 1.829 1.26 0.0278 0.2078 1.887 1.27 0.0316 0.2120 2.039 1.29 0.0324 0.2128 2.068 1.29 0.0339 0.2142 2.120 1.30 0.0408 0.2218 2.398 1.31 0.0429 0.2240 2.478 1.31 0.0458 0.2268 2.582 1.31 0.0486 0.2294 2.679 1.32 0.0513 0.2320 2.776 1.32 0.0540 0.2342 2.859 1.33 0.0624 0.2420 3.152 1.33
TA91-2 0.0007 0 0.029 0.2035 0.2099 0.221 0.78 Vertical 0.0023 0.2163 0.442 0.95 0.0044 0.2223 0.649 1.01 0.0052 0.2239 0.704 1.04 0.0095 0.2329 1.017 1.11 0.0116 0.2361 1.128 1.15 0.0155 0.2421 1.338 1.19 0.0174 0.2449 1.436 1.20 0.0218 0.2505 1.634 1.24 0.0227 0.2517 1.676 1.24 0.0251 0.2545 1.776 1.26 0.0267 0.2571 1.867 1.24 0.0296 0.2599 1.968 1.28 0.0321 0.2627 2.068 1.28 0.0350 0.2655 2.168 1.30 0.0381 0.2687 2.284 1.31 0.0416 0.2721 2.407 1.32 0.0452 0.2753 2.523 1.34 0.0476 0.2775 2.603 1.35 0.0500 0.2795 2.677 1.36 0.0534 0.2827 2.794 1.36 0.0573 0.2863 2.926 1.36 0.0637 0.2919 3.132 1.36 0.0686 0.2961 3.287 1.37 0.0715 0.2985 3.377 1.37
TA91-3 0.0155 0 0.029 0.2535 0.2915 1.315 1.22 Vertical 0.0196 0.2971 1.511 1.26 0.0217 0.2997 1.602 1.27 0.0254 0.3043 1.764 1.29 0.0309 0.3107 1.990 1.31 0.0361 0.3167 2.202 1.31 0.0367 0.3173 2.223 1.31

B-4
Ref. qw α R D d1 HW
R CD Support Type
m2/s deg. m m m (1) (2) (3) (4) (5) (6) (7) (8) (9)
TA91-3 0.0401 0.3205 2.338 1.33 0.0446 0.3251 2.502 1.34 0.0502 0.3297 2.668 1.37 0.0537 0.3339 2.818 1.35 0.0545 0.3347 2.847 1.35 0.0570 0.3373 2.940 1.34 0.0606 0.3413 3.083 1.33 0.0659 0.3427 3.141 1.41
Cylinder C TA91-4 0.0159 0 0.057 0.154 0.1940 0.707 1.15 Vertical
0.0229 0.2042 0.891 1.17 0.0327 0.2150 1.090 1.24 0.0386 0.2224 1.226 1.22 0.0465 0.2304 1.376 1.24 0.0502 0.2340 1.444 1.25 0.0549 0.2378 1.517 1.27 0.0602 0.2428 1.612 1.27 0.0641 0.2460 1.674 1.28 0.0668 0.2478 1.709 1.29 0.0700 0.2504 1.760 1.29 0.0716 0.2518 1.787 1.29 0.0737 0.2538 1.825 1.29 0.0738 0.2554 1.852 1.26
TA91-5 0.0107 0 0.057 0.2035 0.2353 0.559 1.10 Vertical 0.0184 0.2479 0.783 1.15 0.0236 0.2553 0.916 1.16 0.0294 0.2625 1.046 1.18 0.0344 0.2679 1.144 1.21 0.0376 0.2717 1.213 1.21 0.0417 0.2753 1.279 1.24 0.0460 0.2803 1.370 1.23 0.0483 0.2823 1.408 1.25 0.0513 0.2851 1.460 1.25 0.0558 0.2891 1.534 1.27 0.0606 0.2935 1.616 1.27 0.0641 0.2963 1.669 1.28 0.0688 0.3005 1.747 1.28 0.0718 0.3029 1.793 1.29
TA91-6 0.0120 0 0.057 0.2535 0.2891 0.626 1.04 Vertical 0.0186 0.2999 0.817 1.08 0.0245 0.3081 0.963 1.12 0.0293 0.3143 1.074 1.13 0.0336 0.3193 1.163 1.15 0.0404 0.3269 1.300 1.17 0.0465 0.3329 1.409 1.20 0.0509 0.3369 1.483 1.22 0.0539 0.3397 1.534 1.22 0.0568 0.3427 1.588 1.22 0.0622 0.3469 1.666 1.25 0.0669 0.3511 1.744 1.25 0.0706 0.3543 1.803 1.26 0.0740 0.3561 1.837 1.28 0.0764 0.3587 1.885 1.27
Cylinder B TA91-7 0.0092 0 0.067 0.154 0.1834 0.440 1.07 Vertical
0.0184 0.1988 0.674 1.12 0.0231 0.2058 0.782 1.13 0.0304 0.2150 0.924 1.16

B-5
Ref. qw α R D d1 HWR
CD Support Type
m2/s deg. m m m (1) (2) (3) (4) (5) (6) (7) (8) (9)
TA91-7 0.0359 0.2210 1.019 1.18 0.0409 0.2262 1.101 1.20 0.0453 0.2306 1.171 1.21 0.0487 0.2340 1.225 1.21 0.0517 0.2366 1.267 1.22 0.0555 0.2400 1.322 1.23 0.0592 0.2436 1.380 1.23 0.0623 0.2458 1.417 1.25 0.0650 0.2486 1.462 1.24 0.0686 0.2510 1.502 1.26 0.0712 0.2530 1.536 1.26
TA91-8 0.0076 0 0.067 0.2035 0.2291 0.382 1.08 Vertical 0.0121 0.2387 0.527 1.07 0.0168 0.2461 0.638 1.11 0.0216 0.2527 0.739 1.15 0.0257 0.2581 0.821 1.17 0.0295 0.2629 0.895 1.18 0.0332 0.2673 0.963 1.19 0.0370 0.2715 1.028 1.20 0.0400 0.2749 1.080 1.20 0.0445 0.2795 1.152 1.21 0.0472 0.2821 1.193 1.22 0.0508 0.2859 1.252 1.22 0.0580 0.2923 1.353 1.24 0.0625 0.2965 1.420 1.25 0.0688 0.3011 1.494 1.27
TA91-9 0.0093 0 0.067 0.2535 0.2841 0.457 1.01 Vertical 0.0121 0.2901 0.547 1.01 0.0187 0.3005 0.703 1.07 0.0227 0.3063 0.791 1.09 0.0267 0.3117 0.873 1.11 0.0315 0.3175 0.961 1.13 0.0353 0.3223 1.034 1.13 0.0392 0.3269 1.105 1.14 0.0428 0.3303 1.157 1.16 0.0463 0.3335 1.207 1.18 0.0509 0.3377 1.272 1.20 0.0537 0.3413 1.327 1.19 0.0573 0.3443 1.374 1.20 0.0606 0.3477 1.427 1.20 0.0648 0.3515 1.486 1.21
Cylinder A TA91-10 0.0145 0 0.079 0.154 0.1932 0.500 1.09 Vertical
0.0231 0.2060 0.666 1.12 0.0292 0.2140 0.771 1.14 0.0340 0.2198 0.848 1.15 0.0397 0.2260 0.931 1.17 0.0443 0.2308 0.995 1.18 0.0494 0.2358 1.063 1.19 0.0537 0.2398 1.118 1.20 0.0573 0.2430 1.162 1.21 0.0618 0.2468 1.214 1.22 0.0645 0.2490 1.245 1.23 0.0677 0.2512 1.276 1.24 0.0695 0.2532 1.303 1.23 0.0715 0.2546 1.324 1.24 0.0732 0.2560 1.343 1.24
Ref. qw α R D d1 HW
R CD Support Type

B-6
m2/s deg. m m m (1) (2) (3) (4) (5) (6) (7) (8) (9)
TA91-11 0.0164 0 0.079 0.2035 0.2461 0.542 1.09 Vertical 0.0198 0.2507 0.601 1.12 0.0231 0.2559 0.668 1.12 0.0301 0.2651 0.788 1.14 0.0333 0.2687 0.835 1.15 0.0350 0.2709 0.863 1.15 0.0405 0.2771 0.945 1.16 0.0409 0.2773 0.948 1.17 0.0453 0.2823 1.013 1.17 0.0496 0.2873 1.079 1.17 0.0525 0.2889 1.102 1.20 0.0563 0.2921 1.145 1.21 0.0615 0.2971 1.212 1.22 0.0668 0.3009 1.264 1.24 0.0702 0.3039 1.304 1.24
TA91-12 0.0110 0 0.079 0.2535 0.2881 0.439 1.00 Vertical 0.0156 0.2967 0.548 1.02 0.0194 0.3025 0.622 1.04 0.0241 0.3093 0.710 1.06 0.0281 0.3141 0.772 1.09 0.0333 0.3205 0.854 1.11 0.0379 0.3263 0.930 1.12 0.0429 0.3317 1.000 1.13 0.0466 0.3359 1.055 1.14 0.0519 0.3413 1.126 1.15 0.0557 0.3445 1.168 1.16 0.0606 0.3491 1.229 1.18 0.0663 0.3539 1.293 1.19 0.0704 0.3573 1.338 1.20 0.0744 0.3619 1.398 1.19
Ref. qw α R D d1 HW
R CD Support Type
m2/s deg. m m m (1) (2) (3) (4) (5) (6) (7) (8) (9)
Series T1B TB92-1 0.0083 0 0.029 0.154 0.1806 0.920 1.11 Vertical
0.0090 0.1820 0.971 1.12 0.0098 0.1836 1.025 1.13 0.0119 0.1872 1.151 1.15 0.0149 0.1918 1.314 1.17 0.0153 0.1920 1.321 1.20 0.0181 0.1962 1.470 1.21 0.0211 0.2002 1.613 1.23 0.0238 0.2034 1.727 1.24 0.0240 0.2034 1.727 1.26 0.0263 0.2062 1.829 1.26 0.0278 0.2078 1.887 1.27 0.0316 0.2120 2.040 1.29 0.0324 0.2128 2.068 1.29 0.0339 0.2142 2.119 1.31 0.0408 0.2218 2.398 1.31 0.0429 0.2240 2.479 1.31 0.0458 0.2268 2.581 1.31 0.0486 0.2294 2.680 1.32
Ref. qw α R D d1 HW
R CD Support Type
m2/s deg. m m m (1) (2) (3) (4) (5) (6) (7) (8) (9)

B-7
TB92-1 0.0513 0.2320 2.776 1.32 0.0540 0.2342 2.860 1.33 0.0624 0.2420 3.152 1.33
TB92-2 0.0159 0 0.057 0.154 0.1940 0.707 1.15 Vertical 0.0229 0.2042 0.892 1.17 0.0327 0.2150 1.091 1.24 0.0386 0.2225 1.227 1.22 0.0465 0.2304 1.376 1.24 0.0502 0.2340 1.444 1.25 0.0549 0.2378 1.517 1.26 0.0602 0.2428 1.612 1.27 0.0641 0.2460 1.673 1.28 0.0668 0.2478 1.710 1.29 0.0700 0.2504 1.759 1.29 0.0716 0.2518 1.786 1.29 0.0737 0.2538 1.826 1.29 0.0738 0.2554 1.852 1.26
TB92-3 0.0092 0 0.067 0.154 0.1834 0.440 1.07 Vertical 0.0184 0.1988 0.674 1.12 0.0231 0.2058 0.782 1.13 0.0304 0.2150 0.924 1.16 0.0359 0.2210 1.019 1.18 0.0409 0.2262 1.100 1.20 0.0453 0.2306 1.170 1.21 0.0487 0.2339 1.224 1.21 0.0517 0.2366 1.267 1.22 0.0555 0.2400 1.322 1.23 0.0592 0.2436 1.380 1.23 0.0623 0.2457 1.416 1.25 0.0650 0.2486 1.462 1.24 0.0686 0.2510 1.503 1.26 0.0712 0.2530 1.536 1.26
TB92-4 0.0164 0 0.079 0.154 0.1967 0.544 1.08 Vertical 0.0198 0.2011 0.602 1.12 0.0231 0.2064 0.670 1.11 0.0301 0.2156 0.792 1.13 0.0333 0.2191 0.839 1.14 0.0350 0.2215 0.869 1.14 0.0405 0.2276 0.952 1.15 0.0409 0.2278 0.954 1.16 0.0453 0.2328 1.022 1.16 0.0496 0.2378 1.088 1.15 0.0525 0.2387 1.103 1.20 0.0563 0.2426 1.155 1.20 0.0615 0.2476 1.224 1.20 0.0668 0.2513 1.277 1.22 0.0702 0.2544 1.319 1.22
TB92-5 0.0007 0 0.029 0.2035 0.2099 0.221 0.78 Vertical 0.0023 0.2163 0.441 0.95 0.0044 0.2223 0.648 1.01 0.0052 0.2239 0.704 1.04 0.0095 0.2329 1.017 1.11 0.0116 0.2361 1.128 1.15 0.0155 0.2421 1.338 1.19 0.0174 0.2449 1.436 1.20 0.0218 0.2505 1.633 1.24 0.0227 0.2517 1.676 1.24 0.0251 0.2545 1.776 1.26
Ref. qw α R D d1 HW
R CD Support Type
m2/s deg. m m m (1) (2) (3) (4) (5) (6) (7) (8) (9)
TB92-5 0.0267 0.2571 1.867 1.25 0.0296 0.2599 1.968 1.28
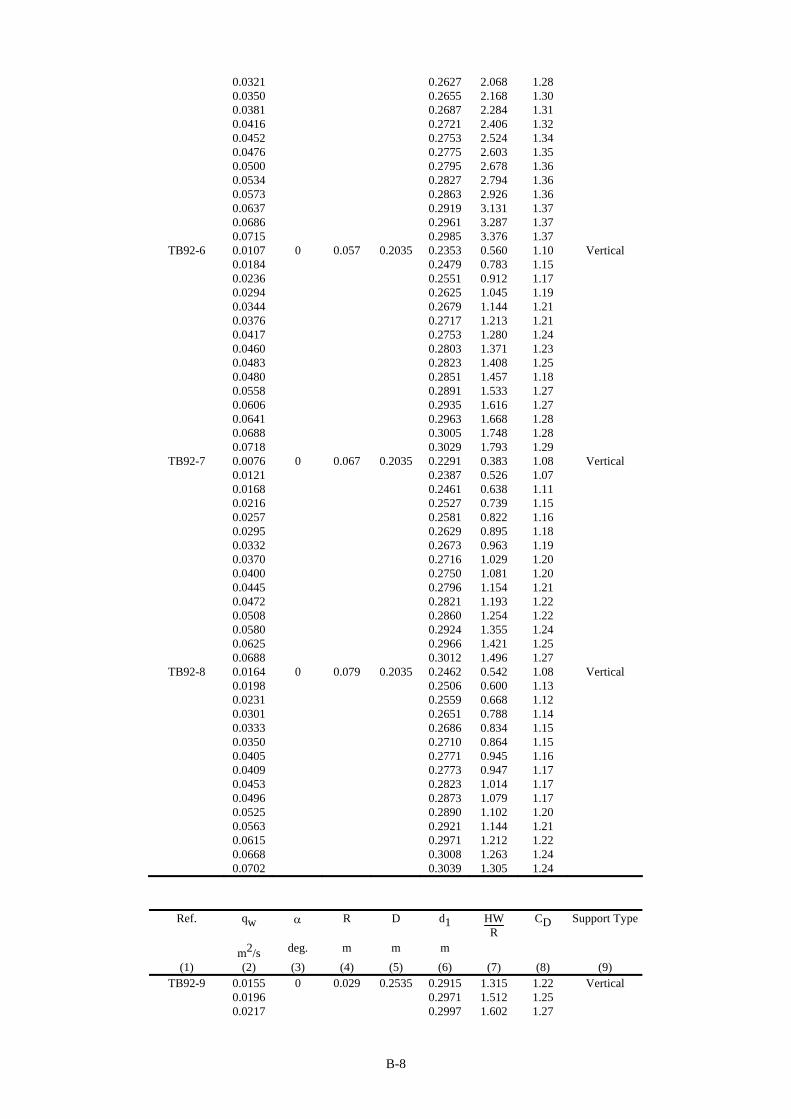
B-8
0.0321 0.2627 2.068 1.28 0.0350 0.2655 2.168 1.30 0.0381 0.2687 2.284 1.31 0.0416 0.2721 2.406 1.32 0.0452 0.2753 2.524 1.34 0.0476 0.2775 2.603 1.35 0.0500 0.2795 2.678 1.36 0.0534 0.2827 2.794 1.36 0.0573 0.2863 2.926 1.36 0.0637 0.2919 3.131 1.37 0.0686 0.2961 3.287 1.37 0.0715 0.2985 3.376 1.37
TB92-6 0.0107 0 0.057 0.2035 0.2353 0.560 1.10 Vertical 0.0184 0.2479 0.783 1.15 0.0236 0.2551 0.912 1.17 0.0294 0.2625 1.045 1.19 0.0344 0.2679 1.144 1.21 0.0376 0.2717 1.213 1.21 0.0417 0.2753 1.280 1.24 0.0460 0.2803 1.371 1.23 0.0483 0.2823 1.408 1.25 0.0480 0.2851 1.457 1.18 0.0558 0.2891 1.533 1.27 0.0606 0.2935 1.616 1.27 0.0641 0.2963 1.668 1.28 0.0688 0.3005 1.748 1.28 0.0718 0.3029 1.793 1.29
TB92-7 0.0076 0 0.067 0.2035 0.2291 0.383 1.08 Vertical 0.0121 0.2387 0.526 1.07 0.0168 0.2461 0.638 1.11 0.0216 0.2527 0.739 1.15 0.0257 0.2581 0.822 1.16 0.0295 0.2629 0.895 1.18 0.0332 0.2673 0.963 1.19 0.0370 0.2716 1.029 1.20 0.0400 0.2750 1.081 1.20 0.0445 0.2796 1.154 1.21 0.0472 0.2821 1.193 1.22 0.0508 0.2860 1.254 1.22 0.0580 0.2924 1.355 1.24 0.0625 0.2966 1.421 1.25 0.0688 0.3012 1.496 1.27
TB92-8 0.0164 0 0.079 0.2035 0.2462 0.542 1.08 Vertical 0.0198 0.2506 0.600 1.13 0.0231 0.2559 0.668 1.12 0.0301 0.2651 0.788 1.14 0.0333 0.2686 0.834 1.15 0.0350 0.2710 0.864 1.15 0.0405 0.2771 0.945 1.16 0.0409 0.2773 0.947 1.17 0.0453 0.2823 1.014 1.17 0.0496 0.2873 1.079 1.17 0.0525 0.2890 1.102 1.20 0.0563 0.2921 1.144 1.21 0.0615 0.2971 1.212 1.22 0.0668 0.3008 1.263 1.24 0.0702 0.3039 1.305 1.24
Ref. qw α R D d1 HW
R CD Support Type
m2/s deg. m m m (1) (2) (3) (4) (5) (6) (7) (8) (9)
TB92-9 0.0155 0 0.029 0.2535 0.2915 1.315 1.22 Vertical 0.0196 0.2971 1.512 1.25 0.0217 0.2997 1.602 1.27

B-9
0.0254 0.3043 1.765 1.29 0.0309 0.3107 1.989 1.31 0.0361 0.3167 2.201 1.31 0.0367 0.3173 2.223 1.31 0.0401 0.3205 2.339 1.33 0.0446 0.3251 2.501 1.34 0.0502 0.3297 2.668 1.37 0.0537 0.3339 2.818 1.35 0.0545 0.3347 2.846 1.35 0.0570 0.3373 2.941 1.34 0.0606 0.3413 3.082 1.33 0.0659 0.3427 3.142 1.41
TB92-10 0.0120 0 0.057 0.2535 0.2891 0.626 1.04 Vertical 0.0186 0.2999 0.817 1.08 0.0245 0.3081 0.963 1.12 0.0293 0.3143 1.074 1.13 0.0336 0.3193 1.164 1.15 0.0404 0.3269 1.300 1.17 0.0465 0.3329 1.409 1.20 0.0509 0.3369 1.482 1.22 0.0539 0.3397 1.534 1.22 0.0568 0.3427 1.588 1.22 0.0622 0.3469 1.666 1.25 0.0669 0.3511 1.743 1.25 0.0706 0.3543 1.803 1.26 0.0740 0.3561 1.837 1.28 0.0764 0.3587 1.885 1.27
TB92-11 0.0093 0 0.067 0.2535 0.2841 0.458 1.01 Vertical 0.0121 0.2902 0.548 1.00 0.0187 0.3006 0.705 1.07 0.0227 0.3064 0.792 1.08 0.0267 0.3118 0.874 1.10 0.0315 0.3176 0.962 1.13 0.0353 0.3223 1.035 1.13 0.0392 0.3270 1.106 1.14 0.0428 0.3304 1.158 1.16 0.0463 0.3335 1.207 1.18 0.0509 0.3378 1.273 1.20 0.0537 0.3414 1.329 1.18 0.0573 0.3444 1.376 1.20 0.0606 0.3478 1.429 1.20 0.0648 0.3516 1.488 1.21
TB92-12 0.0110 0 0.079 0.2535 0.2882 0.439 1.00 Vertical 0.0156 0.2968 0.549 1.01 0.0194 0.3025 0.622 1.04 0.0241 0.3092 0.709 1.07 0.0281 0.3142 0.773 1.09 0.0333 0.3205 0.854 1.11 0.0379 0.3263 0.930 1.12 0.0429 0.3317 1.000 1.13 0.0466 0.3359 1.055 1.14 0.0519 0.3413 1.125 1.15 0.0557 0.3445 1.168 1.16 0.0606 0.3491 1.229 1.17 0.0663 0.3539 1.293 1.19
Ref. qw α R D d1 HW
R CD Support Type
m2/s deg. m m m (1) (2) (3) (4) (5) (6) (7) (8) (9)
TB92-12 0.0704 0.3573 1.338 1.20 0.0744 0.3619 1.399 1.19

B-10
Note : R : curvature radius of crest (see appendix A)
Fig. B-1 - Experimental data : discharge coefficient (Experiments series T1A and T1B)
(A) Summary
0.75
0.85
0.95
1.05
1.15
1.25
1.35
0 0.5 1 1.5 2 2.5 3 3.5 4
R = 0.029 mR = 0.057 mR = 0.0671 mR = 0.0791 m
C
HW/R
Experiments T1A and T1B
D
No Ramp

B-11
Fig. B-1 - Experimental data : discharge coefficient (Experiments series T1A and T1B)
(B) Detailed results
0.75
0.85
0.95
1.05
1.15
1.25
1.35
1.45
0 1 2
Cyl. A (D/R=1.9)Cyl. A (D/R=2.6)Cyl. A (D/R=3.2)
C
HW/R
Experiments TA and TB
D
0.75
0.85
0.95
1.05
1.15
1.25
1.35
1.45
0 1 2
Cyl. B (D/R=2.3)Cyl. B (D/R=3.0)Cyl. B (D/R=3.8)
C
HW/RExperiments TA and TB
D
0.75
0.85
0.95
1.05
1.15
1.25
1.35
1.45
0 1 2
Cyl. C (D/R=2.7)Cyl. C (D/R=3.6)Cyl. C (D/R=4.4)
C
HW/R
Experiments TA and TB
D
0.75
0.85
0.95
1.05
1.15
1.25
1.35
1.45
0 1 2 3 4
Cyl. D (D/R=5.3)Cyl. D (D/R=7.0)Cyl. D (D/R=8.7)
C
HW/RExperiments TA and TB
D

B-12
Table B-3 - Experimental data - Experiments series T1C (30°-upstream ramp)
Ref. qw α R D d1 HW
R CD Support Type
m2/s deg. m m m (1) (2) (3) (4) (5) (6) (7) (8) (9)
Series T1C TC92-1R 0.0107 0 0.029 0.154 0.1850 1.075 1.14 30°-u/s ramp
0.0140 0.1915 1.303 1.12 0.0219 0.2030 1.710 1.17 0.0256 0.2080 1.889 1.17 0.0287 0.2110 1.998 1.21 0.0342 0.2065 1.859 1.60 0.0389 0.2215 2.382 1.26 0.0426 0.2255 2.528 1.26 0.0472 0.2300 2.695 1.27 0.0521 0.2360 2.913 1.24 0.0565 0.2400 3.063 1.25 0.0598 0.2430 3.175 1.26 0.0623 0.2455 3.269 1.25 0.0677 0.2500 3.439 1.26 0.0699 0.2530 3.548 1.24
TC92-2R 0.0051 0 0.05704 0.154 0.1760 0.386 0.91 30°-u/s ramp 0.0081 0.1820 0.493 1.01 0.0115 0.1885 0.608 1.04 0.0178 0.1985 0.787 1.10 0.0217 0.2050 0.904 1.09 0.0269 0.2115 1.022 1.12 0.0304 0.2155 1.096 1.14 0.0354 0.2205 1.189 1.18 0.0392 0.2260 1.289 1.15 0.0426 0.2285 1.337 1.19 0.0458 0.2320 1.402 1.19 0.0502 0.2355 1.469 1.21 0.0565 0.2420 1.591 1.21 0.0628 0.2475 1.697 1.22 0.0699 0.2540 1.821 1.23
TC92-3R 0.0089 0 0.06710 0.154 0.1830 0.434 1.05 30°-u/s ramp 0.0121 0.1895 0.532 1.05 0.0158 0.1960 0.631 1.07 0.0206 0.2025 0.731 1.11 0.0243 0.2075 0.808 1.13 0.0274 0.2100 0.848 1.19 0.0310 0.2155 0.932 1.16 0.0354 0.2210 1.018 1.16 0.0396 0.2255 1.089 1.18 0.0447 0.2310 1.176 1.18 0.0505 0.2370 1.272 1.19 0.0549 0.2415 1.343 1.19 0.0590 0.2470 1.429 1.16 0.0645 0.2540 1.539 1.14 0.0723 0.2615 1.660 1.14
TC92-4R 0.0055 0 0.07905 0.154 0.1730 0.241 1.22 30°-u/s ramp 0.0083 0.1800 0.330 1.16 0.0123 0.1900 0.458 1.05 0.0164 0.1970 0.548 1.07 0.0222 0.2060 0.665 1.08 0.0293 0.2155 0.790 1.10 0.0339 0.2200 0.850 1.14 0.0386 0.2255 0.923 1.15 0.0436 0.2310 0.997 1.16
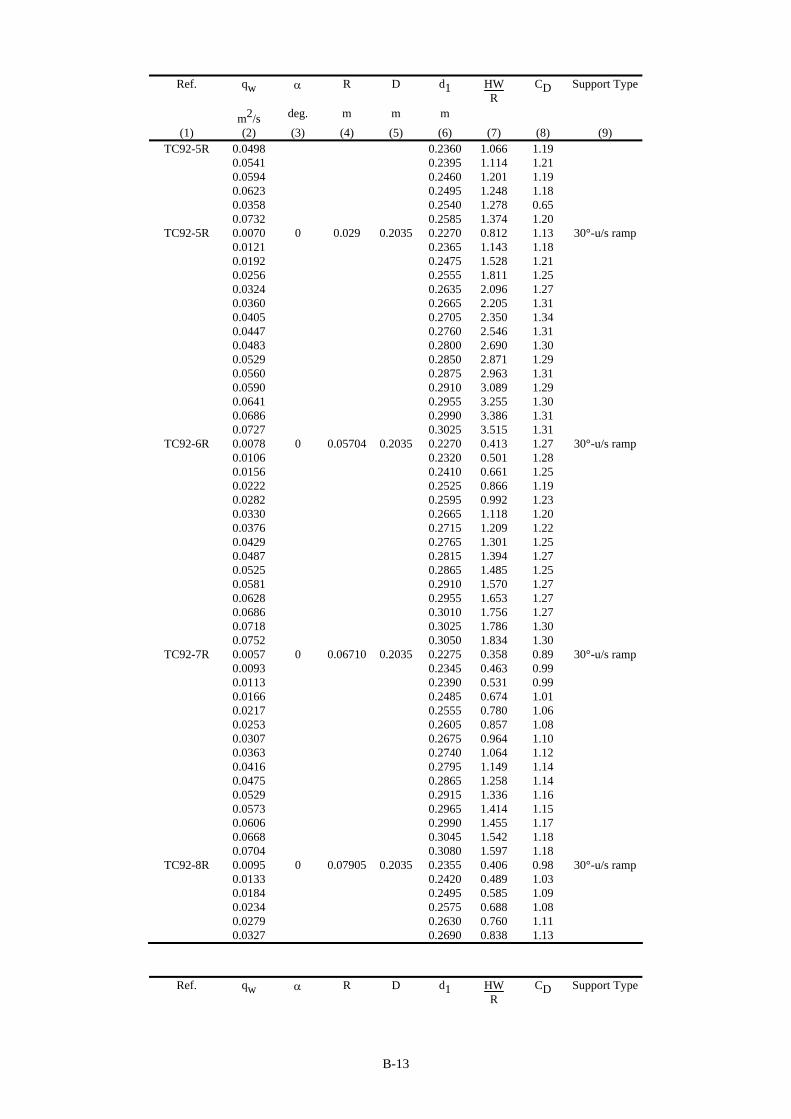
B-13
Ref. qw α R D d1 HWR
CD Support Type
m2/s deg. m m m (1) (2) (3) (4) (5) (6) (7) (8) (9)
TC92-5R 0.0498 0.2360 1.066 1.19 0.0541 0.2395 1.114 1.21 0.0594 0.2460 1.201 1.19 0.0623 0.2495 1.248 1.18 0.0358 0.2540 1.278 0.65 0.0732 0.2585 1.374 1.20
TC92-5R 0.0070 0 0.029 0.2035 0.2270 0.812 1.13 30°-u/s ramp 0.0121 0.2365 1.143 1.18 0.0192 0.2475 1.528 1.21 0.0256 0.2555 1.811 1.25 0.0324 0.2635 2.096 1.27 0.0360 0.2665 2.205 1.31 0.0405 0.2705 2.350 1.34 0.0447 0.2760 2.546 1.31 0.0483 0.2800 2.690 1.30 0.0529 0.2850 2.871 1.29 0.0560 0.2875 2.963 1.31 0.0590 0.2910 3.089 1.29 0.0641 0.2955 3.255 1.30 0.0686 0.2990 3.386 1.31 0.0727 0.3025 3.515 1.31
TC92-6R 0.0078 0 0.05704 0.2035 0.2270 0.413 1.27 30°-u/s ramp 0.0106 0.2320 0.501 1.28 0.0156 0.2410 0.661 1.25 0.0222 0.2525 0.866 1.19 0.0282 0.2595 0.992 1.23 0.0330 0.2665 1.118 1.20 0.0376 0.2715 1.209 1.22 0.0429 0.2765 1.301 1.25 0.0487 0.2815 1.394 1.27 0.0525 0.2865 1.485 1.25 0.0581 0.2910 1.570 1.27 0.0628 0.2955 1.653 1.27 0.0686 0.3010 1.756 1.27 0.0718 0.3025 1.786 1.30 0.0752 0.3050 1.834 1.30
TC92-7R 0.0057 0 0.06710 0.2035 0.2275 0.358 0.89 30°-u/s ramp 0.0093 0.2345 0.463 0.99 0.0113 0.2390 0.531 0.99 0.0166 0.2485 0.674 1.01 0.0217 0.2555 0.780 1.06 0.0253 0.2605 0.857 1.08 0.0307 0.2675 0.964 1.10 0.0363 0.2740 1.064 1.12 0.0416 0.2795 1.149 1.14 0.0475 0.2865 1.258 1.14 0.0529 0.2915 1.336 1.16 0.0573 0.2965 1.414 1.15 0.0606 0.2990 1.455 1.17 0.0668 0.3045 1.542 1.18 0.0704 0.3080 1.597 1.18
TC92-8R 0.0095 0 0.07905 0.2035 0.2355 0.406 0.98 30°-u/s ramp 0.0133 0.2420 0.489 1.03 0.0184 0.2495 0.585 1.09 0.0234 0.2575 0.688 1.08 0.0279 0.2630 0.760 1.11 0.0327 0.2690 0.838 1.13
Ref. qw α R D d1 HW
R CD Support Type

B-14
m2/s deg. m m m (1) (2) (3) (4) (5) (6) (7) (8) (9)
TC92-9R 0.0370 0.2745 0.910 1.13 0.0416 0.2795 0.976 1.14 0.0465 0.2845 1.042 1.15 0.0506 0.2885 1.095 1.17 0.0552 0.2935 1.161 1.17 0.0577 0.2955 1.188 1.18 0.0628 0.3005 1.255 1.18 0.0681 0.3055 1.322 1.18 0.0713 0.3075 1.350 1.20
TC92-9R 0.0055 0 0.029 0.2535 0.2755 0.759 0.98 30°-u/s ramp 0.0113 0.2875 1.175 1.06 0.0174 0.2960 1.472 1.16 0.0227 0.3030 1.717 1.20 0.0266 0.3085 1.910 1.20 0.0321 0.3140 2.105 1.25 0.0351 0.3175 2.228 1.25 0.0389 0.3215 2.371 1.27 0.0422 0.3250 2.495 1.27 0.0454 0.3285 2.620 1.27 0.0505 0.3325 2.765 1.31 0.0549 0.3375 2.943 1.29 0.0593 0.3410 3.071 1.31 0.0641 0.3455 3.233 1.31 0.0686 0.3495 3.378 1.31
TC92-10R 0.0061 0 0.05704 0.2535 0.2770 0.412 0.99 30°-u/s ramp 0.0104 0.2860 0.571 1.04 0.0147 0.2935 0.703 1.07 0.0192 0.3005 0.828 1.10 0.0251 0.3080 0.961 1.15 0.0293 0.3135 1.060 1.16 0.0354 0.3205 1.185 1.18 0.0396 0.3250 1.267 1.20 0.0436 0.3295 1.348 1.20 0.0494 0.3355 1.457 1.21 0.0541 0.3395 1.530 1.23 0.0577 0.3430 1.594 1.23 0.0606 0.3455 1.640 1.24 0.0654 0.3495 1.714 1.25 0.0699 0.3535 1.788 1.26
TC92-11R 0.0082 0 0.06710 0.2535 0.2805 0.403 1.08 30°-u/s ramp 0.0144 0.2935 0.598 1.05 0.0199 0.3020 0.726 1.09 0.0271 0.3115 0.870 1.13 0.0324 0.3175 0.962 1.16 0.0366 0.3225 1.038 1.17 0.0416 0.3275 1.115 1.19 0.0472 0.3335 1.207 1.20 0.0513 0.3375 1.269 1.21 0.0549 0.3405 1.316 1.23 0.0577 0.3435 1.363 1.22 0.0619 0.3470 1.418 1.24 0.0650 0.3500 1.464 1.24 0.0681 0.3525 1.504 1.25 0.0704 0.3545 1.535 1.25
TC92-12R 0.0030 0 0.07905 0.2535 0.2700 0.209 0.84 30°-u/s ramp 0.0116 0.2915 0.482 0.92 0.0195 0.3015 0.610 1.08 0.0266 0.3110 0.732 1.12
Ref. qw α R D d1 HW
R CD Support Type
m2/s deg. m m m

B-15
(1) (2) (3) (4) (5) (6) (7) (8) (9) TC92-12R 0.0315 0.3170 0.810 1.14
0.0370 0.3230 0.888 1.17 0.0419 0.3295 0.972 1.15 0.0468 0.3345 1.037 1.17 0.0517 0.3390 1.097 1.19 0.0545 0.3420 1.136 1.19 0.0585 0.3455 1.182 1.20 0.0610 0.3480 1.215 1.20 0.0654 0.3515 1.262 1.22 0.0690 0.3545 1.302 1.23 0.0713 0.3565 1.329 1.23
Note : R : curvature radius of crest.

B-16
Fig. B-2 - Experimental data - Discharge coefficient : effect of upstream ramp
(A) Summary (Experiments series T1B and T1C)
0.75
0.85
0.95
1.05
1.15
1.25
1.35
1.45
0 0.5 1 1.5 2 2.5 3
No Ramp30-degree Ramp
C
HW/R
R = 0.029,0.057,0.067, 0.079 mExperiments T1B and T1C
D
(B) Complete results (Experiments series T1C)
0.75
0.85
0.95
1.05
1.15
1.25
1.35
1.45
0 0.5 1 1.5 2 2.5 3
Cyl. A (D/R=1.9) Cyl. A (D/R=2.6) Cyl. A (D/R=3.2) Cyl. B (D/R=2.3) Cyl. B (D/R=3.0)
Cyl. B (D/R=3.8) Cyl. C (D/R=2.7) Cyl. C (D/R=3.6) Cyl. C (D/R=4.4) Cyl. D (D/R=5.3)
Cyl. D (D/R=7.0) Cyl. D (D/R=8.7) EQ. (4-4) EQ. (4-5)
C
HW/R
Experiments T1CD
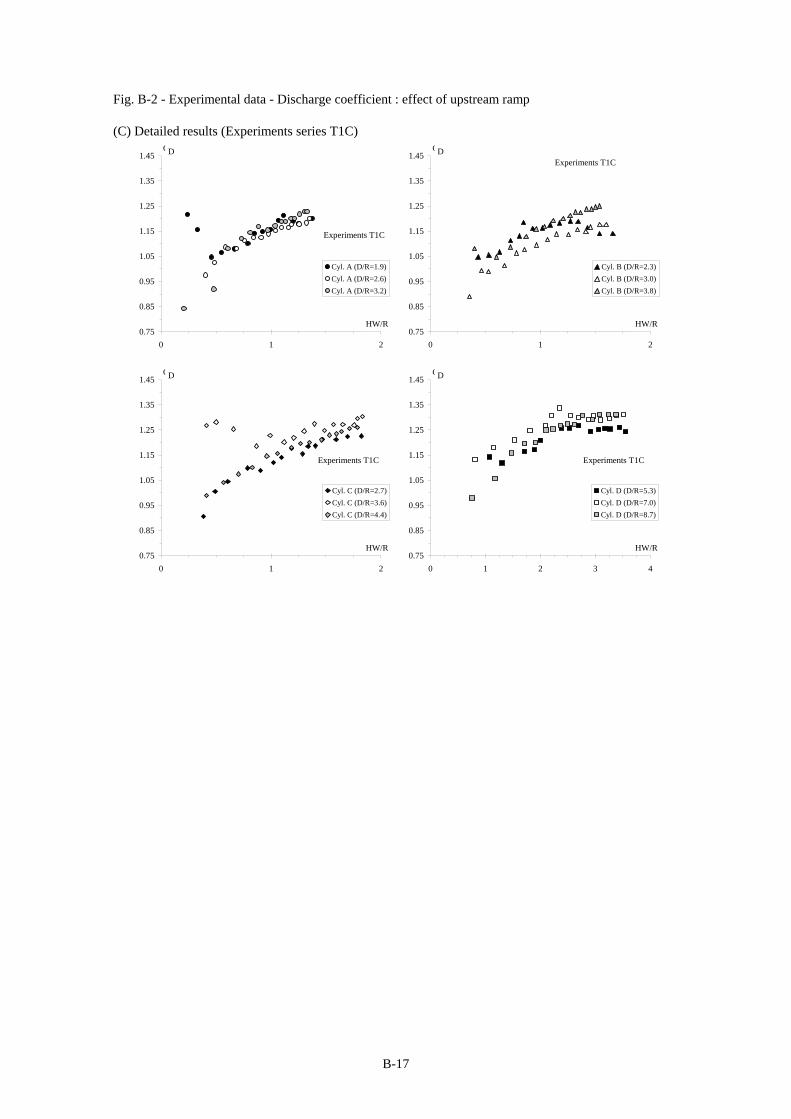
B-17
Fig. B-2 - Experimental data - Discharge coefficient : effect of upstream ramp
(C) Detailed results (Experiments series T1C)
0.75
0.85
0.95
1.05
1.15
1.25
1.35
1.45
0 1 2
Cyl. A (D/R=1.9)Cyl. A (D/R=2.6)Cyl. A (D/R=3.2)
C
HW/R
Experiments T1C
D
0.75
0.85
0.95
1.05
1.15
1.25
1.35
1.45
0 1 2
Cyl. B (D/R=2.3)Cyl. B (D/R=3.0)Cyl. B (D/R=3.8)
C
HW/R
Experiments T1CD
0.75
0.85
0.95
1.05
1.15
1.25
1.35
1.45
0 1 2
Cyl. C (D/R=2.7)Cyl. C (D/R=3.6)Cyl. C (D/R=4.4)
C
HW/R
Experiments T1C
D
0.75
0.85
0.95
1.05
1.15
1.25
1.35
1.45
0 1 2 3 4
Cyl. D (D/R=5.3)Cyl. D (D/R=7.0)Cyl. D (D/R=8.7)
C
HW/R
Experiments T1C
D

B-18
Table B-4 - Experimental data - Experiments series QI
Ref. qw α d1 dcrest d2 HW
R CD ∆H
D XD
Fr HJ Type
m2/s deg. m m m (1) (2) (3) (4) (5) (6) (7) (8) (9) (10) (11) (12)
Series QI Cylinder
1
RM1-[52] 0.0044 0.000 0.1699 0.0120 0.0040 0.455 0.98 1.18 N/A N/A N/A RM1-[53] 0.0052 0.000 0.1719 0.0142 0.0042 0.501 1.01 1.00 N/A N/A N/A RM1-[55] 0.0018 0.000 0.1605 0.0069 0.0026 0.240 1.06 1.55 N/A N/A N/A
RM1-[55/56]
0.0014 0.000 0.1586 0.0064 0.0026 0.198 1.06 1.65 N/A N/A N/A
RM1-[56] 0.0005 0.000 0.1543 0.0032 0.0011 0.094 1.12 1.68 N/A N/A N/A
Notes :
Fr : hydraulic jump Froude number : Fr = qw/ g*djump3
HJ Type : type of upstream hydraulic jump as defined by CHOW (1973) (Note : for undular jump,
classification as defined by CHANSON and MONTES 1995)
N/A : not applicable

B-19
Table B-5 - Experimental data - Experiments series QII
Ref. qw α d1 dcrest d2 HW
R CD ∆H
D XD
Fr HJ Type
m2/s deg. m m m (1) (2) (3) (4) (5) (6) (7) (8) (9) (10) (11) (12)
Series QIIA
Cylinder 1
AS1-[11] 0.0267 0.191 0.1372 0.0376 0.0227 1.280 1.27 0.60 N/A N/A N/A AS1-[11] 0.0407 0.191 0.1515 0.0491 0.0323 1.672 1.29 0.54 N/A N/A N/A AS1-[12] 0.0332 0.191 0.1443 0.0429 0.0277 1.472 1.28 0.59 N/A N/A N/A AS1-[12] 0.0186 0.191 0.1266 0.0304 0.0168 1.020 1.24 0.61 N/A N/A N/A AS1-[13] 0.0328 0.191 0.1442 0.0422 0.0261 1.484 1.25 0.52 N/A N/A N/A AS1-[13] 0.0106 0.191 0.1146 0.0209 0.0095 0.719 1.19 0.55 N/A N/A N/A AS1-[14] 0.0070 0.191 0.1080 0.0164 0.0064 0.553 1.17 0.53 N/A N/A N/A AS1-[14] 0.0053 0.191 0.1041 0.0139 0.0053 0.455 1.18 0.61 N/A N/A N/A AS1-[15] 0.0023 0.191 0.0960 0.0089 0.0045 0.261 1.16 0.98 N/A N/A N/A AS1-[15] 0.0008 0.191 0.0904 0.0050 0.0054 0.125 1.19 1.05 N/A N/A N/A RM1-[71] 0.0397 0.191 0.1513 0.0483 0.0269 1.648 1.29 0.24 N/A N/A N/A RM1-[73] 0.0338 0.191 0.1459 0.0431 0.0241 1.499 1.27 0.33 N/A N/A N/A RM1-[76] 0.0283 0.191 0.1393 0.0375 0.0227 1.340 1.25 0.52 N/A N/A N/A RM1-[78] 0.0228 0.191 0.1320 0.0328 0.0176 1.159 1.26 0.40 N/A N/A N/A RM1-[81] 0.0161 0.191 0.1234 0.0279 0.0110 0.933 1.23 0.09 N/A N/A N/A RM1-[83] 0.0132 0.191 0.1189 0.0231 0.0129 0.810 1.25 0.68 N/A N/A N/A RM1-[86] 0.0076 0.191 0.1095 0.0171 0.0100 0.581 1.17 0.89 N/A N/A N/A RM1-[88] 0.0041 0.191 0.1021 0.0118 0.0058 0.399 1.13 0.88 N/A N/A N/A Cylinder
2
AS1-[03] 0.1176 0.191 0.2311 0.0968 -- 2.629 1.35 -- N/A N/A N/A AS1-[03] 0.0938 0.191 0.2145 0.0804 0.0560 2.253 1.36 0.27 N/A N/A N/A AS1-[04] 0.0834 0.191 0.2053 0.0742 0.0505 2.051 1.39 0.26 N/A N/A N/A AS1-[04] 0.0651 0.191 0.1914 0.0620 0.0420 1.733 1.40 0.35 N/A N/A N/A AS1-[04] 0.0509 0.191 0.1790 0.0514 0.0322 1.465 1.41 0.25 N/A N/A N/A AS1-[05] 0.0402 0.191 0.1678 0.0452 0.0241 1.231 1.44 0.07 N/A N/A N/A AS1-[05] 0.0223 0.191 0.1525 0.0329 0.0131 0.9035 1.27 -0.04 N/A N/A N/A AS1-[16] 0.0134 0.191 0.1407 0.0254 0.0130 0.672 1.19 0.74 N/A N/A N/A AS1-[16] 0.0211 0.191 0.1524 0.0324 -- 0.908 1.19 -- N/A N/A N/A AS1-[17] 0.0078 0.191 0.1309 0.0182 0.0072 0.466 1.20 0.65 N/A N/A N/A AS1-[17] 0.0049 0.191 0.1245 0.0133 0.0055 0.351 1.15 0.78 N/A N/A N/A AS1-[18] 0.0022 0.191 0.1167 0.0081 0.0051 0.200 1.19 1.01 N/A N/A N/A AS1-[18] 0.0008 0.191 0.1108 0.0043 0.0049 0.087 -- 1.03 N/A N/A N/A RM1-[62] 0.0150 0.191 0.1438 0.0266 0.0108 0.726 1.19 0.37 N/A N/A N/A RM1-[64] 0.0349 0.191 0.1688 0.0452 0.0261 1.232 1.25 0.55 N/A N/A N/A RM1-[66] 0.0202 0.191 0.1510 0.0316 0.0151 0.874 1.21 0.47 N/A N/A N/A RM1-[68] 0.0085 0.191 0.1328 0.0185 0.0088 0.497 1.19 0.76 N/A N/A N/A Cylinder
3
AS1-[06] 0.0621 0.191 0.2354 0.0599 0.0328 1.151 1.43 0.18 N/A N/A N/A AS1-[06] 0.0512 0.191 0.2273 0.0529 0.0267 1.034 1.38 0.13 N/A N/A N/A AS1-[07] 0.0470 0.191 0.2224 0.0509 0.0239 0.960 1.42 0.05 N/A N/A N/A AS1-[07] 0.0404 0.191 0.2154 0.0452 0.0177 0.852 1.45 -0.41 N/A N/A N/A AS1-[08] 0.0345 0.191 0.2115 0.0428 0.0210 0.806 1.35 0.38 N/A N/A N/A AS1-[08] 0.0238 0.191 0.2020 0.0358 0.0128 0.670 1.23 -- N/A N/A N/A AS1-[19] 0.0203 0.191 0.1999 0.0327 -- 0.632 1.14 -- N/A N/A N/A AS1-[19] 0.0132 0.191 0.1884 0.0248 0.0132 0.483 1.11 0.85 N/A N/A N/A AS1-[20] 0.0074 0.191 0.1777 0.0162 0.0088 0.324 1.13 0.90 N/A N/A N/A AS1-[20] 0.0043 0.191 0.1697 0.0131 0.0044 0.230 1.11 0.79 N/A N/A N/A AS1-[21] 0.0022 0.191 0.1636 0.0080 0.0065 0.149 1.08 1.03 N/A N/A N/A

B-20
Ref. qw α d1 dcrest d2 HW
R CD ∆H
D XD
Fr HJ Type
m2/s deg. m m m (1) (2) (3) (4) (5) (6) (7) (8) (9) (10) (11) (12)
Cylinder 4
AS1-[09] 0.0044 0.191 0.2506 0.0131 0.0136 0.154 1.07 1.01 N/A M/A N/A AS1-[09] 0.0027 0.191 0.2457 0.0102 0.0110 0.113 1.06 1.01 N/A M/A N/A AS1-[10] 0.0009 0.191 0.2390 0.0054 0.0057 0.056 1.03 1.01 N/A M/A N/A
Ref. qw α d1 dcrest d2 HW
R CD ∆H
D XD
Fr HJ Type
m2/s deg. m m m (1) (2) (3) (4) (5) (6) (7) (8) (9) (10) (11) (12)
Series QIIB
Cylinder 2
RM1-[62] 0.0150 0.191 0.1438 0.0266 0.0108 0.726 1.19 0.37 N/A N/A N/A RM1-[63] 0.0150 0.573 0.1410 0.0283 0.0113 0.710 1.23 0.49 96.4 1.44 UJ-C RM1-[64] 0.0150 0.707 0.1393 0.0272 0.0112 0.690 1.28 0.47 76.4 1.86 UJ-C RM1-[63] 0.0150 0.898 0.1376 0.0268 0.0103 0.665 1.35 0.34 58.0 2.15 UJ-D/ERM1-[64] 0.0349 0.191 0.1688 0.0452 0.0261 1.232 1.25 0.55 N/A N/A N/A RM1-[65] 0.0349 0.535 0.1670 0.0460 0.0253 1.235 1.24 0.54 99.4 1.19 UJ-B RM1-[66] 0.0349 0.649 0.1658 0.0455 0.0243 1.223 1.26 0.48 76.1 1.66 UJ-D RM1-[65] 0.0349 0.898 0.1624 0.0449 0.0251 1.183 1.33 0.55 50.0 2.11 UJ-D/ERM1-[66] 0.0202 0.191 0.1510 0.0316 0.0151 0.874 1.21 0.47 N/A N/A N/A RM1-[67] 0.0202 0.573 0.1484 0.0320 0.0132 0.857 1.25 0.26 94.9 1.48 UJ-C RM1-[67] 0.0202 0.688 0.1473 0.0321 0.0132 0.848 1.26 0.27 76.2 1.84 UJ-D RM1-[67] 0.0202 0.898 0.1440 0.0318 0.0128 0.804 1.37 0.20 56.6 2.20 UJ-D RM1-[68] 0.0085 0.191 0.1328 0.0185 0.0088 0.497 1.19 0.76 N/A N/A N/A RM1-[69] 0.0085 0.573 0.1295 0.0187 0.0075 0.482 1.25 0.64 97.7 1.50 UJ-C RM1-[70] 0.0085 0.707 0.1283 0.0193 0.0086 0.474 1.28 0.79 79.4 1.85 UJ-C RM1-[69] 0.0085 0.898 0.1269 0.0185 0.0089 0.465 1.32 0.83 61.6 2.11 UJ-C Cylinder
1
RM1-[71] 0.0397 0.191 0.1513 0.0483 0.0269 1.648 1.29 0.24 N/A N/A N/A RM1-[71] 0.0397 0.439 0.1488 0.0478 0.0276 1.635 1.31 0.32 119.3 1.25 UJ-B RM1-[73] 0.0397 0.497 0.1486 0.0481 0.0272 1.624 1.32 0.30 99.5 1.46 UJ-C RM1-[72] 0.0397 0.745 0.1461 0.0479 0.0269 1.581 1.38 0.30 57.0 1.96 UJ-D RM1-[72] 0.0397 0.898 0.1439 0.0478 0.0283 1.571 1.39 0.41 44.1 2.31 UJ-D/ERM1-[73] 0.0338 0.191 0.1459 0.0431 0.0241 1.499 1.27 0.33 N/A N/A N/A RM1-[74] 0.0338 0.439 0.1432 0.0432 0.0226 1.462 1.32 0.21 120.7 1.23 UJ-B RM1-[75] 0.0338 0.516 0.1427 0.0433 0.0238 1.461 1.32 0.33 96.8 1.53 UJ-C RM1-[75] 0.0338 0.668 0.1405 0.0428 0.0229 1.426 1.37 0.25 68.6 1.82 UJ-D RM1-[74] 0.0338 0.898 0.1385 0.0430 0.0250 1.412 1.39 0.46 46.5 2.26 UJ-D RM1-[76] 0.0283 0.191 0.1393 0.0375 0.0227 1.340 1.25 0.52 N/A N/A N/A RM1-[76] 0.0283 0.458 0.1374 0.0387 0.0218 1.310 1.30 0.47 115.4 1.33 UJ-B RM1-[78] 0.0283 0.535 0.1366 0.0379 0.0210 1.312 1.30 0.41 95.1 1.58 UJ-C RM1-[77] 0.0283 0.668 0.1354 0.0381 0.0206 1.290 1.33 0.39 66.5 1.83 UJ-D RM1-[77] 0.0283 0.898 0.1434 0.0385 0.0209 1.508 -- 0.56 48.9 2.15 UJ-D RM1-[78] 0.0228 0.191 0.1320 0.0328 0.0176 1.159 1.26 0.40 N/A N/A N/A RM1-[79] 0.0228 0.477 0.1299 0.0339 0.0163 1.133 1.30 0.29 112.2 1.42 UJ-B RM1-[80] 0.0228 0.554 0.1293 0.0328 0.0163 1.120 1.32 0.29 93.9 1.65 UJ-C RM1-[80] 0.0228 0.668 0.1278 0.0324 0.0157 1.109 1.34 0.21 74.7 1.90 UJ-D RM1-[79] 0.0228 0.898 0.1261 0.0338 0.0164 1.100 1.36 0.35 52.0 2.24 UJ-D RM1-[81] 0.0161 0.191 0.1234 0.0279 0.0110 0.933 1.23 0.09 N/A N/A N/A RM1-[81] 0.0161 0.477 0.1213 0.0282 0.0113 0.914 1.26 0.19 115.3 1.45 UJ-C

B-21
Ref. qw α d1 dcrest d2 HW
R CD ∆H
D XD
Fr HJ Type
m2/s deg. m m m (1) (2) (3) (4) (5) (6) (7) (8) (9) (10) (11) (12)
RM1-[83] 0.0161 0.554 0.1207 0.0269 0.0111 0.913 1.27 0.16 97.4 1.67 UJ-C RM1-[82] 0.0161 0.668 0.1196 0.0267 0.0101 0.897 1.30 -0.08 78.8 1.86 UJ-D RM1-[82] 0.0161 0.898 0.1172 0.0271 0.0113 0.872 1.36 0.23 55.7 2.20 UJ-D RM1-[83] 0.0132 0.191 0.1189 0.0231 0.0129 0.810 1.25 0.68 N/A N/A N/A RM1-[84] 0.0132 0.477 0.1171 0.0235 0.0128 0.795 1.28 0.71 116.8 1.49 UJ-B RM1-[85] 0.0132 0.554 0.1156 0.0237 0.0127 0.786 1.30 0.70 99.0 1.65 UJ-B/CRM1-[85] 0.0132 0.707 0.1151 0.0235 0.0122 0.794 1.28 0.68 75.4 1.91 UJ-C RM1-[84] 0.0132 0.898 0.1134 0.0235 0.0125 0.771 1.34 0.72 57.2 2.14 UJ-D RM1-[86] 0.0076 0.191 0.1095 0.0171 0.0100 0.581 1.17 0.89 N/A N/A N/A RM1-[86] 0.0076 0.477 0.1070 0.0160 0.0090 0.559 1.24 0.85 119.4 1.50 UJ-B RM1-[88] 0.0076 0.554 0.1065 0.0165 0.0080 0.550 1.28 0.75 103.0 1.71 UJ-B RM1-[87] 0.0076 0.688 0.1048 0.0164 0.0079 0.520 1.39 0.75 82.8 1.83 UJ-C RM1-[87] 0.0076 0.898 0.1030 0.0167 0.0073 0.514 1.41 0.68 61.8 2.02 UJ-C/DRM1-[88] 0.0041 0.191 0.1021 0.0118 0.0058 0.399 1.13 0.88 N/A N/A N/A RM1-[89] 0.0041 0.477 0.0990 0.0119 0.0050 0.366 1.29 0.80 121.4 1.53 UJ-B RM1-[90] 0.0041 0.554 0.0986 0.0114 0.0052 0.365 1.29 0.85 105.6 1.75 UJ-B RM1-[90] 0.0041 0.707 0.0969 0.0110 0.0051 0.341 1.43 0.85 82.4 1.73 UJ-B RM1-[89] 0.0041 0.898 0.0958 0.0107 0.0046 0.336 1.46 0.79 63.8 1.91 UJ-C
Notes :
Fr : hydraulic jump Froude number : Fr = qw/ g*djump3
HJ Type : type of upstream hydraulic jump as defined by CHOW (1973) (Note : for undular jump,
classification as defined by CHANSON and MONTES 1995)
N/A : not applicable

B-22
Table B-6 - Experimental data - Experiments series QIII
Ref. qw α d1 dcrest d2 HW
R CD ∆H
D XD
Fr HJ Type
m2/s deg. m m m (1) (2) (3) (4) (5) (6) (7) (8) (9) (10) (11) (12)
Series QIIIA
Cylinder 4
AS1-[35] 0.0268 0.000 0.2959 0.0429 -- 0.537 1.00 -- N/A N/A N/A AS1-[35] 0.0013 0.000 0.2406 0.0047 0.0040 0.059 -- 1.00 N/A N/A N/A AS1-[35] 0.0024 0.000 0.2467 0.0082 0.0099 0.110 0.95 1.01 N/A N/A N/A AS1-[36] 0.0036 0.000 0.2533 0.0134 0.0154 0.169 0.77 1.01 N/A N/A N/A AS1-[36] 0.0056 0.000 0.2563 0.0166 0.0230 0.192 0.98 0.99 N/A N/A N/A AS1-[36] 0.0088 0.000 0.2659 0.0208 0.0184 0.274 0.90 1.02 N/A N/A N/A AS1-[37] 0.0112 0.000 0.2707 0.0253 -- 0.318 0.92 -- N/A N/A N/A AS1-[37] 0.0152 0.000 0.2780 0.0308 -- 0.383 0.94 -- N/A N/A N/A AS1-[37] 0.0184 0.000 0.2837 0.0350 -- 0.429 0.96 -- N/A N/A N/A AS1-[38] 0.0208 0.000 0.2875 0.0375 -- 0.462 0.98 -- N/A N/A N/A
Ref. qw α d1 dcrest d2 HW
R CD ∆H
D XD
Fr HJ Type
m2/s deg. m m m (1) (2) (3) (4) (5) (6) (7) (8) (9) (10) (11) (12)
Series QIIIB
Cylinder 2
AS1-[24] 0.0500 0.000 0.1879 0.0611 0.0404 1.599 1.21 0.70 11.93 10.34 Strong AS1-[25] 0.0496 0.000 0.1901 0.0592 0.0415 1.637 1.16 0.77 14.80 10.69 Strong AS1-[25] 0.0492 0.000 0.1882 0.0587 0.0393 1.601 1.19 0.70 17.37 10.36 Strong AS1-[26] 0.0480 0.000 0.1863 0.0593 0.0387 1.564 1.20 0.70 19.57 10.11 Strong AS1-[26] 0.0680 0.000 0.1997 0.0786 0.0513 1.865 1.31 0.62 6.49 5.06 Steady AS1-[27] 0.0668 0.000 0.2020 0.0724 0.0463 1.894 1.25 0.53 11.36 6.03 Steady AS1-[27] 0.0652 0.000 0.2011 0.0714 0.0485 1.868 1.25 0.63 13.27 7.58 Steady AS1-[28] 0.0640 0.000 0.2017 0.0678 0.0460 1.877 1.22 0.60 17.47 7.42 Steady AS1-[28] 0.0636 0.000 0.2005 0.0692 0.0471 1.852 1.24 0.63 20.53 7.77 Steady AS1-[29] 0.0856 0.000 0.2045 0.0848 0.0614 1.999 1.48 0.51 6.11 5.08 Steady AS1-[29] 0.0808 0.000 0.2147 0.0847 0.0545 2.168 1.24 0.54 11.17 4.19 Steady AS1-[30] 0.0784 0.000 0.2108 0.0813 0.0486 2.087 1.27 0.36 16.13 5.95 Steady AS1-[30] 0.0772 0.000 0.2134 0.0776 0.0491 2.124 1.22 0.44 18.71 5.84 Steady AS1-[31] 0.0760 0.000 0.2099 0.0775 0.0516 2.063 1.26 0.53 22.91 4.84 Steady AS1-[32] 0.0976 0.000 0.2121 0.0930 0.0610 2.174 1.49 0.31 7.72 4.26 Oscillat.AS1-[32] 0.0956 0.000 0.2253 0.0904 0.0558 2.397 1.26 0.29 11.55 3.80 Oscillat.AS1-[33] 0.0944 0.000 0.2222 0.0890 0.0572 2.338 1.29 0.34 14.32 4.26 Oscillat.AS1-[33] 0.0928 0.000 0.2201 0.0848 0.0563 2.295 1.31 0.34 17.21 5.09 Oscillat.AS1-[34] 0.0920 0.000 0.2200 0.0845 0.0556 2.293 1.30 0.33 21.48 5.02 Oscillat.AS1-[39] 0.1224 0.000 0.2200 0.1107 0.0858 2.449 1.56 0.45 6.78 4.85 Oscillat.AS1-[39] 0.1136 0.000 0.2395 0.1101 0.0857 2.732 1.23 0.73 11.36 3.72 Oscillat.AS1-[40] 0.1096 0.000 0.2418 0.1062 0.0802 2.752 1.18 0.74 15.27 3.70 Oscillat.AS1-[40] 0.1080 0.000 0.2369 0.1058 0.0721 2.669 1.21 0.59 20.14 3.50 Oscillat.AS1-[41] 0.1360 0.000 0.2401 0.1277 0.1052 2.835 1.39 0.64 9.36 3.48 Oscillat.AS1-[41] 0.1320 0.000 0.2534 0.1241 0.0980 3.044 1.22 0.74 13.84 3.19 Oscillat.AS1-[42] 0.1288 0.000 0.2544 0.1182 0.0911 3.048 1.19 0.72 19.47 3.78 Oscillat.AS1-[42] 0.1280 0.000 0.2544 0.1189 0.0936 3.038 1.18 0.76 20.72 3.75 Oscillat.
Notes :

B-23
Fr : hydraulic jump Froude number : Fr = qw/ g*djump3
HJ Type : type of upstream hydraulic jump as defined by CHOW (1973)
N/A : not applicable
Fig. B-3 - Experimental data : discharge coefficient (Experiments series QI, QII, QIII)
0.7
0.9
1.1
1.3
1.5
1.7
0 0.2 0.4 0.6 0.8 1 1.2 1.4 1.6
Cyl. 1 (Series QI)Cyl. 1 (Series QIIA)Cyl. 1 (Series QIIB)Cyl. 2 (Series QIIA)Cyl. 2 (Series QIIB)Cyl. 2 (Series QIIIB)Cyl. 3 (Series QIIA)Cyl. 4 (Series QIIA)Cyl. 4 (Series QIIIA)
HW/D
CD

B-24
Fig. B-4 - Experimental data : ratio flow depth above crest to critical depth (exp. series QI, QII, QIII)
0.7
0.8
0.9
1
1.1
1.2
1.3
1.4
0 0.2 0.4 0.6 0.8 1 1.2 1.4 1.6
Cyl. 1 (Series QI)Cyl. 1 (Series QIIA)Cyl. 1 (Series QIIB)Cyl. 2 (Series QIIA)Cyl. 2 (Series QIIB)Cyl. 2 (Series QIIIB)Cyl. 3 (Series QIIA)Cyl. 4 (Series QIIA)Cyl. 4 (Series QIIIA)
HW/D
dcrest/dc
Fig. B-5 - Experimental data : dimensionless head loss (experiments series QI, QII, QIII)
0
10
20
30
40
50
0 0.2 0.4 0.6 0.8 1 1.2 1.4 1.6
Cyl. 1 (Series QI)Cyl. 1 (Series QIIA)Cyl. 1 (Series QIIB)Cyl. 2 (Series QIIA)Cyl. 2 (Series QIIB)Cyl. 2 (Series QIIIB)Cyl. 3 (Series QIIA)Cyl. 4 (Series QIIA)Cyl. 4 (Series QIIIA)
HW/D
∆H/dc

C-1
Appendix C
EFFECT OF UPSTREAM FLOW CONDITIONS
ON THE DISCHARGE COEFFICIENT
C.1 Introduction
In this section, we review the effect of the inflow conditions on the discharge characteristics of weirs (fig.
C-1). More specifically, the effect of the upstream flow development on the discharge coefficient is
detailed. The results are general and they may apply to most weir shapes.
Fig. C-1 - Definition sketch
D
H1d1 R
y
Vδ
VmaxVs
dcrestT.H.L.
C.2 Basic equation
Considering the overflow above a circular weir, let us apply the Bernoulli equation along the free-surface
streamline between the upstream flow location [1] and the crest :
d1 + Vmax
2
2 * g = D + dcrest + Vs
2
2 * g (C-1)
where d1 is the upstream flow depth, D is the weir height, Vmax is the upstream free-surface velocity, g
is the gravity constant, dcrest is the flow depth on the crest and Vs is the free-surface velocity on the crest
(fig. C-1).
Note that equation (C-1) makes no assumption on the pressure distribution at the weir crest. Further, for a
developing flow, the free-surface velocity is the free-stream velocity of the developing boundary layer

C-2
C.3 Analytical development
Assuming that the velocity distribution in the bottom boundary layer follows a power law :
V
Vmax = ⎝
⎛⎠⎞yδ
1/N (C-2)
where δ is the boundary layer thickness, the free-surface velocity can be derived from the continuity
equation :
Vmax = qwd1
* N + 1
N + 1 - δ
d1
(C-3)
where qw is the discharge per unit width.
Let us assume that the free-surface velocity at the weir crest equals :
Vs = k * qw
dcrest (C-4)
where k is a constant of proportionality.
Combining the continuity equation and the above assumptions (eq. (C-3) and (C-4)), the Bernoulli
equation (eq. (C-1)) becomes :
d1 - D + qw
2
2 * g * d12 *
⎝⎜⎜⎛
⎠⎟⎟⎞
N+1
N + 1 - δ
d1
2 = dcrest +
k2 * qw2
2 * g * dcrest2 (C-7)
And the discharge per unit width can be expressed as :
qw2 = 2 * g *
d1 - D - dcrest
k2
dcrest2 -
⎝⎜⎜⎛
⎠⎟⎟⎞
N + 1
d12 *
⎝⎜⎛
⎠⎟⎞N + 1 -
δd1
2 (C-6)
Assuming that the discharge per unit width can be approximated as :
qw = CD * g * ⎝⎛
⎠⎞2
3 * (H1 - D)3/2
≈ CD * g * ⎝⎛
⎠⎞2
3 * (d1 - D)3/2
(C-7)
where CD is the discharge coefficient and H1 is the upstream total head, the discharge coefficient can be
expressed as :
CD = 32 *
dcrestd1 - D *
3 * ⎝⎜⎛
⎠⎟⎞1 -
dcrestd1 - D
k2 - dcrest
2
d12 *
⎝⎜⎜⎛
⎠⎟⎟⎞
N + 1
N + 1 - δ
d1
2 (C-8A)

C-3
Note that the above equation may be transformed by introducing the critical depth in rectangular
assuming hydrostatic pressure distribution : dc = 2/3*(H1-D) ≈ 2/3*(d1-D). And equation (C-8A)
becomes :
CD = dcrest
dc *
3 * ⎝⎜⎛
⎠⎟⎞1 -
23 *
dcrestdc
k2 - dcrest
2
d12 *
⎝⎜⎜⎛
⎠⎟⎟⎞
N + 1
N + 1 - δ
d1
2 (C-8B)
C.4 Discussion
Equation (C-8) gives the expression of the discharge coefficient as a function of the ratios dcrest/(d1-D),
dcrest/d1 and δ/d1, and of the coefficients k and N.
Present experiments indicate that the ratio dcrest/dc is a function of the ratio head on crest to curvature
radius but they suggest also that it is nearly independent of the upstream flow conditions. In these
conditions, equation (C-8) implies that the discharge coefficient increases with increasing ratio δ/d1 for
given ratios dcrest/dc and dcrest/d1 (fig. C-2). In other words, CD is larger for fully-developed inflow
conditions that for partially-developed inflows.
Further note that the discharge coefficient is maximum for : dcrest/dc = 1.

C-4
Fig. C-2 - Effect of bottom boundary layer development on the discharge coefficient (eq. (C-8))
1
1.05
1.1
1.15
0 0.2 0.4 0.6 0.8 1
HW/D=0.25,dcrest/d1=0.13HW/D=0.25,dcrest/d1=0.53HW/D=1,dcrest/d1=0.53HW/D=1,dcrest/d1=0.47
N = 6
k = 0.9
C D
δ /d1

D-1
Appendix D
FLOW CONDITIONS AT A WEIR CREST
APPLICATION TO CIRCULAR WEIRS
D.1 Introduction
In this section, we review the flow conditions at the crest of a circular weir (fig. D-1). In particular, the
flow depth at the crest is analysed in the light of new experimental results (section 5).
Fig. D-1 - Overflow of a circular weir
D.2 Basic equations
Application of the Bernoulli equation between the upstream flow location [1] and the crest leads to :
H1 = d1 + α1 * qw
2
2 * g * d12 = D + Λcrest * dcrest + αcrest *
qw2
2 * g * dcrest2 (D-1)
where H1 is the mean total head, d1 is the upstream flow depth, qw is the discharge per unit width, D is
the weir height, g is the gravity constant, dcrest is the flow depth at the crest, Λcrest is the pressure
correction coefficient which accounts for the non-hydrostatic pressure distribution on the crest, and α1
and αcrest are the kinetic energy correction coefficients of the inflow and at the crest respectively (fig. D-
1).

D-2
At the crest of a cylindrical weir, the streamline curvature implies that the pressure distribution is not
hydrostatic and that the pressure gradient is less than hydrostatic : i.e., the pressure correction coefficient
Λcrest is less than unity (e.g. FAWER 1937, ROUVE and INDLEKOFER 1974).
D.3 Occurrence of critical flow conditions at the crest of circular weirs
If critical flow conditions take place at the weir crest, the mean specific energy at the crest must be
minimum : i.e., the flow depth at the crest must satisfy :
Λcrest - αcrest * qw
2
g * dcrest3 = 0 (D-3)
After transformation, it yields :
dcrest
dc =
3 αcrestΛcrest
(D-4)
where dc is the critical flow depth in rectangular channel (assuming hydrostatic pressure distribution) :
dc = 3 qw2
g = 23 * (H1 - D) (D-5)
Note that the kinetic energy correction coefficient αcrest is always larger (or equal) than unity and the
pressure correction coefficient Λcrest is less than unity at the crest of a circular weir. For example, VO
(1992, fig. 21) observed : Λcrest ≈ 1 - 0.5*(H1-D)/R, for (H1-D)/R < 2 and ventilated nappes.
With αcrest ≥ 1 and Λcrest < 1, the occurrence of critical flow conditions at the crest of a circular weir
(eq. (D-3)) must imply:
dcrest
dc > 1 for critical flow conditions at the crest of circular weir (D-6)
Discussion and comparison with new experimental data
When equation (D-6) is not satisfied :
(a) critical flow conditions do not occur at the crest,
(b) the flow at the crest is supercritical, and
(c) critical flow takes place upstream of the crest.
In other words, the (hydraulic) control must be located upstream of the weir crest if equation (D-6) is not
satisfied. And, downstream of the control, the mean flow is supercritical.

D-3
New experimental results indicate that, for the experiments series QII and QIII, the ratio dcrest/dc is less
than unity for (H1-D)/R > 0.4 (section 5 and app. B). Such observations imply that critical flow
conditions do not occur at the weir crest but upstream of the weir crest for (H1-D)/R > 0.4. And the flow
is supercritical at the crest.
D.4 Discussion
Development No. 1
Considering the overflow above a circular weir, let us consider the streamline formed by the channel bed
: i.e., the upstream channel bottom and the weir invert. The Bernoulli equation along the solid boundary
streamline, and applied between the upstream flow location [1] and the crest, gives :
d1 = D + Pcrestρw*g +
VS2
2 * g (D-7)
where d1 is the upstream flow depth, D is the weir height, Pcrest is the invert pressure on the crest and
VS is the invert velocity on the crest (fig. D-1). Note that the upstream bottom velocity is typically zero.
At the crest of the circular weir, the pressure gradient is less than hydrostatic and the bottom pressure (i.e.
invert pressure) can be rewritten as :
Pcrest = λcrest * ρw * g * dcrest (D-8)
where λcrest is a invert pressure correction coefficient which is less than unity at the crest of a circular
weir. Further the velocity distribution is not uniform and the invert velocity at the crest may be estimated
as :
VS = k' * qw
dcrest (D-9)
where k' is a coefficient of proportionality. k' is usually larger than unity for large weir heights (i.e.
D/R >> 1) as observed by several researchers (e.g. FAWER 1937, ROUVE and INDLEKOFER 1974,
RAMAMURTHY et al. 1994).
After transformation, the Bernoulli equation (eq. (D-7)) becomes :
d1 - D
dc = λcrest *
dcrestdc
+ 12 * (k')2 *
⎝⎜⎛
⎠⎟⎞dc
dcrest
2 (D-10)

D-4
where dc is the critical flow depth (eq. (D-5)). Equation (D-10) provides a relationship between the flow
depth at the crest, the critical flow depth, the crest invert velocity coefficient k' and local pressure
correction coefficient λcrest :
k' = 2 * ⎝⎜⎛
⎠⎟⎞3
2 - λcrest * dcrest
dc -
12 *
⎝⎜⎛
⎠⎟⎞dc
d1
2 * ⎝⎜⎛
⎠⎟⎞dc
dcrest
2 (D-11)
Equation (D-11) is plotted on figure D-2 for several ratios dcrest/dc (assuming d1 >> dc).
Fig. D-2 - Relationship between the crest invert velocity coefficient k' and the local pressure correction
coefficient λcrest (eq. (D-11)) for slow upstream flow (i.e. d1 >> dc)
0.80
1.00
1.20
1.40
1.60
1.80
0.30 0.50 0.70 0.90
dcrest/dc=1.05dcrest/dc=1dcrest/dc=0.95dcrest/dc=0.90dcrest/dc=0.8
λ
k'assuming d1 >> dc
crest
Development No. 2
At the crest invert, the fluid is subjected to the gravity acceleration and to the centrifugal acceleration.
And the local pressure correction coefficient equals :
λcrest = 1 - VS
2
g * R (D-12)
where R is the curvature radius of the crest.

D-5
The Bernoulli equation (eq. (D-7)) becomes :
d1 - D = dcrest - (k')2 * qw
2
g * R * dcrest +
(k')2 * qw2
2 * g * dcrest2 (D-13)
Equation (D-13) yields :
k' = VSqw
dcrest
=
32 -
dcrestdc
- 12 *
⎝⎜⎛
⎠⎟⎞dc
d1
2
12 *
⎝⎜⎛
⎠⎟⎞dc
dcrest
2 -
dcR *
⎝⎜⎛
⎠⎟⎞dc
dcrest
(D-14)
where : dc/R = 2/3*(H1-D)/R.
Equations (D-7) and (D-14) are developed neglecting the effects of the developing boundary layer along
the crest invert. RAMAMURTHY et al. (1994) observed that the boundary layer was very thin and that
the effects of the boundary layer were negligible.
It is worth noting that equation (D-14) has a solution only when the denominator of the fraction is
positive and non-zero. That is :
dcrest
dc ≤
12 *
Rdc
= 34 *
RH1 - D (D-15)
Equation (D-15) is compared with experimental data on figure D-3. At low overflows (i.e. (H1-D)/R <
0.8), the experimental results satisfy equation (D-15). For larger overflows, the data departs from
equation (D-15), suggesting that the assumption underlying eq. (D-15) is not valid : i.e., at large flow
rates, the assumption of ideal-fluid overflow is no longer valid.
Comments
FAWER (1937) performed very careful measurements of the velocity and pressure distributions at the
crest of a laboratory model (table 6-1). The geometry was : D = 0.3325 m and R = 0.0325 m, and the
flow conditions were qw = 0.05033 m2/s and H1-D = 0.0768 m. His measurements indicated : Vs = 0.74
m/s, VS = 1.52 m/s, dcrest = 0.0537 m and λcrest = 0.80.
For such experimental results, equation (D-12) predicts λcrest = 0.72 which is very close to the
experimental value. On the other hand, equation (D-14) does not have a solution for FAWER's
experiment, and the experimental result dcrest/dc = 1.05 cannot be predicted.

D-6
Fig. D-3 - Dimensionless flow depth at crest : comparison between experimental data (experiments series
QI, QIIA and QIIA, table 2-1) and the limiting case (eq. (D-15))
0.5
0.7
0.9
1.1
1.3
1.5
0 0.5 1 1.5 2 2.5
Cyl. 1 (Series QI & QIIA)Cyl. 2 (Series QIIA)Cyl. 3 (Series QIIA)Cyl. 4 (Series QIIA)Cyl. 4 (Series QIIIA)Limiting case EQ. (D-15)
HW/R
dcrest/dc