outperformers maintaining asean countries …
TRANSCRIPT

Kaushik Das | Singapore
Diaan-Yi Lin | Singapore
Anu Madgavkar | Mumbai
Kevin Russell | Jakarta
Jeongmin Seong | Shanghai
Kevin Sneader | Hong Kong
Oliver Tonby | Singapore
Jonathan Woetzel | Shanghai
OUTPERFORMERS MAINTAINING ASEAN COUNTRIES’ EXCEPTIONAL GROWTH
DISCUSSION PAPERSEPTEMBER 2018
PRODUCED FOR SINGAPORE SUMMIT 2018

Copyright © McKinsey & Company 2018
Since its founding in 1990, the McKinsey Global Institute (MGI) has sought to develop a deeper understanding of the evolving global economy. As the business and economics research arm of McKinsey & Company, MGI aims to provide leaders in the commercial, public, and social sectors with the facts and insights on which to base management and policy decisions.
MGI research combines the disciplines of economics and management, employing the analytical tools of economics with the insights of business leaders. Our “micro-to-macro” methodology examines microeconomic industry trends to better understand the broad macroeconomic forces affecting business strategy and public policy. MGI’s in-depth reports have covered more than 20 countries and 30 industries. Current research focuses on six themes: productivity and growth, natural resources, labour markets, the evolution of global financial markets, the economic impact of technology and innovation, and urbanisation.
Recent reports have assessed the digital economy, the impact of AI and automation on employment, income inequality, the productivity puzzle, the economic benefits of tackling gender inequality, a new era of global competition, Chinese innovation, and digital and financial globalisation.
MGI is led by three McKinsey & Company senior partners: Jacques Bughin, Jonathan Woetzel, and James Manyika, who also serves as the chairman of MGI. Michael Chui, Susan Lund, Anu Madgavkar, Jan Mischke, Sree Ramaswamy, and Jaana Remes are MGI partners, and Mekala Krishnan and Jeongmin Seong are MGI senior fellows. Project teams are led by the MGI partners and a group of senior fellows, and include consultants from McKinsey offices around the world. These teams draw on McKinsey’s global network of partners and industry and management experts.
Advice and input to MGI research are provided by the MGI Council, members of which are also involved in MGI’s research. MGI Council members are drawn from around the world and from various sectors and include Andrés Cadena, Sandrine Devillard, Tarek Elmasry, Katy George, Rajat Gupta, Eric Hazan, Eric Labaye, Acha Leke, Scott Nyquist, Gary Pinkus, Sven Smit, Oliver Tonby, and Eckart Windhagen. In addition, leading economists, including Nobel laureates, act as advisers to MGI research.
The partners of McKinsey fund MGI’s research; it is not commissioned by any business, government, or other institution. For further information about MGI and to download reports, please visit www.mckinsey.com/mgi.

WHAT’S INSIDE
In brief Page 2
1. ASEAN is a region of outperformers Page 3
2. The pro-growth agenda that underpins ASEAN economic performance Page 6
3. Big companies are an essential factor of success Page 18
4. Opportunities and challenges in changing times Page 27
5. How governments and companies can build on ASEAN’s momentum Page 40
Further reading Page 44
About Mckinsey & Company In Southeast Asia McKinsey & Company in Southeast Asia is one of the firm’s fastest-growing office complexes. Since establishing the Jakarta office in 1995, McKinsey has opened offices and Digital Labs in Malaysia, Singapore, the Philippines, Thailand, Myanmar, Indonesia, and Vietnam. Across these offices, over 700 colleagues solve our clients’ toughest challenges.
From established regional and multinational companies to startups and local disruptors, we serve a diverse client base, across industries. A longstanding trusted advisor on strategy, we are now recognised as a leader in implementation and digital. Increasingly, we use analytics and technology to build new businesses and transform existing ones. Despite how we have changed in recent years, we remain committed to regional impact. We partner with the public sector to translate the region’s rich opportunities into transformative economic and social growth. At McKinsey, we care most about the impact we have—on our clients, our communities, and the people of Southeast Asia.

IN BRIEF
OUTPERFORMERS: MAINTAINING ASEAN COUNTRIES’ EXCEPTIONAL GROWTH After several decades of strong and sustained economic growth, members of the Association of Southeast Asian Nations (ASEAN) make up almost half of the world’s best-performing developing economies. The challenge for the region is to maintain its growth momentum—and continue narrowing the per capita GDP gap with high-income countries—in changing times marked by rapid technological advances and demographic shifts. While people in ASEAN countries have benefited from this economic surge in the form of rising prosperity, income inequality is growing in some countries and will need to be addressed.
� ASEAN is home to eight of 18 developing economies that averaged at least 3.5 percent annual per capita GDP growth over 50 years or 5 percent annual growth over 20 years. We call these fast-growing countries outperformers. Indonesia, Malaysia, Singapore, and Thailand met the 50-year target, and Cambodia, Laos, Myanmar, and Vietnam met the 20-year standard. While the Philippines did not meet either, its recent rapid growth could lift it to the ranks of outperformers in the future. Brunei was not considered in the study.
� Underlying this exceptional performance is a pro-growth agenda of productivity, income, and demand that features steps to boost capital accumulation, including forced savings and the growth of financial institutions. In ASEAN, capital accumulation has been the primary driver of growth along with positive domestic and external demand. Productivity growth has been less striking, particularly in the context of the Asian financial crisis of 1997.
� A second pillar of the growth agenda is the powerful role of large companies that not only lifted GDP in ASEAN countries but also encouraged productivity improvements in small and midsize local suppliers. Revenue from large firms equalled 37 percent of GDP in ASEAN countries, compared with 28 percent among emerging-economy peers. These firms are not only large but competitive, as the best-performing companies are subject to fierce competition at home. They also support the development of small and medium-size enterprises (SMEs) via purchasing and subcontracting, in which business generated by large firms is directly transmitted to smaller firms; large firms in turn benefit from a diversity of suppliers.
� Demographic change, increasing urbanisation, and technological disruption from automation will create opportunities and challenges for ASEAN members in the years ahead. For the growth momentum to continue, regional policy makers and business leaders will need to focus on three areas: digitally driven productivity, a reinvented labour force, and infrastructure development. These opportunities can support renewed productivity growth. With the right vision, bold investment, and adaptive policies, ASEAN countries could continue to outperform, doubling total GDP to nearly $5 trillion.

3McKinsey Global Institute Outperformers: Maintaining ASEAN countries’ exceptional growth
1. ASEAN IS A REGION OF OUTPERFORMERS Our analysis of developing economies around the world shows that just 18, about one in four, have accounted for the lion’s share of economic growth and rising consumption over the past half century—and eight of them belong to the Association of Southeast Asian Nations (ASEAN): Cambodia, Indonesia, Laos, Malaysia, Myanmar, Singapore, Thailand, and Vietnam.1
We identified these ASEAN outperformers after reviewing the per capita GDP growth—a measure of improvements in material living standards—of 71 developing economies over 50 years, starting in 1965.2 Seven of the 18 outperformers, including such well-known success stories as China and Singapore, achieved or exceeded annual per capita GDP growth of 3.5 percent for the entire 50-year period. This threshold is the average growth rate required by low- and lower middle-income economies over a 50-year period to achieve upper middle-income status, as defined by the World Bank.3 Four ASEAN members—Indonesia, Malaysia, Singapore, and Thailand—fall into this category of long-term outperformers, along with China, Hong Kong, and South Korea.4
Our analysis also found 11 more-recent, less-heralded outperformers that achieved average annual per capita GDP growth of at least 5 percent over the 20 years between 1996 and 2016. That was enough to raise low- and lower middle-income economies by one income bracket as defined by the World Bank.5 This group of recent outperformers also includes four ASEAN members—in this case, Cambodia, Laos, Myanmar, and Vietnam—along with Azerbaijan, Belarus, Ethiopia, India, Kazakhstan, Uzbekistan, and Turkmenistan (Exhibit 1).
1 Outperformers: High-growth emerging economies and the companies that propel them, McKinsey Global Institute, September 2018.
2 We selected the 71 from the World Bank’s June 2017 list of 218 economies, from which we excluded 99 economies with fewer than five million people, 28 economies for which there was insufficient data, and 20 advanced economies. That left 71 as our universe of developing economies.
3 The World Bank assigns the world’s economies into four income groups: high, upper middle, lower middle, and low. We set the threshold growth rate for long-term outperformers at 3.5 percent, which is the annual average growth rate required over a 50-year period for low- and lower middle-income economies to achieve upper middle-income status. For low-income economies, the threshold growth rate is 4.3 percent, and for lower middle-income economies it is 2.8 percent. The Data Blog, “New country classifications by income level: 2016–2017”, World Bank, July 1, 2016, worldbank.org.
4 For research on China’s transformation, see Digital China: Powering the economy to global competitiveness, McKinsey Global Institute, December 2017; China’s role in the next phase of globalization, McKinsey Global Institute, April 2017; China’s choice: Capturing the $5 trillion productivity opportunity, McKinsey Global Institute, June 2016; and From ‘Made in China’ to ‘Sold in China’: The rise of the Chinese urban consumer, McKinsey Global Institute, November 2006.
5 For recent outperformers, we set the threshold growth rate at 5.0 percent. Under the World Bank’s income classification, low- and lower middle-income countries must attain average annual growth of 5.4 percent to move up one income level over a 20-year period. Growth of 3.7 percent is needed for the move from low to lower middle income, while 7.1 percent growth is needed to rise from lower middle to upper middle income. Ibid. “New country classifications by income level”, World Bank, July 1, 2016.

4 McKinsey Global Institute 1. ASEAN is a region of outperformers
Exhibit 1
1 We excluded economies with populations of fewer than 5 million in 2016 and those with limited data availability.2 For the purposes of this discussion paper, we have defined high income economies as those that had gross national income
per capita of $6,000 or more in 1987, when the World Bank started classifying countries by income bands. The two exceptions are Hong Kong and Singapore, which are classified as outperformers in our paper because of the high rate of growth during the period analysed.
3 The long-term outperformer threshold of 3.5% compound annual growth rate of GDP per capita is the average growth rate required by low- (4.3%) and lower middle-income (2.8%) economies to achieve upper middle-income status over a 50-year period.
4 The recent outperformer threshold of 5% compound annual growth rate is derived from the average growth rate of 5.4% required by low- (3.7%) and lower-middle income (7.1%) economies to move up one income level over a 20-year period (from low to lower middle or lower middle to upper middle).
5 The middler threshold was between 0.95% and 3.5% compound annual growth rate over the period 1965–2015, or where economies did not meet the criteria for other cohorts. Very recent accelerators’ GDP per capita growth outpaced long-term outperformers’ (>3.5% compound annual growth rate) from 2006–16. Consistent growers’ GDP per capita grew consistently (albeit slowly) from 1965–2015 with a low coefficient of variation. Volatile growers’ GDP per capita regressed or exhibited a high coefficient of variation over at least one 10-year period from 1965–2015. Coefficient of variation defined as standard deviation of year-on-year growth ÷ simple average year-on-year growth 1965–2015.
6 The underperformer threshold of <0.95% compound annual growth rate of GDP per capita over the period 1965–2015 is equivalent to <50% of the rate achieved by the United States over the same period.
SOURCE: World Bank; McKinsey Global Institute analysis
Eighteen developing economies sustained long-term GDP per capita growth, outperforming their peers.
N = 91 countries1
High income2
Australia Austria Belgium Canada Denmark Finland France Germany Israel Italy Japan
Netherlands Norway Saudi Arabia Spain Sweden Switzerland United Arab
Emirates United Kingdom United States
Long-term outperformers3
Outpaced US growth consistently from 1965–2016 China Hong Kong Indonesia Malaysia Singapore South Korea Thailand
Recent outperformers4
Outpaced US growth consistently from 1995–2016 Azerbaijan Belarus Cambodia Ethiopia India Kazakhstan
Laos Myanmar Turkmenistan Uzbekistan Vietnam
Middlers5
No relative change: No or inconsistent improvement relative to US from 1965–2016Very recent accelerators Bangladesh Dominican
Republic Ghana Mozambique Peru Philippines Poland Rwanda Sri Lanka
Consistent growers Bulgaria Chile Colombia Czech
Republic Ecuador Egypt Hungary Morocco Nepal
Pakistan Portugal Romania Serbia Slovak
Republic Tanzania Turkey Uganda
Volatile growers Algeria Angola Argentina Brazil Greece Guatemala Honduras Iran Jordan Kenya Mexico Nigeria Paraguay
Underperformers6
Fallen behind: Slower relative growth than US from 1965–2016 Bolivia Cameroon Côte d’Ivoire El Salvador Kyrgyz Republic Lebanon Nicaragua Russia Senegal South Africa Ukraine Venezuela Zambia Zimbabwe

5McKinsey Global Institute Outperformers: Maintaining ASEAN countries’ exceptional growth
A ninth ASEAN member, the Philippines, did not meet either threshold for length of exceptional growth, but MGI named it a “very recent accelerator” because it is now one of the fastest-growing economies in the region.6
ASEAN economies differ considerably. Malaysia, for example, has a GDP per capita almost 50 percent higher than the next wealthiest ASEAN country, Thailand, and three to five times the average income of Indonesia, the Philippines, and Vietnam. Nonetheless, the region’s next-tier economies—Cambodia, Indonesia, Laos, Myanmar, the Philippines, and Vietnam—have become the association’s fastest growers, making ASEAN an example of both current and historical economic outperformance.
In this report we highlight reasons that the entire region has outperformed and examine differences in firm dynamics and government support that help explain outcomes at a detailed country-by-country level.
6 Outperformers: High-growth emerging economies and the companies that propel them, McKinsey Global Institute, September 2018.
Exhibit 16
Eighteen developing economies sustained long-term GDP per capita growth, outperforming their peers (continued).
SOURCE: World Bank; McKinsey Global Institute analysis
FAKE exh #!At the back for proper exh auto-numbering.
Exhibit 1 (continued)
NOTE: The maps displayed on the MGI website and in MGI reports are for reference only. The boundaries, colours, denominations, and any other information shown on these maps do not imply, on the part of McKinsey, any judgment on the legal status of any territory, or any endorsement or acceptance of such boundaries.

6 McKinsey Global Institute 2. The pro-growth agenda that underpins ASEAN economic performance
2. THE PRO-GROWTH AGENDA THAT UNDERPINS ASEAN ECONOMIC PERFORMANCE ASEAN’s outperformer economies are characterised by a pro-growth agenda of productivity, income, and demand. The agenda starts with greater productivity, made possible by accumulating capital and technology. The fruits of improved productivity are then distributed throughout the economy in the form of more jobs and higher wages for workers, lifting more people into the middle class, and in turn supporting higher levels of consumption and savings (Exhibit 2).
Companies reap increased profits, and governments collect higher tax revenue they can use to reinvest and to improve essential infrastructure. Wage growth translates into more disposable income, which boosts personal savings—some of it through mandatory payroll deductions for pension savings—as well as investment and household consumption. The agenda also supports open trade, further increasing demand and enabling integration with global supply chains.7
7 Outperformers: High-growth emerging economies and the companies that propel them, McKinsey Global Institute, September 2018.
Exhibit 2
A pro-growth cycle of productivity, income, and demand drove growth in outperforming economies.
Sustained, highGDP per capita
growth
Productivity
Income
Demand
Translating productivity into strong and inclusive income growth through▪ Higher wages
boosting household incomes and middle-class formation
▪ Increased corporate profit growth broadly distributed among companies
Boosting demand for production by▪ Driving higher domestic consumption and investment from income and credit growth▪ Supporting investment by mobilizing domestic savings and capital accumulation▪ Tapping into regional and global demand by enhancing global connectivity
Increasing productivity by▪ Promoting competition
and market efficiency▪ Investing in infrastructure
and mechanisation▪ Increasing total factor
productivity by improving technology, innovation, and processes
▪ Boosting scale of production and investing in talent
SOURCE: McKinsey Global Institute analysis

7McKinsey Global Institute Outperformers: Maintaining ASEAN countries’ exceptional growth
In ASEAN, domestic savings and capital accumulation were the primary drivers of growth from 1990 to 2015 (Exhibit 3). Productivity is a more nuanced story, as early high rates of growth before 1990 have more recently been offset by the impact of the 1997 Asian financial crisis.
DOMESTIC SAVINGS WAS KEY TO UNLOCKING GROWTH IN ASEAN By decomposing GDP growth, we found that the capital accumulation of ASEAN’s long-term outperformers accounted for between 2.9 percentage points (Thailand) and 4.7 percentage points (Malaysia) of average annual real GDP growth from 1990 to 2015; that compares with 3.7 percentage points for long-term outperformers outside ASEAN. Capital accumulation made an even larger contribution to GDP growth in three ASEAN recent outperformers: Vietnam (7.2 percentage points), Myanmar (6.2), and Cambodia (5.5). As in long-term outperformers, the governments overseeing these economies had a significant role in turning savings into capital investments, often through state-owned enterprises or government-linked investment companies. That said, Myanmar in particular faces some challenges in this, as a policy to keep 55 percent of state-owned enterprise profits as savings at the Myanmar Economic Bank (rather than being allocated to the national budget) has hindered turning savings into capital investments.8
When it comes to accumulating capital, a key differentiator between outperforming countries and what we call their middling and underperforming peers was that outperformers accumulated capital primarily through higher levels of domestic savings, as seen through a comparison of savings rates (gross savings as a percentage of GDP) and investment rates (gross fixed capital formation as a percentage of GDP).9 This is important because, as the MIT economist Robert Solow concluded half a century ago, high domestic savings rates are a key determinant of capital formation and growth, and reduce a country’s reliance on more volatile foreign capital inflows.10
Indonesia, Malaysia, Singapore, and Thailand have been some of the best domestic savers in the world since the 1970s. Between 2000 and 2015, Singapore saved the equivalent of 51 percent of its GDP, Malaysia saved
8 Andrew Bauer, et al., State-owned economic enterprise reform in Myanmar: The case of natural resource enterprises, Renaissance Institute and Natural Resource Governance Institute, January 2018.
9 Economies that we refer to as “middling performers” or “middlers” achieved no improvement or inconsistent improvement relative to United States from 1965 to 2016. “Underperformers” are those countries that lost ground to the United States because their economies grew slower than that of the US from 1965 to 2016.
10 Robert M. Solow, “A contribution to the theory of economic growth”, Quarterly Journal of Economics, 1956, Volume 70, Number 1, pp. 65–94; for additional details on volatility of capital inflows, see Rakesh Mohan and Muneesh Kapur, Liberalisation and regulation of capital flows: Lessons for emerging market economies, Stanford Center for International Development working paper number 399, October 2009.

8 McKinsey Global Institute 2. The pro-growth agenda that underpins ASEAN economic performance
Exhibit 3
Capital accumulation has been the major factor input for economic growth in ASEAN.
GDP growth decompositionContribution to real GDP growth, 1990–20151
% (N = 83 countries)
1.8
2.2
4.9
3.5
4.4
5.5
6.2
7.2
3.5
4.3
3.8
2.9
4.7
4.0Singapore
China
Vietnam
ASEAN
Indonesia
Malaysia
High income
Thailand
Cambodia
Other long-termoutperformers
Other emerging
India
Other recentoutperformers
Myanmar
1.2
0.9
0.3
4.4
0.9
–0.1
–0.4
–0.2
–0.2
–1.6
–0.6
–0.2
–0.5
–0.5
0.2
0.3
0.4
0.7
0.6
0.3
0.1
0.2
0.3
0.7
0.4
0.4
0.3
0.4
0.8
1.0
1.0
0.8
1.5
0.8
0.9
0.4
0.7
0.9
0.1
1.1
1.6
SOURCE: The Conference Board Total Economy Database; Economics Analytics Platform; World Bank; McKinsey Global Institute analysis
1 Simple average across economies within cohorts and across years within countries; 1995–2015 for recent outperformers.2 Long-term outperformers’ low rate of total factor productivity growth was caused, in part, by the 1997 Asian financial crisis.
Further, capital accumulation and total factor productivity were likely lower for long-term outperformers over this period as the growth accelerations in these economies commenced prior to 1990. For example, from 1965 to 1990, South Korea’s average growth of output attributable to total factor productivity is estimated to be 2.39%, while capital’s contribution was 4.27% compared with total output growth averaging 8.78% per year (Singh and Trieu, 1996).
3 Labour quality or contribution data are constructed using data on employment and compensation by educational attainment. These data are collected from various sources, including Eurostat, World Input-Output Database, and various country-specific KLEMS (capital, labour, energy, material, and services) databases.
Capital accumulation
Total factor productivity2
Labour quality contribution3
Labour quantity contribution
High income
ASEAN
Other emerging
Recent outperformers
Long-term outperformers

9McKinsey Global Institute Outperformers: Maintaining ASEAN countries’ exceptional growth
40 percent, Indonesia 32 percent, and Thailand 30 percent.11 Historically, compulsory savings in pension plans aided these savings rates. By the late 1990s, for example, compulsory savings in Malaysia’s Employees Provident Fund accounted for 8 percent of disposable income in that country, while mandatory savings in Singapore’s Central Provident Fund accounted for 15 percent of disposable income in that country. Savings rates also rose because an increasing share of the population had regular employment and growing per capita income, making it easier to save.12 More recently, savings in Malaysia decreased from 44 percent of GDP in 2008 to 33 percent in 2015; this correlated with an increase in household debt from just over 60 percent of GDP to above 85 percent, before levelling off.13
High savings rates correlate with robust investment.14 On average, long-term outperformers invest around 30 percent of GDP and recent outperformers about 20 percent, compared with 17 percent for middling and underperformer economies. ASEAN’s long-term outperformers range from 24 percent (Malaysia) to 29 percent (Indonesia).15 Ample domestic savings has reduced outperformers’ reliance on more volatile foreign capital and facilitated the kind of consistent capital accumulation that enables capacity expansion and infrastructure development.16 The effective use of capital, however, has sometimes been fettered by a lack of government commitment or managerial skill. For example, while most countries have infrastructure master plans, translating these plans into actual projects remains a challenge. A McKinsey survey of 7,786 Southeast Asian projects from 2007 to 2017 reveals that in some countries, up to 11 percent of announced projects have been cancelled or indefinitely delayed. As a result, ASEAN countries (excluding Singapore) spent an average of about 3.5 percent of GDP on infrastructure between
11 IMF Investment and Capital Stock Dataset.12 For more, see Anand Chandavarkar, “Saving behaviour in the Asian–Pacific region”,
Asian-Pacific Economic Literature, 1993, Volume 7, Issue 1; Hamid Faruqee and Aasim M. Husain, “Saving trends in Southeast Asia: A cross-country analysis”, Asian Economic Journal, 1998, Volume 12, Issue 3; and Ahmad Z. Baharumshah and Marwan A. Thanoon, “Determinants of gross national saving in Malaysia: A macroeconomic analysis 1960–2000”, Savings and Development, 2003, Volume 27, Issue 4. Note that even with high savings, in some cases investment exceeded gross domestic savings, such as Malaysia before the Asian crisis where a net of 6.8 percent of GNP was provided by foreign sources (Baharumshah and Thanoon).
13 “Malaysia household debt: % of GDP, CEIC data”, updated on May 17, 2018, ceicdata.com.
14 See, for example, Marianne Baxter and Mario J. Crucini, “Explaining saving-investment correlations”, The American Economic Review, 1993, Volume 83, Number 3, pp. 416–36; and Stefan Sinn, “Saving-investment correlations and capital mobility: On the evidence from annual data”, The Economic Journal, 1992, Volume 102, Number 414, pp. 1162–70.
15 IMF Investment and Capital Stock Dataset.16 Sze Wei Yong, Rosita Haji Suhaimi, and Jerome Swee Hui Kueh, “Analysis of
international capital mobility in ASEAN 5 countries: Savings-investment nexus”, Malaysian Journal of Economics, 2016, Volume 50, Number 2, pp. 155–65.

10 McKinsey Global Institute 2. The pro-growth agenda that underpins ASEAN economic performance
1992 and 2013, the second-lowest developing region after Latin America, and significantly lower than China (8.6 percent), India (4.9 percent), the Middle East (4.3 percent), and Eastern Europe (4.1 percent).17
ASEAN HAS SUCCEEDED IN MOBILIZING DOMESTIC DEMAND Domestic demand in the form of rising household incomes has also played an important role in ASEAN’s growth story. From 2000 to 2014, household income in the region as a whole grew 3.5 percent annually, ranging from 2.8 percent in Malaysia to 5.0 percent in Vietnam.18 Rising household income across ASEAN countries has led to significant increases in the number of people rising to the “consuming classes”—that is, people with incomes high enough to become significant consumers of goods and services.19 In Indonesia, the proportion of people in the consuming classes considered either middle class or affluent climbed by 14 percentage points, to 51 percent of the population, between 2005 and 2015. Similar gains occurred in Vietnam, where the consuming classes rose from 11 to 24 percent, and in Cambodia, where the consuming classes more than doubled, from 10 to 21 percent. Even countries that were doing well in 2005 have gained since then. Malaysia’s consuming classes grew by ten percentage points, to 88 percent of the population, while the same classes in Singapore inched up one percentage point, to 97 percent.
Governments have played an important role in supporting incomes for broad populations, often through progressive taxation and redistribution (although this may not be the case in all countries).20 All ASEAN countries except Singapore and Brunei have minimum wages.21 Long-term outperformers also stand out for the efficiency with which they provide public goods, public health, and novel labour policies, which have boosted productivity. Singapore, for example, encourages women to remain in the workforce after having children by offering a “working mother child relief” tax credit and childcare subsidies.
Despite such broad income gains throughout the region, economic inequality is a looming concern in some ASEAN countries—both the more
17 Bridging global infrastructure gaps, McKinsey Global Institute and McKinsey’s Capital Projects and Infrastructure Practice, June 2016.
18 McKinsey Global Growth model; 3.5 percent is a simple average across ASEAN countries’ individual growth rates.
19 We define consuming classes or consumers as those individuals with an annual income of more than $3,600, or $10 per day at purchasing power parity, using constant 2005 PPP dollars. See Urban world: Cities and the rise of the consuming class, McKinsey Global Institute, June 2012.
20 See, for example: Kunta Nugraha and Phil Lewis, “The impact of taxation on income distribution: Evidence from Indonesia”, The Singapore Economic Review, 2013, Volume 58, Number 4; Nora Lustig, “Inequality and fiscal redistribution in middle income countries: Brazil, Chile, Colombia, Indonesia, Mexico, Peru, and South Africa”, Journal of Globalization and Development, 2016, Volume 7, Issue 1, pp. 17–60.
21 Minimum wage in ASEAN countries, ASEAN Trade Union Council, November 2017, aseantuc.org.

11McKinsey Global Institute Outperformers: Maintaining ASEAN countries’ exceptional growth
developed long-term outperformers and the more recent outperformers, which have different income distributions. Household income in the original ASEAN nations—Indonesia, Malaysia, the Philippines, Singapore, and Thailand, sometimes referred to as the ASEAN 5—is significantly higher than in the region’s so-called next-tier economies: Cambodia, Laos, Myanmar, and Vietnam. In 2015, only 18 percent of ASEAN 5 households were in the lowest income bracket of MGI’s Cityscope database, compared with 31 percent in the other countries collectively.
As measured by the Gini coefficient, inequality is relatively high (exceeding 0.40) in Indonesia, Malaysia, the Philippines, and Thailand, although Malaysia and Thailand showed a slight decline between 2000 and 2015 (Exhibit 4).22 While these figures are lower than China’s 0.51 in 2014, they are higher than those of developed nations such as the United States (0.38) and Germany (0.29).23 Indonesia in particular has recently experienced a sharp upward trend. At the same time, the number of people in poverty dropped from 9 to 5 percent in Indonesia between
22 Gini coefficient values range from zero, which represents complete equality, to one, which represents extreme inequality. For more on the coefficient, see Lidia Ceriani and Paolo Verme, “The origins of the Gini index: Extracts from Variabilità e Mutabilità (1912) by Corrado Gini”, The Journal of Economic Inequality, 2012, Volume 10, Number 3, pp. 421–43.
23 Frederick Solt, “The Standardized World Income Inequality Database”, Social Science Quarterly, 2016, Volume 97, Number 5, pp. 1267–81 (data updated March 2018). We note that this comparison may not be entirely fair as inequality is inevitable during rapid urbanisation, as is happening in most of the high-growth economies. If incomes grow reasonably across income brackets (e.g., as in China), this inequality is more manageable than in developed economies with stagnant incomes.
Exhibit 4
Economic inequality is relatively high among ASEAN members.
Gini coefficient of selected countries
SOURCE: The Standardized World Income Inequality Database; McKinsey Global Institute analysis
0
0.25
0.35
0.30
0.45
0.40
0.55
0.50
ASEAN states Other countries
Mexico
Poland
Malaysia
Brazil
Indonesia
United States
Singapore
Thailand
Vietnam
Germany
Philippines China
2000 05 10 2015

12 McKinsey Global Institute 2. The pro-growth agenda that underpins ASEAN economic performance
2005 and 2015. Indeed, many factors complicate the picture, such as urbanisation, demographics, the impact of technology, and data collection challenges. For instance, while urbanisation drives growth, it can also drive inequality. While progressive taxation and redistribution are critical to ensuring broad benefits of national income, so are efficient labour markets, education, and mobile healthcare benefits so that people’s living standards improve as productive opportunities arise.
ASEAN also benefited from regional demand integration Outperformer economies in ASEAN and elsewhere also increased their share of worldwide flows in goods, services, and finance (Exhibit 5). This deepened the supply chain in ASEAN, in turn increasing the share of value added from ASEAN sources—much as it did on a large scale in China—as well as increasing returns for labour and capital across a more diverse range of products and services.
Exhibit 5
Outperformers, including in ASEAN, have gained share in global goods, services, and financial flows.
Share of all countries’ total inflows and outflows% by cohort
1 Includes long-term outperformers and recent outperformers described in Outperformers: High-growth emerging economies and the companies that propel them, McKinsey Global Institute, September 2018.
2 Financial flows include foreign direct investment, portfolio investment (equity, debt), other financial flows (loans, reserves, remittances), and financial stock.
NOTE: Numbers may not sum to 100% because of rounding.
SOURCE: World Bank; MGI Global Flows database; McKinsey Global Institute analysis
76
54
16
17
23
7
20151980
53
ServicesGoods Financial2
High income
Otheroutperformers1
Otheremerging economies
ASEAN
7963
15
13
17
7
20151980
4 2
90
67
13
713
7
20151980
11

13McKinsey Global Institute Outperformers: Maintaining ASEAN countries’ exceptional growth
PRODUCTIVITY GROWTH HAS BEEN MIXED FOR ASEAN COUNTRIES The influence of another factor in economic development—total factor productivity, a gauge of the efficient use of resources because of such influences as technology, innovation, and improved management—has been mixed in Southeast Asia.24
For outperformers worldwide, TFP accounted for a full percentage point of annual GDP growth on average from 1990 to 2015, compared with 0.9 percentage point in Myanmar and Thailand, and negative contributions in Cambodia, Indonesia, Malaysia, Singapore, and Vietnam.25 While the Asian financial crisis in 1997 did indeed set back TFP growth in many ASEAN countries (Exhibit 6), the region consistently underperformed the rest of Asia, both before the crisis and in the post-
24 Robert E. Hall and Charles I. Jones, “Why do some countries produce so much more output per worker than others?” The Quarterly Journal of Economics, 1999, Volume 114, Number 1, pp. 83–116.
25 Nirvikar Singh and Hung Trieu, Total factor productivity growth in Japan, South Korea, and Taiwan, University of California, Santa Cruz, working paper, July 1996.
Exhibit 6
Indonesia, Malaysia, and Singapore were hit hardest by the 1997 Asian financial crisis, with total factor productivity shrinking in Malaysia and Singapore until 1999 and in Indonesia until 2000.
SOURCE: The Conference Board Total Economy Database; Economics Analytics Platform; World Bank; McKinsey Global Institute analysis
Annual growth of total factor productivity%
-6
-2
-8
-14
-16
-10
-12
2
6
4
8
-4
0Vietnam
Indonesia
Thailand
Myanmar
Singapore
Cambodia
Philippines
Malaysia
1990 95 2000 05 10 2016

14 McKinsey Global Institute 2. The pro-growth agenda that underpins ASEAN economic performance
recovery years. This has been largely attributed to a low share of value added in services, which was not a focus area for factors such as deregulation, foreign direct investment, transfer of know-how, openness, and competition policies—the very factors that drive TFP growth in manufacturing.26
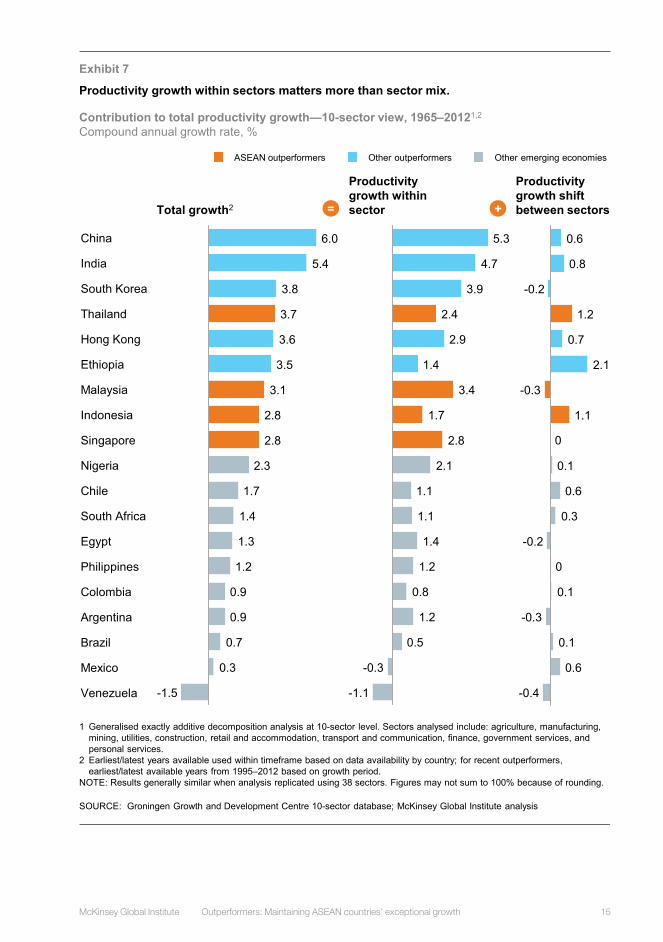
Taking a longer time frame, labour productivity growth—defined as the combined effect of capital, labour quality, and TFP—has been relatively high in ASEAN countries, driven by productivity growth within sectors rather than from the mix across sectors (Exhibit 7). This implies that the role of productive firms is a key determinant of performance. In other words, success hinged less on finding the “right” sectors than on identifying competitive advantages within legacy sectors and continuously driving productivity improvements.27
In the outperforming economies of Malaysia and Singapore, governments cultivated productive sectors by helping to overcome market failures that otherwise inhibited comparative advantages. These governments were also flexible, adapting to local circumstances, as when Singapore overcame its limited resources and size by opening up to international investment while continuing to have the state control airlines and real estate.28 Malaysia built infrastructure efficiently and executed a long-term policy of reducing barriers to entry in manufacturing, attracting foreign investment and technology, and reaching export markets throughout the 1980s and ’90s.
Recent trends in pro-growth indicators differ across ASEAN based on levels of development While there are country-level differences across all elements of the growth cycle, some patterns are associated with level of development (Exhibit 8). For example, while the long-term outperformers Indonesia, Malaysia, Singapore, and Thailand grew based on high domestic savings, the next-tier economies of Cambodia, Laos, Myanmar, and Vietnam have seen more rapid increases in savings over the past two decades. Singapore and Malaysia have stabilised at relatively high ranks of the Global Innovation Index (fifth and 35th, respectively, in 2018), while the Philippines and Vietnam both climbed nine spots between 2013 and 2016, albeit from lower starting points.29 Similarly, while internet penetration is very
26 Florence Jaumotte et al., “Asia rising: Patterns of economic development and growth”, in World Economic Outlook, International Monetary Fund, September 2006.
27 We acknowledge that sectors do grow at different rates given the availability of domestic and export demand. In particular, agricultural demand peaks at relatively low levels of per capita income and thus agriculture declines in importance as a sector as economic development levels increase.
28 Outperformers: High-growth emerging economies and the companies that propel them, McKinsey Global Institute, September 2018.
29 Soumitra Dutta, Bruno Lanvin, and Sacha Wunsch-Vincent, eds., Global Innovation Index 2018: Energizing the world with innovation, Cornell University, INSEAD, and the World Intellectual Property Organization, 2018.
15McKinsey Global Institute Outperformers: Maintaining ASEAN countries’ exceptional growth
Exhibit 7
Productivity growth within sectors matters more than sector mix.
-1.1
-0.3
0.5
1.2
0.8
1.2
1.4
1.1
1.1
2.1
2.8
1.7
3.4
1.4
2.9
2.4
3.9
4.7
5.3
-1.5
0.3
0.7
0.9
0.9
1.2
1.3
1.4
1.7
2.3
2.8
2.8
3.1
3.5
3.6
3.7
3.8
5.4
6.0
South Africa
Egypt
Colombia
Philippines
Chile
South Korea
Thailand
India
China
Venezuela
Brazil
Argentina
Mexico
Ethiopia
Hong Kong
Nigeria
Indonesia
Malaysia
Singapore
Productivity growth within sector
Productivity growth shift between sectors
Contribution to total productivity growth—10-sector view, 1965–20121,2
Compound annual growth rate, %
-0.4
0.6
0.1
-0.3
0.1
-0.2
0.3
0.6
0.1
1.1
2.1
0.7
1.2
0.8
0.6
-0.2
-0.3
0
0
Total growth2
Other outperformers Other emerging economiesASEAN outperformers
+=
1 Generalised exactly additive decomposition analysis at 10-sector level. Sectors analysed include: agriculture, manufacturing, mining, utilities, construction, retail and accommodation, transport and communication, finance, government services, and personal services.
2 Earliest/latest years available used within timeframe based on data availability by country; for recent outperformers, earliest/latest available years from 1995–2012 based on growth period.
NOTE: Results generally similar when analysis replicated using 38 sectors. Figures may not sum to 100% because of rounding.
SOURCE: Groningen Growth and Development Centre 10-sector database; McKinsey Global Institute analysis

16 McKinsey Global Institute 2. The pro-growth agenda that underpins ASEAN economic performance
Exhibit 8
ASEAN heat map by country identifies opportunities and challenges across the pro-growth agenda.
1 Represents which quartile of the 71 economies the average of the archetype would fall in. For example, a green square means the average of this archetype has a similar level in an indicator as top-quartile countries.
SOURCE: World Bank; The Conference Board; IHS; IMF; Economic Complexity Index; Oxford Economics; McKinsey Global Institute analysis
Performance within emerging markets1 Third quartileFirst quartile Fourth quartileSecond quartile
Country
Singapore
Malaysia
Thailand
Indonesia
Philippines
Vietnam
Laos
Myanm
ar
Cam
bodia
Score 3.9 3.9 3.5 4.1 4 5 4.5 5.3 5.3Score rank 31 35 50 22 29 7 14 5 4Econom
ic perform
ance
GDP per capita, 2016Real $ thousand 52.6 11.0 5.9 4.0 2.8 1.8 1.6 1.4 1.1
Real GDP per capitaCAGR, 1996–2016, % 2.9 2.5 2.4 2.6 2.9 5.1 5.4 8.9 5.8
Productivity drivers
Domestic savingsCAGR, 1996–2016, % 5 3 3 4 5 8 13 6 16
Foreign direct investmentCAGR, 1996–2016, %
9 4 0 -5 7 4 5 11 9
Market cap. of listed domestic companiesCAGR, 1996–2016, %
7 0 7 5 4 9 n/a n/a n/a
Global Innovation IndexRank change, 2013–16, %
1 -2 0 -6 9 9 0 0 6
Economic complexity% change, 1996–16 n/a 108 2,499 52 191 75 3 n/a 49
Internet penetration% average, 2000–16 65 52 21 9 20 n/a n/a 5 5
Government health expenditureCAGR, 2000–15, %
10 9 7 10 5 8 5 22 7
Government education expenditureCAGR, 1996–2016, %
4 4 4 11 1 n/a 7 n/a 9
Working-age population% change, 1996–2016 1.5 8.3 3.5 4.5 6 11 10.8 6.2 13.7

17McKinsey Global Institute Outperformers: Maintaining ASEAN countries’ exceptional growth
high in the former pair, the next-tier economies are boosting expenditure in basic infrastructure—a core challenge for these expansive countries that we return to below. The region as a whole continues to benefit from high ranks on the MGI Connectivity Index, which measures the flow of trade, finance, people, and data, and growth in economic complexity and exports.
Exhibit 17
ASEAN heat map by country identifies opportunities and challenges across the pro-growth agenda.
1 Represents which quartile of the 71 economies the average of the archetype would fall in. For example, a green square means the average of this archetype has a similar level in an indicator as top-quartile countries.
SOURCE: World Bank; The Conference Board; IHS; IMF; Economic Complexity Index; Oxford Economics; McKinsey Global Institute analysis
Performance within emerging markets1 Third quartileFirst quartile Fourth quartileSecond quartile
Country
Singapore
Malaysia
Thailand
Indonesia
Philippines
Vietnam
Laos
Myanm
ar
Cam
bodia
Score 3.9 3.9 3.5 4.1 4 5 4.5 5.3 5.3Score rank 31 35 50 22 29 7 14 5 4Incom
e and dem
and drivers
Labour market efficiency% change, 2006–16
1 -1 -16 -14 6 -1 -2 3 -6
Female participation% average, 1996–16 52 48 65 50 48 71 79 52 77
Household incomeCAGR, 1996–2014, % 3 3 2 2 3 5 n/a n/a n/a
% of population above middle-class thresholdChange, 2005–15
2 11 8 15 12 13 12 22 11
Corporate incomeCAGR, 1996–2014, % 7 7 4 8 6 11 n/a n/a n/a
ExportsCAGR, 1996–2016, % 7 4 6 4 5 14 6 n/a 16
MGI Connectedness IndexScore, 2016
51 8 8 2 2 8 1 0 1
Infrastructure investmentCAGR, 2000–15, %
1 5 4 8 4 5 n/a n/a n/a
Exhibit 8 (continued)
FAKE exh #!At the back for proper exh auto-numbering.
18 McKinsey Global Institute 3. Big companies are an essential factor of success
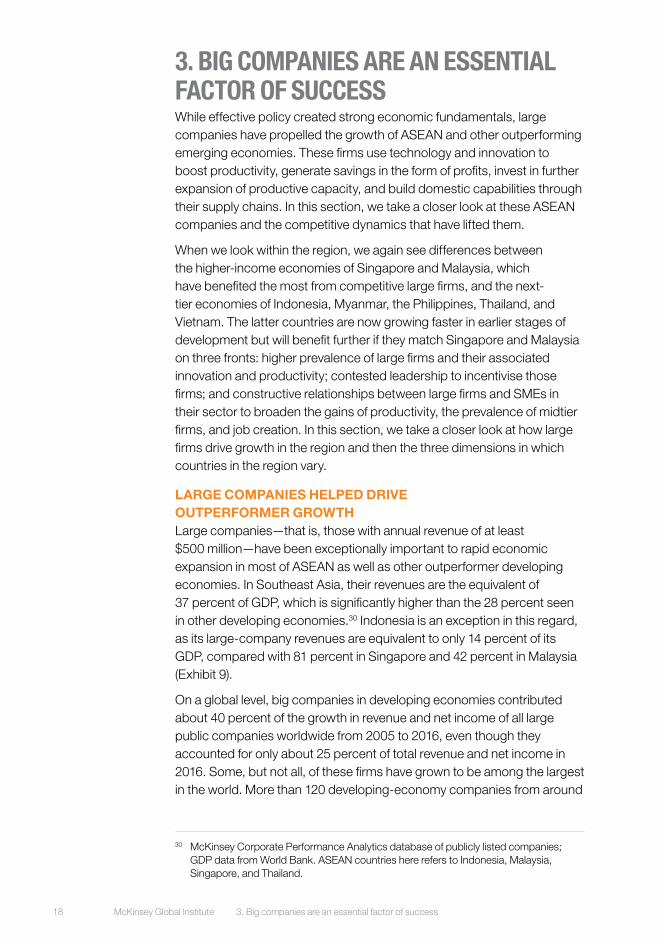
3. BIG COMPANIES ARE AN ESSENTIAL FACTOR OF SUCCESS While effective policy created strong economic fundamentals, large companies have propelled the growth of ASEAN and other outperforming emerging economies. These firms use technology and innovation to boost productivity, generate savings in the form of profits, invest in further expansion of productive capacity, and build domestic capabilities through their supply chains. In this section, we take a closer look at these ASEAN companies and the competitive dynamics that have lifted them.
When we look within the region, we again see differences between the higher-income economies of Singapore and Malaysia, which have benefited the most from competitive large firms, and the next-tier economies of Indonesia, Myanmar, the Philippines, Thailand, and Vietnam. The latter countries are now growing faster in earlier stages of development but will benefit further if they match Singapore and Malaysia on three fronts: higher prevalence of large firms and their associated innovation and productivity; contested leadership to incentivise those firms; and constructive relationships between large firms and SMEs in their sector to broaden the gains of productivity, the prevalence of midtier firms, and job creation. In this section, we take a closer look at how large firms drive growth in the region and then the three dimensions in which countries in the region vary.
LARGE COMPANIES HELPED DRIVE OUTPERFORMER GROWTH Large companies—that is, those with annual revenue of at least $500 million—have been exceptionally important to rapid economic expansion in most of ASEAN as well as other outperformer developing economies. In Southeast Asia, their revenues are the equivalent of 37 percent of GDP, which is significantly higher than the 28 percent seen in other developing economies.30 Indonesia is an exception in this regard, as its large-company revenues are equivalent to only 14 percent of its GDP, compared with 81 percent in Singapore and 42 percent in Malaysia (Exhibit 9).
On a global level, big companies in developing economies contributed about 40 percent of the growth in revenue and net income of all large public companies worldwide from 2005 to 2016, even though they accounted for only about 25 percent of total revenue and net income in 2016. Some, but not all, of these firms have grown to be among the largest in the world. More than 120 developing-economy companies from around
30 McKinsey Corporate Performance Analytics database of publicly listed companies; GDP data from World Bank. ASEAN countries here refers to Indonesia, Malaysia, Singapore, and Thailand.

19McKinsey Global Institute Outperformers: Maintaining ASEAN countries’ exceptional growth
the world have appeared at least once on the Fortune Global 500 list since 2000; six ASEAN companies were on the list in 2017.31
The best-performing companies also outdid advanced-economy firms on a key performance indicator: total return to shareholders. Between 2014 and 2016, total return to shareholders from the top quartile of outperformer companies was 23 percent on average, compared with 15 percent for top-quartile firms in high-income countries and 13 percent in non-outperformer emerging economies. However, return on invested capital was higher among companies in high-income countries, since emerging-economy firms tend to focus on growth rather than maximizing profit.
31 The six were Pertamina of Indonesia, PTT of Thailand, Petronas of Malaysia, and Trafigura, Wilmar, and Flex of Singapore, fortune.com/global500. (Note: Trafigura, a global commodities trader, was founded in the Netherlands and incorporated in Singapore in 1996; only 43 percent of its revenue comes from Asia–Pacific.)
Exhibit 9
Big firms have driven economic growth in ASEAN members, as they have in China and India.
Ratio of large-company revenue to GDP, 1995–20161
% (N = 24 economies; 6,716 companies)2,3
1 Simple average across countries.2 High-income economies include Canada, France, Germany, Italy, Japan, United Kingdom, and United States; other
developing economies include Argentina, Brazil, Egypt, Mexico, Nigeria, Pakistan, Philippines, Poland, Russia, South Africa, and Turkey.
3 Publicly listed companies with more than $500 million in revenue; N = 6,716 in 2016 and 2,908 in 1995.
SOURCE: World Bank; McKinsey Corporate Performance Analytics; McKinsey Global Institute analysis
40
70
0
50
80
30
10
60
20
90
1995 052000 201610
Compound annual growth rate, 1995–2016%
Total large-company revenue
Number of large companies
5.9
25.7
2.5
15.1
7.32.9
17.37.2
26.25.9
13.15.2
8.94.7
12.76.9Otherdevelopingeconomies
Malaysia
Singapore
Indonesia
India
Thailand
China
Highincome

20 McKinsey Global Institute 3. Big companies are an essential factor of success
Big companies’ advantages include ample resources and incentives Large, globally competitive companies have helped drive productivity growth in outperformer economies because big firms have the resources and incentives to invest in raising their own efficiency. To gain a better understanding of these firms, we conducted a survey among more than 2,000 companies across ten industries which assessed their self-reported innovation and management practices, alongside financial performance. The results suggest that most successful large companies in outperformer economies exhibit higher growth, more active innovation, and bolder investment than do big companies in other emerging markets, and they operate in more dynamic and competitive ecosystems (Exhibit 10). For example, they tend to be active exporters because they often outgrow their domestic markets.32
These advantages also result in more profitable firms. Large, publicly listed companies in all outperforming countries said net income rose four to five percentage points faster each year between 1995 and 2016 than big firms in other emerging economies.
Midtier firms likewise have a role to play and can also make productivity gains under the right circumstances. For example, Munchy’s, a leading Malaysian snack food maker, invested enough in automating its production lines and warehouses that labour productivity improved threefold over two decades.33 In the electronics industry, manufacturers have managed to expand production capabilities by more than 10 percent while reducing labour costs by up to 20 percent in less than 18 months, through adoption of lean manufacturing and layout optimization, among other changes.34
In addition to improving their own productivity, large companies can help suppliers, contractors, and other firms in their value chains become more productive by spearheading innovation and process improvements, and demanding higher standards of efficiency. An analysis of the influence of large multinational corporations on the productivity of supplier firms in Indonesia concluded that the presence of large foreign firms could boost total factor productivity in downstream sectors by as much as 9 percent.35 This is especially true in manufacturing and consumables, where large firms can bring know-how that uplifts local business productivity.
32 Based on a McKinsey Global Institute 2017 survey of more than 2,000 company executives in ten industries in seven countries.
33 Expert interviews; Laalitha Hunt, “Up close and personal with C. K. Tan”, The Star Online, March 20, 2010.
34 Outperformers: High-growth emerging economies and the companies that propel them, McKinsey Global Institute, September 2018.
35 Ibid.

21McKinsey Global Institute Outperformers: Maintaining ASEAN countries’ exceptional growth
Exhibit 10
Outperformers vs high income
Non-outperformer emerging markets
vs high incomeHigh
income
Innovation and digital disruption
Innovation assessmentPercentage points of sales from new products
48
Innovation practices4
Score (1–10)
6.5
Disruption proactiveness5
Percentage points25
Digital disruption response6
Score (1–6)3.2
InvestmentInvestment speedNumber of weeks
18.7
Geographicexpansion
Expansion priorityMarkets outside homePercentage points
47
Top companies in emerging economies are bolder, quicker, and more forceful than their peers.
Comparison of self-reported performance and practices for top-performing firms across archetypes1, 2
Absolute difference compared with top-performing firms from high-income economies3
(N = 7 countries, 2,172 companies)
1 Top-performing defined by top quartile of self-reported revenue growth (over past three years) adjusted for country and industry.
2 All reported statistics are calculated as weighted averages across countries within archetype.3 Outperformers include China, India, and Indonesia; non-outperformer emerging economies include Brazil and South Africa;
high income includes Germany and the United States.4 Score marks number of dimensions for which respondent answered either “Strongly agree” or “Agree” among 10 dimensions
that describe the company’s current innovation capabilities and practices.5 Proactiveness measured as answering either “We have changed our longer-term corporate strategy to address the disruption”
or “We initiated the disruption(s)” to question “Which of the following statements best describes your company’s approach to addressing the technological and digital disruptions that have affected your industry in the past three years?”
6 Score marks number of “changes [made] to the strategy of individual business units … in response to technological and digital disruptions that have affected your industry in the past three years”.
SOURCE: McKinsey 2017 Firm Survey; McKinsey Corporate Performance Analytics; McKinsey Global Institute analysis
+8
+3
1.30.8
+33
-6
+1.1+0.5
-6.0-7.9
+27+13

22 McKinsey Global Institute 3. Big companies are an essential factor of success
In Malaysia, the arrival of Dell, Bosch, Intel, and other large multinational firms lifted productivity in the country’s entire electrical and electronics sector, including more than 3,000 suppliers in Penang.36 For instance, Pentamaster, ViTrox Technologies, and several other companies that began as SME suppliers to multinationals have themselves developed into large, publicly listed companies that compete internationally.
Manufacturers have not been the only ones to benefit. Large local and foreign companies also have been instrumental in raising productivity and the economic contribution of the service sector. A good example is Thailand, where the international reputation of its large, modern medical centres has made the country a leading destination for people from around the world who seek high-quality medical care at lower cost than in wealthy countries. A healthcare website lists Bumrungrad International Hospital in Bangkok among the most technologically advanced medical centres globally, and hospitals owned by Bangkok Dusit Medical Services, Thailand’s largest private healthcare group, have established partnerships with leading medical and academic institutions around the world, including the MD Anderson Cancer Center in Texas and Stanford University.37
MALAYSIA AND SINGAPORE STAND OUT IN ASEAN FOR THE CONTRIBUTION OF LARGE COMPANIESWhile large companies have been pivotal in driving growth in all ASEAN economies, there are important variations in the role they played in each country in the region and different implications for potential gains. To understand these differences, we grouped the ASEAN countries according to the prevalence and contribution of big firms as well as the degree of competition governments cultivated within industries. We also sought to determine the opportunities for SMEs and the degree to which countries maximise the comparative advantages of different sized companies across the economy, including the innovation of startups.
We find that Singapore and Malaysia stand out for having many large firms, more competition among them, and a more robust environment for SMEs and startups (Exhibit 11). The other large ASEAN economies—Indonesia, the Philippines, Thailand, and Vietnam—generally have fewer large companies as a ratio of their GDP. In the Philippines, Thailand, and Vietnam, large companies have historically driven GDP growth by outperforming their economies. Conversely, in Indonesia, large firms tend to contribute less to GDP growth. It is worth noting that almost all the growth in the Philippines comes from private-sector conglomerates, whereas there is a large state-owned enterprise contribution in Indonesia (as well as in Malaysia and Singapore).
36 Sangeetha Amarthalingam, “Special Report: Penang manufacturing ready for Industry 4.0?” The Edge Markets, October 12, 2017, theedgemarkets.com.
37 30 most technologically advanced hospitals in the world, Top Master’s in Healthcare Administration, March 24, 2014, topmastersinhealthcare.com; Annual report 2017, Bangkok Dusit Medical Services, bdms.listedcompany.com.

23McKinsey Global Institute Outperformers: Maintaining ASEAN countries’ exceptional growth
Exhibit 11
1 Simple average across countries.NOTE: Figures may not sum to 100% because of rounding.
SOURCE: World Bank Development Indicators, McKinsey Strategy Practice (Beating the Odds model v20.0); McKinsey Corporate Performance Analytics; McKinsey Global Institute analysis
Prevalence and size of large firmsNumber per $ trillion of GDP; CAGR
Average revenue$ million1
316
211
1995 2016
-1.8%
138 115
1995 2016
-1.0%
Income levelGDP per capita 2017$ thousand
Higher income
Higher-income ASEAN economies have more large firms, contested leadership, and opportunities for SME growth than the region’s next-tier economies.
Next tier
1,037 2,831 1,088 2,391
Turnover at the topDistribution of top 2005 quintile in 2015%
Proportion of firms with >200 employees1
%
13
63
25
37
9.9
57.7
Singapore Malaysia
2.33.03.96.6
VietnamIndonesiaThailand Philippines
21
71
66
7
1.1
0.3
Drop to bottom quintile
Drop to middle3 quintiles
Remain in top quintile

24 McKinsey Global Institute 3. Big companies are an essential factor of success
Contested leadership is a key characteristic of outperforming economies Outperforming countries globally tend to have more than twice as many large firms per trillion US dollars of GDP as other developing countries, and the companies in these countries are highly competitive, not just with firms from other emerging countries but also with big companies in advanced economies.
Achieving this level of competitiveness is a function of so-called contested leadership in outperformer economies. Healthy competition in mature sectors should lead to innovation and high turnover among top firms.38 Less than half (45 percent) of companies that reached the top quintile of economic profit generation between 2001 and 2005 managed to stay in place for a decade. That was far less than incumbents in high-income economies, 62 percent of which stayed in the top quintile for the same decade.39 This churn holds true for virtually all the sectors we studied and for all the outperformer countries for which data were available.
High turnover among top-quintile firms was not uniform across ASEAN, however. More than two-thirds of the top companies in the next-tier countries in 2005 remained there ten years later, a possible sign of protectionist policies that limited competition or a dearth of up-and-coming midtier firms exerting pressure on top-quintile incumbents. Our prior research in Thailand also found that sectoral regulations were the single greatest inhibitor of productivity across the seven industries surveyed.40
In other countries and sectors, government ownership may have shielded companies from vigorous competition or shareholder pressure. Vietnam, for example, has a large proportion of underproductive state-owned enterprises that operated at an average annual growth rate of 3.8 percent from 2006 to 2016, compared with 4.9 percent annual growth among the private sector as a whole and 7.7 percent in sectors that had attracted foreign investors.41 These ASEAN economies would likely catch up with Singapore and Malaysia faster, therefore, if regulation could foster a more competitive environment. Similarly, the next-tier economies each have a long tail of micro, small, and medium-size enterprises (MSMEs), which are less productive than big companies (see Box 1, “The productivity challenge for Southeast Asian MSMEs”). Reducing the barriers to start and grow formal companies could unlock the potential of countries that otherwise show signs of innovative talent.
38 McKinsey Strategy Practice (Beating the Odds model v20.0); McKinsey Corporate Performance Analytics.
39 McKinsey Corporate Performance Analytics database of publicly listed companies.40 Thailand: Prosperity through productivity, McKinsey Global Institute, February 2002.41 General Statistics Office of Vietnam.

25McKinsey Global Institute Outperformers: Maintaining ASEAN countries’ exceptional growth
Box 1. The productivity challenge for Southeast Asian MSMEs
1 Economic Census 2016: Profile of SMEs, Department of Statistics Malaysia, p. 110, smecorp.gov.my; Topline estimates for all enterprises and SMEs, annual (2017), Department of Statistics Singapore, tablebuilder.singstat.gov.sg; 2016 MSME statistics, Department of Trade and Industry Philippines, dti.gov.ph; Department of Business Development, Thailand, dbd.go.th; “Ini Kontribusi Koperasi dan UMKM Terhadap PDB Nasional 2017”, LegalEra.ID, legaleraindonesia.com.
2 PitchBook database of companies; for context, South Korea has 12.2 startups per million people, and the United States has 86.4.
Micro, small, and medium-size enterprises (MSMEs) play an indispensable role in ASEAN countries as the largest source of jobs. They account for 90 percent of jobs in Indonesia and 70 percent in Malaysia and Singapore. They also are vital links in the supply chain of big companies. Though there is likely no “right” distribution of firm size, healthy economies should see more SMEs able to grow into midtier companies and more startups able to sustain themselves.
Quantifying the difference among countries is difficult because comparable benchmarks are a challenge to find. However, we see evidence that again differentiates the higher-income economies: there is a pattern of more smaller companies growing into midtier firms, defined as those with more than 200 employees, in Malaysia and Singapore than in Indonesia, the Philippines, Thailand, or Vietnam. In Malaysia, midtier companies account for 1.5 percent of all firms; in Singapore, they account for 0.6 percent. The percentage falls to 0.4 in the Philippines, 0.3 in Thailand, and less than 0.1 in Indonesia.1
Another indicator of the vibrancy of a particular economy is the number of startups that have disrupted industries. Examples include Bukalapak and Tokopedia, online retailers in Indonesia, with the latter supporting about three million full-time-equivalent hours for small and medium-size sellers; Grab, a Singaporean ride-sharing service; RedMart, an online grocer; and Ninja Van, a logistics firm serving online retailers. As we have seen with big firms, startups are concentrated in Singapore (where there are 102 startups per million people) and Malaysia (6.2) and are less visible in Thailand (0.9) and Indonesia (0.6).2
Given the number of jobs at SMEs and midtier companies, improving their productivity would have a significant direct impact on economic growth. When such firms grow, they can put competitive pressure on big companies. Growth also encourages them to join the formal economy, which makes it easier for them to access credit, secure legal protection, integrate into supply chains of companies in the formal sector, and export their goods and services.

26 McKinsey Global Institute 3. Big companies are an essential factor of success
Further distinctions emerge from a country-level perspective. In Singapore, ASEAN’s most advanced economy, companies early on recognised the limited scope of the domestic market and, with supportive government policies, grew by internationalising. They then benefited from exposure to the competitive pressures of international commerce, which encouraged productivity and innovation.
Malaysia, Singapore, and to a lesser extent Thailand and the Philippines have largely followed the broader trend of outperformers, creating about 200 large firms per $1 trillion of GDP over the past 20 years, with revenue generally growing faster than GDP.42 In Thailand, the revenue of large firms has been growing particularly fast, expanding at a compound annual growth rate (CAGR) of over 8 percent from 1995 to 2016, albeit from a low base.
Indonesia, however, is an outlier for both its low concentration of large firms and the lower contribution they made to growth—0.8 percent growth per year for the average large firm between 1995 and 2016, compared with GDP growth of more than 4 percent. This suggests large Indonesian companies have made fewer productivity improvements than their ASEAN peers.43
Top-quartile large Indonesian companies say they reap 47 percent of their revenue from new products, which is one measure of innovation. That compares with 55 percent for comparable companies in China, 63 percent for top Indian firms, and 56 percent of top-quartile large companies in all outperformer developing economies combined. At the same time, 30 percent of Indonesian companies say they managed disruption by changing internal policies or by initiating disruption themselves. That compares with 64 percent of Chinese companies and 58 percent of large companies in all outperformer economies.44
Indonesia also had a disproportionate share of productivity growth attributable to shifts across sectors rather than improvements within sectors. This could be attributable to the importance of both publicly and family-owned diversified conglomerates in Indonesia compared with the rest of ASEAN (except the Philippines): Indonesia’s nine largest conglomerates accounted for 21 percent of market capitalization at the end of 2015, compared with 10 percent in Malaysia.45
42 McKinsey Corporate Performance Analytics database of publicly listed companies; GDP data from World Bank.
43 McKinsey Corporate Performance Analytics database of publicly listed companies.44 Outperformers: High-growth emerging economies and the companies that propel
them, McKinsey Global Institute, September 2018.45 “Corporate rulers: What are Indonesia’s biggest conglomerates?” Indonesia
Investments, August 10, 2016, indonesia-investments.com; “Top listed Indonesian conglomerates with largest market capitalization”, Indonesia Investments, July 17, 2014, indonesia-investments.com; Capital IQ.

27McKinsey Global Institute Outperformers: Maintaining ASEAN countries’ exceptional growth
4. OPPORTUNITIES AND CHALLENGES IN CHANGING TIMES The policies and business practices that worked for ASEAN countries in the past may not be enough to help ASEAN achieve its full potential economic growth in the future. In this section, we examine the key global trends, the opportunities they offer to ASEAN countries, and the challenges that will need to be overcome.
THE TRENDS THAT WILL SHAPE ASEAN’S FUTURE Significant changes are coming to ASEAN, in the form of an ageing populace, a shrinking workforce, rapid urbanisation, premature deindustrialisation, widespread automation, and shifting trade patterns. These trends provide considerable opportunities for ASEAN, but also significant challenges.
An ageing populace will mean more pensioners, fewer workers As birth rates decline and better healthcare extends life expectancy, people who are 65 years of age or older are forecast to almost double to more than 10 percent of the region’s population by 2030 (Exhibit 12).46 This trend will be particularly pronounced in Singapore, Thailand, and Vietnam, where people 65 or above are expected to exceed the overall world average of 12 percent by 2030. Thailand’s population 65 or above is forecast to approach 20 percent by 2030, close to that of high-income nations, but per capita GDP will reach only about 15 percent that of high-income nations. In ASEAN’s most populous country, Indonesia, we expect labour contributions to growth to fall significantly by 2030.47 As populations age and birth rates decline, this demographic drag could become stronger and put a greater onus on productivity growth to propel GDP growth.48 Singapore, for example, had 5.9 working-age adults for each person aged 65 or above in 2012, but as the number of pensioners triples to 900,000 by 2030, the ratio of working-age citizens to retirees will decline to 1.2.49
46 Outperformers: High-growth emerging economies and the companies that propel them, McKinsey Global Institute, September 2018.
47 Southeast Asia at the crossroads: Three paths to prosperity, McKinsey Global Institute, November 2014; McKinsey Global Institute forecast of labour and GDP.
48 Global growth: Can productivity save the day in an aging world? McKinsey Global Institute, January 2015.
49 A sustainable population for a dynamic Singapore, Singapore National Population and Talent Division white paper, January 2013.

28 McKinsey Global Institute 4. Opportunities and challenges in changing times
Exhibit 12
1985 2000
170
10 20 203090
140
100
110
150
120
130
180
160
190
200
210
Population growth is slowing, but the proportion of people 65 or older is expected to almost double by 2030.
1 Azerbaijan, Belarus, Ethiopia, India, Kazakhstan, and Turkmenistan.2 Cambodia, Laos, Myanmar, and Vietnam.3 Indonesia, Malaysia, Singapore, and Thailand.4 South Korea and China.
SOURCE: World Bank Development Indicators; McKinsey Global Institute analysis
Population over timeIndex: 100 = 1985
Recentoutperformers(excl ASEAN)1
Otheremergingmarkets
Recentoutperformers(ASEAN)2
Long-termoutperformers(ASEAN)3
Long-termoutperformers(excl ASEAN)4
High income
Compound annual growth rate%
1985–2000
2000–15
2015–30
1.7 1.2 0.8
1.3 0.5 0.2
2.0 1.5 1.1
0.9 0.6 0.4
Age distributionShare of population 65 or older%
22.7
12.21985
14.52000
2015 17.8
2030
High income
Long-term outperformers (ASEAN)3
Recent outperformers (ASEAN)2
Other developing economies
6.3
5.1
3.7
10.5
5.9
5.5
4.8
10.4 8.9
6.6
5.9
5.1
1.7 1.3 1.1
1.8 1.0 0.9

29McKinsey Global Institute Outperformers: Maintaining ASEAN countries’ exceptional growth
Urbanisation may offer opportunities for greater productivity While overall populations in ASEAN countries are forecast to expand at a CAGR of 1.0 percent from 2007 to 2025, the number of people living in the region’s cities is expected to grow 2.7 percent annually—and the number of urban households is forecast to increase by 62 percent.50
The growing populations in ASEAN’s cities will make it easier for more people to gain access to productivity-enhancing technology, and while the proportion of the populace living in urban areas is expected to rise to 25 percent from 21 percent, cities are expected to account for 54 percent of GDP growth in that period.
Productivity-enhancing technology is not expected to be limited to offices, shops, and factories. Widespread digitisation and sharing of best practices via the ASEAN Smart Cities Network could create urban areas that use data and technology to improve decision making about mobility, security, energy, water, economic development, and housing. Among other things, the programme seeks to use real-time data to inform public transportation, which may shorten commute times by 15 to 30 minutes on average, removing a drag on productivity in the bargain.51
Evolving global trade patterns may work to ASEAN’s benefit Declining trade in resource-intensive commodities and rising calls for protectionism are opening a path for emerging economies to take a larger role in international trade flows. Recent MGI research showed that, for the first time in history, emerging economies participate in more than half of global trade of goods.
Trade exclusively among developed nations represented 55 percent of global trade of goods in 1995 but had decreased to 33 percent by 2016. The research also found that China–south trade increased 11-fold in the same period while trade among emerging markets outside China increased sixfold.52
Next-tier ASEAN economies have become ASEAN’s fastest growers by hosting low-skill manufacturing that is moving out of China and other areas with rising wages. Current growth momentum in these next-tier countries can enable them to close the gap dividing the two-speed ASEAN we know today, and the region as a whole may narrow its gap with advanced economies.
Several recent outperformers, such as Cambodia and Vietnam, and countries where growth has accelerated recently, such as Bangladesh, are taking advantage of increased demand in Asia, particularly in China.
50 Urban world: Mapping the economic power of cities, McKinsey Global Institute, March 2011.
51 Smart cities: Digital solutions for a more livable future, McKinsey Global Institute, June 2018.
52 Digital globalization: The new era of global flows, McKinsey Global Institute, March 2016.

30 McKinsey Global Institute 4. Opportunities and challenges in changing times
Exports of labour-intensive products to China have grown by more than 25 percent annually since 2011; most have come from Bangladesh, Cambodia, Myanmar, Sri Lanka, Uzbekistan, and Vietnam.53
THREE OPPORTUNITIES FOR ASEAN TO GROW For Southeast Asia to realise its full economic potential, ASEAN policy makers and business leaders will need to capture opportunities in three areas: firm-led adoption of digital technologies, labour market adjustments, and infrastructure development. Digital transformation is one solution to the sluggish ASEAN TFP on which firms can take the initiative. Technology that drives productivity gains will also automate tasks and drive a major transition of jobs; a reinvented labour market that also adjusts to the demographic and urbanisation trends in the region will be a critical factor in translating productivity gains into higher wages for more people. Lastly, infrastructure matched to economic development goals is particularly important to the next-tier ASEAN economies where large populations are spread across expansive geographies; with smart public investments, millions of lower income citizens will be integrated into more efficient business ecosystems and eventually smart cities with digital infrastructure. Meeting these challenges and pursuing the pro-competitive business environment that proved critical to Singapore and Malaysia can together sustain the region’s recognition as an economic outperformer.
Digital innovation: propelling the next wave of economic growth The region has grown fast over the past several decades because of high savings and investment and integration with global value chains, but this does not guarantee continued growth in the future. ASEAN needs to persist in nurturing large, competitive companies while focusing on addressing its relatively low level of midtier firms that characterise healthy middle-class economies. Spurring innovation from large corporations to startups and creating the conditions for SMEs to scale are therefore critical for the next wave of growth. Notably, ASEAN long-term outperformers have plateaued or dropped recently on the Global Innovation Index, with Indonesia falling six places in the ranking between 2013 and 2016; meanwhile, recent outperformers Vietnam and Cambodia, as well as the Philippines, all climbed a few places in the rankings in the same period (see Exhibit 8).54
Digital technology is important because it can deliver productivity disruption in three ways and presents opportunities to turn around the historically low TFP of ASEAN countries. One is disintermediation, or making supply chains more efficient by linking producers and buyers directly. Another is disaggregation, in which digital tools allow for
53 UNCTAD and World Bank World Development Indicators.54 Soumitra Dutta, Bruno Lanvin, and Sacha Wunsch-Vincent, eds., Global innovation
index 2018: Energizing the world with innovation, Cornell University, INSEAD, and the World Intellectual Property Organization, 2018.

31McKinsey Global Institute Outperformers: Maintaining ASEAN countries’ exceptional growth
more efficient use of assets, as in the sharing economy. The third is dematerialisation, as when streaming services replaced CDs and e-books supplanted printed books.
These forces have created huge value in China, where e-commerce transaction values jumped from under 1 percent of the global total in 2005 to 42 percent, or $81 billion, in 2016.55 The same is not yet true in ASEAN, which lacks China’s unified market and digital ecosystem. The three disruptive trends are therefore ripe for creating value if firms make the bold choices to capture it. Here are examples of how digital technology can remake three economic sectors.
Retail is one of the biggest opportunities for growth because of expanding consumer classes. One of the key drivers of improving productivity is shifting to online retail, in which labour productivity can be more than 80 percent higher than in modern brick-and-mortar stores in developed economies, and even more so in emerging economies.56 While e-tailing remains small in absolute terms—for the most part less than 3 percent of GDP, compared with 16 percent in China—it has risen in Malaysia, Thailand, and Singapore at compound annual growth rates from 16 to 22 percent; in Vietnam by 35 percent; and in Indonesia by 100 percent in each of the past two years.57 That suggests consumers are interested and there is much room to grow.58 Beyond just e-tailing, more advanced innovations such as automated ordering through the use of big data or order pickup from unstaffed “dark stores” can further improve productivity in this sector.59
Banking can play an essential role in spurring economic development by using digital technology to allow for formal savings, borrowing, and electronic transfers. About 60 percent of Indonesians and Malaysians have digital accounts, an increase of 1.6 times from 2014 to 2017, but they lag behind China, where 84 percent of people have accounts.60 Less than 35 percent of people in Cambodia, Myanmar, the Philippines, and Vietnam have access to financial institutions, as do about half of
55 Digital China: Powering the economy to global competitiveness, McKinsey Global Institute, December 2017.
56 Global growth: Can productivity save the day in an aging world? McKinsey Global Institute, January 2015.
57 Statista, Forrester, eshopworlds, eMarketer.58 For more on this, see Elizabeth Hunter, Sophie Marchessou, and Jennifer Schmidt, “The
need for speed: Capturing today’s fashion consumer”, McKinsey.com, March 2018; and Pascal Grieder, Raphael Buck, Francesco Banfi, Veit Kment, and Jil Fitzner, “The future of retail: How to make your bricks click”, McKinsey.com, September 2014.
59 Global growth: Can productivity save the day in an aging world? McKinsey Global Institute, January 2015.
60 McKinsey & Company Asia Personal Financial Services Survey 2017.

32 McKinsey Global Institute 4. Opportunities and challenges in changing times
Indonesians as of 2017.61 These figures give a sense of the opportunity available in ASEAN.62
Manufacturing is rapidly adapting to the greater reliability and lower cost of technologies that are transforming applications such as yield optimization, predictive maintenance, and quality control. They enable ASEAN countries to capture a larger share of global manufacturing by redressing low productivity (except for Malaysia and Singapore), which has traditionally more than offset lower local labour costs. Widespread embrace of Industry 4.0 technologies could have a potential economic impact on ASEAN of $200 billion to $600 billion by 2025.63 Companies in the region already are seeing benefits: advanced analytics has let a semiconductor manufacturer in Singapore cut maintenance costs by 7 percent.64
Labour markets: preparing workers today for jobs tomorrow A key task for public policy makers is to improve labour markets by eliminating impediments to workforce participation and mobility, and improving education and training programmes. This is of growing importance because the path to new sources of productivity and income will involve new technologies, and eventually artificial intelligence will render old skills obsolete. In Indonesia, for instance, an estimated 23 million jobs may be lost to automation but 46 million could be gained as a result of rising consumption as the country grows more affluent as a whole, but in different areas, such as geriatric care, that will require new skills.65 Such large-scale changes will require the retraining of midcareer professionals and the initiation of other public- and private-sector interventions, and ASEAN has not been improving as quickly as its peers. Six of the nine ASEAN nations we look at have seen declines in labour market efficiency, defined by the World Economic Forum as the flexibility to shift workers between economic activities at low cost, the level of incentives for employees, and meritocracy in the workplace. It also measures equity between women and men in business environments (Exhibit 13).66
61 2017 World Bank Global Findex database.62 For more on this, see Sonia Barquin and Vinayak HV, “Building a digital-banking
business”, McKinsey.com, April 2016; and Asia’s digital banking race: Giving customers what they want, McKinsey & Company Global Banking Practice, April 2018.
63 Industry 4.0: Reinvigorating ASEAN manufacturing for the future, McKinsey & Company Digital Capability Center, February 2018.
64 For more on this, see Industry 4.0: Reinvigorating ASEAN manufacturing for the future, McKinsey & Company Digital Capability Center, February 2018.
65 MGI Automation Model, March 2018; Jobs lost, jobs gained: Workforce transitions in a time of automation, McKinsey Global Institute, December 2017.
66 Global Competitiveness Report, 2014–2015, World Economic Forum, reports.weforum.org/global-competitiveness-report-2014-2015/methodology/

33McKinsey Global Institute Outperformers: Maintaining ASEAN countries’ exceptional growth
Exhibit 13
Women are underrepresented in leadership positions in ASEAN countries, including in the Philippines and Singapore, where gender parity is higher.
Women’s representation1
%
1 Women as a percentage of the total men and women at the respective stage of the talent pipeline.2 Entry positions in jobs occupied by graduates.3 Company management/executive committee (CEO and direct reports to CEO).4 Increase in proportion due to legal mandate for one woman board member for each listed company.
SOURCE: The power of parity: Advancing women’s equality in Asia Pacific, McKinsey Global Institute, 2018
52
13
53
33
53
25
56
21
53
11
43
4
46
3
49
25
10
51
18
44
8
49
15
43
5
45
97
89
90
82
92
85
95
99
96
89
79
75
67
87
51
75
49
56
51
57
55
54
57
47
44
47
47
48
114
—1
Australia
Philippines
China
Singapore
Indonesia
Japan
India
Other countries
ASEAN
Entry-levelprofessionals2
Tertiaryeducatedgraduates
Seniormanagement3
Boardmembers

34 McKinsey Global Institute 4. Opportunities and challenges in changing times
Enabling more women to participate in the workforce could be a significant source of economic growth. A recent MGI report on gender equality in ASEAN concluded that opening the labour market more fully to women could add $369 billion to GDP in 2025, over and above 2014 figures.67 This would require raising the number of women participating in the workforce, increasing the number of paid hours women work (such as swapping part-time for full-time employment), and enabling women to participate in higher productivity sectors. Other than Singapore and the Philippines, ASEAN nations have a long way to go in this respect. The number of women in business leadership remains low, even in a traditionally matriarchal society such as the Philippines, where 15 percent of corporate board members are female. While this figure is low in absolute terms, it is one of the highest globally. The number dips to 8 percent in Singapore and 5 percent in Indonesia.
Companies can support equality by expanding affordable childcare, offering parental leave and flexible working arrangements, addressing unconscious bias in the workplace, and shifting attitudes about women’s role in society. Policy makers can provide subsidised childcare infrastructure (as is already offered in Singapore and the Philippines), subsidies or tax deductions for firms with childcare centres, or tax incentives to encourage mothers to return to work.68
At the same time, ASEAN policy makers and business leaders could seek to mitigate the effects of Southeast Asia’s ageing population by encouraging people to remain productive when they reach retirement age. This can be done by deferring retirement and staying employed, or by replacing a traditional career with activities including mentorship, directorship, teaching, or even social work. Companies are learning they can benefit from keeping experienced workers on the payroll even after they traditionally qualify for a pension.
Governments can help to future-proof workers by focusing education on STEM—science, technology, engineering, and mathematics—and on “less-automatable” skills such as creativity and perceptiveness, which are critical in ensuring the ability to harness and innovate technology.69 At the same time, government should de-emphasise skills that can be automated and enable employers to reskill at scale. This is particularly important as deindustrialisation—the point where services grow fast enough that manufacturing starts declining in relative terms—comes at an increasingly earlier stage in countries’ development, pushing them to create fewer low-skill, low-wage manufacturing jobs.
67 The power of parity: Advancing women’s equality in Asia Pacific, McKinsey Global Institute, April 2018.
68 Mildred Tan and Dilys Boey, “The future of women in Asean: Three priorities for govts”, Business Times, March 15, 2018, businesstimes.com.
69 The role of education in AI (and vice versa), McKinsey.com, April 2018.

35McKinsey Global Institute Outperformers: Maintaining ASEAN countries’ exceptional growth
Infrastructure: cost-effectively enabling economic development The third challenge ASEAN countries face is infrastructure investment. While Malaysia and Singapore have done well at this, other countries need to establish priorities appropriate for their respective stages of development. Building or expanding infrastructure can accelerate productivity growth by improving transport, updating communication, or delivering reliable power. But in some developing economies, accomplishing that task will require a new approach to execution and design. It could be as simple as aligning infrastructure plans with economic goals, or as challenging as making sure that all parties communicate priorities and commitments on project deliverables and timelines so they can be held publicly accountable. The plans should include a rationale for prioritisation based on the expected economic return given the country’s stage of development. Executed properly, this process should produce a clear and rational pipeline of projects.
Digital age infrastructure will be very different from that of earlier eras, because it will be made “smart” through a profusion of sensors, data, and analytics and will require more agility in planning, building, and operating. The providers of these solutions are increasingly likely to involve tech firms as well as traditional engineering, procurement, and construction companies.
Together, fact-based project selection, streamlined delivery via proper preparation, and tight project management can reduce infrastructure spending by about 25 percent.70 Some of the difference can come from increasing revenue once the project is complete—for example, dynamic pricing that changes highway tolls depending on traffic volume. Cutting operating costs can also contribute, by, for instance, learning to cost-effectively store electricity rather than let generating capacity sit idle. Singapore is a good regional example. The prime minister has championed a vision of a more digital Singapore and established a government department dedicated to its Smart Nation initiative. The city remains committed to innovation in mobility; it has formed a consortium of partners for research and development projects to accelerate the rollout of autonomous cars and buses.71
Less-advanced ASEAN members also are winning plaudits for finding new ways to finance the infrastructure they need to expand their economies. For example, Myanmar has developed a framework for public-private partnerships, designed to leverage private-sector expertise, innovation, and management ability to deliver economic
70 Bridging infrastructure gaps: Has the world made progress? McKinsey Global Institute and McKinsey’s Capital Projects and Infrastructure Practice, October 2017.
71 Smart cities: Digital solutions for a more livable future, McKinsey Global Institute, June 2018.

36 McKinsey Global Institute 4. Opportunities and challenges in changing times
and social infrastructure services.72 In Indonesia, under the Ministry of Finance, Sarana Multi Investama operates as a state-owned investment company and the Indonesia Infrastructure Guarantee Fund supports a new pipeline of PPP projects. In addition, priority projects now fall under the direct oversight of a committee led by the Coordinating Minister for Economic Affairs, in another example of reform that has improved delivery and oversight.73 The Philippines attracted private investments in three airports by giving private firms a voice in how the facilities will be built and operated. For recent ASEAN outperformers, establishing a construction ecosystem that can successfully complete large-scale projects and improve return on investment is important given capability gaps and the challenges faced in attracting international construction firms.
Beyond intelligent highways and smart electrical grids, infrastructure means digital networks (including ultra-high-speed 5G networks, sensor bases, and public wireless points), open access to public data (in such forms as real-time traffic flows, weather readings, and population statistics), and regulatory guidelines to support open and inclusive innovation and adoption. ASEAN, apart from Singapore, lags behind most of its Asia–Pacific peers on this public digital infrastructure (Exhibit 14). For example, Bangkok lacks an open data portal where developers can review updated public data.74 That said, Myanmar has followed an exceptional accelerated path to 100 percent mobile penetration since 2014, and has shown high levels of commitment to planning for public digital infrastructure, for example in greenfield cities.
AT STAKE: A CHANCE TO DOUBLE GDP TO ABOUT $5 TRILLION The potential benefits of realising these improvements could be significant. If ASEAN economies could collectively grow at 4.1 percent annually until 2030 (a consensus view of economic forecasters), the region’s GDP could roughly double to about $5 trillion.75 This 4.1 percent figure is above our historical threshold of 3.5 percent for long-term outperformer economies, but is below the historical growth rates of the ASEAN economies. At $5 trillion, ASEAN GDP would represent about 5 percent of global GDP, an increase of seven-tenths of a percentage point from 2015 (Exhibit 15). Four long-term outperformers—Indonesia, Malaysia, Singapore, and Thailand—could account for most of that
72 Myanmar public-private partnership policy document, Ministry of Planning and Finance, 2016, pppmyanmar.gov.mm.
73 “KPPIP: Empowering the coordination of infrastructure delivery”, Committee for Acceleration of Priority Infrastructure Delivery, December 19, 2016, kppip.go.id.
74 Smart cities: Digital solutions for a more livable future, McKinsey Global Institute, June 2018.
75 The annual growth rate target is a based on an average of GDP growth forecasts made by the Economist Intelligence Unit, Oxford, and IHS; global opportunity is estimated at $11 trillion by 2030, if every emerging economy around the world replicates the growth trajectory of outperformers. For more, see Outperformers: High-growth emerging economies and the companies that propel them, McKinsey Global Institute, September 2018.

37McKinsey Global Institute Outperformers: Maintaining ASEAN countries’ exceptional growth
multitrillion-dollar gain by continuing to expand their economies, ASEAN’s four largest, by 3.8 percent annually in real terms. Such an achievement would imply per capita GDP increases of almost 50 percent.76
Further help could come from the regional recent outperformers Cambodia, Laos, Myanmar, and Vietnam, as well as very recent accelerator the Philippines. Sustained rapid growth in these newly vibrant economies could add a further $600 billion to $1 trillion in total GDP and lift per capita GDP in each country by 50 to 70 percent.
76 Outperformers: High-growth emerging economies and the companies that propel them, McKinsey Global Institute, September 2018.
Exhibit 14
Singapore is highly advanced in digital infrastructure, while Bangkok and Jakarta lag Asia–Pacific peers.
Strength of smart city technology baseMaximum of 37 points
SOURCE: Smart cities: Digital solutions for a more livable future, McKinsey Global Institute, June 2018; McKinsey Global Institute analysis
Mumbai
Bangkok
6.4
2.7Jaipur
Pune
Jakarta 8.1
8.8
Melbourne
Beijing
20.5
24.3
18.1
Sydney 17.7
19.6
Shenzhen
14.8
Hong Kong
18.3
20.2
13.8
Tokyo
Yinchuan
Auckland
18.8
20.2
Shanghai
Seoul
Singapore 25.0
CommunicationSensor Open data portal
Components of technology base

38 McKinsey Global Institute 4. Opportunities and challenges in changing times
Big companies can lead this economic transformation by taking risks, responding to disruption, and making technological leaps, while midtier firms help diversify ASEAN economies and benefit from the growing consuming class. Governments can support demand, particularly through infrastructure investments. In large countries such as Indonesia, Myanmar, the Philippines, and Vietnam, such investments can equalise opportunities in areas still at the periphery of revolutionary changes in transport, technology, and supply chains and boost industrial manufacturing where these countries still have room to grow. While ASEAN countries will retain today’s vibrant cultural diversity, greater equality among and within countries can create a strong foundation for improved economic flows, cooperation on regional environmental issues, and broader access to education, technology, and healthcare. SMEs also have a role to play (see Box 2, “Small and medium-size businesses can contribute”).
Exhibit 15
1 Consensus scenario.2 Estimate based on all recent outperformer economies, excluding India.
SOURCE: World Bank; McKinsey Global Growth Model; McKinsey Global Institute analysis
Total ASEAN economic output could grow by more than $2 trillion to represent 4.6 percent of global GDP.
101,567
311
161
161
217
853
294
125
Philippines
Indonesia
ASEAN 2015
Thailand
Singapore
Other ASEAN2
ASEAN 2030
Malaysia
Vietnam
4,7132,1222,591
2,591
34,54367,024
Long-term outperformers
Recent outperformers
Very recent accelerators
World 2030
Compound annual growth rate, 2015–30%
Share of total world GDP%
2.4
4.3
4.2
3.0
4.9
4.5
5.3
4.1
2.8
4.6
3.9
Real GDP, 20101
$ billion

39McKinsey Global Institute Outperformers: Maintaining ASEAN countries’ exceptional growth
These policies also require competency and accountability in government, including bureaucrats who are close enough to the private sector to understand the constraints on growth and yet retain independence to provide a fair playing field. The importance of this is illustrated by the fact that improvements in World Bank measures of “effectiveness”, “regulatory quality”, and “rule of law” correlated with outperformance in our global data set, whereas political instability and corruption did not. ASEAN countries have generally improved on these parameters. Yet the question is whether the improvement is rapid enough—and the answer seems to be that it is not. Absolute levels of governance quality fall behind potential; there is likely a significant governance factor holding back the region, where only Malaysia, Singapore, and Thailand scored in the top third of countries on the World Bank measure in effectiveness in 2016 and only Singapore and Malaysia in regulatory quality and the rule of law.77
77 Worldwide Governance Indicators, World Bank, info.worldbank.org.
Box 2. Small and medium-size businesses can contribute
1 “Online retailers go offline in China”, Economist, April 7, 2018, economist.com.2 The Malaysia External Trade Development Corporation defines midtier companies as those with revenue between
$12 million and $120 million in the manufacturing sector and between $5 million and $120 million in services; for more information, see “MTCDP Overview”, mtcdp.my/mtcdp-overview.
Companies founded on the web, known as digital natives, and governments can support programmes that lower the cost for traditional SMEs to join the digital economy and expand beyond their domestic markets. Creating a more competitive SME sector in ASEAN is especially important in those countries—Indonesia, Myanmar, the Philippines, Thailand, and Vietnam—where competitive pressure on large firms (and thus turnover among industry leaders) has been low historically. Large firms and governments can play a role in lifting overall competitiveness of SMEs. In Indonesia, the Philippines, and Thailand, this may be done through digital adoption and capability building. In Vietnam, the key enablers to help SMEs would be reducing regulatory red tape and providing them with a level playing field vis-à-vis state-owned enterprises, in addition to improving access to credit.
Alibaba’s Ling Shou Tong app allows convenience stores and mom-and-pop shops to digitise their businesses using Alibaba’s supply chain, logistics, and data analytics.1 The app advises store owners on what to stock and how to display their inventory based on sales data. Similar programmes with emerging tech giants in ASEAN, including GoJek, Lazada, and RedMart, could improve SMEs’ productivity at scale. The public sector can also play a part; the Malaysia External Trade Development Corporation in 2014 launched a Mid-Tier Companies Development Programme to improve the export readiness of midtier companies, which represent just 1 percent of all Malaysian firms but generate about 30 percent of the country’s GDP and employ more than 22 percent of the workforce.2
40 McKinsey Global Institute 5. How governments and companies can build on ASEAN’s momentum
5. HOW GOVERNMENTS AND COMPANIES CAN BUILD ON ASEAN’S MOMENTUM ASEAN countries face a considerable challenge in supporting the growth agenda. They need to cultivate competitive business ecosystems, particularly in the lower income countries where contested leadership is low and where comparative advantages may be discovered to drive productivity. They must spur innovation, reorganise labour markets, and steer investments into infrastructure to meet economic development goals—and they must do so as the demand for expertise and good governance has never been higher in the region.
Companies, meanwhile, have played, and will continue to play, a pivotal role in driving productivity growth in ASEAN. Changing demographics and digitisation trends will require new types of governance, innovative business models, and different skill sets. Company executives are well motivated to shoulder these challenges because they and their firms can do well for themselves while doing good for the broader economy and society.
Rapid technological innovation—whether cryptocurrencies, peer-to-peer lending, autonomous vehicles, drones, or artificial intelligence—puts the onus on governments to deliver specialised regulation and agile policy making. This may require teams comprising many government ministries and private-sector partners, and they should test new programmes in an iterative and evidence-based way, using pilots and experiments, before scaling up policies that work. For example, the Monetary Authority of Singapore and Bank of Thailand employ regulatory sandboxes to enable policy experiments while containing the consequences of failures.78 In the future, this approach will allow governments to address questions that tech disruption raises.
Governments also can help by using digital technologies to make it easier to do business. Already today, a range of digital technologies is generating real value by streamlining business administrative processes and safeguarding businesses, through such services as digital business licensing, tax filing, and land use and building permitting. ASEAN countries such as Malaysia and Singapore have already implemented automated portals for some government administration: MyEG.com in Malaysia for the payment of fines and renewing of licenses, and SingPass in Singapore for government e-services including tax filing and ID renewals. Government institutions will deliver services more easily and can create new models for collaborative problem solving with citizens and the private sector, enhancing transparency and harnessing private-sector innovation and appetite for risk.
78 Outperformers: High-growth emerging economies and the companies that propel them, McKinsey Global Institute, September 2018.

41McKinsey Global Institute Outperformers: Maintaining ASEAN countries’ exceptional growth
ACTIONS FOR POLICY MAKERS TO TAKE AND QUESTIONS TO CONSIDER WHEN ENCOURAGING GROWTH Even where they function well, ASEAN governments must be proactive in the face of change and deliberative about hard questions that can only be solved with inputs from civil society and the private sector. We provide a call to action on the three growth opportunities and an illustrative list of questions on which to engage within government and with the public:
� Establish pro-competitive policies to support firms that are best able to increase productivity through the gains of digital adoption and innovation.
— What is the best way to balance support for imported technology with incentives for local firms to innovate and find comparative advantages as the region moves into knowledge economies?
— How can governments help small and medium-size enterprises become a stronger source of nimble innovation and upward competitive pressure? Can regulations be better designed to incentivise SMEs to take entrepreneurial risk and scale to midtier? Is formality a barrier due to regulation and taxes or can it be an incentive for growth?
— How should governments establish data sharing policies that allow for beneficial use of big data and decentralized innovation (such as fintech, smart cities, and education and potentially life-saving machine learning in healthcare) without undermining cybersecurity and privacy?
� Make inclusion, particularly gender parity, a central goal of labour market reinvention.
— What role will governments play to meet the demand for high skill jobs by improving access and opportunities for women? What goals will governments set to generate accountability?
— Will educational investments provide the scale, quality, and access needed for a knowledge economy in 15 to 30 years? What opportunities are there for adults to acquire new skills, including in rural areas?
— What is the best way to inspire displaced workers of all ages and help them transition between jobs? How can government reduce job disruption and match workers with preferred jobs, and are there opportunities to improve this process with an ASEAN-wide approach?

42 McKinsey Global Institute 5. How governments and companies can build on ASEAN’s momentum
� Set infrastructure goals and establish accountability to enhance the pro-growth social consensus and enable productivity gains for marginalized populations.
— What role might ASEAN values play in maintaining constructive consensus for bold investments and to meet social challenges?
— What new models for accountability and cooperation among the public sector, private enterprise, and citizens will underwrite inclusive growth and reward visionary leadership?
— How can governments strike the right balance between centralized infrastructure planning and a more agile process with the private sector while maintaining impartiality?
— How can government and private-sector investors regain mutual trust following examples of biased or unclear practices in infrastructure tenders and projects?
ACTIONS AND QUESTIONS FOR BUSINESS LEADERS ABOUT THEIR ROLE IN OUTPERFORMERS Going forward, established, globally competitive companies as well as small and medium-size enterprises and startups need to address a common set of issues and recognise their leadership role in meeting the three opportunities critical for broad based growth:
� Create digital strategies for the long term with talent and data as the anchors.
— How should companies change product and service offerings to remain competitive? How can companies better anticipate the needs of ASEAN’s growing consumer class? Can new (digital) business models reach underserved populations cost effectively?
— Can foreign-owned firms continue to rely on “imported innovation” from company headquarters or does the pace and context of change in ASEAN demand localized innovation? Can local incumbents develop and export innovation regionally and even internationally in search of the next wave of growth, as Chinese tech giants have done?
� Help build and support the labour force that will help firms grow, especially by increasing the number of women in leadership roles.
— Where does gender parity stand as a priority?
— How can firms contribute to skill building where a career might cross five or six rapidly changing industries? Are there creative partnership models to efficiently teach new digital skills to large numbers of people?

43McKinsey Global Institute Outperformers: Maintaining ASEAN countries’ exceptional growth
� Find opportunities to bring expertise into the planning and execution of infrastructure that boosts broad based economic development.
— How can the private sector help improve the demand-side management of infrastructure, including by articulating the needs that will help firms grow and deliver better services?
— Is there a need for new institutions to better facilitate dialogue with government on public-private collaborations to reduce the cost of infrastructure and potentially share the gains of value creation?
•••
Southeast Asia has made great economic progress in recent decades, expanding its consuming class, building industries, and creating world-class companies. However, it should not rest on its laurels. Countries rich and poor, and companies big and small still face many challenges, from the rise of automation to ageing populations and slower-growing workforces. With each challenge, however, comes opportunity. Growing wealth in developing economies creates new customers for companies in those economies, for example, while evolving trade flows now favour the Southern Hemisphere, home to most developing economies. If more ASEAN economies apply lessons learned from their successful peers and take advantage of global trends, opportunities for growth will be abundant—and top-performing firms that have thrived in the trials of contested leadership will be at the forefront of that growth. It will be up to public officials and business leaders to seize the opportunity, and to share its benefits equitably.

44 McKinsey Global Institute Further reading
FURTHER READING Barquin, Sonia, and Vinayak HV, “Building a digital-banking business”, McKinsey.com, April 2016.
Grieder, Pascal, Raphael Buck, Francesco Banfi, Veit Kment, and Jil Fitzner, “The future of retail: How to make your bricks click”, McKinsey.com, September 2014.
Hunter, Elizabeth, Sophie Marchessou, and Jennifer Schmidt, “The need for speed: Capturing today’s fashion consumer”, McKinsey.com, March 2018.
McKinsey & Company Digital Capability Center, Industry 4.0: Reinvigorating ASEAN manufacturing for the future, February 2018.
McKinsey & Company Global Banking Practice, Asia’s digital banking race: Giving customers what they want, April 2018.
McKinsey Global Institute and McKinsey’s Capital Projects and Infrastructure Practice, Bridging infrastructure gaps: Has the world made progress? October 2017.
McKinsey Global Institute, Digital China: Powering the economy to global competitiveness, December 2017.
McKinsey Global Institute, Jobs lost, jobs gained: Workforce transitions in a time of automation, December 2017.
McKinsey Global Institute, Outperformers: High-growth emerging economies and the companies that propel them, September 2018.
McKinsey Global Institute, Southeast Asia at the crossroads: Three paths to prosperity, November 2014.
McKinsey Global Institute, The power of parity: Advancing women’s equality in Asia Pacific, April 2018.
McKinsey Global Institute, Urban world: Mapping the economic power of cities, March 2011.
Tan, Mildred, and Dilys Boey, “The future of women in Asean: Three priorities for govts”, Business Times, March 15, 2018, businesstimes.com.

RELATED MGI AND MCKINSEY RESEARCH
www.mckinsey.com/mgi
E-book versions of selected MGI reports are available at MGI’s website, Amazon’s Kindle bookstore, and Apple’s iBooks Store.
Download and listen to MGI podcasts on iTunes or at www.mckinsey.com/mgi/publications/multimedia/
Outperformers: High-growth emerging economies and the companies that propel them (September 2018) Emerging economies are the engine of global economic growth, but their performance is highly varied. In this research, we identify countries that have outperformed their peers and global benchmarks, and focus on key factors that led to their growth, including both policy choices and the often-overlooked contribution of large companies.
Industry 4.0: Reinvigorating ASEAN manufacturing for the future (February 2018) Manufacturers in developed markets are eager to explore the potential of Industry 4.0, but ASEAN companies have been slower to climb aboard. ASEAN manufacturers must actively work to understand how they are altering business models and improving operations in ways that were hard to imagine just a few years back.
The power of parity: Advancing women’s equality in Asia Pacific (April 2018) Advancing women’s equality in the countries of Asia Pacific could add $4.5 trillion to their collective annual GDP by 2025, a 12 percent increase over the business-as-usual trajectory. Pursuing the goal of gender parity can lift many women out of poverty, unleash the economic potential of many others, and reinforce the region’s dynamic growth story.
Jobs lost, jobs gained: Workforce transitions in a time of automation (December 2017) We examine work that can be automated through 2030 and jobs that may be created in the same period. We draw from lessons from history and develop various scenarios for the future. While it is hard to predict how all this will play out, our research provides some insights into the likely workforce transitions that should be expected and their implications.

McKinsey Global Institute September 2018 Copyright © McKinsey & Company www.mckinsey.com/mgi @McKinsey_MGI McKinseyGlobalInstitute
ACKNOWLEDGMENTS We would like to thank the organisers of the Singapore Summit 2018 for giving McKinsey & Company the opportunity to contribute to the discussion of ASEAN’s outperforming economies. For this paper, we conducted interviews and research, drawing on internal and external resources. This paper highlights some of the expertise and insights from the McKinsey Global Institute and throughout McKinsey & Company.
The perspectives in this discussion paper were developed by McKinsey & Company managing partner Kevin Sneader, MGI senior partner Jonathan Woetzel, and McKinsey senior partners Oliver Tonby and Diaan-Yi Lin. Kevin Russell led the working team, which included Valerie Chan, Sherlyn Chen, and Jose Pablo Garcia. We wish to thank Abdulla Abdulaal, Marco Breu, Eoin Daly, Vidhya Ganesan, Ee Huei Koh, Anu Madgavkar, Nimal Manuel, Sisu Otto, Alpesh Patel, Kristine Romano, Jeongmin Seong, Noppamas Sivakriskul, Ben Vatterott, and Phillia Wibowo for their contribution to our analysis; and senior editors Mark A. Stein and Peter Gumbel, editorial production manager Julie Philpot, media designers Marisa Carder and Patrick White, and external relations colleague Sharmeen Alam for their support.
We welcome comments on this paper and acknowledge that any errors are our own.