outlook for international real estate · 29/11/2011 · outlook for international real estate ......
TRANSCRIPT

Outlook for International Real Estate
Toronto Forum
Jacques Gordon
Global Strategist
November 29, 2011
2
Agenda
Macro Outlook
Global Office Market Dynamics
Emerging Markets
Investable Universe
Capital Flows
Nightmare on which Street?
3
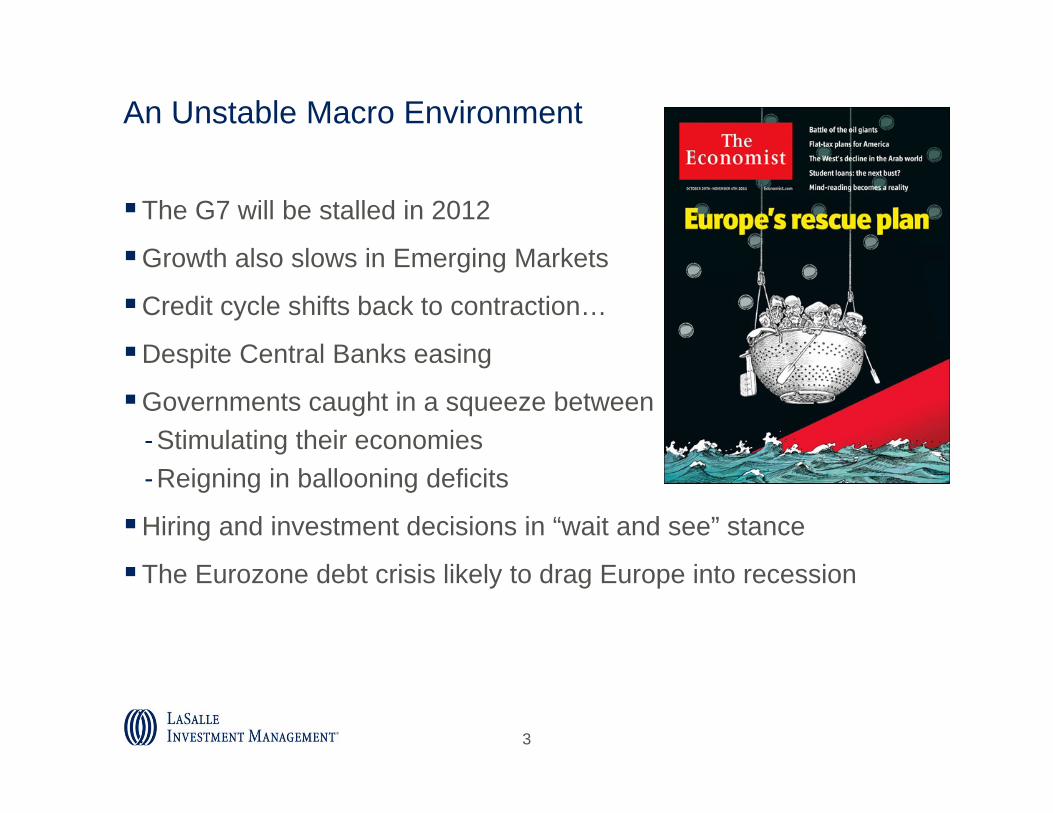
An Unstable Macro Environment
The G7 will be stalled in 2012
Growth also slows in Emerging Markets
Credit cycle shifts back to contraction…
Despite Central Banks easing
Governments caught in a squeeze between-Stimulating their economies-Reigning in ballooning deficits
Hiring and investment decisions in “wait and see” stance
The Eurozone debt crisis likely to drag Europe into recession

4
Source: Global Insight Forecast as of 28 November 2011
Economic Power Shifts East and SouthEmerging Markets To Account for Three Quarters of 2012 Global Growth
-4%
-3%
-2%
-1%
0%
1%
2%
3%
4%
5%
2007 2008 2009 2010 2011 2012 2013 2014
Com
pone
nts
of W
orld
GD
P G
row
th
Middle East & North Africa Latin America Rest of the WorldCEE Asia-Pacific ex-Japan North AmericaWestern Europe Japan 15 July Forecast
4.2%
Emerging Markets
DevelopedMarkets
3.8%2.9%3.0%
4.2%
-2.1%
1.7%
4.1%

5
Prime Offices – Rental Clock, Q3 2010 v Q3 2011
Q3 2011
Rental Value growth slowing
Rental Value growth
accelerating
Rental Values bottoming out
Rental Values falling
Based on rents for Grade A space in CBD or equivalent. In local currency.
Paris, StockholmMumbai, Sydney, Tokyo
Hong Kong
London, Shanghai
Milan, Johannesburg
Chicago Madrid, Seoul
Rental Value growth slowing
Rental Values falling
Rental Value
growth accelerati
ng
Rental Values bottoming out
Detroit Los Angeles
Amsterdam
San FranciscoBerlin
Moscow
Q3 2010
Mexico City
SingaporeNew York, Brussels, Frankfurt
Atlanta, Dallas, Toronto, RomeDubai
Washington DC
Sao PauloBeijing
Detroit Dubai, Seoul
San Francisco
New York
Washington DC, Toronto Milan
Dallas, Mumbai
Atlanta, Frankfurt Johannesburg
ChicagoRomeTokyo
Los Angeles AmsterdamBrussels
MadridBerlin, Sydney
Stockholm
Sao PauloParis
Beijing
London
Moscow
Mexico City
Hong Kong
Singapore
Shanghai
AmericasEMEAAsia Pacific
As of Q3 2011
The Jones Lang LaSalle Property Clocks SM

6
Completions as % of existing stock
Source: Jones Lang LaSalle, October 2011. Covers all office sub-markets in each city. Tokyo - CBD-3 kus
20122013
Office Supply Pipeline - Major Markets, 2012 -2013

% of occupied stock
Offices – Net Absorption, Year to Q3 2011
Source: Jones Lang LaSalle, October 2011. Covers all office sub-markets in each city. Tokyo - CBD-3 kus
AmericasEMEA
Asia Pacific
8
% change
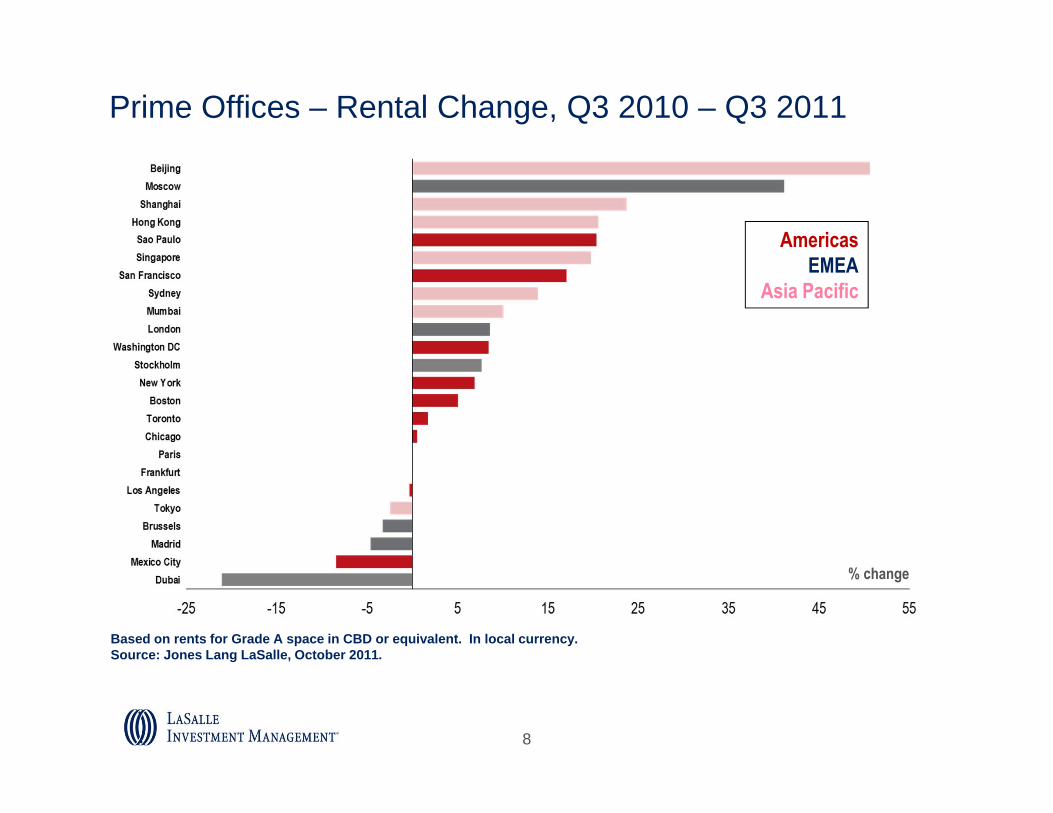
Prime Offices – Rental Change, Q3 2010 – Q3 2011
Based on rents for Grade A space in CBD or equivalent. In local currency.Source: Jones Lang LaSalle, October 2011.
AmericasEMEA
Asia Pacific
9
Emerging Markets’ Growing Share of World GDP
38% of World Output in 2010 at market exchange rates (19% in 1990)
52% of world output in 2011 on a purchasing power parity basis
GDP up 20% since 2007 (while G7 is below 2007 GDP)
75% of the world’s population
82% of mobile phone subscriptions
46% of all retail sales
70% of world steel consumption
Receives over half of world “FDI” (cross border investment)
One quarter of Global Fortune 500 companies HQ in EMs
Over half of world’s currency reserves
Sources: Economist August 2011, Fortune Magazine

10
Source: Global Insight Forecast as of 14 October 2011
China and India: A Class ApartBRICs + Turkey + Indonesia to Drive 40% of Global Growth
Bubble Size RepresentsAbsolute Forecast Change inGDP from 2010 to 2013 India
Vietnam
Indonesia
Egypt
Brazil
Poland
Malaysia
Taiwan
Thailand
Chile
South AfricaRussia
Historical vs Forecast GDP in Key Emerging Markets

11
Emerging Markets Tend to Have Younger Populations
Percent of PopulationUnder 20 65 and Over
Japan 18.1% 22.7%
Germany 18.6% 20.4%
Canada 23.1% 14.1%
US 27.1% 13.1%
Russia 20.8% 12.8%
Poland 21.3% 13.6%
Singapore 24.6% 9.0%
China 27.3% 8.2%
Brazil 33.9% 7.0%
Vietnam 33.8% 6.0%
Turkey 35.3% 6.0%
Mexico 38.7% 6.3%
India 40.4% 4.9%
Developed
Emerging
Source: United Nations Data as of 2010
12
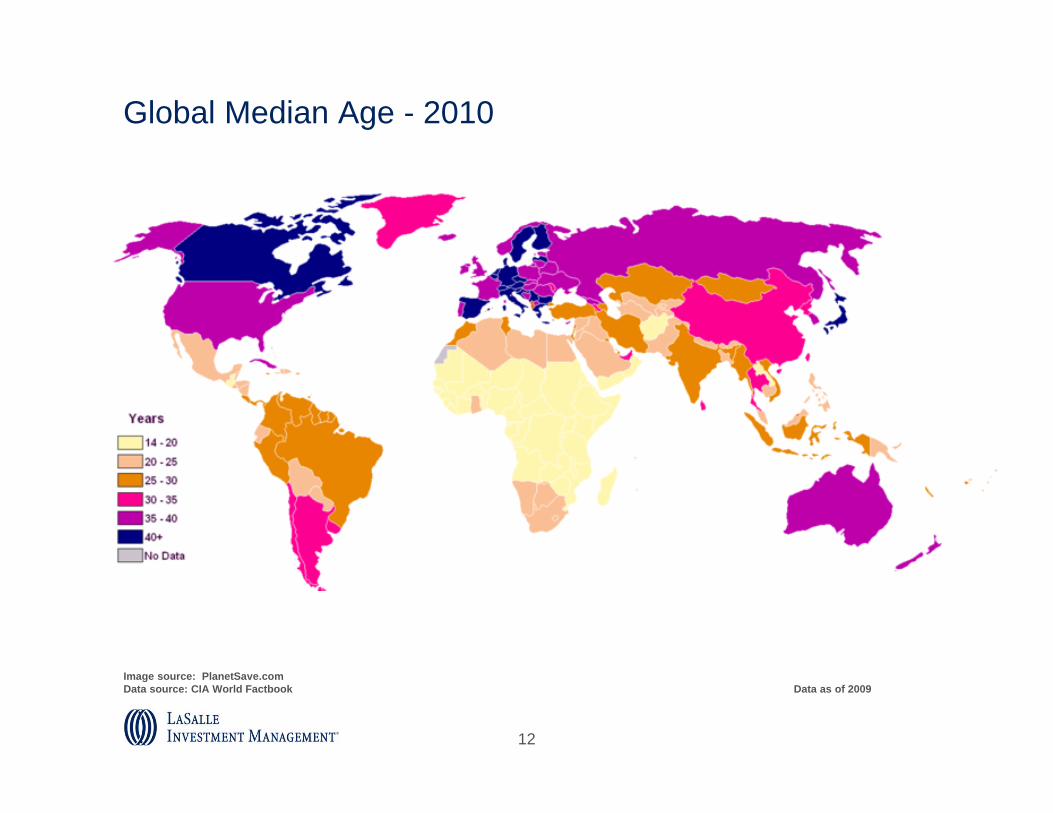
Global Median Age - 2010
Image source: PlanetSave.comData source: CIA World Factbook Data as of 2009

13
2%3%4%5%6%7%8%9%
Chi
na
Indi
a
Vie
tnam
Indo
nesi
a
Taiw
an
Chi
le
Turk
ey
Thai
land
Bra
zil
Rus
sia
Mal
aysi
a
Pol
and
Sou
th A
frica
Wor
ld
Egy
pt
2012
GDP Growth Forecast March 2011 Forecast
November 2011 Forecast
Source: Global Insight Forecast as of 15 October 2011
GDP Forecasts Have Been Revised DownBut Emerging Market Outlooks Have Been Moved Down Less
Change in 2012 GDP Forecast, March 2011 to November 2011
Largest Downward Revisions
Smallest Declines
Improved Outlook

14
Listed Real Estate (Gross Asset Value)Total = $2.0 trillion
Division of Institutional Real Estate Ownership
Source: Investment Property Databank, LaSalle Investment Management 2010 Global Investable Universe EstimateNote: The Listed Real Estate Universe includes all publicly listed property companies, primarily REITs and REOC. Diversified development companies are included in emerging markets, but homebuilders are excluded. The Institutional Real Estate Universe includes all institutional investor-owned property, public and private.
Europe18.5%
Middle East and Africa
3.3%
Asia Pacific42.9%
Americas35.3%
Public Real Estate Companies Own Greater Share of All Real Estate, Especially in Asia-Pacific

15 1
8 of Top 25 Global Public Real Estate Companies Have Large Exposure to China

16
Emerging Network of Chinese Cities
XianChengdu
ChongqingKunming
DalianBeijingTianjin
ShanghaiNingbo
NanjingSuzhou
Hangzhou
MacauDongguan
GuangzhouShenzhen
FuzhouXiamen
Pearl River Delta
Yangtze River Delta
Bohai BasinShenyang
Hong Kong
Taiwan
Wuhan
Central China

17
China: Businesses Will Continue to Head WestDelivery of infrastructure to push development
Source: CBRE

18
Pudong 1900

19
Pudong 1990
20
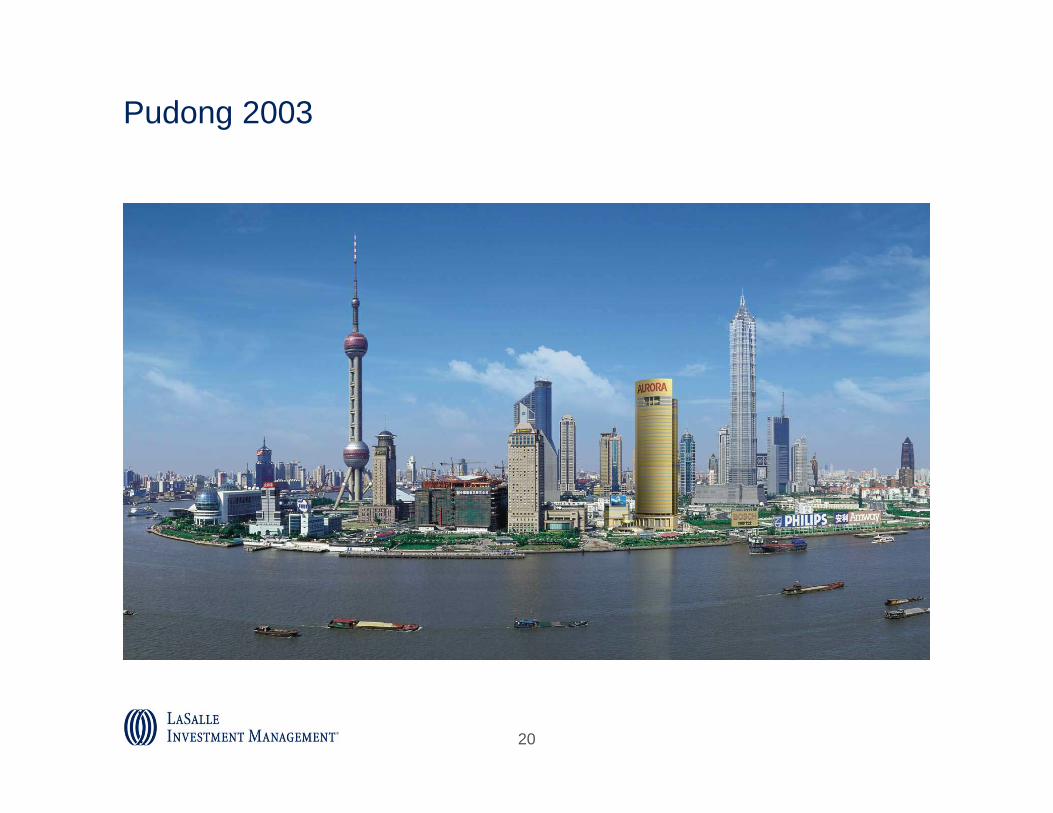
Pudong 2003
21
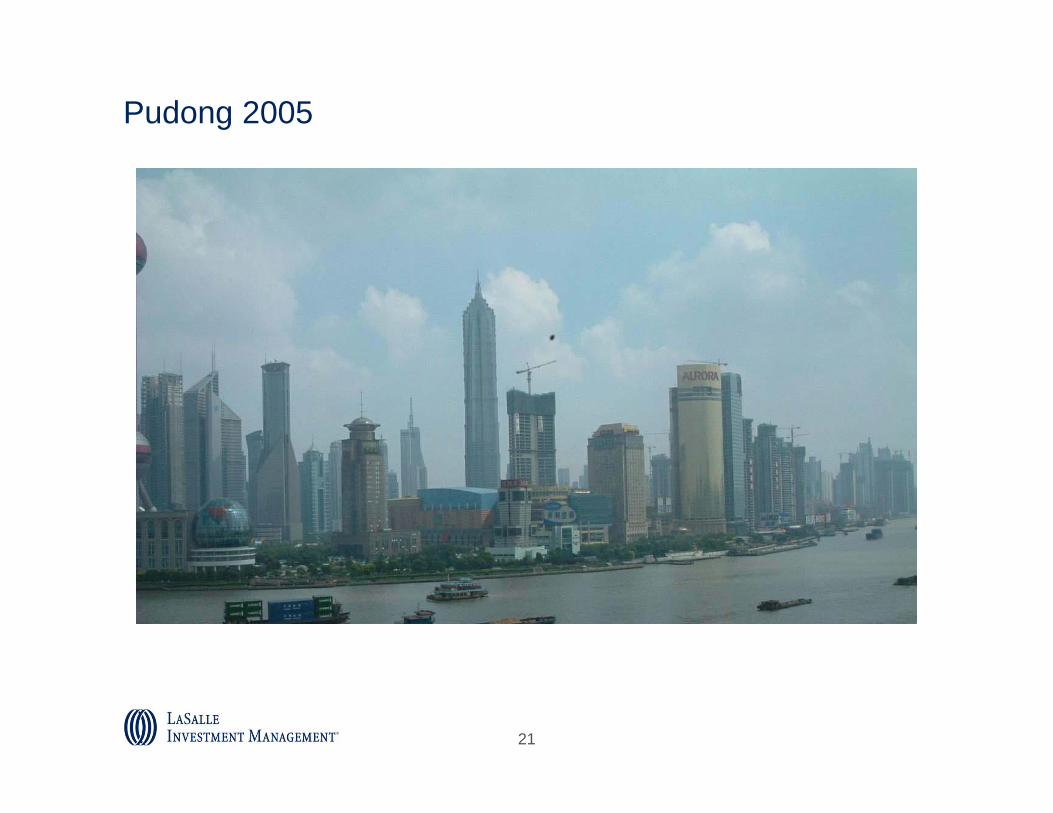
Pudong 2005

22
Pudong-Puxi 2011
23
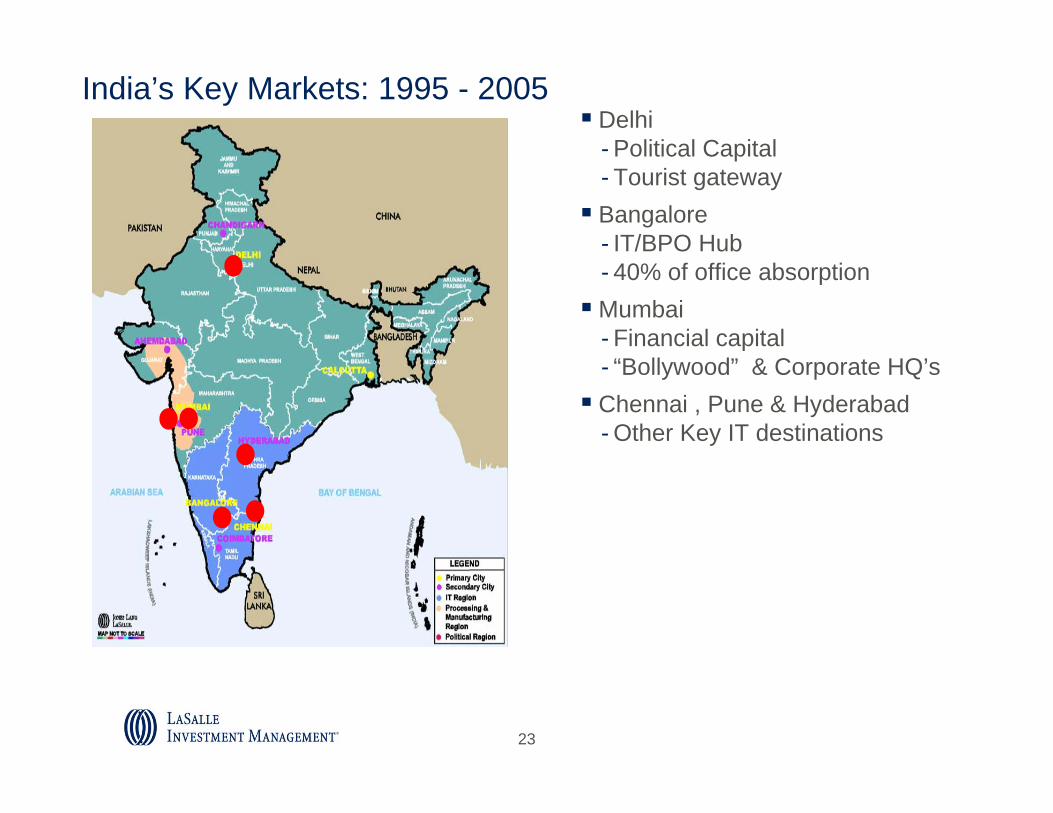
India’s Key Markets: 1995 - 2005 Delhi
- Political Capital - Tourist gateway Bangalore
- IT/BPO Hub- 40% of office absorptionMumbai
- Financial capital - “Bollywood” & Corporate HQ’s Chennai , Pune & Hyderabad
- Other Key IT destinations

24

25
Brazil Overview
186 million population (world’s 5th largest)
3.2 million sq. miles (8.5 million km2)
GDP (US$PPP): $1.8 trillion (world’s 10th largest)
GDP per capita (US$PPP): $9,695
Literacy rate: 88%
Total exports are equivalent to 14% of GDP.
Largest Trading Partner: USA (18% imports; 16% of exports).
Urban Population: 87%
Number of cities with population ≥ 1 million: 14
80% of population lives within 200 km of the Atlantic Ocean
Sao PauloRio de Janeiro
-Brazil’s total area is greater than that of the Continental USA’s.

26
Notional capital values based on rents and yields for Grade A space in CBD or equivalent. In local currency.Source: Jones Lang LaSalle, October 2011.
% change
Prime Offices – Capital Value Change, Q3 2010 – Q3 2011
AmericasEMEA
Asia Pacific
27
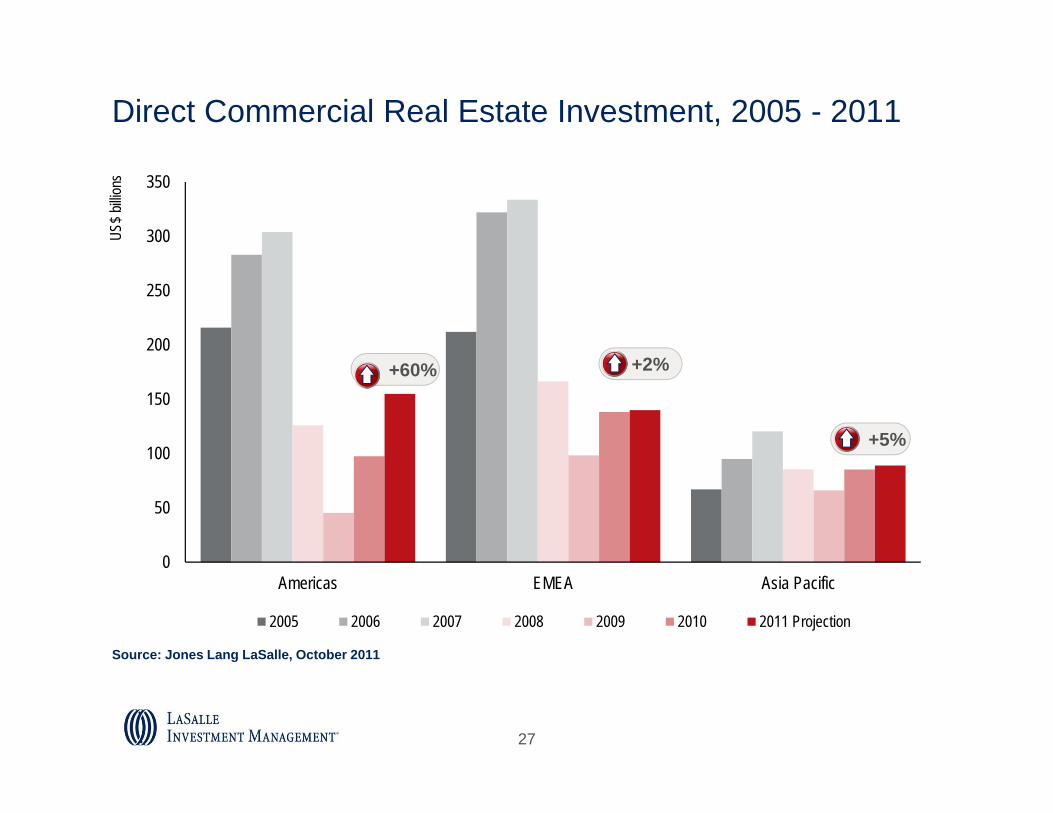
Direct Commercial Real Estate Investment, 2005 - 2011
0
50
100
150
200
250
300
350
Americas EMEA Asia Pacific
US$ b
illion
s
2005 2006 2007 2008 2009 2010 2011 Projection
Source: Jones Lang LaSalle, October 2011
+60% +2%
+5%

28
The Real Estate Investable Universe 2011
Source: Investment Property Databank, LaSalle Investment Management As of 3Q 2011
Total Investable Real Estate US$ 36.5 trillion
Institutional Public & Private US$6.9 trillion
Public Real Estate US$ 2.4 trillion

29
Global Real Estate Universe by Region 2011
Listed Real EstateTotal = $2.4 trillion
Institutional Real EstateTotal = $6.9 trillion
Source: Investment Property Databank, LaSalle Investment Management As of 3Q 2011Note: The Listed Real Estate Universe includes all publicly listed property companies, primarily REITs and REOCs. Diversified development companies are included in emerging markets, but homebuilders are excluded. The Institutional Real Estate Universe includes all institutional investor-owned property, public and private.
Europe31.8%
Middle East & North Africa3.5%
Asia Pacific30.5%
Americas34.2%
Europe16.7%
Middle East and Africa
3.1%
Asia Pacific43.2%
Americas37.0%

30
Real Estate: A Major Asset ClassBut Institutional Ownership Still Small Relative to Other Asset Classes
Source: Investment Property Databank, LaSalle Investment Management As of 3Q 2011Note: Debt data source is the Bank for International Settlements as of June 2011; Equity market capitalization source is from World Federation of Exchanges, as of August 2011; Real estate estimate source is LaSalle Investment Management
$0
$10
$20
$30
$40
$50
$60
Sovereign DebtOutstanding
Corporate andFinancial DebtOutstanding
Global EquityMarket
Capitalization
GlobalInvestable Real
Estate
Estim
ated
Val
ue, T
rillio
ns
Institutional InvestedComponent
Can Europe hold it together?

32
Eurozone Scenarios
Federate with a new treaty
Break up the Currency, Keep the Trade Pact
Devalue, Default, Deutchmark über alles
Creative Destruction… Or Muddle Through
Josef Schumpeter Belgian Surrealist

33
LaSalle Investment Management Research & Strategy
For more information please contact: Jacques Gordon +1 312 228 2760
This information is intended to assist professional investors in deciding whether they wish to consider the investment further. This publication does notconstitute an offer to sell, or the solicitation of an offer to buy, any securities or any interests in investment funds sponsored by, or the advisory servicesof, LaSalle Investment Management and is subject to correction, completion and amendment without notice. Any such offer, if made, will only be madeby means of a confidential prospectus. The prospectus will include information regarding investment risk and investors should have the financial abilityand willingness to accept these risks. All information obtained from third party sources is believed to be reliable and current, but accuracy cannot beguaranteed and we do not undertake to update any information contained in this document. All assumptions, figures and calculations contained in theinformation must be independently verified by the professional investor. This publication has been prepared without regard to the specific investmentobjectives, financial situation or particular needs of recipients. No legal or tax advice is provided. Recipients should independently evaluate specificinvestments and trading strategies. By accepting receipt of this publication, the recipient acknowledges that this publication is confidential and agreesnot to distribute, offer or sell this publication or copies of it and agrees not to make use of the publication other than for its own general informationpurposes. Copyright © 2011 LaSalle Investment Management. All rights reserved. No part of this publication may be reproduced by any means,whether graphically, electronically, mechanically or otherwise howsoever, including without limitation photocopying and recording on magnetic tape, orincluded in any information store and/or retrieval system without prior permission of LaSalle Investment Management.