outline spectroscopic investigations of implosions on the ... · the national ignition facility...
TRANSCRIPT
LLNL-PRES-668439 This work was performed under the auspices of the U.S. Department of Energy by Lawrence Livermore National Laboratory under Contract DE-AC52-07NA27344. Lawrence Livermore National Security, LLC
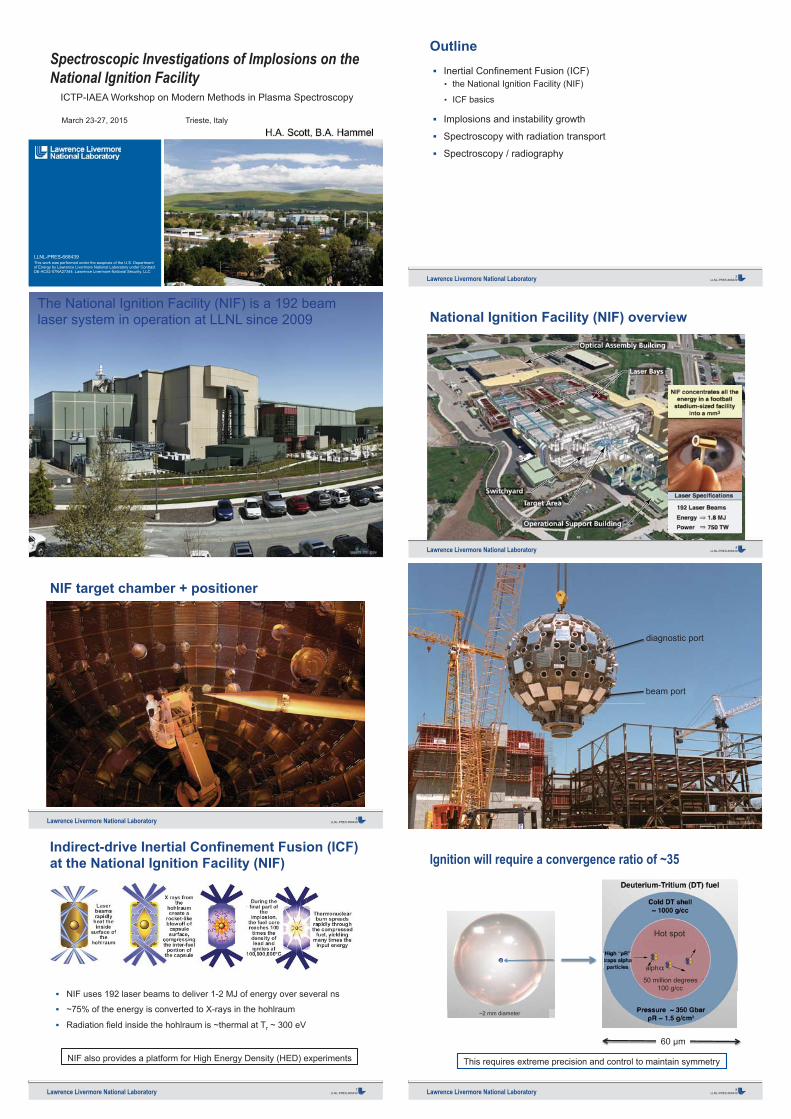
Spectroscopic Investigations of Implosions on the National Ignition Facility
ICTP-IAEA Workshop on Modern Methods in Plasma Spectroscopy
March 23-27, 2015 Trieste, Italy
Lawrence Livermore National Laboratory LLNL-PRES-668439 2
Outline Inertial Confinement Fusion (ICF)
• the National Ignition Facility (NIF)
• ICF basics
Implosions and instability growth
Spectroscopy with radiation transport
Spectroscopy / radiography
Lawrence Livermore National Laboratory LLNL-PRES-668439 3
The National Ignition Facility (NIF) is a 192 beam laser system in operation at LLNL since 2009
Lawrence Livermore National Laboratory LLNL-PRES-668439 4
National Ignition Facility (NIF) overview
Lawrence Livermore National Laboratory LLNL-PRES-668439 5
NIF target chamber + positioner
Lawrence Livermore National Laboratory LLNL-PRES-668439 6
Outline The list of bullets will start from here
diagnostic port
beam port
Lawrence Livermore National Laboratory LLNL-PRES-668439 7
Indirect-drive Inertial Confinement Fusion (ICF) at the National Ignition Facility (NIF)
NIF also provides a platform for High Energy Density (HED) experiments
NIF uses 192 laser beams to deliver 1-2 MJ of energy over several ns
~75% of the energy is converted to X-rays in the hohlraum
Radiation field inside the hohlraum is ~thermal at Tr ~ 300 eV
Lawrence Livermore National Laboratory LLNL-PRES-668439 8
Ignition will require a convergence ratio of ~35
This requires extreme precision and control to maintain symmetry
ρ
50 million degrees 100 g/cc
Hot spot
alph
60 μm
~2 mm diameter
Lawrence Livermore National Laboratory LLNL-PRES-668439 9
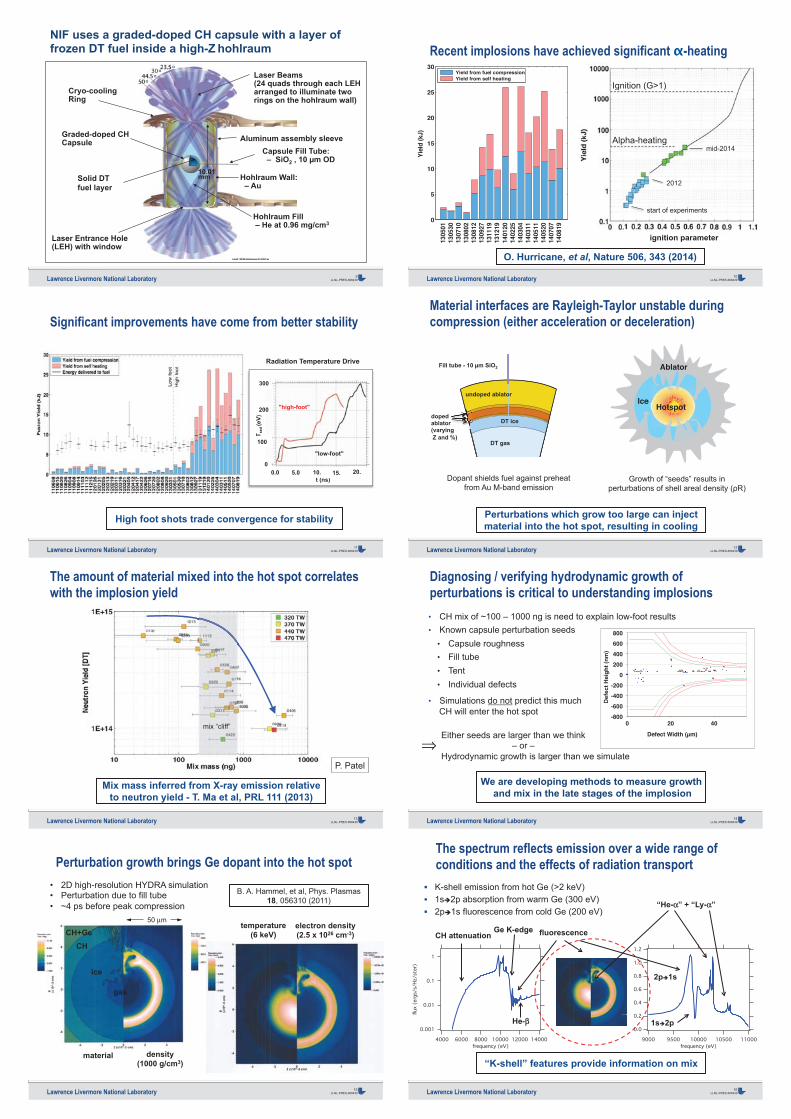
NIF uses a graded-doped CH capsule with a layer of frozen DT fuel inside a high-Z hohlraum
Hohlraum Wall: – Au
Laser Beams (24 quads through each LEH arranged to illuminate two rings on the hohlraum wall)
Laser Entrance Hole (LEH) with window
Hohlraum Fill – He at 0.96 mg/cm3
10.01 mm
Graded-doped CH Capsule
Solid DT fuel layer
Cryo-cooling Ring
Aluminum assembly sleeve
° ° ° °
Capsule Fill Tube: – SiO2 , 10 µm OD
Lawrence Livermore National Laboratory LLNL-PRES-668439 10
Recent implosions have achieved significant α-heating
0
5
10
15
20
25
30
1305
0113
0530
1307
1013
0802
1308
1213
0927
1311
1913
1219
1401
2014
0225
1403
0414
0311
1405
1114
0520
1407
0714
0819
Yie
ld (k
J)
Yield from fuel compression Yield from self heating
start of experiments
2012
mid-2014
Ignition (G>1)
Alpha-heating
g ( )
p g
ignition parameter
O. Hurricane, et al, Nature 506, 343 (2014)
Lawrence Livermore National Laboratory LLNL-PRES-668439 11
Significant improvements have come from better stability
High foot shots trade convergence for stability
"low-foot"
Radiation Temperature Drive
"high-foot"
300
0
T rad
(eV)
t (ns) 0.0 10. 20.
100
200
5.0 15.
Lawrence Livermore National Laboratory LLNL-PRES-668439 12
Material interfaces are Rayleigh-Taylor unstable during compression (either acceleration or deceleration)
Perturbations which grow too large can inject material into the hot spot, resulting in cooling
Fill tube - 10 µm SiO2
DT ice
DT gas
undoped ablator
doped ablator (varying Z and %)
rnggr
Dopant shields fuel against preheat from Au M-band emission
Ice
Ablator
Hotspot
Growth of “seeds” results in perturbations of shell areal density (ρR)
Lawrence Livermore National Laboratory LLNL-PRES-668439 13
The amount of material mixed into the hot spot correlates with the implosion yield
Mix mass inferred from X-ray emission relative to neutron yield - T. Ma et al, PRL 111 (2013)
P. Patel
mix “cliff”
Lawrence Livermore National Laboratory LLNL-PRES-668439 14
• CH mix of ~100 – 1000 ng is need to explain low-foot results • Known capsule perturbation seeds
• Capsule roughness • Fill tube • Tent • Individual defects
• Simulations do not predict this much CH will enter the hot spot
Diagnosing / verifying hydrodynamic growth of perturbations is critical to understanding implosions
We are developing methods to measure growth and mix in the late stages of the implosion
-800
-600
-400
-200
0
200
400
600
800
0 20 40
Def
ect H
eigh
t (nm
)
Defect Width (μm)Either seeds are larger than we think – or –
Hydrodynamic growth is larger than we simulate ⇒
Lawrence Livermore National Laboratory LLNL-PRES-668439 15
Perturbation growth brings Ge dopant into the hot spot
temperature (6 keV)
electron density (2.5 x 1026 cm-3)
material density (1000 g/cm3)
gas
CH
ice
50 μm
• 2D high-resolution HYDRA simulation • Perturbation due to fill tube • ~4 ps before peak compression
B. A. Hammel, et al, Phys. Plasmas 18, 056310 (2011)
CH+Ge
Lawrence Livermore National Laboratory LLNL-PRES-668439 16
0.001
0.01
0.1
1
flux
(erg
s/s/
Hz/s
ter)
140001200010000800060004000frequency (eV)
The spectrum reflects emission over a wide range of conditions and the effects of radiation transport
K-shell emission from hot Ge (>2 keV) 1s 2p absorption from warm Ge (300 eV) 2p 1s fluorescence from cold Ge (200 eV)
“K-shell” features provide information on mix
1.2
1.0
0.8
0.6
0.4
0.2
0.0
flux
(erg
s/s/
Hz/s
ter)
11000105001000095009000frequency (eV)
“He-αα” + “Ly-α”
Ge K-edge fluorescence
1s 2p
CH attenuation
He-β
2p 1s
(e(eflu
x (e
flux
(eeflu
x (e
flux
(eflu
x (e
flux
(eflu
x (e(((e
flux
(ex
(ex
(eflu
x (e(
ux (e(
flux
(fl
//
rgs/
s/rg
s/s/
rgs/
s/rg
s/s/
rgs/
s/rg
s/s/
rgs/
s/rg
s/s/
rgs/
s/rg
s/s/
rgs/
s//rg
s/s/
rgs/
s/rg
s/s///
rgs/
sgs
/srg
s/s
rgs//gssss
Hz/s
teHz
/ste
Hz/s
teeeeHz
/steete
Hz/s
teteste
Hz/s
teHz
/st
Hz/s
Hz//
HHzHHHr)r)r)))r)))r)r)r)rrr

Lawrence Livermore National Laboratory LLNL-PRES-668439 17
Monochromatic imaging accentuates features
Fluorescence is locally weak but extends over a large area
position (μm)
posi
tion
(μm
)
position (μm)
10.22 keV (He-α) 9.85 keV
Lawrence Livermore National Laboratory LLNL-PRES-668439 18
Experimental spectra show optically thick features similar to simulations
S. P. Regan, et al, Phys. Rev. Let. 111, 045001 (2013)
Co
nti
nu
um
-su
btr
acte
din
ten
sity
(J/
keV
/ste
r)
9.8 10.0 10.2Photon energy (keV)
10.4 10.6 10.8
2.5
2.0
1.5
1.0
0.5
0.0B-like Ge
Be-like Ge
Li-like GeHe-like Ge
Ge Hea + satelliteemission
Ge Ka emissionFluorescentinner-shell transitionsof Ne-like to N-like Ge
Ge Lya + satellite emission
2|2 fits
Best fits
This 0D analysis only addresses the “He-α” emission
• Shot N120219
• Capsule doped with Si, Ge, and Cu
• Best fit uniform conditions: Te ≈ 3 keV ne ≈ 1025 cm-3 (ρR)Ge ≈ 0.3 mg/cm2
τ He-α ≈ 10
Lawrence Livermore National Laboratory LLNL-PRES-668439 19
• Count photons emitted at a given frequency Nν • Infer total atom population Ni from
• Complications: • Emission rate per atom, , depends strongly on Te , ne
estimate Te , ne from spectral features
• Optical depth effects (lines + shell)
approximate with escape factors, shell ρr fitting parameter
• Non-uniformity in space and/or time
• Non-emitting mass is invisible (but likely unimportant)
The basic 0D analysis method counts photons
The resulting mass estimates have large uncertainties
Nν =Niην (ne,Te )Δt
ην
Lawrence Livermore National Laboratory LLNL-PRES-668439 20
1D modeling provides additional information
Radiation transport connects the spectral features
Hot spot:DT gas + mix
“Ice”:DT + mix
unablated shell:cold, dense CH + Ge
3-shell model (O. Ciricosta, Oxford U.)
Conditions in the hot spot Ge emission features continuum radiation
Hot spot radiation + cold shell absorption K-shell edge K-α fluorescence
Photon energy (eV)
Tim
e-in
tegr
ated
si
gnal
(J/k
eV/s
ter)
4-shell model allows separate mixed and unmixed regions (in pressure balance) in the hot spot
4-shell fit hot spot parameters - mix : 40 ng (34 – Regan PRL) mass: 6.8 μg (6.5 – neutron yield)
Lawrence Livermore National Laboratory LLNL-PRES-668439 21
• “He-α” emission – hot spot Te, ne • He-α red wing – “ice” Te, ne • K-shell jump – shell ρR
• K-shell position, slope – shell Te, ne + continuum lowering model
• K-α fluorescence – shell Te
Features are sensitive to physical parameters and models
0.7
0.6
0.5
0.4
0.3
0.2
0.1
0.0
signa
l (J/
keV/
ster
)
1110photon energy (keV)
shell Te 100 eV 150 eV 200 eV 250 eV 300 eV
0.7
0.6
0.5
0.4
0.3
0.2
0.1
0.0
sign
al (
J/ke
V/s
ter)
1110photon energy (keV)
shell Te = 100 eV mod. Ecker-Kroll non-degenerate Stewart-Pyatt
ne = 1025
cm-3
Tf = 350 eV
Lawrence Livermore National Laboratory LLNL-PRES-668439 22
Argon in the gas provides backlighting to analyze the growth of perturbations
Machined perturbations (mode ~60) are easily visible
105
106
107
108
109
powe
r (W
/sr)
17.817.617.417.217.016.8time (ns)
no Ar 1% Ar
above 8 keV above 10 keV
peak compression comp
shock bounce ock bo
simulated X-ray power Low-foot High-foot
mode 60 mode 90 mode 60 mode 90
These images are from an earlier time and use an external Vanadium backlighter
Lawrence Livermore National Laboratory LLNL-PRES-668439 23
Simulated diagnostics diagnose the shell ρR
70% He 30% D 1% Ar
• Innermost layer doped with Cu • Images above / below K-edge
obtained with Ross filter pairs
Lawrence Livermore National Laboratory LLNL-PRES-668439 24
Intensity jump across K-edge provides information on ρR
Analysis of a synthetic spectrum reproduces the ρR variations of a rippled shell
Iν = Bν (T )e−τν , τν = ρR( )κν
materials∑
hot spot Te
t
• Analysis requires Te of hot spot - provided by spectroscopy
• Integrate over filter response function • ρR of ablated material estimated from simulation
lnI↓B↑
I↑B↓
⎛
⎝⎜⎞
⎠⎟=
ρR( )shκ sh
↓ + ρR( )abκ ab
↓
ρR( )shκ sh
↓ + ρR( )abκ ab
↓⎡⎣
⎤⎦ ν↓ ν↑( )3 + fdop ρR( )sh Δκ dop
ablated material
shell

Lawrence Livermore National Laboratory LLNL-PRES-668439 25
Initial experiments look promising • Target with pre-imposed ripples • Inhomogeneity along ripples due to machining imperfections • Spectra show emission from shock bounce and peak compression • Spacing, ρR vs time give capsule velocity, growth factors
An improved spectrometer (coming soon) will enable better quantitative analysis of ρR
μ
μ
17.33ns, R~150μm
μ
μ17.46ns, R~130μm
L. Pickworth
Lawrence Livermore National Laboratory LLNL-PRES-668439 26
Recent work has focused on the effect of the “tent” – a thin plastic membrane which supports the capsule
Rayleigh-Taylor growth is seeded where the tent
leaves the capsule
~ 50-100 nm thick plastic (Formvar)
Tent
The tent can induce large (~40%) defects in the shell ρR
Lawrence Livermore National Laboratory LLNL-PRES-668439 27
In a DT target, a jet of CH penetrates the shell and cold DT enters the hot spot
Yield is reduced by ~50%
50 nm tent: Tangential +14 deg
CH does not quite reach the hot-spot
Lawrence Livermore National Laboratory LLNL-PRES-668439 28
An appropriate dopant could provide a spectroscopic signature of the jet / bubble resulting from the tent scar
These simulations are of a Symcap, in which DT ice is replaced by an equivalent mass of CH
Lawrence Livermore National Laboratory LLNL-PRES-668439 29
An appropriate dopant could provide a spectroscopic signature of the jet / bubble resulting from the tent scar
These simulations are of a Symcap, in which DT ice is replaced by an equivalent mass of CH
Lawrence Livermore National Laboratory LLNL-PRES-668439 30
12x10-3
10
8
6
4
2
0
radia
tive
powe
r (er
g/s/
Hz/s
ter)
20x10315105frequency (eV)
9º 18º 27º 36º 45º 54º 63º 72º 81º 90º
The tent scar allows radiation to escape the hot spot
Radiative energy loss may also be significant
90°
0°
temperature CH density t t CH d it100 μm 100 μm
100 μm
Escaping radiation spectrum at multiple viewing angles
Lawrence Livermore National Laboratory LLNL-PRES-668439 31
Spectral features • Ly- and He- emission, K-α fluorescence
• K-edge absorption
• Continuum shape
• Time-dependence
Diagnostics for • Hot spot temperature
• Shell optical depth
• Shell velocity, growth factors
Spectroscopy is providing information on NIF implosions
Spectroscopic simulations are an important part of the experimental design process