our journey in 2001
TRANSCRIPT
o u r j o u r n e y i n 2 0 0 1

Huhtamaki – the name in consumer packaging
ver the past two decades, the
company has refocused itself, aimed
at world leadership in selected business
areas by the year 2000. Following almost
200 corporate transactions, this milestone
was achieved in consumer packaging, a core
activity since the 1960s.
Today, Huhtamaki does nothing but consumer
packaging. Its products communicate brand
identity, help customers sell more, protect the
integrity and freshness of the contents, and
add convenience to the lives of millions of
consumers every day.
With annual sales of EUR 2.4 billion and
16,000 employees in 35 countries,
Huhtamaki is one of the world’s largest
packaging companies, and one of the few
truly global players. Specifically, it is the world
leader in rigid, thin-walled plastic and paper
food packaging and molded fiber packaging.
It also has strong positions in high-
performance flexible packaging.
Having finally reached its desired structure,
the company now concentrates on improving
its internal operations and processes. The
ultimate aim is to make Huhtamaki a synonym
for superior quality, service and innovation in
consumer packaging. This cannot be
achieved in a vacuum, but together with
customers, suppliers, shareholders and
other stakeholders.
The following pages will take you deeper
into the world of Huhtamaki. Chances are,
it has more to do with yours than you have
known.
Since 1920, HUHTAMAKI has stood out as a premier name in the Finnish corporate world. AsHeikki Huhtamäki’s original sweets business diversified into a conglomerate, the name assumedseveral meanings for successive generations.
O
Contents 32
Huhtamaki – the name in consumer packaging . . . . . . . .2
A word from the CEO . . . . . . . . . . . . . . . . . . . . . . . . . . . .4
Roots deep in the industry’s history . . . . . . . . . . . . . .6
An unrivalled range of capabilities . . . . . . . . . . . . . .8
2001 in retrospect:
Europe . . . . . . . . . . . . . . . . . . . . . . . . . . . . . . . . . . . .10
Americas . . . . . . . . . . . . . . . . . . . . . . . . . . . . . . . . . .12
Asia–Oceania–Africa . . . . . . . . . . . . . . . . . . . . . . . . .14
Financial highlights for 2001 . . . . . . . . . . . . . . . . . . .16
The Huhtamaki share . . . . . . . . . . . . . . . . . . . . . . . . . . .18
Corporate governance . . . . . . . . . . . . . . . . . . . . . . . . . . . .20
Human resources objective . . . . . . . . . . . . . . . . . . . . . . . . . .22
Caring for the environment . . . . . . . . . . . . . . . . . . . . . . . . . . . . .24
Administration and auditors . . . . . . . . . . . . . . . . . . . . . . . . . . . . . . . .26
Key addresses . . . . . . . . . . . . . . . . . . . . . . . . . . . . . . . . . . . . . . . . . . . . . . . . .28
News headlines in 2001 . . . . . . . . . . . . . . . . . . . . . . . . . . . . . . . . . . . . . . . . . . . . . . .30
Contents


A word from the CEO 54
A word from the CEO
he formula for success was simple:
a clear direction, a driven, professional
organization – and stability after years of
constant change.
We finally established Huhtamaki as a world
leader in important segments of consumer
packaging. This required the divestment of the
Van Leer industrial packaging division, a full
30% of our consolidated sales in 2000.
During the year, we also concluded our
program to divest smaller, non-core units.
Further, we focused on improving our internal
efficiencies through a host of measures. Raw
materials prices retreated from their peak levels
in 2000. All of this laid the foundations for our
strong margin improvement visible from the
first quarter onwards and still accelerating
towards year-end.
Several clouds gathered to shade the global
economy during the year, yet against that
background our overall sales growth was
satisfactory. I am particularly pleased with our
progress in the Americas, where a strong
rebound was evident after the September 11
shock.
During the year, we made a significant
commitment to boost our innovative
capabilities. Three dedicated Technology and
Development Centers are now up and
running. We also placed more emphasis and
resources on category development and
group-level marketing. The new activities
cannot make a difference overnight. Rather,
they underline our long-term commitment to
increase our leadership in consumer
packaging.
In 2002, the ongoing program to streamline
manufacturing will come to fruition. Expect no
major changes in strategy or structure.
Expect further concentration on business
development and enhancing customer
satisfaction. Finally, expect our financial
performance to improve further.
I thank the international community of
Huhtamaki’s stakeholders for another year of
support and success.
Timo Peltola
T
Against the challenges of 2001, we have reason to be satisfied, even proud of Huhtamaki’s progress.We reached our key structural and business targets for the year. At the same time, we took a longstep towards achieving our longer-term financial objectives.

Yesteryear’s hand crafting of paper cups – one modern machine can produce over 300 cups per minute!

Roots deep in the industry’s history 76
Roots deep in the industry’s history
n Europe, the oldest root leads to
Ronsberg in Southern Germany. Here,
on what is now one of the world’s largest
and most advanced consumer flexibles
sites, a paper mill was founded in 1585. A
couple of centuries later, another paper mill
was started in Pribyslavice, Czechia. It
began to produce molded fiber packaging
after WW II, and is now one of our top units
in the field.
Speaking of molded fiber, the process of
making packaging from wet pulp or recycled
paper is the invention of a Mr. Keyes in the
United States from the 1920s. The company
he established became known for its
Chinet® brand of superior disposable
tableware. Without it, Huhtamaki would not
be the world leader in this environment-
friendly packaging technology, with an ever-
broadening range of applications.
Rigid paperboard packaging is another forte
of ours. In the United States, the hygienic
board made near the Oswego Falls in
upstate New York since the 1870s became
the foundation of our Sealright® packaging
systems for the dairy and ice cream
industries. Paper drinking cups have been
around for a century, and we ranked early
on among the industry pioneers all over the
world: in Central Europe and Oceania from
the 1920s, in Scandinavia the following
decade, and in Asia dating from the 1950s.
The units already engaged in paper
packaging were often the early adopters of
the plastic thermoforming and injection
molding technologies, which started to
conquer the packaging world in the 1950s. In
Germany and France, for example, we were
among the very first thermoformers of dairy
packaging. And in Finland, the first plastics
lines were introduced in 1965, prompting
Huhtamaki to sell its tin can operations to a
competitor and establish Polarpak instead
(the alternative name, Europak, was
considered a bit bullish back then...).
Over the years, our innovative packaging
has helped many customers to successfully
launch a new brand or support an old one,
to enter new markets or to extend the shelf
life of a sensitive product.
We were there, when the round paperboard
ice cream container became an American
icon. We were there, when fast food landed
in Europe, Oceania and Asia, aiding its
phenomenal growth. We play a leading role
now that retortable stand-up pouches
replace tin, glass and other materials,
providing consumers superior convenience
and product quality. And we will be around
tomorrow, offering smarter packaging
with improved barrier properties and
environmental performance.
I
Perception isn't always reality. For being a fresh name in the industry, Huhtamaki combines packaging history and experience that is second to none. The family tree of a company that hascome together via mergers and acquisitions is bound to have several strong roots, and so has ours.
continuously serving...
• Unilever since 1930s
• Coca-Cola since 1968
• Kraft since 1973
• McDonald’s since 1983
consumer packaging sales 1980–2001
2500
2000
1500
1000
500
0
eur million
1987 Bellaplast (Germany)
1988 Lilypak (Australia, New Zealand)
1991 Sweetheart International
(U.K., The Netherlands)
1993 CMB thermoforming units
(France, Italy, U.K.)
1997 Pacific World Packaging
(Australia, Hong Kong etc.),
1997 Monoservizio Bibo (Italy),
Güven Plastik (Turkey)
1998 Sealright, Tetra Cup (USA)
1999 Van Leer (The Netherlands etc.),
Brasholanda (Brazil)
2000 PRI assets (USA),
Mono Containers (South Africa),
Malvern flexibles (USA)
major packaging acquisitions 1987–2000


An unrivalled range of capabilities 98
An unrivalled range of capabilities
uhtamaki’s strategy rests on two
pillars: a global network enabling
the company to provide its customers high
quality and a variety of products wherever
they operate, and a comprehensive
technology range permitting the company
to offer alternatives, combine materials for
innovative solutions, and act as a one-stop
shop for many customers.
Consumer GoodsThe consumer goods category serves
primarily the food industry but also,
increasingly, the pet food, personal care and
detergent sectors. Huhtamaki is the world
leader in rigid, thin-walled cups, tubs,
containers and lids made from plastic and
paper, and a front-runner in complex, high-
performance flexible packaging.
Main market segments:
ice cream, edible fats, dairy, personal care
and detergents, pet food, confectionery,
soups and ready meals, coffee and tea
Main customers (alphabetically):
Colgate-Palmolive, Danone, Dreyer’s, Häagen-
Dazs, Kraft Foods, Mars, Nestlé, Unilever
Food Service The food service customers include all
leading international quick service and
beverage operators, as well as their local
counterparts. Food service products are
also sold to institutional caterers and
vending operators. Branded food service
disposables for households are another
important product category. New market
segments addressed include airline catering
and health care disposables. Huhtamaki is
the world leader in plastic and paper cups
and plates. Molded fiber products play an
important role in the category as well.
Main market segments:
quick service restaurants and beverage,
catering, vending, retailers
Main customers (alphabetically):
Bunzl, Burger King, Coca-Cola, McDonald’s,
PepsiCo, Sysco, Tricon International
Fresh Foods There is a consumer trend to switch from
processed to fresh foods, which require
special packaging to promote product
integrity, freshness and appearance. At the
same time, the portioning and packing of fresh
produce, such as meat, poultry, seafood, fruit
and vegetables, has largely moved from retail
trade into industrial-scale operations.
Sophisticated packaging solutions, such as
modified atmosphere packaging and modular
concepts, prolong shelf life and facilitate
logistics through the supply chain.
Huhtamaki is the world leader in molded
fiber packaging. Few if any competitors can
offer such a comprehensive range of
materials, technologies and packaging
varieties suitable for this diverse category,
which also includes the rapidly growing
home meal replacement segment.
Main market segments:
Industrial packers and food industry:
fruits and vegetables, meat and poultry,
eggs, chilled and frozen ready meals
Food retailers:
fresh produce, home meal replacement
Other operationsThrough its Forchheim and Göttingen units in
Germany, Huhtamaki is engaged in the
manufacture of films, coatings and siliconized
papers for different purposes. The Group
also possesses considerable engineering
skills for developing and supplying customer-
operated equipment and complete
packaging solutions. These include molded
fiber machinery as well as in-plant container
forming and filling machines for frozen
desserts as well as other food and non-food
products. Huhtamaki is an important paper
recycler in continental Europe. The company
aims to commercialize the environmentally
superior EarthShell® food service packaging
in Europe during 2002, with future prospects
in Asia and Oceania.
Technology and developmentHuhtamaki deploys six main packaging
technologies:
• Paper forming
• Rigid plastic extrusion, co-extrusion
and thermoforming
• Foam plastic extrusion and thermoforming
• Plastic injection molding with in-mold
labeling
• Flexible plastic and paper converting and
lamination
• Smooth and rough molded fiber
While most of the processes employ
commonly available equipment, Huhtamaki
has considerable experience in optimizing
their use and developing proprietary
applications. A major investment has been
made to introduce state-of-the-art graphics
technology all the way from product design
and prototyping to high-speed, high-
resolution printing lines.
Local new product development activity and
dedicated Technology & Development
Centers ensure a steady flow of new,
innovative products. Also, combining
technologies enables us to introduce novel
packaging products uniting the best of both
worlds.
H
As a specialty consumer packaging group, Huhtamaki ranks among the very largest in the world.Over 70% of its sales are derived from product categories and manufacturing technologies where thecompany is the world leader. Hence, it does not directly compete with the even larger packagingcompanies present in the broad metal, glass and corrugated carton categories.


2001 in retrospect 1110
2001 in retrospect: EuropeIn 2001, Huhtamaki continued to build its European operations, addressing structural and businesschallenges identified over the past few years. Both external factors and our own actions led to a relatively low sales growth. However, rationalization and synergies, lower raw materials prices and ahigher value added product mix all contributed to a strong improvement in operating margins andreturn on net assets across the region
uropean sales amounted to EUR
1,179 million. Sales of core packaging
products were robust; the 2% decline in total
sales reflects the retreat from unprofitable
product lines, the divestment of two business
units and the low value of waste paper
trading. The underlying market development
was relatively stronger in North and Central
Europe, with the Czech molded fiber unit
posting the highest sales growth. South
Europe and the U.K. also reported significant
gains in operating margins. Hence, the
operating profit from Europe improved by
27% to EUR 93 million, with the final-quarter
figure up by 55%.
New food service products were introduced
to address growth opportunities in the
dynamic Coffee-to-Go and chilled drinks
segments. Molded fiber carrier trays for quick
service restaurants advanced sharply. In fresh
foods, proprietary product development
resulted in superior absorbent trays
employing open cell technology. The Desto
concept, which combines a plastic barrier
liner inside a paperboard shell, found new
applications. Multilayer barrier sheets for
thermoformed food containers showed great
promise. Laminate for sterilizable stand-up
pouches was in good demand, and new
applications were introduced.
Outside the category structure, the German-
based films business continued its strong
performance, and molded fiber machinery
sales were up.
During the year, the Groenlo paper cup plant
in the Netherlands was closed and its
production relocated to other units, mainly to
Göttingen, Germany. In France, the relocation
of the Guegon plastics operation to Auneau
was completed. A molded fiber operation in
Italy and a flexible packaging unit in Turkey
were divested. Overall, some 100 individual
machines were transferred in order to improve
manufacturing efficiencies, gain economies of
scale and address growth segments.
The reconstruction of the Polish Siemianowice
plant, which was destroyed by fire in late 2000,
progressed on plan. In July, a warehouse fire
occurred in Ivanteevka, Russia. In each case,
supplies from sister units guaranteed an
uninterrupted product flow to customers,
proving the value of operating as a network.
The year 2002 contains important milestones
for Huhtamaki’s European operations.
Significant growth will result from partnership
agreements, recently concluded with a major
pet food manufacturer and a leading global
catering operator for example. New local fresh
foods organizations have reached operational
status in several countries, and dedicated
resources will promote network sales across
Europe. The European rationalization program
will be concluded, with logistics as an area of
special attention.
Henk Koekoek
Executive VP Europe
E


2001 in retrospect 1312
AmericasOverall, 2001 resulted in more than satisfactory performance for the Americas, despite the atrociousevents of September 11. In North America, the newly acquired flexibles and plastics operations wereintegrated in a seamless process. The integration process no doubt benefited from the adoption ofthe Huhtamaki name for all Business Units early in the year.
ales in the Americas advanced
by 32% to EUR 826 million, mainly
reflecting acquisitions in late 2000. Operating
profit from the region increased by 38% to
EUR 75 million.
In North America, the consumer packaging
business unit was able to recover from the
one-off issues that it faced during 2000. Fresh
capacity additions became fully operational,
and third party sources were eliminated. The
conversion of the US frozen dessert market to
non-round containers continued, and the unit
fully participated in this process. New
business was developed in both personal
care and pet food packaging. This has
allowed the unit to diversify its customer base
beyond the traditional ice cream market, while
successfully leveraging its ability to offer a full
range of packaging solutions, using paper,
plastics and flexibles.
The retail unit had an outstanding year, as
volumes grew despite recession. The
Chinet® brand of premium tableware
responded positively to new designs and
marketing campaigns, increasing its market
share. Growth in the important grocery and
warehouse clubs channels was above
expectations. This is expected to continue
in 2002, upon the introduction of plastic
products to boost the product range.
The foodservice unit faced some difficult
issues. Growth in the quick service segment
stagnated and was further hampered by the
negative events of September 11. The
demand for frozen food declined, partly as a
function of high energy costs. A perennial
frozen foods customer was lost following its
financial difficulties and change of ownership.
These issues were countered through
streamlining manufacturing: the paper
packaging operations in East Providence,
R.I. were relocated to Fulton, N.Y., and fixed
costs in the Waterville, Maine mill were
pruned via staff cuts. The Mt. Carmel, Pa.
plastics unit was closed and its production
relocated to other units. The remaining
plastics production in East Providence will
be relocated to other units in 2002.
Latin America had an excellent year, but
currency translations into euros masked
growth. Both Brazilian businesses performed
well. In the consumer unit, new volumes were
secured in dairy and ice cream. For molded
fiber, the very low apple crop dictated a more
turbulent year, but the unit gained new
volumes in poultry to offset the volume deficit
and ended the year on track. The
Argentinean unit posted record volumes
despite the country’s fundamental economic
problems.
For 2002, the outlook in both geographies is
positive; new customer commitments will
lead to growth, while rationalization
programs will yield savings and continued
improvement in operational efficiency.
Specifically, the North American food
service business appears to have better
prospects than in 2001. New customer
commitments have been secured. The full
benefit of the plastics range is expected to
be seen in broadline distribution along with
a renewed product development program.
Mark Staton
Executive VP Americas
S

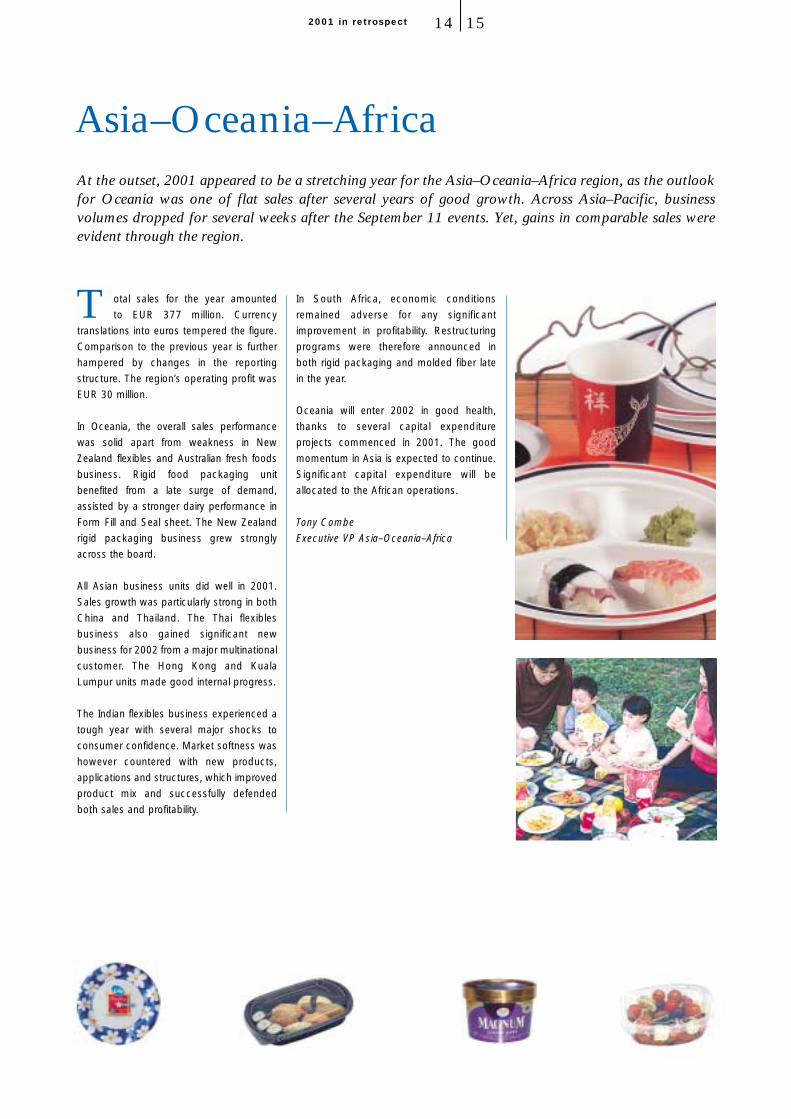
At the outset, 2001 appeared to be a stretching year for the Asia–Oceania–Africa region, as the outlookfor Oceania was one of flat sales after several years of good growth. Across Asia–Pacific, businessvolumes dropped for several weeks after the September 11 events. Yet, gains in comparable sales wereevident through the region.
2001 in retrospect 1514
otal sales for the year amounted
to EUR 377 million. Currency
translations into euros tempered the figure.
Comparison to the previous year is further
hampered by changes in the reporting
structure. The region’s operating profit was
EUR 30 million.
In Oceania, the overall sales performance
was solid apart from weakness in New
Zealand flexibles and Australian fresh foods
business. Rigid food packaging unit
benefited from a late surge of demand,
assisted by a stronger dairy performance in
Form Fill and Seal sheet. The New Zealand
rigid packaging business grew strongly
across the board.
All Asian business units did well in 2001.
Sales growth was particularly strong in both
China and Thailand. The Thai flexibles
business also gained significant new
business for 2002 from a major multinational
customer. The Hong Kong and Kuala
Lumpur units made good internal progress.
The Indian flexibles business experienced a
tough year with several major shocks to
consumer confidence. Market softness was
however countered with new products,
applications and structures, which improved
product mix and successfully defended
both sales and profitability.
In South Africa, economic conditions
remained adverse for any significant
improvement in profitability. Restructuring
programs were therefore announced in
both rigid packaging and molded fiber late
in the year.
Oceania will enter 2002 in good health,
thanks to several capital expenditure
projects commenced in 2001. The good
momentum in Asia is expected to continue.
Significant capital expenditure will be
allocated to the African operations.
Tony Combe
Executive VP Asia–Oceania–Africa
T
Asia–Oceania–Africa

Financial highlights for 2001
key figures
EUR million 2001 2000 Change %(Pro forma)
Net sales 2,382 2,278 4.6
EBITDA 334 297 12.7
% of net sales 14.0 13.0
Operating profit (EBITA) 222 184 20.4
% of net sales 9.3 8.1
EBIT 178 144.5 23.4
% of net sales 7.5 6.3
Profit before exceptional items,
minority interest and taxes 130 118 10.7
Net income 87 80 8.6
EPS before amortization (EUR) 4.45 3.82 16.6
EPS after amortization (EUR) 2.97 2.55 16.6
Dividend (EUR) 1.25* 1.10 13.6
Personnel at year-end 16,417 16,759 -2.0
*) Board’s proposal
highlights
+ Record earnings per share
+ Synergy benefits accumulating
+ Healthy margin improvement
+ Capital structure in line with targets
+ Strong cash flow
+net sales by segment
ice cream
dairy
edible fats
other foods
non-food
fresh foods
catering
consumer
qsr&b

Financial highlights for 2001 1716
net sales
3,500
3,000
2,500
2,000
1,500
1,000
500
01992 1993 1994 1995 1996 1997 1998 1999 2000 2001
eur million
other
consumerpackaging
profit before exceptional items
140
120
100
80
60
40
20
01992 1993 1994 1995 1996 1997 1998 1999 2000 2001
eur million personnel at year-end
25,000
20,000
15,000
10,000
5,000
01992 1993 1994 1995 1996 1997 1998 1999 2000 2001
return on investment (roi)
14
12
10
8
6
4
2
01992 1993 1994 1995 1996 1997 1998 1999 2000 2001
% net debt to equity
1.2
1.0
0.8
0.6
0.4
0.2
0
-0.2
-0.41992 1993 1994 1995 1996 1997 1998 1999 2000 2001
capital expenditure
200
180
160
140
120
100
80
60
40
20
01992 1993 1994 1995 1996 1997 1998 1999 2000 2001
eur million earnings per share
3.0
2.5
2.0
1.5
1.0
0.5
01992 1993 1994 1995 1996 1997 1998 1999 2000 2001
eur
47 %38 %
15 %
europe
americas
asia–oceania–africa
ebita by region
49 %35 %
16 %
europe
americas
asia–oceania–africa
net salesby region
net salesby category
consumer goods
food service
fresh foods
55 %35%
10 %
net salesby technology
rigid packaging
molded fiber
flexibles
other
54 %21 %
24 %
1 %
The Huhtamaki shareupported by an improving financial per-
formance, major share repurchases and
positive views widely held among equity ana-
lysts, the Huhtamaki share price increased by
21% during calendar 2001, with the upward
trend continuing into early 2002. Hence, the
share traded at around EUR 44.00 in mid-
February 2002, some 80% above its lowest
value of EUR 24.50 a year earlier. The volume
of average daily trading in the share
increased by 70% during 2001.
Shares and share capital• One share class
• No physical share certificates
• Original nominal value FIM 20 abolished in
1999; accounting counter value EUR 3.40
• Shares in issue at December 31, 2001:
25,303,948
• Average number of shares in issue in 2001:
29,279,424
• Share capital at December 31, 2001:
EUR 86.0 million
Registration• Finnish Central Securities Depository Ltd.,
electronic Book Entry system
• Nominee registration and temporary
registration for voting at General
Shareholders’ Meetings available to foreign
shareholders
Quotations• HEX (Helsinki Exchanges) main list
since 1960
• Standard lot 50 shares
• Classification: Food Industry
• AEX (EuroNext Amsterdam) from October
1999 until de-listing in February 2001
• Over the counter trading at the Frankfurt,
Munich and Berlin exchanges
• Rule 144A ADR program in the U.S.
from 1990 technically valid
SymbolsHEX: HUH1V
Reuters: HUH1V.HE
Bloomberg: HUH1V.FH
AuthorizationsNo current authorization for Board of
Directors to alter share capital through issue
of new shares or repurchase and invalida-
tion of company shares. Annual General
Meeting on March 25, 2002 to address the
Board’s proposal to launch a new share
repurchase program.
Shareholders and shareholderagreement• 15,669 registered shareholders at the end
of 2001
• Largest shareholders: Finnish Cultural
Foundation and the Association of the
Finnish Cultural Foundation, together
18.2% of share capital
• No current shareholder agreements,
following exit of Van Leer Group
Foundation as shareholder on
September 11, 2001
Insider provisions and shareholding• Full compliance with HEX guidelines
of March 1, 2000
• Insider register maintained by company,
based on information from Central
Securities Depositary Ltd
• Share ownership of Directors and
Executive Committee members at
year-end: 29,450 shares, corresponding
to 0.10% of total
• Management’s stock options: up to
1,350,000 new shares may be issued in
2002–2006, corresponding to 5.3%
of total after subscriptions
• Non-executive Directors have no stock
options
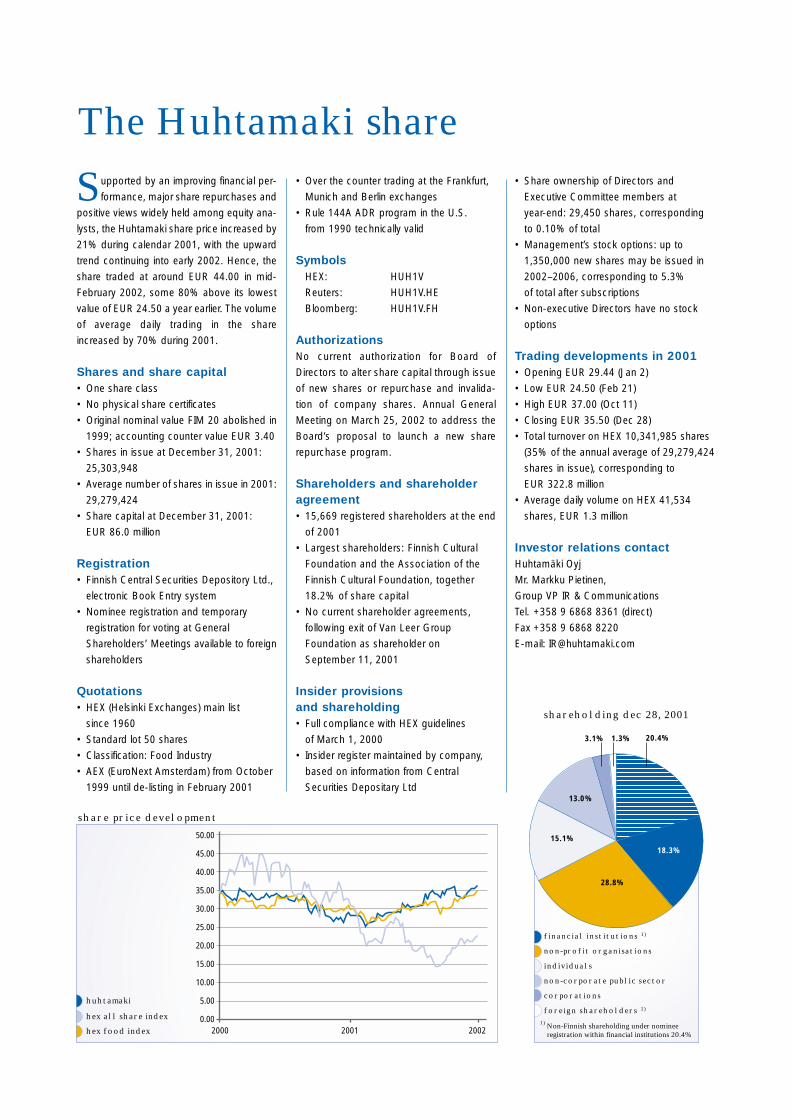
Trading developments in 2001• Opening EUR 29.44 (Jan 2)
• Low EUR 24.50 (Feb 21)
• High EUR 37.00 (Oct 11)
• Closing EUR 35.50 (Dec 28)
• Total turnover on HEX 10,341,985 shares
(35% of the annual average of 29,279,424
shares in issue), corresponding to
EUR 322.8 million
• Average daily volume on HEX 41,534
shares, EUR 1.3 million
Investor relations contactHuhtamäki Oyj
Mr. Markku Pietinen,
Group VP IR & Communications
Tel. +358 9 6868 8361 (direct)
Fax +358 9 6868 8220
E-mail: [email protected]
hex food index
hex all share index
huhtamaki
share price development
2000 2001 2002
50.00
45.00
40.00
35.00
30.00
25.00
20.00
15.00
10.00
5.00
0.00
financial institutions 1)
non-profit organisations
individuals
non-corporate public sector
corporations
foreign shareholders 1)
shareholding dec 28, 2001
1.3%
28.8%
15.1%
13.0 %
3.1%
1) Non-Finnish shareholding under nomineeregistration within financial institutions 20.4%
18.3%
20.4%
S
(HUHTAMAKI)2001 lowest highest turnover
I quarter . . . . . . . . . . . . . . . . . .24.50 . . . . . . . . .29.50 . . . . . .2,065,194II quarter . . . . . . . . . . . . . . . . . .26.10 . . . . . . . . .31.50 . . . . . .2,541,147III quarter . . . . . . . . . . . . . . . . .29.50 . . . . . . . . .35.00 . . . . . .3,449,060IV quarter . . . . . . . . . . . . . . . . .32.37 . . . . . . . . .37.00 . . . . . .2,286,584
(HUHTAMAKI VAN LEER)2000 lowest highest turnover
I quarter . . . . . . . . . . . . . . . . . .31.00 . . . . . . . . .36.50 . . . . . .2,002,397II quarter . . . . . . . . . . . . . . . . . .31.00 . . . . . . . . .35.50 . . . . . .1,382,884III quarter . . . . . . . . . . . . . . . . .28.30 . . . . . . . . .34.00 . . . . . .1,680,453IV quarter . . . . . . . . . . . . . . . . .25.50 . . . . . . . . .32.00 . . . . . . .854,118 (Series I and K were united on Oct 8, 1999)
(HUHTAMAKI) SERIES I SERIES K1999 lowest highest turnover lowest highest turnover
I quarter . . . . . . . . . . . . . . . . . .29.00 . . . . . . . . .36.50 . . . . . .2,897,688 . . . . . . . . . . . . . . 29.00 . . . . . . . . .36.00 . . . . . . . 171,007 II quarter . . . . . . . . . . . . . . . . . .32.00 . . . . . . . . .37.40 . . . . . .2,011,727 . . . . . . . . . . . . . . . .31.01 . . . . . . . . .37.00 . . . . . . . 196,624 III quarter . . . . . . . . . . . . . . . . .29.00 . . . . . . . . .36.75 . . . . . .1,252,541 . . . . . . . . . . . . . . . .29.06 . . . . . . . . .37.00 . . . . . . . 335,300 IV quarter . . . . . . . . . . . . . . . . .27.60 . . . . . . . . .34.45 . . . . . .1,796,551 . . . . . . . . . . . . . . . .28.80 . . . . . . . . .30.00 . . . . . . . . 20,330
1998 I quarter . . . . . . . . . . . . . . . . . .36.66 . . . . . . . . .51.30 . . . . . .1,796,067 . . . . . . . . . . . . . . . .36.16 . . . . . . . . .49.62 . . . . . . .311,421II quarter . . . . . . . . . . . . . . . . . .48.77 . . . . . . . . .58.87 . . . . . .2,317,490 . . . . . . . . . . . . . . . .47.93 . . . . . . . . .56.51 . . . . . . .567,069III quarter . . . . . . . . . . . . . . . . .26.41 . . . . . . . . .52.81 . . . . . .2,102,919 . . . . . . . . . . . . . . . .26.07 . . . . . . . . .51.47 . . . . . . .107,288IV quarter . . . . . . . . . . . . . . . . .24.64 . . . . . . . . .32.63 . . . . . .3,739,409 . . . . . . . . . . . . . . . .24.39 . . . . . . . . .32.63 . . . . . . .255,167
1997 I quarter . . . . . . . . . . . . . . . . . .35.66 . . . . . . . . .42.43 . . . . . .3,128,218 . . . . . . . . . . . . . . . . 35.49 . . . . . . . . .41.71 . . . . . .1,202,205II quarter . . . . . . . . . . . . . . . . . .37.00 . . . . . . . . .41.21 . . . . . .1,837,360 . . . . . . . . . . . . . . . . 36.18 . . . . . . . . .40.03 . . . . . . .384,394III quarter . . . . . . . . . . . . . . . . .33.13 . . . . . . . . .41.88 . . . . . .1,869,069 . . . . . . . . . . . . . . . . 32.80 . . . . . . . . .40.53 . . . . . . .147,735IV quarter . . . . . . . . . . . . . . . . .32.12 . . . . . . . . .39.19 . . . . . .1,534,220 . . . . . . . . . . . . . . . . 31.96 . . . . . . . . .37.51 . . . . . . .272,089
The Huhtamaki share 1918
share price quotations (eur) and turnover (units) at helsinki exchanges
Sharesand votes %
1. The Finnish Cultural Foundation . . . . . . . . . . . . . . . . . . . . . . . . . . .12.92. The Association for the Finnish Cultural Foundation . . . . . . . . . . . . . . .5.33. Society of Swedish Literature in Finland . . . . . . . . . . . . . . . . . . . . . . .4.14. Ilmarinen Mutual Pension Insurance Company . . . . . . . . . . . . . . . . . .3.15. Varma-Sampo Mutual Pension Insurance Company . . . . . . . . . . . . . . .2.66. Suomi Mutual Life Assurance Company . . . . . . . . . . . . . . . . . . . . . . .2.07. Pohjola Non-Life Insurance Company Ltd. . . . . . . . . . . . . . . . . . . . . . .2.08. Suomi Insurance Company . . . . . . . . . . . . . . . . . . . . . . . . . . . . . . . .1.99. Nordea Life Assurance . . . . . . . . . . . . . . . . . . . . . . . . . . . . . . . . . . .1.110. Odin Norden . . . . . . . . . . . . . . . . . . . . . . . . . . . . . . . . . . . . . . . . . .0.811. Tapiola Mutual Insurance Company . . . . . . . . . . . . . . . . . . . . . . . . . .0.812. The State Pensionfund of Finland . . . . . . . . . . . . . . . . . . . . . . . . . . . .0.713. FIM Forte Investment Fund . . . . . . . . . . . . . . . . . . . . . . . . . . . . . . . .0.714. Tapiola Mutual Pension Insurance Company . . . . . . . . . . . . . . . . . . . .0.615. Pensionfund Polaris . . . . . . . . . . . . . . . . . . . . . . . . . . . . . . . . . . . . .0.616. IF Non-Life Insurance Company . . . . . . . . . . . . . . . . . . . . . . . . . . . . .0.617. Nordea Optima Investment Fund . . . . . . . . . . . . . . . . . . . . . . . . . . . .0.518. Kaleva Mutual Insurance Company . . . . . . . . . . . . . . . . . . . . . . . . . . .0.519. Tapiola Mutual Life Assurance Company . . . . . . . . . . . . . . . . . . . . . . .0.520. Aktia Capital . . . . . . . . . . . . . . . . . . . . . . . . . . . . . . . . . . . . . . . . . .0.4
major owners at feb 15, 2002
Company City Analyst
Alfred Berg . . . . . . . . . . . . . . . . . . .Helsinki . . . . . . .Tia Lehto CA Indosuez Cheuvreux Nordic . . . . . .Helsinki . . . . . . .Jan Kaijala Conventum Securities . . . . . . . . . . . .Helsinki . . . . . . .Hannu NymanD. Carnegie AB Finland . . . . . . . . . . .Helsinki . . . . . . .Kia Aejmelaeus Den Danske Bank . . . . . . . . . . . . . . .Helsinki . . . . . . .Ari JärvinenDeutsche Bank . . . . . . . . . . . . . . . . .Helsinki . . . . . . .Tomi RailoEnskilda Securities . . . . . . . . . . . . . .Helsinki . . . . . . .Tommy Ilmoni Evli Securities Plc . . . . . . . . . . . . . . .Helsinki . . . . . . .Antti SeppänenFIM Securities . . . . . . . . . . . . . . . . .Helsinki . . . . . . .Mikko LinnanvuoriImpivaara Securities . . . . . . . . . . . . .London . . . . . . . .Jeffrey RobertsMandatum Stockbrokers Ltd . . . . . . .Helsinki . . . . . . .Ari Laakso Merrill Lynch . . . . . . . . . . . . . . . . . .London . . . . . . . .Mads AspremMorgan Stanley Dean Witter . . . . . . . .London . . . . . . . .Andreas Mavrikakis Nordea Securities . . . . . . . . . . . . . . .Helsinki . . . . . . .Ville Kivelä Opstock Securities . . . . . . . . . . . . . .Helsinki . . . . . . .Sanna PäiväniemiSchroder Salomon Smith Barney . . . .New York . . . . . .George L. Staphos
stock analysis
The following institutions published reports on Huhtamaki during 2001.An updated list appears on the company’s website, www.huhtamaki.com

Corporate governance 2120
Corporate governanceHuhtamäki Oyj is incorporated in Finland, and the stipulations in its Articles of Association havebeen derived from the Finnish Companies Act. As a publicly listed company with an internationalshareholder base, Huhtamaki has in recent years revised its governance system in order to align withwidely accepted principles and recommendations. Hence, the company has unified its shares into oneclass and abolished a two-tier decision-making structure with an external Supervisory Board and aninternal Board of Directors.
he most recent change in governance
was adopted by an Extraordinary
General Shareholders’ Meeting in October
2001. The company’s current Articles of
Association contain no privileges to the main
shareholders, and the requirement of a
qualified majority of 3/4 of votes for amending
certain items in the Articles was lifted.
The company is governed by Board of
Directors consisting of 6 to 9 predominantly
non-executive members. The Board is
annually elected for a one-year term by the
Annual General Shareholders’ Meeting
(AGM), based on a proposal from the
Board's Nomination Committee. At the
AGM, shareholders may propose and elect
other candidates. The Board elects its
Chairman and Vice-Chairman from among
its members.
The Board is vested with the powers specified
in Finnish Companies Act and the company’s
Articles of Association. It sets the company’s
financial and strategic objectives and decides
on main policies, strategic and business plans,
significant acquisitions and divestments as
well as capital expenditure projects exceeding
EUR 25 million. The Board also appoints the
Chief Executive Officer (CEO) and other
Executive Committee (EC) members, decides
on executive compensation, allocates stock
options to management and annually reviews
the management performance. The Board
meets at least six times per year, with one
meeting entirely dedicated to corporate
strategy. In 2001, the Board met 8 times.
In 2001, the Board had three committees.
Nomination Committee, Remuneration
Committee and Audit Committee. Due to the
Board’s compactness and availability via
electronic conferencing channels between
scheduled meetings, only the Nomination
Committee will continue in 2002.
The company’s day-to-day operation is the
responsibility of the CEO, who is also
Chairman of the EC. The EC convenes at
least once a month and additionally on
specific topics such as strategy and annual
business plans.
Each EC member has a clear operative
responsibility, either for a geographical region
(Europe, Americas, Asia–Oceania–Africa),
or a key function (Finance, Technology,
Marketing). The EC members are the CEO’s
direct reports; additionally, the CEO
supervises the Human Resources function.
Individual responsibilities appear in the
biographical section of this report.
The company’s internal operating principles
and procedures are documented in policies
and guidelines subject to review by the EC
from time to time. These govern such areas
as reporting, finance and treasury, capital
expenditure, insurance, intellectual property,
sales and supply contracts, information
systems, sourcing, human resources, health
and safety and the environment, insider
regulations and communications.
It is to be noted, however, that local laws and
conditions require flexibility, and that
company-wide information systems and
network tools increasingly replace written
procedures. A major emphasis is placed on
the recruitment, training and career
progression of management and specialist
resources.
Remuneration and benefitsThe AGM held on April 12, 2000, maintained
the remuneration of the Board of Directors
as follows: Chairman EUR 75,685, Vice-
Chairman EUR 43,730 and other members
EUR 33,638 annually. The CEO does not
receive remuneration for his Board
membership.
The remuneration of senior management
consists of a base salary, benefits such as
routine health care and company car, an
annual bonus linked to corporate and
personal objectives (short-term incentive;
typically up to 30% of base salary depending
on level of responsibility), as well as stock
options issued from time to time (long-term
incentive). The compensation and benefits
for line managers follows local law and
practice, based on an internationally
recognized job grading system and an
annual review of individual performance.
Performance-related bonus schemes are
widespread.
The EC members are entitled to retirement
upon reaching sixty years of age. They, as
well as certain other senior executives, have
been provided with a general directors’ and
officers’ liability insurance policy, and a
severance pay exceeding the legal minimum
in their respective countries of operation.
In 2001, the CEO’s total compensation
amounted to EUR 594,898.
The Executive Committee members have an
aggregate of 229,000 stock options under
schemes adopted in 1997 and 2000. In
2001, a total of 70,000 new stock options
were allocated to them. Their individual
positions and shareholding in the company
appear in the biographical section.
Stock option schemes extend to some 120
executives and managers across the
company and its subsidiaries. A total of
1,350,000 new shares (corresponding to
5.3% of the shares outstanding) may be
issued in 2002–2006 assuming full use of the
stock options schemes of 1997 and 2000.
T

Human resources 2322
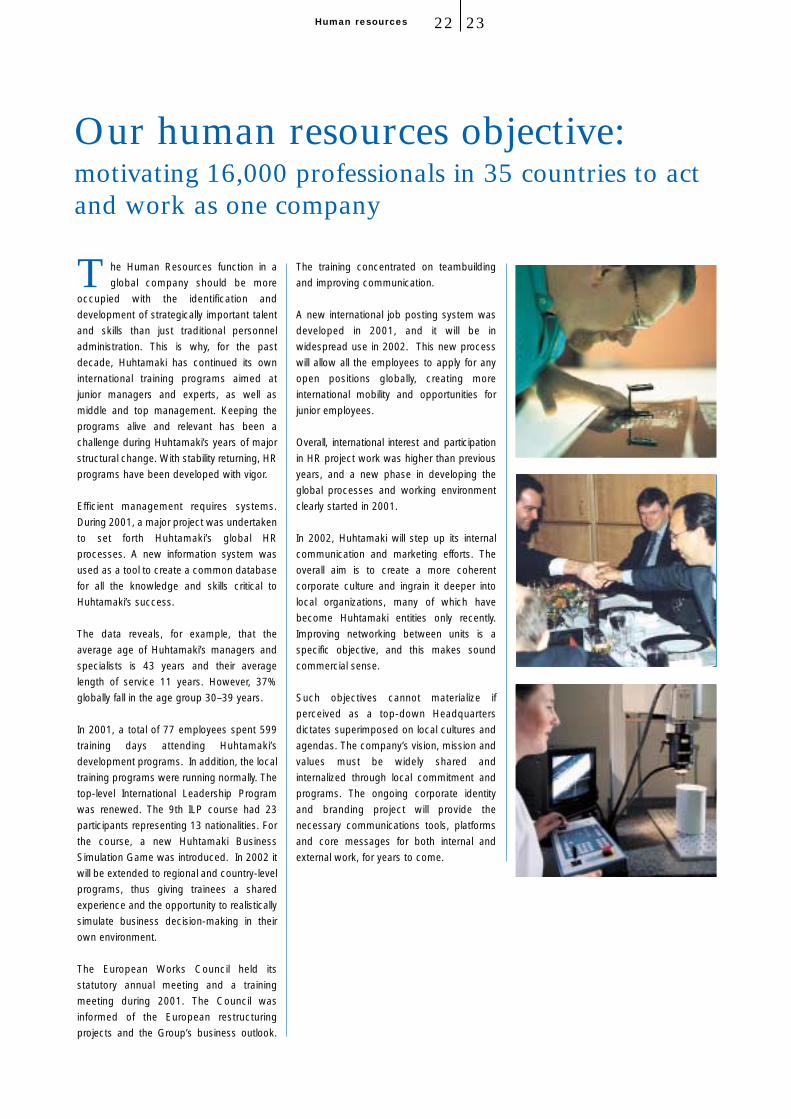
Our human resources objective: motivating 16,000 professionals in 35 countries to actand work as one company
he Human Resources function in a
global company should be more
occupied with the identification and
development of strategically important talent
and skills than just traditional personnel
administration. This is why, for the past
decade, Huhtamaki has continued its own
international training programs aimed at
junior managers and experts, as well as
middle and top management. Keeping the
programs alive and relevant has been a
challenge during Huhtamaki’s years of major
structural change. With stability returning, HR
programs have been developed with vigor.
Efficient management requires systems.
During 2001, a major project was undertaken
to set forth Huhtamaki’s global HR
processes. A new information system was
used as a tool to create a common database
for all the knowledge and skills critical to
Huhtamaki’s success.
The data reveals, for example, that the
average age of Huhtamaki’s managers and
specialists is 43 years and their average
length of service 11 years. However, 37%
globally fall in the age group 30–39 years.
In 2001, a total of 77 employees spent 599
training days attending Huhtamaki’s
development programs. In addition, the local
training programs were running normally. The
top-level International Leadership Program
was renewed. The 9th ILP course had 23
participants representing 13 nationalities. For
the course, a new Huhtamaki Business
Simulation Game was introduced. In 2002 it
will be extended to regional and country-level
programs, thus giving trainees a shared
experience and the opportunity to realistically
simulate business decision-making in their
own environment.
The European Works Council held its
statutory annual meeting and a training
meeting during 2001. The Council was
informed of the European restructuring
projects and the Group’s business outlook.
The training concentrated on teambuilding
and improving communication.
A new international job posting system was
developed in 2001, and it will be in
widespread use in 2002. This new process
will allow all the employees to apply for any
open positions globally, creating more
international mobility and opportunities for
junior employees.
Overall, international interest and participation
in HR project work was higher than previous
years, and a new phase in developing the
global processes and working environment
clearly started in 2001.
In 2002, Huhtamaki will step up its internal
communication and marketing efforts. The
overall aim is to create a more coherent
corporate culture and ingrain it deeper into
local organizations, many of which have
become Huhtamaki entities only recently.
Improving networking between units is a
specific objective, and this makes sound
commercial sense.
Such objectives cannot materialize if
perceived as a top-down Headquarters
dictates superimposed on local cultures and
agendas. The company’s vision, mission and
values must be widely shared and
internalized through local commitment and
programs. The ongoing corporate identity
and branding project will provide the
necessary communications tools, platforms
and core messages for both internal and
external work, for years to come.
T


Caring for the environment 2524
Caring for the environment
Environmental policy
As a leading global provider of high-
performing consumer packaging products
and services, Huhtamaki recognizes its
responsibility to contribute to sustainable
development. The Group will continue to
integrate standards for Quality, Hygiene,
Safety, Health and Environment into its day-
to-day business as an essential element of
management.
As a matter of course, we will conduct our
business in compliance with all applicable
laws and regulations, and in accordance
with our ethical and societal responsibilities;
We will continuously improve our management,
total quality and environmental performance;
We will ensure that our packaging products,
while meeting customers’ requirements for
functional properties and the highest
standards for hygiene and safety, are
developed and designed to achieve
prevention at source, the use of renewable
or recycled materials, and the recyclability of
the packaging product itself;
We manufacture our products with the aim
to minimise natural resource depletion, to
optimize process efficiency, to apply the
best available techniques and practices,
and to reduce solid waste generation,
effluent discharges and emissions to air;
We will educate, train and motivate all
employees to instil a keen sense of environ-
mental responsibility and accountability;
We will engage our suppliers to comply with
our stringent standards of quality, safety,
hygiene and environmental excellence;
As an industry leader, we are eager to co-
operate with public, governmental and
industrial organisations, both at national and
international level, to develop effective and
balanced environmental standards and
modes of operation;
We will transpose this policy into a long-
term environmental program, requiring
detailed annual action plans and progress
reports from our operating units;
We will communicate our environmental
record to our stakeholders using widely
accepted concepts and measurements.
Huhtamaki recognizes its corporate responsibility to contribute to sustainable development.Environmental considerations form an integral part of our day-to-day management. Our commitment is spelled out in the Group environmental policy, originally developed on the cornerstones of the International Chamber of Commerce (ICC), Business Charter for SustainableDevelopment, and recently revised to take account of the company’s transformation into a consumer packaging company.
highlights of 2001
Global activities• Globally 42 Huhtamaki manufacturing unitsare implementing certified systems either inquality, environmental, health and safety orhygiene management
• Group environmental action plan for 2002was drafted and approved by the ExecutiveCommittee
• Decision to start monitoring of environmentalkey performance indicators (eKPI) forming thebasis for the environmental reporting ofHuhtamaki Group
Europe• Implemented the Garbage Gang recyclingsystem at the world orienteering champion-ships, Tampere, Finland. This sports eventwas regarded as the “world’s environmentallyfriendliest sporting event.”
• The innovative closed loop recycling systempilot test was implemented together with
McDonalds Finland. Up to 95% of therestaurant kitchen waste and used packagingwaste was recycled.
Americas• Environmental Care Program was launchedas an internal environmental managementsystem ensuring improved environmentalperformance and reporting of environmentalinformation
• Began development of a crisis managementplan for mission-critical processes. Whencompleted, the plan will outline a contingencyfor each core process vital to the successfuloperation of the Americas’ business.
• Six plants received the superior rating inhealth and safety management according tothe implemented standard
Australia and New Zealand• Huhtamaki Australia became a signatory ofthe National Packaging Covenant and hassubmitted its first year’s action plan
• Plastics recycling pilots in Australia havecommenced involving several levels of thesupply chain
• Huhtamaki New Zealand, Hendersonplant, has been awarded a HACCPcertification, achieving a high level ofcompliance with key customers, as well asmeeting the national CODEX and the WorldHealth Organisation standards
• In New Zealand, signed the national wasteminimization strategy aimed at minimizing theamount of waste ending in landfills
Asia and Africa• Thane plant in India received the first prizein the Best Safety Performance in LargeScale Industry category
Administration and auditors
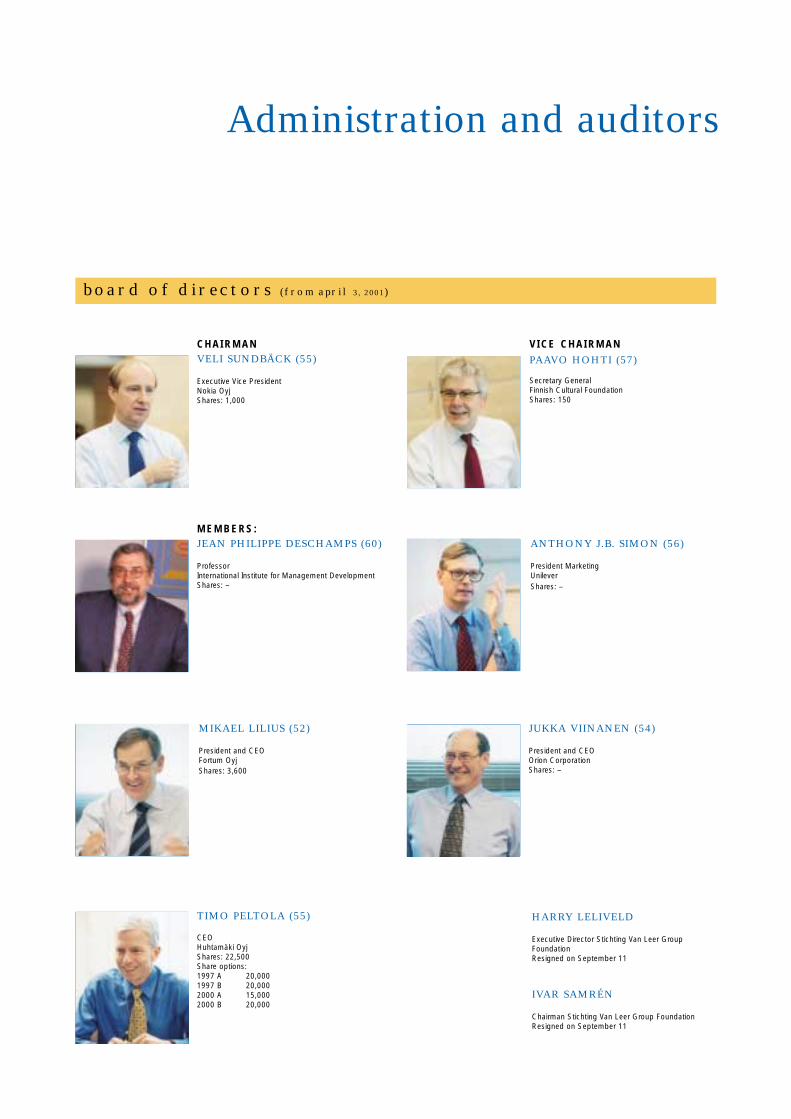
board of directors (from april 3, 2001)
C H A I R M A NVELI SUNDBÄCK (55)
Executive Vice PresidentNokia OyjShares: 1,000
V I C E C H A I R M A N
PAAVO HOHTI (57)
Secretary General Finnish Cultural FoundationShares: 150
M E M B E R S :JEAN PHILIPPE DESCHAMPS (60)
ProfessorInternational Institute for Management DevelopmentShares: –
TIMO PELTOLA (55)
CEOHuhtamäki OyjShares: 22,500Share options:1997 A 20,0001997 B 20,0002000 A 15,0002000 B 20,000
MIKAEL LILIUS (52)
President and CEO Fortum OyjShares: 3,600
ANTHONY J.B. SIMON (56)
President MarketingUnileverShares: –
HARRY LELIVELD
Executive Director Stichting Van Leer GroupFoundationResigned on September 11
IVAR SAMRÉN
Chairman Stichting Van Leer Group FoundationResigned on September 11
JUKKA VIINANEN (54)
President and CEOOrion CorporationShares: –

Administration and auditors 2726
C H A I R M A NTIMO PELTOLA (55)
Dr. Econ.h.c.B.Sc. (Econ) Turku School of EconomicsCEO since 1989Joined the company in 1971Positions of trust: Board Member of Nordea Plc., AvestaPolarit Oyj and Instrumentarium Corp.Chairman of the Supervisory Board of Ilmarinen Mutual Pension Insurance CompanyMember of the Supervisory Boards of the Finnish Cultural Foundation and the Finnish Fair Corporation
M E M B E R S :TONY COMBE (40)
Executive VP Asia–Oceania–Africa since 2000B.Bus. (Marketing) University of South AustraliaJoined the company in 1986Positions of trust: Board Member of Packaging Council of Australia (PCA)Shares: –Share options:1997 A 6,0001997 B 6,0002000 A 8,0002000 B 10,000
TIMO SALONEN (43)
Chief Financial Officer since 1998• Finance• Administration• Legal• Investor Relations• Information SystemsB.Sc. (Econ) Turku School of EconomicsLL.M. University of TurkuJoined the company in 1991Positions of trust: Board Member of Pohjola Group plcShares: 1,500Share options:1997 A 7,5001997 B 7,5002000 A 8,0002000 B 10,000
MATTI TIKKAKOSKI (48)
Chief Technology Officer since 2002• Global manufacturing strategy• R&D• Quality, Health, EnvironmentB.Sc. (Econ.) Helsinki School of EconomicsJoined the company in 1980Shares: 1,700Share options:1997 B 10,0002000 A 8,0002000 B 10,000
H.R. (HENK) KOEKOEK (55)
Executive Vice President, Europe since 2002M.Sc. (Eng) Technical University DelftJoined the company in 1973Shares: 3,400Share options:1997 A –1997 B –2000 A 8,0002000 B 10,000
MARK STATON (42)
Executive VP Americas since 2000BA in Business Studies (hons) University of West EnglandJoined the company in 1989Shares: –Share options:1997 A 7,5001997 B 7,5002000 A 8,0002000 B 10,000
kalle tanhuanpää (49)
Chief Marketing Officer since 2002• Marketing• Category and branding strategies• Corporate and Marketing CommunicationsB.Sc. (Econ) Turku School of EconomicsJoined the company in 1976Positions of trust: Board Member of HK Ruokatalo Oyj,The Association of Finnish AdvertisersShares: 1,500Share options:1997 A 6,0001997 B 6,0002000 A –2000 B –
executive committee
auditors
• ESA KAILIALA, APA
• PEKKA PAJAMO, APA
Key addresses
Corporate
Huhtamäki Oyj
Länsituulentie 7
FIN–02100 Espoo
FINLAND
Tel: +358 (0) 9 686 881
Fax: +358 (0) 9 660 622
Huhtamaki Finance B.V.
Jupiterstraat 102
2132 HE Hoofddorp
THE NETHERLANDS
Tel: +31 (0) 23 567 998 8
Fax: +31 (0) 23 567 998 9
Category management
Food Service, Fresh Foods
Huhtamäki Oyj
Länsituulentie 7
FIN–02100 Espoo
FINLAND
Tel: +358 (0) 9 686 881
Fax: +358 (0) 9 660 622
Consumer Goods
Huhtamaki Ronsberg GmbH
Heinrich Nicolaus Strasse 6
D–87671 Ronsberg Allgau
GERMANY
Tel: +49 (0) 830 6 770
Fax: +49 (0) 830 6 772 26
Europe
North Europe
Huhtamäki Oyj Finland
Polarpakintie
FIN–13300 Hämeenlinna
FINLAND
Tel: +358 (0) 3 658 21
Fax: +358 (0) 3 619 754 4
Central Europe
Huhtamaki Ronsberg GmbH
Heinrich Nicolaus Strasse 6
D–87671 Ronsberg Allgau
GERMANY
Tel: +49 (0) 830 6 770
Fax: +49 (0) 830 6 772 26
South Europe
Huhtamaki France S.A.
Route de Roinville
28702 Auneau Cedex
FRANCE
Tel. +33 (0) 237 917 700
Fax +33 (0) 237 318 003Contact details for each country and unit appear
in the Corporate Directory on www.huhtamaki.com

Key addresses 2928
UK, Ireland
Huhtamaki (UK) Ltd.
Rowner Road
PO13 OPR Gosport, Hampshire
UNITED KINGDOM
Tel: +44 (0) 23 925 122 00
Fax: +44 (0) 23 925 123 52
North America
Huhtamaki Americas
9201 Packaging Drive
DeSoto, Kansas 66018
UNITED STATES (USA)
Tel: +1 (0) 913 583 302 5
Fax: +1 (0) 913 583 875 6
Latin America
Huhtamaki do Brazil Ltda.
Rua Brasholanda, 01
Curitiba 83322–070 Pinhais–PR
BRAZIL
Tel: +55 (0) 41 661 100 0
Fax: +55 (0) 41 661 117 0
Asia–Oceania–Africa
Huhtamaki Australia Limited
406 Marion Street
2200 Bankstown, N.S.W.
AUSTRALIA
Tel: +61 (0) 2 970 874 00
Fax: +61 (0) 2 979 103 96
The Paper Products Ltd.
Lbs Marg, Majiwade
Thane West, Maharashtra 400601
INDIA
Tel: +91 (0) 22 542 705 1
Fax: +91 (0) 22 534 059 9
Huhtamaki South Africa (Pty) Ltd.
Industry Road, New Era
Springs 1560
SOUTH AFRICA
Tel: +27 (0) 11 813 120 0
Fax: +27 (0) 11 813 243 8

February 13Results 2000
March 2Divestment of Van Leer Industrial to Greif Bros. completed
April 3AGM decisions
May 11First quarter on track
July 5Italian molded fiber unit sold
July 19U.S. fruit packaging unit divested
August 7A strong second quarter
August 21Share buyback program expected to continue
August 30Huhtamaki streamlines manufacturing in the U.S.
September 12Huhtamaki acquires Van Leer Group Foundation’s shareholding through Dutch subsidiary
September 17Extraordinary Shareholders’ Meeting to be held on October 10, 2001
September 18Kalle Tanhuanpää appointed to Executive Committee as Chief Marketing Officer
October 10 EGM approves lowering of share capital
October 17New share capital and amendments to Articles of Association registered
November 6Earnings improvement and strong cash flow continued in third quarter
November 6 Role switch in Executive Committee
November 30Turkish consumer flexibles operation sold
News headlines in 2001

www.huhtamaki.com

Länsituulentie 7, FIN–02100 Espoo, FinlandTel. +358 9 686 881, Fax +358 9 660 622
Business Identity Code: 0140879–6
www.huhtamaki.com
a n n u a l a c c o u n t s 2 0 0 1


Contents 32
Announcements . . . . . . . . . . . . . . . . . . . . . . . . . . . . . . . . . . . . . . . . . . . . .4
Financial targets . . . . . . . . . . . . . . . . . . . . . . . . . . . . . . . . . . . . . . . . . . . . .4
Annual accounts
Director’s report . . . . . . . . . . . . . . . . . . . . . . . . . . . . . . . . . . . . . . . . .5
Group income statement . . . . . . . . . . . . . . . . . . . . . . . . . . . . . . . . . . .9
Group balance sheet . . . . . . . . . . . . . . . . . . . . . . . . . . . . . . . . . . . . .10
Group cash flow statement . . . . . . . . . . . . . . . . . . . . . . . . . . . . . . . .12
Parent company income statement . . . . . . . . . . . . . . . . . . . . . . . . . . .13
Parent company balance sheet . . . . . . . . . . . . . . . . . . . . . . . . . . . . . .14
Parent company cash flow statement . . . . . . . . . . . . . . . . . . . . . . . . .16
Accounting principles . . . . . . . . . . . . . . . . . . . . . . . . . . . . . . . . . . . .17
Notes to the financial accounts . . . . . . . . . . . . . . . . . . . . . . . . . . . . .19
Board’s proposal . . . . . . . . . . . . . . . . . . . . . . . . . . . . . . . . . . . . . . . .31
Auditor’s report . . . . . . . . . . . . . . . . . . . . . . . . . . . . . . . . . . . . . . . . . . . . .31
Huhtamaki 1997–2001 . . . . . . . . . . . . . . . . . . . . . . . . . . . . . . . . . . . . . . .32
Per share data . . . . . . . . . . . . . . . . . . . . . . . . . . . . . . . . . . . . . . . . . . . . . .32
Comparison against 2000 pro forma . . . . . . . . . . . . . . . . . . . . . . . . . . .33
Definitions for key indicators . . . . . . . . . . . . . . . . . . . . . . . . . . . . . . . . .34
Contents

AnnouncementsAnnual general meeting
The Annual General Shareholders’
Meeting (AGM) of Huhtamäki Oyj will
be held on Monday, March 25, 2002
at 3:00 p.m. in Finlandia Hall,
Mannerheimintie 13 e, Helsinki. The
proceedings will be conducted in
Finnish. Simultaneous translation into
English will be provided.
The main items on the AGM agenda are:
• Statutory business as expressed in
Article 8 of Articles of Association
• Establishing a new program to
repurchase up to 5% of the
company’s own shares during one
year following the AGM
Shareholders registered by the Finnish
Central Securities Depository Ltd. on
March 15, 2002, may exercise their
rights at the AGM. Beneficiary holders
of nominee shares are welcome to
attend and vote, provided they have
obtained a temporary registration by
March 15. In each case, participation
should be notified to the company no
later than March 21 by 4.00 p.m.
Finnish time, either by telephone
(+358 800 90026, “Huhtamaki AGM
Services”), in writing (Huhtamäki Oyj,
Länsituulentie 7, FIN–02100 Espoo,
Finland), or via e-mail:
Shareholders wishing to authorize
another person to represent them at
the AGM are requested to mail the proxy
to the above address by March 21.
All documents and proposals under
review at the AGM will be available for
public viewing from February 25 at
Group Headquarters, Länsituulentie 7,
02100 Espoo, Finland. Copies of the
documents will be mailed to
shareholders upon request. For
further information contact Investor
Relations, +358 9 6868 8361.
Dividend
The Board of Directors proposes to
the AGM a dividend of EUR 1.25 per
share for 2001. Dividend will be paid
on April 9 to shareholders as
registered on April 2.
Financial calendar
Huhtamaki will release the following
financial information for 2002 in
Finnish and English:
2002:
• April 25–1st Quarter Interim Report
• July 25–2nd Quarter Interim Report
• October 24–3rd Quarter Interim
Report
2003:
• February – Full-year Results
• Week 11–Annual Report
As a rule, interim results will be
released at or about 9.00 a.m. Finnish
time. All financial releases may be
retrieved instantly from the company’s
website, www.huhtamaki.com
On-line electronic services have
become the main channel of financial
information. Huhtamaki does not
automatically mail its Annual and
Interim Reports to registered
shareholders. Interested parties
wishing to receive mailed reports are
kindly requested to contact Investor
Relations, tel. +358 9 6868 8363, or
via e-mail: [email protected]
The Board of Directors of Huhtamäki Oyj
has endorsed the following financial
targets by 2003:
• Annual organic growth at least 5%
• Operating margin (before amortization)
at least 10%
• Return on investment (before
amortization) 15%
• Strong cash flow
• Long term gearing ratio around 100%
• Average payout ratio 40%
financial targets

Directors’ report 54
Overview In 2001, Huhtamaki successfullypursued the business strategies andfinancial objectives set during the past two years. The company’stransformation into a pure consumerpackaging specialist was finalized atthe end of February, on thecompletion of the divestment of theVan Leer industrial packaging division.During the year, several small, non-core operations were also sold.Acquisition opportunities were notpursued.
Numerous processes were inmotion to streamline manufacturing,and to redirect capacity to highervalue added businesses. Fivefactories were closed. The netreduction of workforce in continuingoperations was 800 persons.
The year did not provide an idealsetting for business. Three distinctfactors affected Huhtamaki’s markets:a slowdown in the world economy,food safety issues in Europe, and theaftermath of the September 11terrorist attacks. While none of thesehad a deep or lasting influence,together they depressed volumegrowth to some extent. Compared toyear 2000, the main positive featurewas the overall stability of the rawmaterials market, and the softening ofkey polymer prices.
Against this backdrop, Huhtamaki’ssales and earnings development wasmore than satisfactory. While net salesincreased by 5% over thecorresponding pro forma figure for2000, operating profit (earningsbefore interest, tax and amortization)advanced by 20%. The profitimprovement was particularly clear inthe final quarter, when operating profitwas up by 27% on the back of a salesgrowth of 2%.
The favorable development is attributable to three factors: 1) reduction of fixed costs, resultingfrom synergies and rationalization; 2) incremental sales at healthymargins; and 3) higher value addedfrom an improving product mix andlower raw materials costs.
The repurchase of almost 20% ofthe company’s own shares optimized
the Group’s capital structure, andcontributed to the 30% improvementof earnings per share beforeamortization during the final quarter.The corresponding full-year results,EUR 4.45 before and EUR 2.97 afteramortization, are both 17% above thecorresponding pro forma figures for2000, setting a new company record.
The Board carried out its annualstrategy review in September butfound no reason to deviate fromearlier directions. Hence, the mainemphasis in 2002 remains onoptimizing the existing companystructure, accelerating sales growthand improving profitability further.
Dividend ProposalThe Board proposes a dividend ofEUR 1.25 per share, 14% more thanfor 2000 and representing a payoutratio of 42%.
Integration, Synergies and RestructuringIn terms of organization, the integrationof Huhtamaki and the Dutch company
Van Leer, acquired in 1999, was largelyaccomplished in 2000. In 2001, furtherwork concentrated on improvingefficiencies through streamlining themanufacturing structure and processes.Rationalization projects to this effectadvanced well, but further measuresremain to be implemented in 2002.
The U.S. rigid plastics and flexiblepackaging businesses acquiredtowards the end of 2000 weresuccessfully integrated during 2001.The costs of all major integration andrationalization projects have beencovered from provisions made in late1999 after the Van Leer transaction,and in March 2001 as part of thebalance sheet adustments followingthe sale of the industrial packagingdivision. At year-end, unusedintegration provisions amounted toEUR 35 million.
The following table summarizesrestructuring accomplished during2001:
Directors’ report
country/unit action
NetherlandsGroenlo paper pkg plant . . . . . . . . . . . . . . . .Closed, production transfered
to Göttingen (Germany)
FranceGuegon plastic pkg plant . . . . . . . . . . . . . . . .Closing completed
Auneau thermoforming . . . . . . . . . . . . . . . . .Transfer to Alf (Germany) completed
Auneau mono sheet business . . . . . . . . . . . .Swap to multi sheet ongoing
Dourdan focus on injection molding . . . . . . . .Downsizing ongoing
USAMt Carmel (PA) plastics pkg plant . . . . . . . . . .Closure completed
Los Angeles (CA) paper pkg plant . . . . . . . . . .Downsizing completed
East Providence (RI) . . . . . . . . . . . . . . . . . . .Paper cup mfg relocation to
Fulton (NY) completed
Plastic pkg relocation started,
closure in 2002
Waterville (MN) . . . . . . . . . . . . . . . . . . . . . . .Downsizing completed
Foodservice Headquarters . . . . . . . . . . . . . . .Relocated to Chicago (IL)
New ZealandConsumer Flexibles . . . . . . . . . . . . . . . . . . . .Three plants concentrated to New Lynn
The net reduction of workforce (in full-time equivalents) was 320 in Europe, 230 in theAmericas and 250 in Asia–Oceania–Africa.

Healthy BusinessDevelopmentsThe industrial packaging division wasnot consolidated during 2001.Thefollowing analysis is based on a proforma treatment of the year 2000, inwhich the sales, profits, depreciation,goodwill amortization and financialexpenses related to industrialpackaging have been eliminated.“Actual” refers to statutory accountsin 2000, which include the industrialpackaging operations.
The Group’s consolidated netsales in 2001 amounted to EUR 2,382million, 5% above the correspondingpro forma figure in 2000 but 28%below the actual 2000 sales.Structural changes boosted sales by2%, price changes and currencytranslations also by 2% and volumegrowth by 1%.
Geographically, the sales brokedown as follows: Europe 49%,Americas 35%, and Asia, Oceaniaand Africa 16%. Finland’s share of thetotal was 3%.
European sales amounted to EUR1,179 million. Sales of core packagingproducts were robust; the 2% decline intotal sales reflects the retreat fromunprofitable product lines, thedivestment of two business units in thesecond half of the year, and the lowvalue of waste paper trading. Theunderlying market development wasrelatively stronger in North and CentralEurope. Operating profit from Europeimproved by 27% to EUR 93 million,with the final-quarter figure up by 55%.The operating margin in Europeimproved from 6.1% in 2000 to 7.9%,and RONA (return on net assets) from11.4% to 14.7%.
Sales in the Americas advancedby 32% to EUR 826 million, mainlyreflecting acquisitions in late 2000.The North American sales werebuoyant most of the time. Operatingprofit from the Americas increased by38% to EUR 75 million, with thecorresponding margin advancing from8.6% to 9.0%. RONA also improvedslightly, to 15.8%.
Sales in the rest of the worldamounted to EUR 377 million, withgains in Asia, Africa and Oceaniatempered by by currency translationsinto euros. The comparison figure from2000, EUR 451 million, includes
divested operations. The region’soperating profit was EUR 30 million,which corresponds to 8.1% of netsales (7.0% in 2000). The region’sRONA also advanced from 10.1% to11.8%.
The sales of the Consumer Goodscategory amounted to EUR 1,296million, 54% of the total and up by 1%.The figure includes the Films business,as well as machine trade and othersupporting operations. Sales growthaccelerated towards year-end and was4% in the final quarter.
Good growth in several segments,including soups, confectionery andpersonal care, offset the stagnant salesof dairy and edible fats packaging,which partly reflected voluntary retreatfrom unprofitable product areas. Newtake-home ice cream containers werewell received in the U.S. and Oceania.As a whole, flexible packagingdeveloped well, and significant volumegrowth was secured for the mostimportant products, sterilizable stand-up pouches and toothpaste tubelaminate, in 2002 and beyond.
The Consumer Goods category’soperating profit contribution improvedby 17% to EUR 93 million or 7.2% netsales. The improvement in the finalquarter was a remarkable 78%.
Food Service sales, includingFresh Foods packaging, amounted toEUR 1,087 million, up by 9%. Amongthe positive contributors were thecontinued good progress in Europeanquick service markets, the new plasticpackaging operations in the U.S.,healthy progress for molded fiberproducts especially in Europe, as wellas an excellent year for the U.S.Chinet® retail products.
European cattle diseases affectedfood service and fresh foodspackaging early in the year, mainly inthe U.K. and South Europe. TheSeptember 11 terrorist attack causeda short-lived stall in sales around theworld; the U.S. food service marketsremained hesitant towards year-end.Hence, the final quarter’s salesremained virtually flat against theprevious year.
The Food Service category’soperating profit amounted to EUR105 million, up by 32% and 9.7% ofnet sales. Despite a slowdown in sales, the operating margin
in the fourth quarter improved by 2 percentage points to 10.7%.
Profit Improvement On TrackThe improvement of the Group’sfinancial performance gainedmomentum towards year-end.Healthy margins development,declining working capital levels andlower than anticipated interestexpenses all contributed to a strongfree cash flow.
The operating profit fromoperations totaled EUR 199 million,showing an improvement of 25% over2000 pro forma. Group royaltyincome and unallocated expensesshowed a net income of EUR 23million, 7% less than in 2000. Hence,the Group operating profit improvedby 20% to EUR 222 million or 9.3% ofnet sales. After an amortizationcharge of EUR 45 million for goodwilland other intangible assets, thecorresponding operating profit afteramortization (EBIT) amounted to EUR178 million, up by 23%. For reference,the full-year depreciation of tangibleassets was EUR 111 million.
Net financial expenses amountedto EUR 49 million, 78% above 2000pro forma but 21% less than theactual figure. The increase against proforma reflects U.S. acquisitions in late2000, as well as capital tied in sharerepurchases. The profit beforeminority interest and taxes amountedto EUR 130 million, 11% above 2000pro forma. Taxes increased by 16% toEUR 37 million and minority interestamounted to EUR 7 million, wherebynet income increased by 9% to EUR87 million.
Share repurchases caused theaverage number of shares in issue todecline from 31,475,963 in 2000 to29,279,424. This contributed to the17% growth in earnings per share, toEUR 4.45 (before amortization) andEUR 2.97 (after amortization).
Higher profits and a tighter balancesheet led to a clear improvement inreturn on equity (ROE), to 12.6%, andreturn on investment (ROI), to 11.8%.Both figures are before amortization.
Strong Cash Flow; BalanceSheet Structure On TargetThe structure of Huhtamaki’s balancesheet has been subject to sharp

Directors’ report 76
changes in recent years, reflecting thetiming of major corporate transactions.The company’s stated objective is anet debt to equity (gearing) ratioaround one. This target zone wasreached in October, following thedivestment of the industrial packagingoperations earlier in the year and therepurchase and invalidation of almost20% of the company shares in issue.The share buybacks absorbed a totalof EUR 207 million. This amount waswritten off from equity. The total freecash flow (cash from operations minuscapital expenditure, interest and tax)for the year amounted to EUR 151million.
At year-end, net debt amountedto EUR 901 million and gearing to94%. Equity per share was EUR34.56, up by 5%.
Capital Expenditure,Research and DevelopmentThe Group’s total capital expenditureamounted to EUR 144 million, 13%more than in 2000 pro forma. Asignificant part of this was related torationalization and restructuring. Otherprojects included the construction anew logistics center in Germany, andnew printing capacity in severallocations. The reconstruction of thePolish Siemianowice plant, which wasdestroyed by fire in late 2000,advanced on plan.
Reported expenditure on researchand development amounted to EUR 13million, substantially more than in 2000.The new Technology and DevelopmentCenters in Finland, Germany and theNetherlands became operational. AnInnovation Board established at thestart of the year endorsed severalprojects of Group-level interest; localinnovation and development workcontinued as before.
Important product launchesincluded superior-quality cups for hotbeverages, several molded fiberitems aimed at food serviceoperators, new shapes and featuresin take-home ice containers, and awhole range of fresh foodspackaging, including absorbentproduce trays with proprietary open-cell technology.
The first environmentally friendlyEarthShell® food service packagingline in Göttingen, Germany, was
nearing completion at year-end. Trialruns are expected to commenceduring the first quarter of 2002.
Annual General MeetingThe Annual General Meetingconvened on April 3, approving thecompany’s accounts and the Board’sdividend proposal, EUR 1.10 pershare. The meeting also changed thecompany’s name back to HuhtamäkiOyj, authorized the Board of Directorsto launch a share repurchase programcovering up to 5% of the companyshares in issue within a year, andamended the pricing mechanism forB and C options in the company’sOption Rights 2000 program.
The Board of Directors was re-elected with the exception of MrHeikki Marttinen, who was no longeravailable. The Finnish CulturalFoundation nominated CEO TimoPeltola as his successor. Thus, theBoard consisted of the followingpersons: Veli Sundbäck (Chairman),Paavo Hohti (Vice Chairman), IvarSamrén (Vice Chairman), JeanPhilippe Deschamps, Harry Leliveld,Mikael Lilius, Timo Peltola, AnthonyJ.B. Simon and Jukka Viinanen.Messrs. Samrén and Leliveld resignedon September 11, after Stichting VanLeer Group Foundation had sold itsHuhtamaki shares to HuhtamakiFinance B.V.
Extraordinary Shareholders’Meeting Lowered Share CapitalAn extraordinary shareholders’meeting was held on October 10, todecide on the lowering of thecompany’s share capital by EUR20.985 million to EUR 86.033 millionthrough invalidating the 6,172,015own shares, corresponding to 19.6%of the equity, that had come to thecompany’s possession.
1,573,798 shares or 5.0% of theshares outstanding had been acquiredin public trading via the HelsinkiExchanges between April 11 andAugust 17. The total price paid for theshares was EUR 47.9 million,corresponding to an average price ofEUR 30.44 per share. 4,598,217shares, representing 14.6% of theshare capital, were acquired fromStichting Van Leer Group Foundationon September 11 by Huhtamaki
Finance B.V., the wholly owned Dutchsubsidiary of Huhtamäki Oyj. The pricewas EUR 34.59 per share, equal to thetrade-weighted average price onHelsinki Exchanges for the two weekspreceding September 7. The totalconsideration thus amounted to EUR159.1 million. The lowering of theshare capital was entered to theFinnish Trade Registed on October 17.
Certain related amendments wereadopted in the company’s Articles ofAssociation. The minimum sharecapital was lowered to EUR 80 million.The Board of Directors now consistsof a minimum of six and a maximumof nine members. The right of theFinnish Cultural Foundation togetherwith its affiliate association, and ofStichting Van Leer Group Foundationto nominate one or two Boardsmembers each was removed, as theirmutual shareholders’ agreement wasno longer in force.
Ownership StructureOn September 11, Stichting VanLeer Group Foundation sold itsHuhtamaki shares, 14.6% of the totaloutstanding, to Huhtamaki FinanceB.V. This left the Finnish CulturalFoundation alone as the company’slargest shareholder. The Foundation,together with its affiliate association,held 18.2% of the equity at year-end.Foreign shareholding amounted to21.7% of the equity. The companyhad 15.669 registered shareholders,marginally less than at the end of 2000.
Having strengthened sharply inthe last weeks of December 2000, theHuhtamaki share opened the year to adecline. Market confidence returnedin late February, whereafter an upwardtrend was evident during the rest ofthe year. The swing from the year’slowest to highest price was 51.6%,whereas the increase from the first tothe last trading day was a moremoderate 20.6%. Nevertheless, the
Share developments
Share prices, EURJanuary 2 . . . . . . . . . . . . . . . .29.44
February 21 . . . . . . . . . . . . . . .24.50 low
October 11 . . . . . . . . . . . . . . . .37.00 high
December 28 . . . . . . . . . . . . . .35.50

share overperformed the HEX all-share index by almost 80%.
The averege daily trading volumefor the share on HEX increased byover 70% to 41,500 shares. Thefigure was boosted by the sharerepurchase program active from mid-April to mid-August, but volumesremained brisk during the rest of theyear as well. At the company’srequest, the share was de-listed fromthe EuroNext Amsterdam (formerlyAEX) exchange on February 16 due toinsignificant volumes.
Corporate StructureThe sale of the Van Leer industrialpackaging division to the U.S.company Greif Bros. Corporation wascompleted on March 3. The finalconsideration was USD 555 million,including debt and other liabilitiesassumed by the buyer. The otherdivested units included molded fiberbusiness in India (April), Keyes S.p.a.,the Italian molded fiber operation(July); U.S. molded fiber fruitpackaging business (July), and SAFPlastics, a Turkish flexible packagingunit (November). In each case, thebuyer was a private investor group.The combined annualized sales ofthese units amounted to EUR 54million. Their aggregate profitcontribution was negative.
Executive AppointmentsMr. Kalle Tanhuanpää, a former Huhta-maki executive, was appointed ChiefMarketing Officer and ExecutiveCommittee Member from thebeginning of 2002. From the samedate, Mr. Matti Tikkakoski and Mr.Henk Koekoek switched roles in theExecutive Committee, with the formerbecoming Chief Technology Officerand the latter Executive Vice PresidentEurope. In August, Mr. Jan Lång wasappointed Group Vice President SouthEurope and Mr. Joel Portnoj becameGroup Vice President Africa.
PersonnelAt year-end, Huhtamaki had 16,417employees, 6,681 less than at the endof 2000. The reduction mainly reflectsthe sale of the industrial packagingoperations. The divested consumerpackaging operations employed a
total of 510 employees, and variousrestructuring measures resulted in anet reduction of 800 employees. Theaverage number of employees was17,237, against 23,480 in 2000. Thecompany had 73 factories andadditional sales units in 35 countriesat the end of 2001.
The parent company employed751 people at year-end, comprisingthe Espoo Head Office (70) and theFinnish packaging operations (681).The respective annual average was795 (752 in 2000).
The European Works Council(EWC), an information and discussionplatform for employee representativesfrom within EEA (European EconomicArea), had its first official meetingduring the year.
The Outlook For 2002In 2002, Huhtamaki will pursuefurther efficiency improvements,foster innovation across thecompany and strengthen customerrelationships. A cautious marketrecovery now appears to be in sight,but the company’s long-term volumegrowth target may again provechallenging. The positive momentum
in margins development willnevertheless continue, as furthersynergies and rationalization benefitswill materialize from both past andpending projects. All such projectswill be completed during the year.
A year-on-year decline of 14% inthe average number of shares in issuewill alone strengthen earnings pershare significantly, and a new sharebuyback program is proposed to theAnnual General Meeting. Capitalexpenditure will remain on the level ofdepreciation, contributing to a strongfree cash flow. All told, Huhtamakilooks forward to another year ofgrowth and profit improvement.
main countries of operation (ranked by net sales;employees in full-time equivivalents)
Country Employees Net sales, EUR millionUSA 3,202 749
Germany 2,620 477
UK 1,319 187
France 679 113
Australia 795 110
Italy 508 91
The Netherlands 350 87
Finland 714 81
India 1,135 61
Brazil 627 45
key exchange rates in euros
2001 2000Income Balance Income Balance
statement sheet statement sheetAustralia AUD 0.5770 0.5787 0.6291 0.5963
Brazil BRL 0.4755 0.4893 0.5924 0.5524
UK GBP 1.6082 1.6434 1.6410 1.6023
India INR 0.0237 0.0235 0.0241 0.0230
South Africa ZAR 0.1295 0.0959 0.1564 0.1421
United States USD 1.1166 1.1347 1.0824 1.0747
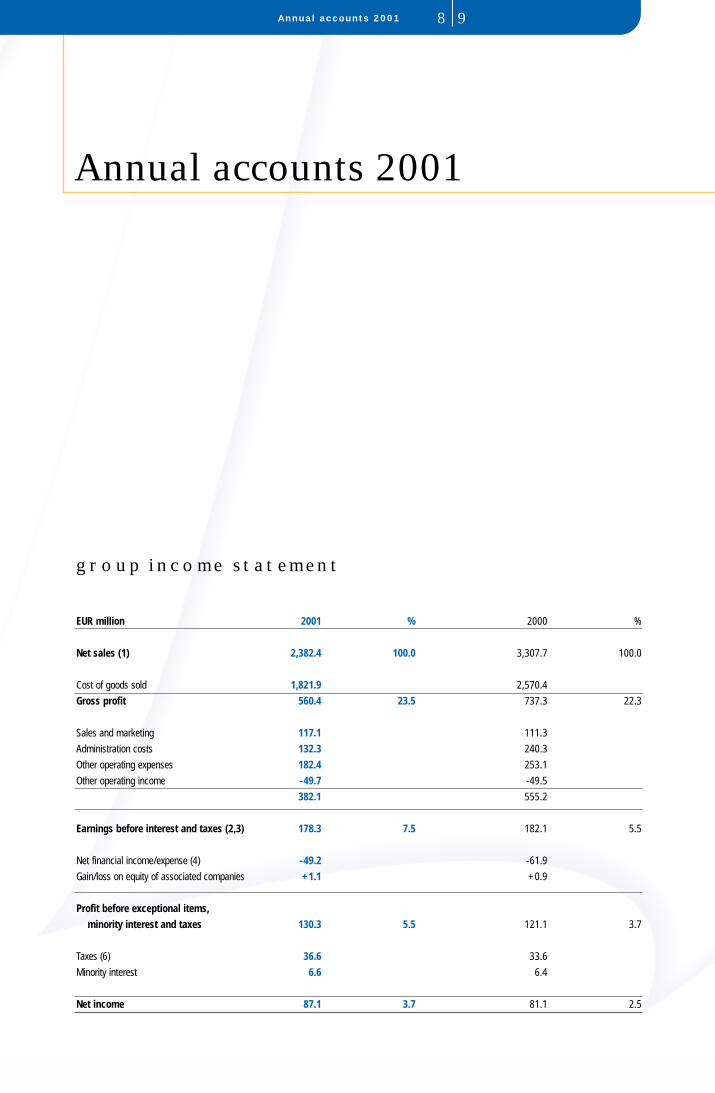
Annual accounts 2001
Annual accounts 2001 98
EUR million 2001 % 2000 %
Net sales (1) 2,382.4 100.0 3,307.7 100.0
Cost of goods sold 1,821.9 2,570.4
Gross profit 560.4 23.5 737.3 22.3
Sales and marketing 117.1 111.3
Administration costs 132.3 240.3
Other operating expenses 182.4 253.1
Other operating income -49.7 -49.5
382.1 555.2
Earnings before interest and taxes (2,3) 178.3 7.5 182.1 5.5
Net financial income/expense (4) -49.2 -61.9
Gain/loss on equity of associated companies +1.1 +0.9
Profit before exceptional items,
minority interest and taxes 130.3 5.5 121.1 3.7
Taxes (6) 36.6 33.6
Minority interest 6.6 6.4
Net income 87.1 3.7 81.1 2.5
group income statement

ASSETS
EUR million 2001 % 2000 %
FIXED ASSETS
Intangible assets (7)
Intangible rights 0.4 0.4
Goodwill 626.8 746.8
Other capitalised expenditure 103.5 28.1
730.7 27.5 775.3 21.4
Tangible assets (7)
Land 39.6 60.7
Buildings and constructions 235.6 319.0
Machinery and equipment 641.9 779.8
Other tangible assets 16.5 12.3
Construction in progress
and advance payments 76.7 105.1
1,010.3 38.1 1,276.9 35.2
Other fixed assets
Shares and holdings (8,9) 7.6 189.3
Loans receivable 4.7 4.2
12.3 0.5 193.5 5.3
CURRENT ASSETS
Inventories
Raw and packaging material 84.8 194.9
Work-in-process 45.7 53.1
Finished goods 155.0 204.1
Advance payments 2.4 9.3
287.9 10.9 461.4 12.7
Receivables (10)
Long-term
Deferred tax asset (18) 93.0 82.0
Other long-term receivables 25.1 23.7
118.1 4.4 105.7 2.9
Short-term
Trade receivables 362.3 535.9
Loans receivable 6.9 39.9
Accrued income and
other short-term receivables (10,19) 103.9 204.6
473.2 17.9 780.4 21.6
Marketable securities 2.9 0.1 1.0
Cash and bank 15.2 0.6 33.4 0.9
2,650.8 100.0 3,627.6 100.0
group balance sheet
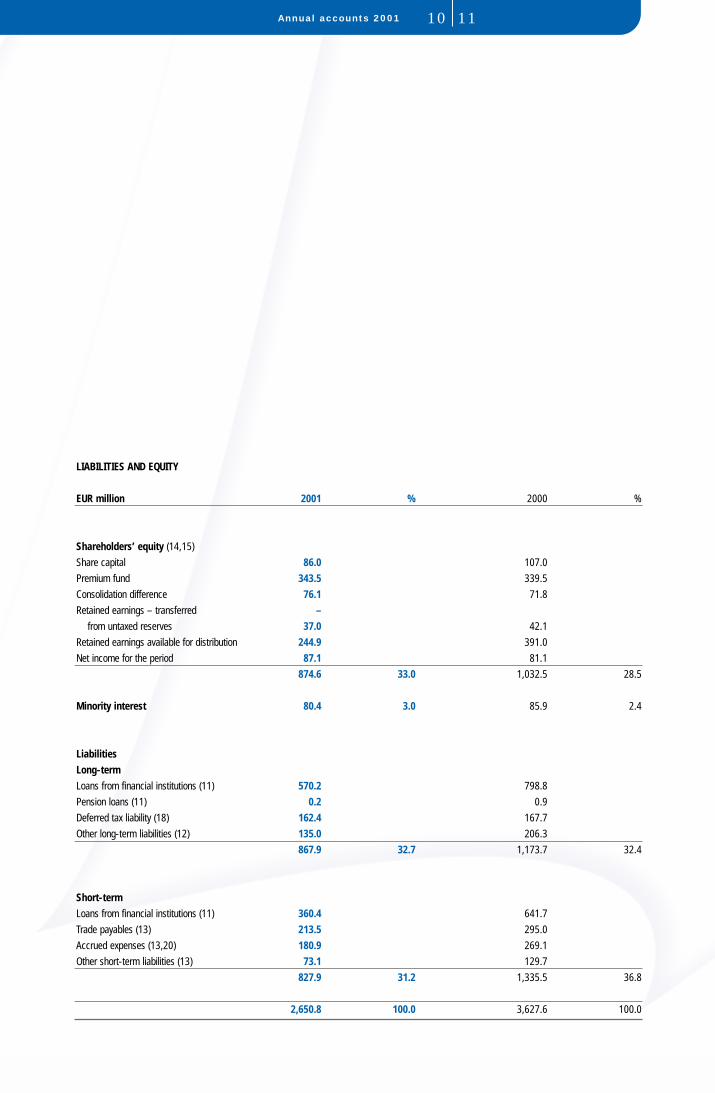
Annual accounts 2001 1110
LIABILITIES AND EQUITY
EUR million 2001 % 2000 %
Shareholders’ equity (14,15)
Share capital 86.0 107.0
Premium fund 343.5 339.5
Consolidation difference 76.1 71.8
Retained earnings – transferred –
from untaxed reserves 37.0 42.1
Retained earnings available for distribution 244.9 391.0
Net income for the period 87.1 81.1
874.6 33.0 1,032.5 28.5
Minority interest 80.4 3.0 85.9 2.4
Liabilities
Long-term
Loans from financial institutions (11) 570.2 798.8
Pension loans (11) 0.2 0.9
Deferred tax liability (18) 162.4 167.7
Other long-term liabilities (12) 135.0 206.3
867.9 32.7 1,173.7 32.4
Short-term
Loans from financial institutions (11) 360.4 641.7
Trade payables (13) 213.5 295.0
Accrued expenses (13,20) 180.9 269.1
Other short-term liabilities (13) 73.1 129.7
827.9 31.2 1,335.5 36.8
2,650.8 100.0 3,627.6 100.0
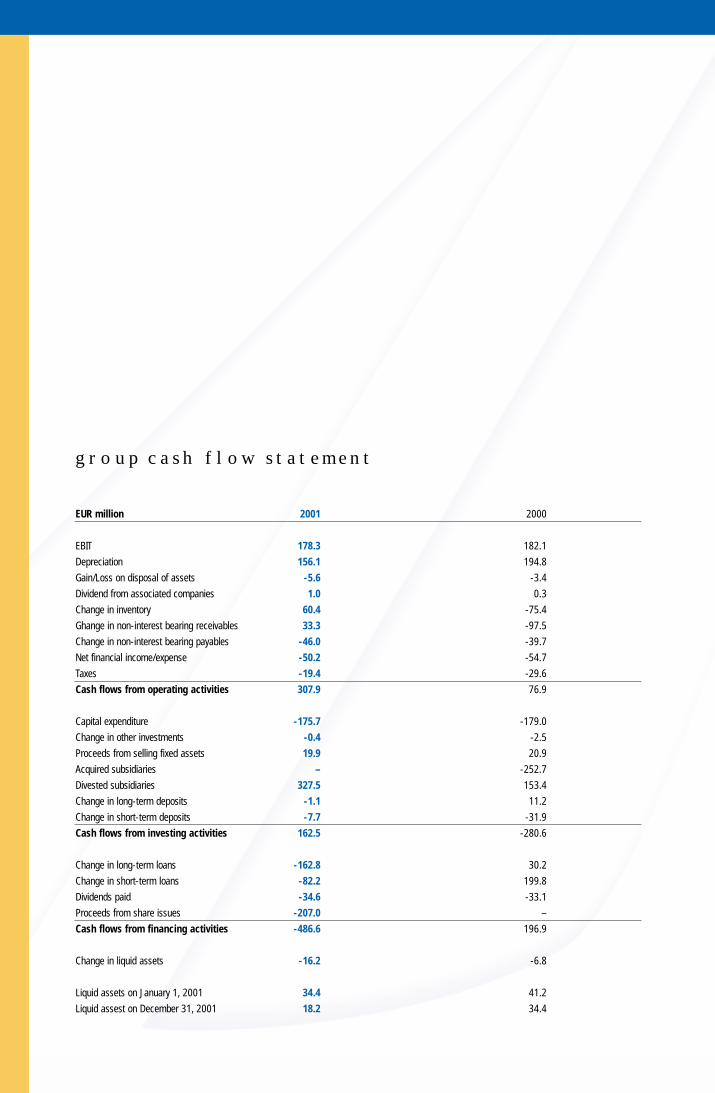
EUR million 2001 2000
EBIT 178.3 182.1
Depreciation 156.1 194.8
Gain/Loss on disposal of assets -5.6 -3.4
Dividend from associated companies 1.0 0.3
Change in inventory 60.4 -75.4
Ghange in non-interest bearing receivables 33.3 -97.5
Change in non-interest bearing payables -46.0 -39.7
Net financial income/expense -50.2 -54.7
Taxes -19.4 -29.6
Cash flows from operating activities 307.9 76.9
Capital expenditure -175.7 -179.0
Change in other investments -0.4 -2.5
Proceeds from selling fixed assets 19.9 20.9
Acquired subsidiaries – -252.7
Divested subsidiaries 327.5 153.4
Change in long-term deposits -1.1 11.2
Change in short-term deposits -7.7 -31.9
Cash flows from investing activities 162.5 -280.6
Change in long-term loans -162.8 30.2
Change in short-term loans -82.2 199.8
Dividends paid -34.6 -33.1
Proceeds from share issues -207.0 –
Cash flows from financing activities -486.6 196.9
Change in liquid assets -16.2 -6.8
Liquid assets on January 1, 2001 34.4 41.2
Liquid assest on December 31, 2001 18.2 34.4
group cash flow statement

Annual accounts 2001 1312
EUR million 2001 % 2000 %
Net sales (1) 102.6 100.0 95.8 100.0
Cost of goods sold 72.7 67.3
Gross profit 29.9 29.1 28.5 29.8
Sales and marketing 8.1 6.8
Administration costs 14.7 19.1
Other operating expenses 9.0 7.5
Other operating income -39.1 -35.9
-7.3 -2.5
Earnings before interest and taxes (2,3) 37.2 36.2 31.0 32.3
Net financial income/expense (4) 909.1 -43.1
Profit before exceptional items 946.3 921.9 -12.1 -12.6
Exceptional income (5) 4.0 8.2
Exceptional expense (5) -0.5 -3.2
Profit before appropriations and taxes 949.8 925.4 -7.1 -7.4
Depreciation difference,
(–) increase, (+) decrease +2.1 +2.5
Change in voluntary reserves,
(–) increase, (+) decrease +5.1 –
Taxes (6) 6.4 –
Net income 950.7 926.2 -4.6 -4.8
parent company income statement

ASSETS
EUR million 2001 % 2000 %
FIXED ASSETS
Intangible assets (7)
Intangible rights 0.3 0.3
Other capitalised expenditure 17.0 19.6
17.3 0.9 19.9 1.1
Tangible assets (7)
Land 0.5 0.5
Buildings and constructions 25.5 32.6
Machinery and equipment 31.3 31.5
Other tangible assets 2.1 0.4
Construction in progress and advance payments 6.1 1.8
65.6 3.5 66.8 3.8
Other fixed assets
Shares and holdings (8,9) 1,751.2 1,624.8
Loans receivable 3.3 6.0
1,754.6 92.5 1,630.8 91.6
CURRENT ASSETS
Inventories
Raw and packaging material 2.7 2.9
Work-in-process 0.4 0.6
Finished goods 8.6 8.3
11.7 0.6 11.8 0.7
Receivables (10)
Long-term
Loans receivable 4.4 4.1
Other long-term receivables 0.1 0.1
4.5 0.2 4.2 0.2
Short-term
Trade receivables 12.7 11.8
Loans receivable – 0.3
Accrued income (19) 26.9 32.3
39.6 2.1 44.4 2.5
Cash and bank 2.8 0.1 1.8 0.1
1,896.1 100.0 1,779.7 100.0
parent company balance sheet
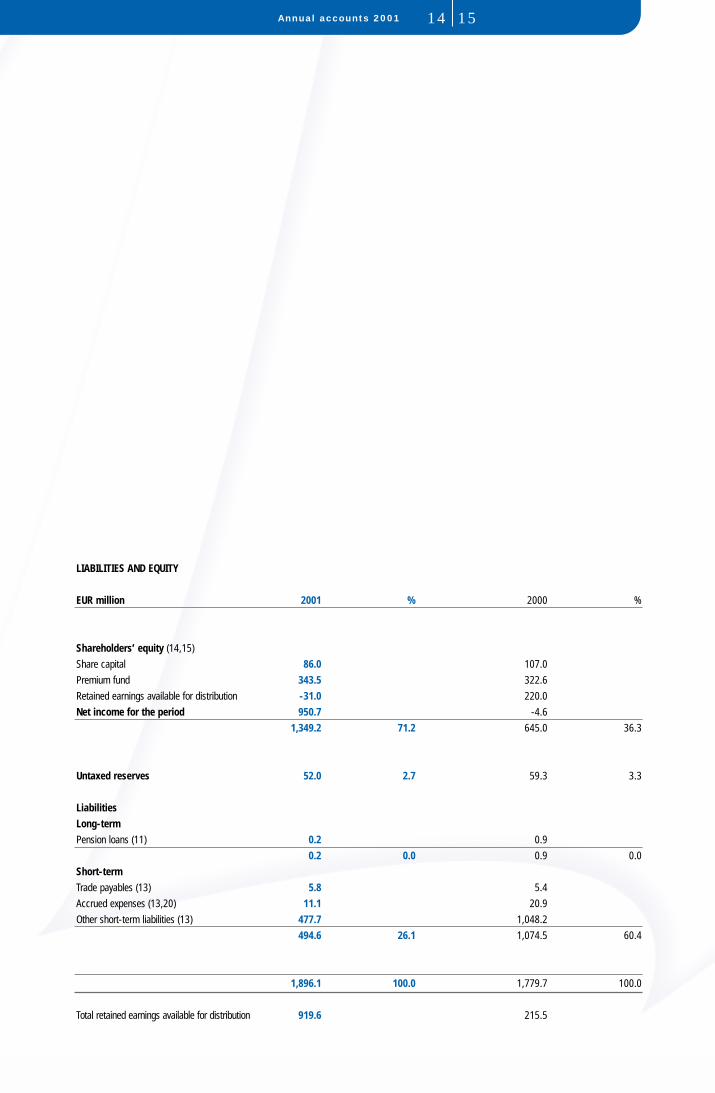
Annual accounts 2001 1514
LIABILITIES AND EQUITY
EUR million 2001 % 2000 %
Shareholders’ equity (14,15)
Share capital 86.0 107.0
Premium fund 343.5 322.6
Retained earnings available for distribution -31.0 220.0
Net income for the period 950.7 -4.6
1,349.2 71.2 645.0 36.3
Untaxed reserves 52.0 2.7 59.3 3.3
Liabilities
Long-term
Pension loans (11) 0.2 0.9
0.2 0.0 0.9 0.0
Short-term
Trade payables (13) 5.8 5.4
Accrued expenses (13,20) 11.1 20.9
Other short-term liabilities (13) 477.7 1,048.2
494.6 26.1 1,074.5 60.4
1,896.1 100.0 1,779.7 100.0
Total retained earnings available for distribution 919.6 215.5

EUR million 2001 2000
EBIT 37.2 31.0
Depreciation 8.1 8.0
Gain/Loss on disposal of assets 0.1
Change in inventory 0.2 -2.0
Ghange in non-interest bearing receivables 0.5 -17.5
Change in non-interest bearing payables 1.1 -12.6
Net financial income/expense -33.3 -40.7
Taxes -0.1 5.3
Exceptional income/expense 2.5 1.2
Cash flows from operating activities 16.2 -27.2
Capital expenditure -11.6 -6.5
Change in other investments –
Proceeds from selling fixed assets 7.2 0.5
Acquired subsidiaries -126.7 -1,3
Divested subsidiaries 1.1 –
Change in long-term deposits 2.4 1.8
Change in short-term deposits -0.2 18.5
Cash flows from investing activities -127.8 13.0
Change in long-term loans -0.6 –
Change in short-term loans -576.7 46.9
Dividends 932.2
Dividends paid -34.6 -33.1
Proceeds from share issues -207.7 –
Cash flows from financing activities 112.6 13.8
Change in liquid assets 1.0 -0.4
Liquid assets on January 1, 2000 1.8 2.2
Liquid assets on December 31, 2000 2.8 1.8
parent company cash flow statement
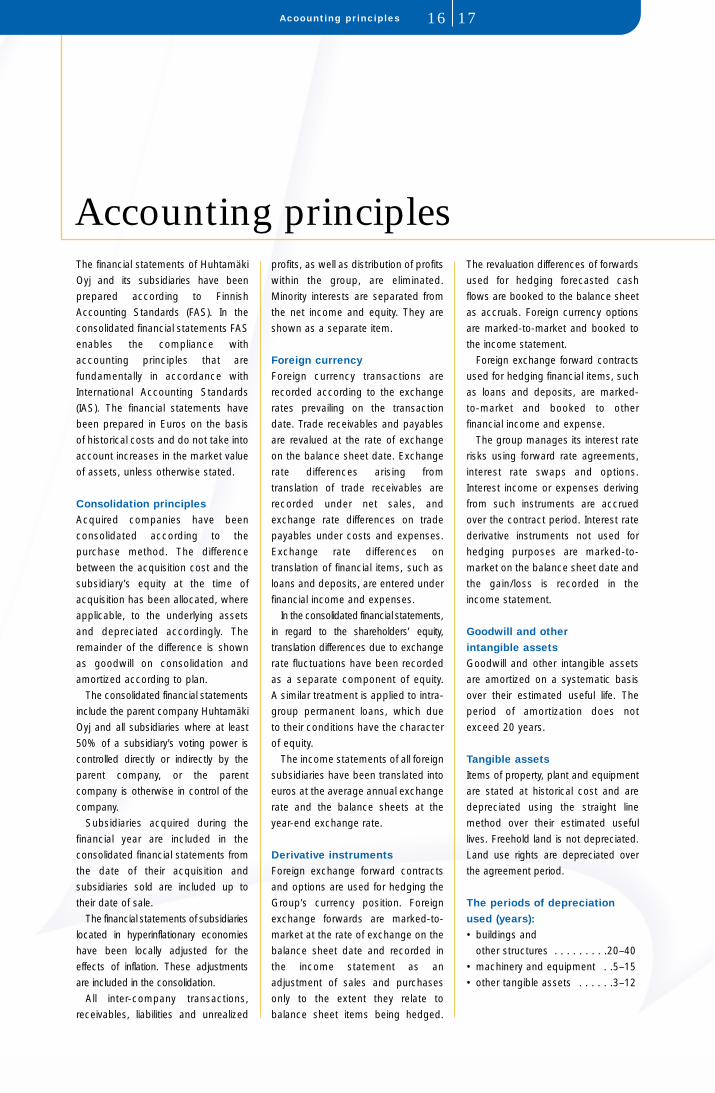
The financial statements of Huhtamäki
Oyj and its subsidiaries have been
prepared according to Finnish
Accounting Standards (FAS). In the
consolidated financial statements FAS
enables the compliance with
accounting principles that are
fundamentally in accordance with
International Accounting Standards
(IAS). The financial statements have
been prepared in Euros on the basis
of historical costs and do not take into
account increases in the market value
of assets, unless otherwise stated.
Consolidation principles
Acquired companies have been
consolidated according to the
purchase method. The difference
between the acquisition cost and the
subsidiary’s equity at the time of
acquisition has been allocated, where
applicable, to the underlying assets
and depreciated accordingly. The
remainder of the difference is shown
as goodwill on consolidation and
amortized according to plan.
The consolidated financial statements
include the parent company Huhtamäki
Oyj and all subsidiaries where at least
50% of a subsidiary’s voting power is
controlled directly or indirectly by the
parent company, or the parent
company is otherwise in control of the
company.
Subsidiaries acquired during the
financial year are included in the
consolidated financial statements from
the date of their acquisition and
subsidiaries sold are included up to
their date of sale.
The financial statements of subsidiaries
located in hyperinflationary economies
have been locally adjusted for the
effects of inflation. These adjustments
are included in the consolidation.
All inter-company transactions,
receivables, liabilities and unrealized
profits, as well as distribution of profits
within the group, are eliminated.
Minority interests are separated from
the net income and equity. They are
shown as a separate item.
Foreign currency
Foreign currency transactions are
recorded according to the exchange
rates prevailing on the transaction
date. Trade receivables and payables
are revalued at the rate of exchange
on the balance sheet date. Exchange
rate differences arising from
translation of trade receivables are
recorded under net sales, and
exchange rate differences on trade
payables under costs and expenses.
Exchange rate differences on
translation of financial items, such as
loans and deposits, are entered under
financial income and expenses.
In the consolidated financial statements,
in regard to the shareholders’ equity,
translation differences due to exchange
rate fluctuations have been recorded
as a separate component of equity.
A similar treatment is applied to intra-
group permanent loans, which due
to their conditions have the character
of equity.
The income statements of all foreign
subsidiaries have been translated into
euros at the average annual exchange
rate and the balance sheets at the
year-end exchange rate.
Derivative instruments
Foreign exchange forward contracts
and options are used for hedging the
Group’s currency position. Foreign
exchange forwards are marked-to-
market at the rate of exchange on the
balance sheet date and recorded in
the income statement as an
adjustment of sales and purchases
only to the extent they relate to
balance sheet items being hedged.
The revaluation differences of forwards
used for hedging forecasted cash
flows are booked to the balance sheet
as accruals. Foreign currency options
are marked-to-market and booked to
the income statement.
Foreign exchange forward contracts
used for hedging financial items, such
as loans and deposits, are marked-
to-market and booked to other
financial income and expense.
The group manages its interest rate
risks using forward rate agreements,
interest rate swaps and options.
Interest income or expenses deriving
from such instruments are accrued
over the contract period. Interest rate
derivative instruments not used for
hedging purposes are marked-to-
market on the balance sheet date and
the gain/loss is recorded in the
income statement.
Goodwill and other
intangible assets
Goodwill and other intangible assets
are amortized on a systematic basis
over their estimated useful life. The
period of amortization does not
exceed 20 years.
Tangible assets
Items of property, plant and equipment
are stated at historical cost and are
depreciated using the straight line
method over their estimated useful
lives. Freehold land is not depreciated.
Land use rights are depreciated over
the agreement period.
The periods of depreciation
used (years):
• buildings and
other structures . . . . . . . . .20–40
• machinery and equipment . .5–15
• other tangible assets . . . . . .3–12
Accounting principles
Acoounting principles 1716

Leases of plant and equipment
under which the Group assumes
substantially all the risks and benefits
of ownership are classified as finance
leases. Other leases are classified as
operating leases.
Investments
Investments classified as current
assets are carried at market value.
Any increases or decreases in
carrying values are credited or
charged to financial income.
Investments classified as long-term
assets are carried at cost, less
amounts written off to recognize
permanent declines in the value of the
investment. On disposal of an
investment, the difference between
the net disposal proceeds and the
carrying amount is charged or
credited to income.
Investments in subsidiaries are
carried at cost in the balance sheet of
the parent company in accordance
with the valuation policy applied to
long-term investments. A listing of the
Group’s significant subsidiaries is set
out in note 8.
Investments in associated companies
are carried in parent company’s balance
sheet in accordance with the valuation
policy applied to long-term investments
noted above and in Group’s balance
sheet under equity method. Jointly
owned companies are accounted for
according to the share of ownership.
An associated company is one in which
Huhtamaki holds, directly or indirectly,
between 20% and 50% of the voting
power of the company. A listing of the
Group’s associates is set out in note 9.
Inventories
Inventories are stated at the lower of
cost, replacement cost or net
realizable value. Cost for purchased
inventories represent historic purchase
price determined on the “first in first
out” (FIFO) basis.
Cost for produced finished goods
and work in process represent the
historic purchase price of materials,
determined on a first in first out basis,
plus direct labor, other direct costs
and related production overheads
excluding selling and financial costs.
Income taxes
The Group income statement
includes income taxes of Group
companies based on taxable profit for
the financial period according to local
tax regulations as well as adjustments
to prior year taxes and deferred taxes.
Deferred taxes
Deferred tax arising from timing
differences between book and fiscal
valuation of net income is calculated
applying the standard tax rate
applicable at the balance sheet date
or the tax rate at when the tax is going
to be paid. Deferred tax debits are
only carried forward if there is a
reasonable expectation of realization.
In the consolidated balance sheet
accumulated depreciation difference
and untaxed reserves (appropriations)
have been divided into equity and
deferred tax as well as deferred tax
arising from movements on untaxed
reserves during the financial year have
been taken into account in net
income.
Revenue recognition
Revenue is recognized at the date of
delivery. Net sales is calculated after
deduction of sales discounts, indirect
sales taxes and exchange differences
on sales in foreign currencies.
Research and development
Research and development costs are
charged as an expense in the income
statement in the period in which they
are incurred without exception.
Pensions and other
post retirement benefits
The Group companies have various
pension plans in accordance with
local conditions and practices.
Contributions are based on periodic
actuarial valuations and are charged
against profits. The plans are covered
according to local conditions and
practices.
Some US based Group companies
provide for certain post retirement
health care and life insurance benefits.
Unfunded part of the plans is
recorded in the balance sheet as a
liability.
Other operating
income and expenses
Other operating income includes
gains from disposal of assets and
regular income, such as royalty and
rental income, which have not been
derived from primary activities.
Other operating expenses include
losses from disposal of assets and
other costs not directly related to end
product such as R&D.
Extraordinary
income and expenses
Extraordinary income and expenses
include items which fall outside the
ordinary activities of the company, e.g.
items related to major divestments or
restructuring operations.
Cash flow statement
Cash flow statement illustrates cash
in- and outflows arising from
operations, investments and financing.
In the investments, acquisitions and
divestments are valued at the purchase
price of shares. Assets and liabilities of
the acquired/divested company are
neither included in the change in
working capital, net investments nor
financing in the cash flow statement.
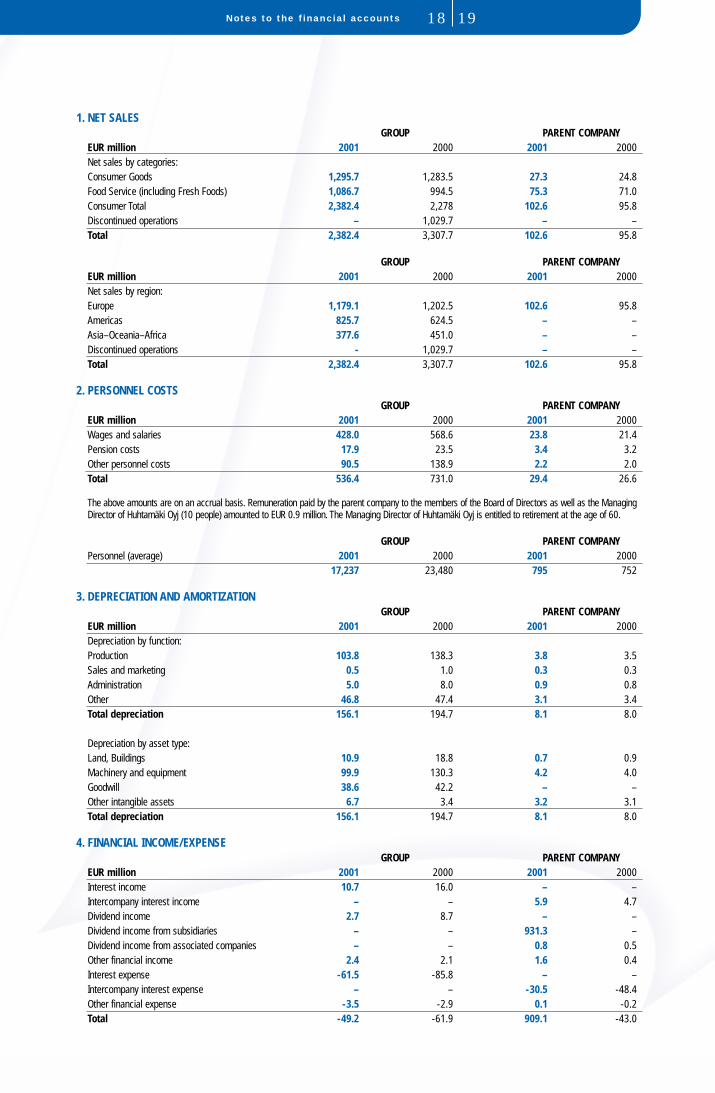
Notes to the financial accounts 1918
1. NET SALESGROUP PARENT COMPANY
EUR million 2001 2000 2001 2000 Net sales by categories:Consumer Goods 1,295.7 1,283.5 27.3 24.8Food Service (including Fresh Foods) 1,086.7 994.5 75.3 71.0Consumer Total 2,382.4 2,278 102.6 95.8Discontinued operations – 1,029.7 – –Total 2,382.4 3,307.7 102.6 95.8
GROUP PARENT COMPANYEUR million 2001 2000 2001 2000 Net sales by region:Europe 1,179.1 1,202.5 102.6 95.8Americas 825.7 624.5 – –Asia–Oceania–Africa 377.6 451.0 – –Discontinued operations - 1,029.7 – –Total 2,382.4 3,307.7 102.6 95.8
2. PERSONNEL COSTSGROUP PARENT COMPANY
EUR million 2001 2000 2001 2000 Wages and salaries 428.0 568.6 23.8 21.4Pension costs 17.9 23.5 3.4 3.2Other personnel costs 90.5 138.9 2.2 2.0Total 536.4 731.0 29.4 26.6
The above amounts are on an accrual basis. Remuneration paid by the parent company to the members of the Board of Directors as well as the Managing Director of Huhtamäki Oyj (10 people) amounted to EUR 0.9 million. The Managing Director of Huhtamäki Oyj is entitled to retirement at the age of 60.
GROUP PARENT COMPANYPersonnel (average) 2001 2000 2001 2000
17,237 23,480 795 752
3. DEPRECIATION AND AMORTIZATION GROUP PARENT COMPANY
EUR million 2001 2000 2001 2000 Depreciation by function:Production 103.8 138.3 3.8 3.5Sales and marketing 0.5 1.0 0.3 0.3Administration 5.0 8.0 0.9 0.8Other 46.8 47.4 3.1 3.4Total depreciation 156.1 194.7 8.1 8.0
Depreciation by asset type:Land, Buildings 10.9 18.8 0.7 0.9Machinery and equipment 99.9 130.3 4.2 4.0Goodwill 38.6 42.2 – –Other intangible assets 6.7 3.4 3.2 3.1Total depreciation 156.1 194.7 8.1 8.0
4. FINANCIAL INCOME/EXPENSE GROUP PARENT COMPANY
EUR million 2001 2000 2001 2000 Interest income 10.7 16.0 – –Intercompany interest income – – 5.9 4.7Dividend income 2.7 8.7 – –Dividend income from subsidiaries – – 931.3 –Dividend income from associated companies – – 0.8 0.5Other financial income 2.4 2.1 1.6 0.4Interest expense -61.5 -85.8 – –Intercompany interest expense – – -30.5 -48.4Other financial expense -3.5 -2.9 0.1 -0.2Total -49.2 -61.9 909.1 -43.0

5. EXCEPTIONAL ITEMS GROUP PARENT COMPANY
EUR million 2001 2000 2001 2000 Exceptional income – – – –Exceptional expense – – -0.5 -3.2Group contributions, net – – 4.0 8.2Total – – 3.5 5.0
The parent company exceptional expense comprises of structural changes within the group, that have been eliminated on the group level.
6. TAXESGROUP PARENT COMPANY
EUR million 2001 2000 2001 2000 Ordinary taxes -35.3 -25.7 -6.4 –Deferred taxes -1.3 -7.9 – –Total -36.6 -33.6 -6.4 –
7. FIXED ASSETS GROUP PARENT COMPANY
EUR million 2001 2000 2001 2000Intangible rights
Acquisition cost at January 1 1.0 1.1 0.4 0.4Additions – 0.5 – –Disposals 0.5 -0.1 – –Intra-balance sheet transfer – -0.5 – –Changes in exchange rates -0.4 – – –
Acquisition cost at December 31 1.1 1.0 0.4 0.4
Accumulated amortization at January 1 0.6 0.6 0.1 0.1Accum. amortization on decreases and transfers 0.2 -0.3 – –Accumulation during the financial year 0.2 0.3 – –Changes in exchange rates -0.3 – – –
Accumulated amortization at December 31 0.7 0.6 0.1 0.1Book value at December 31 0.4 0.4 0.3 0.3
GoodwillAcquisition cost at January 1 834.0 847.0 – –
Additions 0.3 13.4 – –Disposals -87.6 -33.3 – –Intra-balance sheet transfer – – – –Changes in exchange rates 5.3 6.9 – –
Acquisition cost December 31 752.0 834.0 – –
Accumulated amortization at January 1 87.2 45.5 – –Accum. amortization on decreases and transfers -0.5 -0.1 – –Amortization during the financial year 37.7 42.2 – –Changes in exchange rates 0.9 -0.4 – –
Accumulated amortization at December 31 125.3 87.2 – –Book value at December 31 626.7 746.8 – –
Other capitalised expenditureAcquisition cost at January 1 40.9 13.5 30.2 30.0
Additions 82.5 21.3 0.6 0.2Disposals -4.5 -0.6 – –Intra-balance sheet transfer 2.5 7.3 – –Changes in exchange rates 2.3 -0.6 – –
Acquisition cost at December 31 123.9 40.9 30.8 30.2

Notes to the financial accounts 2120
GROUP PARENT COMPANYEUR million 2001 2000 2001 2000
Accumulated amortization at January 1 12.8 7.0 10.6 7.5Accum. amortization on decreases and transfers -0.3 2.9 – –Amortization during the financial year 7.3 3.1 3.2 3.1Changes in exchange rates 0.6 -0.2 – –
Accumulated amortization at December 31 20.4 12.8 13.8 10.6Book value at December 31 103.5 28.1 17.0 19.6
Land and land use rightsAcquisition cost at January 1 61.7 63.2 0.5 0.9
Additions 0.3 3.0 – –Disposals -21.7 -4.9 – -0.4Intra-balance sheet transfer 0.2 0.1 – –Changes in exchange rates 0.1 0.3 – –
Acquisition cost at December 31 40.6 61.7 0.5 0.5
Accumulated amortization at January 1 1.0 0.6 – –Accum. amortization on decreases and transfers -0.3 - – –Amortization during the financial year 0.2 0.4 – –Changes in exchange rates 0.1 - – –
Accumulated amortization at December 31 1.0 1.0 – –Book value at December 31 39.6 60.7 0.5 0.5
Buildings and constructionsAcquisition cost at January 1 391.3 371.1 63.0 62.8
Additions 32.6 15.1 0.3 0.4Disposals -157.0 -38.1 -13.6 -0.2Intra-balance sheet transfer 9.1 41.3 – –Changes in exchange rates 2.6 1.9 – –
Acquisition cost at December 31 278.6 391.3 49.7 63.0
Accumulated depreciation at January 1 72.3 61.8 30.4 29.5Accum. depreciation on decreases and transfers -42.3 -6.0 -6.9 -0.1Depreciation during the financial year 12.0 18.4 0.7 1.0Changes in exchange rates 1.0 -1.9 – –
Accumulated depreciation at December 31 43.0 72.3 24.2 30.4Book value at December 31 235.6 319.0 25.5 32.6
Revaluation of buildings and constructions(included in the above figures) 2.4 6.7 2.4 6.7
Machinery and equipmentAcquisition cost at January 1 1,143.3 1,100.9 72.3 66.6
Additions 121.4 101.4 5.4 6.4Disposals -406.7 -105.2 -2.0 -0.7Intra-balance sheet transfer 65.0 28.2 -5.5 –Changes in exchange rates -26.1 18.0 – –
Acquisition cost at December 31 896.9 1,143.3 70.2 72.3
Accumulated depreciation at January 1 363.5 276.1 40.8 37.3Accum. depreciation on decreases and transfers -169.9 -42.7 -5.4 -0.5Depreciation during the financial year 100.0 124.8 3.5 4.0Changes in exchange rates -38.6 5.3 – –
Accumulated depreciation at December 31 255.0 363.5 38.9 40.8Book value at December 31 641.9 779.8 31.3 31.5
Other tangible assetsAcquisition cost at January 1 40.1 26.9 0.8 1.0
Additions 4.2 3.5 0.7 –Disposals -4.8 -3.1 -0.1 -0.2Intra-balance sheet transfer 2.8 11.6 5.5 –Changes in exchange rates 2.6 1.2 – –
Acquisition cost at December 31 44.9 40.1 6.9 0.8

Accumulated depreciation at January 1 27.8 16.1 0.4 0.6Accum. depreciation on decreases and transfers -4.9 4.9 3.7 -0.2Depreciation during the financial year 5.8 5.8 0.7 –Changes in exchange rates -0.3 1.0 – –
Accumulated depreciation at December 31 28.4 27.8 4.8 0.4Book value at December 31 16.5 12.3 2.1 0.4
Construction in progress and advance paymentsAcquisition cost at January 1 105.1 116.3 1.8 2.1
Additions 86.2 80.1 10.4 6.3Disposals -43.3 -7.8 -6.1 -6.6Intra-balance sheet transfer -77.8 -88.2 – –Changes in exchange rates 6.5 4.7 – –
Acquisition cost at December 31 76.7 105.1 6.1 1.8
8. INVESTMENT IN SUBSIDIARIES
The list contains operative companies, holding companies and other subsidiaries with sufficient assets. A complete statutory list is enclosed in the official statutory accounts, which may be be obtained from the company on request. Foreign subsidiaries’ nominal values are expressed in local currency (1,000). Subsidiaries’ book values are expressed in holding company’s currency (1,000).
Huhtamaki Oyj’s shareholding in subsidiaries:Name Number Size of Nominal Book Group
of shares holding % value value holding %Huhtamaki Finance B.V. 4,900,713 100.0 NLG 490,071 EUR 1,712,765 100.0Huhtamaki Portugal S.G.P.S., Lda 2 100.0 PTE 50,400 EUR 1,975 100.0Huhtamäki Finance Oy 50 100.0 EUR 8,409 EUR 8,409 100.0Pacific World Packaging (International) Ltd. 182,502 100.0 HDK 183 EUR 9,512 100.0Partner Polarcup Oy 78,694 100.0 EUR 13,236 EUR 13,236 100.0Huhtamaki Argentina S.A. 1,400,000 91.2 ARS 1,400 EUR 1,803 100.0Huhtamaki Hungary Kft 1 100.0 HUF 51,060 EUR 339 100.0
Subsidiary shares owned by Huhtamaki Finance B.V.:Huhtamaki Istanbul Sanayi A.S. 1,650,000 100.0 TRL 1,650,000,000 EUR 25,201 100.0Huhtamaki Holdings Pty Ltd 43,052,750 100.0 AUD 43,053 EUR 1,715 100.0Huhtamaki (NZ) Holdings Ltd 13,920 100.0 NZD 12,250 EUR 2,637 100.0Huhtamaki Anglo Holding Unlimited 64,000,001 100.0 GBP 64,000 EUR 102,597 100.0Huhtamaki Finance B.V.Y. Cia,Sociedada Collectiva – 99.9 EUR 6,003 EUR 6,000 100.0Huhtamaki Finance Co I B.V. 200 100.0 EUR 20 EUR 241,623 100.0Huhtamaki Holdings France S.A.R.L 489,668 100.0 FRF 7,467 EUR 7,726 100.0Huhtamaki (Norway) Holdings A/S 28,459 100.0 NOK 28,459 EUR 3,470 100.0Huhtamaki Sweden Holding AB 1,000 100.0 SEK 100 EUR 4,387 100.0Huhtamaki Egypt LLC 6,000 75.0 EGP 6,000 EUR 2,024 75.0Huhtamaki South Africa (Pty) Ltd. 167,661 100.0 ZAR 335 EUR 1,774 100.0Huhtamaki S.p.A 20,020,000 100.0 ITL 10,410 EUR 34,796 100.0Huhtamaki Singapore Pte. Ltd 28,000 100.0 SGD 28,000 EUR 11,977 100.0
Subsidiary shares owned by Huhtamaki Pty. Ltd:Huhtamaki Australia Limited 9,241,702 100.0 AUD 9,242 AUD 9,242 100.0
Subsidiary shares owned by Huhtamaki (NZ) Holdings Ltd:Huhtamaki (Henderson) Ltd 195,700 97.5 NZD 391 NZD 28,493 100.0
Subsidiary shares owned by Huhtamaki Holdings France S.A.R.L.:Huhtamaki France S.A. 71,994 100.0 FRF 7,200 FRF 4,992 100.0
Subsidiary shares owned by Huhtamaki Finance B.V.Y. Cia, Sociedada Collectiva:Huhtamaki Spain S.A. 430,000 100.0 EUR 12,922 EUR 24,000 100.0
Subsidiary shares owned by Huhtamaki Anglo Holding Unlimited:Huhtamaki Ltd 51,928,202 100.0 GBP 51,928 GBP 87,000 100.0
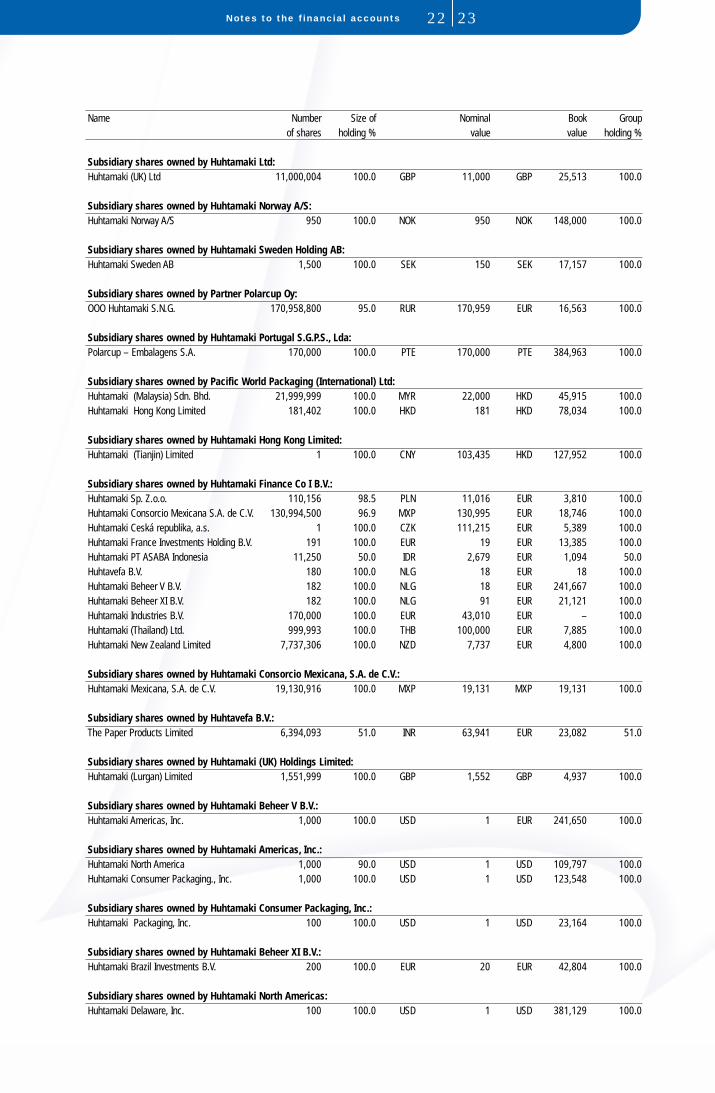
Notes to the financial accounts 2322
Name Number Size of Nominal Book Groupof shares holding % value value holding %
Subsidiary shares owned by Huhtamaki Ltd:Huhtamaki (UK) Ltd 11,000,004 100.0 GBP 11,000 GBP 25,513 100.0
Subsidiary shares owned by Huhtamaki Norway A/S:Huhtamaki Norway A/S 950 100.0 NOK 950 NOK 148,000 100.0
Subsidiary shares owned by Huhtamaki Sweden Holding AB:Huhtamaki Sweden AB 1,500 100.0 SEK 150 SEK 17,157 100.0
Subsidiary shares owned by Partner Polarcup Oy:OOO Huhtamaki S.N.G. 170,958,800 95.0 RUR 170,959 EUR 16,563 100.0
Subsidiary shares owned by Huhtamaki Portugal S.G.P.S., Lda:Polarcup – Embalagens S.A. 170,000 100.0 PTE 170,000 PTE 384,963 100.0
Subsidiary shares owned by Pacific World Packaging (International) Ltd:Huhtamaki (Malaysia) Sdn. Bhd. 21,999,999 100.0 MYR 22,000 HKD 45,915 100.0Huhtamaki Hong Kong Limited 181,402 100.0 HKD 181 HKD 78,034 100.0
Subsidiary shares owned by Huhtamaki Hong Kong Limited:Huhtamaki (Tianjin) Limited 1 100.0 CNY 103,435 HKD 127,952 100.0
Subsidiary shares owned by Huhtamaki Finance Co I B.V.:Huhtamaki Sp. Z.o.o. 110,156 98.5 PLN 11,016 EUR 3,810 100.0Huhtamaki Consorcio Mexicana S.A. de C.V. 130,994,500 96.9 MXP 130,995 EUR 18,746 100.0Huhtamaki Ceská republika, a.s. 1 100.0 CZK 111,215 EUR 5,389 100.0Huhtamaki France Investments Holding B.V. 191 100.0 EUR 19 EUR 13,385 100.0Huhtamaki PT ASABA Indonesia 11,250 50.0 IDR 2,679 EUR 1,094 50.0Huhtavefa B.V. 180 100.0 NLG 18 EUR 18 100.0Huhtamaki Beheer V B.V. 182 100.0 NLG 18 EUR 241,667 100.0Huhtamaki Beheer XI B.V. 182 100.0 NLG 91 EUR 21,121 100.0Huhtamaki Industries B.V. 170,000 100.0 EUR 43,010 EUR – 100.0Huhtamaki (Thailand) Ltd. 999,993 100.0 THB 100,000 EUR 7,885 100.0Huhtamaki New Zealand Limited 7,737,306 100.0 NZD 7,737 EUR 4,800 100.0
Subsidiary shares owned by Huhtamaki Consorcio Mexicana, S.A. de C.V.: Huhtamaki Mexicana, S.A. de C.V. 19,130,916 100.0 MXP 19,131 MXP 19,131 100.0
Subsidiary shares owned by Huhtavefa B.V.: The Paper Products Limited 6,394,093 51.0 INR 63,941 EUR 23,082 51.0
Subsidiary shares owned by Huhtamaki (UK) Holdings Limited: Huhtamaki (Lurgan) Limited 1,551,999 100.0 GBP 1,552 GBP 4,937 100.0
Subsidiary shares owned by Huhtamaki Beheer V B.V.: Huhtamaki Americas, Inc. 1,000 100.0 USD 1 EUR 241,650 100.0
Subsidiary shares owned by Huhtamaki Americas, Inc.: Huhtamaki North America 1,000 90.0 USD 1 USD 109,797 100.0 Huhtamaki Consumer Packaging., Inc. 1,000 100.0 USD 1 USD 123,548 100.0
Subsidiary shares owned by Huhtamaki Consumer Packaging, Inc.:Huhtamaki Packaging, Inc. 100 100.0 USD 1 USD 23,164 100.0
Subsidiary shares owned by Huhtamaki Beheer XI B.V.: Huhtamaki Brazil Investments B.V. 200 100.0 EUR 20 EUR 42,804 100.0
Subsidiary shares owned by Huhtamaki North Americas: Huhtamaki Delaware, Inc. 100 100.0 USD 1 USD 381,129 100.0

Name Number Size of Nominal Book Groupof shares holding % value value holding %
Subsidiary shares owned by Huhtamaki Delaware, Inc.:Huhtamaki Holding, Inc. 100 100.0 USD 1 USD 284,857 100.0
Subsidiary shares owned by Huhtamaki Holding Inc.: Huhtamaki Flexibles, Inc. 100 100.0 USD 1 USD 1,000 100.0Huhtamaki Plastics, Inc. 1,000 100.0 USD 3 USD 1,500 100.0Huhtamaki - East Providence., Inc. 6,445 100.0 USD 15 USD 32,463 100.0Huhtamaki Group of Companies 100 100.0 USD 1 USD 82,830 100.0
Subsidiary shares owned by Huhtamaki Brazil Investments B.V.: Huhtamaki do Brazil Ltda 4,886,600 100.0 BRL 4,887 EUR 13,482 100.0
Subsidiary shares owned by Huhtamaki France Investments Holding B.V.: Huhtamaki La Rochelle SNC 2,499,976 100.0 FRF 25,000 EUR 206 100.0
Subsidiary shares owned by Huhtamaki Industries B.V.: Huhtamaki Nederland B.V. 10,000 100.0 EUR 4,530 EUR 14,006 100.0 Huhtamaki Paper Recycling B.V. 1,350 100.0 EUR 61 EUR 1,492 100.0 Huhtamaki Pulp Moulding Machinery B.V. 200 100.0 EUR 91 EUR 290 100.0 Huhtamaki Protective Packaging B.V. 250 100.0 EUR 113 EUR 113 100.0 Huhtamaki Beheer III B.V. 1 100.0 DEM 3,550 EUR 17,697 100.0
Subsidiary shares owned by Huhtamaki Beheer III B.V.: Huhtamaki (Deutschland) B.V. & Co Holding KG 19,391 75.1 EUR 1,939 EUR 160,439 75.1
Subsidiary shares owned by Huhtamaki (Deutschland) B.V. & Co. Holding KG: Huhtamaki Deutschland Operations Holding GmbH 1 100.0 DEM 38,400 DEM 119,630 100.0
Subsidiary shares owned by Huhtamaki Deutschland Operations GmbH: Huhtamaki Deutschland GmbH 14,850 100.0 DEM 15,050 EUR 131,073 100.0
Subsidiary shares owned by Huhtamaki (Deutschland) GmbH:Huhtamaki Deutschland GmbH & Co. KG 1 100.0 EUR 4,090 EUR 85,306 100.0
9. INVESTMENTS IN ASSOCIATED AND OTHER COMPANIESForeign subsidiaries’ nominal values are expressed in local currency (1,000), while book values are in holding company’s currency (1,000).
Name Number Size of Nominal Book Groupof shares holding % value value holding %
Owned by Huhtamäki Oyj:
Joint Ventures:MCP Solutions Oy 4 50.0 EUR 4,000 EUR 11 50.0Polarcup EarthShell Aps 1,000 50.0 EUR 100 EUR 634 50.0
Associated companies:Arabian Paper Products Co. 1,600 40.0 SAR 1,600 EUR 452 40.0
Other:Hex Oy 24,400 0.2 EUR 34 EUR 25Repligen Corporation 30,514 0.2 USD – EUR 271Suomen Osakekeskusrekisteri Osuuskunta 8 1.7 EUR 27 EUR 27
Owned by the Group:Joint Ventures:
Huhtamaki EarthShell GmbH – 50.0 EUR 50 EUR 575 50.0
Associated companies:Hiatus B.V. 950 47.5 NLG 200 EUR 471 47.5
Other:Nordea FDR 306,000 0.0 EUR 505 EUR 968Pohjola-Yhtymä Vakuutus Oyj 117,664 0.3 EUR 99 EUR 1,461

Notes to the financial accounts 2524
10. RECEIVABLESGROUP PARENT COMPANY
EUR million 2001 2000 2001 2000Current
Trade receivables 362.3 535.9 7.3 6.8Intercompany trade receivables – – 5.4 5.0Loan receivables 6.9 39.9 – –Intercompany loan receivables – – – 0.3Accrued income and
other short-term receivables 103.9 204.6 14.4 12.9Accrued corporate income and
other intercompany receivables – – 12.5 19.4473.1 780.4 39.6 44.4
Long-termIntercompany loan receivables – – 4.4 4.1Other long-term receivables 25.1 23.7 0.1 0.1Deferred tax asset 93.0 82.0 – –
118.1 105.7 4.5 4.2
Total receivables 591.2 886.1 44.1 48.6
11. LOANSGROUP PARENT COMPANY
EUR million 2001 2000 2001 2000Current
Bank loans – current portion 16.9 13.4 – –Other loans – current portion 3.2 4.3 – –Obligations under finance leases-
– current portion 0.2 0.6 – –Short-term loans 340.3 623.4 – –
360.6 641.7 – –
Long-termBank loans 565.6 787.3 – –Pension loans 0.2 0.9 0.2 0.9Other long-term loans 4.8 9.7 – –
Obligations under finance leases 0.1 1.8 – –570.7 799.7 0.2 0.9
GROUP PARENT COMPANYChanges in long-term loans and repayments 2001 2000 2001 2000
Bank loansJanuary 1, 2001 800.6 825.9 – –Additions 118.0 218.8 – –Decreases 337.5 242.5 – –Changes in exchange rates +1.4 -1.6 – –
582.5 800.6 – –Repayments 2002 16.9 13.3 – –December 31, 2001 565.6 787.3 – –
Pension loans December 31, 2001From pension foundation 0.2 0.9 0.2 0.9
Repayments 2002 20.3 –2003 182.4 –2004 310.8 –2005 7.6 –2006 7.6 –2007 57.2 0.2
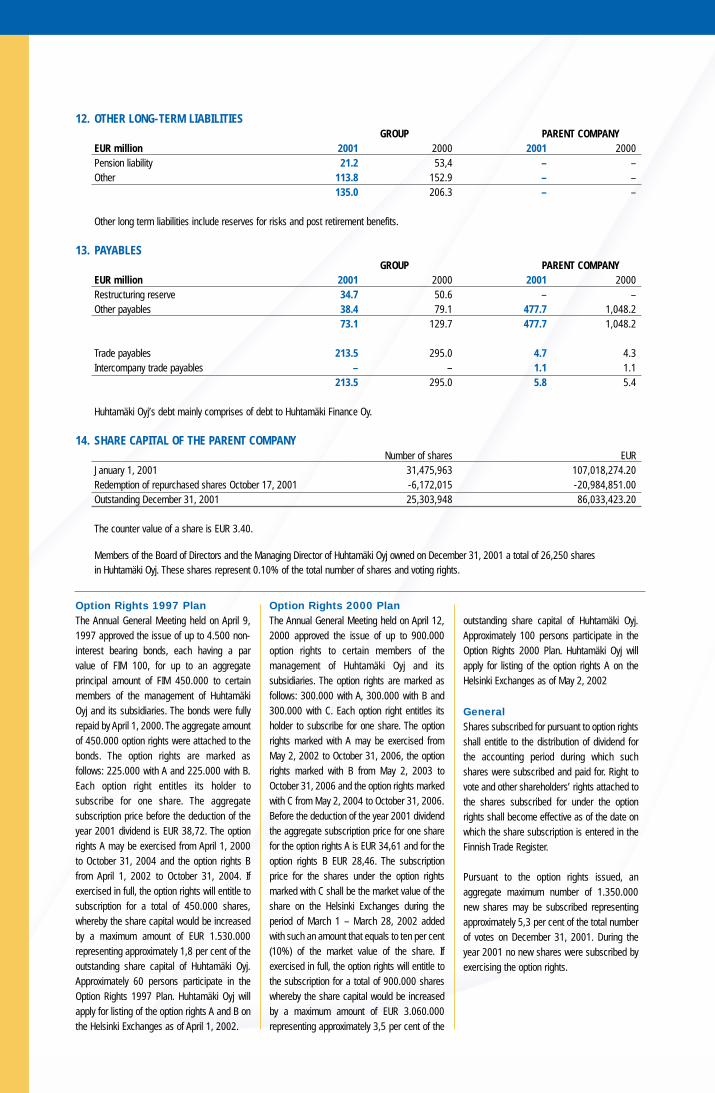
12. OTHER LONG-TERM LIABILITIES GROUP PARENT COMPANY
EUR million 2001 2000 2001 2000Pension liability 21.2 53,4 – –Other 113.8 152.9 – –
135.0 206.3 – –
Other long term liabilities include reserves for risks and post retirement benefits.
13. PAYABLES GROUP PARENT COMPANY
EUR million 2001 2000 2001 2000Restructuring reserve 34.7 50.6 – –Other payables 38.4 79.1 477.7 1,048.2
73.1 129.7 477.7 1,048.2
Trade payables 213.5 295.0 4.7 4.3Intercompany trade payables – – 1.1 1.1
213.5 295.0 5.8 5.4
Huhtamäki Oyj’s debt mainly comprises of debt to Huhtamäki Finance Oy.
14. SHARE CAPITAL OF THE PARENT COMPANY Number of shares EUR
January 1, 2001 31,475,963 107,018,274.20Redemption of repurchased shares October 17, 2001 -6,172,015 -20,984,851.00Outstanding December 31, 2001 25,303,948 86,033,423.20
The counter value of a share is EUR 3.40.
Members of the Board of Directors and the Managing Director of Huhtamäki Oyj owned on December 31, 2001 a total of 26,250 shares in Huhtamäki Oyj. These shares represent 0.10% of the total number of shares and voting rights.
Option Rights 1997 PlanThe Annual General Meeting held on April 9,1997 approved the issue of up to 4.500 non-interest bearing bonds, each having a parvalue of FIM 100, for up to an aggregateprincipal amount of FIM 450.000 to certainmembers of the management of HuhtamäkiOyj and its subsidiaries. The bonds were fullyrepaid by April 1, 2000. The aggregate amountof 450.000 option rights were attached to thebonds. The option rights are marked asfollows: 225.000 with A and 225.000 with B.Each option right entitles its holder tosubscribe for one share. The aggregatesubscription price before the deduction of theyear 2001 dividend is EUR 38,72. The optionrights A may be exercised from April 1, 2000to October 31, 2004 and the option rights Bfrom April 1, 2002 to October 31, 2004. Ifexercised in full, the option rights will entitle tosubscription for a total of 450.000 shares,whereby the share capital would be increasedby a maximum amount of EUR 1.530.000representing approximately 1,8 per cent of theoutstanding share capital of Huhtamäki Oyj.Approximately 60 persons participate in theOption Rights 1997 Plan. Huhtamäki Oyj willapply for listing of the option rights A and B onthe Helsinki Exchanges as of April 1, 2002.
Option Rights 2000 PlanThe Annual General Meeting held on April 12,2000 approved the issue of up to 900.000option rights to certain members of themanagement of Huhtamäki Oyj and itssubsidiaries. The option rights are marked asfollows: 300.000 with A, 300.000 with B and300.000 with C. Each option right entitles itsholder to subscribe for one share. The optionrights marked with A may be exercised fromMay 2, 2002 to October 31, 2006, the optionrights marked with B from May 2, 2003 toOctober 31, 2006 and the option rights markedwith C from May 2, 2004 to October 31, 2006.Before the deduction of the year 2001 dividendthe aggregate subscription price for one sharefor the option rights A is EUR 34,61 and for theoption rights B EUR 28,46. The subscriptionprice for the shares under the option rightsmarked with C shall be the market value of theshare on the Helsinki Exchanges during theperiod of March 1 – March 28, 2002 addedwith such an amount that equals to ten per cent(10%) of the market value of the share. Ifexercised in full, the option rights will entitle tothe subscription for a total of 900.000 shareswhereby the share capital would be increasedby a maximum amount of EUR 3.060.000representing approximately 3,5 per cent of the
outstanding share capital of Huhtamäki Oyj.Approximately 100 persons participate in theOption Rights 2000 Plan. Huhtamäki Oyj willapply for listing of the option rights A on theHelsinki Exchanges as of May 2, 2002
GeneralShares subscribed for pursuant to option rightsshall entitle to the distribution of dividend forthe accounting period during which suchshares were subscribed and paid for. Right tovote and other shareholders’ rights attached tothe shares subscribed for under the optionrights shall become effective as of the date onwhich the share subscription is entered in theFinnish Trade Register.
Pursuant to the option rights issued, anaggregate maximum number of 1.350.000new shares may be subscribed representingapproximately 5,3 per cent of the total numberof votes on December 31, 2001. During theyear 2001 no new shares were subscribed byexercising the option rights.

Notes to the financial accounts 2726
15. CHANGES IN EQUITYGROUP PARENT COMPANY
EUR million 2001 2000 2001 2000Restricted equity:
Share capital January 1 107.0 106.0 107.0 106.0Bonus issue – 1.0 – 1.0Share repurchase -21.0 – -21.0 –Share capital December 31 86.0 107.0 86.0 107.0
Premium fund January 1 339.5 340.5 322.6 323.6Transfer from share capital 21.0 – 21.0 –Transfer to retained earnings -16.9 – – –Bonus issue – -1.0 – -1.0
Premium fund December 31 343.5 339.5 343.5 322.6
Consolidation difference January 1 71.8 44.7 – –Change 4.3 27.1 – –Consolidation difference December 31 76.1 71.8 – –
Total restricted equity 505.6 518.3 429.5 429.6
Non-restricted equity:Retained earnings January 1 472.1 422.4 215.4 253.1Changes in exchange rates 2.4 1.7 – –Reversal of revaluation -4.3 – -4.3 –Dividends -34.6 -33.1 -34.6 -33.1Share repurchase -207.6 – -207.6 –Transfer from premium fund 16.9 – – –Net income for the period 87.1 81.1 950.7 -4.6Retained earnings December 31 332.0 472.1 919.6 215.4
Transfers from untaxed reservesJanuary 1 42.1 44.5 – –Change -5.1 -2.4 – –December 31 37.0 42.1 – –
Total non-restricted equity 369.0 514.2 919.6 215.4
Minority interest:Minority interest January 1 85.9 87.7 – –Increase – 0.4 – –Minority interest for the year 6.6 6.4 – –Decrease -12.1 -8.6 – –Minority interest December 31 80.4 85.9 – –
Third-party interest includes EUR 63.9 million of preference shares in a Group company.
16. COMMITMENTS AND CONTINGENCIESGROUP PARENT COMPANY
EUR millionOperating lease payments:
2002 16.3 0.22003 and thereafter 44.6 0.3
Total 60.9 0.5
Capital expenditure commitments:2002 6.2 0.22003 and thereafter – –
Total 6.2 0.2
Mortgages:For own debt 7.0 0.2
Guarantee obligations:For subsidiaries – 938.4For associated companies – 0.4For external parties 1.1 1.1
17. MANAGEMENT OF FINANCIAL RISKSThe objective of the financial risk managementis to ensure that the company has access tosufficient funding in the most cost efficient wayand to minimize the impact on the companyfrom adverse movements in the financialmarkets.
The management of financial risks is guidedand controlled by a Finance Committee, led bythe CEO. Risk reports on the company’s interestbearing balance sheet items, commercial flowsand derivatives are reviewed and requiredmeasures approved by the Finance Committeeon a monthly basis.
The financial risks are managed centrally by the Treasury function at the Espooheadquarters. Huhtamäki Finance Oy, the in-house bank, is the centre point of thecompany’s funding and risk management,serving the business units in daily financing,foreign exchange transactions and cashmanagement co-ordination.
Currency riskThe company has production units in 35countries and is exposed to exchange rate riskthrough inter-company cross-border trade,exports and imports, funding of foreign unitsand currency denominated equities. Thelargest exposures derive from export androyalty receivables in USD and raw materialand trade imports in Australia, U.K. and Polandmainly from the Euro area. In inter-companycross-border trade, EUR is used in Europe andUSD elsewhere.
The objective of currency transaction riskmanagement is to identify exposures andprotect the company from negative exchangerate movements. Business units are in chargeof actively managing their currency risks
related to future commercial cash flows.Transaction exposures are managed accordingto policies and limits defined by the businessunit and approved by the Finance Committee.The net commercial position is monitored on a12-month rolling basis. Eligible hedginginstruments are currency forwards and inauthorized subsidiaries also currency options.Business units’ counterpart in hedgingtransactions is Huhtamäki Finance Oy.
As a main rule subsidiaries are financed inlocal currencies. In very high interest ratecountries business units have drawn loans alsoin other currencies, totalling EUR 5 million atbalance sheet date. The Finance Committeeapproves the borrowing currencies in eachcountry.
The equity changes arising from exchangerate movements in consolidation are reportedas a consolidation difference. The mainexposures derive from equities in US,Australian and U.K. subsidiaries. The companymay hedge its translation risks selectively byusing foreign currency loans and derivativestaking into account market functionality andhedging costs. Changes in EUR values of suchhedges are offset against the consolidationdifference. Equity hedging decisions are madeby the Finance Committee.
Interest rate riskThe interest bearing debt together with relatedhedging measures expose the company tointerest rate risk, namely re-pricing- and pricerisk caused by interest rate movements. Thecompany’s policy is to maintain in the maindebt currencies an average duration thatmatches a benchmark based on thecompany’s estimated cash flow, selectedbalance sheet ratios, business cyclicality andalso the shape and level of the yield curve. The
objective of interest rate risk management is tomaintain in the long term the lowest possibleaverage interest rate level for outstanding andestimated debt within the framework set by theinterest rate risk management policy.
The company manages interest rate risk byselection of debt interest periods and by usingderivatives such as futures, forward rateagreements, interest rate swaps and options.Of net debt after hedges in the main borrowingcurrencies EUR and USD, 42% and 48%respectively carried a fixed rate at balancesheet date. Management of interest rate risk iscentralized to the company’s Treasury.
Liquidity and re-financing riskThe company maintains sufficient liquidityreserves at all times by efficient cashmanagement structures such as cash poolsand concentration accounts managed by theTreasury and by maintaining overdraftfacilities. Excess cash is invested in liquidmoney market instruments or short-term bankdeposits. Funds are invested at banks, withwhich the company has credit facilities, or ingovernment bonds, treasury bills orcommercial papers of borrowers with a solidinvestment grade rating and selected Finnishcorporate issuers.
The company maintains unused committedcredit facilities to ensure financing resourcesunder all circumstances. In addition, thecompany has a EUR 350 M commercial paperprogram in Finland and uncommitted creditfacilities with relationship banks.
Re-financing risk is managed by maintaininga balanced maturity structure of credit facilities.The maturity structure of debt facilities isadapted to the estimated currency specific cashflow of the company.

Notes to the financial accounts 2928
FOREIGN EXCHANGE TRANSACTION EXPOSURE
EUR million 31.12.2001 31.12.2000Commercial Commercial
Currency Position PositionUSD 34 49PLN 32 15GBP 23 30AUD 21 27Other 62 35Total 172 155
CURRENCY SPLIT AND MATURITY STRUCTURE OF OUTSTANDING NET DEBT INCLUDING HEDGES
EUR million 31.12.2001 31.12.2000Rate
Amount Avg. Avg. sensitivity1) Debt repricing in period, incl. derivatives Amount Avg. Avg.Currency mEUR duration rate mEUR 2002 2003 2004 2005 2006 Later mEUR duration rateEUR 525 1.1 y 3.9% 3.3 363 12 50 50 50 701 0.8 y 5.3%USD 207 2.6 y 4.7% 0.1 93 18 7 40 18 31 415 0.8 y 6.8%AUD 48 0.9 y 6.7% 0.2 15 33 92 1.8 y 7.4%GBP 37 0.1 y 4.2% 0.3 37 77 0.2 y 6.2%Other 85 0.4 y 6.8% 0.5 81 2 1 1 78 0.3 y 8.2%Total 902 1.3 y 4.5% 4.4 589 65 58 90 68 32 1,363 0.8 y 6.1%1) Effect of one percentage point rise in market interest rates on Group’s net interest expenses over the following 12 months.
DEBT STRUCTURE
EUR million 31.12.2001 31.12.2000Amount Amount Maturity of facility/loan Amount Amount
Debt type drawn available Total 2002 2003 2004 2005 2006 Later drawn available TotalRevolving facilities 410 234 644 13 171 460 844 110 954Bank loans 191 191 102 61 6 22 258 258Private Placements 85 85 16 19 7 7 7 29 101 101Commercial Paper
Program 245 245 245 238 238Total 931 234 1,165 376 251 473 7 7 51 1,441 110 1,551
OUTSTANDING OFF-BALANCE SHEET INSTRUMENTS SUMMARY
EUR million 31.12.2001 31.12.2000Market Nominal value Maturity Structure Nominal value
Instrument value Gross Net 2002 2003 2004 2005 2006 Later Gross NetCurrency forwards
for transaction risk -0.5 68 68 498for financing purposes 0.8 57 57 481
Interest rate forwards and futures contractsEUR 0.0 40 40 40 320 200
Interest rate swapsEUR -1.5 150 150 50 50 50 100 100USD -1.4 57 57 11 35 11 56 13other -1.3 33 33 33 87 87

18. DEFERRED TAX ASSET/LIABILITYGROUP PARENT COMPANY
Deferred tax asset EUR million 2001 2000 2001 2000Due to consolidation 0.9 2.3 – –Due to timing differences 92.1 79.7 – –Total 93.0 82.0 – –
Deferred tax liabilityEUR million 2001 2000 2001 2000On untaxed reserves 15.1 12.6 – –Due to timing differencies 147.3 155.1 – –Total 162.4 167.7 – –
19. ACCRUED INCOMEGROUP PARENT COMPANY
EUR million 2001 2000 2001 2000Accrued interest and other financial items 3.7 62.3 0.2 0.1Prepayments 11.7 33.0 5.8 3.6Personnel, social security and pensions 1.3 2.4 0.3 0.3Rebates 2.5 2.1 0.4 0.6Accruals for income and other taxes 19.7 28.8 0.4 0.1Miscellaneous accrued income 23.8 15.7 6.5 6.5Accrued corporate income and prepaid expense – – 12.4 19.4Other 4.7 4.1 0.9 1.8
67.4 148.4 26.9 32.4Other short-term receivables 36.5 56.2 – –Accrued income and other short-term receivables 103.9 204.6 26.9 32.4
20. ACCRUED EXPENSESGROUP PARENT COMPANY
EUR million 2001 2000 2001 2000Accrued interest expense 9.2 27.9 2.1 12.3Personnel, social security and pensions 61.9 74.0 7.6 7.3Purchases of material 8.3 16.6 0.1 –Rebates 17.4 15.1 0.2 0.1Accrued income taxes 40.0 44.4 – 0.4Miscellaneous accrued expense 15.7 56.9 0.6 0.2Prepayments 0.7 4.1 – –Other accrued corporate expense – – 0.4 –Other 27.7 30.1 0.1 0.6Total 180.9 269.1 11.1 20.9
Net sales by business sectorEUR million 1997 % 1998 % 1999 % 2000 % 2001 %
Packaging 546.9 50.9 716.0 58.4 1,412.1 100.0 3,307.7 100.0 2,382.4 100.0Other1 527.4 49.1 510.1 41.6 – – – – – –Total 1,074.3 100.0 1,226.1 100.0 1,412.1 100.0 3,307.7 100.0 2,382.4 100.0
Operating earnings by business sectorEUR million 1997 % 1998 % 1999 % 2000 % 2001 %
Packaging 43.0 7.9 54.1 7.5 116.2 8.2 200.9 6.0 198.5 8.3Other1 44.3 8.4 30.0 5.9 -2.3 – -18.8 – -20.2 –Total 87.3 8.1 84.1 6.9 113.9 8.1 182.1 5.5 178.3 7.5
1 Unallocated costs and income; revenue from divested units.From 1999 onwards Packaging goodwill amortisation has been included in Other.

Board’s proposal & Auditors’ report 3130
proposal of the board of directors
On December 31, 2001, consolidated non-restricted equity amounted to EUR 331,993,881.30.
On December 31, 2001, Huhtamäki Oyj’s non-restricted equity was EUR 919,635,452.91of which the net income for the financial period was EUR 950,685,803.58.
The Board of Directors proposes distribution of the retained earnings as follows:
– to the shareholders EUR 1.25 a share 31,629,935.00– to be left in the non-restricted equity 887,005,517.91
919,635,452.91
The Board of Directors proposes that the payment of dividends will be made on April 9, 2002. The dividends will be paid to shareholders who on therecord date, April 2, 2002, are registered as shareholders in the register of shareholders.
Espoo, February 11, 2002
Veli Sundbäck Paavo Hohti Jean Philippe Deschamps
Mikael Lilius Anthony J.B. Simon Jukka Viinanen
Timo PeltolaCEO
TO THE SHAREHOLDERS OF HUHTAMÄKI OYJ
We have audited the accounting, the financial statements and thecorporate governance of Huhtamäki Oyj for the period 1.1.–31.12.2001.The financial statements, which include the report of the Board ofDirectors, consolidated and parent company income statements, balancesheets and notes to the financial statements, have been prepared by theBoard of Directors and the Managing Director. Based on our audit weexpress an opinion on these financial statements and on corporategovernance.
We have conducted the audit in accordance with Finnish Standards onAuditing. Those standards require that we perform the audit to obtainreasonable assurance about whether the financial statements are free ofmaterial misstatement. An audit includes examining on a test basisevidence supporting the amounts and disclosures in the financialstatements, assessing the accounting principles used and significantestimates made by the management as well as evaluating the overallfinancial statement presentation. The purpose of our audit of corporategovernance is to examine that the members of the Board of Directors andthe Managing Director have legally complied with the rules of theCompanies’ Act.
In our opinion the financial statements have been prepared in accordancewith the Accounting Act and other rules and regulations governing thepreparation of financial statements in Finland. The financial statements give a true and fair view, as defined in the Accounting Act, of both the
consolidated and parent company’s result of operations as well as of thefinancial position. The financial statements with the consolidated financialstatements can be adopted and the members of the Board of Directors and the Managing Director of the parent company can be discharged fromliability for the period audited by us. The proposal by the Board of Directorsregarding the distribution of retained earnings is in compliance with theCompanies Act.
Espoo, February 11, 2002
Esa KailialaAuthorized Public Accountant
Pekka PajamoAuthorized Public Accountant
auditors’ report

EUR million 1997 1998 1999 2000 2001Net sales 1,074.3 1,226.1 1,412.1 3,307.7 2,382.4Increase in net sales % -14.9 14.1 15.2 134.2 -28.0Net sales outside Finland 950.1 1,099.8 1,364.5 3,251.5 2.301.1
Earnings before interest, taxes,depreciation and amortisation 150.0 151.4 202.1 376.8 334.4
Earnings before interest, taxes,depreciation and amortisation/net sales % 14.0 12.3 14.4 11.4 14.0
Earnings before interest and taxes 87.3 84.1 113.9 182.1 178.3Earnings before interest and taxes/net sales % 8.1 6.9 8.1 5.5 7.5Profit before exceptional items 88.0 79.6 94.4 121.1 130.3Profit before exceptional items/net sales % 8.2 6.5 6.7 3.7 5.5Net income 69.3 61.4 101.8 81.1 87.1
Shareholders’ equity 686.2 680.5 958.1 1,032.5 874.6Return on investment % 12.9 10.6 10.4 8.7 9.6Return on shareholders’ equity % 10.4 8.8 9.4 7.8 8.6Solidity % 57.9 52.5 31.1 30.8 36.0Net debt to equity -0.04 0.28 1.09 1.22 0.94Current ratio 1.55 1.09 0.94 0.96 0.94Times interest earned .. 14.47 8.47 5.40 6.58
Capital expenditure 77.2 81.7 100.7 172.7 144.0Capital expenditure/net sales % 7.2 6.7 7.1 5.2 6.0Research and development 5.3 6.2 7.2 10.0 12.8Research and development/net sales % 0.5 0.5 0.5 0.3 0.5
Number of shareholders (December 31) 16,566 16,168 15,966 15,765 15,669Personnel (December 31) 9,974 11,024 23,876 23,098 16,417
per share data
1997 1998 1999 2000 2001Earnings per share EUR 2.55 2.29 2.39 2.58 2.971
Dividend, nominal EUR 1.01 1.01 1.05 1.10 1.252
Dividend/earnings per share % 39.5 44.1 43.9 42.7 42.02
Dividend yieldSeries K % 2.8 3.2 – – –3
Series I % 2.7 3.1 3.1 3.9 3.52
Shareholders’ equity per share EUR 25.63 25.32 30.44 32.80 34.56Share price at December 31
Series K EUR 36.83 31.96 – – –3
Series I EUR 37.84 32.63 33.60 28.40 35.50Average number of shares adjusted for share issue 26,748,354 26,835,736 27,964,032 31,475,963 29,279,424Number of shares adjusted for share issue at year end 26,775,896 26,874,746 31,475,963 31,475,963 25,303,948P/E ratio
Series K 14.3 13.7 – – –3
Series I 14.9 14.1 14.0 11.0 11.9Market capitalisation at December 31 EUR million 993.0 952.0 1,057.6 893.9 898.3
1 The dilutive effect of the stock option programs of 1997 and 2000 included: EUR 2.842 2001: Board’s proposal3 Series K and l combined on October 8, 1999
huhtamaki 1997–2001

comparison against 2000 pro forma
Comparison against 2000 pro forma 3332
INCOME STATEMENTChange
EUR million 2001 2000 Pro forma %Net sales 2,382.4 2,278.0 4.6EBITDA 334.4 296.6 12.7Operating profit (EBITA) 221.7 184.1 20.4EBIT 178.3 144.5 23.4% of net sales 7.5 6.3Net financial
+income/-expense -49.2 -27.6 -78.1+Gain/-loss on equity
of associated companies 1.1 0.9 24.0Profit before minority
interest and taxes 130.3 117.7 10.7Taxes 36.6 31.5 16.0Minority interest 6.6 6.1 8.2Net income 87.1 80.2 8.6
Earnings per share (before amortization) (EUR) 4.45 3.82 16.6Earning per share (after amortization) (EUR) 2.97 2.55 16.6
REGIONS – NET SALESChange
EUR million 2001 2000 Pro forma %Europe 1,179.1 1,202.5 -1.9Americas 825.7 624.5 32.2Asia–Oceania–Africa 377.6 451.0 -16.3Total 2,382.4 2,278.0 4.6
REGIONS – OPERATING PROFIT (EBITA) AND RONA % Change
EUR million 2001 2000 Pro forma %Europe 93.4 73.6 26.9% of net sales 7.9 6.1RONA % (12m roll.) 14.7 11.4
Americas 74.7 53.9 38.5% of net sales 9.0 8.6RONA % (12m roll.) 15.8 15.0
Asia–Oceania–Africa 30.4 31.6 -3.7% of net sales 8.1 7.0RONA % (12m roll.) 11.8 10.1
ChangeEUR million 2001 2000 Pro forma %Consumer Goods 1,295.7 1,283.5 1.0Food Service (including Fresh Foods) 1,086.7 994.5 9.3Total 2,382.4 2,278.0 4.6
CATEGORIES – OPERATING PROFIT (EBITA)Change
EUR million 2001 2000 Pro forma %Consumer Goods 93.0 79.4 17.1% of net sales 7.2 6.2Food Service (including Fresh Foods) 105.5 79.7 32.4% of net sales 9.7 8.0Total from operations 198.5 159.1 24.8% of net sales 8.3 7.0Corporate net 23.2 25.0 -7.2Total 221.7 184.1 20.4% of net sales 9.3 8.1
CATEGORIES – NET SALES

definitions for key indicators
Earnings per share =
Dividend yield =
Shareholders’ equity per share =
P/E ratio =
Market capitalisation =
Return on investment =
Return on shareholders’equity =
Net debt to equity =
Solidity =
Current ratio =
Times interest earned =
Profit before exceptional items, minority interest and taxes – minority interest – taxesAverage fully deluted number of shares
100 x issue-adjusted dividendIssue-adjusted share price at December 31
Equity + untaxed reserves – deferred tax and minority interest in untaxed reservesIssue-adjusted number of shares at December 31
Issue-adjusted share price at December 31Earnings per share
The number of shares issued in the different share series at December 31 multiplied by the corresponding share prices on the stock exchange
100 x (Profit before exceptional items, minority interest and taxes + interest expenses + other financial expenses) Balance sheet total – interest-free liabilities (average)
100 x (Profit before exceptional items, minority interest and taxes – taxes)Equity + minority interest + untaxed reserves – deferred tax in untaxed reserves (average)
Interest bearing net debtEquity + minority interest + untaxed reserves – deferred tax in untaxed reserves
100 x (equity + minority interest + untaxed reserves – deferred tax in untaxed reserves)Balance sheet total – advances received
Current assetsCurrent liabilities
Earnings before interest and taxes + depreciation and amortisationNet interest expenses

for notes:
Länsituulentie 7, FIN–02100 Espoo, FinlandTel. +358 9 686 881, Fax +358 9 660 622
Business Identity Code: 0140879–6
www.huhtamaki.com