otter tail corporation - south dakota public … · (yes€ o€no€þ) ... 4 and 5 filed on...
TRANSCRIPT

SECURITIES AND EXCHANGE COMMISSION Washington, D.C. 20549
FORM 10-K (Mark One)
For the fiscal year ended December 31, 2008
For the transition period from to
Commission File Number 0-368
OTTER TAIL CORPORATION (Exact name of registrant as specified in its charter)
Registrant’s telephone number, including area code: 866-410-8780
Securities registered pursuant to Section 12(b) of the Act:
Securities registered pursuant to Section 12(g) of the Act: CUMULATIVE PREFERRED SHARES, without par value
Indicate by check mark if the registrant is a well-known seasoned issuer, as defined in Rule 405 of the Securities Act. (Yes þ No o)
Indicate by check mark if the registrant is not required to file reports pursuant to Section 13 or Section 15(d) of the Act. (Yes o No þ)
Indicate by check mark whether the registrant (1) has filed all reports required to be filed by Section 13 or 15(d) of the Securities Exchange Act of 1934 during the preceding 12 months (or for such shorter period that the registrant was required to file such reports), and (2) has been subject to such filing requirements for the past 90 days. (Yes þ No o)
Indicate by check mark if disclosure of delinquent filers pursuant to Item 405 of Regulation S-K is not contained herein and will not be contained, to the best of the registrant’s knowledge, in definitive proxy or information statements incorporated by reference in Part III of this Form 10-K or any amendment to this Form 10-K. þ
Indicate by check mark whether the registrant is a large accelerated filer, an accelerated filer, a non-accelerated filer or a smaller reporting company. See the definitions of “large accelerated filer,” “accelerated filer” and “smaller reporting company” in Rule 12b-2 of the Exchange Act. (Check one):
Indicate by check mark whether the registrant is a shell company (as defined in Rule 12b-2 of the Exchange Act). (Yes o No þ)
The aggregate market value of common stock held by non-affiliates, computed by reference to the last sales price on June 30, 2008 was $1,156,006,973.
OTTR 10-K 12/31/2008
Section 1: 10-K (FORM 10-K)
þ Annual Report pursuant to Section 13 or 15(d) of the Securities Exchange Act of 1934
o Transition Report pursuant to Section 13 or 15(d) of the Securities Exchange Act of 1934
MINNESOTA
(State or other jurisdiction of incorporation or organization) 41-0462685
(I.R.S. Employer Identification No.)
215 SOUTH CASCADE STREET, BOX 496, FERGUS FALLS, MINNESOTA
(Address of principal executive offices)
56538-0496 (Zip Code)
Title of each class Name of each exchange on which registered
COMMON SHARES, par value $5.00 per share The NASDAQ Stock Market LLC
Large accelerated filer þ Accelerated filer o Non-accelerated filer o (Do not check if a smaller reporting company)
Smaller reporting company o

Indicate the number of shares outstanding of each of the registrant’s classes of common stock, as of the latest practicable date: 35,408,233 Common Shares ($5 par value) as of February 13, 2009.
Documents Incorporated by Reference: 2008 Annual Report to Shareholders-Portions incorporated by reference into Parts I and II Proxy Statement for the 2009 Annual Meeting-Portions incorporated by reference into Part III
PART I
Item 1. BUSINESS
(a) General Development of Business
Otter Tail Power Company was incorporated in 1907 under the laws of the State of Minnesota. In 2001, the name was changed to “Otter Tail Corporation” (the Company) to more accurately represent the broader scope of electric and nonelectric operations and the name “Otter Tail Power Company” was retained for use by the electric utility. The Company’s executive offices are located at 215 South Cascade Street, P.O. Box 496, Fergus Falls, Minnesota 56538-0496 and 4334 18th Avenue SW, Suite 200, P.O. Box 9156, Fargo, North Dakota 58106-9156. Its telephone number is (866) 410-8780.
The Company makes available free of charge at its internet website (www.ottertail.com) its annual reports on Form 10-K, quarterly reports on Form 10-Q, current reports on Form 8-K, Forms 3, 4 and 5 filed on behalf of directors and executive officers and any amendments to these reports filed or furnished pursuant to Section 13(a) or 15(d) of the Securities Exchange Act of 1934, as soon as reasonably practicable after such material is electronically filed with or furnished to the Securities and Exchange Commission. Information on the Company’s website is not deemed to be incorporated by reference into this Annual Report on Form 10-K.
In the late 1980s, the Company determined its core electric business was located in a region of the country where there was little growth in the demand for electricity. In order to maintain growth for shareholders, the Company began to explore opportunities for the acquisition and long-term ownership of nonelectric businesses. This strategy has resulted in steady revenue growth over the years.
The Company’s strategy is to continue to develop a core regulated electric utility combined with a diversified multi-industry platform. Reliable utility performance combined with growth opportunities at all its businesses provides long-term value. Growing the Company’s core electric utility business provides a strong base of revenues, earnings and cash flows. The Company looks to its nonelectric operating companies to provide organic growth as well. Organic, internal growth comes from new products and services, market expansion and increased efficiencies. The Company expects much of its growth in the next few years will come from major capital investment at its existing companies. The Company also expects to grow through acquisition and adheres to strict guidelines when reviewing acquisition candidates. The Company’s aim is to add companies that will produce an immediate positive impact on earnings and provide long-term growth potential. The Company believes that owning well-run, profitable companies across different industries will bring more growth opportunities and more balance to its results. In doing this, the Company also avoids concentrating business risk within a single industry. All of the Company’s operating companies operate under a decentralized business model with disciplined corporate oversight.
The Company assesses the performance of its operating companies over time, using the following criteria:
The Company is a committed long-term owner, and therefore does not acquire companies in pursuit of short-term gains. However, the Company may divest operating companies that no longer fit into the Company’s strategy over the long term.
1
• ability to provide returns on invested capital that exceed the Company’s weighted average cost of capital over the long term; and
• assessment of an operating company’s business and potential for future earnings growth.

Otter Tail Corporation and its subsidiaries conduct business in all 50 states and in international markets. The Company had approximately 4,166 full-time employees at December 31, 2008. The businesses of the Company have been classified into six segments: Electric, Plastics, Manufacturing, Health Services, Food Ingredient Processing and Other Business Operations.
The Company’s corporate operating costs, which include corporate staff and overhead costs, the results of the Company’s captive insurance company and other items, are excluded from the measurement of operating segment performance. Corporate assets consist primarily of cash, prepaid expenses, investments and fixed assets.
The Company’s electric operations, including wholesale power sales, are operated as a division of Otter Tail Corporation, and the Company’s energy services operation is operated as a subsidiary of Otter Tail Corporation. Substantially all of the other businesses are owned by the Company’s wholly owned subsidiary, Varistar Corporation (Varistar).
2
• Electric (the Utility) includes the production, transmission, distribution and sale of electric energy in Minnesota, North Dakota and South Dakota under the name Otter Tail Power Company. In addition, the Utility is an active wholesale participant in the Midwest Independent Transmission System Operator (MISO) markets. The electric utility operations have been the Company’s primary business since incorporation.
• Plastics consist of businesses producing polyvinyl chloride (PVC) pipe in the Upper Midwest and Southwest regions of the United States.
• Manufacturing consists of businesses in the following manufacturing activities: production of wind towers, contract machining, metal parts stamping and fabrication, and production of waterfront equipment, material and handling trays and horticultural containers. These businesses have manufacturing facilities in Florida, Illinois, Minnesota, Missouri, North Dakota, Oklahoma and Ontario, Canada and sell products primarily in the United States.
• Health Services consists of businesses involved in the sale of diagnostic medical equipment, patient monitoring equipment and related supplies and accessories. These businesses also provide equipment maintenance, diagnostic imaging services and rental of diagnostic medical imaging equipment to various medical institutions located throughout the United States.
• Food Ingredient Processing consists of Idaho Pacific Holdings, Inc. (IPH), which owns and operates potato dehydration plants in Ririe, Idaho; Center, Colorado; and Souris, Prince Edward Island, Canada. IPH produces dehydrated potato products that are sold in the United States, Canada and other countries. Approximately 25% of IPH’s sales in 2008 were to customers outside of the United States.
• Other Business Operations consists of businesses in residential, commercial and industrial electric contracting industries, fiber optic and electric distribution systems, wastewater and HVAC systems construction, transportation and energy services. These businesses operate primarily in the Central United States, except for the transportation company which operates in 48 states and four Canadian provinces.

The Company considers the following guidelines when reviewing potential acquisition candidates:
The Company continues to look for strategic acquisitions of additional businesses with emphasis on adding to existing operating companies and expects continued growth in this area.
On May 1, 2008 the Company’s wholly owned subsidiary, BTD Manufacturing, Inc. (BTD), acquired the assets of Miller Welding & Iron Works, Inc. (Miller Welding) of Washington, Illinois for $41.7 million in cash. Miller Welding, a custom job shop fabricator and finisher, recorded $26 million in revenue in 2007. Miller Welding manufactures and fabricates parts for off-road equipment, mining machinery, oil fields and offshore oil rigs, wind industry components, broadcast antennae and farm equipment, and serves several major equipment manufacturers in the Peoria, Illinois area and nationwide, including Caterpillar, Komatsu and Gardner Denver. This acquisition will provide opportunities for growth in new and existing markets for both BTD and Miller Welding, and complementing production capabilities will expand the scope and capacity of services offered by both companies.
The Company made significant investments in its existing operating companies in 2008 in order to drive organic growth in the coming years. Capital expenditures exclusive of acquisitions totaled $266 million, including expenditures for the Utility’s portion of the Langdon and Ashtabula Wind Energy Centers, and expansion of DMI Industries, Inc.’s (DMI) wind tower manufacturing facilities in West Fargo, North Dakota and Tulsa, Oklahoma.
For a discussion of the Company’s results of operations, see “Management’s Discussion and Analysis of Financial Condition and Results of Operations,” which is incorporated by reference to pages 19 through 37 of the Company’s 2008 Annual Report to Shareholders, filed as an Exhibit hereto.
(b) Financial Information About Industry Segments
The Company is engaged in businesses that have been classified into six segments: Electric, Plastics, Manufacturing, Health Services, Food Ingredient Processing and Other Business Operations. Financial information about the Company’s segments and geographic areas is incorporated by reference to note 2 of “Notes to Consolidated Financial Statements” on pages 49 through 51 of the Company’s 2008 Annual Report to Shareholders, filed as an Exhibit hereto.
3
• Emerging or middle market company;
• Proven entrepreneurial management team that will remain after the acquisition;
• Preference for 100% ownership of the acquired company;
• Products and services intended for commercial rather than retail consumer use; and
• The potential to provide immediate earnings and future growth.

(c) Narrative Description of Business
ELECTRIC
General
The Utility provides electricity to more than 129,000 customers in a 50,000 square mile area of Minnesota, North Dakota and South Dakota. The Company derived 26%, 26% and 28% of its consolidated operating revenues from the Electric segment for each of the three years ended December 31, 2008, 2007 and 2006, respectively. The Company derived 95%, 45% and 48% of its consolidated income from continuing operations from the Electric segment for each of the three years ended December 31, 2008, 2007 and 2006, respectively. The breakdown of retail revenues by state is as follows:
The territory served by the Utility is predominantly agricultural. Although there are relatively few large customers, sales to commercial and industrial customers are significant. The following table provides a breakdown of electric revenues by customer category. All other sources include gross wholesale sales from Utility generation, net revenue from energy trading activity and sales to municipalities.
Wholesale electric energy kilowatt-hour (kWh) sales were 38.7% of total kWh sales for 2008 and 28.6% for 2007. Wholesale electric energy kWh sales increased by 62.7% between the years while revenue per kWh increased by 3.0%. Activity in the short-term energy market is subject to change based on a number of factors and it is difficult to predict the quantity of wholesale power sales or prices for wholesale power in the future.
With the inception of the MISO Day 2 markets in April 2005, MISO introduced two new types of contracts, virtual transactions and Financial Transmission Rights (FTR). Virtual transactions are of two types: Virtual Demand Bid, which is a bid to purchase energy in MISO’s Day-Ahead Market that is not backed by physical load, and Virtual Supply Offer, which is an offer submitted by a market participant in the Day-Ahead Market to sell energy not supported by a physical injection or reduction in withdrawals in commitment by a resource. An FTR is a financial contract that entitles its holder to a stream of payments, or charges, based on transmission congestion charges calculated in MISO’s Day-Ahead Market. A market participant can acquire an FTR from several sources: the annual or monthly FTR auction, the FTR secondary market or a grant of an FTR in conjunction with a transmission service request. An FTR is structured to hedge a market participant’s exposure to uncertain cash flows resulting from congestion of the transmission system. In 2008, net revenues from virtual and FTR transactions represented 0.3% of total electric energy revenues compared with 0.1% in 2007. As the MISO markets have evolved and become more efficient, profits from virtual transactions have declined.
4
State 2008 2007
Minnesota 50.2% 49.7%North Dakota 40.4 40.8 South Dakota 9.4 9.5
Total 100.0% 100.0%
Customer category 2008 2007
Commercial 35.9% 36.3%Residential 30.6 30.4 Industrial 23.1 23.1 All other sources 10.4 10.2
Total 100.0% 100.0%
The aggregate population of the Utility’s retail electric service area is approximately 230,000. In this service area of 423 communities and adjacent rural areas and farms, approximately 130,900 people live in communities having a population of more than 1,000, according to the 2000 census. The only communities served which have a population in excess of 10,000 are Jamestown, North Dakota (15,527); Fergus Falls, Minnesota (13,471); and Bemidji, Minnesota (11,917). As of December 31, 2008 the Utility served 129,268 customers.
Capability and Demand
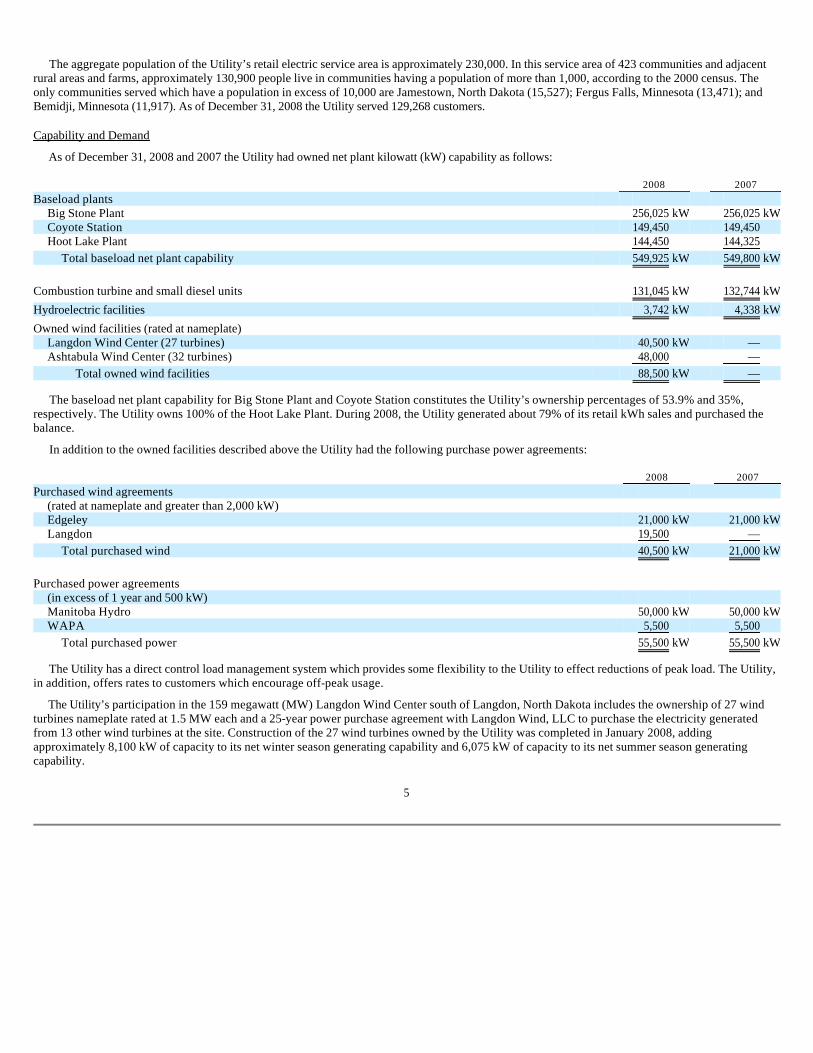
As of December 31, 2008 and 2007 the Utility had owned net plant kilowatt (kW) capability as follows:
The baseload net plant capability for Big Stone Plant and Coyote Station constitutes the Utility’s ownership percentages of 53.9% and 35%, respectively. The Utility owns 100% of the Hoot Lake Plant. During 2008, the Utility generated about 79% of its retail kWh sales and purchased the balance.
In addition to the owned facilities described above the Utility had the following purchase power agreements:
The Utility has a direct control load management system which provides some flexibility to the Utility to effect reductions of peak load. The Utility, in addition, offers rates to customers which encourage off-peak usage.
The Utility’s participation in the 159 megawatt (MW) Langdon Wind Center south of Langdon, North Dakota includes the ownership of 27 wind turbines nameplate rated at 1.5 MW each and a 25-year power purchase agreement with Langdon Wind, LLC to purchase the electricity generated from 13 other wind turbines at the site. Construction of the 27 wind turbines owned by the Utility was completed in January 2008, adding approximately 8,100 kW of capacity to its net winter season generating capability and 6,075 kW of capacity to its net summer season generating capability.
5
2008 2007
Baseload plants Big Stone Plant 256,025 kW 256,025 kWCoyote Station 149,450 149,450 Hoot Lake Plant 144,450 144,325
Total baseload net plant capability 549,925 kW 549,800 kW
Combustion turbine and small diesel units 131,045 kW 132,744 kW
Hydroelectric facilities 3,742 kW 4,338 kW
Owned wind facilities (rated at nameplate) Langdon Wind Center (27 turbines) 40,500 kW — Ashtabula Wind Center (32 turbines) 48,000 —
Total owned wind facilities 88,500 kW —
2008 2007
Purchased wind agreements (rated at nameplate and greater than 2,000 kW) Edgeley 21,000 kW 21,000 kWLangdon 19,500 —
Total purchased wind 40,500 kW 21,000 kW
Purchased power agreements
(in excess of 1 year and 500 kW) Manitoba Hydro 50,000 kW 50,000 kWWAPA 5,500 5,500
Total purchased power 55,500 kW 55,500 kW
In 2008, the Utility took ownership of 32 wind turbines at the 200 MW Ashtabula Wind Center under construction in Barnes County, North Dakota. The 32 wind turbines, nameplate rated at 1.5 MW each, became commercially operational in November 2008, adding approximately 9,600 kW of capacity to the Utility’s net winter season generating capability and 7,200 kW of capacity to its net summer season generating capability.
The Utility traditionally experiences its peak system demand during the winter season. For the year ended December 31, 2008 the Utility experienced a system peak demand of 765,000 kW on December 22, 2008, which was also the highest all-time system peak demand (as reported to Mid-Continent Area Power Pool). Taking into account additional capacity available to it on December 22, 2008 under purchase power contracts (including short-term arrangements), as well as its own generating capacity, the Utility’s capability of then meeting system demand, excluding reserve requirements computed in accordance with accepted industry practice, amounted to 959,660 kW (861,920 kW if reserve requirements are included). The Utility’s additional capacity available under power purchase contracts (as described above), combined with generating capability and load management control capabilities, is expected to meet 2009 system demand, including industry reserve requirements.
Big Stone II
On June 30, 2005 the Utility and a coalition of six other electric providers entered into several agreements for the development of a second electric generating unit, named Big Stone II, at the site of the existing Big Stone Plant near Milbank, South Dakota. The three primary agreements are the Participation Agreement, the Operation and Maintenance Agreement and the Joint Facilities Agreement. Central Minnesota Municipal Power Agency, Great River Energy, Heartland Consumers Power District, Montana-Dakota Utilities Co., a Division of MDU Resources Group, Inc., Southern Minnesota Municipal Power Agency and Western Minnesota Municipal Power Agency are parties to all three agreements. In September 2007, Great River Energy and Southern Minnesota Municipal Power Agency withdrew from the project. The five remaining project participants decided to downsize the proposed plant’s nominal generating capacity from 630 MW to between 500 and 580 MW. New procedural schedules were established in the various project-related proceedings, which take into consideration the optimal plant configuration decided on by the remaining participants. NorthWestern Corporation, one of the co-owners of the existing Big Stone Plant, is an additional party to the Joint Facilities Agreement.
The Participation Agreement is an agreement to jointly develop, finance, construct, own (as tenants in common) and manage the Big Stone II Plant. The Participation Agreement includes provisions which obligate the parties to the agreement to obtain financing and pay their share of development, construction, operating and maintenance costs for the Big Stone II Plant. It also provides for the sharing of the plant output. Estimated construction costs for the plant including transmission are expected to be between $1.5 billion and $1.7 billion depending upon the size of unit constructed. The Participation Agreement provides that the Utility shall pay for and own approximately a 120 MW share of the Big Stone II Plant and be entitled to a corresponding interest in the plant’s electrical output. The project participants included in the Participation Agreement a section covering withdrawal rights due to higher than anticipated project costs. Higher than anticipated project costs give each participant certain withdrawal rights exercisable at an agreed upon time. Under amendments to the Participation Agreement entered into in 2007, the agreed upon time has been extended to be 60 days after the later of receipt of the written Minnesota Public Utilities Commission (MPUC) Order regarding the Transmission Certificate of Need or receipt of a Prevention of Significant Deterioration (PSD) air permit from the South Dakota Board of Minerals and Environment. The Participation Agreement establishes a Coordinating Committee and an Engineering and Operating Committee to manage the development, design, construction, operation and maintenance of the Big Stone II Plant.
6
The Operation and Maintenance Agreement designates the Utility as the operator of the Big Stone II Plant. As operator, the Utility is required to provide staff and resources for the development, design, financing, construction and operation of the Big Stone II Plant. The other project participants are each required to reimburse the Utility for their respective share of the costs relating to those activities. The Coordinating Committee and the Engineering and Operating Committee, which are made up of representatives of all project participants, are authorized to supervise the Utility in its role as operator.
The Joint Facilities Agreement, which provided for the transfer of certain real property and easements from the Big Stone I Plant owners to the Big Stone II Plant participants and for the shared use of certain equipment and facilities between the two plants, terminated automatically on January 1, 2009 as a result of the project not reaching financial close. The Joint Facilities Agreement also allocated between the two plants the costs of operation and maintenance of the shared equipment and facilities. The Big Stone I Plant owners and Big Stone II Plant participants expect to put a new Joint Facilities Agreement in place during 2009.
The proposed project is intended to serve the participants’ native customer loads and is expected to be part of the Utility’s regulated rate base. The project will be nominally rated between 500 and 580 MW, and it will be coal fired. The proposed project is expected to meet air emission requirements as prescribed by the Environmental Protection Agency (EPA) and the South Dakota Department of Environment and Natural Resources. Black & Veatch Corporation, a Kansas City based engineering firm, has been selected to do the plant design work and provide construction management services.
The participants have secured the permits required for construction and operation of the project, including the plant site permit, and are in the process of securing air quality permits and certificate of need and route permits for transmission. The federal Environmental Impact Statement (EIS) process led by the Western Area Power Administration (WAPA) continues to move forward. WAPA and its third party subcontractor continue to develop the Final EIS, which will include comments on the Draft EIS and the Supplemental Draft EIS, and responses to those comments. WAPA will develop a Record of Decision (ROD) following internal review and approval of the Final EIS. The Utility anticipates publication of the ROD in the Federal Register in the second quarter of 2009.
For more information regarding the status of the permitting process of the Big Stone II project, see “General Regulation” and “Environmental Regulation.”
Whether Big Stone II is completed will depend on how the conditions are ultimately written in the Certificate of Need order by the MPUC, if the EIS permit is obtained, if financing can be obtained and whether or not shareholders of the Company will be given an opportunity for reasonable returns.
Financial close, which requires the participants to provide binding financial commitments to support their share of costs, is to occur 90 days after the EIS ROD.
As of December 31, 2008 the Utility capitalized $11.6 million in costs related to the planned construction of Big Stone II. If the project is abandoned for permitting or other reasons, a portion of these capitalized costs and others incurred in future periods may be subject to expense and may not be recoverable.
Fuel Supply
Coal is the principal fuel burned at the Big Stone, Coyote and Hoot Lake generating plants. Coyote Station, a mine-mouth facility, burns North Dakota lignite coal. Hoot Lake and Big Stone plants burn western subbituminous coal.
7

The following table shows the sources of energy used to generate the Utility’s net output of electricity for 2008 and 2007:
The Utility has the following primary coal supply agreements:
The contract with Dakota Westmoreland Corporation has a 5 to 15-year renewal option subject to certain contingencies. It is the Utility’s practice to maintain a minimum 30-day inventory (at full output) of coal at the Big Stone Plant and a 20-day inventory at the Coyote Station and Hoot Lake Plant.
Railroad transportation services to the Big Stone Plant and Hoot Lake Plant are provided under a common carrier rate by the BNSF Railway. The common carrier rate is subject to a mileage-based methodology to assess a fuel surcharge. The basis for the fuel surcharge is the U.S. average price of retail on-highway diesel fuel. No coal transportation agreement is needed for the Coyote Station due to its location next to a coal mine.
The average cost of coal consumed (including handling charges to the plant sites) per million British Thermal Unit for each of the three years 2008, 2007 and 2006 was $1.678, $1.486 and $1.419, respectively.
The Utility is permitted by the State of South Dakota to burn some alternative fuels, including tire-derived fuel and biomass, at the Big Stone Plant.
8
2008 2007 Net Kilowatt % of Total Net Kilowatt % of Total Hours Kilowatt Hours Kilowatt Generated Hours Generated Hours
Sources (Thousands) Generated (Thousands) Generated
Subbituminous Coal 2,613,060 67.7% 2,273,799 67.1%Lignite Coal 1,016,828 26.4 1,032,449 30.5 Hydro and Renewables 177,250 4.6 20,537 .6 Natural Gas and Oil 48,957 1.3 59,256 1.8 Total 3,856,095 100.0% 3,386,041 100.0%
Plant Coal Supplier Type of Coal Expiration Date
Big Stone Plant Kennecott Coal Sales Company Wyoming subbituminous December 31, 2010Hoot Lake Plant Kennecott Coal Sales Company Wyoming subbituminous December 31, 2010Coyote Station Dakota Westmoreland Corporation North Dakota lignite May 4, 2016

General Regulation
The Utility is subject to regulation of rates and other matters in each of the three states in which it operates and by the federal government for certain interstate operations.
A breakdown of electric rate regulation by each jurisdiction is as follows:
The Utility operates under approved retail electric tariffs in all three states it serves. The Utility has an obligation to serve any customer requesting service within its assigned service territory. Accordingly, the Utility has designed its electric system to provide continuous service at times of peak usage. The pattern of electric usage can vary dramatically during a 24-hour period and from season to season. The Utility’s tariffs provide for continuous electric service and are designed to cover the costs of service during peak times. To the extent that peak usage can be reduced or shifted to periods of lower usage, the cost to serve all customers is reduced. In order to shift usage from peak times, the Utility has approved tariffs in all three states for lower rates for residential demand control, real-time pricing and controlled service and in North Dakota and South Dakota for bulk interruptible rates. Each of these specialized rates is designed to improve efficient use of the Utility resources, while giving customers more control over the size of their electric bill. In all three states, the Utility has approved tariffs which allow qualifying customers to release and sell energy back to the Utility when wholesale energy prices make such transactions desirable.
The majority of the Utility’s electric retail rate schedules now in effect provide for adjustments in rates based on the cost of fuel delivered to the Utility’s generating plants, as well as for adjustments based on the cost of electric energy purchased by the Utility. Such adjustments are presently based on a two-month moving average in Minnesota and by the Federal Energy Regulatory Commission (FERC), a three-month moving average in South Dakota and a four-month moving average in North Dakota. These adjustments are applied to the next billing period after becoming applicable.
The following summarizes the material regulations of each jurisdiction applicable to the Utility’s electric operations, as well as any specific electric rate proceedings during the last three years with the Minnesota Public Utilities Commission (MPUC), the North Dakota Public Service Commission (NDPSC), the South Dakota Public Utilities Commission (SDPUC) and the FERC. The Company’s nonelectric businesses are not subject to direct regulation by any of these agencies.
Minnesota: Under the Minnesota Public Utilities Act, the Utility is subject to the jurisdiction of the MPUC with respect to rates, issuance of securities, depreciation rates, public utility services, construction of major utility facilities, establishment of exclusive assigned service areas, contracts and arrangements with subsidiaries and other affiliated interests, and other matters. The MPUC has the authority to assess the need for large energy facilities and to issue or deny certificates of need, after public hearings, within one year of an application to construct such a facility.
9
2008 2007 % of % of % of % of Electric kWh Electric kWhRates Regulation Revenues Sales Revenues Sales
MN retail sales MN Public Utilities Commission 32.6% 31.7% 37.1% 34.5% ND retail sales ND Public Service Commission 26.3 23.4 30.4 25.8 SD retail sales SD Public Utilities Commission 6.1 6.2 7.1 6.4 Transmission & wholesale Federal Energy Regulatory Commission 35.0 38.7 25.4 33.3 100.0% 100.0% 100.0% 100.0%

The Minnesota Office of Energy Security (MNOES), part of the Minnesota Department of Commerce (MNDOC), is responsible for investigating all matters subject to the jurisdiction of the MNDOC or the MPUC, and for the enforcement of MPUC orders. Among other things, the MNDOC is authorized to collect and analyze data on energy and the consumption of energy, develop recommendations as to energy policies for the governor and the legislature of Minnesota and evaluate policies governing the establishment of rates and prices for energy as related to energy conservation. The MNOES acts as a state advocate in matters heard before the MPUC. The MNDOC also has the power, in the event of energy shortage or for a long-term basis, to prepare and adopt regulations to conserve and allocate energy.
In an order issued by the MPUC on August 1, 2008 the Utility was granted an increase in Minnesota retail electric rates of $3.8 million or approximately 2.9%, compared with the originally requested increase of approximately 6.7%. An interim rate increase of 5.4% went into effect on November 30, 2007. The Utility will refund Minnesota customers the difference between interim rates and final rates, with interest, in March 2009. Amounts refundable totaling $3.9 million have been recorded as a liability on the Company’s consolidated balance sheet as of December 31, 2008. The MPUC approved a rate of return on equity of 10.43% on a capital structure with 50.0% equity. The Utility deferred recognition of $1.5 million in rate case-related filing and administrative costs in June 2008 that are subject to amortization and recovery over three years under new rates as ordered by the MPUC. As a result of an MPUC decision on reconsideration of the treatment of profit margins on the resale of electricity purchased from other companies, the Utility will assign an amount of its costs to this unregulated activity but will not be required to credit any portion of nonasset-based margins to retail customers.
Under Minnesota law, every regulated public utility that furnishes electric service must make annual investments and expenditures in energy conservation improvements, or make a contribution to the state’s energy and conservation account, in an amount equal to at least 1.5% of its gross operating revenues from service provided in Minnesota. The Next Generation Energy Act of 2007, passed by the Minnesota legislature in May 2007, transitions from a conservation spending goal to a conservation energy savings goal. A statewide energy conservation goal of 1.5% of the historical three year weather normalized average megawatt hour (mWh) retail sales was set for 2010. The Utility filed its plan to achieve these goals on June 1, 2008 for implementation in 2009 and 2010.
The MNOES may require a utility to make investments and expenditures in energy conservation improvements whenever it finds that the improvement will result in energy savings at a total cost to the utility less than the cost to the utility to produce or purchase an equivalent amount of a new supply of energy. Such MNOES orders can be appealed to the MPUC. Investments made pursuant to such orders generally are recoverable costs in rate cases, even though ownership of the improvement may belong to the property owner rather than the utility. Since 1995, the Utility has recovered conservation related costs not included in base rates under Minnesota’s Conservation Improvement Programs through the use of an annual recovery mechanism approved by the MPUC.
Minnesota law requires utilities to submit to the MPUC for approval a 15-year advance integrated resource plan (IRP). The MPUC’s findings of fact and conclusions regarding resource plans shall be considered prima facie evidence, subject to rebuttal, in certificate of need hearings, rate reviews and other proceedings. Typically, the filings are submitted every two years. The Utility submitted its most recent IRP on July 1, 2005. On June 5, 2008 the MPUC deferred approval of the Utility’s 2006-2020 IRP. The addition of 160 MW of wind generation in the IRP was approved early in 2007 and, on January 15, 2009, the MPUC approved the Utility’s 2006-2020 IRP in its entirety. As of the date of this report, the MPUC had not issued a written order reflecting its decision. This 2006-2020 IRP includes new renewable wind generation and significant demand-side management, including conservation, new baseload including the proposed Big Stone II power plant, natural gas-fired peaking plants and wholesale energy purchases. The
10

delays in approval of the Big Stone II transmission Certificate of Need in Minnesota and issuance of required permits may delay the availability of Big Stone II as a generation resource. Also the Utility has experienced more rapid load growth than was expected since originally filing the IRP in 2005. The Utility is assessing ways in which to address this potential near-term generation shortfall and has requested authority from the MPUC to immediately acquire up to 110 MW of peaking capacity. The MPUC committed to expediting a decision on this request. The Utility will be required to file its next IRP before the end of 2009.
The Minnesota legislature has enacted a statute that favors conservation over the addition of new resources. In addition, it has mandated the use of renewable resources where new supplies are needed, unless the utility proves that a renewable energy facility is not in the public interest. It has effectively prohibited the building of new nuclear facilities. An existing environmental externality law requires the MPUC, to the extent practicable, to quantify the environmental costs associated with each method of electricity generation, and to use such monetized values in evaluating resource plans. The MPUC must disallow any nonrenewable rate base additions (whether within or outside of the state) or any rate recovery therefrom, and may not approve any nonrenewable energy facility in an integrated resource plan, unless the utility proves that a renewable energy facility is not in the public interest. The state has prioritized the acceptability of new generation with wind and solar ranked first and coal and nuclear ranked fifth, the lowest ranking.
In February 2007, the Minnesota legislature passed a renewable energy standard requiring the Utility to generate or procure sufficient renewable generation such that the following percentages of total retail electric sales to Minnesota customers come from qualifying renewable sources: 12% by 2012; 17% by 2016; 20% by 2020 and 25% by 2025. Under certain circumstances and after consideration of costs and reliability issues, the MPUC may modify or delay implementation of the standards. The Utility has acquired renewable resources and expects to acquire additional renewable resources in order to maintain compliance with the Minnesota renewable energy standard. By the end of 2010, the Utility expects to have sufficient renewable energy resources available to comply with the required 2012 level of the Minnesota renewable energy standard. The Utility’s compliance with the Minnesota renewable energy standard will be measured through the Midwest Renewable Energy Tracking System.
Under the Next Generation Energy Act of 2007, an automatic adjustment mechanism was established to allow Minnesota electric utilities to recover investments and costs incurred to satisfy the requirements of the renewable energy standards. The MPUC is now authorized to approve a rate schedule rider to enable utilities to recover the costs of qualifying renewable energy projects that supply renewable energy to Minnesota customers. Cost recovery for qualifying renewable energy projects can now be authorized outside of a rate case proceeding provided that such renewable projects have received previous MPUC approval. Renewable resource costs eligible for recovery may include return on investment, depreciation, operation and maintenance costs, taxes, renewable energy delivery costs and other related expenses.
In an order issued on August 15, 2008, the MPUC approved the Utility’s proposal to implement a Renewable Resource Cost Recovery Rider for its Minnesota jurisdictional portion of investment in renewable energy facilities. The rider enables the Utility to recover from its Minnesota retail customers its investments in owned renewable energy facilities and provides for a return on those investments. The Renewable Resource Adjustment of 0.19 cents per kWh was included on Minnesota customers’ electric service statements beginning in September 2008. The first renewable energy project for which the Utility will receive cost recovery is its 40.5 MW ownership share of the Langdon Wind Energy Center, which became fully operational in January 2008. The Utility has recognized a regulatory asset of $3.0 million for revenues that are eligible for recovery through the rider but have not been billed to Minnesota customers as of December 31, 2008.
The Utility is awaiting a decision from the MPUC on its 2009 Rider Adjustment filing with an expected implementation date of April 1, 2009. The 2009 Rider Adjustment filing includes a request for recovery of the Utility’s investment costs and expenses related to its 32 wind turbines at the Ashtabula Wind Energy Center that became commercially operational in November 2008.
11

In addition to the Renewable Resource Cost Recovery Rider, the Minnesota Public Utilities Act provides a similar mechanism for automatic adjustment outside of a general rate proceeding to recover the costs of new electric transmission facilities. The MPUC may approve a tariff rider to recover the Minnesota jurisdictional costs of new transmission facilities that have been previously approved by the MPUC in a Certificate of Need proceeding or certified by the MPUC as a Minnesota priority transmission project or investment and expenditures made to transmit the electricity generated from renewable generation sources ultimately used to provide service to the utility’s retail customers. Such transmission cost recovery riders would allow a return on investments at the level approved in a utility’s last general rate case. The Utility expects to file a proposed rider with the MPUC to recover its share of costs of eligible transmission infrastructure upgrades projects in 2009.
Pursuant to the Minnesota Power Plant Siting Act, the MPUC has been granted the authority to regulate the siting in Minnesota of large electric generating facilities in an orderly manner compatible with environmental preservation and the efficient use of resources. To that end, the MPUC is empowered, after an environmental impact study is conducted by the MNDOC and the Office of Administrative Law conducts contested case hearings, to select or designate sites in Minnesota for new electric power generating plants (50,000 kW or more) and routes for transmission lines (100 kilovolt (kV) or more) and to certify such sites and routes as to environmental compatibility.
The Utility and a coalition of six other electric providers filed an application for a Certificate of Need for the Minnesota portion of the Big Stone II transmission line project on October 3, 2005 and filed an application for a Route Permit for the Minnesota portion of the Big Stone II transmission line project with the MPUC on December 9, 2005. On January 15, 2009, the MPUC approved, by a vote of 5-0, a motion to grant the Certificate of Need and Route Permit for the Minnesota portion of the Big Stone II transmission line. The motion involved numerous elements, including the following:
Therefore, the MPUC determined to grant the Certificate of Need subject to a number of additional conditions pending issuance of a final order, including but not limited to: (1) fulfilling various requirements relating to renewable energy goals, energy efficiency, community-based energy development projects and emissions reduction; (2) that the generation plant be built as a “carbon capture retrofit ready” facility; (3) that the applicants report to the MPUC on the feasibility of building the plant using ultra-supercritical technology; and (4) that the applicants achieve specific limits on construction costs at $3,000/kilowatt and CO2 costs at $26/ton.
The Certificate of Need and Route Permit are required by state law and would allow the Big Stone II utilities to construct and upgrade 112 miles of electric transmission lines in western Minnesota for delivery of power from the Big Stone site and from numerous other planned generation projects, most of which are wind energy.
The Minnesota Legislature enacted the Minnesota Energy Security and Reliability Act in 2001. Its primary focus was to streamline the siting and routing processes for the construction of new electric
12
• That there is reasonable assurance that Big Stone II would be more cost-effective than renewable energy beyond the statutory levels of renewable energy based on accepted estimates of construction costs and carbon dioxide (CO2);
• That the 345 kV transmission project is necessary based on identified regional and state transmission needs; and
• That the project presents risks requiring additional measures to protect the applicants’ ratepayers.
generation and transmission projects. The bill also added to utility requirements for renewable energy and energy conservation. This legislation also transferred environmental review authority from the Environmental Quality Board to the MNDOC.
Planning studies have shown there will be significant electric load growth and more transmission will be necessary for renewable energy in the coming decade. This led to a joint transmission planning initiative among eleven utilities that own transmission lines in Minnesota and the surrounding region, called CapX 2020 — capacity expansion by 2020. On August 16, 2007 the eleven CapX 2020 utilities asked the MPUC to determine the need for three 345-kV transmission lines. These lines would help ensure continued reliable electricity service in Minnesota and the surrounding region by upgrading and expanding the high-voltage transmission network and providing capacity for more wind energy resources to be developed in southern and western Minnesota, eastern North Dakota and South Dakota. The proposed lines would span more than 600 miles and represent one of the largest single transmission initiatives in the region in several years. Evidentiary hearings for the Certificate of Need for the three CapX 2020 345-kV transmission line projects began in July 2008 and continued into August 2008. The MPUC is expected to decide if the lines meet regulatory need requirements by early 2009. The MPUC would determine routes for the new lines in separate proceedings. Portions of the lines would also require approvals by federal officials and by regulators in North Dakota, South Dakota and Wisconsin. After regulatory need is established and routing decisions are completed (expected in 2009 or 2010), construction will begin. The lines would be expected to be completed three or four years later. Great River Energy and Xcel Energy are leading these projects, and the Utility and eight other utilities are involved in permitting, building and financing. The Utility is directly involved in two of these three projects and serves as the lead utility in a fourth Group 1 project, the Bemidji-Grand Rapids 230-kV line which has an expected in-service date of 2012-2013.
The Utility filed a Certificate of Need for the fourth project on March 17, 2008. The MNOES staff completed briefing papers regarding the Bemidji-Grand Rapids route permit application. The MNOES staff recommended to the MPUC: (1) the route permit application be found to be complete, (2) the need determination not be sent to a contested case but be handled informally by MPUC review, and (3) the Certificate of Need and route permit proceedings be combined as requested. The MPUC met on June 26, 2008 to act on the MNOES staff recommendation. The MPUC agreed the Certificate of Need and route permit applications were complete. The commissioners asked the CapX 2020 utilities to add a section to the Certificate of Need application addressing how the new Minnesota Conservation Improvement Programs (CIP) statutes will affect the need for the project. Because no one has intervened in the Certificate of Need proceeding, the MPUC will handle the Certificate of Need application as an uncontested case. The MNOES subsequently recommended that need for the line has been established. The MPUC is expected to determine if there is a need for this line and, if appropriate, issue the route permit in spring 2010. The Utility’s 2009 — 2013 capital budgets include $66 million for CapX 2020 expenditures.
In December 2005, the MPUC issued an order denying the Utility’s request to allow recovery of certain MISO-related costs through the fuel clause adjustment (FCA) in Minnesota retail rates and requiring a refund of amounts previously collected pursuant to an interim order issued in April 2005. The Utility recorded a $1.9 million reduction in revenue and a refund payable in December 2005 to reflect the refund obligation. On February 9, 2006 the MPUC decided to reconsider its December 2005 order. The MPUC’s final order was issued on February 24, 2006 requiring jurisdictional investor-owned utilities in the state to participate with the MNDOC and other parties in a proceeding that would evaluate suitability of recovery of certain MISO Day 2 energy market costs through the FCA. The February 24, 2006 order eliminated the refund provision from the December 2005 order and allowed that any MISO-related costs not recovered through the FCA may be deferred for a period of 36 months, with possible recovery through base rates in the utility’s next general rate case. As a result, the Utility recognized $1.9 million in revenue and reversed the refund payable in February 2006. The Minnesota utilities and other parties submitted a final report to the MPUC in July 2006.
In an order issued on December 20, 2006 the MPUC stated that except for schedule 16 and 17 administrative costs, discussed below, each petitioning utility may recover the charges imposed by the
13

MISO for MISO Day 2 operations (offset by revenues from Day 2 operations via net accounting) through the calculation of the utility’s FCA from the period April 1, 2005 through a period of at least three years after the date of the order. The MPUC also ordered the utilities to refund schedule 16 and 17 costs collected through the FCA since the inception of MISO Day 2 Markets in April 2005 and stated that each petitioning utility may use deferred accounting for MISO schedule 16 and 17 costs incurred since April 1, 2005. This deferred accounting may continue for ongoing schedule 16 and 17 costs, without the accumulation of interest, until the earlier of March 1, 2009 or the utility’s next electric rate case. Pursuant to this December 20, 2006 order, the Utility was ordered to refund $446,000 in MISO schedule 16 and 17 costs to Minnesota retail customers through the FCA over a twelve-month period beginning in January 2007. The Utility requested recovery of the deferred costs and recovery of the ongoing costs in its general rate case filed in October 2007 and, in January 2008, began amortizing $855,000 of deferred MISO schedule 16 and 17 costs over a 35-month period. The August 1, 2008 MPUC Order in the general rate case allowed future recovery of MISO schedule 16 and 17 costs and recovery of the deferred schedule 16 and 17 costs.
The MNDOC and the Utility identified two operational situations which are not covered in the approved method for allocating MISO costs contained in the final December 20, 2006 MPUC order discussed above. One relates to plants not expected to be available for retail but that produce energy in certain hours, resulting in wholesale sales. The other situation is related to Financial Transmission Rights not needed for retail load. For the period July 1, 2005 through June 30, 2007, the Utility determined its Minnesota customers’ portion of costs associated with these situations to be $765,000. The data was provided to the MNDOC during the course of the MNDOC’s review of the Minnesota Annual Automatic Adjustment Report on Energy Costs (AAA Report). The Utility offered to refund $765,000 to its Minnesota customers to settle this and other issues raised by the MNDOC in the AAA Report docket before the MPUC and the MNDOC accepted the offer in October 2007 and recommended that the MPUC include the refund in its final order. The Utility also agreed to modifications to the MISO Day 2 cost allocations that were resolved in the MPUC’s December 20, 2006 order. The Utility agreed to make some of those modifications retroactive back to January 1, 2007. The MPUC accepted the Utility’s refund offer and modifications and closed this docket on February 6, 2008. In December 2007, the Utility recorded a liability and a reduction to revenue of $805,000 for the amount of the refund offer and similar revenues collected subsequent to June 30, 2007. Refunds to Minnesota customers were completed during 2008.
Minnesota law requires an annual filing of a capital structure petition with the MPUC. In this filing the MPUC reviews and approves the capital structure for the Company. Once the petition is approved, the Company may issue securities without further petition or approval, provided the issuance is consistent with the purposes and amounts set forth in the approved capital structure petition. The Company’s current capital structure petition is in effect until the MPUC issues a new capital structure order for 2009. The Company expects to file its 2009 capital structure petition in April and expects to receive approval from the MPUC prior to August 31, 2009.
In September 2004 the Company provided a letter to the MPUC summarizing issues and conclusions of an internal investigation completed by the Company related to claims of allegedly improper regulatory filings brought to the attention of the Company by certain individuals. A hearing before the MPUC was held on February 28, 2006. As a result of the hearing, the Utility agreed that within 90 days it would file a revised Regulatory Compliance Plan, an updated Corporate Cost Allocation Manual and documentation of the definitions of its chart of accounts. The Utility filed these documents with the MPUC in the second quarter of 2006. Subsequently, at a MPUC hearing on January 25, 2007 all remaining open issues were resolved. On two of the issues resolved, the MPUC required the Utility to include all of the Company’s short-term debt in its calculations of allowance for funds used during construction (AFUDC) and the Utility agreed to provide the MPUC the results of the ongoing FERC operational audit when available. The Company recorded a noncash charge of $3.3 million in 2006 related to the disallowance of a portion of capitalized AFUDC from the Utility’s rate base as a result of including all of the Company’s short-term debt, regardless of use, in the Utility’s calculation of AFUDC. On December 12, 2007, the MPUC issued its order closing the investigation subject to the Company’s continuing responsibility to file
14

the report on its FERC operational audit as soon as available and subject to any further development of the record required in the Utility’s recent general rate case. FERC Order (IN08-6-000), resolving alleged network transmission service violations by the Utility of the Open Access Transmission and Energy Markets Tariff of the MISO was issued on May 29, 2008 and filed with the MPUC on June 4, 2008.
North Dakota: The Utility is subject to the jurisdiction of the NDPSC with respect to rates, services, certain issuances of securities and other matters. The NDPSC periodically performs audits of gas and electric utilities over which it has rate setting jurisdiction to determine the reasonableness of overall rate levels. In the past, these audits have occasionally resulted in settlement agreements adjusting rate levels for the Utility. The North Dakota Energy Conversion and Transmission Facility Siting Act grants the NDPSC the authority to approve sites in North Dakota for large electric generating facilities and high voltage transmission lines. This Act is similar to the Minnesota Power Plant Siting Act described above and applies to proposed new electric power generating plants of 100,000 kW or more and proposed new transmission lines of more than 115 kV. The Utility is required to submit a ten-year plan to the NDPSC annually.
The NDPSC reserves the right to review the issuance of stocks, bonds, notes and other evidence of indebtedness of a public utility. However, the issuance by a public utility of securities registered with the Securities and Exchange Commission is expressly exempted from review by the NDPSC under North Dakota state law.
On November 3, 2008 the Utility filed a general rate case in North Dakota requesting an overall revenue increase of approximately $6.1 million, or 5.1%, and an interim rate increase, to begin on January 2, 2009, of approximately 4.1%, or $4.8 million annualized. A final decision by the NDPSC on the Utility’s request is expected by August 1, 2009. Interim rates will remain in effect for all North Dakota customers until the NDPSC makes a final determination on the Utility’s request. If final rates are lower than interim rates, the Utility will refund North Dakota customers the difference with interest.
On May 21, 2008 the NDPSC approved the Utility’s request for a Renewable Resource Cost Recovery Rider to enable the Utility to recover the North Dakota share of its investments in renewable energy facilities it owns in North Dakota. The Renewable Resource Cost Recovery Rider Adjustment of 0.193 cents per kWh was included on North Dakota customers’ electric service statements beginning in June 2008. The first renewable energy project for which the Utility will receive cost recovery is its 40.5 MW ownership share of the Langdon Wind Energy Center, which became fully operational in January 2008. The Utility may also recover through this rider costs associated with other new renewable energy projects as they are completed. The Utility has included investment costs and expenses related to its 32 wind turbines at the Ashtabula Wind Energy Center that became commercially operational in November 2008 in its 2009 annual request to the NDPSC to increase the amount of the Renewable Resource Cost Recovery Rider Adjustment. A Renewable Resource Cost Recovery Rider Adjustment rate of 0.51 cents per kWh was approved by the NDPSC on January 14, 2009 and went into effect beginning with billing statements sent on February 1, 2009.
The Utility had not been deferring recognition of its renewable resource costs eligible for recovery under the North Dakota Renewable Resource Cost Recovery Rider but had been charging those costs to operating expense since January 2008. After approval of the rider, the Utility accrued revenues related to its investment in renewable energy and for renewable energy costs incurred since January 2008 that are eligible for recovery through the North Dakota Renewable Resource Cost Recovery Rider. The Company’s December 31, 2008 consolidated balance sheet includes a regulatory asset of $2.0 million for revenues that are eligible for recovery through the North Dakota Renewable Resource Cost Recovery Rider but that had not been billed to North Dakota customers as of December 31, 2008.
North Dakota legislation also provides a mechanism for automatic adjustment outside of a general rate proceeding to recover jurisdictional capital and operating costs incurred by a public utility for new or modified electric transmission facilities. However, the Utility has requested recovery of such costs in its general rate case filed in November 2008.
15
In February 2005, the Utility filed a petition with the NDPSC to seek recovery of certain MISO-related costs through the FCA. The NDPSC granted interim recovery through the FCA in April 2005, but similar to the decision of the MPUC, conditioned the relief as being subject to refund until the merits of the case are determined. In August 2007, the NDPSC approved a settlement agreement between the Utility and an intervener representing several large industrial customers in North Dakota. Under the approved settlement agreement, the Utility refunded $493,000 of MISO schedule 16 and 17 costs collected through the FCA from April 2005 through July 2007 to North Dakota customers beginning in October 2007 and ending in January 2008. The Utility deferred recognition of these costs plus $330,000 in MISO schedule 16 and 17 costs incurred from August 2007 through December 2008 and requested recovery of these deferred costs in its general rate case filed in North Dakota in November 2008. As of December 31, 2008 the Utility had deferred $823,000 in MISO schedule 16 and 17 costs in North Dakota, which it will amortize over 36 months beginning in January 2009 in conjunction with the implementation of interim rates in North Dakota. Request for approval of base rate recovery for deferred and on-going MISO schedule 16 and 17 costs are included in the pending general rate case.
A filing in North Dakota for an advance determination of prudence of Big Stone II was made by the Utility in November 2006. Evidentiary hearings were held in June 2007. The NDPSC decision was delayed because of the change in ownership of the project. On August 27, 2008, the NDPSC determined that the Utility’s participation in Big Stone II was prudent in a range of 121.8 to 130 MW. The NDPSC decision has been appealed to Burleigh County District Court by interveners in the matter. In addition, the NDPSC ordered the Utility to file, for approval, proposals to implement demand-side management and conservation programs identified as more economic resources than Big Stone II. This filing was submitted in February 2009.
South Dakota: Under the South Dakota Public Utilities Act, the Utility is subject to the jurisdiction of the SDPUC with respect to rates, public utility services, establishment of assigned service areas and other matters. The Utility is not currently subject to the jurisdiction of the SDPUC with respect to the issuance of securities. Under the South Dakota Energy Facility Permit Act, the SDPUC has the authority to approve sites in South Dakota for large energy conversion facilities (100,000 kW or more) and transmission lines of 115 kV or more.
On October 31, 2008 the Utility filed a general rate case in South Dakota requesting an overall revenue increase of approximately $3.8 million, or 15.3%, which provides for recovery of renewable resource investments and expenses in base rates. South Dakota rules do not provide for interim rate increases pending approval of final rates. A final decision by the SDPUC on the Utility’s request is expected in mid-summer 2009. Prior to this general rate case there have been no significant rate proceedings in South Dakota since November 1987.
The Utility and a coalition of six other electric providers filed an Energy Conversion Facility Siting Permit Application for Big Stone II with the SDPUC on July 21, 2005. The permit was granted by the SDPUC on July 14, 2006 but was appealed by a group of interveners on the basis that CO2 concerns had not been adequately addressed. In February 2007 a South Dakota circuit court judge issued an opinion affirming the decision of the SDPUC to grant the siting permit for Big Stone II. The permit was appealed to the South Dakota Supreme Court. On January 16, 2008 the South Dakota Supreme Court unanimously affirmed the SDPUC’s decision to grant Big Stone II project participants a site permit. A permit application for the South Dakota portion of the transmission line for Big Stone II was filed with the SDPUC on January 16, 2006 and was approved by the SDPUC on January 2, 2007.
On November 20, 2008 the South Dakota Board of Minerals and Environment unanimously approved the Big Stone II participating utilities’ application for a Prevention of Significant Deterioration (PSD) permit for Big Stone II and a proposed Title V Operating Permit for the Big Stone site. A PSD permit is a pre-construction permit designed to protect air quality. Joint petitioners Sierra Club and Clean Water Action have appealed the administrative decision on the PSD permit to the Circuit Court of Hughes
16
County. The appeal is currently pending before the court. The issuance of the Title V permit is subject to review by the U.S. Environmental Protection Agency (EPA). On January 22, 2009, the EPA filed a formal objection to the proposed Title V permit. The State of South Dakota has revised and submitted a proposed permit in response to the EPA’s objection.
On January 4, 2007 the SDPUC encouraged all investor-owned utilities in South Dakota to be part of an Energy Efficiency Partnership to significantly reduce energy use. On July 28, 2008 the SDPUC approved the Utility’s energy efficiency plan for South Dakota customers. The plan is being implemented with program costs, carrying costs and a financial incentive being recovered through an approved rider.
FERC: Wholesale power sales and transmission rates are subject to the jurisdiction of the FERC under the Federal Power Act of 1935, as amended. The FERC is an independent agency, which has jurisdiction over rates for wholesale electricity sales, transmission and sale of electric energy in interstate commerce, interconnection of facilities, and accounting policies and practices. Filed rates are effective after a one-day suspension period, subject to ultimate approval by the FERC.
On April 25, 2006 the FERC issued an order requiring MISO to refund to customers, with interest, amounts related to real-time revenue sufficiency guarantee (RSG) charges that were not allocated to day-ahead virtual supply offers in accordance with MISO’s Open Access Transmission and Energy Markets Tariff (TEMT) going back to the commencement of MISO Day 2 markets in April 2005. On May 17, 2006 the FERC issued a Notice of Extension of Time, permitting MISO to delay compliance with the directives contained in its April 2006 order, including the requirement to refund to customers the amounts due, with interest, from April 1, 2005 and the requirement to submit a compliance filing. The Notice stated that the order on rehearing would provide the appropriate guidance regarding the timing of the compliance filing. On October 26, 2006 the FERC issued an order on rehearing of the April 25, 2006 order, stating it would not require refunds related to real-time RSG charges that had not been allocated to day-ahead virtual supply offers in accordance with MISO’s TEMT going back to the commencement of the MISO Day 2 market in April 2005. However, the FERC ordered prospective allocation of RSG charges to virtual transactions consistent with the TEMT to prevent future inequity and directed MISO to propose a charge that assesses RSG costs to virtual supply offers based on the RSG costs that virtual supply offers cause within 60 days of the October 26, 2006 order. On December 27, 2006 the FERC issued an order granting rehearing of the October 26, 2006 order.
On March 15, 2007 the FERC issued an order denying requests for rehearing of the RSG rehearing order dated October 26, 2006. In the March 15, 2007 order on rehearing, the FERC stated that its findings in the April 25, 2006 RSG order that virtual offers should share in the allocation of RSG costs, per the terms of the currently effective tariff, served as notice to market participants that virtual offers, for those market participants withdrawing energy, were liable for RSG charges. FERC clarified that the RSG rehearing order’s waiver of refunds applies to the period before that order, from market start-up in April 2005 until April 24, 2006. After that date, virtual supply offers are liable for RSG costs and therefore, to the extent virtual supply offers were not assessed RSG costs, refunds are due for the period starting April 25, 2006.
On November 5, 2007 the FERC issued two orders related to the RSG proceeding. In the first order, the FERC accepted the MISO’s April 17, 2007 RSG compliance filing to comply with the FERC’s March 15, 2007 RSG order. The compliance order reinserted language requiring the actual withdrawal of energy by market participants, restored the MISO’s original TEMT language allocating RSG costs to virtual transactions, revised the effective date for allocation to imports, provided an explanation of its efforts to reflect partial-hour revenue determinations in its software development, and revised several definitions. The second related RSG order issued by FERC on November 5, 2007 was its order on rehearing on its April 25, 2006 order, in which it rejected the MISO’s proposal to remove references to virtual supply from the TEMT provisions related to calculating RSG charges (FERC Docket Nos. ER04-691-084 and ER04-691-086). In this order, the FERC denied the requests for rehearing of the RSG second rehearing order (the Utility was one of the parties that sought rehearing) and FERC denied all requests for rehearing of the RSG compliance order.
17

In the RSG compliance order, the FERC rejected the MISO’s proposal to allocate costs based on net virtual offers, i.e., virtual offers minus virtual bids, and clarified that the currently effective tariff, which allocates RSG costs to virtual supply offers, remains in effect. In the RSG second rehearing order, the FERC clarified that for those market participants withdrawing energy, to the extent virtual supply offers were not assessed RSG costs, refunds were due for the period starting April 25, 2006.
The Utility recorded a $1.7 million ($1.0 million net-of-tax) charge to earnings in the first quarter of 2007 based on an internal estimate of the net impact of MISO reallocating RSG charges in response to the FERC order on rehearing. In May 2007, MISO informed affected market participants of the impact of reallocating charges based on its interpretation of the FERC order on rehearing. Based on MISO’s interpretation of the order on rehearing, the Utility estimated the reallocation of charges would not have a significant impact on earnings previously recognized by the Utility. Accordingly, the Utility revised its first quarter estimated charge of $1.7 million ($1.0 million net-of-tax) to zero in the second quarter of 2007.
On March 15, 2007 the FERC also directed MISO to make another compliance filing that the FERC addressed on November 7, 2008 (RSG Compliance Order III). In RSG Compliance Order III, the FERC concluded that its interpretation in RSG III regarding the RSG rate denominator was in error and that a different interpretation applied. On November 10, 2008 the FERC issued an order on the paper hearing finding the current RSG rate unjust and unreasonable and accepting an interim rate that applied RSG charges to all virtual sales until such time that MISO makes a subsequent filing of the new RSG rate. In response to RSG Compliance Order III, MISO made another compliance filing on December 8, 2008 in which it proposed to re-resettle the RSG charges and cost allocations back to market start to correct its previous resettlement completed in January 2008 that was based on the FERC’s interpretation of the RSG rate and billing determinants affirmed in RSG III. In addition to correcting the RSG rate denominator to limit it to only virtual sales associated with actual physical energy withdrawals, MISO proposed additional corrections designed to reduce the denominator. Both changes will increase the RSG rate that the Utility must pay. Also, on November 11, 2008 the FERC issued an order on rehearing of the November 28, 2007 order on complaint. Again, where the revenue from RSG charges collected is not sufficient to make RSG payments to suppliers, MISO recovers the shortage through an uplift charge from all load.
The Utility requested rehearing of both November 10, 2008 orders (in conjunction with the FERC’s RSG Compliance Order III). If the FERC denies rehearing, the Utility will likely seek review at the United States Court of Appeals for the District of Columbia Circuit (D.C. Circuit). The Utility’s principal concern in these proceedings was to ensure that the FERC did not impose refunds prior to the August 10, 2007 refund effective date. The FERC did not impose such refunds but did offer an interpretation in support of its decision in RSG Compliance Order III (in ER04-691 docket) that would subject the Utility to further RSG refunds and resettlements prior to August 10, 2007.
Since 2006, the Utility has been a party to litigation before the FERC regarding the application of RSG charges to market participants who withdraw energy from the market or engage in financial-only, virtual sales of energy into the market or both. These litigated proceedings occurred in several electric rate and complaint dockets before the FERC and several of the FERC’s orders are on review before the D.C. Circuit. These proceedings create potential contingent liabilities in three separate periods for the Utility: (1) April 1, 2005 through April 24, 2006; (2) April 25, 2006 through August 9, 2007; and (3) August 10, 2007 forward. The Utility identified and assessed potential contingent RSG liabilities under various scenarios depending on the time period over which the FERC ultimately orders RSG refunds. The Utility accrued a liability in 2008 based on the outcome it determined to be most probable. The Company does not know when these litigation proceedings will conclude.
The FERC’s Office of Enforcement, formerly referred to as the Division of Audits of the Office of Market Oversight and Investigations, commenced an audit in 2005 of the Utility’s transmission practices for the period January 1, 2003 through August 31, 2005. The purpose of the audit was to determine whether the
18
Utility’s transmission practices were in compliance with the FERC’s applicable rules, regulations and tariff requirements and whether the implementation of the Utility’s waivers from the requirements of Order No. 889 and Order No. 2004 appropriately restricted access to transmission information that would benefit the Utility’s off-system sales. FERC staff identified two of the Utility’s transmission practices that it believed were out of compliance. The Utility believes its actions were in compliance with the MISO tariff but rather than litigate, it entered into a Stipulated Settlement Agreement with FERC staff resolving all issues related to the audit. The FERC approved the settlement agreement on May 29, 2008 and issued FERC Order (IN08-6-000) which resolved alleged network transmission service violations by the Utility of MISO’s TEMT. The Utility agreed to pay $547,000 plus interest of $141,000 to the Low Income Home Energy Assistance Program administered by the three states served by the Utility. This amount represents profits earned by the Utility on transactions FERC staff believes incorrectly utilized network transmission service under MISO’s TEMT. Enforcement staff did not seek to impose a compliance monitoring plan on the Utility because the MISO’s Day 2 market is now operational and its member utilities no longer schedule transmission within the system.
The Comprehensive Energy Policy Act of 2005 (the 2005 Energy Act), signed into law in August 2005, substantially affected the regulation of energy companies, including the Utility. The 2005 Energy Act amended federal energy laws and provided the FERC with new oversight responsibilities. Among the important changes implemented as a result of this legislation were the following:
MEMA: The Utility is a member of the Mid-Continent Energy Marketers Association (MEMA) which is an independent, non-profit trade association representing entities involved in the marketing of energy or in providing services to the energy industry. MEMA operates in the Mid-Continent Area Power Pool (MAPP), MISO, Southwest Power Pool, PJM Interconnection, LLC and Southeast regions and was formed in 2003 as a successor organization of the Power and Energy Market of MAPP. Power pool sales are conducted continuously through MEMA in accordance with schedules filed by MEMA with the FERC.
MRO: The Utility is a member of the Midwest Reliability Organization (MRO). The MRO, a non-profit organization that replaced the MAPP Regional Reliability Council, is one of eight Regional Reliability Councils that comprise the NERC. The MRO operates to ensure the reliability of the bulk power system in the Midwest part of North America. The MRO, through its balanced stakeholder board with independent oversight, operates independently from any member, market participant or operator, so that the standards developed and enforced by the MRO are fair and administered without undue influence from market participants. The MRO is approximately 40% larger in terms of net end use load than MAPP. The MRO region includes more than 40 members supplying approximately 280 million mWh to more than 20 million people. Its membership is comprised of municipal utilities, cooperatives, investor-owned utilities, a federal power marketing agency, Canadian Crown Corporations and independent power producers.
MISO: The Utility is a member of the MISO. As expressed in FERC Order No. 2000, FERC’s view is that independent regional transmission organizations will benefit the public interest by enhancing
19
• The Public Utility Holding Company Act of 1935 (PUHCA) was repealed effective February 8, 2006. PUHCA significantly restricted mergers and acquisitions in the electric utility sector.
• FERC appointed the Electric Reliability Organization (ERO) formerly known as North American Electric Reliability Council (NERC) as an electric reliability organization to establish and enforce mandatory reliability rules regarding the interstate electric transmission system. On January 1, 2007 the ERO began operating.
• The FERC established incentives for transmission companies, such as performance based rates, recovery of costs to comply with reliability rules and accelerated depreciation for investments in transmission infrastructure.
• Federal support was made available for certain clean coal power initiatives, nuclear power projects and renewable energy technologies.

the reliability of the electric grid and providing unbiased regional grid management, nondiscriminatory operation of the bulk power transmission system and open access to the transmission facilities under MISO’s functional supervision. The MISO covers a broad region containing all or parts of 20 states and one Canadian province. The MISO began operational control of the Utility’s transmission facilities above 100 kV on February 1, 2002 but the Utility continues to own and maintain its transmission assets. As the transmission provider and security coordinator for the region, the MISO seeks to optimize the efficiency of the interconnected system, provide regional solutions to regional planning needs and minimize risk to reliability through its security coordination, long-term regional planning, market monitoring, scheduling and tariff administration functions.
The MISO Energy Markets commenced operation on April 1, 2005. Through its Energy Markets, MISO seeks to develop options for energy supply, increase utilization of transmission assets, optimize the use of energy resources across a wider region and provide greater visibility of data. MISO aims to facilitate a more cost-effective and efficient use of the wholesale bulk electric system.
The MISO Ancillary Services Market (ASM) commenced on January 6, 2009. The market facilitates the provision of Regulation, Spinning Reserve and Supplemental Reserves. The ASM integrates the procurement and use of regulation and contingency reserves with the existing Energy Market. The Utility has actively participated in the market since its commencement.
In December 2008 the Utility sent MISO a letter of intent to withdraw from MISO. This procedural step was taken to allow the Utility the opportunity to withdraw from MISO at the end of 2009 if concerns about MISO charges born by retail customers cannot be resolved. Withdrawal from MISO would require the Utility to secure replacement of MISO-provided services from other sources.
MAPP: The Utility has been a participant in the MAPP generation reserve sharing pool, which operates in parts of eight states in the Upper Midwest and in three provinces in Canada. As a result of the start up of the ASM, the Utility is withdrawing from the generation reserve sharing pool of MAPP. The MAPP generation reserve sharing pool provided for, among other things, the contingency reserves necessary to meet certain major events such as the loss of a large generating unit or a transmission line.
Other: The Utility is subject to various federal and state laws, including the Federal Public Utility Regulatory Policies Act and the Energy Policy Act of 1992, which are intended to promote the conservation of energy and the development and use of alternative energy sources, and the 2005 Energy Act described above.
Holding Company Reorganization
The Company’s Board of Directors has authorized a holding company reorganization of the Company’s regulated utility business. Following the completion of the holding company reorganization, Otter Tail Power Company, which is currently operated as a division of Otter Tail Corporation, will be operated as a wholly owned subsidiary of the new parent holding company to be named Otter Tail Corporation. In connection with the reorganization, each outstanding Otter Tail Corporation common share will be automatically converted into one common share of the new holding company, and each outstanding Otter Tail Corporation cumulative preferred share will be automatically converted into one cumulative preferred share of the new holding company having the same terms. The holding company reorganization is subject to approval by Minnesota, North Dakota and South Dakota regulatory agencies and by the FERC, consents from various third parties and certain other conditions. In an order issued on August 18, 2008, the FERC authorized the reorganization subject to certain conditions specified in the order. In an order issued on October 10, 2008, the NDPSC approved the Company’s application to form a holding company. In a meeting held on October 30, 2008, the SDPUC approved the Company’s application to form a new holding company. The MPUC approved the Company’s request to form a holding company with certain conditions at its hearing on December 11, 2008. There remain several business and legal steps that must be accomplished before the reorganization can be completed.
20

Competition, Deregulation and Legislation
Electric sales are subject to competition in some areas from municipally owned systems, rural electric cooperatives and, in certain respects, from on-site generators and cogenerators. Electricity also competes with other forms of energy. The degree of competition may vary from time to time depending on relative costs and supplies of other forms of energy. The Utility may also face competition as the restructuring of the electric industry evolves.
The Company believes the Utility is well positioned to be successful in a competitive environment. A comparison of the Utility’s electric retail rates to the rates of other investor-owned utilities, cooperatives and municipals in the states the Utility serves indicates the Utility’s rates are competitive.
Legislative and regulatory activity could affect operations in the future. The Utility cannot predict the timing or substance of any future legislation or regulation. There has been no legislative action regarding electric retail choice in any of the states where the Utility operates. The Minnesota legislature has in the past, and again is, considering legislation which would regulate holding companies doing business within the state that include in the ownership chain a public utility. Proposed legislation would foreclose public utilities, or holding companies of which public utilities are members, from acquiring an interest in a company that is not a public utility or that does not receive 50 percent or more of its revenue from electric or gas utility-related business. This legislation, if passed in its present form, could limit the Company’s ability to maintain and grow its nonelectric businesses. The Company does not expect retail competition to come to the States of Minnesota, North Dakota or South Dakota in the foreseeable future.
Some of the Company’s businesses could benefit from renewable energy development incentives included in the American Recovery and Reinvestment Act of 2009 recently passed by Congress.
The Utility is unable to predict the impact on its operations resulting from future regulatory activities, from future legislation or from future taxes that may be imposed on the source or use of energy.
Environmental Regulation
Impact of Environmental Laws: The Utility’s existing generating plants are subject to stringent federal and state standards and regulations regarding, among other things, air, water and solid waste pollution. In the five years ended December 31, 2008 the Utility invested approximately $17.4 million in environmental control facilities. The 2009 construction budget includes approximately $0.6 million for environmental equipment for existing facilities. The Utility’s share of environmental expenditures for the proposed Big Stone II Plant is estimated to be $133 million, including the cost of a joint scrubber, which will be shared between the current Big Stone Plant and the proposed Big Stone II Plant.
Air Quality: Pursuant to the Federal Clean Air Act (the Act), the EPA has promulgated national primary and secondary standards for certain air pollutants.
The primary fuels burned by the Utility’s steam generating plants are North Dakota lignite coal and western subbituminous coal. Electrostatic precipitators have been installed at the principal units at the Hoot Lake Plant. Hoot Lake Plant unit 1 turbine generator, which is the smallest of the three coal-fired units at Hoot Lake Plant, was retired as of December 31, 2005. The Utility has retained the unit 1 boiler for use as a source of emergency heat. A fabric filter collects particulates from stack gases on Hoot Lake Plant unit 1. As a result, the Utility believes the units at the Hoot Lake Plant currently meet all presently applicable federal and state air quality and emission standards.
During the fall of 2007 maintenance outage at the Big Stone Plant, the demonstration project Advanced Hybrid™ technology was replaced with a pulse jet baghouse. The Big Stone Plant is currently operating within all presently applicable federal and state air quality and emission standards.
21
The Coyote Station is equipped with sulfur dioxide (SO2) removal equipment. The removal equipment—referred to as a dry scrubber—consists of a spray dryer, followed by a fabric filter, and is designed to desulfurize hot gases from the stack. The fabric filter collects spray dryer residue along with the fly ash. The Coyote Station is currently operating within all presently applicable federal and state air quality and emission standards.
The Act, in addressing acid deposition, imposed requirements on power plants in an effort to reduce national emissions of SO2 and nitrogen oxides (NOx).
The national SO2 emission reduction goals are achieved through a market-based system under which power plants are allocated “emissions allowances” that will require plants to either reduce their emissions or acquire allowances from others to achieve compliance. Each allowance is an authorization to emit one ton of SO2. SO2 emission requirements are currently being met by all of the Utility’s generating facilities without the need to acquire other allowances for compliance.
The national NOx emission reduction goals are achieved by imposing mandatory emissions standards on individual sources. Hoot Lake Plant unit 2 was governed by the phase one early opt-in provision until January 1, 2008. In order to meet the national NOx emission standards required at the Hoot Lake Plant unit 2 in 2008, the Utility installed low NOx burners and over-fire air in the first quarter of 2008, enabling the unit to meet the annual average emission rate. The remaining generating units meet the NOx emission regulations that were adopted by the EPA in December 1996. All of the Utility’s generating facilities met the NOx standards during 2008.
The EPA Administrator signed the final Interstate Air Quality Rule, also known as the Clean Air Interstate Rule (CAIR), on March 10, 2005. The EPA has concluded that SO2 and NOx are the chief emissions contributing to interstate transport of particulate matter less than 2.5 microns (PM2.5). The EPA also concluded that NOx emissions are the chief emissions contributing to ozone non-attainment. Twenty-three states and the District of Columbia were found to contribute to ambient air quality PM2.5 non-attainment in downwind states. On that basis, the EPA proposed to cap SO2 and NOx emissions in the designated states. Minnesota was included among the twenty-three states for emissions caps. Twenty-five states were found to contribute to downwind 8-hour ozone non-attainment. None of the states in the Utility’s service territory were slated for NOx reduction for ambient air quality 8-hour ozone non-attainment purposes. On July 11, 2007, the U.S. Court of Appeals for the D.C. Circuit vacated CAIR and the CAIR federal implementation plan in its entirety. On December 23, 2008, the court reconsidered and remanded the case without vacatur for the EPA to conduct further proceedings consistent with the court’s prior opinion. The court did not impose a definitive deadline by which the EPA must correct CAIR. On January 16, 2009, the EPA proposed a rule that would stay the effectiveness of CAIR and the CAIR federal implementation plan for sources in Minnesota while the EPA conducts notice-and-comment rulemaking on remand from the D.C. Circuit’s decisions in the litigation on CAIR. Remanding the issue to the EPA for further consideration, the court held that the EPA had not adequately addressed errors alleged by Minnesota Power in the EPA’s analysis supporting inclusion of Minnesota. Neither the EPA nor any other party sought rehearing of this part of the court’s CAIR decision. Given the uncertainty of the proposed rule, future EPA action and whether Minnesota will be included in the CAIR, the impact on Otter Tail facilities is uncertain at this time. Nonetheless, NOx emissions control equipment has been installed on Hoot Lake Plant unit 2 as described above, and was installed on unit 3 in 2007 in anticipation of having to meet CAIR requirements.
On June 15, 2005, the EPA signed the Regional Haze Best Available Retrofit Technology (BART) rule. The rule requires emissions reductions from designated sources that are deemed to contribute to visibility impairment in Class I air quality areas. Hoot Lake Plant unit 3 and Big Stone Plant are units that are potentially subject to emission reduction requirements. The Minnesota Pollution Control Agency (MPCA) has determined that Hoot Lake Plant unit 3 is not subject to the BART rule. A similar determination has not been made for Big Stone Plant and it remains potentially subject to emission
22

reduction requirements. At the request of the South Dakota Department of Environment and Natural Resources (DENR), the Utility agreed to model Big Stone emissions to evaluate the impact of plant emissions on Class I air quality areas. The modeling effort was completed and the final report submitted to the DENR on March 19, 2008. Although the DENR has not as yet acted on the report, the report concluded that Big Stone does not contribute to visibility impairment in Class I air quality areas and is exempt from the BART process. The Utility has responded to questions and comments posed by the reviewing agencies and has provided a revised modeling protocol for consideration by the DENR, the EPA and the Federal Land Managers. The state rule revisions were due by January 2008, but South Dakota rule revisions have been delayed. Given the regulatory uncertainties at this time, it is not possible to assess to what extent this regulation will impact the Utility.
The Act calls for EPA studies of the effects of emissions of listed pollutants by electric steam generating plants. The EPA has completed the studies and submitted reports to Congress. The Act required the EPA to make a finding as to whether regulation of emissions of hazardous air pollutants from fossil fuel-fired electric utility generating units is appropriate and necessary. On December 14, 2000 the EPA announced it affirmatively decided to regulate mercury emissions from electric generating units. The EPA published the proposed mercury rule on January 30, 2004. The proposal included two options for regulating mercury emission from coal-fired electric generating units. One option would set technology-based maximum achievable control technology standards under paragraph 111(d) of the Act. The other option embodied a market-based cap and trade approach to emissions reduction. The EPA published final rules in May 2005 based on the cap and trade approach. On October 28, 2005 the EPA announced a reconsideration of portions of the final rules. Final rules were published on June 9, 2006 that maintained the cap and trade approach. On February 8, 2008, the United States Court of Appeals for the D.C. Circuit granted petitions for review of the EPA rules and vacated the rules that would have allowed the EPA to regulate mercury emissions based on a cap and trade approach. On March 14, 2008, the U.S. Court of Appeals for the D.C. Circuit issued a mandate vacating the EPA final rule regulating utility mercury emissions. EPA rulemaking is slated to proceed under the maximum achievable control technologies (MACT) provision of the Clean Air Act section 112(d) for existing units and section 112(g) case-by-case MACT provisions for affected new units. Given the potential for legal challenges and regulatory uncertainties associated with the EPA’s revised rulemaking, it is not possible to assess to what extent the court’s recent decision will impact the Utility.
In 1998, the EPA announced its New Source Review Enforcement Initiative targeting coal-fired utilities, petroleum refineries, pulp and paper mills and other industries for alleged violations of EPA’s New Source Review rules. These rules require owners or operators that construct new major sources or make major modifications to existing sources to obtain permits and install air pollution control equipment at affected facilities. The EPA is attempting to determine if emission sources violated certain provisions of the Act by making major modifications to their facilities without installing state-of-the-art pollution controls. On January 2, 2001 the Utility received a request from the EPA, pursuant to Section 114(a) of the Act, to provide certain information relative to past operation and capital construction projects at the Big Stone Plant. The Utility responded to that request. In March 2003 the EPA conducted a review of the plant’s outage records as a follow-up to their January 2001 data request. A copy of the designated documents was provided to the EPA on March 21, 2003. On January 8, 2009, the Utility received another request from EPA Regions 5 and 8, pursuant to Section 114(a) of the Act, to provide certain information relative to past operation and capital construction projects at the Big Stone Plant, Coyote Station and Hoot Lake Plant. The Utility plans to file a timely response to the request. At this time the Utility cannot determine what, if any, actions will be taken by the EPA.
The EPA issued changes to the existing New Source Review rules with respect to routine maintenance and repair and replacement activities in its Equipment Replacement Provision Rule on October 27, 2003. However, the U.S. Court of Appeals for the D.C. Circuit issued an order which stayed the effective date of the Equipment Replacement Provision rule pending judicial review. In a March 2006 decision the U.S. Court of Appeals for the D.C. Circuit struck down the EPA’s Equipment Replacement
23
Provision. The EPA petitioned the original three-judge panel to reconsider its ruling and, at the same time, petitioned all of the court’s judges to rehear the panel’s decision. In June 2006, the judges denied both requests. The Department of Justice, on behalf of the EPA, and the Utility Air Regulatory Group filed a petition with the U.S. Supreme Court in November 2006 asking the Court to overturn the D.C. Circuit Court’s decision to vacate the Equipment Replacement Provision. The petition was denied. On April 25, 2007, the EPA issued its supplemental proposal on the New Source Review Emissions Increase Rule and a final rule was expected. However, on December 10, 2008 the EPA announced that it decided not to finalize the proposed rule.
On November 20, 2006, the Sierra Club notified the Utility and the two other Big Stone Plant co-owners of its intent to sue alleging violations of the PSD requirements of the Act at the Big Stone Plant with respect to three past plant activities. The Sierra Club stated that unless the matter is otherwise fully resolved, it intends to file suit in the applicable district courts any time 60 days after November 20, 2006. On June 10, 2008 the Sierra Club filed a complaint in the U.S. District Court for the District of South Dakota (Northern Division) against the Company and two other co-owners of the Big Stone Plant. The complaint alleges certain violations of the Prevention of Significant Deterioration and New Source Performance Standards (NSPS) provisions of the Clean Air Act and certain violations of the South Dakota State Implementation Plan (South Dakota SIP). The action further alleges the defendants modified and operated Big Stone without obtaining the appropriate permits, without meeting certain emissions limits and NSPS requirements and without installing appropriate emission control technology, all allegedly in violation of the Clean Air Act and the South Dakota SIP. The Sierra Club alleges the defendants’ actions have contributed to air pollution and visibility impairment and have increased the risk of adverse health effects and environmental damage. The Sierra Club seeks both declaratory and injunctive relief to bring the defendants into compliance with the Clean Air Act and the South Dakota SIP and to require the defendants to remedy the alleged violations. The Sierra Club also seeks unspecified civil penalties, including a beneficial mitigation project. The Company believes these claims are without merit and that Big Stone has been and is being operated in compliance with the Clean Air Act and the South Dakota SIP. The Utility and the co-owners have filed a motion to dismiss that is presently pending before the Court. The ultimate outcome of these matters cannot be determined at this time.
On September 22, 2008, the Sierra Club notified the Utility and the two other Big Stone Plant co-owners of its intent to sue alleging violations of the PSD and NSPS requirements of the Clean Air Act with respect to two past plant activities. The Sierra Club stated that unless the matter is otherwise fully resolved, it intended to file suit in the applicable district courts any time 60 days after the September 22, 2008 letter. As of the date of this report the Sierra Club has not filed suit in the applicable district courts. The Utility believes that the Big Stone Plant is in material compliance with all applicable requirements of the Act.
The Coyote Station is subject to certain emission limitations under the PSD program of the Act. The EPA and the North Dakota Department of Health reached an agreement to identify a process for resolving several issues relating to the modeling protocol for the state’s PSD program. Modeling was completed and the results were submitted to the EPA for its review. On April 19, 2005 the North Dakota Department of Health held a Periodic Review Hearing relating to the PSD Air Quality Modeling Report that was submitted to the EPA. One of the Hearing Officer’s Findings and Conclusion was that the air quality relating to impacts of SO2 emissions is being adequately protected and that at 2002-2003 SO2 emission levels the relevant Class I increments are not violated.
The issue of global climate change and the connection between global warming and increased levels of CO2 —a greenhouse gas (GHG)—in the atmosphere is receiving increased attention. Combustion of fossil fuels for the generation of electricity is a major stationary source of CO2 emissions in the United States and globally. The Utility is an owner or part-owner of three baseload, coal-fired electricity generating plants and four fuel-oil or natural gas-fired combustion turbine peaking plants with a combined generating capability of 679 MW. In 2008, these plants emitted approximately 4.4 million tons of CO2.
24

The Utility monitors and evaluates the possible adoption of national, regional, or state climate change and GHG legislation or regulations that would affect electric utilities. Debate continues in Congress on the direction and scope of U.S. policy on climate change and regulation of GHGs. Although several bills have been introduced in Congress that would compel reductions in CO2 emissions, there are presently no federal mandatory GHG reduction requirements. The likelihood of any federal mandatory CO2 emissions reduction program being adopted by Congress in the near future, and the specific requirements of any such program, is uncertain. In April 2007, however, the U.S. Supreme Court issued a decision that determined that the EPA has authority to regulate CO2 and other GHGs from automobiles as “air pollutants” under the Clean Air Act. The Supreme Court sent the case back to the EPA, which must conduct a rulemaking to determine whether GHG emissions contribute to climate change “which may reasonably be anticipated to endanger public health or welfare.” While this case addressed a provision of the Clean Air Act related to emissions from motor vehicles, a parallel provision of the Clean Air Act applies to stationary sources such as electric generators. Additionally, the EPA has announced that it plans to reconsider its decision to deny California’s request for a waiver under the Act. If granted, the waiver would allow California to put into place motor vehicle standards to address GHG emissions. Finally, on July 11, 2008, the EPA issued an advance notice of proposed rulemaking on regulating GHG emissions under the Clean Air Act. Unless the Congress enacts legislation directing otherwise, the EPA could begin to regulate GHG emissions under the Act. The specific requirements of regulation under the Act’s various programs, and thus their impact on the Utility, are uncertain at this time.
Although standards have not been developed at the national level, several states and regional organizations are developing, or already have developed, state-specific or regional legislative initiatives to reduce GHG emissions through mandatory programs. In 2007, the state of Minnesota passed legislation regarding renewable energy portfolio standards that will require retail electricity providers to obtain 25% of the electricity sold to Minnesota customers from renewable sources by the year 2025. The Minnesota Legislature set a January 1, 2008 deadline for the MPUC to establish an estimate of the likely range of costs of future CO2 regulation on electricity generation. The legislation also set state targets for reducing fossil fuel use, included goals for reducing the state’s output of GHGs, and restricted importing electricity that would contribute to statewide power sector CO2 emission. MPUC, in its order dated December 21, 2007, has established an estimate of future CO2 regulation cost at between $4/ton and $30/ton emitted in 2012 and after. Annual updates of the range are required, and the MPUC currently has a docket outstanding in which they have solicited comments in regard to establishing the 2009 annual update of estimates of the likely range of costs of future CO2 regulation on electricity regulation.
The states of North Dakota and South Dakota currently have no proposed or pending legislation related to the regulation of GHG emissions, but North Dakota and South Dakota have 10% renewable energy objectives.
25
While the eventual outcome of proposed and pending climate change legislation and GHG regulation is unknown, the Utility is taking steps to reduce its carbon footprint and mitigate levels of CO2 emitted in the process of generating electricity for its customers through the following initiatives:
While the future financial impact of any proposed or pending climate change legislation or regulation of GHG emissions is unknown at this time, any capital and operating costs incurred for additional pollution control equipment or CO2 emission reduction measures, such as the cost of sequestration or purchasing allowances, or offset credits, or the imposition of a carbon tax or cap and trade program at the state or federal level could materially adversely affect the Company’s future results of operations, cash flows, and possibly financial condition, unless such costs could be recovered through regulated rates and/or future market prices for energy.
26
• Supply efficiency and reliability: Between 1990 and 2005, the Utility decreased its CO2 intensity (lbs. of CO2 /mWh generated) nearly 11%. The Utility plans to more than double that reduction by 2025. Big Stone II, the Utility proposed new generating plant is designed to incorporate supercritical pulverized coal technology that will increase plant efficiency by 20% and produce fly-ash that can replace cement in making concrete. In addition, transmission capacity above that which was needed for the plant was included in order to encourage regional wind energy development.
• Conservation: Since 1992 the Utility has helped its customers conserve more than 1 million mWh of electricity. That is roughly equivalent to the amount of electricity that 90,000 average homes would have used in a year. The Utility continues to educate customers about energy efficiency and demand-side management and to work with regulators to develop new programs and measurements. The Utility’s integrated resource plan calls for an additional 98 MW of conservation impacts by 2020.
• Renewable energy: Since 2002 the Utility’s customers have been able to purchase 100% of their electricity from wind generation through the Utility’s TailWinds program. The MPUC has approved 160 MW of new wind generation in the most recent resource plan filing. Of that, 19.5 MW of purchased power agreements came on-line in December 2007 and 88.5 MW of owned wind resources were on-line by December 2008. Other projects are in the development phase and are expected to come on-line in the 2009 — 2010 time periods. The Utility has purchased all the electricity generated by fourteen 1.5 MW wind turbines located in southeastern North Dakota since 2004. The Utility supports Minnesota’s new law requiring 25% of the electricity sold to Minnesota customers be obtained from renewable resources by 2025, especially with its customer protection provisions. This new law was based on the MPUC’s Wind Integration Study, which assumed in its baseline the construction of the Big Stone II power plant and associated transmission. The Utility supports renewable energy objectives in North Dakota and South Dakota that 10% of all retail electricity sold within the states by the year 2015 is obtained from qualifying renewable energy sources.
• Other: The Utility will continue to participate as a member of the EPA’s SF6 (sulfur hexafluoride) Emission Reduction Partnership for Electric Power Systems program. The partnership proactively is targeting a reduction in emissions of SF6, a potent GHG. SF6 has a global-warming potential 23,900 times that of CO2. The Utility is involved in a pilot project to use methane from a municipal waste water treatment plant to generate electricity and is also studying the potential for other methane-related projects. Methane has a global-warming potential 20 times that of CO2. The Utility participates in carbon sequestration research through the Plains CO2 Reduction Partnership (PCOR) through the University of North Dakota’s Energy and Environment Research Center. The PCOR Partnership is a collaborative effort of more than 50 public and private sector stakeholders working toward a better understanding of the technical and economic feasibility of capturing and storing anthropogenic CO2 emissions from stationary sources in the central interior of North America.

Water Quality: The Federal Water Pollution Control Act Amendments of 1972, and amendments thereto, provide for, among other things, the imposition of effluent limitations to regulate discharges of pollutants, including thermal discharges, into the waters of the United States, and the EPA has established effluent guidelines for the steam electric power generating industry. Discharges must also comply with state water quality standards.
On February 16, 2004 the EPA Administrator signed the final Phase II rule implementing Section 316(b) of the Clean Water Act establishing standards for cooling water intake structures for certain existing facilities. Hoot Lake Plant is the Utility’s only facility that could be impacted by this rule. On January 25, 2007 the U.S. Court of Appeals for the Second Circuit remanded portions of the rule to the EPA. The Utility has completed an information collection program for the Hoot Lake Plant cooling water intake structure, but given the Court decision the Utility is uncertain of the impact on the facility at this time.
The Utility has all federal and state water permits presently necessary for the operation of the Coyote Station, the Big Stone Plant and the Hoot Lake Plant. The Utility owns five small dams on the Otter Tail River, which are subject to FERC licensing requirements. A license for all five dams was issued on December 5, 1991. Total nameplate rating (manufacturer’s expected output) of the five dams is 3,450 kW.
Solid Waste: Permits for disposal of ash and other solid wastes have either been issued or are under renewal for the Coyote Station, the Big Stone Plant and the Hoot Lake Plant.
At the request of the MPCA, the Utility has an ongoing investigation at its former, closed Hoot Lake Plant ash disposal sites. The MPCA continues to monitor site activities under their Voluntary Investigation and Cleanup Program. The Utility provided a revised focus feasibility study for remediation alternatives to the MPCA in October 2004. The Utility and the MPCA have reached an agreement identifying the remediation technology and the Utility completed the projects in 2006. The effectiveness of the remediation is under evaluation.
The EPA has promulgated various solid and hazardous waste regulations and guidelines pursuant to, among other laws, the Resource Conservation and Recovery Act of 1976, the Solid Waste Disposal Act Amendments of 1980 and the Hazardous and Solid Waste Amendments of 1984, which provide for, among other things, the comprehensive control of various solid and hazardous wastes from generation to final disposal. The States of Minnesota, North Dakota and South Dakota have also adopted rules and regulations pertaining to solid and hazardous waste. To date, the Utility has incurred no significant costs as a result of these laws. The future total impact on the Utility of the various solid and hazardous waste statutes and regulations enacted by the federal government or the States of Minnesota, North Dakota and South Dakota is not certain at this time.
In 1980, the United States enacted the Comprehensive Environmental Response, Compensation and Liability Act, commonly known as the Federal Superfund law, which was reauthorized and amended in 1986. In 1983, Minnesota adopted the Minnesota Environmental Response and Liability Act, commonly known as the Minnesota Superfund law. In 1988, South Dakota enacted the Regulated Substance Discharges Act, commonly known as the South Dakota Superfund law. In 1989, North Dakota enacted the Environmental Emergency Cost Recovery Act. Among other requirements, the federal and state acts establish environmental response funds to pay for remedial actions associated with the release or threatened release of certain regulated substances into the environment. These federal and state Superfund laws also establish liability for cleanup costs and damage to the environment resulting from such release or threatened release of regulated substances. The Minnesota Superfund law also creates liability for personal injury and economic loss under certain circumstances. The Utility has not incurred any significant costs to date related to these laws. The Utility is not presently named as a potentially responsible party under the federal or state Superfund laws.
27

Capital Expenditures
The Utility is continually expanding, replacing and improving its electric facilities. During 2008, approximately $199 million was invested for additions and replacements to its electric utility properties. During the five years ended December 31, 2008 gross electric property additions, including construction work in progress, were approximately $400.7 million and gross retirements were approximately $58.8 million.
The Utility estimates that during the five-year period 2009-2013 it will invest approximately $698 million for electric construction, which includes $395 million for its share of expected expenditures for construction of the planned Big Stone II electric generating plant and related transmission assets if all necessary permits and approvals are granted on a timely basis and $66 million for anticipated expansion of transmission capacity in Minnesota. Other significant portions of the 2009-2013 capital budgets include wind generation projects and upgrades to the Utility’s transmission system. If Big Stone II is not built, budgeted amounts for that project will be applied to alternative baseload generation projects that will be needed to meet the Utility’s future generation requirements. In addition the Utility continues to review another wind project called the Luverne Wind Farm. The expected cost of this 49.5 MW project is $100 to $110 million and is not included in five-year estimate above. This project is subject to the Utility’s ability to obtain acceptable financing terms and approval by the Company’s Board of Directors.
Franchises
At December 31, 2008 the Utility had franchises to operate as an electric utility in all but three incorporated municipalities that it serves. All franchises are nonexclusive and generally were obtained for 20-year terms, with varying expiration dates. No franchises are required to serve unincorporated communities in any of the three states that the Utility serves. The Utility believes that its franchises will be renewed prior to expiration.
Employees
At December 31, 2008 the Utility had approximately 697 equivalent full-time employees. A total of 421 employees are represented by local unions of the International Brotherhood of Electrical Workers. One labor contract was renewed in the fall of 2005 and has an expiration date in the fall of 2009. The other labor contract was renewed in the fall of 2008 and will expire in the fall of 2011. The Utility has not experienced any strike, work stoppage or strike vote, and considers its present relations with employees to be good.
28

PLASTICS
General
Plastics consist of businesses producing PVC pipe in the Upper Midwest and Southwest regions of the United States. The Company derived 9%, 12% and 15% of its consolidated operating revenues from the Plastics segment for each of the three years ended December 31, 2008, 2007 and 2006, respectively. The Company derived 5%, 15% and 28% of its consolidated income from continuing operations from the Plastics segment for each of the three years ended December 31, 2008, 2007 and 2006, respectively.
The following is a brief description of these businesses:
Northern Pipe Products, Inc. (Northern Pipe), located in Fargo, North Dakota, manufactures and sells PVC pipe for municipal water, rural water, wastewater, storm drainage systems and other uses in the Northern, Midwestern and Western regions of the United States as well as Central and Western Canada. Production facilities are located in Fargo, North Dakota and Hampton, Iowa.
Vinyltech Corporation (Vinyltech), located in Phoenix, Arizona, manufactures and sells PVC pipe for municipal water, wastewater, water reclamation systems and other uses in the Western, Southwestern and South-central regions of the United States.
Together these companies have the current capacity to produce approximately 220 million pounds of PVC pipe annually. The companies will have the capacity to produce approximately 300 million pounds annually once planned expansions are completed and brought on-line.
Customers
PVC pipe products are marketed through a combination of independent sales representatives, company salespersons and customer service representatives. Customers for the PVC pipe products consist primarily of wholesalers and distributors throughout the Upper Midwest, Southwest and Western United States.
Competition
The plastic pipe industry is highly fragmented and competitive, due to the large number of producers, the small number of raw material suppliers and the fungible nature of the product. Due to shipping costs, competition is usually regional, instead of national, in scope. The principal areas of competition are a combination of price, service, warranty and product performance. Northern Pipe and Vinyltech compete not only against other plastic pipe manufacturers, but also ductile iron, steel, concrete and clay pipe producers. Pricing pressure will continue to affect operating margins in the future.
Northern Pipe and Vinyltech intend to continue to compete on the basis of their high quality products, cost-effective production techniques and close customer relations and support.
Manufacturing and Resin Supply
PVC pipe is manufactured through a process known as extrusion. During the production process, PVC compound (a dry powder-like substance) is introduced into an extrusion machine, where it is heated to a molten state and then forced through a sizing apparatus to produce the pipe. The newly extruded pipe is then pulled through a series of water cooling tanks, marked to identify the type of pipe and cut to finished lengths. Warehouse and outdoor storage facilities are used to store the finished product. Inventory is shipped from storage to distributors and customers mainly by common carrier.
29

The PVC resins are acquired in bulk and shipped to point of use by rail car. Over the last several years, there has been consolidation in PVC resin producers. There are a limited number of third party vendors that supply the PVC resin used by Northern Pipe and Vinyltech. Two vendors provided approximately 94% and 95% of total resin purchases in 2008 and 2007, respectively. The supply of PVC resin may also be limited primarily due to manufacturing capacity and the limited availability of raw material components. A majority of U.S. resin production plants are located in the Gulf Coast region, which is subject to risk of damage to the plants and potential shutdown of resin production because of exposure to hurricanes that occur in that part of the United States. The loss of a key vendor, or any interruption or delay in the supply of PVC resin, could disrupt the ability of the Plastics segment to manufacture products, cause customers to cancel orders or require incurrence of additional expenses to obtain PVC resin from alternative sources, if such sources were available. Both Northern Pipe and Vinyltech believe they have good relationships with their key raw material vendors.
Due to the commodity nature of PVC resin and PVC pipe and the dynamic supply and demand factors worldwide, historically the markets for both PVC resin and PVC pipe have been very cyclical with significant fluctuations in prices and gross margins.
Capital Expenditures
Capital expenditures in the Plastics segment typically include investments in extrusion machines, land and buildings and management information systems. During 2008, capital expenditures of approximately $9 million were made in the Plastics segment. Total capital expenditures for the five-year period 2009-2013 are estimated to be approximately $18 million. Estimated capital expenditures include approximately $2 million for remaining plant expansion costs at Vinyltech. New plant expansion capacity is not expected to be brought on-line until the economy improves and demand for PVC pipe increases. Vinyltech’s plant expansion will include a new resin-blending system and two additional extrusion lines which will increase production capacity by 40% once they have been completed and brought on-line.
Employees
At December 31, 2008 the Plastics segment had approximately 130 full-time employees.
MANUFACTURING
General
Manufacturing consists of businesses engaged in the following activities: production of wind towers, contract machining, metal parts stamping and fabrication, and production of waterfront equipment, material and handling trays and horticultural containers.
The Company derived 36%, 31% and 28% of its consolidated operating revenues from the Manufacturing segment for each of the three years ended December 31, 2008, 2007 and 2006, respectively. The Company has one customer within the Manufacturing segment that accounted for approximately 10.6% of the Company’s consolidated revenues in 2008. The Company derived 15%, 29% and 26% of its consolidated income from continuing operations from the Manufacturing segment for each of the three years ended December 31, 2008, 2007 and 2006, respectively. The following is a brief description of each of these businesses:
BTD Manufacturing, Inc., with headquarters located in Detroit Lakes, Minnesota, is a metal stamping and tool and die manufacturer that provides its services mainly to customers in the Midwest. BTD stamps, fabricates, welds and laser cuts metal components according to manufacturers’ specifications primarily for the recreation vehicle, gas fireplace, health and fitness
30
and enclosure industries. BTD’s wholly owned subsidiary, Miller Welding, is located in Washington, Illinois and manufactures and fabricates parts for off-road equipment, mining machinery, oil fields and offshore oil rigs, wind industry components, broadcast antennae and farm equipment, and serves several major equipment manufacturers in the Peoria, Illinois area and nationwide, including Caterpillar, Komatsu and Gardner Denver.
DMI Industries, Inc., with headquarters located in West Fargo, North Dakota, engineers and manufactures wind towers and other heavy metal fabricated products. DMI has manufacturing facilities in West Fargo, North Dakota; Tulsa, Oklahoma; and Fort Erie, Ontario, Canada. DMI has a wholly owned subsidiary, DMI Canada, Inc. located in Fort Erie, Ontario, Canada.
ShoreMaster, Inc., with headquarters in Fergus Falls, Minnesota, produces and markets residential and commercial waterfront equipment, ranging from boatlifts and docks to full marina systems that are marketed throughout the United States. ShoreMaster has four wholly owned subsidiaries, Galva Foam Marine Industries, Inc., Shoreline Industries, Inc., Aviva Sports, Inc., and ShoreMaster Costa Rica Limitada. ShoreMaster has manufacturing facilities located in Fergus Falls and Pine River, Minnesota; Camdenton and Montreal, Missouri; and St. Augustine, Florida.
T. O. Plastics, Inc. (T.O. Plastics), located in Minneapolis and Clearwater, Minnesota, manufactures and sells thermoformed products for the horticulture industry throughout the United States. In addition, T. O. Plastics produces products such as clamshell packing, blister packs, returnable pallets and handling trays for shipping and storing odd-shaped or difficult-to-handle parts for other industries.
Competition
The various markets in which the Manufacturing segment entities compete are characterized by intense competition from both foreign and domestic manufacturers. These markets have many established manufacturers with broader product lines, greater distribution capabilities, greater capital resources, excess capacity, labor advantages and larger marketing, research and development staffs and facilities than the Company’s manufacturing entities.
The Company believes the principal competitive factors in its Manufacturing segment are product performance, quality, price, ease of use, technical innovation, cost effectiveness, customer service and breadth of product line. The Company’s manufacturing entities intend to continue to compete on the basis of high-performance products, innovative technologies, cost-effective manufacturing techniques, close customer relations and support, and increasing product offerings.
Raw Materials Supply
The companies in the Manufacturing segment use a variety of raw materials in the products they manufacture, including steel, aluminum, lumber, resin and concrete. Both pricing increases and availability of these raw materials are concerns of companies in the Manufacturing segment. The companies in the Manufacturing segment attempt to pass the increases in the costs of these raw materials on to their customers. Increases in the costs of raw materials that cannot be passed on to customers could have a negative effect on profit margins in the Manufacturing segment.
Backlog
The Manufacturing segment has backlog in place to support 2009 revenues of approximately $241 million compared with $295 million one year ago.
31

Legislation
The demand for wind towers manufactured by DMI depends in part on the existence of either renewable portfolio standards or a federal production tax credit for wind energy. Renewable portfolio standards or objectives exist in approximately one-half of the states. A federal production tax credit is in place through December 31, 2013.
Capital Expenditures
Capital expenditures in the Manufacturing segment typically include additional investments in new manufacturing equipment or expenditures to replace worn-out manufacturing equipment. Capital expenditures may also be made for the purchase of land and buildings for plant expansion and for investments in management information systems. During 2008, capital expenditures of approximately $48 million were made in the Manufacturing segment driven mainly by the DMI expansion projects in West Fargo, North Dakota and Tulsa, Oklahoma. Total capital expenditures for the Manufacturing segment during the five-year period 2009-2013 are estimated to be approximately $115 million. This investment is primarily to replace existing equipment at the manufacturing companies.
Employees
At December 31, 2008 the Manufacturing segment had approximately 1,850 full-time employees.
HEALTH SERVICES
General
Health Services consists of the DMS Health Group, which includes businesses involved in the sale of diagnostic medical equipment, patient monitoring equipment and related supplies and accessories. These businesses also provide equipment maintenance, diagnostic imaging services, and rental of diagnostic medical imaging equipment.
The Company derived 9%, 11% and 12% of its consolidated operating revenues from the Health Services segment for each of the three years ended December 31, 2008, 2007 and 2006, respectively. The decline in revenues between 2007 and 2008 reflects a change from the traditional dealership distribution of sales to an increase in manufacturer-direct sales commissions. The Company derived less than 1%, 3% and 4% of its consolidated income from continuing operations from the Health Services segment for each of the three years ended December 31, 2008, 2007 and 2006, respectively. The companies comprising the DMS Health Group that deliver diagnostic imaging and healthcare solutions across the United States include:
DMS Health Technologies, Inc. (DMSHT), located in Fargo, North Dakota, sells and services diagnostic medical imaging equipment, cardiac and other patient monitoring equipment, defibrillators, EKGs and related medical supplies and accessories and provides ongoing service maintenance. DMSHT sells radiology equipment primarily manufactured by Philips Medical Systems (Philips), a large multi-national company based in the Netherlands. Philips manufactures fluoroscopic, radiographic and vascular equipment, along with ultrasound, computerized tomography (CT), magnetic resonance imaging (MR), positron emission tomography (PET), PET/CT and cardiac catheterization labs. The business agreement with Philips has been renewed for a five year term ending on December 31, 2013. This agreement can be terminated on 180 days written notice by either party for any reason and can be terminated by Philips if certain compliance requirements are not met. DMSHT is also a supplier of medical film and related accessories. DMSHT markets mainly to hospitals, clinics and mobile imaging service companies.
32
DMS Imaging, Inc. (DMSI), a subsidiary of DMSHT located in Fargo, North Dakota, operates diagnostic medical imaging equipment, including CT, MRI, PET and PET/CT and provides nuclear medicine and other similar radiology services to hospitals, clinics, long-term care facilities and other medical providers. Regional offices are located in Minneapolis, Minnesota; Los Angeles, California; and Sioux Falls, South Dakota. DMS Imaging, Inc. provides services through four different business units:
Combined, the DMS Health Group covers the three basics of the medical imaging industry: (1) ownership and operation of the imaging equipment for healthcare providers; (2) sale, lease and/or maintenance of medical imaging equipment and related supplies; and (3) scheduling, billing and administrative support of medical imaging services.
Regulation
The healthcare industry is subject to extensive federal and state regulations relating to licensure, conduct of operation, ownership of facilities, payment of services and expansion or addition of facilities and services.
The federal Anti-Kickback Statute prohibits persons from knowingly and willfully soliciting, receiving, offering or providing remuneration, directly or indirectly, to induce the referral of an individual or the furnishing or arranging for a good or service for which payment may be made under a federal healthcare program such as Medicare or Medicaid. Several states have similar statutes. The term “remuneration” has been broadly interpreted to include anything of value, including, for example, gifts, discounts, credit arrangements, payments of cash, waiver of payments and ownership interests. Penalties for violating the Anti-Kickback Statute can include both criminal and civil sanctions as well as possible exclusion from participating in Medicare and other federal healthcare programs.
The Ethics and Patient Referral Act of 1989 (Stark Law) prohibits a physician from making referrals for certain designated health services payable under Medicare, including services provided by the Health Services companies, to an entity with which the physician has a financial relationship, unless certain exceptions apply. The Stark Law also prohibits an entity from billing for designated health services pursuant to a prohibited referral. A person who engages in a scheme to violate the Stark Law or a person who presents a claim to Medicare in violation of the Stark Law may be subject to civil fines and possible exclusion from participation in federal healthcare programs. Several states have similar statutes, the violation of which can result in civil fines and possible exclusion from state healthcare programs. The Center for Medicare and Medicaid Services (CMS) is currently considering additional modifications to the Stark Law that may further limit the ability of physicians to provide certain imaging services in their practices.
The federal False Claims Act imposes liability on those who knowingly present or cause to be presented a false or fraudulent claim for payment to the federal government. “Knowingly” has been defined to include actions in deliberate ignorance and reckless disregard of the truth or falsity of such information. A suit under the False Claims Act can be brought directly by the United States Department
33
• DMS Imaging — provides shared diagnostic medical imaging services (primarily mobile) for MR, CT, nuclear medicine, PET, PET/CT, ultrasound, mammography and bone density analysis.
• DMS Interim Solutions — offers interim and rental options for diagnostic imaging services.
• DMS MedSource Partners — develops long-term relationships with healthcare providers to offer dedicated in-house diagnostic imaging services.
• DMS Portable X-Ray — delivers portable x-ray, ultrasound and electrocardiography services to nursing homes and other facilities.

of Justice, or can be brought by a “whistleblower.” A whistleblower brings suit on behalf of themselves and the United States, and the whistleblower is awarded a percentage of any recovery. Conduct that has given rise to False Claims Act liability includes but is not limited to current and past failures to comply with technical Medicare and Medicaid billing requirements, failure to comply with certain Medicare documentation requirements, and failure to comply with Medicare physician supervision requirements. Violations of the Stark Law and Anti-Kickback Statute have also served as the basis of False Claims Act liability. Many states have adopted or are seeking to adopt state false claims act laws modeled on the federal statute.
The Health Insurance Portability and Accountability Act of 1996 (HIPAA) created federal crimes related to healthcare fraud and to making false statements related to healthcare matters. HIPAA prohibits knowingly and willfully executing a scheme to defraud any healthcare benefit program including a program involving private payors. Further, HIPAA prohibits knowingly and willfully falsifying, concealing or covering up a material fact or making any materially false statement in connection with the delivery of or payment for healthcare benefits or services.
In some states a certificate of need or similar regulatory approval is required prior to the acquisition of high-cost capital items or services, including diagnostic imaging systems or the provision of diagnostic imaging services by companies or its customers. Certificate of need laws were enacted to contain rising healthcare costs by preventing unnecessary duplication of health resources.
DMSI maintains a limited number of Independent Diagnostic Testing Facilities (IDTFs) that enroll in the Medicare program as participating Medicare suppliers, so that they may receive reimbursement directly from the Medicare program for services provided to Medicare beneficiaries. CMS rule changes, effective January 1, 2008 increased oversight of IDTFs. These regulations delineate certain stringent performance standards for IDTFs including standards for physical facilities, patient privacy, technician qualifications, insurance, equipment inspections, reporting changes to CMS, physician supervision, and manner in which IDTFs are defined and enrolled in Medicare. These standards also include a provision prohibiting certain staff or space sharing arrangements. CMS implemented additional rule changes effective January 1, 2009 which may require some IDTFs to alter billing arrangements with healthcare clients.
The final rules published as part of the 2008 Medicare Physician Fee Schedule also alter the scope of the federal anti-markup rule for diagnostic tests, a federal law which delineates instances when physicians and other suppliers are prohibited from marking-up to Medicare the price of diagnostic tests when the physician performing or supervising the test does not share a practice with the billing physician or other supplier.
CMS has also finalized new regulations that require suppliers of mobile diagnostic services under certain circumstances to enroll in the Medicare program for diagnostic tests that they perform and to bill Medicare directly these tests. Medicare has published guidance indicating that entities that lease equipment and technicians need not enroll in Medicare and bill directly for tests performed. Both the changes to the Medicare anti-markup rule and the mobile diagnostic testing rules are recent regulations that are subject to interpretation by Medicare and local Medicare carriers, and could require us to make operational changes. Furthermore, if we are found not to be in compliance with these rules, or if Medicare reimbursement available to certain customers is impaired by these rules, our business could be adversely affected.
Additional federal and state regulations that the Health Services companies are subject to include state laws that prohibit the practice of medicine by non-physicians and prohibit fee-splitting arrangements involving physicians; Federal Food and Drug Administration requirements; state licensing and certification requirements; and federal and state laws governing diagnostic imaging and therapeutic equipment. Courts and regulatory authorities have not fully interpreted a significant number of the current laws and regulations.
34

The Health Services companies continue to monitor developments in healthcare law. The Health Services companies believe their operations comply with these laws and they are prepared to modify their operations from time to time as the legal and regulatory environment changes. However, there can be no assurances that the Health Services companies will always be able to modify their operations to address changes in the legal and regulatory environment without any adverse effect to their financial performance. The consequences of failing to comply with applicable laws can be severe. Laws such as the Anti-Kickback Statute and HIPAA carry criminal penalties. In many instances violations of applicable law can result in substantial fines and damages. Moreover, in some cases violations of applicable law can result in exclusion in participation in federal and state healthcare programs. If any of the Health Services companies were excluded from participation in federal or state healthcare programs, our customers who participate in those programs could not do business with us.
Reimbursement
The companies in the Health Services segment derive significant revenue from direct billings to customers and third-party payors such as Medicare, Medicaid, managed care and private health insurance companies for their diagnostic imaging services. The Health Services’ customers are primarily healthcare providers who receive the majority of their payments from third-party payors. Payments by third-party payors to such healthcare providers depend, in part, upon their patients’ health insurance policies.
New Medicare regulations reduced 2006 Medicare reimbursement for certain imaging services performed on contiguous body parts during the same day. In addition, the Deficit Reduction Act of 2005 (the DRA) limits reimbursement for imaging services provided in physician offices and in free-standing imaging centers to the reimbursement amount for that same service when provided in a hospital outpatient department. This DRA provision impacts a small number of imaging services provided by the Health Services segment. Federal and state legislatures may seek additional cuts in Medicare and Medicaid programs that could impact the value of the services provided by the Health Services segment.
Competition
The market for selling, servicing and operating diagnostic imaging services, patient monitoring equipment and imaging systems is highly competitive. In addition to direct competition from other providers of items and services similar to those offered by the Health Services companies, the companies within Health Services compete with free-standing imaging centers and health care providers that have their own diagnostic imaging systems, as well as with equipment manufacturers that sell imaging equipment directly to healthcare providers for permanent installation. Some of the direct competitors, which provide contract MR and PET/CT services, have access to greater financial resources than the Health Services companies. In addition, some of Health Services’ customers are capable of providing the same services to their patients directly, subject only to their decision to acquire a high-cost diagnostic imaging system, assume the financial and technology risk, and employ the necessary technologists, rather than obtain the services from the Health Services company. The Health Services companies may also experience greater competition in states that currently have certificate of need laws if such laws were repealed, thereby reducing barriers to entry and competition in that state. The Health Services companies compete against other similar providers on the basis of quality of services, quality and magnetic field strength of imaging systems, relationships with health care providers, knowledge and service quality of technologists, price, availability and reliability.
35
Environmental, Health or Safety Laws
PET, PET/CT and nuclear medicine services require the use of radioactive material. While this material has a short life and quickly breaks down into inert, or non-radioactive substances, using such materials presents the risk of accidental environmental contamination and physical injury. Federal, state and local regulations govern the storage, use and disposal of radioactive material and waste products. The Company believes that its safety procedures for storing, handling and disposing of these hazardous materials comply with the standards prescribed by law and regulation; however the risk of accidental contamination or injury from those hazardous materials cannot be completely eliminated. The companies in the Health Services segment have not had any material expenses related to environmental, health or safety laws or regulations.
Capital Expenditures
Capital expenditures in this segment principally relate to the acquisition of diagnostic imaging equipment used in the imaging business. During 2008, capital expenditures of approximately $4 million were made in the Health Services segment. Total capital expenditures during the five-year period 2009-2013 are estimated to be approximately $27 million. Operating leases are also used to finance the acquisition of medical equipment used by Health Services companies. Current operating lease commitments during the five-year period 2009-2013 are estimated to be $76 million.
Employees
At December 31, 2008 the Health Services segment had approximately 357 full-time employees.
FOOD INGREDIENT PROCESSING
General
Food ingredient processing consists of Idaho Pacific Holdings, Inc. IPH, headquartered in Ririe, Idaho, manufactures and supplies dehydrated potato products to food manufacturers in the snack food, foodservice and bakery industries. IPH has three processing facilities located in Ririe, Idaho; Center, Colorado; and Souris, Prince Edward Island, Canada. Together these three facilities have the capacity to process approximately 114 million pounds of dehydrated potato products annually.
The Company derived 5%, 6% and 4% of its consolidated operating revenues from the Food Ingredient Processing segment for each of the years ended December 31, 2008, 2007 and 2006, respectively. This segment’s contribution to consolidated income from continuing operations for each of three years ended December 31, 2008, 2007 and 2006 was 5%, 8% and (8%), respectively.
Customers
IPH sells to customers in the United States and internationally. Products are sold through company sales persons and broker sales representatives. Customers include end users in the food ingredient industries and distributors to the food ingredient industries and foodservice industries, both domestically and internationally.
Competition
The market for processed, dehydrated potato flakes, flour and granules is highly competitive. The ability to compete depends on superior product quality, competitive product pricing and strong customer relationships. IPH competes with numerous manufacturers and dehydrators of varying sizes in the United States and overseas, including companies with greater financial resources.
36
Potato Supply
The principal raw material used by IPH is washed process-grade potatoes from fresh packing operations and growers. These potatoes are unsuitable for use in other markets due to imperfections. They do not meet United States Department of Agriculture’s general requirements and expectations for size, shape or color. While IPH has processing capabilities in three geographically distinct growing regions, there can be no assurance it will be able to obtain raw materials due to poor growing conditions, a loss of key growers and other factors. A loss of raw materials or the necessity of paying much higher prices for raw materials could adversely affect the financial performance of IPH.
Backlog
IPH has backlog in place for 2009 of approximately 48 million pounds compared with 52 million pounds one year ago.
Regulations
IPH is regulated by the United States Department of Agriculture and the Federal Food and Drug Administration and other federal, state, local and foreign governmental agencies relating to the quality of products, sanitation, safety and environmental control. IPH adheres to strict manufacturing practices that dictate sanitary conditions conducive to a high quality food product. All facilities use wastewater systems that are regulated by government environmental agencies in their respective locations and are subject to permitting by these agencies. IPH believes that it complies with applicable laws and regulations in all material respects, and that continued compliance with such laws and regulations will not have a material effect on its capital expenditures, earnings or competitive position.
Capital Expenditures
Capital expenditures in the Food Ingredient Processing segment typically include additional investments in new dehydration equipment or expenditures to replace worn-out equipment and improve efficiency. Capital expenditures may also be made for the purchase of land and buildings for plant capacity expansion and for investments in management information systems. During 2008, capital expenditures of $2 million were made in the Food Ingredient Processing segment. Total capital expenditures for the Food Ingredient Processing segment during the five-year period 2009-2013 are estimated to be approximately $14 million.
Employees
At December 31, 2008 the Food Ingredient Processing segment had approximately 375 full-time employees.
OTHER BUSINESS OPERATIONS
General
Other Business Operations consists of businesses in residential, commercial and industrial electric contracting industries; fiber optic and electric distribution systems; wastewater and HVAC systems construction; transportation and energy services.
The Company derived 15%, 15% and 13% of its consolidated operating revenues from the Other Business Operations segment for each of the years ended December 31, 2008, 2007 and 2006, respectively. This segment’s contribution to consolidated income from continuing operations for each of
37

the three years ended December 31, 2008, 2007 and 2006 was 15%, 8% and 10%, respectively. Following is a brief description of the businesses included in this segment.
Foley Company, headquartered in Kansas City, Missouri, provides mechanical and prime contracting services for water and wastewater treatment plants, power generation plants, hospital and pharmaceutical facilities, and other industrial and manufacturing projects across a multi-state service area in the Central United States.
Midwest Construction Services, Inc. (MCS), located in Moorhead, Minnesota, is a holding company for subsidiaries that provide a full spectrum of electrical design and construction services for the industrial, commercial and municipal business markets, including government, institutional, utility communications, electric distribution and renewable energy generation.
Otter Tail Energy Services Company, headquartered in Fergus Falls, Minnesota, provides technical and engineering services and energy efficient lighting primarily in North Dakota and Minnesota.
E. W. Wylie Corporation (Wylie), located in West Fargo, North Dakota, is a flatbed, heavy-haul and specialized contract and common carrier operating a fleet of tractors and trailers in 48 states and four Canadian provinces. During 2008 Wylie developed heavy-haul and wind tower transport operations. Wylie has trucking terminals in West Fargo, North Dakota; Fort Worth, Texas; Denver, Colorado; and Albertville, Minnesota.
Competition
Each of the businesses in Other Business Operations is subject to competition, as well as the effects of general economic conditions in their respective industries. The construction companies in this segment must compete with other construction companies in the Upper Midwest and the Central regions of the United States, including companies with greater financial resource, when bidding on new projects. The Company believes the principal competitive factors in the construction segment are price, quality of work and customer service.
The trucking industry, in which Wylie participates, is highly competitive. Wylie competes primarily with other short- to medium-haul, flatbed truckload carriers, internal shipping conducted by existing and potential customers and, to a lesser extent, railroads. Wylie recently entered the transportation market with specialized heavy-haul trucks and trailers capable of hauling wind tower sections. Competition for the freight transported by Wylie is based primarily on safety, service, efficiency and freight rates. There are other trucking companies that have greater financial resources, operate more equipment or carry a larger volume of freight than Wylie and these companies compete with Wylie for qualified drivers.
Backlog
The construction companies in the Other Business Operations segment have backlog in place of $71 million for 2009 compared with $77 million one year ago.
Capital Expenditures
Capital expenditures in this segment typically include investments in additional trucks, trailers and construction equipment. During 2008, capital expenditures of approximately $4 million were made in Other Business Operations. Capital expenditures during the five-year period 2009-2013 are estimated to be approximately $11 million for Other Business Operations. Operating leases are also used to finance the
38

acquisition of trucks used by Wylie. Current operating lease commitments during the five-year period 2009-2013 are estimated to be $13 million.
Employees
At December 31, 2008 there were approximately 696 full-time employees in Other Business Operations. Moorhead Electric, Inc., a subsidiary of MCS, has 60 employees represented by local unions of the International Brotherhood of Electrical Workers and covered by a labor contract that expires on May 1, 2010. Foley Company has 230 employees represented by various unions, including Carpenters and Millwrights, Sheet Metal Workers, Laborers, Operators, Operating Engineers, Pipe Fitters, Steamfitters, Plumbers and Teamsters. Foley Company has several labor contracts with various expiration dates in 2009 and 2010. Moorhead Electric, Inc. and Foley Company have not experienced any strike, work stoppage or strike vote, and consider their present relations with employees to be good.
Forward-Looking Information — Safe Harbor Statement Under the Private Securities Litigation Reform Act of 1995
This Annual Report on Form 10-K contains forward-looking statements within the meaning of the Private Securities Litigation Reform Act of 1995 (the Act). When used in this Form 10-K and in future filings by the Company with the Securities and Exchange Commission, in the Company’s press releases and in oral statements, words such as “may,” “will,” “expect,” “anticipate,” “continue,” “estimate,” “project,” “believes” or similar expressions are intended to identify forward-looking statements within the meaning of the Act. Such statements are based on current expectations and assumptions, and entail various risks and uncertainties that could cause actual results to differ materially from those expressed in such forward-looking statements.
The following factors, among others, could cause actual results for the Company to differ materially from those discussed in the forward-looking statements:
39
• The Company is subject to federal and state legislation, regulations and actions that may have a negative impact on the Company’s business and results of operations.
• Actions by the regulators of the Company’s electric segment could result in rate reductions, lower revenues and earnings or delays in recovering capital expenditures.
• Future operating results of the electric segment will be impacted by the outcome of a rate case filed in North Dakota on November 3, 2008 requesting an overall increase in North Dakota rates of 5.14%. The filing included a request for an interim rate increase of 4.07%, which went into effect on January 1, 2009. Interim rates will remain in effect for all North Dakota customers until the NDPSC makes a final determination on the Utility’s request, which is expected by August 1, 2009. If final rates are lower than interim rates, the Utility will refund North Dakota customers the difference with interest.
• Any significant impairment of the Company’s goodwill would cause a decrease in the Company’s assets and a reduction in its net operating performance.
• A sustained decline in the Company’s common stock price below book value may result in goodwill impairments that could adversely affect the Company’s results of operations and financial position, as well as credit facility covenants.
• The terms of some of the Company’s contracts could expose it to unforeseen costs and costs not within its control, which may not be recoverable and could adversely affect its results of operations and financial condition.
• The Company is subject to risks associated with energy markets.
40
• Certain of the Company’s operating companies sell products to consumers that could be subject to recall.
• Future operating results of the Company’s electric segment will be impacted by the outcome of rate rider filings in Minnesota for transmission investments.
• Certain costs currently included in the FCA in retail rates may be excluded from recovery through the FCA but may be subject to recovery through rates established in a general rate case.
• Weather conditions or changes in the weather patterns can adversely affect the Company’s operations and revenues.
• Electric wholesale margins could be further reduced as the MISO market becomes more efficient.
• Electric wholesale trading margins could be reduced or eliminated by losses due to trading activities.
• The Company’s electric generating facilities are subject to operational risks that could result in unscheduled plant outages, unanticipated operation and maintenance expenses and increased power purchase costs.
• Wholesale sales of electricity from excess generation could be affected by reductions in coal shipments to the Big Stone and Hoot Lake plants due to supply constraints or rail transportation problems beyond the Company’s control.
• The Company’s electric segment has capitalized $11.6 million in costs related to the planned construction of a second electric generating unit at its Big Stone Plant site as of December 31, 2008. If the project is abandoned for permitting or other reasons, a portion of these capitalized costs and others incurred in future periods may be subject to expense and may not be recoverable.
• Federal and state environmental regulation could cause the Company to incur substantial capital expenditures and increased operating costs.
• Existing or new laws or regulations addressing climate change or reductions of GHG emissions by federal or state authorities, such as mandated levels of renewable generation or mandatory reductions in CO2 emission levels or taxes on CO2 emissions, that result in increases in electric service costs could negatively impact the Company’s net income, financial position and operating cash flows if such costs cannot be recovered through rates granted by ratemaking authorities in the states where the Utility provides service or through increased market prices for electricity.
• The Company may not be able to respond effectively to deregulation initiatives in the electric industry, which could result in reduced revenues and earnings.
• If the Company is unable to achieve the organic growth it expects, its financial performance may be adversely affected.
• The Company’s plans to grow and diversify through acquisitions and capital projects may not be successful and could result in poor financial performance.
• The Company’s plans to acquire, grow and operate the Company’s nonelectric businesses could be limited by state law.
41
• Competition is a factor in all of the Company’s businesses.
• Economic uncertainty could have an adverse impact on the Company’s future revenues and expenses.
• Volatile financial markets and changes in the Company’s debt rating could restrict the Company’s ability to access capital and could increase borrowing costs and pension plan expenses. Disruptions, uncertainty or volatility in the financial markets can also adversely impact the results of operations, the ability of customers to finance purchases of goods and services, and the financial condition of the Company as well as exert downward pressure on stock prices and/or limit the Company’s ability to sustain its current common stock dividend level.
• As of December 31, 2008, the Company’s defined benefit pension plan assets had declined significantly since December 31, 2007. The Company is not required to make a mandatory contribution to the pension plan in 2009. However, if the market value of pension plan assets continues to decline and relief under the Pension Protection Act is no longer granted, the Company could be required to contribute capital to the pension plan in 2009.
• The price and availability of raw materials could affect the revenue and earnings of the Company’s manufacturing segment.
• The Company’s food ingredient processing segment operates in a highly competitive market and is dependent on adequate sources of raw materials for processing. Should the supply of these raw materials be affected by poor growing conditions, this could negatively impact the results of operations for this segment.
• The Company’s food ingredient processing and wind tower manufacturing businesses could be adversely affected by changes in foreign currency exchange rates.
• The Company’s plastics segment is highly dependent on a limited number of vendors for PVC resin, many of which are located in the Gulf Coast regions, and a limited supply of resin. The loss of a key vendor or an interruption or delay in the supply of PVC resin could result in reduced sales or increased costs for this business. Reductions in PVC resin prices could negatively impact PVC pipe prices, profit margins on PVC pipe sales and the value of PVC pipe held in inventory.
• Changes in the rates or method of third-party reimbursements for diagnostic imaging services could result in reduced demand for those services or create downward pricing pressure, which would decrease revenues and earnings for the Company’s health services segment.
• The Company’s health services businesses may be unable to continue to maintain the agreements with Philips Medical from which it derives significant revenues from the sale and service of Philips Medical diagnostic imaging equipment.
• Technological change in the diagnostic imaging industry could reduce the demand for diagnostic imaging services and require the Company’s health services operations to incur significant costs to upgrade their equipment.
• Actions by regulators of the Company’s health services operations could result in monetary penalties or restrictions in the Company’s health services operations.
• A significant failure or an inability to properly bid or perform on projects by the Company’s construction businesses could lead to adverse financial results.

A further discussion of risk factors and cautionary statements is set forth under “Risk Factors and Cautionary Statements” and “Critical Accounting Policies Involving Significant Estimates” in “Management’s Discussion and Analysis of Financial Condition and Results of Operations” on pages 29 through 36 of the Company’s 2008 Annual Report to Shareholders, filed as an Exhibit hereto. These factors are in addition to any other cautionary statements, written or oral, which may be made or referred to in connection with any forward-looking statement or contained in any subsequent filings by the Company with the Securities and Exchange Commission. The Company undertakes no obligation to correct or update any forward-looking statement, whether as a result of new information, future events or otherwise.
Item 1A. RISK FACTORS
The information required by this Item is incorporated by reference to “Management’s Discussion and Analysis of Financial Condition and Results of Operations — Risk Factors and Cautionary Statements” on Pages 29 through 34 of the Company’s 2008 Annual Report to Shareholders, filed as an Exhibit hereto.
Item 1B. UNRESOLVED STAFF COMMENTS
None.
Item 2. PROPERTIES
The Coyote Station, which commenced operation in 1981, is a 414,000 kW (nameplate rating) mine-mouth plant located in the lignite coal fields near Beulah, North Dakota and is jointly owned by the Utility, Northern Municipal Power Agency, Montana-Dakota Utilities Co. and Northwestern Public Service Company. The Utility is the operating agent of the Coyote Station and owns 35% of the plant.
The Utility, jointly with Northwestern Public Service Company and Montana-Dakota Utilities Co., owns the 414,000 kW (nameplate rating) Big Stone Plant in northeastern South Dakota which commenced operation in 1975. The Utility is the operating agent of Big Stone Plant and owns 53.9% of the plant.
Located near Fergus Falls, Minnesota, the Hoot Lake Plant is comprised of three separate generating units with a combined nameplate rating of 127,000 kW. The oldest Hoot Lake Plant generating unit was constructed in 1948 (7,500 kW nameplate rating) and was retired on December 31, 2005. A second unit was added in 1959 (53,500 kW nameplate rating) and a third unit was added in 1964 (66,000 kW nameplate rating) and modified in 1988 to provide cycling capability, allowing this unit to be more efficiently brought online from a standby mode.
The Utility owns 27 wind turbines at the Langdon, North Dakota Wind Energy Center with a nameplate rating of 40,500 kW and 32 wind turbines at the Ashtabula Wind Energy Center located in Barnes County, North Dakota with a nameplate rating of 48,000 kW.
As of December 31, 2008 the Utility’s transmission facilities, which are interconnected with lines of other public utilities, consisted of 48 miles of 345 kV lines; 405 miles of 230 kV lines; 799 miles of 115 kV lines; and 4,039 miles of lower voltage lines, principally 41.6 kV. The Utility owns the uprated portion of the 48 miles of the 345 kV line, with Minnkota Power Cooperative retaining title to the original 230 kV construction.
42
In addition to the properties mentioned above, the Company owns and has investments in offices and service buildings. The Company’s subsidiaries own facilities and equipment used to manufacture PVC pipe, produce dehydrated potato products and perform metal stamping, fabricating and contract machining; construction equipment and tools; wind towers and other heavy metal fabricated products; thermoformed products; commercial and waterfront equipment; medical imaging equipment and a fleet of flatbed trucks and trailers.
Management of the Company believes the facilities and equipment described above are adequate for the Company’s present businesses.
Item 3. LEGAL PROCEEDINGS
Sierra Club Complaint
On June 10, 2008 the Sierra Club filed a complaint in the U.S. District Court for the District of South Dakota (Northern Division) against the Company and two other co-owners of Big Stone. The complaint alleges certain violations of the Prevention of Significant Deterioration and New Source Performance Standards (NSPS) provisions of the Clean Air Act and certain violations of the South Dakota State Implementation Plan (South Dakota SIP). The action further alleges the defendants modified and operated Big Stone without obtaining the appropriate permits, without meeting certain emissions limits and NSPS requirements and without installing appropriate emission control technology, all allegedly in violation of the Clean Air Act and the South Dakota SIP. The Sierra Club alleges the defendants’ actions have contributed to air pollution and visibility impairment and have increased the risk of adverse health effects and environmental damage. The Sierra Club seeks both declaratory and injunctive relief to bring the defendants into compliance with the Clean Air Act and the South Dakota SIP and to require the defendants to remedy the alleged violations. The Sierra Club also seeks unspecified civil penalties, including a beneficial mitigation project. The Company believes these claims are without merit and that Big Stone has been and is being operated in compliance with the Clean Air Act and the South Dakota SIP. The ultimate outcome of these matters cannot be determined at this time.
Federal Power Act Complaint
On August 29, 2008 Renewable Energy System Americas, Inc. (RES), a developer of wind generation and PEAK Wind Development, LLC (PEAK Wind), a group of landowners in Barnes County, North Dakota, filed a complaint with the FERC alleging that the Utility and Minnkota Power Cooperative, Inc. (Minnkota) had acted together in violation of the Federal Power Act (FPA) to deny RES/PEAK Wind access to the Pillsbury Line, an interconnection facility which Minnkota owns to interconnect generation projects being developed by the Utility and NextEra Energy Resources, Inc. (fka FPL Energy, Inc.) (NextEra). RES/PEAK Wind asked that (1) the FERC order Minnkota to interconnect its Glacier Ridge project to the Pillsbury Line, or in the alternative, (2) the FERC direct MISO to interconnect the Glacier Ridge project to the Pillsbury Line. RES and Peak Wind also requested that the Utility, Minnkota and NextEra pay any costs associated with interconnecting the Glacier Ridge Project to the MISO transmission system which would result from the interconnection of the Pillsbury Line to the Minnkota transmission system, and that the FERC assess civil penalties against the Utility. The Utility answered the Complaint on September 29, 2008, denying the allegations of RES and PEAK Wind and requesting that the FERC dismiss the Complaint. On October 14, 2008, RES and PEAK Wind filed an Answer to the Utility’s Answer and, restated the allegations included in the initial Complaint. RES and PEAK Wind also added a request that the FERC rescind both the Utility’s waiver from the FERC Standards of Conduct and its market-based rate authority. On October 28, 2008, the Utility filed a Reply, denying the allegations made by RES and PEAK Wind in its Answer. By Order issued on December 19, 2008, the Commission set the Complaint for hearing and established settlement procedures. The parties are engaged in settlement discussions. The Company believes the claims that the Utility has violated the FPA are without merit. The ultimate outcome of this matter cannot be determined at this time.
43
The Company is the subject of various pending or threatened legal actions and proceedings in the ordinary course of its business. Such matters are subject to many uncertainties and to outcomes that are not predictable with assurance. The Company records a liability in its consolidated financial statements for costs related to claims, including future legal costs, settlements and judgments, where it has assessed that a loss is probable and an amount can be reasonably estimated. The Company believes the final resolution of currently pending or threatened legal actions and proceedings, either individually or in the aggregate, will not have a material adverse effect on the Company’s consolidated financial position, results of operations or cash flows.
Item 4. SUBMISSION OF MATTERS TO A VOTE OF SECURITY HOLDERS
No matters were submitted to a vote of security holders during the three months ended December 31, 2008.
Item 4A. EXECUTIVE OFFICERS OF THE REGISTRANT (AS OF FEBRUARY 27, 2009)
Set forth below is a summary of the principal occupations and business experience during the past five years of the executive officers as defined by rules of the Securities and Exchange Commission. Except as noted below, each of the executive officers has been employed by the Company for more than five years in an executive or management position either with the Company or its wholly owned subsidiary, Varistar.
With the exception of Charles S. MacFarlane, the term of office for each of the executive officers is one year and any executive officer elected may be removed by the vote of the Board of Directors at any time during the term. Mr. MacFarlane is not appointed by the Board of Directors. Mr. MacFarlane is a son of John MacFarlane, who is the Chairman of the Board of Directors. There are no other family relationships between any of the executive officers or directors.
44
NAME AND AGE DATES ELECTED TO OFFICE PRESENT POSITION AND BUSINESS EXPERIENCE
John D. Erickson (50)
4/8/02
Present:
President and Chief Executive Officer
George A. Koeck (56)
4/10/00
Present:
Corporate Secretary and General Counsel
Lauris N. Molbert (51)
6/10/02
Present:
Executive Vice President and Chief Operating Officer
Kevin G. Moug (49) 4/9/01 Present: Chief Financial Officer Charles S. MacFarlane (44) 5/1/03 Present: President, Otter Tail Power Company
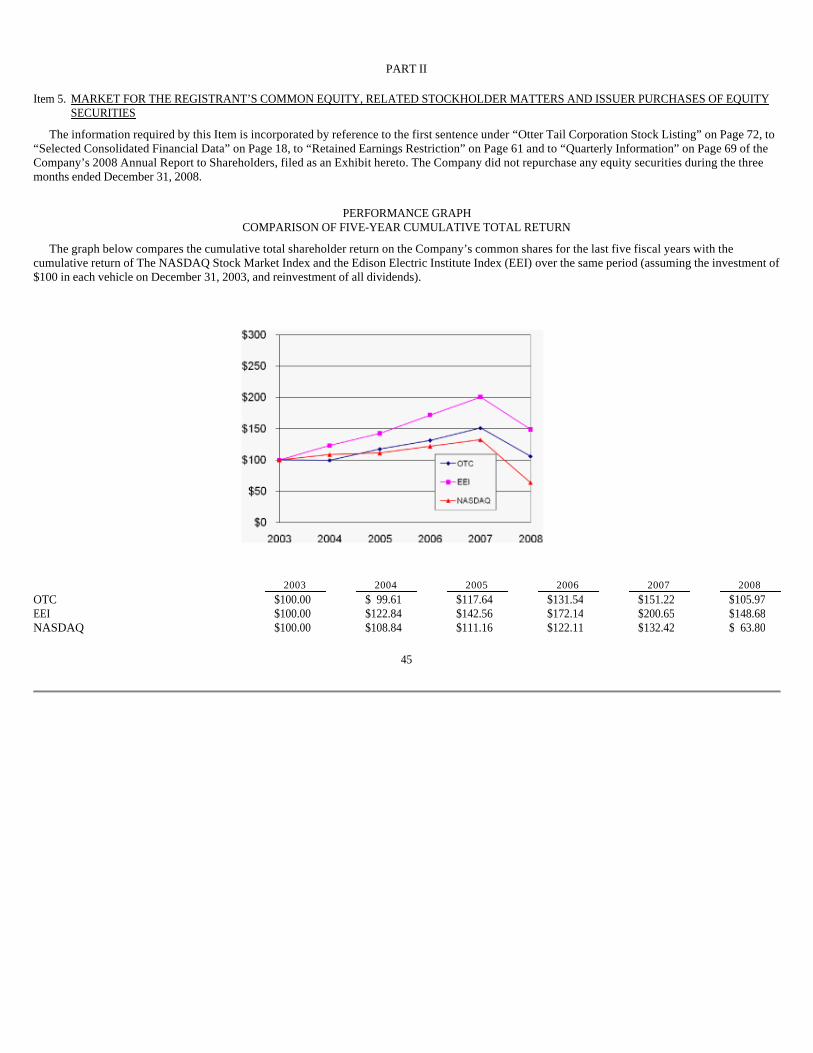
PART II
The information required by this Item is incorporated by reference to the first sentence under “Otter Tail Corporation Stock Listing” on Page 72, to “Selected Consolidated Financial Data” on Page 18, to “Retained Earnings Restriction” on Page 61 and to “Quarterly Information” on Page 69 of the Company’s 2008 Annual Report to Shareholders, filed as an Exhibit hereto. The Company did not repurchase any equity securities during the three months ended December 31, 2008.
PERFORMANCE GRAPH COMPARISON OF FIVE-YEAR CUMULATIVE TOTAL RETURN
The graph below compares the cumulative total shareholder return on the Company’s common shares for the last five fiscal years with the cumulative return of The NASDAQ Stock Market Index and the Edison Electric Institute Index (EEI) over the same period (assuming the investment of $100 in each vehicle on December 31, 2003, and reinvestment of all dividends).
45
Item 5. MARKET FOR THE REGISTRANT’S COMMON EQUITY, RELATED STOCKHOLDER MATTERS AND ISSUER PURCHASES OF EQUITY SECURITIES
2003 2004 2005 2006 2007 2008
OTC $100.00 $ 99.61 $117.64 $131.54 $151.22 $105.97 EEI $100.00 $122.84 $142.56 $172.14 $200.65 $148.68 NASDAQ $100.00 $108.84 $111.16 $122.11 $132.42 $ 63.80

The information required by this Item is incorporated by reference to “Selected Consolidated Financial Data” on Page 18 of the Company’s 2008 Annual Report to Shareholders, filed as an Exhibit hereto.
The information required by this Item is incorporated by reference to “Management’s Discussion and Analysis of Financial Condition and Results of Operations” on Pages 19 through 37 of the Company’s 2008 Annual Report to Shareholders, filed as an Exhibit hereto.
The information required by this Item is incorporated by reference to “Quantitative and Qualitative Disclosures About Market Risk” on Pages 32 through 34 of the Company’s 2008 Annual Report to Shareholders, filed as an Exhibit hereto.
The information required by this Item is incorporated by reference to “Quarterly Information” on Page 69, the Company’s audited financial statements on Pages 39 through 69 and “Report of Independent Registered Public Accounting Firm” on Page 38 of the Company’s 2008 Annual Report to Shareholders, filed as an Exhibit hereto.
None.
Under the supervision and with the participation of the Company’s management, including the Chief Executive Officer and the Chief Financial Officer, the Company evaluated the effectiveness of the design and operation of its disclosure controls and procedures (as defined in Rule 13a-15(e) under the Securities Exchange Act of 1934 (the Exchange Act)) as of December 31, 2008, the end of the period covered by this report. Based on that evaluation, the Chief Executive Officer and Chief Financial Officer concluded that the Company’s disclosure controls and procedures were effective as of December 31, 2008.
There were no changes in the Company’s internal control over financial reporting (as defined in Rules 13a-15(f) under the Exchange Act) during the fourth quarter ended December 31, 2008 that has materially affected, or is reasonably likely to materially affect, the Company’s internal control over financial reporting.
The annual report of the Company’s management on internal control over financial reporting is incorporated by reference to “Management’s Report Regarding Internal Control Over Financial Reporting” on Page 37 of the Company’s 2008 Annual Report to Shareholders, filed as an Exhibit hereto.
46
Item 6. SELECTED FINANCIAL DATA
Item 7. MANAGEMENT’S DISCUSSION AND ANALYSIS OF FINANCIAL CONDITION AND RESULTS OF OPERATIONS
Item 7A. QUANTITATIVE AND QUALITATIVE DISCLOSURES ABOUT MARKET RISK
Item 8. FINANCIAL STATEMENTS AND SUPPLEMENTARY DATA
Item 9. CHANGES IN AND DISAGREEMENTS WITH ACCOUNTANTS ON ACCOUNTING AND FINANCIAL DISCLOSURE
Item 9A. CONTROLS AND PROCEDURES
The attestation report of Deloitte & Touche LLP, the Company’s independent registered public accounting firm, regarding the Company’s internal control over financial reporting is incorporated by reference to “Report of Independent Registered Public Accounting Firm” on Page 38 of the Company’s 2008 Annual Report to Shareholders, filed as an Exhibit hereto.
None.
PART III
The information required by this Item regarding Directors is incorporated by reference to the information under “Election of Directors” in the Company’s definitive Proxy Statement for the 2009 Annual Meeting. The information regarding executive officers and family relationships is set forth in Item 4A hereto. The information regarding Section 16 reporting is incorporated by reference to the information under “Security Ownership of Directors and Officers — Section 16(a) Beneficial Ownership Reporting Compliance” in the Company’s definitive Proxy Statement for the 2009 Annual Meeting. The information required by this Item regarding the Company’s procedures for recommending nominees to the Board of Directors is incorporated by reference to the information under “Meetings and Committees of the Board of Directors — Corporate Governance Committee” in the Company’s definitive Proxy Statement for the 2009 Annual Meeting. The information required by this Item in regards to the Audit Committee is incorporated by reference to the information under “Meetings and Committees of the Board of Directors — Audit Committee” in the Company’s definitive Proxy Statement for the 2009 Annual Meeting. The information regarding the Company’s Audit Committee financial experts is incorporated by reference to the information under “Meetings and Committees of the Board — Audit Committee” in the Company’s definitive Proxy Statement for the 2009 Annual Meeting.
The Company has adopted a code of conduct that applies to all of its directors, officers (including its principal executive officer, principal financial officer, and its principal accounting officer or controller or person performing similar functions) and employees. The Company’s code of conduct is available on its website at www.ottertail.com. The Company intends to satisfy the disclosure requirements under Item 5.05 of Form 8-K regarding an amendment to, or waiver from, a provision of its code of conduct by posting such information on its website at the address specified above. Information on the Company’s website is not deemed to be incorporated by reference into this Annual Report on Form 10-K.
The information required by this Item is incorporated by reference to the information under “Compensation Discussion and Analysis,” “Report of Compensation Committee,” “Executive Compensation” and “Director Compensation” in the Company’s definitive Proxy Statement for the 2009 Annual Meeting.
The information required by this Item regarding security ownership is incorporated by reference to the information under “Outstanding Voting Shares” and “Security Ownership of Directors and Officers” in the Company’s definitive Proxy Statement for the 2009 Annual Meeting.
47
Item 9B. OTHER INFORMATION
Item 10. DIRECTORS, EXECUTIVE OFFICERS AND CORPORATE GOVERNANCE
Item 11. EXECUTIVE COMPENSATION
Item 12. SECURITY OWNERSHIP OF CERTAIN BENEFICIAL OWNERS AND MANAGEMENT AND RELATED STOCKHOLDER MATTERS

EQUITY COMPENSATION PLAN INFORMATION
The following table sets forth information as of December 31, 2008 about the Company’s common stock that may be issued under all of its equity compensation plans:
The information required by this Item is incorporated by reference to the information under “Policy and Procedures Regarding Transactions with Related Persons” and “Election of Directors” in the Company’s definitive Proxy Statement for the 2009 Annual Meeting.
The information required by this Item is incorporated by reference to the information under “Ratification of Independent Registered Public Accounting Firm — Fees” and “Ratification of Independent Registered Public Accounting Firm — Pre-Approval of Audit/Non-Audit Services Policy” in the Company’s definitive Proxy Statement for the 2009 Annual Meeting.
48
Number of securities remaining available Number of for future issuance securities to be under equity issued upon Weighted-average compensation plans exercise of exercise price of (excluding outstanding outstanding securities options, warrants options, warrants reflected in columnPlan Category and rights and rights (a))
(a) (b) (c) Equity compensation plans approved by security holders 1999 Stock Incentive Plan 909,632 (1) $14.51 1,017,326 (2) 1999 Employee Stock Purchase Plan — N/A 330,565 (3) Equity compensation plans not approved by security holders — — — Total 909,632 $14.51 1,347,891
(1) Includes 114,800, 109,000, and 88,050 performance based share awards made in 2008, 2007 and 2006, respectively, 73,585 restricted stock units outstanding as of December 31, 2008, and 16,495 phantom shares as part of the deferred director compensation program and excludes 73,447 shares of restricted stock issued under the 1999 Stock Incentive Plan.
(2) The 1999 Stock Incentive Plan provides for the issuance of any shares available under the plan in the form of restricted stock, performance awards and other types of stock-based awards, in addition to the granting of options, warrants or stock appreciation rights.
(3) Shares are issued based on employee’s election to participate in the plan.
Item 13. CERTAIN RELATIONSHIPS AND RELATED TRANSACTIONS, AND DIRECTOR INDEPENDENCE
Item 14. PRINCIPAL ACCOUNTANT FEES AND SERVICES

PART IV
(a) List of documents filed:
(1) and (2) See Table of Contents on Page 51 hereof.
(3) See Exhibit Index on Pages 52 through 59 hereof.
Pursuant to Item 601(b)(4)(iii) of Regulation S-K, copies of certain instruments defining the rights of holders of certain long-term debt of the Company are not filed, and in lieu thereof, the Company agrees to furnish copies thereof to the Securities and Exchange Commission upon request.
49
Item 15. EXHIBITS, FINANCIAL STATEMENT SCHEDULES
SIGNATURES
Pursuant to the requirements of Section 13 or 15(d) of the Securities Exchange Act of 1934, the registrant has duly caused this report to be signed on its behalf by the undersigned, thereunto duly authorized.
Pursuant to the requirements of the Securities Exchange Act of 1934, this report has been signed below by the following persons on behalf of the registrant and in the capacities and on the dates indicated:
Signature and Title
50
OTTER TAIL CORPORATION
By /s/ Kevin G. Moug Kevin G. Moug
Chief Financial Officer
Dated: February 27, 2009
John D. Erickson ) President and Chief Executive Officer ) (principal executive officer) and Director ) ) Kevin G. Moug ) Chief Financial Officer ) (principal financial and accounting officer) ) ) By /s/ John D. EricksonJohn C. MacFarlane ) John D. EricksonChairman of the Board and Director ) Pro Se and Attorney-in-Fact ) Dated February 27, 2009Karen M. Bohn, Director ) ) Arvid R. Liebe, Director ) ) Edward J. McIntyre, Director ) ) Joyce Nelson Schuette, Director ) ) Nathan I. Partain, Director ) ) Gary J. Spies, Director ) ) James B. Stake, Director )
OTTER TAIL CORPORATION
TABLE OF CONTENTS
FINANCIAL STATEMENTS, SUPPLEMENTARY FINANCIAL DATA, SUPPLEMENTAL FINANCIAL SCHEDULES INCLUDED IN ANNUAL REPORT ON FORM 10-K
FOR THE YEAR ENDED DECEMBER 31, 2008
The following items are incorporated in this Annual Report on Form 10-K by reference to the registrant’s Annual Report to Shareholders for the year ended December 31, 2008 filed as an Exhibit hereto:
Page in Annual
Report to Shareholders
Financial Statements:
Schedules are omitted because of the absence of the conditions under which they are required, because the amounts are insignificant or because the information required is included in the financial statements or the notes thereto.
51
Management’s Report Regarding Internal Control Over Financial Reporting 37 Report of Independent Registered Public Accounting Firm 38 Consolidated Statements of Income for the Three Years Ended December 31, 2008 39 Consolidated Balance Sheets, December 31, 2008 and 2007 40 & 41 Consolidated Statements of Common Shareholders’ Equity and Comprehensive Income for the Three Years Ended
December 31, 2008
42
Consolidated Statements of Cash Flows for the Three Years Ended December 31, 2008 43 Consolidated Statements of Capitalization, December 31, 2008 and 2007 44 Notes to Consolidated Financial Statements 45-69 Selected Consolidated Financial Data for the Five Years Ended December 31, 2008 18 Quarterly Data for the Two Years Ended December 31, 2008 69
Exhibit Index to
Annual Report on Form 10-K
For Year Ended December 31, 2008
52
Previously Filed As Exhibit File No. No. 3-A
8-K filed 4/10/01
3
—Restated Articles of Incorporation, as amended (including resolutions creating outstanding series of Cumulative Preferred Shares).
3-B
10-K for year ended 12/31/07
3-B
—Restated Bylaws, as amended.
4-A-1
10-K for year ended 12/31/01
4-D-7
—Note Purchase Agreement, dated as of December 1, 2001.
4-A-2
10-K for year ended 12/31/02
4-D-4
—First Amendment, dated as of December 1, 2002, to Note Purchase Agreement, dated as of December 1, 2001.
4-A-3
10-Q for quarter ended 9/30/04
4.2
—Second Amendment, dated as of October 1, 2004, to Note Purchase Agreement, dated as of December 1, 2001.
4-A-4
8-K filed 12/20/07
4.2
—Third Amendment, dated as of December 1, 2007, to Note Purchase Agreement, dated as of December 1, 2001.
4-B
8-K filed 8/01/08
4.1
—Credit Agreement, dated as of July 30, 2008, among the Company, dba Otter Tail Power Company, the Banks named therein, Bank of America, N.A., as Syndication Agent, and U.S. Bank National Association, as agent for the Banks.
4-C
8-K filed 2/28/07
4.1
—Note Purchase Agreement, dated as of February 23, 2007, between the Company and Cascade Investment L.L.C.
4-D
8-K filed 8/23/07
4.1
—Note Purchase Agreement, dated as of August 20, 2007.
4-D-1
8-K filed 12/20/07
4.3
—First Amendment, dated as of December 14, 2007, to Note Purchase Agreement, dated as of August 20, 2007.
4-D-2
8-K filed 9/15/08
4.1
—Second Amendment, dated as of September 11, 2008, to Note Purchase Agreement, dated as of August 20, 2007
4-E
8-K filed 10/5/07
4.1
—Credit Agreement, dated as of October 2, 2007, among Varistar Corporation, the Banks named therein, U.S. Bank National Association, as agent for the Banks and as Lead Arranger, and Bank of America, N.A., Keybank National Association, and Wells Fargo Bank, National Association, as Co-Documentation Agents.

53
Previously Filed As Exhibit File No. No. 4-E-1
8-K filed 12/7/07
4.1
—First Amendment to Credit Agreement, dated as of November 30, 2007, to Credit Agreement, dated as of October 2, 2007.
4-E-2
8-K filed 12/30/08
4.1
—Amended and Restated Credit Agreement, dated as of December 23, 2008 among Varistar Corporation, the Banks named therein, U.S. Bank National Association, as agent for the Banks and as Lead Arranger, and Bank of America, N.A., Keybank National Association, and Wells Fargo Bank, National Association, as Co-Documentation Agents.
10-A
2-39794
4-C
—Integrated Transmission Agreement, dated August 25, 1967, between Cooperative Power Association and the Company.
10-A-1
10-K for year ended 12/31/92
10-A-1
—Amendment No. 1, dated as of September 6, 1979, to Integrated Transmission Agreement, dated as of August 25, 1967, between Cooperative Power Association and the Company.
10-A-2
10-K for year ended 12/31/92
10-A-2
—Amendment No. 2, dated as of November 19, 1986, to Integrated Transmission Agreement between Cooperative Power Association and the Company.
10-C-1
2-55813
5-E
—Contract dated July 1, 1958, between Central Power Electric Corporation, Inc., and the Company.
10-C-2
2-55813
5-E-1
—Supplement Seven dated November 21, 1973. (Supplements Nos. One through Six have been superseded and are no longer in effect.)
10-C-3 2-55813 5-E-2 —Amendment No. 1 dated December 19, 1973, to Supplement Seven. 10-C-4
10-K for year ended 12/31/91
10-C-4
—Amendment No. 2 dated June 17, 1986, to Supplement Seven.
10-C-5
10-K for year ended 12/31/92
10-C-5
—Amendment No. 3 dated June 18, 1992, to Supplement Seven.
10-C-6
10-K for year ended 12/31/93
10-C-6
—Amendment No. 4 dated January 18, 1994 to Supplement Seven.
10-D
2-55813
5-F
—Contract dated April 12, 1973, between the Bureau of Reclamation and the Company.
10-E-1
2-55813
5-G
—Contract dated January 8, 1973, between East River Electric Power Cooperative and the Company.
10-E-2 2-62815 5-E-1 —Supplement One dated February 20, 1978.
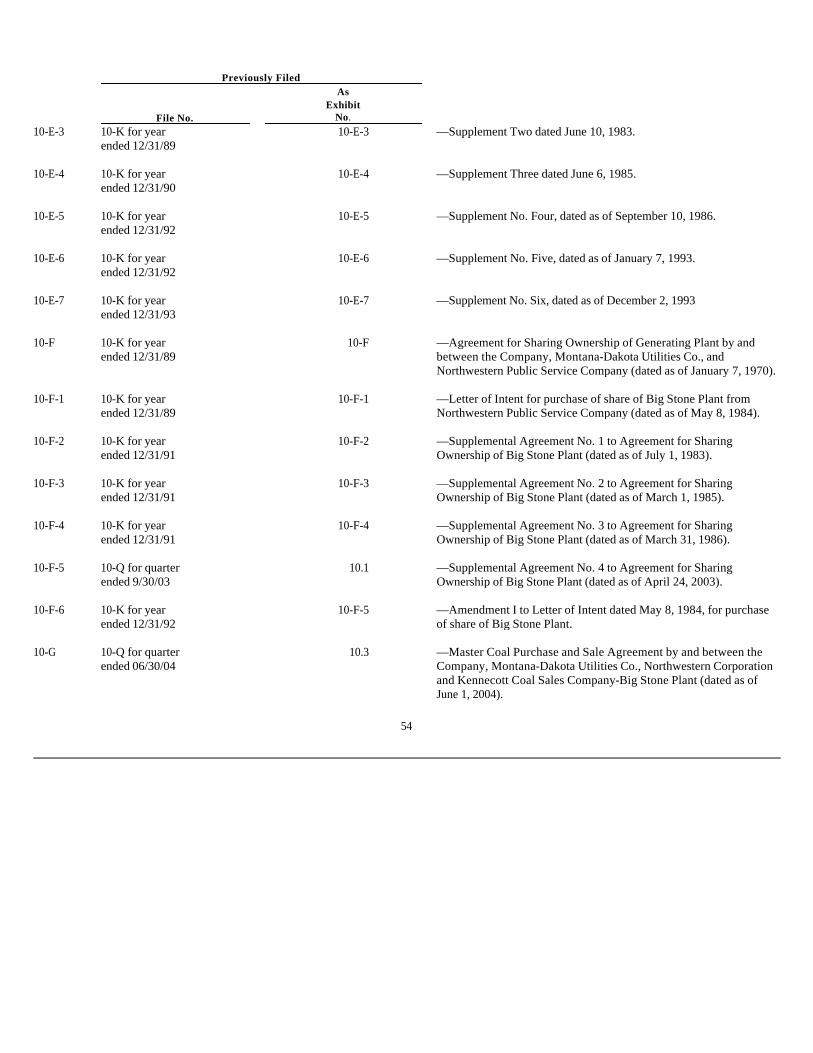
54
Previously Filed As Exhibit File No. No. 10-E-3
10-K for year ended 12/31/89
10-E-3
—Supplement Two dated June 10, 1983.
10-E-4
10-K for year ended 12/31/90
10-E-4
—Supplement Three dated June 6, 1985.
10-E-5
10-K for year ended 12/31/92
10-E-5
—Supplement No. Four, dated as of September 10, 1986.
10-E-6
10-K for year ended 12/31/92
10-E-6
—Supplement No. Five, dated as of January 7, 1993.
10-E-7
10-K for year ended 12/31/93
10-E-7
—Supplement No. Six, dated as of December 2, 1993
10-F
10-K for year ended 12/31/89
10-F
—Agreement for Sharing Ownership of Generating Plant by and between the Company, Montana-Dakota Utilities Co., and Northwestern Public Service Company (dated as of January 7, 1970).
10-F-1
10-K for year ended 12/31/89
10-F-1
—Letter of Intent for purchase of share of Big Stone Plant from Northwestern Public Service Company (dated as of May 8, 1984).
10-F-2
10-K for year ended 12/31/91
10-F-2
—Supplemental Agreement No. 1 to Agreement for Sharing Ownership of Big Stone Plant (dated as of July 1, 1983).
10-F-3
10-K for year ended 12/31/91
10-F-3
—Supplemental Agreement No. 2 to Agreement for Sharing Ownership of Big Stone Plant (dated as of March 1, 1985).
10-F-4
10-K for year ended 12/31/91
10-F-4
—Supplemental Agreement No. 3 to Agreement for Sharing Ownership of Big Stone Plant (dated as of March 31, 1986).
10-F-5
10-Q for quarter ended 9/30/03
10.1
—Supplemental Agreement No. 4 to Agreement for Sharing Ownership of Big Stone Plant (dated as of April 24, 2003).
10-F-6
10-K for year ended 12/31/92
10-F-5
—Amendment I to Letter of Intent dated May 8, 1984, for purchase of share of Big Stone Plant.
10-G
10-Q for quarter ended 06/30/04
10.3
—Master Coal Purchase and Sale Agreement by and between the Company, Montana-Dakota Utilities Co., Northwestern Corporation and Kennecott Coal Sales Company-Big Stone Plant (dated as of June 1, 2004).

55
Previously Filed As Exhibit File No. No. 10-H
2-61043
5-H
—Agreement for Sharing Ownership of Coyote Station Generating Unit No. 1 by and between the Company, Minnkota Power Cooperative, Inc., Montana-Dakota Utilities Co., Northwestern Public Service Company and Minnesota Power & Light Company (dated as of July 1, 1977).
10-H-1
10-K for year ended 12/31/89
10-H-1
—Supplemental Agreement No. One, dated as of November 30, 1978, to Agreement for Sharing Ownership of Coyote Generating Unit No. 1.
10-H-2
10-K for year ended 12/31/89
10-H-2
—Supplemental Agreement No. Two, dated as of March 1, 1981, to Agreement for Sharing Ownership of Coyote Generating Unit No. 1 and Amendment No. 2 dated March 1, 1981, to Coyote Plant Coal Agreement.
10-H-3
10-K for year ended 12/31/89
10-H-3
—Amendment, dated as of July 29, 1983, to Agreement for Sharing Ownership of Coyote Generating Unit No. 1.
10-H-4
10-K for year ended 12/31/92
10-H-4
—Agreement, dated as of September 5, 1985, containing Amendment No. 3 to Agreement for Sharing Ownership of Coyote Generating Unit No.1, dated as of July 1, 1977, and Amendment No. 5 to Coyote Plant Coal Agreement, dated as of January 1, 1978.
10-H-5
10-Q for quarter ended 9/30/01
10-A
—Amendment, dated as of June 14, 2001, to Agreement for Sharing Ownership of Coyote Generating Unit No. 1.
10-H-6
10-Q for quarter ended 9/30/03
10.2
—Amendment, dated as of April 24, 2003, to Agreement for Sharing Ownership of Coyote Generating Unit No. 1.
10-I
2-63744
5-I
—Coyote Plant Coal Agreement by and between the Company, Minnkota Power Cooperative, Inc., Montana-Dakota Utilities Co., Northwestern Public Service Company, Minnesota Power & Light Company, and Knife River Coal Mining Company (dated as of January 1, 1978).
10-I-1
10-K for year ended 12/31/92
10-I-1
—Addendum, dated as of March 10, 1980, to Coyote Plant Coal Agreement.
10-I-2
10-K for year ended 12/31/92
10-I-2
—Amendment (No. 3), dated as of May 28, 1980, to Coyote Plant Coal Agreement.
10-I-3
10-K for year ended 12/31/92
10-I-3
—Fourth Amendment, dated as of August 19, 1985, to Coyote Plant Coal Agreement.
10-I-4
10-Q for quarter ended 6/30/93
19-A
—Sixth Amendment, dated as of February 17, 1993, to Coyote Plant Coal Agreement.
10-I-5
10-K for year ended 12/31/01
10-I-5
—Agreement and Consent to Assignment of the Coyote Plant Coal Agreement.
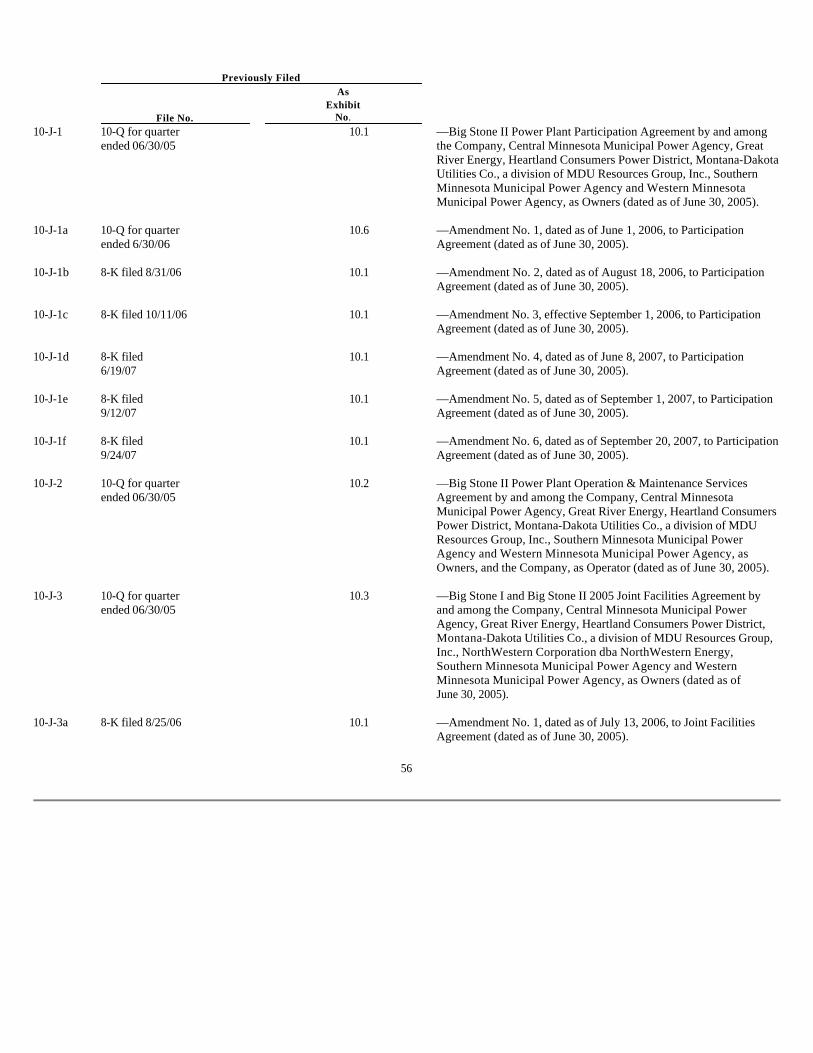
56
Previously Filed As Exhibit File No. No. 10-J-1
10-Q for quarter ended 06/30/05
10.1
—Big Stone II Power Plant Participation Agreement by and among the Company, Central Minnesota Municipal Power Agency, Great River Energy, Heartland Consumers Power District, Montana-Dakota Utilities Co., a division of MDU Resources Group, Inc., Southern Minnesota Municipal Power Agency and Western Minnesota Municipal Power Agency, as Owners (dated as of June 30, 2005).
10-J-1a
10-Q for quarter ended 6/30/06
10.6
—Amendment No. 1, dated as of June 1, 2006, to Participation Agreement (dated as of June 30, 2005).
10-J-1b
8-K filed 8/31/06
10.1
—Amendment No. 2, dated as of August 18, 2006, to Participation Agreement (dated as of June 30, 2005).
10-J-1c
8-K filed 10/11/06
10.1
—Amendment No. 3, effective September 1, 2006, to Participation Agreement (dated as of June 30, 2005).
10-J-1d
8-K filed 6/19/07
10.1
—Amendment No. 4, dated as of June 8, 2007, to Participation Agreement (dated as of June 30, 2005).
10-J-1e
8-K filed 9/12/07
10.1
—Amendment No. 5, dated as of September 1, 2007, to Participation Agreement (dated as of June 30, 2005).
10-J-1f
8-K filed 9/24/07
10.1
—Amendment No. 6, dated as of September 20, 2007, to Participation Agreement (dated as of June 30, 2005).
10-J-2
10-Q for quarter ended 06/30/05
10.2
—Big Stone II Power Plant Operation & Maintenance Services Agreement by and among the Company, Central Minnesota Municipal Power Agency, Great River Energy, Heartland Consumers Power District, Montana-Dakota Utilities Co., a division of MDU Resources Group, Inc., Southern Minnesota Municipal Power Agency and Western Minnesota Municipal Power Agency, as Owners, and the Company, as Operator (dated as of June 30, 2005).
10-J-3
10-Q for quarter ended 06/30/05
10.3
—Big Stone I and Big Stone II 2005 Joint Facilities Agreement by and among the Company, Central Minnesota Municipal Power Agency, Great River Energy, Heartland Consumers Power District, Montana-Dakota Utilities Co., a division of MDU Resources Group, Inc., NorthWestern Corporation dba NorthWestern Energy, Southern Minnesota Municipal Power Agency and Western Minnesota Municipal Power Agency, as Owners (dated as of June 30, 2005).
10-J-3a
8-K filed 8/25/06
10.1
—Amendment No. 1, dated as of July 13, 2006, to Joint Facilities Agreement (dated as of June 30, 2005).
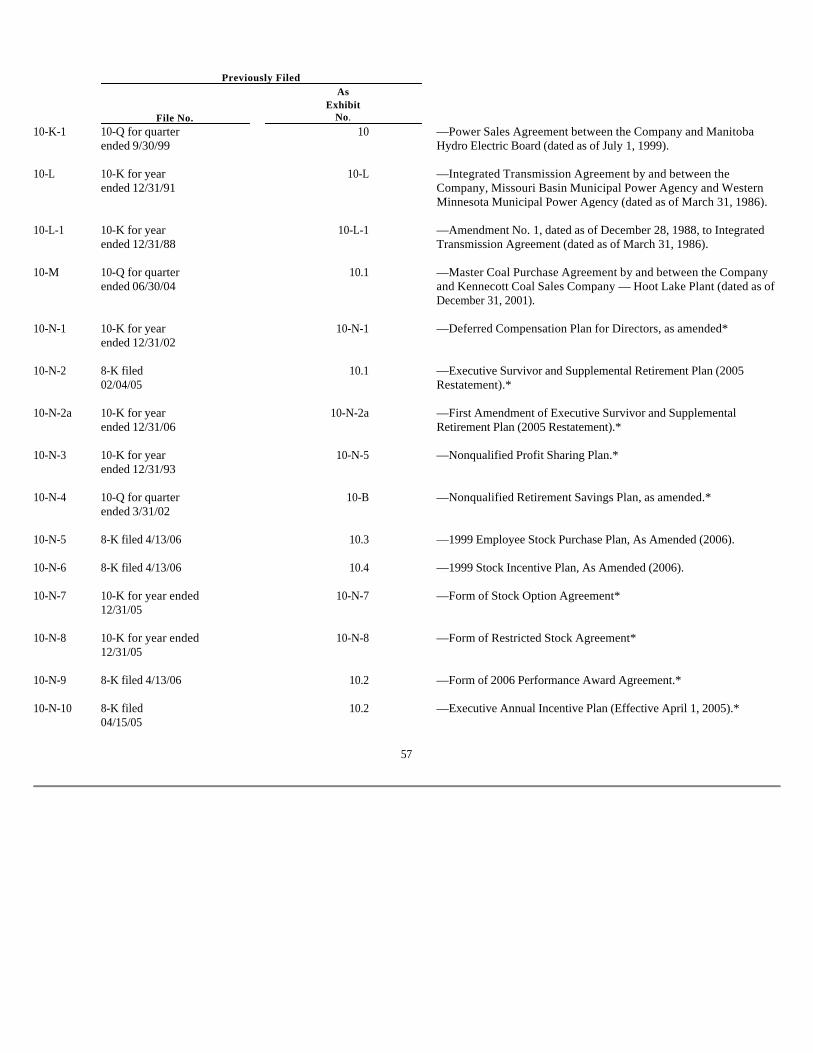
57
Previously Filed As Exhibit File No. No. 10-K-1
10-Q for quarter ended 9/30/99
10
—Power Sales Agreement between the Company and Manitoba Hydro Electric Board (dated as of July 1, 1999).
10-L
10-K for year ended 12/31/91
10-L
—Integrated Transmission Agreement by and between the Company, Missouri Basin Municipal Power Agency and Western Minnesota Municipal Power Agency (dated as of March 31, 1986).
10-L-1
10-K for year ended 12/31/88
10-L-1
—Amendment No. 1, dated as of December 28, 1988, to Integrated Transmission Agreement (dated as of March 31, 1986).
10-M
10-Q for quarter ended 06/30/04
10.1
—Master Coal Purchase Agreement by and between the Company and Kennecott Coal Sales Company — Hoot Lake Plant (dated as of December 31, 2001).
10-N-1
10-K for year ended 12/31/02
10-N-1
—Deferred Compensation Plan for Directors, as amended*
10-N-2
8-K filed 02/04/05
10.1
—Executive Survivor and Supplemental Retirement Plan (2005 Restatement).*
10-N-2a
10-K for year ended 12/31/06
10-N-2a
—First Amendment of Executive Survivor and Supplemental Retirement Plan (2005 Restatement).*
10-N-3
10-K for year ended 12/31/93
10-N-5
—Nonqualified Profit Sharing Plan.*
10-N-4
10-Q for quarter ended 3/31/02
10-B
—Nonqualified Retirement Savings Plan, as amended.*
10-N-5 8-K filed 4/13/06 10.3 —1999 Employee Stock Purchase Plan, As Amended (2006). 10-N-6 8-K filed 4/13/06 10.4 —1999 Stock Incentive Plan, As Amended (2006). 10-N-7
10-K for year ended 12/31/05
10-N-7
—Form of Stock Option Agreement*
10-N-8
10-K for year ended 12/31/05
10-N-8
—Form of Restricted Stock Agreement*
10-N-9 8-K filed 4/13/06 10.2 —Form of 2006 Performance Award Agreement.* 10-N-10
8-K filed 04/15/05
10.2
—Executive Annual Incentive Plan (Effective April 1, 2005).*
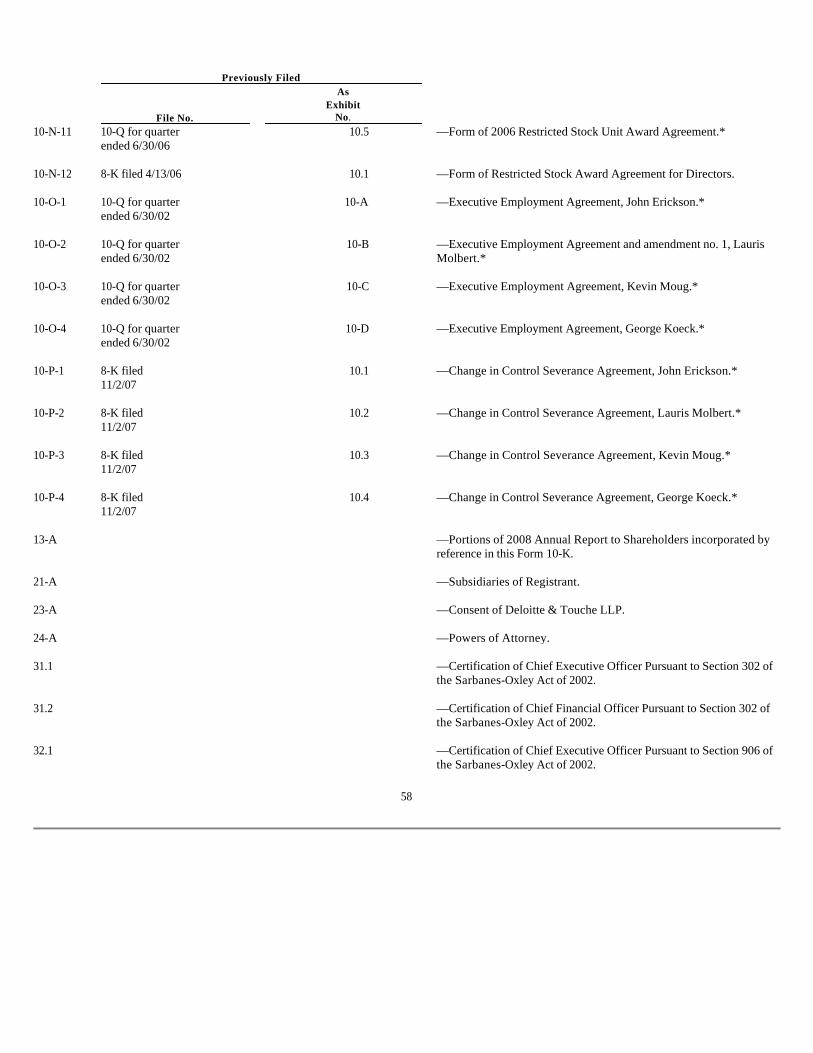
58
Previously Filed As Exhibit File No. No. 10-N-11
10-Q for quarter ended 6/30/06
10.5
—Form of 2006 Restricted Stock Unit Award Agreement.*
10-N-12 8-K filed 4/13/06 10.1 —Form of Restricted Stock Award Agreement for Directors. 10-O-1
10-Q for quarter ended 6/30/02
10-A
—Executive Employment Agreement, John Erickson.*
10-O-2
10-Q for quarter ended 6/30/02
10-B
—Executive Employment Agreement and amendment no. 1, Lauris Molbert.*
10-O-3
10-Q for quarter ended 6/30/02
10-C
—Executive Employment Agreement, Kevin Moug.*
10-O-4
10-Q for quarter ended 6/30/02
10-D
—Executive Employment Agreement, George Koeck.*
10-P-1
8-K filed 11/2/07
10.1
—Change in Control Severance Agreement, John Erickson.*
10-P-2
8-K filed 11/2/07
10.2
—Change in Control Severance Agreement, Lauris Molbert.*
10-P-3
8-K filed 11/2/07
10.3
—Change in Control Severance Agreement, Kevin Moug.*
10-P-4
8-K filed 11/2/07
10.4
—Change in Control Severance Agreement, George Koeck.*
13-A
—Portions of 2008 Annual Report to Shareholders incorporated by reference in this Form 10-K.
21-A —Subsidiaries of Registrant. 23-A —Consent of Deloitte & Touche LLP. 24-A —Powers of Attorney. 31.1
—Certification of Chief Executive Officer Pursuant to Section 302 of the Sarbanes-Oxley Act of 2002.
31.2
—Certification of Chief Financial Officer Pursuant to Section 302 of the Sarbanes-Oxley Act of 2002.
32.1
—Certification of Chief Executive Officer Pursuant to Section 906 of the Sarbanes-Oxley Act of 2002.

59 (Back To Top)
Exhibit 13-A
Selected Consolidated Financial Data
Previously Filed As Exhibit File No. No. 32.2
—Certification of Chief Financial Officer Pursuant to Section 906 of the Sarbanes-Oxley Act of 2002.
* Management contract of compensatory plan or arrangement required to be filed pursuant to Item 601(b)(10)(iii)(A) of Regulation S-K.
Section 2: EX-13.A (EX-13(A))
2008 2007 2006 2005 2004 (thousands, except number of shareholders and per-share data) Revenues Electric $ 340,020 $ 323,478 $ 306,014 $ 312,985 $ 266,385 Plastics 116,452 149,012 163,135 158,548 115,426 Manufacturing 470,462 381,599 311,811 244,311 201,615 Health Services 122,520 130,670 135,051 123,991 114,318 Food Ingredient Processing 65,367 70,440 45,084 38,501 14,023 Other Business Operations (1) 199,511 185,730 145,603 105,821 102,516 Corporate Revenues and Intersegment Eliminations (1) (3,135) (2,042) (1,744) (2,288) (1,247)
Total Operating Revenues $1,311,197 $1,238,887 $1,104,954 $ 981,869 $ 813,036 Special Charges — — — — — Net Income from Continuing Operations 35,125 53,961 50,750 53,902 40,502 Net Income from Discontinued Operations — — 362 8,649 1,693 Net Income 35,125 53,961 51,112 62,551 42,195 Cumulative Change in Accounting Principle — — — — — Operating Cash Flow from Continuing Operations 111,321 84,812 79,207 90,348 54,410 Operating Cash Flow — Continuing and Discontinued
Operations 111,321 84,812 80,246 95,800 56,301 Capital Expenditures — Continuing Operations 265,888 161,985 69,448 59,969 49,484 Total Assets 1,692,587 1,454,754 1,258,650 1,181,496 1,134,148 Long-Term Debt 339,726 342,694 255,436 258,260 261,805 Redeemable Preferred — — — — — Basic Earnings Per Share — Continuing Operations (2) 1.09 1.79 1.70 1.82 1.53 Basic Earnings Per Share — Total (2) 1.09 1.79 1.71 2.12 1.59 Diluted Earnings Per Share — Continuing Operations (2) 1.09 1.78 1.69 1.81 1.52 Diluted Earnings Per Share — Total (2) 1.09 1.78 1.70 2.11 1.58 Return on Average Common Equity 6.0% 10.5% 10.6% 13.9% 12.0%Dividends Per Common Share 1.19 1.17 1.15 1.12 1.10 Dividend Payout Ratio 109% 66% 68% 53% 70%Common Shares Outstanding — Year End 35,385 29,850 29,522 29,401 28,977 Number of Common Shareholders (3) 14,627 14,509 14,692 14,801 14,889
Notes:
(1) Beginning in 2007 corporate revenues and expenses are no longer reported as components of Other Business Operations. Prior years have been restated accordingly.
(2) Based on average number of shares outstanding.
(3) Holders of record at year end.

MANAGEMENT’S DISCUSSION AND ANALYSIS OF FINANCIAL CONDITION AND RESULTS OF OPERATIONS
OVERVIEW
Otter Tail Corporation and our subsidiaries form a diverse group of businesses with operations classified into six segments: Electric, Plastics, Manufacturing, Health Services, Food Ingredient Processing and Other Business Operations. Our primary financial goals are to maximize earnings and cash flows and to allocate capital profitably toward growth opportunities that will increase shareholder value. Meeting these objectives enables us to preserve and enhance our financial capability by maintaining desired capitalization ratios and a strong interest coverage position and preserving solid credit ratings on outstanding securities, which, in the form of lower interest rates, benefits both our customers and shareholders.
Our strategy is to continue to develop a core regulated electric utility combined with a diversified multi-industry platform. Reliable utility performance combined with growth opportunities at all our businesses provides long-term value. Growing our core electric utility business provides a strong base of revenues, earnings and cash flows. We look to our nonelectric operating companies to provide organic growth as well. Organic, internal growth comes from new products and services, market expansion and increased efficiencies. We expect much of our growth in the next few years will come from major capital investments at our existing companies. We also expect to grow through acquisitions and adhere to strict guidelines when reviewing acquisition candidates. Our aim is to add companies that will produce an immediate positive impact on earnings and provide long-term growth potential. We believe that owning well-run, profitable companies across different industries will bring more growth opportunities and more balance to our results. In doing this, we also avoid concentrating business risk within a single industry. All of our operating companies operate under a decentralized business model with disciplined corporate oversight.
We assess the performance of our operating companies over time, using the following criteria:
We are a committed long-term owner and therefore we do not acquire companies in pursuit of short-term gains. However, we may divest operating companies that no longer fit into our strategy over the long term.
The following major events occurred in our company in 2008:
• ability to provide returns on invested capital that exceed our weighted average cost of capital over the long term; and
• assessment of an operating company’s business and potential for future earnings growth.
• We achieved record annual consolidated revenues of $1.3 billion.
• We achieved record annual net cash from operations of $111.3 million.
• Net income from our electric segment was $33.2 million.
• Our construction companies reported record net income of $5.5 million.
• Capital expenditures totaled $266 million, including expenditures for the electric utility’s 32 wind turbines at the Ashtabula Wind Center in Barnes County, North Dakota and expansion of the wind tower manufacturing facilities of DMI Industries, Inc. (DMI) in West Fargo, North Dakota and Tulsa, Oklahoma.
• On May 1, 2008 BTD Manufacturing, Inc. (BTD) acquired the assets of Miller Welding & Iron Works, Inc. (Miller Welding), of Washington, Illinois for $41.7 million in cash.
• The electric utility was granted a general rate increase of 2.9% in Minnesota and regulators in both Minnesota and North Dakota approved rate riders for the recovery of renewable resource costs and investment returns.
• The electric utility filed a general rate case in North Dakota in November 2008 requesting a revenue increase of approximately $6.1 million.
• The electric utility filed a general rate case in South Dakota in October 2008 requesting a revenue increase of approximately $3.8 million.

Major growth strategies and initiatives in our company’s future include:
The following table summarizes our consolidated results of operations for the years ended December 31:
The 5.8% increase in consolidated revenues in 2008 compared with 2007 reflects significant revenue growth from our manufacturing and electric segments. Revenues increased $88.9 million in our manufacturing segment in 2008 mainly due to increased sales of wind towers and other fabricated steel products, including $17.5 million related to the acquisition of Miller Welding in May 2008. Electric segment revenues grew by $16.6 million as a result of increases in retail and wholesale kilowatt-hour (kwh) sales, a 2.9% general rate increase in Minnesota, initiation of renewable resource recovery riders in North Dakota and Minnesota and an increase in contracted electrical construction work performed for other entities. Revenues at our transportation company increased $7.5 million as a result of passing through higher fuel costs and the introduction of heavy-haul and wind tower transport services. Our construction companies’ revenues grew by $6.3 million in 2008 as higher backlog going into 2008 resulted in an increase in volume of jobs in progress. Revenues decreased by $32.6 million in our plastics segment in 2008 as a result of lower volumes of pipe sold due to a decrease in construction activity related to the current economic downturn. Revenues from our health services segment decreased $8.1 million in 2008, reflecting a shift from traditional dealership distribution of products to more commission-based compensation for sales. Food ingredient processing revenues decreased $5.1 million as a result of a 13.2% decrease in pounds of products sold in 2008.
Following is a more detailed analysis of our operating results by business segment for the three years ended December 31, 2008, 2007 and 2006, followed by our outlook for 2009, a discussion of our financial position at the end of 2008 and risk factors that may affect our future operating results and financial position.
• Planned capital budget expenditures of up to $884 million for the years 2009-2013 of which $698 million is for capital projects at the electric utility, including $395 million related to Big Stone II and associated transmission projects and $66 million for anticipated expansion of transmission capacity in Minnesota (CapX 2020). See “Capital Requirements” section for further discussion.
• Pursuing the regulatory approvals, financing and other arrangements necessary to build Big Stone II.
• Adding more renewable resources to our electric resource mix.
• Completion of the North Dakota and South Dakota general rate cases.
• The continued investigation and evaluation of organic growth and strategic acquisition opportunities.
(in thousands) 2008 2007
Operating Revenues: Electric $ 339,726 $ 323,158 Nonelectric 971,471 915,729
Total Operating Revenues $1,311,197 $1,238,887
Net Income: Electric $ 33,234 $ 24,498 Nonelectric 1,891 29,463
Total Net Income $ 35,125 $ 53,961
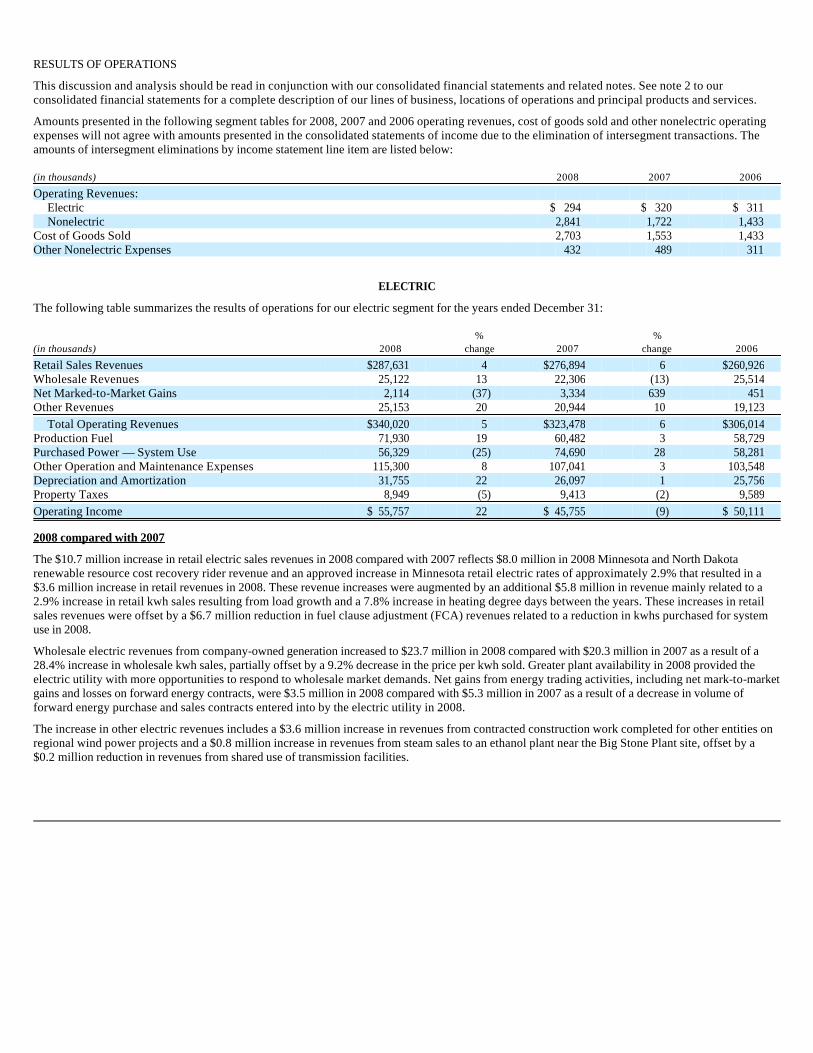
RESULTS OF OPERATIONS
This discussion and analysis should be read in conjunction with our consolidated financial statements and related notes. See note 2 to our consolidated financial statements for a complete description of our lines of business, locations of operations and principal products and services.
Amounts presented in the following segment tables for 2008, 2007 and 2006 operating revenues, cost of goods sold and other nonelectric operating expenses will not agree with amounts presented in the consolidated statements of income due to the elimination of intersegment transactions. The amounts of intersegment eliminations by income statement line item are listed below:
ELECTRIC
The following table summarizes the results of operations for our electric segment for the years ended December 31:
2008 compared with 2007
The $10.7 million increase in retail electric sales revenues in 2008 compared with 2007 reflects $8.0 million in 2008 Minnesota and North Dakota renewable resource cost recovery rider revenue and an approved increase in Minnesota retail electric rates of approximately 2.9% that resulted in a $3.6 million increase in retail revenues in 2008. These revenue increases were augmented by an additional $5.8 million in revenue mainly related to a 2.9% increase in retail kwh sales resulting from load growth and a 7.8% increase in heating degree days between the years. These increases in retail sales revenues were offset by a $6.7 million reduction in fuel clause adjustment (FCA) revenues related to a reduction in kwhs purchased for system use in 2008.
Wholesale electric revenues from company-owned generation increased to $23.7 million in 2008 compared with $20.3 million in 2007 as a result of a 28.4% increase in wholesale kwh sales, partially offset by a 9.2% decrease in the price per kwh sold. Greater plant availability in 2008 provided the electric utility with more opportunities to respond to wholesale market demands. Net gains from energy trading activities, including net mark-to-market gains and losses on forward energy contracts, were $3.5 million in 2008 compared with $5.3 million in 2007 as a result of a decrease in volume of forward energy purchase and sales contracts entered into by the electric utility in 2008.
The increase in other electric revenues includes a $3.6 million increase in revenues from contracted construction work completed for other entities on regional wind power projects and a $0.8 million increase in revenues from steam sales to an ethanol plant near the Big Stone Plant site, offset by a $0.2 million reduction in revenues from shared use of transmission facilities.
(in thousands) 2008 2007 2006
Operating Revenues: Electric $ 294 $ 320 $ 311 Nonelectric 2,841 1,722 1,433
Cost of Goods Sold 2,703 1,553 1,433 Other Nonelectric Expenses 432 489 311
% % (in thousands) 2008 change 2007 change 2006
Retail Sales Revenues $287,631 4 $276,894 6 $260,926 Wholesale Revenues 25,122 13 22,306 (13) 25,514 Net Marked-to-Market Gains 2,114 (37) 3,334 639 451 Other Revenues 25,153 20 20,944 10 19,123
Total Operating Revenues $340,020 5 $323,478 6 $306,014 Production Fuel 71,930 19 60,482 3 58,729 Purchased Power — System Use 56,329 (25) 74,690 28 58,281 Other Operation and Maintenance Expenses 115,300 8 107,041 3 103,548 Depreciation and Amortization 31,755 22 26,097 1 25,756 Property Taxes 8,949 (5) 9,413 (2) 9,589 Operating Income $ 55,757 22 $ 45,755 (9) $ 50,111
Fuel and purchased-power costs to serve retail and wholesale electric customers decreased $6.9 million between the years. Fuel costs for generation for retail customers increased $8.3 million as a result of a 12.1% increase in generation for system use combined with a 3.4% increase in fuel costs per kwh generated for system use. Purchased power costs to serve retail customers decreased $18.4 million as a result of a 23.8% decrease in kwhs purchased combined with a 1.0% decrease in the cost per kwh purchased for system use. Fuel costs for wholesale sales increased $3.2 million due to a 28.4% increase in wholesale kwh sales combined with a 7.1% increase in the cost of fuel per kwh generated for wholesale sales. Overall fuel-fired kwh generation increased 9.3% as a result of greater plant availability in 2008. Fuel costs per kwh generated increased 8.8%, but kwhs generated from zero-fuel-cost wind turbines mitigated the increase in fuel costs per kwh from generation used to serve retail customers.
The $8.3 million increase in electric operating and maintenance expenses includes: (1) $3.1 million in increased material costs not subject to recovery through retail rates, related to contracted construction work completed for other entities on regional wind power projects, (2) $1.7 million in turbine repair costs at Hoot Lake Plant in 2008, (3) $0.9 million in higher wage and benefit expenses related to a general wage increase, (4) $0.6 million in wind turbine related expenses, and (5) a net increase of $2.0 million in other operating expenses. The $5.7 million increase in depreciation and amortization expense is due to recent capital additions, including 27 wind turbines at the Langdon Wind Energy Center that were built in 2007. Property tax expense decreased $0.5 million as a result of decreases in utility property assessed values in Minnesota and South Dakota and changes in assessment methodology in South Dakota.
2007 compared with 2006
The $16.0 million increase in retail electric sales revenues in 2007 compared with 2006 includes a net increase of $8.4 million in FCA revenues mainly related to an increase in purchased power costs in the fourth quarter of 2007 to replace generation lost during a scheduled major maintenance shutdown of our Big Stone Plant. The increase in retail revenues also includes $7.6 million related to a 3.3% increase in retail kwh sales. Residential kwh sales increased 4.0% due, in part, to a 9.6% increase in heating degree days. Increased oil and ethanol production in our electric service territory and surrounding regions contributed to a 3.1% increase in commercial and industrial kwh sales. The increase in FCA revenues related to increases in fuel and purchased power costs for system use between the years was $14.4 million. The $8.4 million net increase in FCA revenues includes the effects of $6.0 million in FCA adjustments and refunds in 2006 and 2007 that were not related to increases in fuel and purchased power costs between the years.
A 30.6% decline in wholesale kwh sales from company-owned generation in 2007 compared with 2006 resulted in a $2.8 million decrease in wholesale revenues despite a 26.7% increase in the price per kwh sold from company-owned generating units. In 2006, advance purchases of electricity in anticipation of normal winter weather resulted in increased wholesale electric sales in January 2006, when the weather was unseasonably mild. Advance purchases of electricity in anticipation of coal supply constraints at Big Stone and Hoot Lake plants in the second quarter of 2006 freed up more generation for wholesale sales when coal supplies improved in May 2006. Net revenues from energy trading activities, including net mark-to-market gains on forward energy contracts, were $5.3 million in 2007 compared with $2.8 million in 2006. The $2.5 million increase in revenue from energy trading activities reflects a $3.5 million increase in profits from purchased power resold and net settlements of forward energy contracts and a $2.9 million increase in net mark-to-market gains on forward energy contracts, offset by a $3.9 million decrease in profits related to the purchase and sale of financial transmission rights.
The $1.8 million increase in other electric operating revenues in 2007 compared with 2006 is related to increases in revenues of $0.8 million from electric system planning and construction work performed for other companies, $0.5 million from integrated transmission agreements and $0.4 million for reimbursement of system operations costs from the Midwest Independent Transmission System Operator (MISO).
The $1.8 million increase in fuel costs in 2007 compared with 2006 reflects an 8.7% increase in the cost of fuel per kwh generated offset by a 5.3% decrease in kwhs generated. Generation used for wholesale electric sales decreased 30.6% while generation for retail sales decreased 0.8% between the years. Fuel costs for the electric utility’s combustion turbines increased $2.0 million due to an 86.1% increase in kwhs generated from those units. Fuel costs per kwh increased at all of the electric utility’s steam turbine generating units as a result of increases in coal and coal transportation costs between the years. Much of the increase in coal and coal transportation costs is related to higher diesel fuel prices.
The $16.4 million increase in purchased power — system use (to serve retail customers) in 2007 compared with 2006 is due to a 22.1% increase in kwh purchases for system use combined with a 4.9% increase in the cost per kwh purchased. The increase in kwh purchases was a result of power purchased to replace generation lost during the scheduled major maintenance shutdown of our Big Stone Plant in the fourth quarter of 2007.
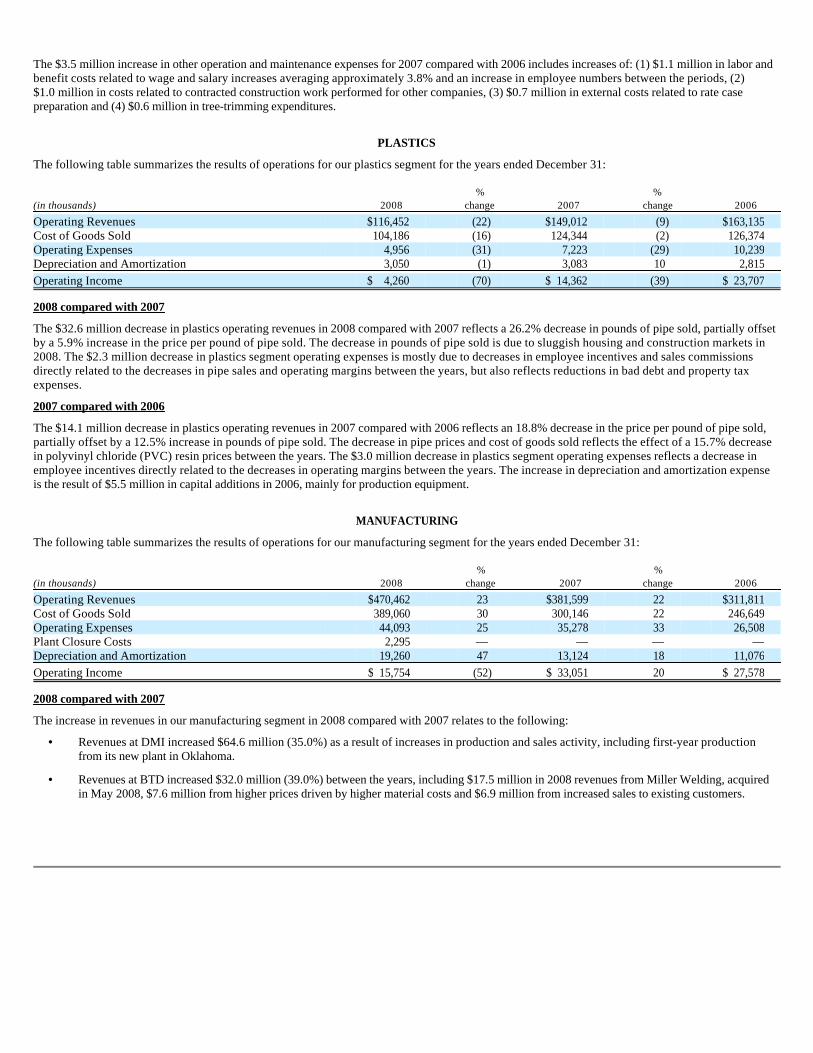
The $3.5 million increase in other operation and maintenance expenses for 2007 compared with 2006 includes increases of: (1) $1.1 million in labor and benefit costs related to wage and salary increases averaging approximately 3.8% and an increase in employee numbers between the periods, (2) $1.0 million in costs related to contracted construction work performed for other companies, (3) $0.7 million in external costs related to rate case preparation and (4) $0.6 million in tree-trimming expenditures.
PLASTICS
The following table summarizes the results of operations for our plastics segment for the years ended December 31:
2008 compared with 2007
The $32.6 million decrease in plastics operating revenues in 2008 compared with 2007 reflects a 26.2% decrease in pounds of pipe sold, partially offset by a 5.9% increase in the price per pound of pipe sold. The decrease in pounds of pipe sold is due to sluggish housing and construction markets in 2008. The $2.3 million decrease in plastics segment operating expenses is mostly due to decreases in employee incentives and sales commissions directly related to the decreases in pipe sales and operating margins between the years, but also reflects reductions in bad debt and property tax expenses.
2007 compared with 2006
The $14.1 million decrease in plastics operating revenues in 2007 compared with 2006 reflects an 18.8% decrease in the price per pound of pipe sold, partially offset by a 12.5% increase in pounds of pipe sold. The decrease in pipe prices and cost of goods sold reflects the effect of a 15.7% decrease in polyvinyl chloride (PVC) resin prices between the years. The $3.0 million decrease in plastics segment operating expenses reflects a decrease in employee incentives directly related to the decreases in operating margins between the years. The increase in depreciation and amortization expense is the result of $5.5 million in capital additions in 2006, mainly for production equipment.
MANUFACTURING
The following table summarizes the results of operations for our manufacturing segment for the years ended December 31:
2008 compared with 2007
The increase in revenues in our manufacturing segment in 2008 compared with 2007 relates to the following:
% % (in thousands) 2008 change 2007 change 2006
Operating Revenues $116,452 (22) $149,012 (9) $163,135 Cost of Goods Sold 104,186 (16) 124,344 (2) 126,374 Operating Expenses 4,956 (31) 7,223 (29) 10,239 Depreciation and Amortization 3,050 (1) 3,083 10 2,815 Operating Income $ 4,260 (70) $ 14,362 (39) $ 23,707
% % (in thousands) 2008 change 2007 change 2006
Operating Revenues $470,462 23 $381,599 22 $311,811 Cost of Goods Sold 389,060 30 300,146 22 246,649 Operating Expenses 44,093 25 35,278 33 26,508 Plant Closure Costs 2,295 — — — — Depreciation and Amortization 19,260 47 13,124 18 11,076 Operating Income $ 15,754 (52) $ 33,051 20 $ 27,578
• Revenues at DMI increased $64.6 million (35.0%) as a result of increases in production and sales activity, including first-year production from its new plant in Oklahoma.
• Revenues at BTD increased $32.0 million (39.0%) between the years, including $17.5 million in 2008 revenues from Miller Welding, acquired in May 2008, $7.6 million from higher prices driven by higher material costs and $6.9 million from increased sales to existing customers.

The increase in cost of goods sold in our manufacturing segment in 2008 compared with 2007 relates to the following:
The increase in operating expenses in our manufacturing segment in 2008 compared with 2007 relates to the following:
Depreciation and amortization expense increased mainly as a result of capital additions at DMI and T.O. Plastics and the May 2008 acquisition of Miller Welding.
Segment operating income decreased by $17.3 million primarily due to a $12.3 million decline in operating income at ShoreMaster.
• Revenues at T.O. Plastics, Inc. (T.O. Plastics), our manufacturer of thermoformed plastic and horticultural products, increased $2.5 million (6.5%) between the years as a result of increased sales of horticultural products.
• Revenues at ShoreMaster, Inc. (ShoreMaster), our waterfront equipment manufacturer, decreased $10.3 million (13.5%) between the years as a result of lower residential and commercial sales.
• Cost of goods sold at DMI increased $63.7 million between the years as a result of increases in production and sales activity, including initial operations at its new plant in Oklahoma. DMI experienced only a $0.9 million increase in gross profit margins between the years mainly due to the start-up of its Oklahoma plant, where the levels of labor and overhead spending have been higher than expected and production has not reached levels necessary to cover these costs. Included in cost of goods sold for 2008 are costs of $4.3 million associated with start-up of the Oklahoma plant, $3.5 million in additional labor and material costs on a production contract at the Ft. Erie plant and higher costs due to steel surcharges.
• Cost of goods sold at BTD increased $23.4 million between the years, mainly in the categories of materials, labor and shop supply costs, as a result of increased sales volumes to existing customers and higher material prices. Miller Welding accounted for $13.2 million of the increase in cost of goods sold. BTD’s gross margin was also reduced by $1.0 million in 2008 as a result of the sale of Miller Welding’s inventory that was adjusted to fair value on acquisition, as required under business combination accounting rules.
• Cost of goods sold at T.O. Plastics increased $2.2 million, mainly in material costs related to increased sales of horticultural products.
• Cost of goods sold at ShoreMaster decreased by $0.3 million despite a $10.3 million decrease in revenues between the years. Reduced sales combined with dealer discounts and tighter profit margins, as well as losses incurred on a large marina project in Costa Rica, contributed to the $10.0 million decline in gross profits at ShoreMaster.
• Operating expenses at DMI increased $5.3 million, including expenses related to the operation of its new plant in Oklahoma, which began construction in the third quarter of 2007 and went into operation in January 2008. The increase also includes approximately $1.0 million in increased severance and retention costs in 2008 related to personnel changes and delayed orders for towers that resulted in workforce reductions at the end of 2008.
• Operating expenses at BTD increased $3.6 million between the years, mainly as a result of increases in labor, benefit and contracted service expenses and the May 2008 acquisition of Miller Welding.
• Operating expenses at T.O. Plastics decreased by $0.1 million, but T.O. Plastics operating income was flat between the years as its depreciation expenses increased by $0.4 million related to $7.0 million in capital expenditures in 2007 and 2008.
• Operating expenses at ShoreMaster increased $2.3 million as a result of the shutdown and sale of ShoreMaster’s production facility in California following the completion of a major marina project in the state. Plant closure costs include employee-related termination obligations, asset impairment costs plus other related losses and expenses.

2007 compared with 2006
The increase in revenues in our manufacturing segment in 2007 compared with 2006 relates to the following:
The increase in cost of goods sold in our manufacturing segment in 2007 compared with 2006 relates to the following:
The increase in operating expenses in our manufacturing segment in 2007 compared with 2006 relates to the following:
Depreciation expense increased between the years mainly as a result of 2006 capital additions at DMI’s Ft. Erie and West Fargo plants.
• Revenues at DMI increased $48.0 million (35.2%) as a result of increased productivity at the West Fargo plant and increased production levels at the Ft. Erie plant compared with initial start-up levels beginning in May 2006.
• Revenues at ShoreMaster increased $15.9 million (26.4%) between the years due to increased production and sales of commercial products and higher residential sales during the peak selling season. The Aviva Sports product line, acquired by ShoreMaster in February 2007, contributed $3.7 million to the increase in revenues.
• Revenues at BTD increased $3.5 million (4.5%) between the years, mainly as a result of the May 2007 acquisition of Pro Engineering, LLC (Pro Engineering).
• Revenues at T.O. Plastics increased $2.4 million (6.4%) between the years as a result of greater demand for both custom and horticultural products.
• Cost of goods sold at DMI increased $39.8 million between the years, including increases of $30.4 million in material and supplies, $6.8 million in labor and benefit costs and $2.6 million in other direct manufacturing costs. The increase in cost of goods sold is directly related to DMI’s increase in production and sales activity, including operations at the Ft. Erie facilities which commenced in May 2006.
• Cost of goods sold at ShoreMaster increased $9.2 million between the years as a result of increases in material and labor costs directly related to the increase in commercial and residential product sales as well as the acquisition of the Aviva Sports product line in February 2007, which contributed $2.9 million to cost of goods sold in 2007.
• Cost of goods sold at BTD increased $2.8 million between the years as a result of the acquisition of Pro Engineering in May 2007, partially offset by a decrease in costs at BTD’s other manufacturing facilities related to a decrease in unit sales between the years.
• Cost of goods sold at T.O. Plastics increased $2.1 million, mainly driven by an increase in volume, as compared to 2006, and higher material costs.
• Operating expenses at DMI increased $3.0 million, including $2.0 million in 2007 pre-production start-up costs at its new plant in Oklahoma and increases in expenses related to full operations at the Ft. Erie facility. The new plant in Oklahoma started producing towers in January 2008.
• Operating expenses at ShoreMaster increased $3.9 million as a result of increases in labor, benefits, sales expenses and professional services, of which $1.7 million is related to the Aviva Sports product line acquired in February 2007 and $1.3 million is related to facility relocation and legal expenses.
• Operating expenses at BTD increased $1.3 million between the years as a result of increases in labor and other expenses, mainly related to the acquisition of Pro Engineering in May 2007, and the reduction of a legal settlement reserve in 2006.
• Operating expenses at T.O. Plastics increased by $0.6 million between the years mainly as a result of leadership succession costs and increases in professional service expenditures.

HEALTH SERVICES
The following table summarizes the results of operations for our health services segment for the years ended December 31:
2008 compared with 2007
The $8.2 million decrease in health services operating revenues in 2008 compared with 2007 reflects a $4.6 million decrease in revenues from scanning and other related services as a result of a decrease in revenues from rental and interim installations. Revenues from equipment sales and servicing decreased $3.6 million and cost of goods sold decreased $3.3 million between the years as a decrease in traditional dealership distribution of products was mostly offset by increases in manufacturer representative commissions on more manufacturer-direct sales. The $2.7 million decrease in operating expenses includes a $0.9 million increase in gains on sales of imaging company assets, reductions in sales, marketing and advertising expenses totaling $1.2 million and a $0.4 million decrease in labor costs. The increase in depreciation and amortization expense is due to capital additions in 2007 and 2008. The imaging side of the business continues to be affected by less than optimal utilization of certain imaging assets.
2007 compared with 2006
The $4.4 million decrease in health services operating revenues in 2007 compared with 2006 reflects a $3.2 million decrease in revenues from scanning and other related services as a result of a $2.8 million decrease in revenues from rental and interim installations and transportation services and a 9.2% decrease in the number of scans performed between the years. Revenues from equipment sales and servicing decreased $1.2 million between the years as a decrease in traditional dealership distribution of products was mostly offset by increases in manufacturer representative commissions on more manufacturer-direct sales. The decrease in health services revenue was more than offset by the decrease in health services cost of goods sold due to the decrease in traditional dealership distribution of products and $3.2 million in decreases to labor, warranty and other direct costs of sales. The $0.9 million increase in operating expenses is mainly due to increased labor and sales and marketing expenditures. The increase in depreciation and amortization expense is due to capital additions in 2006 and 2007.
FOOD INGREDIENT PROCESSING
The following table summarizes the results of operations for our food ingredient processing segment for the years ended December 31:
2008 compared with 2007
The $5.1 million decrease in food ingredient processing revenues in 2008 compared with 2007 is due to a 13.2% decrease in pounds of product sold, partially offset by a 7.0% increase in the price per pound of product sold. The decrease in product sales was due to a reduction in sales to European customers and major snack customers and to lower production caused by potato supply shortages. European sales were higher than normal in 2007 due to reduced crop yields in Europe in 2006. Supply constraints combined with energy costs rising at rates faster than could be passed through to customers increased costs and lowered profits on products sold in 2008.
2007 compared with 2006
The $25.4 million increase in food ingredient processing revenues in 2007 compared with 2006 reflects a 29.5% increase in pounds of product sold combined with a 20.7% increase in the price per pound sold. A reduction in the value of the U.S.
% % (in thousands) 2008 change 2007 change 2006
Operating Revenues $122,520 (6) $130,670 (3) $135,051 Cost of Goods Sold 96,349 (3) 99,612 (4) 104,108 Operating Expenses 21,030 (11) 23,691 4 22,745 Depreciation and Amortization 4,133 5 3,937 8 3,660 Operating Income $ 1,008 (71) $ 3,430 (24) $ 4,538
% % (in thousands) 2008 change 2007 change 2006
Operating Revenues $65,367 (7) $70,440 56 $45,084 Cost of Goods Sold 55,415 (2) 56,591 28 44,233 Operating Expenses 2,998 (4) 3,135 7 2,920 Depreciation and Amortization 4,094 4 3,952 5 3,759 Operating Income (Loss) $ 2,860 (58) $ 6,762 216 $ (5,828)

dollar relative to certain foreign currencies in 2007 and a poor European potato crop in 2006 led to favorable export pricing and sales increases in Europe, Latin America and the Pacific Rim in 2007. The increase in revenues was only partially offset by a 27.9% increase in cost of goods sold. The cost per pound of product sold decreased 1.2% between the years. The increase in operating expenses between the years is mainly due to increases in employee benefit and travel expenses. The increase in depreciation and amortization expense is related to $1.8 million in capital additions in 2006.
OTHER BUSINESS OPERATIONS
The following table summarizes the results of operations for our other business operations segment for the years ended December 31:
2008 compared with 2007
The increase in operating revenues in 2008 compared with 2007 in our other business operations is due to the following:
The increase in cost of goods sold in 2008 compared with 2007 is due to the following:
The increase in operating expenses in 2008 compared with 2007 is due to the following:
% % (in thousands) 2008 change 2007 change 2006
Operating Revenues $199,511 7 $185,730 28 $145,603 Cost of Goods Sold 132,985 — 133,407 45 91,806 Operating Expenses 54,538 28 42,448 1 41,867 Depreciation and Amortization 2,230 8 2,058 (12) 2,330 Operating Income $ 9,758 25 $ 7,817 (19) $ 9,600
• Revenues at Foley Company (Foley), a mechanical and prime contractor on industrial projects, increased $16.6 million (20.3%) between the years due to an increase in volume of jobs performed.
• Revenues at E.W. Wylie Corporation (Wylie), our flatbed trucking company, increased $7.5 million (21.5%) mainly as a result of the impact of increased fuel costs on shipping rates. Miles driven by company-owned trucks increased 15.7% as a result of the addition of heavy haul and wind tower transport services. Miles driven by owner-operated trucks decreased 32.6%. Combined miles driven by company-owned and owner-operated trucks decreased 1.1% between the years, reflecting a reduction in transport activity related to the economic downturn that started in 2008.
• Revenues at Midwest Construction Services, Inc. (MCS), our electrical design and construction services company, decreased $10.3 million (15.0%) between the years as a result of a reduction in the number of jobs in progress in 2008 compared to 2007 in the area of electrical infrastructure for delivery of wind generated electricity and MCS supplied materials for more jobs in 2007 resulting in a reduction in material pass through costs and revenues in 2008.
• Foley’s cost of goods sold increased $14.2 million, including increases of $6.2 million in direct labor and benefit costs, $5.1 million in subcontractor costs and $2.7 million in material costs as a result of increased construction activity and jobs in progress.
• Cost of goods sold at MCS decreased $14.7 million due to decreases in material and subcontractor costs directly related to MCS having fewer jobs in progress and supplying materials on fewer jobs in 2008. However, MCS’s gross margins increased by $4.4 million mainly as a result of higher productivity and increased margins on wind turbine and electric transmission line projects in 2008.
• Wylie’s operating expenses increased $8.8 million between the years. Fuel costs increased $6.9 million as a result of higher diesel fuel prices and a 15.7% increase in miles driven by company-owned trucks. Labor and benefit costs increased by $1.3 million and equipment rental costs increased by $0.6 million due to the addition of heavy-haul services in the fourth quarter of 2007.
• MCS’s operating expenses increased $2.0 million between the years due to increases in salary, benefit and professional services expenses.

2007 compared with 2006
The increase in operating revenues in 2007 compared with 2006 in our other business operations is due to the following:
The increase in cost of goods sold in 2007 compared with 2006 is due to the following:
The increase in operating expenses in 2007 compared with 2006 is due to the following:
The decrease in depreciation and amortization expense in 2007 compared with 2006 reflects the effects of a decision by Wylie to lease rather than buy replacement trucks for its fleet.
CORPORATE
Corporate includes items such as corporate staff and overhead costs, the results of our captive insurance company and other items excluded from the measurement of operating segment performance. Corporate is not an operating segment. Rather it is added to operating segment totals to reconcile to totals on our consolidated statements of income.
2008 compared with 2007
Corporate operating expenses increased $6.0 million as a result of a combination of increases in self insured health insurance plan costs, insurance expenses and claims experience in the captive insurance company, stock-based compensation and benefit expenses and outside professional service costs related to the formation of a holding company. These increases were partially offset by a decrease in incentive compensation expense.
2007 compared with 2006
Corporate operating expenses decreased $1.5 million as a result of a combination of lower insurance costs at our captive insurance company and lower health insurance plan costs.
• Foley’s operating expenses increased $0.9 million between the years due to increases in labor, professional services and insurance costs.
• Operating expenses at Otter Tail Energy Services Company, (OTESCO), our energy services subsidiary, increased $0.4 million between the years related to the investigation of renewable energy wind-generation projects.
• Revenues at MCS increased $22.9 million (49.9%) between the years as a result of an increase in volume of jobs in 2007.
• Revenues at Foley increased $17.3 million (26.9%) between the years due to an increase in the volume of jobs in progress.
• Revenues at Wylie were unchanged between the years.
• Cost of goods sold at MCS increased $25.0 million mainly due to increases in material, subcontractor, direct labor and insurance costs related to the increase in volume of jobs between the years. Lower than expected margins on certain construction projects at MCS was the main factor contributing to the decrease in operating income between the years.
• Cost of goods sold at Foley increased $16.6 million mainly due to increases in direct labor, employee benefits, and subcontractor and material costs as a result of the increased volume of work performed between the years.
• Operating expenses at MCS were unchanged between the years.
• Operating expenses at Foley increased $0.5 million between the years as a result of increased labor, benefit and insurance expenses. Also, Foley’s 2006 expenses reflect the recovery of $0.2 million in bad debts.
• Operating expenses at Wylie were unchanged between the years.
% % (in thousands) 2008 change 2007 change 2006
Operating Expenses $15,867 62 $9,824 (13) $11,322 Depreciation and Amortization 538 (7) 579 (1) 587

CONSOLIDATED OTHER INCOME AND DEDUCTIONS
Other income and deductions increased by $2.1 million in 2008 compared with 2007 mainly as a result of an increase in Allowance for Funds used During Construction (AFUDC) at the electric utility in 2008. No equity AFUDC was recorded in 2007 because our 2007 average short-term debt balance was in excess of the average balance of Construction Work in Progress (CWIP) at the electric utility in 2007. Average CWIP exceeded average short-term debt in 2008. As a result, 63% of AFUDC in 2008 was equity funded.
Other income and deductions increased by $2.5 million in 2007 compared with 2006 mainly due to a noncash charge of $3.3 million in 2006 related to the disallowance of a portion of capitalized costs of funds used during construction at the electric utility.
CONSOLIDATED INTEREST CHARGES
Interest expense increased $6.1 million in 2008 compared with 2007 primarily as a result of a net increase of $87 million in long-term debt in August and October of 2007. Short-term debt interest expense increased by $1.8 million in 2008 as a result of a $76.3 million increase in the average daily balance of short-term debt outstanding in 2008, mitigated by a 1.9 percentage point decrease in the weighted average interest rate paid on short-term debt between the years. Interest expense also increased in 2008 as a result of a $0.5 million reduction in capitalized interest in 2008 compared with 2007.
Interest expense increased $1.4 million in 2007 compared with 2006 as a result of a net increase of $87 million in long-term debt in 2007. Short-term debt interest expense increased $1.8 million as a result of an increase in the average daily balance of short-term debt outstanding and higher interest rates in 2007 compared with 2006. Increases in interest expense on both long-term and short-term debt were partially offset by a $2.4 million increase in capitalized interest in 2007.
CONSOLIDATED INCOME TAXES
The $12.9 million (46.2%) reduction in income tax expense from continuing operations in 2008 compared with 2007 is mostly due to a 38.8% decrease in income from continuing operations before income taxes. The decrease also is due to federal production tax credits earned on electricity generated from renewable resources in 2008. These items caused our effective tax rate on income from continuing operations to be 30.0% in 2008 compared with 34.1% in 2007.
The $0.9 million (3.2%) increase in income tax expense from continuing operations in 2007 compared to 2006 is due, in part, to a 5.2% increase in income from continuing operations before income taxes. Our effective tax rate on income from continuing operations was 34.1% in 2007 compared with 34.8% in 2006.
DISCONTINUED OPERATIONS
In 2006, we sold the natural gas marketing operations of OTESCO. Discontinued operations includes the operating results of OTESCO’s natural gas marketing operations and an after-tax gain on the sale of its natural gas marketing operations of $0.3 million in 2006.
IMPACT OF INFLATION
The electric utility operates under regulatory provisions that allow price changes in fuel and certain purchased power costs to be passed to most retail customers through automatic adjustments to its rate schedules under fuel clause adjustments. Other increases in the cost of electric service must be recovered through timely filings for electric rate increases with the appropriate regulatory agency.
Our plastics, manufacturing, health services, food ingredient processing, and other business operations consist entirely of businesses whose revenues are not subject to regulation by ratemaking authorities. Increased operating costs are reflected in product or services pricing with any limitations on price increases determined by the marketplace. Raw material costs, labor costs and interest rates are important components of costs for companies in these segments. Any or all of these components could be impacted by inflation or other pricing pressures, with a possible adverse effect on our profitability, especially where increases in these costs exceed price increases on finished products. In recent years, our operating companies have faced strong inflationary and other pricing pressures with respect to steel, fuel, resin, lumber, concrete, aluminum and health care costs, which have been partially mitigated by pricing adjustments.
HOLDING COMPANY REORGANIZATION
Our Board of Directors has authorized a holding company reorganization of our regulated utility business. Following the completion of the holding company reorganization, Otter Tail Power Company, which is currently operated as a division of Otter Tail Corporation, will be operated as a wholly owned subsidiary of the new parent holding company to be named Otter Tail Corporation. In connection with the reorganization, each outstanding Otter Tail Corporation common share will be automatically converted into one common share of the new holding company, and each outstanding Otter Tail Corporation cumulative preferred share will be automatically converted into one cumulative preferred share of the new holding company, having the same terms. The holding company reorganization is subject to approval by Minnesota, North Dakota and South Dakota regulatory agencies and by the Federal Energy Regulatory Commission (FERC), consents from various third parties and certain other conditions. In an order issued on August 18, 2008, the FERC authorized the reorganization subject to certain conditions specified in the order. In an order issued on October 10, 2008, the North Dakota Public Service Commission (NDPSC) approved our application to form a holding company. In a meeting held on October 30, 2008, the South Dakota Public Utilities Commission (SDPUC) approved our application to form a new holding company. The Minnesota Public Utilities Commission (MPUC) approved our request to form a holding company, with certain conditions, at its hearing on December 11, 2008. There remain several business and legal steps that must be accomplished before the reorganization can be completed.
2009 BUSINESS OUTLOOK
We anticipate 2009 diluted earnings per share to be in the range of $1.10 to $1.50. This guidance considers the seasonality of the operating cycles of our businesses and reflects challenges presented by an ongoing economic recession and our plans to prudently manage operating expenses and capital expenditures across all our operating companies. Our current consolidated capital expenditures expectation for 2009 is in the range of $60 to $70 million. This compares with $266 million of capital expenditures in 2008. Some of our businesses could benefit from renewable energy development incentives included in the American Recovery and Reinvestment Act passed by Congress and signed by the President in February 2009. We continue to explore investments in wind projects for the electric segment that could have a positive effect on our earnings and returns on capital. There could be additional capital expenditure opportunities available as well for some of our nonelectric businesses as a result of the passage of the American Recovery and Reinvestment Act of 2009.
Contributing to our earnings guidance for 2009 are the following items:
• We expect increased levels of revenue and net income from our electric segment in 2009 as a result of recently granted rate increases and resource recovery riders. The expected increase in revenues includes Minnesota and North Dakota renewable resource cost recovery rider revenue related to the Ashtabula Wind Center that was placed in service in late 2008, an interim rate increase of approximately $4.8 million, or 4.1%, which is part of a rate case filed with the NDPSC in November 2008 requesting a general rate increase of approximately $6.1 million, or 5.1%. Interim rates remain in effect for all North Dakota customers until the NDPSC makes a final determination on the electric utility’s request, which is expected to occur by August 1, 2009. Expectations in 2009 also reflect a request for an increase in revenues in South Dakota of approximately $3.8 million annually, or 15.3% ($1.3 million in 2009). A final decision on the request is expected from the SDPUC in mid-summer 2009 with no provision for an increase in rates in the interim.
• We expect our plastics segment’s 2009 performance to be below 2008 earnings given continued poor economic conditions. Announced capacity expansions are not expected to be brought on line until the economy improves and demand for PVC pipe increases.
• We expect earnings from our manufacturing segment to improve in 2009. Business conditions at BTD remain relatively strong and earnings are expected to increase in 2009 given full year operating results of Miller Welding, acquired in May 2008, an expanded customer base and expected improvements in manufacturing processes. While the economy is expected to impact the amount of spending on waterfront products, earnings are expected to improve at ShoreMaster compared with 2008 given the restructuring that has occurred in its business. The Adelanto facility has been closed, workforce reductions have been put in place, capital spending is being limited and improved profitability is expected on commercial projects in 2009. At DMI, we expect a decline in earnings in 2009 due to wind developers’ limited access to financing which has resulted in cancellation or suspension of orders across the industry. Industry forecasts for megawatt installations of wind power in 2009 portray a decrease of between 25 to 50 percent from 2008. T. O. Plastics’ earnings are expected to remain flat between the years. Backlog in place in the manufacturing segment to support 2009 revenues is approximately $241 million compared with $295 million one year ago.

Our outlook for 2009 is dependent on a variety of factors and is subject to the risks and uncertainties discussed under “Risk Factors and Cautionary Statements.”
LIQUIDITY
The following table presents the status of our lines of credit as of December 31, 2008:
We believe we have the necessary liquidity to effectively conduct business operations for an extended period if current market conditions continue. Despite the difficult year in 2008, our balance sheet is strong and we are in compliance with our debt covenants. We completed an equity offering in September 2008, which allowed us to invest in major organic growth opportunities in wind energy projects.
We believe our financial condition is strong and that our cash, other liquid assets, operating cash flows, existing lines of credit, access to capital markets and borrowing ability because of solid credit ratings, when taken together, provide adequate resources to fund ongoing operating requirements and future capital expenditures related to expansion of existing businesses and development of new projects. Additional equity and debt financing will be required in the period 2009 through 2013 given our current capital expansion plans over this period. See “Capital Resources” section for further discussion. Also, our operating cash flow and access to capital markets can be impacted by macroeconomic factors outside our control. In addition, our borrowing costs can be impacted by changing interest rates on short-term and long-term debt and ratings assigned to us by independent rating agencies, which in part are based on certain credit measures such as interest coverage and leverage ratios.
In March 2008, DMI entered into a three-year $40 million receivable purchase agreement whereby designated customer accounts receivable may be sold to General Electric Capital Corporation (GECC) on a revolving basis. Accounts receivable totaling $132.9 million were sold in 2008. Discounts, fees and commissions of $0.7 million for the year ended December 31, 2008 were charged to operating expenses in the consolidated statements of income. The balance of receivables sold that were still outstanding to the buyer as of December 31, 2008 was $25.3 million. The sales of these accounts receivable are reflected as a reduction of accounts receivable in the 2008 consolidated balance sheet and the proceeds are included in the cash flows from operating activities in the 2008 consolidated statement of cash flows.
In December 2007, ShoreMaster entered into an agreement with GE Commercial Distribution Finance Corporation (CDF) to provide floor plan financing for certain dealer purchases of ShoreMaster products. Financings under this agreement began in 2008. This agreement has improved our liquidity by financing dealer purchases of ShoreMaster’s products without requiring substantial use of working capital. ShoreMaster is paid by CDF shortly after product shipment for purchases financed under this agreement. The floor plan financing agreement requires ShoreMaster to repurchase new and unused inventory repossessed by CDF to satisfy the dealer’s obligations to CDF under this agreement. ShoreMaster has agreed to unconditionally guarantee to CDF all current and future liabilities which any dealer owes to CDF under this agreement. Any
• We expect increased net income from our health services segment in 2009 as it focuses on improving its mix of imaging assets and asset utilization rates and has implemented cost reductions across the segment.
• We expect increased net income from our food ingredient processing business in 2009 based on expectations of higher sales volumes, strong pricing for products, lower energy costs and higher production levels in 2009 compared with 2008. This business has backlog in place for 2009 of 48 million pounds compared with 52 million pounds one year ago.
• We expect our other business operations segment to have a similar level of earnings in 2009 compared with 2008. Backlog in place for the construction businesses is $71 million for 2009 compared with $77 million one year ago.
• We expect corporate general and administrative costs to decrease in 2009.
In Use on Restricted due to December 31, Outstanding Available on(in thousands) Line Limit 2008 Letters of Credit December 31, 2008
Varistar Credit Agreement $200,000 $107,849 $14,445 $ 77,706 Electric Utility Credit Agreement 170,000 27,065 — 142,935
Total $370,000 $134,914 $14,445 $220,641
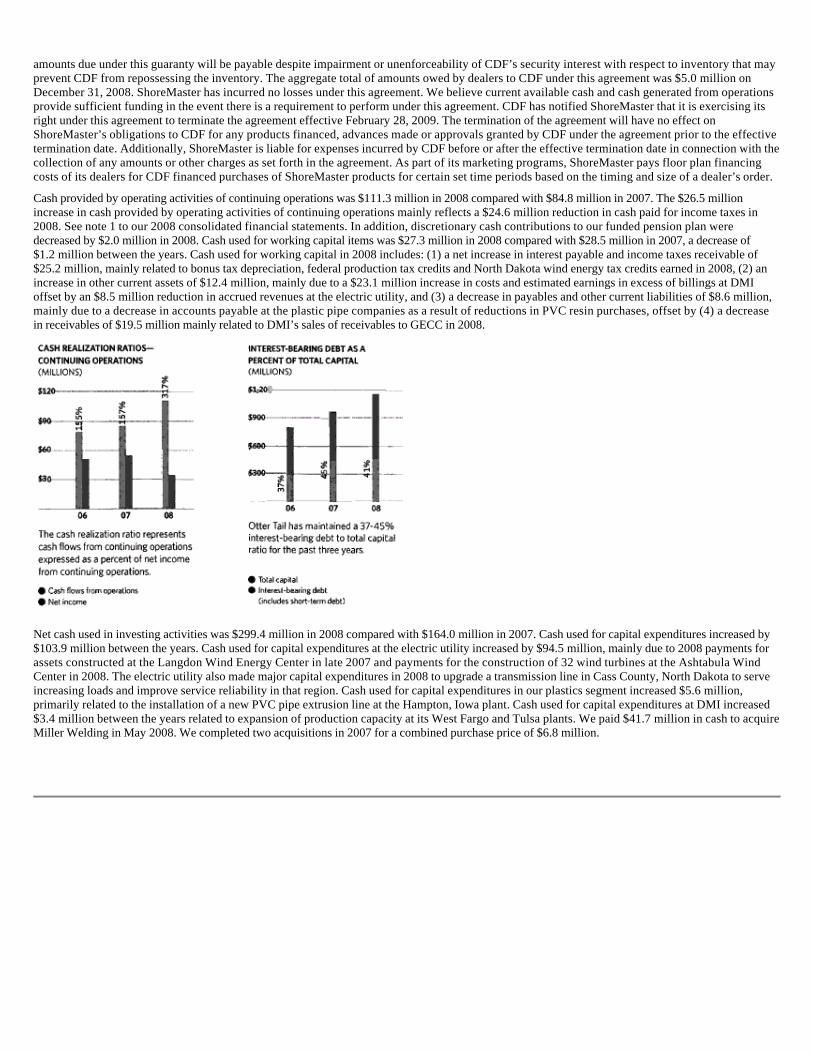
amounts due under this guaranty will be payable despite impairment or unenforceability of CDF’s security interest with respect to inventory that may prevent CDF from repossessing the inventory. The aggregate total of amounts owed by dealers to CDF under this agreement was $5.0 million on December 31, 2008. ShoreMaster has incurred no losses under this agreement. We believe current available cash and cash generated from operations provide sufficient funding in the event there is a requirement to perform under this agreement. CDF has notified ShoreMaster that it is exercising its right under this agreement to terminate the agreement effective February 28, 2009. The termination of the agreement will have no effect on ShoreMaster’s obligations to CDF for any products financed, advances made or approvals granted by CDF under the agreement prior to the effective termination date. Additionally, ShoreMaster is liable for expenses incurred by CDF before or after the effective termination date in connection with the collection of any amounts or other charges as set forth in the agreement. As part of its marketing programs, ShoreMaster pays floor plan financing costs of its dealers for CDF financed purchases of ShoreMaster products for certain set time periods based on the timing and size of a dealer’s order.
Cash provided by operating activities of continuing operations was $111.3 million in 2008 compared with $84.8 million in 2007. The $26.5 million increase in cash provided by operating activities of continuing operations mainly reflects a $24.6 million reduction in cash paid for income taxes in 2008. See note 1 to our 2008 consolidated financial statements. In addition, discretionary cash contributions to our funded pension plan were decreased by $2.0 million in 2008. Cash used for working capital items was $27.3 million in 2008 compared with $28.5 million in 2007, a decrease of $1.2 million between the years. Cash used for working capital in 2008 includes: (1) a net increase in interest payable and income taxes receivable of $25.2 million, mainly related to bonus tax depreciation, federal production tax credits and North Dakota wind energy tax credits earned in 2008, (2) an increase in other current assets of $12.4 million, mainly due to a $23.1 million increase in costs and estimated earnings in excess of billings at DMI offset by an $8.5 million reduction in accrued revenues at the electric utility, and (3) a decrease in payables and other current liabilities of $8.6 million, mainly due to a decrease in accounts payable at the plastic pipe companies as a result of reductions in PVC resin purchases, offset by (4) a decrease in receivables of $19.5 million mainly related to DMI’s sales of receivables to GECC in 2008.
Net cash used in investing activities was $299.4 million in 2008 compared with $164.0 million in 2007. Cash used for capital expenditures increased by $103.9 million between the years. Cash used for capital expenditures at the electric utility increased by $94.5 million, mainly due to 2008 payments for assets constructed at the Langdon Wind Energy Center in late 2007 and payments for the construction of 32 wind turbines at the Ashtabula Wind Center in 2008. The electric utility also made major capital expenditures in 2008 to upgrade a transmission line in Cass County, North Dakota to serve increasing loads and improve service reliability in that region. Cash used for capital expenditures in our plastics segment increased $5.6 million, primarily related to the installation of a new PVC pipe extrusion line at the Hampton, Iowa plant. Cash used for capital expenditures at DMI increased $3.4 million between the years related to expansion of production capacity at its West Fargo and Tulsa plants. We paid $41.7 million in cash to acquire Miller Welding in May 2008. We completed two acquisitions in 2007 for a combined purchase price of $6.8 million.

Net cash provided by financing activities was $154.6 million in 2008 compared with $113.2 million in 2007. Proceeds from the issuance of common stock, net of issuance expenses, were $156.6 million in 2008 compared with $7.7 million in 2007. We issued 5,175,000 common shares in a public offering in September 2008. During 2008, 276,685 common shares were issued for stock options exercised compared with 298,601 common shares issued for stock options exercised in 2007. We received $1.2 million in proceeds from the issuance of long-term debt and repaid $3.6 million in long-term debt in 2008. In 2007, we received proceeds of $203.4 million in cash from the issuance of debt, net of debt issuance expenses, and paid $118.2 million to retire or refinance debt. Proceeds from short-term borrowings were $39.9 million in 2008 compared with $56.1 million in 2007. Proceeds from short-term borrowings were used to help fund construction expenditures in 2008. Dividends paid on common and preferred shares in 2008 increased $2.6 million in 2008 compared with 2007. The increase in dividend payments is due to a two cent per share increase in common dividends paid and an increase of 5,534,831 common shares outstanding between the years, most of which were issued for the September 2008 public offering and only received dividends in the fourth quarter of 2008.
CAPITAL REQUIREMENTS
We have a capital expenditure program for expanding, upgrading and improving our plants and operating equipment. Typical uses of cash for capital expenditures are investments in electric generation facilities, transmission and distribution lines, manufacturing facilities and upgrades, equipment used in the manufacturing process, purchase of diagnostic medical equipment, transportation equipment and computer hardware and information systems. The capital expenditure program is subject to review and is revised in light of changes in demands for energy, technology, environmental laws, regulatory changes, business expansion opportunities, the costs of labor, materials and equipment and our consolidated financial condition.
Cash used for consolidated capital expenditures was $266 million in 2008, $162 million in 2007 and $69 million in 2006. As a result of the ongoing economic recession and difficult credit market conditions we have reduced capital expenditures across all of our operating companies. Estimated capital expenditures for 2009 are $61 million. Total capital expenditures for the five-year period 2009 through 2013 are estimated to be approximately $884 million, which includes $395 million for our share of expected expenditures for construction of the planned Big Stone II electric generating plant and related transmission assets if all necessary permits and approvals are granted on a timely basis, and $66 million for CapX 2020 projects. The breakdown of 2006, 2007 and 2008 actual and 2009 through 2013 estimated capital expenditures by segment is as follows:
The electric segment continues to review another wind project called the Luverne Wind Farm. The expected cost of this 49.5 megawatt project is $100 to $110 million. This project is subject to our ability to obtain acceptable financing terms and to approval by our Board of Directors. There could be additional capital expenditure opportunities available as well for some of our nonelectric businesses as a result of the passage of the American Recovery and Reinvestment Act of 2009. If Big Stone II is not built, budgeted amounts for that project will be applied to alternative baseload generation projects that will be needed to meet the electric utility’s future generation requirements.
(in millions) 2006 2007 2008 2009 2009-2013
Electric $ 35 $ 104 $ 199 $ 35 $ 698 Plastics 5 3 9 5 18 Manufacturing 20 43 48 13 115 Health Services 5 5 4 3 27 Food Ingredient Processing 2 — 2 3 14 Other Business Operations 2 6 4 2 11 Corporate — 1 — — 1
Total $ 69 $ 162 $ 266 $ 61 $ 884
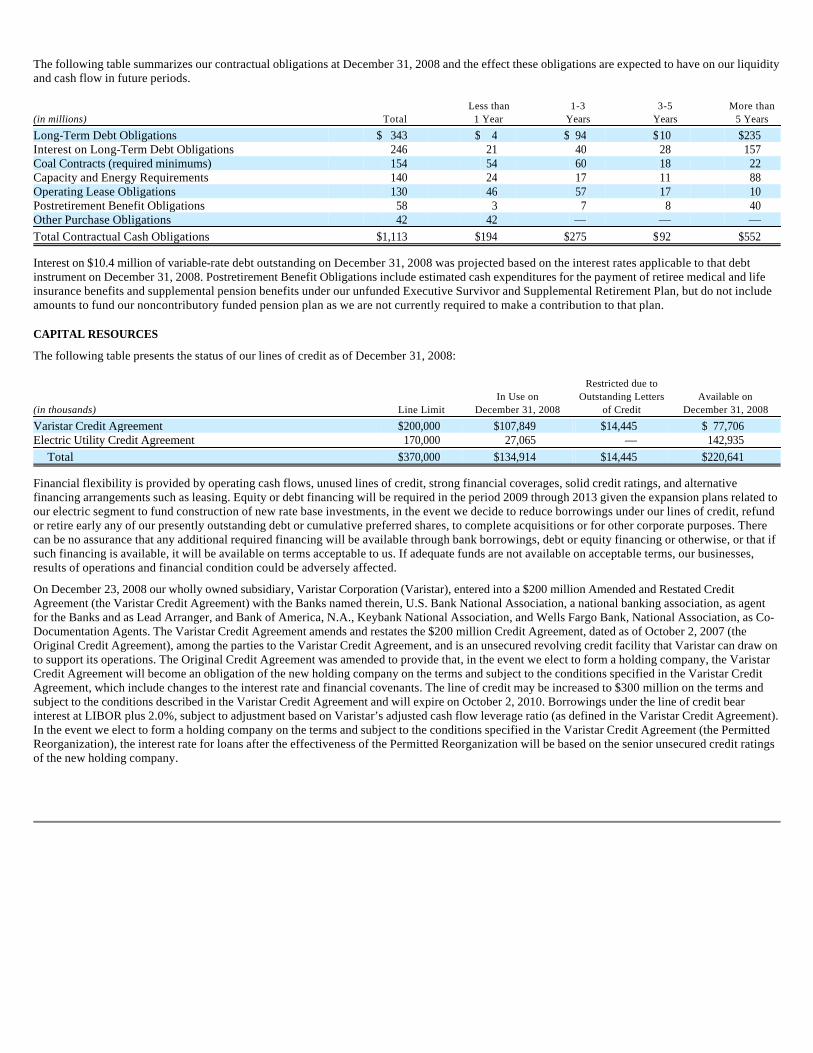
The following table summarizes our contractual obligations at December 31, 2008 and the effect these obligations are expected to have on our liquidity and cash flow in future periods.
Interest on $10.4 million of variable-rate debt outstanding on December 31, 2008 was projected based on the interest rates applicable to that debt instrument on December 31, 2008. Postretirement Benefit Obligations include estimated cash expenditures for the payment of retiree medical and life insurance benefits and supplemental pension benefits under our unfunded Executive Survivor and Supplemental Retirement Plan, but do not include amounts to fund our noncontributory funded pension plan as we are not currently required to make a contribution to that plan.
CAPITAL RESOURCES
The following table presents the status of our lines of credit as of December 31, 2008:
Financial flexibility is provided by operating cash flows, unused lines of credit, strong financial coverages, solid credit ratings, and alternative financing arrangements such as leasing. Equity or debt financing will be required in the period 2009 through 2013 given the expansion plans related to our electric segment to fund construction of new rate base investments, in the event we decide to reduce borrowings under our lines of credit, refund or retire early any of our presently outstanding debt or cumulative preferred shares, to complete acquisitions or for other corporate purposes. There can be no assurance that any additional required financing will be available through bank borrowings, debt or equity financing or otherwise, or that if such financing is available, it will be available on terms acceptable to us. If adequate funds are not available on acceptable terms, our businesses, results of operations and financial condition could be adversely affected.
On December 23, 2008 our wholly owned subsidiary, Varistar Corporation (Varistar), entered into a $200 million Amended and Restated Credit Agreement (the Varistar Credit Agreement) with the Banks named therein, U.S. Bank National Association, a national banking association, as agent for the Banks and as Lead Arranger, and Bank of America, N.A., Keybank National Association, and Wells Fargo Bank, National Association, as Co-Documentation Agents. The Varistar Credit Agreement amends and restates the $200 million Credit Agreement, dated as of October 2, 2007 (the Original Credit Agreement), among the parties to the Varistar Credit Agreement, and is an unsecured revolving credit facility that Varistar can draw on to support its operations. The Original Credit Agreement was amended to provide that, in the event we elect to form a holding company, the Varistar Credit Agreement will become an obligation of the new holding company on the terms and subject to the conditions specified in the Varistar Credit Agreement, which include changes to the interest rate and financial covenants. The line of credit may be increased to $300 million on the terms and subject to the conditions described in the Varistar Credit Agreement and will expire on October 2, 2010. Borrowings under the line of credit bear interest at LIBOR plus 2.0%, subject to adjustment based on Varistar’s adjusted cash flow leverage ratio (as defined in the Varistar Credit Agreement). In the event we elect to form a holding company on the terms and subject to the conditions specified in the Varistar Credit Agreement (the Permitted Reorganization), the interest rate for loans after the effectiveness of the Permitted Reorganization will be based on the senior unsecured credit ratings of the new holding company.
Less than 1-3 3-5 More than(in millions) Total 1 Year Years Years 5 Years
Long-Term Debt Obligations $ 343 $ 4 $ 94 $10 $235 Interest on Long-Term Debt Obligations 246 21 40 28 157 Coal Contracts (required minimums) 154 54 60 18 22 Capacity and Energy Requirements 140 24 17 11 88 Operating Lease Obligations 130 46 57 17 10 Postretirement Benefit Obligations 58 3 7 8 40 Other Purchase Obligations 42 42 — — — Total Contractual Cash Obligations $1,113 $194 $275 $92 $552
Restricted due to In Use on Outstanding Letters Available on(in thousands) Line Limit December 31, 2008 of Credit December 31, 2008
Varistar Credit Agreement $200,000 $107,849 $14,445 $ 77,706 Electric Utility Credit Agreement 170,000 27,065 — 142,935
Total $370,000 $134,914 $14,445 $220,641

The Varistar Credit Agreement contains a number of restrictions on the businesses of Varistar and its material subsidiaries, including restrictions on their ability to merge, sell assets, make certain investments, create or incur liens on assets, guarantee the obligations of any other party, and engage in transactions with related parties. The Varistar Credit Agreement also contains affirmative covenants and events of default. The Varistar Credit Agreement does not include provisions for the termination of the agreement or the acceleration of repayment of amounts outstanding due to changes in our credit ratings. Varistar’s obligations under the Varistar Credit Agreement are guaranteed by each of its material subsidiaries.
On July 30, 2008 Otter Tail Corporation, dba Otter Tail Power Company replaced its credit agreement with U.S. Bank National Association, which provided for a $75 million line of credit, with a new credit agreement providing for a $170 million line of credit with an accordion feature whereby the line can be increased to $250 million as described in the new credit agreement. The new credit agreement (the Electric Utility Credit Agreement) is between Otter Tail Corporation, dba Otter Tail Power Company and JPMorgan Chase Bank, N.A., Wells Fargo Bank, National Association and Merrill Lynch Bank USA, as Banks, U.S Bank National Association, as a Bank and as agent for the Banks, and Bank of America, N.A., as a Bank and as Syndication Agent. The Electric Utility Credit Agreement is an unsecured revolving credit facility that the electric utility can draw on to support the working capital needs and other capital requirements of its operations. Borrowings under this line of credit bear interest at LIBOR plus 0.5%, subject to adjustment based on the ratings of our senior unsecured debt. The Electric Utility Credit Agreement contains a number of restrictions on the business of the electric utility, including restrictions on its ability to merge, sell assets, incur indebtedness, create or incur liens on assets, guarantee the obligations of any other party, and engage in transactions with related parties. The Electric Utility Credit Agreement also contains affirmative covenants and events of default. The Electric Utility Credit Agreement is subject to renewal on July 30, 2011.
The note purchase agreement relating to our $90 million 6.63% senior notes due December 1, 2011 (the 2001 Note Purchase Agreement), the note purchase agreement relating to our $50 million 5.778% senior note due November 30, 2017 (the Cascade Note Purchase Agreement), and the note purchase agreement relating to our $155 million senior unsecured notes issued in four series consisting of $33 million aggregate principal amount of 5.95% Senior Unsecured Notes, Series A, due 2017; $30 million aggregate principal amount of 6.15% Senior Unsecured Notes, Series B, due 2022; $42 million aggregate principal amount of 6.37% Senior Unsecured Notes, Series C, due 2027; and $50 million aggregate principal amount of 6.47% Senior Unsecured Notes, Series D, due 2037 (the 2007 Note Purchase Agreement) each states that we may prepay all or any part of the notes issued thereunder (in an amount not less than 10% of the aggregate principal amount of the notes then outstanding in the case of a partial prepayment) at 100% of the principal amount prepaid, together with accrued interest and a make-whole amount. Each of the 2001 Note Purchase Agreement and the Cascade Note Purchase Agreement states in the event of a transfer of utility assets put event, the noteholders thereunder have the right to require us to repurchase the notes held by them in full, together with accrued interest and a make-whole amount, on the terms and conditions specified in the respective note purchase agreements. The 2007 Note Purchase Agreement states we must offer to prepay all of the outstanding notes issued thereunder at 100% of the principal amount together with unpaid accrued interest in the event of a change of control of the Company.
The 2001 Note Purchase Agreement, the Cascade Note Purchase Agreement and the 2007 Note Purchase Agreement each contains a number of restrictions on us and our subsidiaries. In each case these include restrictions on our ability and the ability of certain of our subsidiaries to merge, sell assets, create or incur liens on assets, guarantee the obligations of any other party, and engage in transactions with related parties. Our obligations under the 2001 Note Purchase Agreement and the Cascade Note Purchase Agreement are guaranteed by certain of our subsidiaries.
Financial Covenants
The Electric Utility Credit Agreement, the 2001 Note Purchase Agreement, the Cascade Note Purchase Agreement, the 2007 Note Purchase Agreement, the Lombard US Equipment Finance Note and the financial guaranty insurance policy with Ambac Assurance Corporation relating to our pollution control refunding bonds contain covenants by us to not permit our debt-to-total capitalization ratio to exceed 60% or permit our interest and dividend coverage ratio (or in the case of the Cascade Note Purchase Agreement, our interest coverage ratio) to be less than 1.5 to 1. On effectiveness of the Permitted Reorganization, the Varistar Credit Agreement will contain similar covenants applicable to the new holding company. The note purchase agreements further restrict us from allowing our priority debt to exceed 20% of total capitalization. The Varistar Credit Agreement also contains certain financial covenants that will apply to Varistar until the effectiveness of the Permitted Reorganization. Specifically, Varistar must maintain a fixed charge coverage ratio (as defined in the Varistar Credit Agreement) of not less than 1.20 to 1.00 for each period of four consecutive fiscal quarters through March 31, 2009, and not less than 1.25 to 1.00 for each period of four consecutive fiscal quarters ending June 30, 2009 and thereafter. In addition, Varistar must not permit its Cash Flow Leverage Ratio (as defined in the Varistar Credit Agreement) to exceed 3.25 to 1.00 for each period of four consecutive fiscal quarters through March 31, 2009, or to exceed 3.00 to 1.00 for each period of four
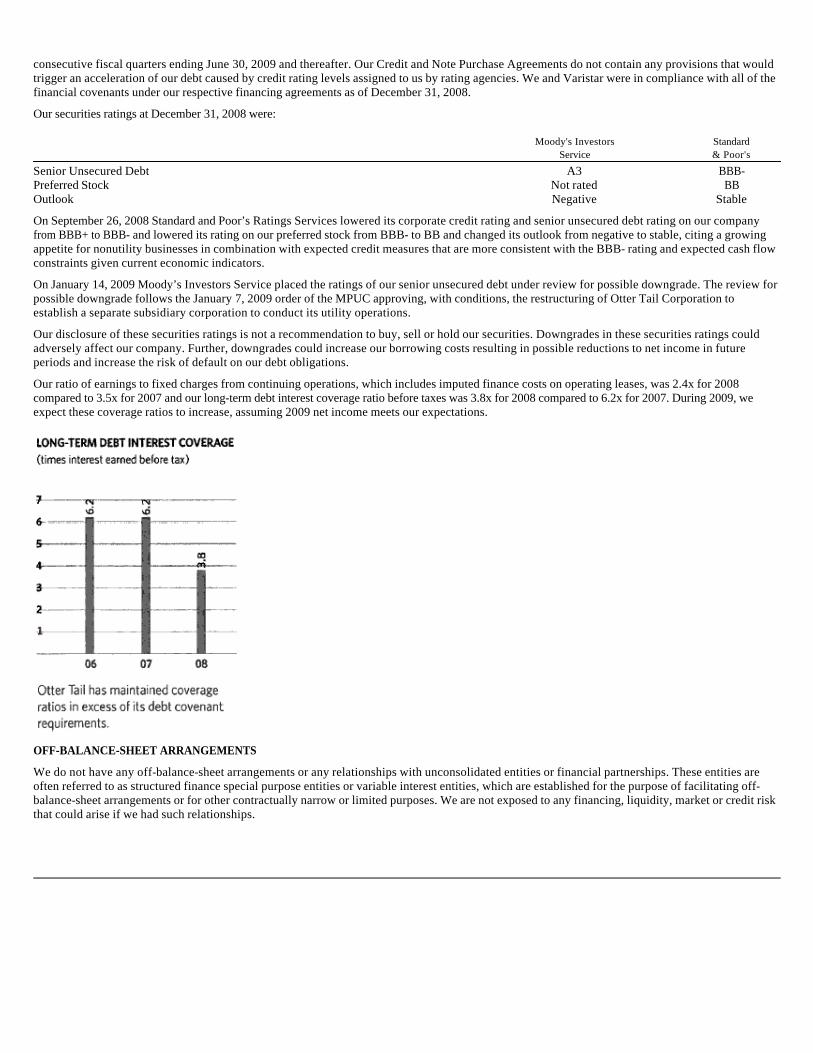
consecutive fiscal quarters ending June 30, 2009 and thereafter. Our Credit and Note Purchase Agreements do not contain any provisions that would trigger an acceleration of our debt caused by credit rating levels assigned to us by rating agencies. We and Varistar were in compliance with all of the financial covenants under our respective financing agreements as of December 31, 2008.
Our securities ratings at December 31, 2008 were:
On September 26, 2008 Standard and Poor’s Ratings Services lowered its corporate credit rating and senior unsecured debt rating on our company from BBB+ to BBB- and lowered its rating on our preferred stock from BBB- to BB and changed its outlook from negative to stable, citing a growing appetite for nonutility businesses in combination with expected credit measures that are more consistent with the BBB- rating and expected cash flow constraints given current economic indicators.
On January 14, 2009 Moody’s Investors Service placed the ratings of our senior unsecured debt under review for possible downgrade. The review for possible downgrade follows the January 7, 2009 order of the MPUC approving, with conditions, the restructuring of Otter Tail Corporation to establish a separate subsidiary corporation to conduct its utility operations.
Our disclosure of these securities ratings is not a recommendation to buy, sell or hold our securities. Downgrades in these securities ratings could adversely affect our company. Further, downgrades could increase our borrowing costs resulting in possible reductions to net income in future periods and increase the risk of default on our debt obligations.
Our ratio of earnings to fixed charges from continuing operations, which includes imputed finance costs on operating leases, was 2.4x for 2008 compared to 3.5x for 2007 and our long-term debt interest coverage ratio before taxes was 3.8x for 2008 compared to 6.2x for 2007. During 2009, we expect these coverage ratios to increase, assuming 2009 net income meets our expectations.
OFF-BALANCE-SHEET ARRANGEMENTS
We do not have any off-balance-sheet arrangements or any relationships with unconsolidated entities or financial partnerships. These entities are often referred to as structured finance special purpose entities or variable interest entities, which are established for the purpose of facilitating off-balance-sheet arrangements or for other contractually narrow or limited purposes. We are not exposed to any financing, liquidity, market or credit risk that could arise if we had such relationships.
Moody's Investors Standard Service & Poor's
Senior Unsecured Debt A3 BBB-Preferred Stock Not rated BBOutlook Negative Stable

RISK FACTORS AND CAUTIONARY STATEMENTS
We are including the following factors and cautionary statements in this Annual Report to make applicable and to take advantage of the safe harbor provisions of the Private Securities Litigation Reform Act of 1995 for any forward-looking statements made by us or on our behalf. Forward-looking statements include statements concerning plans, objectives, goals, strategies, future events or performance, and underlying assumptions (many of which are based, in turn, upon further assumptions) and other statements that are other than statements of historical facts. From time to time, we may publish or otherwise make available forward-looking statements of this nature. All these forward-looking statements, whether written or oral and whether made by us or on our behalf, are also expressly qualified by these factors and cautionary statements. Forward-looking statements involve risks and uncertainties, which could cause actual results or outcomes to differ materially from those expressed.
Any forward-looking statement contained in this document speaks only as of the date on which the statement is made, and we undertake no obligation to update any forward-looking statement or statements to reflect events or circumstances that occur after the date on which the statement is made or to reflect the occurrence of unanticipated events. New factors emerge from time to time, and it is not possible for us to predict all of the factors, nor can we assess the effect of each factor on our business or the extent to which any factor, or combination of factors, may cause actual results to differ materially from those contained in any forward-looking statement. The following factors and the other matters discussed herein are important factors that could cause actual results or outcomes for our company to differ materially from those discussed in the forward-looking statements included elsewhere in this document.
GENERAL
Federal and state environmental regulation could require us to incur substantial capital expenditures and increased operating costs.
We are subject to federal, state and local environmental laws and regulations relating to air quality, water quality, waste management, natural resources and health safety. These laws and regulations regulate the modification and operation of existing facilities, the construction and operation of new facilities and the proper storage, handling, cleanup and disposal of hazardous waste and toxic substances. Compliance with these legal requirements requires us to commit significant resources and funds toward environmental monitoring, installation and operation of pollution control equipment, payment of emission fees and securing environmental permits. Obtaining environmental permits can entail significant expense and cause substantial construction delays. Failure to comply with environmental laws and regulations, even if caused by factors beyond our control, may result in civil or criminal liabilities, penalties and fines.
Existing environmental laws or regulations may be revised and new laws or regulations may be adopted or become applicable to us. Revised or additional regulations, which result in increased compliance costs or additional operating restrictions, particularly if those costs are not fully recoverable from customers, could have a material effect on our results of operations.
Volatile financial markets and changes in our debt ratings could restrict our ability to access capital and increase borrowing costs and pension plan expenses.
We rely on access to both short- and long-term capital markets as a source of liquidity for capital requirements not satisfied by cash flows from operations. If we are not able to access capital at competitive rates, our ability to implement our business plans may be adversely affected. Market disruptions or a downgrade of our credit ratings may increase the cost of borrowing or adversely affect our ability to access one or more financial markets.
Disruptions, uncertainty or volatility in the financial markets can also adversely impact our results of operations, the ability of customers to finance purchases of goods and services, and our financial condition as well as exert downward pressure on stock prices and/or limit our ability to sustain our current common stock dividend level.
Changes in the U.S. capital markets could also have significant effects on our pension plan. Our pension income or expense is affected by factors including the market performance of the assets in the master pension trust maintained for the pension plan for some of our employees, the weighted average asset allocation and long-term rate of return of our pension plan assets, the discount rate used to determine the service and interest cost components of our net periodic pension cost and assumed rates of increase in our employees’ future compensation. If our pension plan assets do not achieve positive rates of return, or if our estimates and assumed rates are not accurate, our earnings may decrease because net periodic pension costs would rise and we could be required to provide additional funds to cover our obligations to employees under the pension plan.
As of December 31, 2008, our defined benefit pension plan assets had declined significantly since December 31, 2007. We are not required to make a mandatory contribution to the pension plan in 2009. However, if the market value of pension plan assets continues to decline and relief under the Pension Protection Act is no longer granted, we could be required to contribute additional capital to the pension plan.
Any significant impairment of our goodwill would cause a decrease in our assets and a reduction in our net operating performance.
We had approximately $106.8 million of goodwill recorded on our consolidated balance sheet as of December 31, 2008. We have recorded goodwill for businesses in each of our business segments, except for our electric utility. If we make changes in our business strategy or if market or other conditions adversely affect operations in any of these businesses, we may be forced to record an impairment charge, which would lead to decreased assets and a reduction in net operating performance. Goodwill is tested for impairment annually or whenever events or changes in circumstances indicate impairment may have occurred. If the testing performed indicates that impairment has occurred, we are required to record an impairment charge for the difference between the carrying value of the goodwill and the implied fair value of the goodwill in the period the determination is made. The testing of goodwill for impairment requires us to make significant estimates about our future performance and cash flows, as well as other assumptions. These estimates can be affected by numerous factors, including changes in economic, industry or market conditions, changes in business operations, future business operating performance, changes in competition or changes in technologies. Any changes in key assumptions, or actual performance compared with key assumptions, about our business and its future prospects or other assumptions could affect the fair value of one or more business segments, which may result in an impairment charge.
We currently have $24.3 million of goodwill and a $3.3 million nonamortizable trade name recorded on our balance sheet related to the acquisition of Idaho Pacific Holdings, Inc. (IPH) in 2004. If conditions of low sales prices, high energy and raw material costs and a shortage of raw potato supplies return, as experienced in 2006, or operating margins do not improve according to our projections, the reductions in anticipated cash flows from this business may indicate that its fair value is less than its book value resulting in an impairment of some or all of the goodwill and nonamortizable intangible assets associated with IPH and a corresponding charge against earnings.
We currently have $12.3 million of goodwill and $4.9 million in nonamortizable trade names recorded on our balance sheet related to the acquisition of ShoreMaster and its subsidiary companies. If current economic conditions continue to impact the amount of sales of waterfront products and ShoreMaster is not successful with reorganizing and streamlining its business to improve operating margins according to our projections, the reductions in anticipated cash flows from this business may indicate that its fair value is less than its book value resulting in an impairment of some or all of the goodwill and nonamortizable intangible assets associated with ShoreMaster and a corresponding charge against earnings.
A sustained decline in our common stock price below book value may result in goodwill impairments that could adversely affect our results of operations and financial position, as well as our credit facility covenants.
Economic conditions could negatively impact our businesses.
Our businesses are affected by local, national and worldwide economic conditions. The current tightening of credit in financial markets could continue to adversely affect the ability of customers to finance purchases of our goods and services, resulting in decreased orders, cancelled or deferred orders, slower payment cycles, and increased bad debt and customer bankruptcies. Our businesses may also be adversely affected by decreases in the general level of economic activity, such as decreases in business and consumer spending. A decline in the level of economic activity and uncertainty regarding energy and commodity prices could adversely affect our results of operations and our future growth.
If we are unable to achieve the organic growth we expect, our financial performance may be adversely affected.
We expect much of our growth in the next few years will come from major capital investment at existing companies. To achieve the organic growth we expect we will have to develop new products and services, expand our markets and increase efficiencies in our businesses. Competitive and economic factors could adversely affect our ability to do this. If we are unable to achieve and sustain consistent organic growth, we will be less likely to meet our revenue growth targets, which together with any resulting impact on our net income growth, may adversely affect the market price of our common shares.

Our plans to grow and diversify through acquisitions may not be successful, which could result in poor financial performance.
As part of our business strategy, we intend to acquire new businesses. We may not be able to identify appropriate acquisition candidates or successfully negotiate, finance or integrate acquisitions. If we are unable to make acquisitions, we may be unable to realize the growth we anticipate. Future acquisitions could involve numerous risks including: difficulties in integrating the operations, services, products and personnel of the acquired business; and the potential loss of key employees, customers and suppliers of the acquired business. If we are unable to successfully manage these risks of an acquisition, we could face reductions in net income in future periods.
Our plans to acquire, grow and operate our nonelectric businesses could be limited by state law.
Our plans to acquire, grow and operate our nonelectric businesses could be adversely affected by legislation in one or more states that may attempt to limit the amount of diversification permitted in a holding company structure that includes a regulated utility company or affiliated nonelectric companies.
The terms of some of our contracts could expose us to unforeseen costs and costs not within our control, which may not be recoverable and could adversely affect our results of operations and financial condition.
DMI and ShoreMaster, two businesses in our manufacturing segment, and our construction companies frequently provide products and services pursuant to fixed-price contracts. Revenues recognized on jobs in progress under fixed-price contracts for the year ended December 31, 2008 were $425 million. Under those contracts, we agree to perform the contract for a fixed price and, as a result, can improve our expected profit by superior contract performance, productivity, worker safety and other factors resulting in cost savings. However, we could incur cost overruns above the approved contract price, which may not be recoverable.
Fixed-price contract prices are established based largely upon estimates and assumptions relating to project scope and specifications, personnel and material needs. These estimates and assumptions may prove inaccurate or conditions may change due to factors out of our control, resulting in cost overruns, which we may be required to absorb and that could have a material adverse effect on our business, financial condition and results of our operations. In addition, our profits from these contracts could decrease and we could experience losses if we incur difficulties in performing the contracts or are unable to secure fixed-pricing commitments from our manufacturers, suppliers and subcontractors at the time we enter into fixed-price contracts with our customers.
We are subject to risks associated with energy markets.
Our businesses are subject to the risks associated with energy markets, including market supply and increasing energy prices. If we are faced with shortages in market supply, we may be unable to fulfill our contractual obligations to our retail, wholesale and other customers at previously anticipated costs. This could force us to obtain alternative energy or fuel supplies at higher costs or suffer increased liability for unfulfilled contractual obligations. Any significantly higher than expected energy or fuel costs would negatively affect our financial performance.
Certain of our operating companies sell products to consumers that could be subject to recall.
Certain of our operating companies sell products to consumers that could be subject to recall due to product defect or other safety concerns. If such a recall were to occur, it could have a negative impact on our consolidated results of operations and financial position.
ELECTRIC
We may experience fluctuations in revenues and expenses related to our electric operations, which may cause our financial results to fluctuate and could impair our ability to make distributions to shareholders or scheduled payments on our debt obligations.
A number of factors, many of which are beyond our control, may contribute to fluctuations in our revenues and expenses from electric operations, causing our net income to fluctuate from period to period. These risks include fluctuations in the volume and price of sales of electricity to customers or other utilities, which may be affected by factors such as mergers and acquisitions of other utilities, geographic location of other utilities, transmission costs (including increased costs related to operations of regional transmission organizations), changes in the manner in which wholesale power is sold and purchased,

unplanned interruptions at our generating plants, the effects of regulation and legislation, demographic changes in our customer base and changes in our customer demand or load growth. Electric wholesale margins have been significantly and adversely affected by increased efficiencies in the MISO market. Electric wholesale trading margins could also be adversely affected by losses due to trading activities. Other risks include weather conditions or changes in weather patterns (including severe weather that could result in damage to our assets), fuel and purchased power costs and the rate of economic growth or decline in our service areas. A decrease in revenues or an increase in expenses related to our electric operations may reduce the amount of funds available for our existing and future businesses, which could result in increased financing requirements, impair our ability to make expected distributions to shareholders or impair our ability to make scheduled payments on our debt obligations.
As of December 31, 2008 the electric utility had capitalized $11.6 million in costs related to the planned construction of a second electric generating unit at the electric utility’s Big Stone Plant site. If the project is abandoned for permitting or other reasons, a portion of these capitalized costs and others incurred in future periods may be subject to expense and may not be recoverable. Additionally, if the electric utility is unable to complete the construction of Big Stone II and commence operations, it may be forced to purchase power in order to meet customer needs. There is no guarantee that in such a case the electric utility would be able to obtain sufficient supplies of power at reasonable costs. If it is forced to pay higher than normal prices for power, the increase in costs could reduce our earnings if the electric utility is not able to recover the increased costs from its electric customers through the FCA.
Actions by the regulators of our electric operations could result in rate reductions, lower revenues and earnings or delays in recovering capital expenditures.
We are subject to federal and state legislation, government regulations and regulatory actions that may have a negative impact on our business and results of operations. The electric rates that we are allowed to charge for our electric services are one of the most important items influencing our financial position, results of operations and liquidity. The rates that we charge our electric customers are subject to review and determination by state public utility commissions in Minnesota, North Dakota and South Dakota. We are also regulated by the FERC. An adverse decision by one or more regulatory commissions concerning the level or method of determining electric utility rates, the authorized returns on equity, implementation of enforceable federal reliability standards or other regulatory matters, permitted business activities (such as ownership or operation of nonelectric businesses) or any prolonged delay in rendering a decision in a rate or other proceeding (including with respect to the recovery of capital expenditures in rates) could result in lower revenues and net income.
Future operating results of our electric segment will be impacted by the outcome of a rate case filed in North Dakota on November 3, 2008 requesting an overall increase in North Dakota retail rates of 5.14%. The filing included a request for an interim rate increase of 4.07%, which went into effect on January 1, 2009. Interim rates will remain in effect for all North Dakota customers until the NDPSC makes a final determination on the electric utility’s request, which is expected by August 1, 2009. If final rates are lower than interim rates, the electric utility will refund North Dakota customers the difference with interest.
We may not be able to respond effectively to deregulation initiatives in the electric industry, which could result in reduced revenues and earnings.
We may not be able to respond in a timely or effective manner to the changes in the electric industry that may occur as a result of regulatory initiatives to increase wholesale competition. These regulatory initiatives may include further deregulation of the electric utility industry in wholesale markets. Although we do not expect retail competition to come to the states of Minnesota, North Dakota and South Dakota in the foreseeable future, we expect competitive forces in the electric supply segment of the electric business to continue to increase, which could reduce our revenues and earnings.
Our electric generating facilities are subject to operational risks that could result in unscheduled plant outages, unanticipated operation and maintenance expenses and increased power purchase costs.
Operation of electric generating facilities involves risks which can adversely affect energy output and efficiency levels. Most of our generating capacity is coal-fired. We rely on a limited number of suppliers of coal, making us vulnerable to increased prices for fuel as existing contracts expire or in the event of unanticipated interruptions in fuel supply. We are a captive rail shipper of the BNSF Railway for shipments of coal to our Big Stone and Hoot Lake plants, making us vulnerable to increased prices for coal transportation from a sole supplier. Higher fuel prices result in higher electric rates for our retail customers through fuel clause adjustments and could make us less competitive in wholesale electric markets. Operational risks also include facility shutdowns due to breakdown or failure of equipment or processes, labor disputes, operator error and

catastrophic events such as fires, explosions, floods, intentional acts of destruction or other similar occurrences affecting our electric generating facilities. The loss of a major generating facility would require us to find other sources of supply, if available, and expose us to higher purchased power costs.
Changes to regulation of generating plant emissions, including but not limited to carbon dioxide (CO2) emissions, could affect our operating costs and the costs of supplying electricity to our customers.
Existing or new laws or regulations passed or issued by federal or state authorities addressing climate change or reductions of greenhouse gas emissions, such as mandated levels of renewable generation, mandatory reductions in CO2 emission levels, taxes on CO2 emissions or cap and trade regimes, that result in increases in electric service costs could negatively impact our net income, financial position and operating cash flows if such costs cannot be recovered through rates granted by ratemaking authorities in the states where the electric utility provides service or through increased market prices for electricity.
PLASTICS
Our plastics operations are highly dependent on a limited number of vendors for PVC resin and a limited supply of PVC resin. The loss of a key vendor, or any interruption or delay in the supply of PVC resin, could result in reduced sales or increased costs for our plastics business.
We rely on a limited number of vendors to supply the PVC resin used in our plastics business. Two vendors accounted for approximately 94% of our total purchases of PVC resin in 2008 and approximately 95% of our total purchases of PVC resin in 2007. In addition, the supply of PVC resin may be limited primarily due to manufacturing capacity and the limited availability of raw material components. A majority of U.S. resin production plants are located in the Gulf Coast region, which may increase the risk of a shortage of resin in the event of a hurricane or other natural disaster in that region. The loss of a key vendor or any interruption or delay in the availability or supply of PVC resin could disrupt our ability to deliver our plastic products, cause customers to cancel orders or require us to incur additional expenses to obtain PVC resin from alternative sources, if such sources are available.
We compete against a large number of other manufacturers of PVC pipe and manufacturers of alternative products. Customers may not distinguish our products from those of our competitors.
The plastic pipe industry is highly fragmented and competitive due to the large number of producers and the fungible nature of the product. We compete not only against other PVC pipe manufacturers, but also against ductile iron, steel, concrete and clay pipe manufacturers. Due to shipping costs, competition is usually regional instead of national in scope, and the principal areas of competition are a combination of price, service, warranty and product performance. Our inability to compete effectively in each of these areas and to distinguish our plastic pipe products from competing products may adversely affect the financial performance of our plastics business.
Reductions in PVC resin prices can negatively affect our plastics business.
The PVC pipe industry is highly sensitive to commodity raw material pricing volatility. Historically, when resin prices are rising or stable, margins and sales volume have been higher and when resin prices are falling, sales volumes and margins have been lower. Reductions in PVC resin prices could negatively affect PVC pipe prices, profit margins on PVC pipe sales and the value of PVC pipe held in inventory.
MANUFACTURING
Competition from foreign and domestic manufacturers, the price and availability of raw materials, fluctuations in foreign currency exchange rates and general economic conditions could affect the revenues and earnings of our manufacturing businesses.
Our manufacturing businesses are subject to intense risks associated with competition from foreign and domestic manufacturers, many of whom have broader product lines, greater distribution capabilities, greater capital resources, larger marketing, research and development staffs and facilities and other capabilities that may place downward pressure on margins and profitability. The companies in our manufacturing segment use a variety of raw materials in the products they manufacture, including steel, lumber, concrete, aluminum and resin. Costs for these items have increased significantly and may continue to increase. If our manufacturing businesses are not able to pass on cost increases to their customers, it could have a negative effect on profit margins in our manufacturing segment.
Each of our manufacturing companies has significant customers and concentrated sales to such customers. If our relationships with significant customers should change materially, it would be difficult to immediately and profitably replace lost sales. Fluctuations in foreign currency exchange rates could have a negative impact on the net income and competitive position of our wind tower manufacturing operations in Ft. Erie, Ontario because the plant pays its operating expenses in Canadian dollars.
HEALTH SERVICES
Changes in the rates or methods of third-party reimbursements for our diagnostic imaging services could result in reduced demand for those services or create downward pricing pressure, which would decrease our revenues and earnings.
Our health services businesses derive significant revenue from direct billings to customers and third-party payors such as Medicare, Medicaid, managed care and private health insurance companies for our diagnostic imaging services. Moreover, customers who use our diagnostic imaging services generally rely on reimbursement from third-party payors. Adverse changes in the rates or methods of third-party reimbursements could reduce the number of procedures for which we or our customers can obtain reimbursement or the amounts reimbursed to us or our customers.
Our health services businesses may be unable to continue to maintain agreements with Philips Medical from which we derive significant revenues from the sale and service of Philips Medical diagnostic imaging equipment.
Our health services business agreement with Philips Medical expires on December 31, 2013. This agreement can be terminated on 180 days written notice by either party for any reason. It also includes other compliance requirements. If this agreement is terminated under the existing termination provisions or we were not able to comply with the agreement, the financial results of our health services operations would be adversely affected.
Technological change in the diagnostic imaging industry could reduce the demand for diagnostic imaging services and require our health services operations to incur significant costs to upgrade its equipment.
Although we believe substantially all of our diagnostic imaging systems can be upgraded to maintain their state-of-the-art character, the development of new technologies or refinements of existing technologies might make our existing systems technologically or economically obsolete, or cause a reduction in the value of, or reduce the need for, our systems.
Actions by regulators of our health services operations could result in monetary penalties or restrictions in our health services operations.
Our health services operations are subject to federal and state regulations relating to licensure, conduct of operations, ownership of facilities, addition of facilities and services and payment of services. Our failure to comply with these regulations, including new regulations released October 30, 2008 by the Center for Medicare & Medical Services, or our inability to obtain and maintain necessary regulatory approvals, may result in adverse actions by regulators with respect to our health services operations, which may include civil and criminal penalties, damages, fines, injunctions, operating restrictions or suspension of operations. Any such action could adversely affect our financial results. Courts and regulatory authorities have not fully interpreted a significant number of these laws and regulations, and this uncertainty in interpretation increases the risk that we may be found to be in violation. Any action brought against us for violation of these laws or regulations, even if successfully defended, may result in significant legal expenses and divert management’s attention from the operation of our businesses.

FOOD INGREDIENT PROCESSING
Our company that processes dehydrated potato flakes, flour and granules, IPH, competes in a highly competitive market and is dependent on adequate sources of potatoes for processing.
The market for processed, dehydrated potato flakes, flour and granules is highly competitive. The profitability and success of our potato processing company is dependent on superior product quality, competitive product pricing, strong customer relationships, raw material costs, fuel prices and availability and customer demand for finished goods. In most product categories, our company competes with numerous manufacturers of varying sizes in the United States.
The principal raw material used by our potato processing company is washed process-grade potatoes from growers. These potatoes are unsuitable for use in other markets due to imperfections. They are not subject to the United States Department of Agriculture’s general requirements and expectations for size, shape or color. While our food ingredient processing company has processing capabilities in three geographically distinct growing regions, there can be no assurance it will be able to obtain raw materials due to poor growing conditions, a loss of key growers and other factors. A loss or shortage of raw materials or the necessity of paying much higher prices for raw materials or fuel could adversely affect the financial performance of this company. Fluctuations in foreign currency exchange rates could have a negative impact on our potato processing company’s net income and competitive position because approximately 25% of IPH sales in 2008 were outside the United States and the Canadian plant pays its operating expenses in Canadian dollars.
OTHER BUSINESS OPERATIONS
Our construction companies may be unable to properly bid and perform on projects.
The profitability and success of our construction companies require us to identify, estimate and timely bid on profitable projects. The quantity and quality of projects up for bids at any time is uncertain. Additionally, once a project is awarded, we must be able to perform within cost estimates that were set when the bid was submitted and accepted. A significant failure or an inability to properly bid or perform on projects could lead to adverse financial results for our construction companies.
QUANTITATIVE AND QUALITATIVE DISCLOSURES ABOUT MARKET RISK
At December 31, 2008 we had exposure to market risk associated with interest rates because we had $107.8 million in short-term debt outstanding subject to variable interest rates that are indexed to LIBOR plus 2.0% under the Varistar Credit Agreement and $27.1 million in short-term debt outstanding subject to variable interest rates that are indexed to LIBOR plus 0.5% under the Electric Utility Credit Agreement. At December 31, 2008 we had exposure to changes in foreign currency exchange rates. DMI has market risk related to changes in foreign currency exchange rates at its plant in Ft. Erie, Ontario because the plant pays its operating expenses in Canadian dollars. Outstanding trade accounts receivable of the Canadian operations of IPH are not at risk of valuation change due to changes in foreign currency exchange rates because the Canadian company transacts all sales in U.S. dollars. However, IPH does have market risk related to changes in foreign currency exchange rates because approximately 25% of IPH sales in 2008 were outside the United States and the Canadian operations of IPH pays its operating expenses in Canadian dollars. However, IPH’s Canadian subsidiary has locked in exchange rates for the exchange of U.S. dollars (USD) for Canadian dollars (CAD) for approximately 100% of its cash needs for the period January 1, 2009 through July 31, 2009 and approximately 50% of its cash needs for the period August 1, 2009 through October 31, 2009 by entering into forward foreign currency exchange contracts. On December 31, 2008 IPH’s Canadian subsidiary held contracts for the exchange of $6.8 million USD for $7.9 million CAD.
The majority of our consolidated long-term debt has fixed interest rates. The interest rate on variable rate long-term debt is reset on a periodic basis reflecting current market conditions. We manage our interest rate risk through the issuance of fixed-rate debt with varying maturities, through economic refunding of debt through optional refundings, limiting the amount of variable interest rate debt, and the utilization of short-term borrowings to allow flexibility in the timing and placement of long-term debt. As of December 31, 2008 we had $10.4 million of long-term debt subject to variable interest rates. Assuming no change in our financial structure, if variable interest rates were to average one percentage point higher or lower than the average variable rate on December 31, 2008, annualized interest expense and pre-tax earnings would change by approximately $104,000.
We have not used interest rate swaps to manage net exposure to interest rate changes related to our portfolio of borrowings. We maintain a ratio of fixed-rate debt to total debt within a certain range. It is our policy to enter into interest rate transactions and other financial instruments only to the extent considered necessary to meet our stated objectives. We do not enter into interest rate transactions for speculative or trading purposes.

The plastics companies are exposed to market risk related to changes in commodity prices for PVC resins, the raw material used to manufacture PVC pipe. The PVC pipe industry is highly sensitive to commodity raw material pricing volatility. Historically, when resin prices are rising or stable, margins and sales volume have been higher and when resin prices are falling, sales volumes and margins have been lower. Gross margins also decline when the supply of PVC pipe increases faster than demand. Due to the commodity nature of PVC resin and the dynamic supply and demand factors worldwide, it is very difficult to predict gross margin percentages or to assume that historical trends will continue.
The companies in our manufacturing segment are exposed to market risk related to changes in commodity prices for steel, lumber, aluminum, cement and resin. The price and availability of these raw materials could affect the revenues and earnings of our manufacturing segment.
The electric utility has market, price and credit risk associated with forward contracts for the purchase and sale of electricity. As of December 31, 2008 the electric utility had recognized, on a pretax basis, $123,000 in net unrealized losses on open forward contracts for the purchase and sale of electricity. Due to the nature of electricity and the physical aspects of the electricity transmission system, unanticipated events affecting the transmission grid can cause transmission constraints that result in unanticipated gains or losses in the process of settling transactions.
The market prices used to value the electric utility’s forward contracts for the purchases and sales of electricity are determined by survey of counterparties or brokers used by the electric utility’s power services’ personnel responsible for contract pricing, as well as prices gathered from daily settlement prices published by the Intercontinental Exchange. For certain contracts, prices at illiquid trading points are based on a basis spread between that trading point and more liquid trading hub prices. Prices are benchmarked to forward price curves and indices acquired from a third party price forecasting service. Of the forward energy sales contracts that are marked to market as of December 31, 2008, 100% are offset by forward energy purchase contracts in terms of volumes and delivery periods.
We have in place an energy risk management policy with a goal to manage, through the use of defined risk management practices, price risk and credit risk associated with wholesale power purchases and sales. With the advent of the MISO Day 2 market in April 2005, we made several changes to our energy risk management policy to recognize new trading opportunities created by this new market. Most of the changes were in new volumetric limits and loss limits to adequately manage the risks associated with these new opportunities. In addition, we implemented a Value at Risk (VaR) limit to further manage market price risk. Exposure to price risk on any open positions as of December 31, 2008 was not material.
The following tables show the effect of marking to market forward contracts for the purchase and sale of electricity on our consolidated balance sheet as of December 31, 2008 and the change in our consolidated balance sheet position from December 31, 2007 to December 31, 2008:
The $123,000 in recognized but unrealized net losses on the forward energy purchases and sales marked to market on December 31, 2008 is expected to be realized on physical settlement as scheduled in January and February of 2009.
(in thousands) December 31, 2008
Current Asset — Marked-to-Market Gain $ 405 Regulatory Asset — Deferred Marked-to-Market Loss 1,162
Total Assets 1,567
Current Liability — Marked-to-Market Loss (1,690)Regulatory Liability — Deferred Marked-to-Market Gain —
Total Liabilities (1,690)
Net Fair Value of Marked-to-Market Energy Contracts $ (123)
Year ended(in thousands) December 31, 2008
Fair Value at Beginning of Year $ 632 Amount Realized on Contracts Entered into in 2007 and Settled in 2008 (1,169)Changes in Fair Value of Contracts Entered into in 2007 537 Net Fair Value of Contracts Entered into in 2007 at Year End 2008 — Changes in Fair Value of Contracts Entered into in 2008 (123)Net Fair Value at End of Year $ (123)
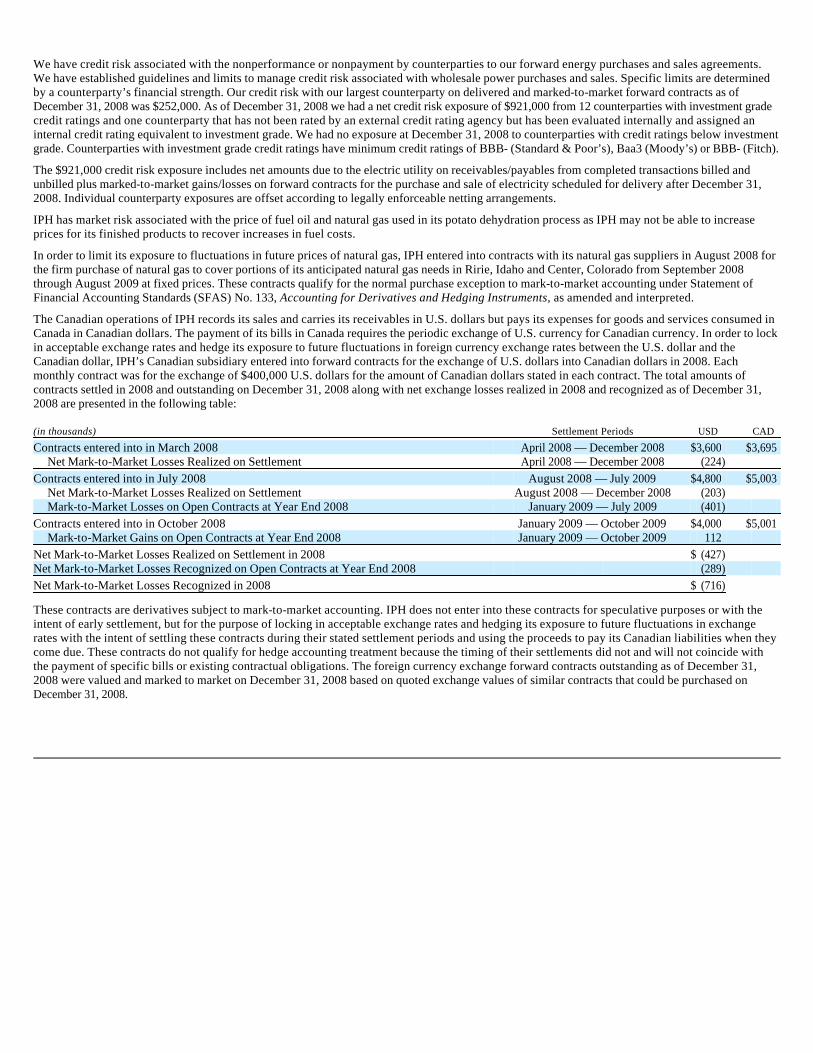
We have credit risk associated with the nonperformance or nonpayment by counterparties to our forward energy purchases and sales agreements. We have established guidelines and limits to manage credit risk associated with wholesale power purchases and sales. Specific limits are determined by a counterparty’s financial strength. Our credit risk with our largest counterparty on delivered and marked-to-market forward contracts as of December 31, 2008 was $252,000. As of December 31, 2008 we had a net credit risk exposure of $921,000 from 12 counterparties with investment grade credit ratings and one counterparty that has not been rated by an external credit rating agency but has been evaluated internally and assigned an internal credit rating equivalent to investment grade. We had no exposure at December 31, 2008 to counterparties with credit ratings below investment grade. Counterparties with investment grade credit ratings have minimum credit ratings of BBB- (Standard & Poor’s), Baa3 (Moody’s) or BBB- (Fitch).
The $921,000 credit risk exposure includes net amounts due to the electric utility on receivables/payables from completed transactions billed and unbilled plus marked-to-market gains/losses on forward contracts for the purchase and sale of electricity scheduled for delivery after December 31, 2008. Individual counterparty exposures are offset according to legally enforceable netting arrangements.
IPH has market risk associated with the price of fuel oil and natural gas used in its potato dehydration process as IPH may not be able to increase prices for its finished products to recover increases in fuel costs.
In order to limit its exposure to fluctuations in future prices of natural gas, IPH entered into contracts with its natural gas suppliers in August 2008 for the firm purchase of natural gas to cover portions of its anticipated natural gas needs in Ririe, Idaho and Center, Colorado from September 2008 through August 2009 at fixed prices. These contracts qualify for the normal purchase exception to mark-to-market accounting under Statement of Financial Accounting Standards (SFAS) No. 133, Accounting for Derivatives and Hedging Instruments, as amended and interpreted.
The Canadian operations of IPH records its sales and carries its receivables in U.S. dollars but pays its expenses for goods and services consumed in Canada in Canadian dollars. The payment of its bills in Canada requires the periodic exchange of U.S. currency for Canadian currency. In order to lock in acceptable exchange rates and hedge its exposure to future fluctuations in foreign currency exchange rates between the U.S. dollar and the Canadian dollar, IPH’s Canadian subsidiary entered into forward contracts for the exchange of U.S. dollars into Canadian dollars in 2008. Each monthly contract was for the exchange of $400,000 U.S. dollars for the amount of Canadian dollars stated in each contract. The total amounts of contracts settled in 2008 and outstanding on December 31, 2008 along with net exchange losses realized in 2008 and recognized as of December 31, 2008 are presented in the following table:
These contracts are derivatives subject to mark-to-market accounting. IPH does not enter into these contracts for speculative purposes or with the intent of early settlement, but for the purpose of locking in acceptable exchange rates and hedging its exposure to future fluctuations in exchange rates with the intent of settling these contracts during their stated settlement periods and using the proceeds to pay its Canadian liabilities when they come due. These contracts do not qualify for hedge accounting treatment because the timing of their settlements did not and will not coincide with the payment of specific bills or existing contractual obligations. The foreign currency exchange forward contracts outstanding as of December 31, 2008 were valued and marked to market on December 31, 2008 based on quoted exchange values of similar contracts that could be purchased on December 31, 2008.
(in thousands) Settlement Periods USD CAD
Contracts entered into in March 2008 April 2008 — December 2008 $3,600 $3,695 Net Mark-to-Market Losses Realized on Settlement April 2008 — December 2008 (224)
Contracts entered into in July 2008 August 2008 — July 2009 $4,800 $5,003 Net Mark-to-Market Losses Realized on Settlement August 2008 — December 2008 (203) Mark-to-Market Losses on Open Contracts at Year End 2008 January 2009 — July 2009 (401)
Contracts entered into in October 2008 January 2009 — October 2009 $4,000 $5,001 Mark-to-Market Gains on Open Contracts at Year End 2008 January 2009 — October 2009 112
Net Mark-to-Market Losses Realized on Settlement in 2008 $ (427) Net Mark-to-Market Losses Recognized on Open Contracts at Year End 2008 (289) Net Mark-to-Market Losses Recognized in 2008 $ (716)

CRITICAL ACCOUNTING POLICIES INVOLVING SIGNIFICANT ESTIMATES
Our significant accounting policies are described in note 1 to consolidated financial statements. The discussion and analysis of the financial statements and results of operations are based on our consolidated financial statements, which have been prepared in accordance with accounting principles generally accepted in the United States of America. The preparation of these consolidated financial statements requires management to make estimates and judgments that affect the reported amounts of assets, liabilities, revenues and expenses, and related disclosure of contingent assets and liabilities.
We use estimates based on the best information available in recording transactions and balances resulting from business operations. Estimates are used for such items as depreciable lives, asset impairment evaluations, tax provisions, collectability of trade accounts receivable, self-insurance programs, valuation of forward energy contracts, unbilled electric revenues, service contract maintenance costs, percentage-of-completion and actuarially determined benefits costs and liabilities. As better information becomes available or actual amounts are known, estimates are revised. Operating results can be affected by revised estimates. Actual results may differ from these estimates under different assumptions or conditions. Management has discussed the application of these critical accounting policies and the development of these estimates with the Audit Committee of the Board of Directors. The following critical accounting policies affect the more significant judgments and estimates used in the preparation of our consolidated financial statements.
PENSION AND OTHER POSTRETIREMENT BENEFITS OBLIGATIONS AND COSTS
Pension and postretirement benefit liabilities and expenses for our electric utility and corporate employees are determined by actuaries using assumptions about the discount rate, expected return on plan assets, rate of compensation increase and healthcare cost-trend rates. Further discussion of our pension and postretirement benefit plans and related assumptions is included in note 12 to consolidated financial statements.
These benefits, for any individual employee, can be earned and related expenses can be recognized and a liability accrued over periods of up to 40 or more years. These benefits can be paid out for up to 40 or more years after an employee retires. Estimates of liabilities and expenses related to these benefits are among our most critical accounting estimates. Although deferral and amortization of fluctuations in actuarially determined benefit obligations and expenses are provided for when actual results on a year-to-year basis deviate from long-range assumptions, compensation increases and healthcare cost increases or a reduction in the discount rate applied from one year to the next can significantly increase our benefit expenses in the year of the change. Also, a reduction in the expected rate of return on pension plan assets in our funded pension plan or realized rates of return on plan assets that are well below assumed rates of return could result in significant increases in recognized pension benefit expenses in the year of the change or for many years thereafter because actuarial losses can be amortized over the average remaining service lives of active employees.
The pension benefit cost for 2009 for our noncontributory funded pension plan is expected to be $3.4 million compared to $2.9 million in 2008. The estimated discount rate used to determine annual benefit cost accruals will be 6.70% in 2009; the discount rate used in 2008 was 6.25%. In selecting the discount rate, we consider the yields of fixed income debt securities, which have ratings of “Aa” published by recognized rating agencies, along with bond matching models specific to our plans as a basis to determine the rate.
Subsequent increases or decreases in actual rates of return on plan assets over assumed rates or increases or decreases in the discount rate or rate of increase in future compensation levels could significantly change projected costs. For 2008, all other factors being held constant: a 0.25 increase in the discount rate would have decreased our 2008 pension benefit cost by $350,000; a 0.25 decrease in the discount rate would have increased our 2008 pension benefit cost by $610,000; a 0.25 increase (or decrease) in the assumed rate of increase in future compensation levels would have increased (or decreased) our 2008 pension benefit cost by $500,000; a 0.25 increase (or decrease) in the expected long-term rate of return on plan assets would have decreased (or increased) our 2008 pension benefit cost by $410,000.
Increases or decreases in the discount rate or in retiree healthcare cost inflation rates could significantly change our projected postretirement healthcare benefit costs. A 0.25 increase in the discount rate would have decreased our 2008 postretirement medical benefit costs by $60,000. A 0.25 decrease in the discount rate would have increased our 2008 postretirement medical benefit costs by $160,000. See note 12 to consolidated financial statements for the cost impact of a change in medical cost inflation rates.
We believe the estimates made for our pension and other postretirement benefits are reasonable based on the information that is known at the point in time the estimates are made. These estimates and assumptions are subject to a number of variables and are subject to change.

REVENUE RECOGNITION
Our construction companies and two of our manufacturing companies record operating revenues on a percentage-of-completion basis for fixed-price construction contracts. The method used to determine the progress of completion is based on the ratio of labor costs incurred to total estimated labor costs at our wind tower manufacturer, square footage completed to total bid square footage for certain floating dock projects and costs incurred to total estimated costs on all other construction projects. The duration of the majority of these contracts is less than a year. Revenues recognized on jobs in progress as of December 31, 2008 were $425 million. Any expected losses on jobs in progress at year-end 2008 have been recognized. We believe the accounting estimate related to the percentage-of-completion accounting on uncompleted contracts is critical to the extent that any underestimate of total expected costs on fixed-price construction contracts could result in reduced profit margins being recognized on these contracts at the time of completion.
FORWARD ENERGY CONTRACTS CLASSIFIED AS DERIVATIVES
Our electric utility’s forward contracts for the purchase and sale of electricity are derivatives subject to mark-to-market accounting under generally accepted accounting principles. The market prices used to value the electric utility’s forward contracts for the purchases and sales of electricity are determined by survey of counterparties or brokers used by the electric utility’s power services’ personnel responsible for contract pricing, as well as prices gathered from daily settlement prices published by the Intercontinental Exchange. For certain contracts, prices at illiquid trading points are based on a basis spread between that trading point and more liquid trading hub prices. Prices are benchmarked to forward price curves and indices acquired from a third party price forecasting service, and, as such, are estimates. Of the forward energy sales contracts that are marked to market as of December 31, 2008, 100% are offset by forward energy purchase contracts in terms of volumes and delivery periods. All of the forward energy contracts for the purchase and sale of electricity marked to market as of December 31, 2008 are scheduled for settlement prior to March 1, 2009.
ALLOWANCE FOR DOUBTFUL ACCOUNTS
Our operating companies encounter risks associated with sales and the collection of the associated accounts receivable. As such, they record provisions for accounts receivable that are considered to be uncollectible. In order to calculate the appropriate monthly provision, the operating companies primarily utilize historical rates of accounts receivables written off as a percentage of total revenue. This historical rate is applied to the current revenues on a monthly basis. The historical rate is updated periodically based on events that may change the rate, such as a significant increase or decrease in collection performance and timing of payments as well as the calculated total exposure in relation to the allowance. Periodically, operating companies compare identified credit risks with allowances that have been established using historical experience and adjust allowances accordingly. In circumstances where an operating company is aware of a specific customer’s inability to meet financial obligations, the operating company records a specific allowance for bad debts to reduce the account receivable to the amount it reasonably believes will be collected.
We believe the accounting estimates related to the allowance for doubtful accounts is critical because the underlying assumptions used for the allowance can change from period to period and could potentially cause a material impact to the income statement and working capital.
During 2008, $2.0 million of bad debt expense (0.16% of total 2008 revenue of $1.3 billion) was recorded and the allowance for doubtful accounts was $2.7 million (2.0% of trade accounts receivable) as of December 31, 2008. General economic conditions and specific geographic concerns are major factors that may affect the adequacy of the allowance and may result in a change in the annual bad debt expense. An increase or decrease in our consolidated allowance for doubtful accounts based on one percentage point of outstanding trade receivables at December 31, 2008 would result in a $1.4 million increase or decrease in bad debt expense.
Although an estimated allowance for doubtful accounts on our operating companies’ accounts receivable is provided for, the allowance for doubtful accounts on the electric segment’s wholesale electric sales is insignificant in proportion to annual revenues from these sales. The electric segment has not experienced a bad debt related to wholesale electric sales largely due to stringent risk management criteria related to these sales. Nonpayment on a single wholesale electric sale could result in a significant bad debt expense.

DEPRECIATION EXPENSE AND DEPRECIABLE LIVES
The provisions for depreciation of electric utility property for financial reporting purposes are made on the straight-line method based on the estimated service lives (5 to 65 years) of the properties. Such provisions as a percent of the average balance of depreciable electric utility property were 2.81% in 2008, 2.78% in 2007 and 2.82% in 2006. Depreciation rates on electric utility property are subject to annual regulatory review and approval, and depreciation expense is recovered through rates set by ratemaking authorities. Although the useful lives of electric utility properties are estimated, the recovery of their cost is dependent on the ratemaking process. Deregulation of the electric industry could result in changes to the estimated useful lives of electric utility property that could impact depreciation expense.
Property and equipment of our nonelectric operations are carried at historical cost or at the then-current replacement cost if acquired in a business combination accounted for under the purchase method of accounting and are depreciated on a straight-line basis over useful lives (3 to 40 years) of the related assets. We believe the lives and methods of determining depreciation are reasonable, however, changes in economic conditions affecting the industries in which our nonelectric companies operate or innovations in technology could result in a reduction of the estimated useful lives of our nonelectric operating companies’ property, plant and equipment or in an impairment write-down of the carrying value of these properties.
TAXATION
We are required to make judgments regarding the potential tax effects of various financial transactions and our ongoing operations to estimate our obligations to taxing authorities. These tax obligations include income, real estate and use taxes. These judgments could result in the recognition of a liability for potential adverse outcomes regarding uncertain tax positions that we have taken. While we believe our liability for uncertain tax positions as of December 31, 2008 reflects the most likely probable expected outcome of these tax matters in accordance with FASB Interpretation No. 48, Accounting for Uncertainty in Income Taxes — an interpretation of FASB Statement No. 109, and SFAS No. 109, Accounting for Income Taxes, the ultimate outcome of such matters could result in additional adjustments to our consolidated financial statements. However, we do not believe such adjustments would be material.
Deferred income taxes are provided for revenue and expenses which are recognized in different periods for income tax and financial reporting purposes. We assess our deferred tax assets for recoverability based on both historical and anticipated earnings levels. We have not recorded a valuation allowance related to the probability of recovery of our deferred tax assets as we believe reductions in tax payments related to these assets will be fully realized in the future.
ASSET IMPAIRMENT
We are required to test for asset impairment relating to property and equipment whenever events or changes in circumstances indicate that the carrying value of an asset might not be recoverable. We apply SFAS No. 144, Accounting for the Impairment or Disposal of Long-Lived Assets, in order to determine whether or not an asset is impaired. This standard requires an impairment analysis when indicators of impairment are present. If such indicators are present, the standard requires that if the sum of the future expected cash flows from a company’s asset, undiscounted and without interest charges, is less than the carrying value, an asset impairment must be recognized in the financial statements. The amount of the impairment is the difference between the fair value of the asset and the carrying value of the asset.
We believe the accounting estimates related to an asset impairment are critical because they are highly susceptible to change from period to period reflecting changing business cycles and require management to make assumptions about future cash flows over future years and the impact of recognizing an impairment could have a significant effect on operations. Management’s assumptions about future cash flows require significant judgment because actual operating levels have fluctuated in the past and are expected to continue to do so in the future.
As of December 31, 2008 an assessment of the carrying values of our long-lived assets and other intangibles indicated these assets were not impaired.

GOODWILL IMPAIRMENT
Goodwill is required to be evaluated annually for impairment, according to SFAS No. 142, Goodwill and Other Intangible Assets. The standard requires a two-step process be performed to analyze whether or not goodwill has been impaired. Step one is to test for potential impairment and requires that the fair value of the reporting unit be compared to its book value including goodwill. If the fair value is higher than the book value, no impairment is recognized. If the fair value is lower than the book value, a second step must be performed. The second step is to measure the amount of impairment loss, if any, and requires that a hypothetical purchase price allocation be done to determine the implied fair value of goodwill. This fair value is then compared to the carrying value of goodwill. If the implied fair value is lower than the carrying value, an impairment must be recorded.
We believe accounting estimates related to goodwill impairment are critical because the underlying assumptions used for the discounted cash flow can change from period to period and could potentially cause a material impact to the income statement. Management’s assumptions about inflation rates and other internal and external economic conditions, such as earnings growth rate, require significant judgment based on fluctuating rates and expected revenues. Additionally, SFAS No. 142 requires goodwill be analyzed for impairment on an annual basis using the assumptions that apply at the time the analysis is updated.
We evaluate goodwill for impairment on an annual basis and as conditions warrant. As of December 31, 2008 an assessment of the carrying values of our goodwill indicated no impairment.
PURCHASE ACCOUNTING
Through December 31, 2008, under SFAS No. 141, Business Combinations, we have accounted for our acquisitions under the purchase method of accounting and, accordingly, the acquired assets and liabilities assumed are recorded at their respective fair values. The excess of purchase price over the fair value of the assets acquired and liabilities assumed is recorded as goodwill. The recorded values of assets and liabilities are based on third party estimates and valuations when available. The remaining values are based on management’s judgments and estimates, and, accordingly, our consolidated financial position or results of operations may be affected by changes in estimates and judgments.
Acquired assets and liabilities assumed that are subject to critical estimates include property, plant and equipment and intangible assets.
The fair value of property, plant and equipment is based on valuations performed by qualified internal personnel and/or outside appraisers. Fair values assigned to plant and equipment are based on several factors including the age and condition of the equipment, maintenance records of the equipment and auction values for equipment with similar characteristics at the time of purchase.
Intangible assets are identified and valued using the guidelines of SFAS No. 141. The fair value of intangible assets is based on estimates including royalty rates, customer attrition rates and estimated cash flows.
While the allocation of purchase price is subject to a high degree of judgment and uncertainty, we do not expect the estimates to vary significantly once an acquisition is complete. We believe our estimates have been reasonable in the past as there have been no significant valuation adjustments to the final allocation of purchase price.
Beginning in 2009, we will account for acquisitions under the requirements of SFAS No. 141 (revised 2007), Business Combinations, issued in December 2007. SFAS No. 141(R) replaces the term “purchase method of accounting” with “acquisition method of accounting” and requires an acquirer to recognize the assets acquired, the liabilities assumed and any noncontrolling interest in the acquiree at the acquisition date, measured at their fair values as of that date, with limited exceptions. This guidance will replace SFAS No. 141’s cost-allocation process, which requires the cost of an acquisition to be allocated to the individual assets acquired and liabilities assumed based on their estimated fair values.

KEY ACCOUNTING PRONOUNCEMENTS
SFAS No. 157, Fair Value Measurements, was issued by the FASB in September 2006. SFAS No. 157 defines fair value, establishes a framework for measuring fair value in generally accepted accounting principles and expands disclosures about fair value measurements. SFAS No. 157 is effective for fiscal years beginning after November 15, 2007. SFAS No. 157 applies under other accounting pronouncements that require or permit fair value measurements where fair value is the relevant measurement attribute. Accordingly, this statement does not require any new fair value measurements. The adoption of SFAS No. 157 on January 1, 2008 resulted in additional footnote disclosures related to the use of fair value measurements in the areas of investments, derivatives, asset retirement obligations, goodwill and asset impairment evaluations, financial instruments and acquisitions, but did not have a significant impact on our consolidated balance sheet, income statement or statement of cash flows.
SFAS No. 159, The Fair Value Option for Financial Assets and Financial Liabilities — Including an Amendment of FASB Statement No. 115, was issued by the FASB in February 2007. SFAS No. 159 provides companies with an option to measure, at specified election dates, many financial instruments and certain other items at fair value that are not currently measured at fair value. A company that adopts SFAS No. 159 will report unrealized gains and losses in earnings at each subsequent reporting date on items for which the fair value option has been elected. This statement also establishes presentation and disclosure requirements to facilitate comparisons between entities that choose different measurement attributes for similar types of assets and liabilities. SFAS No. 159 is effective for fiscal years beginning after November 15, 2007. We adopted SFAS No. 159 on January 1, 2008. The adoption of this pronouncement had no effect on our consolidated financial statements because we had not opted, nor do we currently plan to opt, to apply fair value accounting to any financial instruments or other items that we are not currently required to account for at fair value.
SFAS No. 141(R), Business Combinations, was issued by the FASB in December 2007. SFAS No. 141(R) replaces SFAS No. 141, Business Combinations, and will apply prospectively to business combinations for which the acquisition date is on or after the beginning of the first annual reporting period beginning on or after December 15, 2008. SFAS No. 141(R) applies to all transactions or other events in which an entity (the acquirer) obtains control of one or more businesses (the acquiree). In addition to replacing the term “purchase method of accounting” with “acquisition method of accounting,” SFAS No. 141(R) requires an acquirer to recognize the assets acquired, the liabilities assumed and any noncontrolling interest in the acquiree at the acquisition date, measured at their fair values as of that date, with limited exceptions. This guidance will replace SFAS No. 141’s cost-allocation process, which requires the cost of an acquisition to be allocated to the individual assets acquired and liabilities assumed based on their estimated fair values. SFAS No. 141’s guidance results in not recognizing some assets and liabilities at the acquisition date, and it also results in measuring some assets and liabilities at amounts other than their fair values at the acquisition date. For example, SFAS No. 141 requires the acquirer to include the costs incurred to effect an acquisition (acquisition-related costs) in the cost of the acquisition that is allocated to the assets acquired and the liabilities assumed. SFAS No. 141(R) requires those costs to be expensed as incurred. In addition, under SFAS No. 141, restructuring costs that the acquirer expects but is not obligated to incur are recognized as if they were a liability assumed at the acquisition date. SFAS No. 141(R) requires the acquirer to recognize those costs separately from the business combination.
SFAS No. 161, Disclosures about Derivative Instruments and Hedging Activities—an amendment of FASB Statement No. 133, was issued by the FASB in March 2008. SFAS No. 161 requires enhanced disclosures about an entity’s derivative and hedging activities to improve the transparency of financial reporting. SFAS No. 161 is effective for financial statements issued for fiscal years and interim periods beginning after November 15, 2008. Adoption of SFAS No. 161 will result in additional footnote disclosures related to our use of derivative instruments but those additional disclosures will not be extensive because the derivative instruments currently held by us are not designated as hedging instruments under SFAS No. 161.
Management’s Report Regarding Internal Control Over Financial Reporting
Management is responsible for the preparation and integrity of the consolidated financial statements and representations in this annual report. The consolidated financial statements of Otter Tail Corporation (the Company) have been prepared in conformity with generally accepted accounting principles applied on a consistent basis and include some amounts that are based on informed judgments and best estimates and assumptions of management.
In order to assure the consolidated financial statements are prepared in conformance with generally accepted accounting principles, management is responsible for establishing and maintaining adequate internal control over financial reporting, as such term is defined in Exchange Act Rule 13a-15(f). These internal controls are designed only to provide reasonable assurance, on a cost-effective basis, that transactions are carried out in accordance with management’s authorizations and assets are safeguarded against loss from unauthorized use or disposition.
Management has completed its assessment of the effectiveness of the Company’s internal control over financial reporting as of December 31, 2008. In making this assessment, management used the criteria set forth by the Committee of Sponsoring Organizations of the Treadway Commission in Internal Control — Integrated Framework to conduct the required assessment of the effectiveness of the Company’s internal control over financial reporting.
There have not been any changes in the Company’s internal control over financial reporting (as such term is defined in Exchange Act Rule 13a-15(f)) during the fiscal year to which this report relates that have materially affected, or are reasonably likely to materially affect, the Company’s internal control over financial reporting.
Based on this assessment, we believe that, as of December 31, 2008 the Company’s internal control over financial reporting is effective based on those criteria.
The Company’s independent registered public accounting firm, Deloitte & Touche LLP, audited the Company’s consolidated financial statements included in this annual report and issued an attestation report on the Company’s internal control over financial reporting.
February 25, 2009
/s/ John Erickson John Erickson President and Chief Executive Officer /s/ Kevin Moug Kevin Moug Chief Financial Officer

REPORT OF INDEPENDENT REGISTERED PUBLIC ACCOUNTING FIRM
TO THE SHAREHOLDERS OF OTTER TAIL CORPORATION
We have audited the accompanying consolidated balance sheets and statements of capitalization of Otter Tail Corporation and its subsidiaries (the “Company”) as of December 31, 2008 and 2007, and the related consolidated statements of income, common shareholders’ equity and comprehensive income, and cash flows for each of the three years in the period ended December 31, 2008. We also have audited the Company’s internal control over financial reporting as of December 31, 2008 based on the criteria established in Internal Control — Integrated Framework issued by the Committee of Sponsoring Organizations of the Treadway Commission. The Company’s management is responsible for these financial statements, for maintaining effective internal control over financial reporting, and for its assessment of the effectiveness of internal control over financial reporting, included in the accompanying Management’s Report Regarding Internal Control Over Financial Reporting. Our responsibility is to express an opinion on these financial statements and an opinion on the Company’s internal control over financial reporting based on our audits.
We conducted our audits in accordance with the standards of the Public Company Accounting Oversight Board (United States). Those standards require that we plan and perform the audit to obtain reasonable assurance about whether the financial statements are free of material misstatement and whether effective internal control over financial reporting was maintained in all material respects. Our audits of the financial statements included examining, on a test basis, evidence supporting the amounts and disclosures in the financial statements, assessing the accounting principles used and significant estimates made by management, and evaluating the overall financial statement presentation. Our audit of internal control over financial reporting included obtaining an understanding of internal control over financial reporting, assessing the risk that a material weakness exists, and testing and evaluating the design and operating effectiveness of internal control based on the assessed risk. Our audits also included performing such other procedures as we considered necessary in the circumstances. We believe that our audits provide a reasonable basis for our opinions.
A company’s internal control over financial reporting is a process designed by, or under the supervision of, the company’s principal executive and principal financial officers, or persons performing similar functions, and effected by the company’s board of directors, management, and other personnel to provide reasonable assurance regarding the reliability of financial reporting and the preparation of financial statements for external purposes in accordance with generally accepted accounting principles. A company’s internal control over financial reporting includes those policies and procedures that (1) pertain to the maintenance of records that, in reasonable detail, accurately and fairly reflect the transactions and dispositions of the assets of the company; (2) provide reasonable assurance that transactions are recorded as necessary to permit preparation of financial statements in accordance with generally accepted accounting principles, and that receipts and expenditures of the company are being made only in accordance with authorizations of management and directors of the company; and (3) provide reasonable assurance regarding prevention or timely detection of unauthorized acquisition, use, or disposition of the company’s assets that could have a material effect on the financial statements.
Because of the inherent limitations of internal control over financial reporting, including the possibility of collusion or improper management override of controls, material misstatements due to error or fraud may not be prevented or detected on a timely basis. Also, projections of any evaluation of the effectiveness of the internal control over financial reporting to future periods are subject to the risk that the controls may become inadequate because of changes in conditions, or that the degree of compliance with the policies or procedures may deteriorate.
In our opinion, the consolidated financial statements referred to above present fairly, in all material respects, the financial position of the Company and subsidiaries as of December 31, 2008 and 2007, and the results of their operations and their cash flows for each of the three years in the period ended December 31, 2008, in conformity with accounting principles generally accepted in the United States of America. Also, in our opinion, the Company maintained, in all material respects, effective internal control over financial reporting as of December 31, 2008, based on the criteria established in Internal Control — Integrated Framework issued by the Committee of Sponsoring Organizations of the Treadway Commission.
DELOITTE & TOUCHE LLP
Minneapolis, Minnesota February 25, 2009

Otter Tail Corporation
See accompanying notes to consolidated financial statements.
Consolidated Statements of Income For the Years Ended December 31 (in thousands, except per-share amounts) 2008 2007 2006
Operating Revenues
Electric $ 339,726 $ 323,158 $ 305,703 Nonelectric 971,471 915,729 799,251
Total Operating Revenues 1,311,197 1,238,887 1,104,954 Operating Expenses
Production Fuel — Electric 71,930 60,482 58,729 Purchased Power — Electric System Use 56,329 74,690 58,281 Electric Operation and Maintenance Expenses 115,300 107,041 103,548 Cost of Goods Sold — Nonelectric (excludes depreciation; included below) 775,292 712,547 611,737 Other Nonelectric Expenses 143,050 121,110 115,290 Plant Closure Costs 2,295 — — Depreciation and Amortization 65,060 52,830 49,983 Property Taxes — Electric 8,949 9,413 9,589
Total Operating Expenses 1,238,205 1,138,113 1,007,157 Operating Income 72,992 100,774 97,797 Other Income and Deductions 4,128 2,012 (440)Interest Charges 26,958 20,857 19,501 Income from Continuing Operations Before Income Taxes 50,162 81,929 77,856 Income Taxes — Continuing Operations 15,037 27,968 27,106 Net Income from Continuing Operations 35,125 53,961 50,750 Discontinued Operations
Income from Discontinued Operations Net of Taxes of $28 in 2006 — — 26 Gain on Disposition of Discontinued Operations Net of Taxes of $224 in 2006 — — 336
Net Income from Discontinued Operations — — 362 Net Income 35,125 53,961 51,112 Preferred Dividend Requirements 736 736 736 Earnings Available for Common Shares $ 34,389 $ 53,225 $ 50,376
Average Number of Common Shares Outstanding—Basic 31,409 29,681 29,394 Average Number of Common Shares Outstanding—Diluted 31,673 29,970 29,664 Basic Earnings Per Share:
Continuing Operations (net of preferred dividend requirements) $ 1.09 $ 1.79 $ 1.70 Discontinued Operations — — 0.01
$ 1.09 $ 1.79 $ 1.71 Diluted Earnings Per Share:
Continuing Operations (net of preferred dividend requirements) $ 1.09 $ 1.78 $ 1.69 Discontinued Operations — — 0.01
$ 1.09 $ 1.78 $ 1.70 Dividends Per Common Share $ 1.19 $ 1.17 $ 1.15
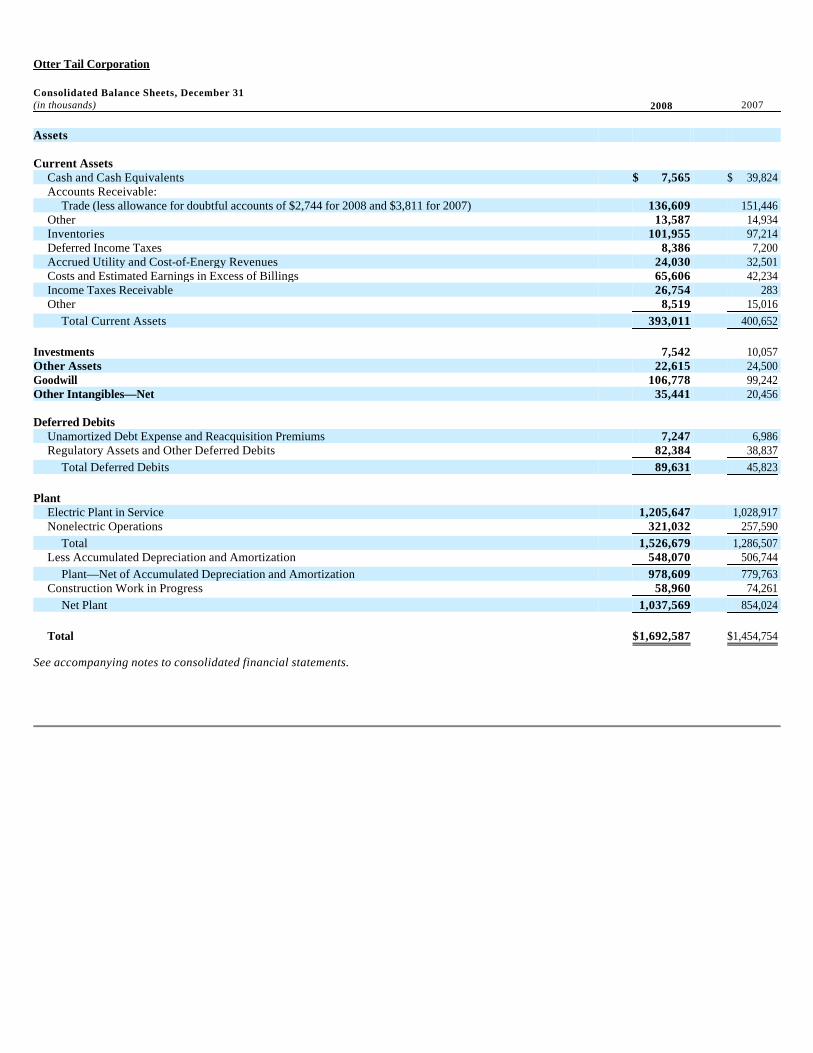
Otter Tail Corporation
See accompanying notes to consolidated financial statements.
Consolidated Balance Sheets, December 31 (in thousands) 2008 2007
Assets Current Assets
Cash and Cash Equivalents $ 7,565 $ 39,824 Accounts Receivable:
Trade (less allowance for doubtful accounts of $2,744 for 2008 and $3,811 for 2007) 136,609 151,446 Other 13,587 14,934 Inventories 101,955 97,214 Deferred Income Taxes 8,386 7,200 Accrued Utility and Cost-of-Energy Revenues 24,030 32,501 Costs and Estimated Earnings in Excess of Billings 65,606 42,234 Income Taxes Receivable 26,754 283 Other 8,519 15,016
Total Current Assets 393,011 400,652 Investments 7,542 10,057 Other Assets 22,615 24,500 Goodwill 106,778 99,242 Other Intangibles—Net 35,441 20,456 Deferred Debits
Unamortized Debt Expense and Reacquisition Premiums 7,247 6,986 Regulatory Assets and Other Deferred Debits 82,384 38,837
Total Deferred Debits 89,631 45,823 Plant
Electric Plant in Service 1,205,647 1,028,917 Nonelectric Operations 321,032 257,590
Total 1,526,679 1,286,507 Less Accumulated Depreciation and Amortization 548,070 506,744
Plant—Net of Accumulated Depreciation and Amortization 978,609 779,763 Construction Work in Progress 58,960 74,261
Net Plant 1,037,569 854,024
Total $1,692,587 $1,454,754

Otter Tail Corporation
See accompanying notes to consolidated financial statements.
Consolidated Balance Sheets, December 31 (in thousands, except share data) 2008 2007
Liabilities and Equity Current Liabilities
Short-Term Debt $ 134,914 $ 95,000 Current Maturities of Long-Term Debt 3,747 3,004 Accounts Payable 113,422 141,390 Accrued Salaries and Wages 29,688 29,283 Accrued Taxes 10,939 11,409 Other Accrued Liabilities 12,034 13,873
Total Current Liabilities 304,744 293,959 Pensions Benefit Liability 80,912 39,429 Other Postretirement Benefits Liability 32,621 30,488 Other Noncurrent Liabilities 19,391 23,228 Commitments (note 9) Deferred Credits
Deferred Income Taxes 123,086 105,813 Deferred Tax Credits 34,288 16,761 Regulatory Liabilities 64,684 62,705 Other 397 275
Total Deferred Credits 222,455 185,554 Capitalization (page 44)
Long-Term Debt, Net of Current Maturities 339,726 342,694
Class B Stock Options of Subsidiary 1,220 1,255
Cumulative Preferred Shares 15,500 15,500
Common Shares, Par Value $5 Per Share—Authorized, 50,000,000 Shares; Outstanding, 2008—35,384,620 Shares; 2007—29,849,789 Shares 176,923 149,249
Premium on Common Shares 241,731 108,885 Retained Earnings 260,364 263,332 Accumulated Other Comprehensive (Loss) Income (3,000) 1,181
Total Common Equity 676,018 522,647
Total Capitalization 1,032,464 882,096
Total $1,692,587 $1,454,754
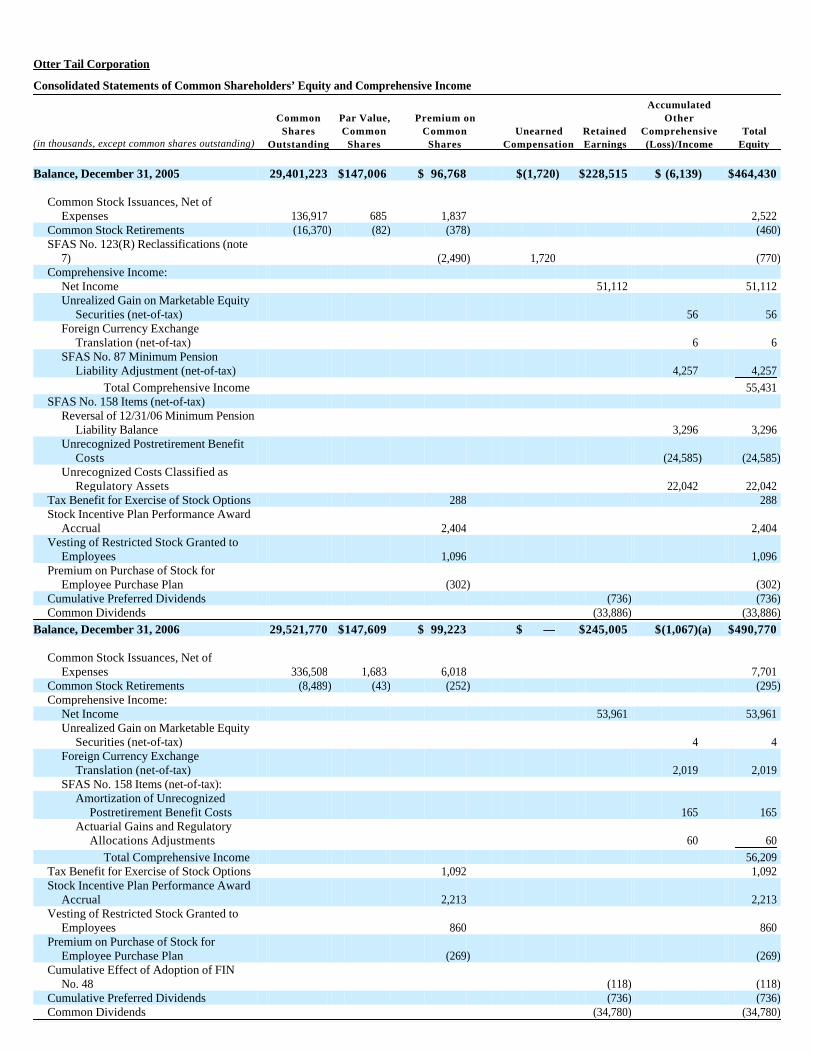
Otter Tail Corporation
Consolidated Statements of Common Shareholders’ Equity and Comprehensive Income
Accumulated Common Par Value, Premium on Other Shares Common Common Unearned Retained Comprehensive Total(in thousands, except common shares outstanding) Outstanding Shares Shares Compensation Earnings (Loss)/Income Equity
Balance, December 31, 2005 29,401,223 $147,006 $ 96,768 $(1,720) $228,515 $ (6,139) $464,430
Common Stock Issuances, Net of Expenses 136,917 685 1,837 2,522
Common Stock Retirements (16,370) (82) (378) (460)SFAS No. 123(R) Reclassifications (note
7) (2,490) 1,720 (770)Comprehensive Income:
Net Income 51,112 51,112 Unrealized Gain on Marketable Equity
Securities (net-of-tax) 56 56 Foreign Currency Exchange
Translation (net-of-tax) 6 6 SFAS No. 87 Minimum Pension
Liability Adjustment (net-of-tax) 4,257 4,257 Total Comprehensive Income 55,431
SFAS No. 158 Items (net-of-tax) Reversal of 12/31/06 Minimum Pension
Liability Balance 3,296 3,296 Unrecognized Postretirement Benefit
Costs (24,585) (24,585)Unrecognized Costs Classified as
Regulatory Assets 22,042 22,042 Tax Benefit for Exercise of Stock Options 288 288 Stock Incentive Plan Performance Award
Accrual 2,404 2,404 Vesting of Restricted Stock Granted to
Employees 1,096 1,096 Premium on Purchase of Stock for
Employee Purchase Plan (302) (302)Cumulative Preferred Dividends (736) (736)Common Dividends (33,886) (33,886)
Balance, December 31, 2006 29,521,770 $147,609 $ 99,223 $ — $245,005 $(1,067) (a) $490,770
Common Stock Issuances, Net of Expenses 336,508 1,683 6,018 7,701
Common Stock Retirements (8,489) (43) (252) (295)Comprehensive Income:
Net Income 53,961 53,961 Unrealized Gain on Marketable Equity
Securities (net-of-tax) 4 4 Foreign Currency Exchange
Translation (net-of-tax) 2,019 2,019 SFAS No. 158 Items (net-of-tax):
Amortization of Unrecognized Postretirement Benefit Costs 165 165
Actuarial Gains and Regulatory Allocations Adjustments 60 60
Total Comprehensive Income 56,209 Tax Benefit for Exercise of Stock Options 1,092 1,092 Stock Incentive Plan Performance Award
Accrual 2,213 2,213 Vesting of Restricted Stock Granted to
Employees 860 860 Premium on Purchase of Stock for
Employee Purchase Plan (269) (269)Cumulative Effect of Adoption of FIN
No. 48 (118) (118)Cumulative Preferred Dividends (736) (736)Common Dividends (34,780) (34,780)

See accompanying notes to consolidated financial statements.
Balance, December 31, 2007 29,849,789 $149,249 $108,885 $ — $263,332 $ 1,181 (a) $522,647
Common Stock Issuances, Net of Expenses 5,557,531 27,788 128,818 156,606
Common Stock Retirements (22,700) (114) (642) (756)Comprehensive Income:
Net Income 35,125 35,125 Unrealized Loss on Marketable Equity
Securities (net-of-tax) (40) (40)Foreign Currency Exchange
Translation (net-of-tax) (2,784) (2,784)SFAS No. 158 Items (net-of-tax):
Amortization of Unrecognized Postretirement Benefit Costs 153 153
Actuarial Gains and Regulatory Allocations Adjustments (1,510) (1,510)
Total Comprehensive Income 30,944 Tax Benefit for Exercise of Stock Options 1,777 1,777 Stock Incentive Plan Performance Award
Accrual 3,093 3,093 Vesting of Restricted Stock Granted to
Employees 165 165 Premium on Purchase of Stock for
Employee Purchase Plan (365) (365)Cumulative Preferred Dividends (736) (736)Common Dividends (37,357) (37,357)
Balance, December 31, 2008 35,384,620 $176,923 $241,731 $ — $260,364 $(3,000) (a) $676,018
(a) Accumulated Other Comprehensive Income (Loss) on December 31 is comprised of the following (in thousands) Before Tax Tax Effect Net-of-Tax
Unamortized Actuarial Losses and Transition Obligation Related to Pension and Postretirement Benefits $(4,238) $ 1,695 $(2,543)
2006 Foreign Currency Exchange Translation 2,430 (972) 1,458 Unrealized Gain on Marketable Equity Securities 30 (12) 18 Net Accumulated Other Comprehensive Loss $(1,778) $ 711 $(1,067)
Unamortized Actuarial Losses and Transition Obligation Related to Pension and Postretirement Benefits $(3,863) $ 1,545 $(2,318)
2007 Foreign Currency Exchange Translation 5,795 (2,318) 3,477 Unrealized Gain on Marketable Equity Securities 36 (14) 22 Net Accumulated Other Comprehensive Income $ 1,968 $ (787) $ 1,181
Unamortized Actuarial Losses and Transition Obligation Related to Pension and Postretirement Benefits $(6,125) $ 2,450 $(3,675)
2008 Foreign Currency Exchange Translation 1,155 (462) 693 Unrealized Gain on Marketable Equity Securities (30) 12 (18) Net Accumulated Other Comprehensive Loss $(5,000) $ 2,000 $(3,000)

Otter Tail Corporation
Consolidated Statements of Cash Flows—For the Years Ended December 31
See accompanying notes to consolidated financial statements.
(in thousands) 2008 2007 2006
Cash Flows from Operating Activities
Net Income $ 35,125 $ 53,961 $ 51,112 Adjustments to Reconcile Net Income to Net Cash Provided by Operating Activities:
Net Gain on Sale of Discontinued Operations — — (336)Income from Discontinued Operations — — (26)Depreciation and Amortization 65,060 52,830 49,983 Deferred Tax Credits (1,692) (1,169) (1,146)Deferred Income Taxes 40,665 4,366 (1,258)Change in Deferred Debits and Other Assets (41,851) 6,505 (38,499)Discretionary Contribution to Pension Plan (2,000) (4,000) (4,000)Change in Noncurrent Liabilities and Deferred Credits 40,918 481 45,340 Allowance for Equity (Other) Funds Used During Construction (2,786) — 2,529 Change in Derivatives Net of Regulatory Deferral 1,044 (800) 3,083 Stock Compensation Expense 3,850 2,986 2,404 Other—Net 298 (1,837) 418
Cash Provided by (Used for) Current Assets and Current Liabilities: Change in Receivables 19,522 (18,903) (15,713)Change in Inventories (743) 8,407 (14,345)Change in Other Current Assets (12,362) (14,333) (17,409)Change in Payables and Other Current Liabilities (8,572) (2,556) 23,022 Change in Interest Payable and Income Taxes Receivable/Payable (25,155) (1,126) (5,952)
Net Cash Provided by Continuing Operations 111,321 84,812 79,207 Net Cash Provided by Discontinued Operations — — 1,039
Net Cash Provided by Operating Activities 111,321 84,812 80,246 Cash Flows from Investing Activities
Capital Expenditures (265,888) (161,985) (69,448)Proceeds from Disposal of Noncurrent Assets 8,174 12,486 5,233 Acquisitions—Net of Cash Acquired (41,674) (6,750) — Net Decrease (Increase) in Other Investments 4 (7,745) (3,326)
Net Cash Used in Investing Activities — Continuing Operations (299,384) (163,994) (67,541)Net Proceeds from Sale of Discontinued Operations — — 1,960
Net Cash Used in Investing Activities (299,384) (163,994) (65,581) Cash Flows from Financing Activities
Change in Checks Written in Excess of Cash — — (11)Net Short-Term Borrowings 39,914 56,100 22,900 Proceeds from Issuance of Common Stock 162,978 7,733 2,444 Common Stock Issuance Expenses (6,418) — — Payments for Retirement of Common Stock and Class B Stock of Subsidiary (91) (305) (463)Proceeds from Issuance of Long-Term Debt 1,240 205,129 149 Short-Term and Long-Term Debt Issuance Expenses (1,252) (1,762) (458)Payments for Retirement of Long-Term Debt (3,639) (118,171) (3,287)Dividends Paid (38,093) (35,516) (34,621)
Net Cash Provided by (Used in) Financing Activities 154,639 113,208 (13,347)Effect of Foreign Exchange Rate Fluctuations on Cash 1,165 (993) 43 Net Change in Cash and Cash Equivalents (32,259) 33,033 1,361 Cash and Cash Equivalents at Beginning of Year — Continuing Operations 39,824 6,791 5,430 Cash and Cash Equivalents at End of Year — Continuing Operations $ 7,565 $ 39,824 $ 6,791
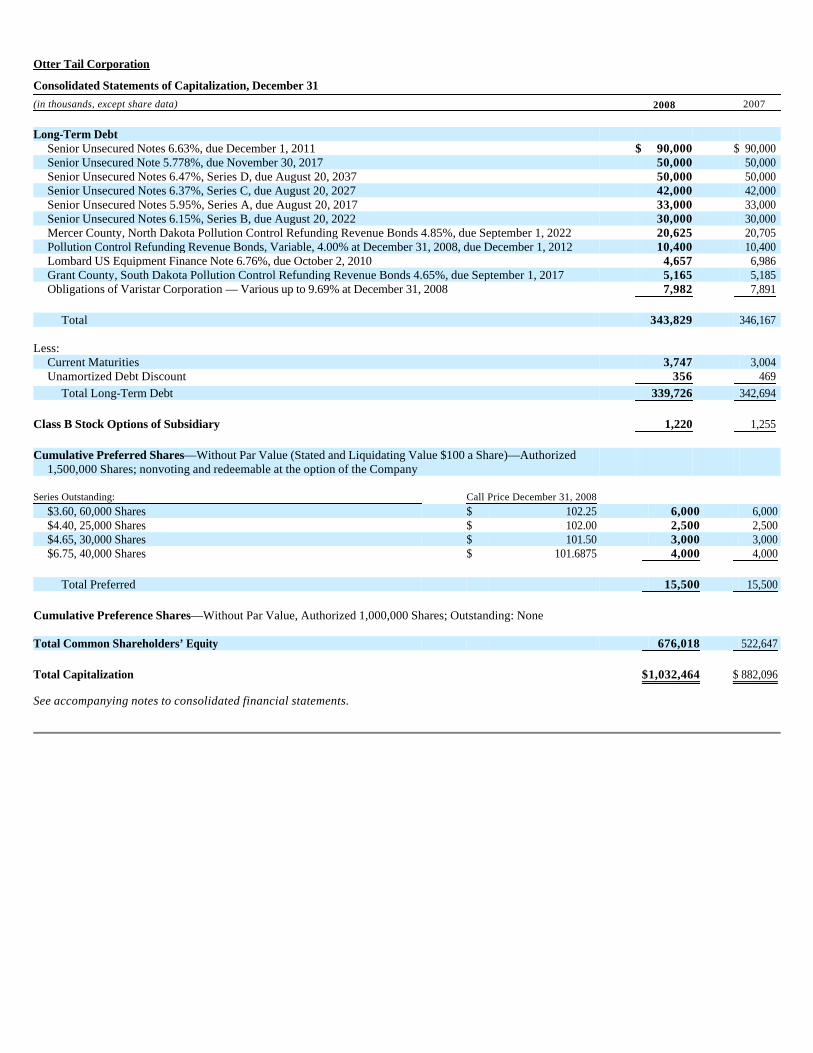
Otter Tail Corporation
Consolidated Statements of Capitalization, December 31
See accompanying notes to consolidated financial statements.
(in thousands, except share data) 2008 2007
Long-Term Debt
Senior Unsecured Notes 6.63%, due December 1, 2011 $ 90,000 $ 90,000 Senior Unsecured Note 5.778%, due November 30, 2017 50,000 50,000 Senior Unsecured Notes 6.47%, Series D, due August 20, 2037 50,000 50,000 Senior Unsecured Notes 6.37%, Series C, due August 20, 2027 42,000 42,000 Senior Unsecured Notes 5.95%, Series A, due August 20, 2017 33,000 33,000 Senior Unsecured Notes 6.15%, Series B, due August 20, 2022 30,000 30,000 Mercer County, North Dakota Pollution Control Refunding Revenue Bonds 4.85%, due September 1, 2022 20,625 20,705 Pollution Control Refunding Revenue Bonds, Variable, 4.00% at December 31, 2008, due December 1, 2012 10,400 10,400 Lombard US Equipment Finance Note 6.76%, due October 2, 2010 4,657 6,986 Grant County, South Dakota Pollution Control Refunding Revenue Bonds 4.65%, due September 1, 2017 5,165 5,185 Obligations of Varistar Corporation — Various up to 9.69% at December 31, 2008 7,982 7,891
Total 343,829 346,167
Less:
Current Maturities 3,747 3,004 Unamortized Debt Discount 356 469
Total Long-Term Debt 339,726 342,694 Class B Stock Options of Subsidiary 1,220 1,255 Cumulative Preferred Shares—Without Par Value (Stated and Liquidating Value $100 a Share)—Authorized
1,500,000 Shares; nonvoting and redeemable at the option of the Company Series Outstanding: Call Price December 31, 2008
$3.60, 60,000 Shares $ 102.25 6,000 6,000 $4.40, 25,000 Shares $ 102.00 2,500 2,500 $4.65, 30,000 Shares $ 101.50 3,000 3,000 $6.75, 40,000 Shares $ 101.6875 4,000 4,000
Total Preferred 15,500 15,500
Cumulative Preference Shares—Without Par Value, Authorized 1,000,000 Shares; Outstanding: None Total Common Shareholders’ Equity 676,018 522,647 Total Capitalization $1,032,464 $ 882,096
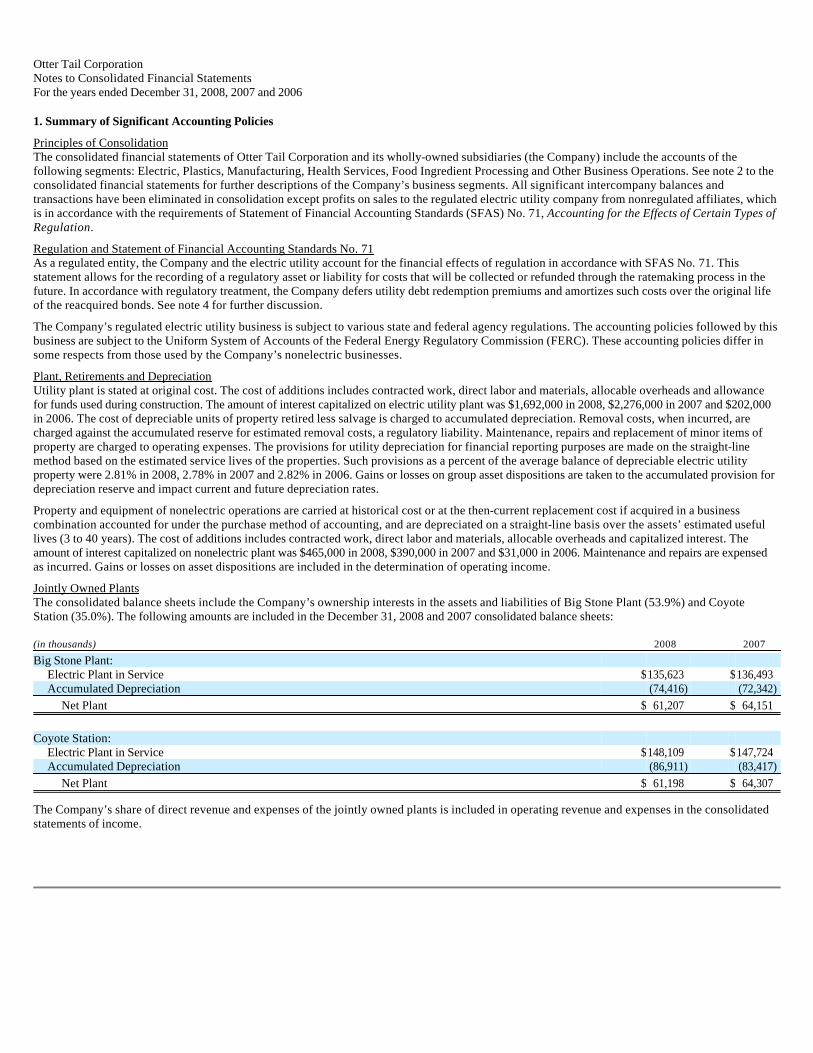
Otter Tail Corporation Notes to Consolidated Financial Statements For the years ended December 31, 2008, 2007 and 2006
1. Summary of Significant Accounting Policies
Principles of Consolidation The consolidated financial statements of Otter Tail Corporation and its wholly-owned subsidiaries (the Company) include the accounts of the following segments: Electric, Plastics, Manufacturing, Health Services, Food Ingredient Processing and Other Business Operations. See note 2 to the consolidated financial statements for further descriptions of the Company’s business segments. All significant intercompany balances and transactions have been eliminated in consolidation except profits on sales to the regulated electric utility company from nonregulated affiliates, which is in accordance with the requirements of Statement of Financial Accounting Standards (SFAS) No. 71, Accounting for the Effects of Certain Types of Regulation.
Regulation and Statement of Financial Accounting Standards No. 71 As a regulated entity, the Company and the electric utility account for the financial effects of regulation in accordance with SFAS No. 71. This statement allows for the recording of a regulatory asset or liability for costs that will be collected or refunded through the ratemaking process in the future. In accordance with regulatory treatment, the Company defers utility debt redemption premiums and amortizes such costs over the original life of the reacquired bonds. See note 4 for further discussion.
The Company’s regulated electric utility business is subject to various state and federal agency regulations. The accounting policies followed by this business are subject to the Uniform System of Accounts of the Federal Energy Regulatory Commission (FERC). These accounting policies differ in some respects from those used by the Company’s nonelectric businesses.
Plant, Retirements and Depreciation Utility plant is stated at original cost. The cost of additions includes contracted work, direct labor and materials, allocable overheads and allowance for funds used during construction. The amount of interest capitalized on electric utility plant was $1,692,000 in 2008, $2,276,000 in 2007 and $202,000 in 2006. The cost of depreciable units of property retired less salvage is charged to accumulated depreciation. Removal costs, when incurred, are charged against the accumulated reserve for estimated removal costs, a regulatory liability. Maintenance, repairs and replacement of minor items of property are charged to operating expenses. The provisions for utility depreciation for financial reporting purposes are made on the straight-line method based on the estimated service lives of the properties. Such provisions as a percent of the average balance of depreciable electric utility property were 2.81% in 2008, 2.78% in 2007 and 2.82% in 2006. Gains or losses on group asset dispositions are taken to the accumulated provision for depreciation reserve and impact current and future depreciation rates.
Property and equipment of nonelectric operations are carried at historical cost or at the then-current replacement cost if acquired in a business combination accounted for under the purchase method of accounting, and are depreciated on a straight-line basis over the assets’ estimated useful lives (3 to 40 years). The cost of additions includes contracted work, direct labor and materials, allocable overheads and capitalized interest. The amount of interest capitalized on nonelectric plant was $465,000 in 2008, $390,000 in 2007 and $31,000 in 2006. Maintenance and repairs are expensed as incurred. Gains or losses on asset dispositions are included in the determination of operating income.
Jointly Owned Plants The consolidated balance sheets include the Company’s ownership interests in the assets and liabilities of Big Stone Plant (53.9%) and Coyote Station (35.0%). The following amounts are included in the December 31, 2008 and 2007 consolidated balance sheets:
The Company’s share of direct revenue and expenses of the jointly owned plants is included in operating revenue and expenses in the consolidated statements of income.
(in thousands) 2008 2007
Big Stone Plant: Electric Plant in Service $135,623 $136,493 Accumulated Depreciation (74,416) (72,342)
Net Plant $ 61,207 $ 64,151
Coyote Station:
Electric Plant in Service $148,109 $147,724 Accumulated Depreciation (86,911) (83,417)
Net Plant $ 61,198 $ 64,307

Recoverability of Long-Lived Assets The Company reviews its long-lived assets whenever events or changes in circumstances indicate the carrying amount of the assets may not be recoverable. The Company determines potential impairment by comparing the carrying value of the assets with net cash flows expected to be provided by operating activities of the business or related assets. If the sum of the expected future net cash flows is less than the carrying values, the Company would determine whether an impairment loss should be recognized. An impairment loss would be quantified by comparing the amount by which the carrying value exceeds the fair value of the asset, where fair value is based on the discounted cash flows expected to be generated by the asset.
Income Taxes Comprehensive interperiod income tax allocation is used for substantially all book and tax temporary differences. Deferred income taxes arise for all temporary differences between the book and tax basis of assets and liabilities. Deferred taxes are recorded using the tax rates scheduled by tax law to be in effect in the periods when the temporary differences reverse. The Company amortizes investment tax credits over the estimated lives of related property. The Company adopted Financial Accounting Standards Board (FASB) Interpretation (FIN) No. 48, Accounting for Uncertainty in Income Taxes — an interpretation of FASB Statement No. 109, on January 1, 2007 and has recognized, in its consolidated financial statements, the tax effects of all tax positions that are “more-likely-than-not” to be sustained on audit based solely on the technical merits of those positions as of December 31, 2008. The term “more-likely-than-not” means a likelihood of more than 50%. The Company classifies interest and penalties on tax uncertainties as components of the provision for income taxes. See note 15 to the consolidated financial statements regarding the Company’s accounting for uncertain tax positions.
Revenue Recognition Due to the diverse business operations of the Company, revenue recognition depends on the product produced and sold or service performed. The Company recognizes revenue when the earnings process is complete, evidenced by an agreement with the customer, there has been delivery and acceptance, and the price is fixed or determinable. In cases where significant obligations remain after delivery, revenue recognition is deferred until such obligations are fulfilled. Provisions for sales returns and warranty costs are recorded at the time of the sale based on historical information and current trends. In the case of derivative instruments, such as the electric utility’s forward energy contracts, marked-to-market and realized gains and losses are recognized on a net basis in revenue in accordance with SFAS No. 133, Accounting for Derivative Instruments and Hedging Activities, as amended and interpreted. Gains and losses on forward energy contracts subject to regulatory treatment, if any, are deferred and recognized on a net basis in revenue in the period realized.
For the Company’s operating companies recognizing revenue on certain products when shipped, those operating companies have no further obligation to provide services related to such product. The shipping terms used in these instances are FOB shipping point.
Customer electricity use is metered and bills are rendered monthly. Revenue is accrued for electricity consumed but not yet billed. Rate schedules applicable to substantially all customers include a fuel clause adjustment (FCA), under which the rates are adjusted to reflect changes in average cost of fuels and purchased power, and a surcharge for recovery of conservation-related expenses. Revenue is accrued for fuel and purchased power costs incurred in excess of amounts recovered in base rates but not yet billed through the FCA and for renewable resource incurred costs and investment returns approved for recovery through riders.
Revenues on wholesale electricity sales from Company-owned generating units are recognized when energy is delivered.
The Company’s unrealized gains and losses on forward energy contracts that do not meet the definition of capacity contracts are marked to market and reflected on a net basis in electric revenue on the Company’s consolidated statement of income. Under SFAS No. 133 as amended and interpreted, the Company’s forward energy contracts that do not meet the definition of a capacity contract and are subject to unplanned netting do not qualify for the normal purchase and sales exception from mark-to-market accounting. The Company is required to mark to market these forward energy contracts and recognize changes in the fair value of these contracts as components of income over the life of the contracts. See note 5 for further discussion.
Plastics operating revenues are recorded when the product is shipped.
Manufacturing operating revenues are recorded when products are shipped and on a percentage-of-completion basis for construction type contracts.
Health Services operating revenues on major equipment and installation contracts are recorded when the equipment is delivered or when installation is completed and accepted. Amounts received in advance under customer service contracts are deferred and recognized on a straight-line basis over the contract period. Revenues generated in the imaging operations are recorded on a fee-per-scan basis when the scan is performed.
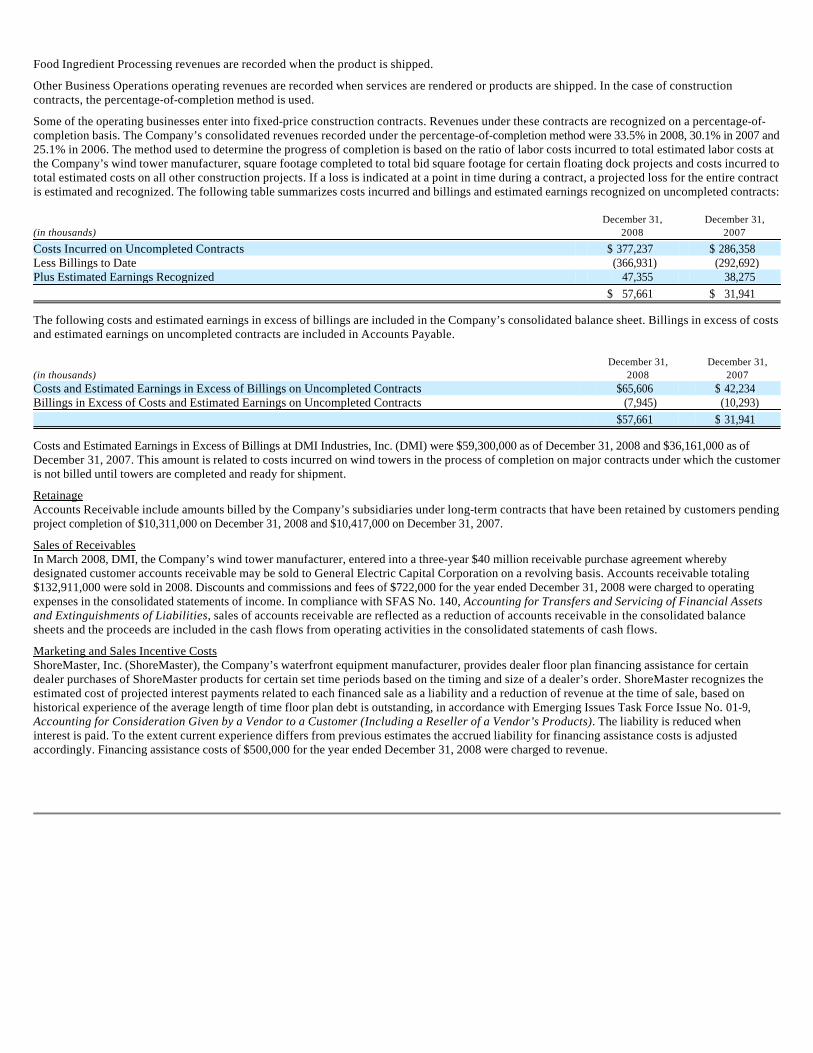
Food Ingredient Processing revenues are recorded when the product is shipped.
Other Business Operations operating revenues are recorded when services are rendered or products are shipped. In the case of construction contracts, the percentage-of-completion method is used.
Some of the operating businesses enter into fixed-price construction contracts. Revenues under these contracts are recognized on a percentage-of-completion basis. The Company’s consolidated revenues recorded under the percentage-of-completion method were 33.5% in 2008, 30.1% in 2007 and 25.1% in 2006. The method used to determine the progress of completion is based on the ratio of labor costs incurred to total estimated labor costs at the Company’s wind tower manufacturer, square footage completed to total bid square footage for certain floating dock projects and costs incurred to total estimated costs on all other construction projects. If a loss is indicated at a point in time during a contract, a projected loss for the entire contract is estimated and recognized. The following table summarizes costs incurred and billings and estimated earnings recognized on uncompleted contracts:
The following costs and estimated earnings in excess of billings are included in the Company’s consolidated balance sheet. Billings in excess of costs and estimated earnings on uncompleted contracts are included in Accounts Payable.
Costs and Estimated Earnings in Excess of Billings at DMI Industries, Inc. (DMI) were $59,300,000 as of December 31, 2008 and $36,161,000 as of December 31, 2007. This amount is related to costs incurred on wind towers in the process of completion on major contracts under which the customer is not billed until towers are completed and ready for shipment.
Retainage Accounts Receivable include amounts billed by the Company’s subsidiaries under long-term contracts that have been retained by customers pending project completion of $10,311,000 on December 31, 2008 and $10,417,000 on December 31, 2007.
Sales of Receivables In March 2008, DMI, the Company’s wind tower manufacturer, entered into a three-year $40 million receivable purchase agreement whereby designated customer accounts receivable may be sold to General Electric Capital Corporation on a revolving basis. Accounts receivable totaling $132,911,000 were sold in 2008. Discounts and commissions and fees of $722,000 for the year ended December 31, 2008 were charged to operating expenses in the consolidated statements of income. In compliance with SFAS No. 140, Accounting for Transfers and Servicing of Financial Assets and Extinguishments of Liabilities, sales of accounts receivable are reflected as a reduction of accounts receivable in the consolidated balance sheets and the proceeds are included in the cash flows from operating activities in the consolidated statements of cash flows.
Marketing and Sales Incentive Costs ShoreMaster, Inc. (ShoreMaster), the Company’s waterfront equipment manufacturer, provides dealer floor plan financing assistance for certain dealer purchases of ShoreMaster products for certain set time periods based on the timing and size of a dealer’s order. ShoreMaster recognizes the estimated cost of projected interest payments related to each financed sale as a liability and a reduction of revenue at the time of sale, based on historical experience of the average length of time floor plan debt is outstanding, in accordance with Emerging Issues Task Force Issue No. 01-9, Accounting for Consideration Given by a Vendor to a Customer (Including a Reseller of a Vendor’s Products). The liability is reduced when interest is paid. To the extent current experience differs from previous estimates the accrued liability for financing assistance costs is adjusted accordingly. Financing assistance costs of $500,000 for the year ended December 31, 2008 were charged to revenue.
December 31, December 31,(in thousands) 2008 2007
Costs Incurred on Uncompleted Contracts $ 377,237 $ 286,358 Less Billings to Date (366,931) (292,692)Plus Estimated Earnings Recognized 47,355 38,275 $ 57,661 $ 31,941
December 31, December 31,(in thousands) 2008 2007Costs and Estimated Earnings in Excess of Billings on Uncompleted Contracts $65,606 $ 42,234 Billings in Excess of Costs and Estimated Earnings on Uncompleted Contracts (7,945) (10,293) $57,661 $ 31,941

Foreign Currency Translation The functional currency for the operations of the Canadian subsidiary of Idaho Pacific Holdings, Inc. (IPH) is the Canadian dollar (CAD). This subsidiary realizes foreign currency transaction gains or losses on settlement of receivables related to its sales, which are mostly in U.S. dollars (USD), and on exchanging U.S. currency for Canadian currency for its Canadian operations. This subsidiary recorded foreign currency transaction losses of $60,000 USD in 2008 as a result of the decrease in the value of the Canadian dollar relative to the U.S. dollar in 2008, and foreign currency transaction losses of $656,000 USD in 2007 as a result of the increase in the value of the Canadian dollar relative to the U.S. dollar in 2007. Transaction gains and losses in 2006 were not significant due to the relative stability of the currencies in 2006. The translation of CAD to USD is performed for balance sheet accounts using exchange rates in effect at the balance sheet dates, except for the common equity accounts which are at historical rates, and for revenue and expense accounts using a weighted average exchange during the year. Gains or losses resulting from the translation are included in Accumulated Other Comprehensive Income (Loss) in the equity section of the Company’s consolidated balance sheet.
The functional currency for the Canadian subsidiary of DMI is the U.S. dollar. There are no foreign currency translation gains or losses related to this entity. However, this subsidiary may realize foreign currency transaction gains or losses on settlement of liabilities related to goods or services purchased in CAD. Foreign currency transaction gains related to balance sheet adjustments of CAD liabilities to USD equivalents and realized gains on settlement of those liabilities were $399,000 USD in 2008 as a result of the decrease in the value of the Canadian dollar relative to the U.S. dollar in 2008. Foreign currency transaction losses related to balance sheet adjustments of CAD liabilities to USD equivalents and realized losses on settlement of those liabilities were $102,000 USD in 2007 as a result of the increase in the value of the Canadian dollar relative to the U.S. dollar in 2007.
Shipping and Handling Costs The Company includes revenues received for shipping and handling in operating revenues. Expenses paid for shipping and handling are recorded as part of cost of goods sold.
Use of Estimates The Company uses estimates based on the best information available in recording transactions and balances resulting from business operations. Estimates are used for such items as depreciable lives, asset impairment evaluations, tax provisions, collectability of trade accounts receivable, self-insurance programs, unbilled electric revenues, valuations of forward energy contracts, service contract maintenance costs, percentage-of-completion and actuarially determined benefits costs and liabilities. As better information becomes available (or actual amounts are known), the recorded estimates are revised. Consequently, operating results can be affected by revisions to prior accounting estimates.
Cash Equivalents The Company considers all highly liquid debt instruments purchased with maturity of 90 days or less to be cash equivalents.
Supplemental Disclosures of Cash Flow Information
Investments The following table provides a breakdown of the Company’s investments at December 31, 2008 and 2007:
(in thousands) 2008 2007 2006
Increases (Decreases) in Accounts Payable and Other Liabilities Related to Capital Expenditures $(22,729) $23,514 $ 1,401
Noncash Investing and Financing Transactions: Capital Leases $ 2,084 — —
Cash Paid During the Year from Continuing Operations for: Interest (net of amount capitalized) $ 25,032 $18,155 $18,456 Income Taxes $ 1,356 $25,906 $35,061
Cash Paid During the Year from Discontinued Operations for: Interest $ — $ — $ 91 Income Taxes $ — $ — $ 423
December 31, December 31,(in thousands) 2008 2007
Cost Method: Economic Development Loan Pools $ 528 $ 655 Other 1,057 1,303
Equity Method: Affordable Housing and Other Partnerships 1,441 1,851
Marketable Securities Classified as Available-for-Sale 4,516 6,248 Total Investments $7,542 $10,057

The Company has investments in eleven limited partnerships that invest in tax-credit-qualifying affordable-housing projects that provided tax credits of $55,000 in 2008, $285,000 in 2007 and $839,000 in 2006. The Company owns a majority interest in eight of the eleven limited partnerships with a total investment of $1,426,000. FIN No. 46, Consolidation of Variable Interest Entities, requires full consolidation of the majority-owned partnerships. However, the Company includes these entities on its consolidated financial statements on a declining balance basis due to immateriality and uncertainty regarding residual values. Consolidating these entities would have represented less than 0.4% of total assets, 0.1% of total revenues and (0.5%) of operating income for the Company as of, and for the year ended, December 31, 2008 and would have an insignificant impact on the Company’s 2008 consolidated net income.
The Company’s marketable securities classified as available-for-sale are held for insurance purposes and are reflected at their market values on December 31, 2008. See further discussion below and under note 13.
Fair Value Measurements Effective January 1, 2008, the Company adopted SFAS No. 157, Fair Value Measurements, for recurring fair value measurements. SFAS No. 157 provides a single definition of fair value and requires enhanced disclosures about assets and liabilities measured at fair value. SFAS No. 157 establishes a hierarchal framework for disclosing the observability of the inputs utilized in measuring assets and liabilities at fair value. The three levels defined by the SFAS No. 157 hierarchy and examples of each level are as follows:
Level 1 — Quoted prices are available in active markets for identical assets or liabilities as of the reported date. The types of assets and liabilities included in Level 1 are highly liquid and actively traded instruments with quoted prices, such as equities listed by the New York Stock Exchange and commodity derivative contracts listed on the New York Mercantile Exchange.
Level 2 — Pricing inputs are other than quoted prices in active markets, but are either directly or indirectly observable as of the reported date. The types of assets and liabilities included in Level 2 are typically either comparable to actively traded securities or contracts, such as treasury securities with pricing interpolated from recent trades of similar securities, or priced with models using highly observable inputs, such as commodity options priced using observable forward prices and volatilities.
Level 3 — Significant inputs to pricing have little or no observability as of the reporting date. The types of assets and liabilities included in Level 3 are those with inputs requiring significant management judgment or estimation, such as the complex and subjective models and forecasts used to determine the fair value of financial transmission rights.
The following table presents, for each of these hierarchy levels, the Company’s assets and liabilities that are measured at fair value on a recurring basis as of December 31, 2008:
(in thousands) Level 1 Level 2 Level 3 Total
Assets: Investments for Nonqualified Retirement Savings Retirement Plan:
Money Market and Mutual Funds and Cash $ 890 $ — $ 890 Cash Surrender Value of Life Insurance Policies 8,014 8,014
Cash Surrender Value of Keyman Life Insurance Policies — Net of Policy Loans 10,244 10,244
Forward Energy Contracts 405 405 Investments of Captive Insurance Company:
Corporate Debt Securities 3,569 3,569 U.S. Government Debt Securities 947 947
Total Assets $5,406 $18,663 $24,069
Liabilities: Forward Energy Contracts $ — $ 1,690 $ — $ 1,690 Forward Foreign Currency Exchange Contracts 289 289 Asset Retirement Obligations 3,298 3,298
Total Liabilities $ 289 $ 1,690 $ 3,298 $ 5,277
Net Assets (Liabilities) $5,117 $16,973 $(3,298) $18,792
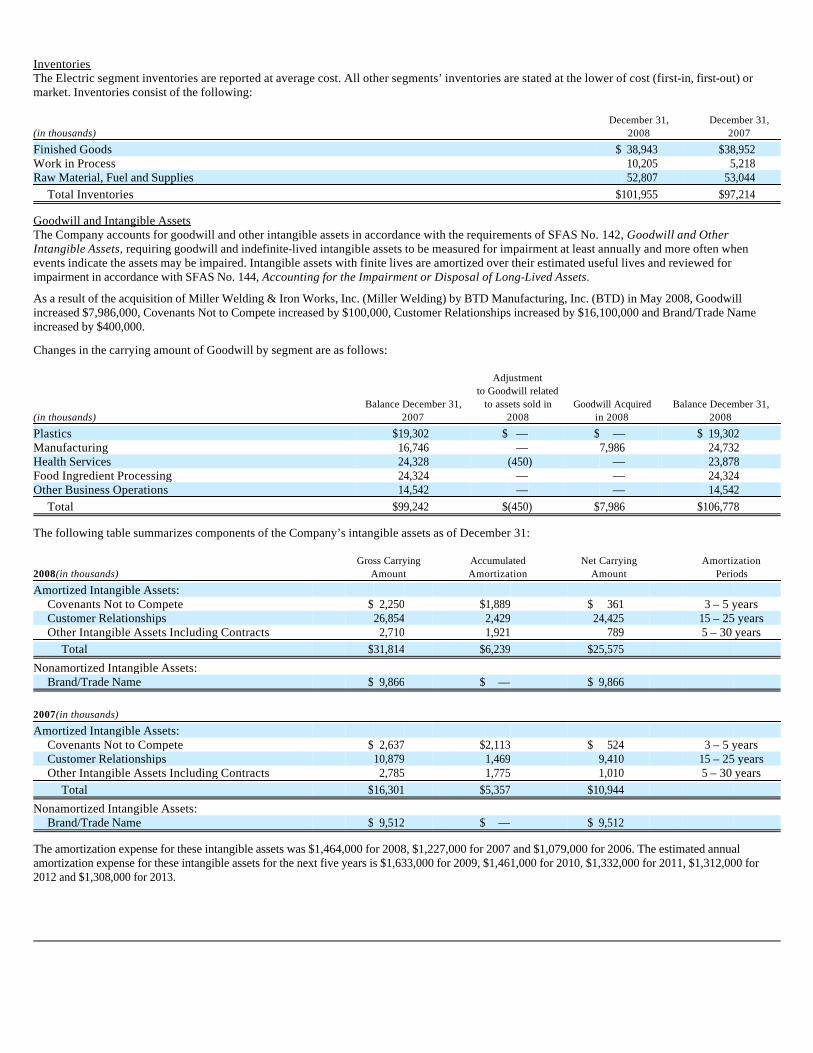
Inventories The Electric segment inventories are reported at average cost. All other segments’ inventories are stated at the lower of cost (first-in, first-out) or market. Inventories consist of the following:
Goodwill and Intangible Assets The Company accounts for goodwill and other intangible assets in accordance with the requirements of SFAS No. 142, Goodwill and Other Intangible Assets, requiring goodwill and indefinite-lived intangible assets to be measured for impairment at least annually and more often when events indicate the assets may be impaired. Intangible assets with finite lives are amortized over their estimated useful lives and reviewed for impairment in accordance with SFAS No. 144, Accounting for the Impairment or Disposal of Long-Lived Assets.
As a result of the acquisition of Miller Welding & Iron Works, Inc. (Miller Welding) by BTD Manufacturing, Inc. (BTD) in May 2008, Goodwill increased $7,986,000, Covenants Not to Compete increased by $100,000, Customer Relationships increased by $16,100,000 and Brand/Trade Name increased by $400,000.
Changes in the carrying amount of Goodwill by segment are as follows:
The following table summarizes components of the Company’s intangible assets as of December 31:
The amortization expense for these intangible assets was $1,464,000 for 2008, $1,227,000 for 2007 and $1,079,000 for 2006. The estimated annual amortization expense for these intangible assets for the next five years is $1,633,000 for 2009, $1,461,000 for 2010, $1,332,000 for 2011, $1,312,000 for 2012 and $1,308,000 for 2013.
December 31, December 31,(in thousands) 2008 2007
Finished Goods $ 38,943 $38,952 Work in Process 10,205 5,218 Raw Material, Fuel and Supplies 52,807 53,044
Total Inventories $101,955 $97,214
Adjustment to Goodwill related Balance December 31, to assets sold in Goodwill Acquired Balance December 31,(in thousands) 2007 2008 in 2008 2008
Plastics $19,302 $ — $ — $ 19,302 Manufacturing 16,746 — 7,986 24,732 Health Services 24,328 (450) — 23,878 Food Ingredient Processing 24,324 — — 24,324 Other Business Operations 14,542 — — 14,542
Total $99,242 $(450) $7,986 $106,778
Gross Carrying Accumulated Net Carrying Amortization2008(in thousands) Amount Amortization Amount Periods
Amortized Intangible Assets: Covenants Not to Compete $ 2,250 $1,889 $ 361 3 – 5 yearsCustomer Relationships 26,854 2,429 24,425 15 – 25 yearsOther Intangible Assets Including Contracts 2,710 1,921 789 5 – 30 years
Total $31,814 $6,239 $25,575
Nonamortized Intangible Assets: Brand/Trade Name $ 9,866 $ — $ 9,866
2007(in thousands)
Amortized Intangible Assets: Covenants Not to Compete $ 2,637 $2,113 $ 524 3 – 5 yearsCustomer Relationships 10,879 1,469 9,410 15 – 25 yearsOther Intangible Assets Including Contracts 2,785 1,775 1,010 5 – 30 years
Total $16,301 $5,357 $10,944
Nonamortized Intangible Assets: Brand/Trade Name $ 9,512 $ — $ 9,512
New Accounting Standards
SFAS No. 157, Fair Value Measurements, was issued by the FASB in September 2006. SFAS No. 157 defines fair value, establishes a framework for measuring fair value in generally accepted accounting principles and expands disclosures about fair value measurements. SFAS No. 157 is effective for fiscal years beginning after November 15, 2007. SFAS No. 157 applies under other accounting pronouncements that require or permit fair value measurements where fair value is the relevant measurement attribute. Accordingly, this statement does not require any new fair value measurements. The adoption of SFAS No. 157 on January 1, 2008 resulted in additional footnote disclosures related to the use of fair value measurements in the areas of investments, derivatives, asset retirement obligations, goodwill and asset impairment evaluations, financial instruments and acquisitions, but did not have a significant impact on the Company’s consolidated balance sheet, income statement or statement of cash flows.
SFAS No. 159, The Fair Value Option for Financial Assets and Financial Liabilities — Including an Amendment of FASB Statement No. 115, was issued by the FASB in February 2007. SFAS No. 159 provides companies with an option to measure, at specified election dates, many financial instruments and certain other items at fair value that are not currently measured at fair value. A company that adopts SFAS No. 159 will report unrealized gains and losses in earnings at each subsequent reporting date on items for which the fair value option has been elected. This statement also establishes presentation and disclosure requirements to facilitate comparisons between entities that choose different measurement attributes for similar types of assets and liabilities. SFAS No. 159 is effective for fiscal years beginning after November 15, 2007. The Company adopted SFAS No. 159 on January 1, 2008. The adoption of this pronouncement had no effect on the Company’s consolidated financial statements because the Company had not opted, nor does it currently plan to opt, to apply fair value accounting to any financial instruments or other items that it is not currently required to account for at fair value.
SFAS No. 141 (revised 2007), Business Combinations (SFAS No. 141(R)), was issued by the FASB in December 2007. SFAS No. 141(R) replaces SFAS No. 141, Business Combinations, and will apply prospectively to business combinations for which the acquisition date is on or after the beginning of the first annual reporting period beginning on or after December 15, 2008. SFAS No. 141(R) applies to all transactions or other events in which an entity (the acquirer) obtains control of one or more businesses (the acquiree). In addition to replacing the term “purchase method of accounting” with “acquisition method of accounting,” SFAS No. 141(R) requires an acquirer to recognize the assets acquired, the liabilities assumed and any noncontrolling interest in the acquiree at the acquisition date, measured at their fair values as of that date, with limited exceptions. This guidance will replace SFAS No. 141’s cost-allocation process, which requires the cost of an acquisition to be allocated to the individual assets acquired and liabilities assumed based on their estimated fair values. SFAS No. 141’s guidance results in not recognizing some assets and liabilities at the acquisition date, and it also results in measuring some assets and liabilities at amounts other than their fair values at the acquisition date. For example, SFAS No. 141 requires the acquirer to include the costs incurred to effect an acquisition (acquisition-related costs) in the cost of the acquisition that is allocated to the assets acquired and the liabilities assumed. SFAS No. 141(R) requires those costs to be expensed as incurred. In addition, under SFAS No. 141, restructuring costs that the acquirer expects but is not obligated to incur are recognized as if they were a liability assumed at the acquisition date. SFAS No. 141(R) requires the acquirer to recognize those costs separately from the business combination.
SFAS No. 161, Disclosures about Derivative Instruments and Hedging Activities—an amendment of FASB Statement No. 133, was issued by the FASB in March 2008. SFAS No. 161 requires enhanced disclosures about an entity’s derivative and hedging activities to improve the transparency of financial reporting. SFAS No. 161 is effective for financial statements issued for fiscal years and interim periods beginning after November 15, 2008. Adoption of SFAS No. 161 will result in additional footnote disclosures related to the Company’s use of derivative instruments but those additional disclosures will not be extensive because the derivative instruments currently held by the Company are not designated as hedging instruments under SFAS No. 161.
2. Business Combinations, Dispositions and Segment Information
On May 1, 2008 BTD acquired the assets of Miller Welding of Washington, Illinois for $41.7 million in cash. Miller Welding, a custom job shop fabricator and finisher, recorded $26 million in revenue in 2007. Miller Welding manufactures and fabricates parts for off-road equipment, mining machinery, oil fields and offshore oil rigs, wind industry components, broadcast antennae and farm equipment, and serves several major equipment manufacturers in the Peoria, Illinois area and nationwide, including Caterpillar, Komatsu and Gardner Denver. This acquisition will provide opportunities for growth in new and existing markets for both BTD and Miller Welding, and complementing production capabilities will expand the scope and capacity of services offered by both companies.

Below is condensed balance sheet information, at the date of the business combination, disclosing the preliminary allocation of the purchase price assigned to each major asset and liability category of Miller Welding:
Other Intangible Assets related to the Miller Welding acquisition include $16,100,000 for Customer Relationships being amortized over 20 years, $400,000 for a Nonamortizable Trade Name and a $100,000 Covenant Not to Compete being amortized over three years.
On February 19, 2007 ShoreMaster acquired the assets of the Aviva Sports product line for $2.0 million in cash. The Aviva Sports product line operates under Aviva Sports, Inc. (Aviva), a newly-formed wholly-owned subsidiary of ShoreMaster. The Aviva Sports product line is sold internationally and consists of products for consumer use in the pool, lake and yard, as well as commercial use at summer camps, resorts and large public swimming pools. The acquisition of the Aviva Sports product line fits well with the other product lines of ShoreMaster, a leading manufacturer and supplier of waterfront equipment.
On May 15, 2007 BTD acquired the assets of Pro Engineering, LLC (Pro Engineering) for $4.8 million in cash. Pro Engineering specializes in providing metal parts stampings to customers in the Midwest. The acquisition of Pro Engineering by BTD provides expanded growth opportunities for both companies.
Below, are condensed balance sheets, at the dates of the respective business combinations, disclosing the allocation of the purchase price assigned to each major asset and liability category of Aviva and Pro Engineering:
Other Intangible Assets related to the Aviva acquisition include $83,000 for a nonamortizable brand name and $787,000 in intangible assets being amortized over various periods up to 15 years. Other Intangible Assets related to the Pro Engineering acquisition include $51,000 for a nonamortizable brand name and $345,000 in intangible assets being amortized over various periods up to 20 years.
The Company acquired no new businesses in 2006.
All of the acquisitions described above were accounted for using the purchase method of accounting. Disclosure of pro forma information related to the results of operations of the entities acquired in 2008 and 2007 for the periods presented in this report is not required due to immateriality.
In June 2006, Otter Tail Energy Services Company (OTESCO), the Company’s energy services company, sold its gas marketing operations. Discontinued Operations includes the operating results of OTESCO’s natural gas marketing operations and an after-tax gain on the sale of its natural gas marketing operations of $0.3 million in 2006.
(in thousands)
Assets Current assets $ 8,855 Goodwill 7,986 Other Intangible Assets 16,600 Fixed Assets 8,994
Total Assets $42,435
Liabilities Current Liabilities $ 761 Noncurrent Liabilities —
Total Liabilities $ 761
Cash Paid $41,674
(in thousands) Aviva Pro Engineering
Assets Current Assets $2,083 $1,956 Goodwill — 1,048 Other Intangible Assets 870 396 Plant — 1,600
Total Assets $2,953 $5,000
Liabilities Current Liabilities $ 988 $ 215 Noncurrent Liabilities — —
Total Liabilities $ 988 $ 215
Cash Paid $1,965 $4,785

Segment Information
The accounting policies of the segments are described under note 1 — Summary of Significant Accounting Policies. The Company’s businesses have been classified into six segments based on products and services and reach customers in all 50 states and international markets. The six segments are: Electric, Plastics, Manufacturing, Health Services, Food Ingredient Processing and Other Business Operations.
Electric includes the production, transmission, distribution and sale of electric energy in Minnesota, North Dakota and South Dakota under the name Otter Tail Power Company (the electric utility). In addition, the electric utility is an active wholesale participant in the Midwest Independent Transmission System Operator (MISO) markets. The electric utility operations have been the Company’s primary business since incorporation.
Plastics consists of businesses producing polyvinyl chloride pipe in the Upper Midwest and Southwest regions of the United States.
Manufacturing consists of businesses in the following manufacturing activities: production of wind towers, contract machining, metal parts stamping and fabrication, and production of waterfront equipment, material and handling trays and horticultural containers. These businesses have manufacturing facilities in Florida, Illinois, Minnesota, Missouri, North Dakota, Oklahoma and Ontario, Canada and sell products primarily in the United States.
Health Services consists of businesses involved in the sale of diagnostic medical equipment, patient monitoring equipment and related supplies and accessories. These businesses also provide equipment maintenance, diagnostic imaging services and rental of diagnostic medical imaging equipment to various medical institutions located throughout the United States.
Food Ingredient Processing consists of IPH, which owns and operates potato dehydration plants in Ririe, Idaho; Center, Colorado; and Souris, Prince Edward Island, Canada. IPH produces dehydrated potato products that are sold in the United States, Canada and other countries.
Other Business Operations consists of businesses in residential, commercial and industrial electric contracting industries, fiber optic and electric distribution systems, wastewater and HVAC systems construction, transportation and energy services. These businesses operate primarily in the Central United States, except for the transportation company which operates in 48 states and 4 Canadian provinces.
Our electric operations, including wholesale power sales, are operated as a division of Otter Tail Corporation, and our energy services operation is operated as a subsidiary of Otter Tail Corporation. Substantially all of our other businesses are owned by our wholly owned subsidiary Varistar Corporation.
Corporate includes items such as corporate staff and overhead costs, the results of the Company’s captive insurance company and other items excluded from the measurement of operating segment performance. Corporate assets consist primarily of cash, prepaid expenses, investments and fixed assets. Corporate is not an operating segment. Rather, it is added to operating segment totals to reconcile to totals on the Company’s consolidated financial statements.
The Company has one customer within the Manufacturing segment that accounted for approximately 10.6% of the Company’s consolidated revenues in 2008. No other single external customer accounts for 10% or more of the Company’s revenues. Substantially all of the Company’s long-lived assets are within the United States except for a food ingredient processing dehydration plant in Souris, Prince Edward Island, Canada and a wind tower manufacturing plant in Fort Erie, Ontario, Canada.
Percent of Sales Revenue by Country for the Year Ended December 31:
The Company evaluates the performance of its business segments and allocates resources to them based on earnings contribution and return on total invested capital. Information on continuing operations for the business segments for 2008, 2007 and 2006 is presented in the following table.
2008 2007 2006
United States of America 97.3% 96.9% 97.2%Canada 1.1% 1.3% 1.3%All Other Countries 1.6% 1.8% 1.5%

(in thousands) 2008 2007 2006
Operating Revenue Electric $ 340,020 $ 323,478 $ 306,014 Plastics 116,452 149,012 163,135 Manufacturing 470,462 381,599 311,811 Health Services 122,520 130,670 135,051 Food Ingredient Processing 65,367 70,440 45,084 Other Business Operations 199,511 185,730 145,603 Corporate and Intersegment Eliminations (3,135) (2,042) (1,744)
Total $1,311,197 $1,238,887 $1,104,954
Depreciation and Amortization Electric $ 31,755 $ 26,097 $ 25,756 Plastics 3,050 3,083 2,815 Manufacturing 19,260 13,124 11,076 Health Services 4,133 3,937 3,660 Food Ingredient Processing 4,094 3,952 3,759 Other Business Operations 2,230 2,058 2,330 Corporate 538 579 587
Total $ 65,060 $ 52,830 $ 49,983
Interest Charges Electric $ 12,895 $ 9,405 $ 10,315 Plastics 1,156 970 814 Manufacturing 8,666 8,546 6,550 Health Services 714 883 910 Food Ingredient Processing 109 177 481 Other Business Operations 1,171 1,234 988 Corporate and Intersegment Eliminations 2,247 (358) (557)
Total $ 26,958 $ 20,857 $ 19,501
Income Before Income Taxes Electric $ 46,160 $ 37,422 $ 38,802 Plastics 3,114 13,452 22,959 Manufacturing 7,650 24,503 21,148 Health Services 342 2,626 3,909 Food Ingredient Processing 2,655 5,912 (6,325)Other Business Operations 8,736 6,762 8,666 Corporate (18,495) (8,748) (11,303)
Total $ 50,162 $ 81,929 $ 77,856
Earnings Available for Common Shares Electric $ 32,498 $ 23,762 $ 23,445 Plastics 1,880 8,314 14,326 Manufacturing 5,269 15,632 13,171 Health Services 85 1,427 2,230 Food Ingredient Processing 1,681 4,386 (4,115)Other Business Operations 5,279 4,049 5,257 Corporate (12,303) (4,345) (4,300)
Total $ 34,389 $ 53,225 $ 50,014
Capital Expenditures Electric $ 198,798 $ 104,288 $ 35,207 Plastics 8,883 3,305 5,504 Manufacturing 47,606 42,786 20,048 Health Services 4,039 5,276 4,720 Food Ingredient Processing 2,402 47 1,762 Other Business Operations 3,919 5,589 1,779 Corporate 241 694 428
Total $ 265,888 $ 161,985 $ 69,448
Identifiable Assets Electric $ 992,159 $ 813,565 $ 689,653 Plastics 78,054 77,971 80,666 Manufacturing 356,697 274,780 219,336 Health Services 61,086 64,824 66,126 Food Ingredient Processing 88,813 91,966 94,462 Other Business Operations 71,359 72,258 67,110 Corporate 44,419 59,390 41,008 Discontinued Operations — — 289

Total $1,692,587 $1,454,754 $1,258,650
3. Rate and Regulatory Matters
Minnesota
General Rate Case— In an order issued by the Minnesota Public Utilities Commission (MPUC) on August 1, 2008 the electric utility was granted an increase in Minnesota retail electric rates of $3.8 million or approximately 2.9%, compared with the originally requested increase of approximately 6.7%. An interim rate increase of 5.4% went into effect on November 30, 2007. The electric utility will refund Minnesota customers the difference between interim rates and final rates, with interest, in March 2009. Amounts refundable totaling $3.9 million have been recorded as a liability on the Company’s consolidated balance sheet as of December 31, 2008. The MPUC approved a rate of return on equity of 10.43% on a capital structure with 50.0% equity. The electric utility deferred recognition of $1.5 million in rate case-related filing and administrative costs in June 2008 that are subject to amortization and recovery over three years under new rates as ordered by the MPUC. As a result of an MPUC decision on reconsideration of the treatment of profit margins on the resale of electricity purchased from other companies, the electric utility will assign an amount of its costs to this unregulated activity but will not be required to credit any portion of nonasset-based margins to retail customers.
Capacity Expansion 2020 (CapX 2020) Mega Certificate of Need—On August 16, 2007 the eleven CapX 2020 utilities asked the MPUC to determine the need for three 345-kilovolt (kv) transmission lines. Evidentiary hearings for the Certificate of Need for the three CapX 2020 345-kv transmission line projects began in July 2008 and continued into August 2008. The MPUC is expected to decide if the lines meet regulatory need requirements by early 2009. The MPUC would determine routes for the new lines in separate proceedings. Portions of the lines would also require approvals by federal officials and by regulators in North Dakota, South Dakota and Wisconsin. After regulatory need is established and routing decisions are completed (expected in 2009 or 2010), construction will begin. The lines would be expected to be completed three or four years later. Great River Energy and Xcel Energy are leading these projects, and Otter Tail Power Company and eight other utilities are involved in permitting, building and financing. Otter Tail Power Company is directly involved in two of these three projects and serves as the lead utility in a fourth Group 1 project, the Bemidji-Grand Rapids 230-kv line which has an expected in-service date of 2012-2013.
The electric utility filed a Certificate of Need for the fourth project on March 17, 2008. The Department of Commerce Office of Energy Security (MNOES) staff completed briefing papers regarding the Bemidji-Grand Rapids route permit application. The MNOES staff recommended to the MPUC: (1) the route permit application be found to be complete, (2) the need determination not be sent to a contested case but be handled informally by MPUC review, and (3) the Certificate of Need and route permit proceedings be combined as requested. The MPUC met on June 26, 2008 to act on the MNOES staff recommendation. The MPUC agreed the Certificate of Need and route permit applications were complete. The commissioners asked the CapX 2020 utilities to add a section to the Certificate of Need application addressing how the new Minnesota Conservation Improvement Programs (CIP) statutes will affect the need for the project. Because no one has intervened in the Certificate of Need proceeding, the MPUC will handle the Certificate of Need application as an uncontested case. The MNOES subsequently recommended that need for the line has been established. The MPUC is expected to determine if there is a need for this line and, if appropriate, issue the route permit in spring 2010.
Renewable Energy Standards, Conservation and Renewable Resource Riders—In February 2007, the Minnesota legislature passed a renewable energy standard requiring the electric utility to generate or procure sufficient renewable generation such that the following percentages of total retail electric sales to Minnesota customers come from qualifying renewable sources: 12% by 2012; 17% by 2016; 20% by 2020 and 25% by 2025. Under certain circumstances and after consideration of costs and reliability issues, the MPUC may modify or delay implementation of the standards. The electric utility has acquired renewable resources and expects to acquire additional renewable resources in order to maintain compliance with the Minnesota renewable energy standard. By the end of 2010, the electric utility expects to have sufficient renewable energy resources available to comply with the required 2012 level of the Minnesota renewable energy standard. The electric utility’s compliance with the Minnesota renewable energy standard will be measured through the Midwest Renewable Energy Tracking System.
Under the Next Generation Energy Act of 2007 passed by the Minnesota legislature in May 2007, an automatic adjustment mechanism was established to allow Minnesota electric utilities to recover investments and costs incurred to satisfy the requirements of the renewable energy standards. The MPUC is now authorized to approve a rate schedule rider to enable utilities to recover the costs of qualifying renewable energy projects that supply renewable energy to Minnesota customers. Cost recovery for qualifying renewable energy projects can now be authorized outside of a rate case proceeding, provided that such renewable projects have received previous MPUC approval. Renewable resource costs eligible for recovery may include return on investment, depreciation, operation and maintenance costs, taxes, renewable energy delivery costs and other related expenses.
In an order issued on August 15, 2008, the MPUC approved the electric utility’s proposal to implement a Renewable Resource Cost Recovery Rider for its Minnesota jurisdictional portion of investment in renewable energy facilities. The rider
enables the electric utility to recover from its Minnesota retail customers its investments in owned renewable energy facilities and provides for a return on those investments. The Renewable Resource Adjustment of 0.19 cents per kilowatt-hour (kwh) was included on Minnesota customers’ electric service statements beginning in September 2008. The first renewable energy project for which the electric utility will receive cost recovery is its 40.5 megawatt ownership share of the Langdon Wind Energy Center, which became fully operational in January 2008. The electric utility has recognized a regulatory asset of $3.0 million for revenues that are eligible for recovery through the rider but have not been billed to Minnesota customers as of December 31, 2008.
The electric utility is awaiting a decision from the MPUC on its 2009 Rider Adjustment filing with an expected implementation date of April 1, 2009. The 2009 Rider Adjustment filing includes a request for recovery of the electric utility’s investment costs and expenses related to its 32 wind turbines at the Ashtabula Wind Energy Center that became commercially operational in November 2008.
In addition to the Renewable Resource Cost Recovery Rider, the Minnesota Public Utilities Act provides a similar mechanism for automatic adjustment outside of a general rate proceeding to recover the costs of new electric transmission facilities. The MPUC may approve a tariff rider to recover the Minnesota jurisdictional costs of new transmission facilities that have been previously approved by the MPUC in a Certificate of Need proceeding or certified by the MPUC as a Minnesota priority transmission project or investment and expenditures made to transmit the electricity generated from renewable generation sources ultimately used to provide service to the utility’s retail customers. Such transmission cost recovery riders would allow a return on investments at the level approved in a utility’s last general rate case. The electric utility expects to file a proposed rider with the MPUC to recover its share of costs of eligible transmission infrastructure upgrades projects in 2009.
Recovery of MISO Costs—In December 2005, the MPUC issued an order denying the electric utility’s request to allow recovery of certain MISO-related costs through the FCA in Minnesota retail rates and requiring a refund of amounts previously collected pursuant to an interim order issued in April 2005. The electric utility recorded a $1.9 million reduction in revenue and a refund payable in December 2005 to reflect the refund obligation. On February 9, 2006 the MPUC decided to reconsider its December 2005 order. The MPUC’s final order was issued on February 24, 2006 requiring jurisdictional investor-owned utilities in the state to participate with the Minnesota Department of Commerce (MNDOC) and other parties in a proceeding that would evaluate suitability of recovery of certain MISO Day 2 energy market costs through the FCA. The February 24, 2006 order eliminated the refund provision from the December 2005 order and allowed that any MISO-related costs not recovered through the FCA may be deferred for a period of 36 months, with possible recovery through base rates in the utility’s next general rate case. As a result, the electric utility recognized $1.9 million in revenue and reversed the refund payable in February 2006. The Minnesota utilities and other parties submitted a final report to the MPUC in July 2006.
In an order issued on December 20, 2006 the MPUC stated that except for schedule 16 and 17 administrative costs, discussed below, each petitioning utility may recover the charges imposed by the MISO for MISO Day 2 operations (offset by revenues from Day 2 operations via net accounting) through the calculation of the utility’s FCA from the period April 1, 2005 through a period of at least three years after the date of the order. The MPUC also ordered the utilities to refund schedule 16 and 17 costs collected through the FCA since the inception of MISO Day 2 Markets in April 2005 and stated that each petitioning utility may use deferred accounting for MISO schedule 16 and 17 costs incurred since April 1, 2005. This deferred accounting may continue for ongoing schedule 16 and 17 costs, without the accumulation of interest, until the earlier of March 1, 2009 or the utility’s next electric rate case. Pursuant to this December 20, 2006 order, the electric utility was ordered to refund $446,000 in MISO schedule 16 and 17 costs to Minnesota retail customers through the FCA over a twelve-month period beginning in January 2007. The electric utility requested recovery of the deferred costs and recovery of the ongoing costs in its general rate case filed in October 2007 and, in January 2008, began amortizing $855,000 of deferred MISO schedule 16 and 17 costs over a 35-month period. The August 1, 2008 MPUC Order in the general rate case allowed future recovery of MISO schedule 16 and 17 costs and recovery of the deferred Schedule 16 and 17 costs.
Minnesota Annual Automatic Adjustment Report on Energy Costs (AAA Report)—The MNDOC and the electric utility identified two operational situations which are not covered in the approved method for allocating MISO costs contained in the final December 20, 2006 MPUC order discussed above. One relates to plants not expected to be available for retail but that produce energy in certain hours, resulting in wholesale sales. The other situation is related to Financial Transmission Rights (FTRs) not needed for retail load. For the period July 1, 2005 through June 30, 2007 the electric utility determined its Minnesota customers’ portion of costs associated with these situations to be $765,000. The data was provided to the MNDOC during the course of the MNDOC’s review of the AAA Report. The electric utility offered to refund $765,000 to its Minnesota customers to settle this and other issues raised by the MNDOC in the AAA Report docket before the MPUC and the MNDOC accepted the offer in October 2007 and recommended that the MPUC include the refund in its final order. The electric utility also agreed to modifications to the MISO Day 2 cost allocations that were resolved in the MPUC’s December 20, 2006 order. The electric utility agreed to make some of those modifications retroactive back to January 1, 2007. The MPUC accepted the electric utility’s refund offer and modifications and closed this docket on February 6, 2008. In December 2007, the electric utility recorded a liability and a reduction to revenue of $805,000 for the amount of the refund offer and similar revenues collected subsequent to June 30, 2007. Refunds to Minnesota customers were completed during 2008.

Claims of Improper Regulatory Filings—In September 2004, the Company provided a letter to the MPUC summarizing issues and conclusions of an internal investigation completed by the Company related to claims of allegedly improper regulatory filings brought to the attention of the Company by certain individuals. A hearing before the MPUC was held on February 28, 2006. As a result of the hearing, the electric utility agreed that within 90 days it would file a revised Regulatory Compliance Plan, an updated Corporate Cost Allocation Manual and documentation of the definitions of its chart of accounts. The electric utility filed these documents with the MPUC in the second quarter of 2006. Subsequently, at a MPUC hearing on January 25, 2007 all remaining open issues were resolved. On two of the issues resolved, the MPUC required the electric utility to include all of the Company’s short-term debt in its calculations of allowance for funds used during construction (AFUDC) and the electric utility agreed to provide the MPUC the results of an ongoing FERC operational audit when available. The Company recorded a noncash charge to Other Income and Deductions of $3.3 million in 2006 related to the disallowance of a portion of capitalized AFUDC from the electric utility’s rate base as a result of including all of the Company’s short-term debt, regardless of use, in the electric utility’s calculations of AFUDC. On December 12, 2007 the MPUC issued its order closing the investigation subject to the Company’s continuing responsibility to file the report on its FERC operational audit as soon as available and subject to any further development of the record required in the electric utility’s recent general rate case. FERC Order (IN08-6-000), resolving alleged network transmission service violations by the electric utility of the Open Access Transmission and Energy Markets Tariff of the MISO was issued on May 29, 2008 and filed with the MPUC on June 4, 2008.
North Dakota
General Rate Case— On November 3, 2008 the electric utility filed a general rate case in North Dakota requesting an overall revenue increase of approximately $6.1 million, or 5.1%, and an interim rate increase, to begin on January 2, 2009, of approximately 4.1%, or $4.8 million annualized. A final decision by the North Dakota Public Service Commission (NDPSC) on the electric utility’s request is expected by August 1, 2009. Interim rates will remain in effect for all North Dakota customers until the NDPSC makes a final determination on the electric utility’s request. If final rates are lower than interim rates, the electric utility will refund North Dakota customers the difference with interest.
Renewable Resource Cost Recovery Rider—On May 21, 2008 the NDPSC approved the electric utility’s request for a Renewable Resource Cost Recovery Rider to enable the electric utility to recover the North Dakota share of its investments in renewable energy facilities it owns in North Dakota. The Renewable Resource Cost Recovery Rider Adjustment of 0.193 cents per kwh was included on North Dakota customers’ electric service statements beginning in June 2008. The first renewable energy project for which the electric utility will receive cost recovery is its 40.5 megawatt ownership share of the Langdon Wind Energy Center, which became fully operational in January 2008. The electric utility may also recover through this rider costs associated with other new renewable energy projects as they are completed. The electric utility has included investment costs and expenses related to its 32 wind turbines at the Ashtabula Wind Energy Center that became commercially operational in November 2008 in its 2009 annual request to the NDPSC to increase the amount of the Renewable Resource Cost Recovery Rider Adjustment. A Renewable Resource Cost Recovery Rider Adjustment rate of 0.51 cents per kwh was approved by the NDPSC on January 14, 2009 and went into effect beginning with billing statements sent on February 1, 2009.
The electric utility had not been deferring recognition of its renewable resource costs eligible for recovery under the North Dakota Renewable Resource Cost Recovery Rider but had been charging those costs to operating expense since January 2008. After approval of the rider, the electric utility accrued revenues related to its investment in renewable energy and for renewable energy costs incurred since January 2008 that are eligible for recovery through the North Dakota Renewable Resource Cost Recovery Rider. The Company’s December 31, 2008 consolidated balance sheet includes a regulatory asset of $2.0 million for revenues that are eligible for recovery through the North Dakota Renewable Resource Cost Recovery Rider but that had not been billed to North Dakota customers as of December 31, 2008.
North Dakota legislation also provides a mechanism for automatic adjustment outside of a general rate proceeding to recover jurisdictional capital and operating costs incurred by a public utility for new or modified electric transmission facilities. However, the electric utility has requested recovery of such costs in its general rate case filed in November 2008.
Recovery of MISO Costs—In February 2005, the electric utility filed a petition with the NDPSC to seek recovery of certain MISO-related costs through the FCA. The NDPSC granted interim recovery through the FCA in April 2005, but similar to the decision of the MPUC, conditioned the relief as being subject to refund until the merits of the case are determined. In August 2007, the NDPSC approved a settlement agreement between the electric utility and an intervener representing several large industrial customers in North Dakota. Under the approved settlement agreement, the electric utility refunded $493,000 of MISO schedule 16 and 17 costs collected through the FCA from April 2005 through July 2007 to North Dakota customers beginning in October 2007 and ending in January 2008. The electric utility deferred recognition of these costs plus $330,000 in MISO schedule 16 and 17 costs incurred from August 2007 through December 2008 and requested recovery of these deferred costs in its general rate case filed in North Dakota in November 2008. As of December 31, 2008 the electric utility had deferred $823,000 in MISO schedule 16 and 17 costs in North Dakota, which it will amortize over 36 months beginning in January 2009 in conjunction with the implementation of interim rates in North Dakota. Requests for approval of base rate recovery for deferred and on-going MISO schedule 16 and 17 costs are included in the pending general rate case.

South Dakota
General Rate Case— On October 31, 2008 the electric utility filed a general rate case in South Dakota requesting an overall revenue increase of approximately $3.8 million, or 15.3%, which provides for recovery of renewable resource investments and expenses in base rates. South Dakota rules do not provide for interim rate increases pending approval of final rates. A final decision by the SDPUC on the electric utility’s request is expected in mid-summer 2009.
Federal
Revenue Sufficiency Guarantee (RSG) Charges—On April 25, 2006 the FERC issued an order requiring MISO to refund to customers, with interest, amounts related to real-time RSG charges that were not allocated to day-ahead virtual supply offers in accordance with MISO’s Open Access Transmission and Energy Markets Tariff (TEMT) going back to the commencement of MISO Day 2 markets in April 2005. On May 17, 2006 the FERC issued a Notice of Extension of Time, permitting MISO to delay compliance with the directives contained in its April 2006 order, including the requirement to refund to customers the amounts due, with interest, from April 1, 2005 and the requirement to submit a compliance filing. The Notice stated that the order on rehearing would provide the appropriate guidance regarding the timing of the compliance filing. On October 26, 2006 the FERC issued an order on rehearing of the April 25, 2006 order, stating it would not require refunds related to real-time RSG charges that had not been allocated to day-ahead virtual supply offers in accordance with MISO’s TEMT going back to the commencement of the MISO Day 2 market in April 2005. However, the FERC ordered prospective allocation of RSG charges to virtual transactions consistent with the TEMT to prevent future inequity and directed MISO to propose a charge that assesses RSG costs to virtual supply offers based on the RSG costs that virtual supply offers cause within 60 days of the October 26, 2006 order. On December 27, 2006 the FERC issued an order granting rehearing of the October 26, 2006 order.
On March 15, 2007 the FERC issued an order denying requests for rehearing of the RSG rehearing order dated October 26, 2006. In the March 15, 2007 order on rehearing, the FERC stated that its findings in the April 25, 2006 RSG order that virtual offers should share in the allocation of RSG costs, per the terms of the currently effective tariff, served as notice to market participants that virtual offers, for those market participants withdrawing energy, were liable for RSG charges. FERC clarified that the RSG rehearing order’s waiver of refunds applies to the period before that order, from market start-up in April 2005 until April 24, 2006. After that date, virtual supply offers are liable for RSG costs and therefore, to the extent virtual supply offers were not assessed RSG costs, refunds are due for the period starting April 25, 2006.
On November 5, 2007 the FERC issued two orders related to the RSG proceeding. In the first order, the FERC accepted the MISO’s April 17, 2007 RSG compliance filing to comply with the FERC’s March 15, 2007 RSG order. The compliance reinserted language requiring the actual withdrawal of energy by market participants, restored the MISO’s original TEMT language allocating RSG costs to virtual transactions, revised the effective date for allocation to imports, provided an explanation of its efforts to reflect partial-hour revenue determinations in its software development, and revised several definitions. The second related RSG order issued by FERC on November 5, 2007 was its order on rehearing on its April 25, 2006 order in which it rejected the MISO’s proposal to remove references to virtual supply from the TEMT provisions related to calculating RSG charges (FERC Docket Nos. ER04-691-084 and ER04-691-086). In this order, the FERC denied the requests for rehearing of the RSG second rehearing order (the electric utility was one of the parties that sought rehearing) and FERC denied all requests for rehearing of the RSG compliance order.
In the RSG compliance order, the FERC rejected the MISO’s proposal to allocate costs based on net virtual offers, i.e., virtual offers minus virtual bids, and clarified that the currently effective tariff, which allocates RSG costs to virtual supply offers, remains in effect. In the RSG second rehearing order, the FERC clarified that for those market participants withdrawing energy, to the extent virtual supply offers were not assessed RSG costs, refunds were due for the period starting April 25, 2006.
The electric utility recorded a $1.7 million ($1.0 million net-of-tax) charge to earnings in the first quarter of 2007 based on an internal estimate of the net impact of MISO reallocating RSG charges in response to the FERC order on rehearing. In May 2007, MISO informed affected market participants of the impact of reallocating charges based on its interpretation of the FERC order on rehearing. Based on MISO’s interpretation of the order on rehearing, the electric utility estimated the reallocation of charges would not have a significant impact on earnings previously recognized by the electric utility. Accordingly, the electric utility revised its first quarter estimated charge of $1.7 million ($1.0 million net-of-tax) to zero in the second quarter of 2007.
On March 15, 2007 the FERC also directed MISO to make another compliance filing that the FERC addressed on November 7, 2008 (RSG Compliance Order III). In RSG Compliance Order III, the FERC concluded that its interpretation in RSG III regarding the RSG rate denominator was in error and that a different interpretation applied. On November 10, 2008 the FERC issued an order on the paper hearing finding the current RSG rate unjust and unreasonable and accepting an interim rate that applied RSG charges to all virtual sales until such time as MISO makes a subsequent filing of the new RSG rate. In response to RSG Compliance Order III, MISO made another compliance filing on December 8, 2008 in which it proposed to
re-resettle the RSG charges and cost allocations back to market start to correct its previous resettlement completed in January 2008 that was based on the FERC’s interpretation of the RSG rate and billing determinants affirmed in RSG III. In addition to correcting the RSG rate denominator to limit it to only virtual sales associated with actual physical energy withdrawals, MISO proposed additional corrections designed to reduce the denominator. Both changes will increase the RSG rate that the electric utility must pay. Also, on November 11, 2008 the FERC issued an order on rehearing of the November 28, 2007 order on complaint. Again, where the revenue from RSG charges collected is not sufficient to make RSG payments to suppliers, MISO recovers the shortage through an uplift charge from all load.
The electric utility requested rehearing of both November 10, 2008 orders (in conjunction with the FERC’s RSG Compliance Order III). If the FERC denies rehearing, the electric utility will likely seek review at the District of Columbia Circuit (D.C. Circuit). The electric utility’s principal concern in these proceedings was to ensure that the FERC did not impose refunds prior to the August 10, 2007 refund effective date. The FERC did not impose such refunds but did offer an interpretation in support of its decision in RSG Compliance Order III (in ER04-691 docket) that would subject the electric utility to further RSG refunds and resettlements prior to August 10, 2007.
Since 2006, the electric utility has been a party to litigation before the FERC regarding the application of RSG charges to market participants who withdraw energy from the market or engage in financial-only, virtual sales of energy into the market or both. These litigated proceedings occurred in several electric rate and complaint dockets before the FERC and several of the FERC’s orders are on review before the United States Court of Appeals for the D.C. Circuit. These proceedings create potential contingent liabilities in three separate periods for the electric utility: (1) April 1, 2005 through April 24, 2006; (2) April 25, 2006 through August 9, 2007; and (3) August 10, 2007 forward. The electric utility identified and assessed potential contingent RSG liabilities under various scenarios depending on the time period over which the FERC ultimately orders RSG refunds. The electric utility accrued a liability in 2008 based on the outcome it determined to be most probable. The Company does not know when these litigation proceedings will conclude.
Transmission Practices Audit—The FERC’S Office of Enforcement, formerly referred to as the Division of Audits of the Office of Market Oversight and Investigations, commenced an audit in 2005 of the electric utility’s transmission practices for the period January 1, 2003 through August 31, 2005. The purpose of the audit was to determine whether the electric utility’s transmission practices were in compliance with the FERC’s applicable rules, regulations and tariff requirements and whether the implementation of the electric utility’s waivers from the requirements of Order No. 889 and Order No. 2004 appropriately restricted access to transmission information that would benefit the electric utility’s off-system sales. FERC staff identified two of the electric utility’s transmission practices that it believed were out of compliance. The electric utility believes its actions were in compliance with the MISO tariff but rather than litigate, it entered into a Stipulated Settlement Agreement with FERC staff resolving all issues related to the audit. The FERC approved the settlement agreement on May 29, 2008.
FERC Order (IN08-6-000) issued May 29, 2008 resolves alleged network transmission service violations by the electric utility of MISO’s TEMT. The electric utility agreed to pay $547,000 plus interest of $141,000 to the Low Income Home Energy Assistance Program administered by the three states served by the electric utility. This amount represents profits earned by the electric utility on transactions FERC staff believes incorrectly utilized network transmission service under MISO’s TEMT. Enforcement staff did not seek to impose a compliance monitoring plan on the electric utility because the MISO’s Day 2 market is now operational and its member utilities no longer schedule transmission within the system.
Big Stone II Project
On June 30, 2005 the electric utility and a coalition of six other electric providers entered into several agreements for the development of a second electric generating unit, named Big Stone II, at the site of the existing Big Stone Plant near Milbank, South Dakota. The three primary agreements are the Participation Agreement, the Operation and Maintenance Agreement and the Joint Facilities Agreement. Central Minnesota Municipal Power Agency, Great River Energy, Heartland Consumers Power District, Montana-Dakota Utilities Co., a division of MDU Resources Group, Inc., Southern Minnesota Municipal Power Agency and Western Minnesota Municipal Power Agency are parties to all three agreements. In September 2007, Great River Energy and Southern Minnesota Municipal Power Agency withdrew from the project. The five remaining project participants decided to downsize the proposed plant’s nominal generating capacity from 630 megawatts to between 500 and 580 megawatts. New procedural schedules were established in the various project-related proceedings, which take into consideration the optimal plant configuration decided on by the remaining participants. NorthWestern Corporation, one of the co-owners of the existing Big Stone Plant, is an additional party to the Joint Facilities Agreement.

In the fourth quarter of 2005, the participating utilities filed applications with the MPUC for a transmission Certificate of Need and a Route Permit for the Minnesota portion of the Big Stone II transmission line. On January 15, 2009 the MPUC approved, by a vote of 5-0, a motion to grant the Certificate of Need and Route Permit for the Minnesota portion of the Big Stone II transmission line. The motion involved numerous elements, including the following:
Therefore, the MPUC determined to grant the Certificate of Need subject to a number of additional conditions pending issuance of a final order, including but not limited to: (1) fulfilling various requirements relating to renewable energy goals, energy efficiency, community-based energy development projects and emissions reduction; (2) that the generation plant be built as a “carbon capture retrofit ready” facility; (3) that the applicants report to the MPUC on the feasibility of building the plant using ultra-supercritical technology; and (4) that the applicants achieve specific limits on construction cost at $3000/kilowatt and carbon dioxide costs at $26/ton.
The Certificate of Need and Route Permit are required by state law and would allow the Big Stone II utilities to construct and upgrade 112 miles of electric transmission lines in western Minnesota for delivery of power from the Big Stone site and from numerous other planned generation projects, most of which are wind energy.
The electric utility’s integrated resource plan (IRP) includes generation from Big Stone II beginning in 2013 to accommodate load growth and to replace expiring purchased power contracts and older coal-fired base-load generation units scheduled for retirement. On June 5, 2008 the MPUC deferred approval of the electric utility’s 2006-2020 IRP, originally filed in 2005. The addition of 160 megawatts of wind generation in the IRP was approved early in 2007 and, on January 15, 2009, the MPUC approved the electric utility’s 2006-2020 IRP in its entirety. As of the date of this report, the MPUC had not issued a written order reflecting its decision. This 2006-2020 IRP includes new renewable wind generation and significant demand-side management including conservation, new baseload including the proposed Big Stone II power plant, natural gas-fired peaking plants and wholesale energy purchases.
On August 27, 2008 the NDPSC determined that the electric utility’s participation in Big Stone II was prudent in a range of 121.8 to 130 megawatts. The NDPSC decision has been appealed to Burleigh County District Court by interveners in the matter. On November 20, 2008 the South Dakota Board of Minerals and Environment unanimously approved the Big Stone II participating utilities’ application for a Prevention of Significant Deterioration (PSD) permit for Big Stone II and a proposed Title V Operating Permit for the Big Stone site. A PSD permit is a pre-construction permit designed to protect air quality. Joint petitioners Sierra Club and Clean Water Action have appealed the administrative decision on the PSD permit to the Circuit Court of Hughes County. The appeal is currently pending before the Court. The issuance of the Title V permit is subject to review by the U.S. Environmental Protection Agency (EPA). On January 22, 2009, the EPA filed a formal objection to the proposed Title V permit. The State of South Dakota has revised and submitted a proposed permit in response to the EPA’s objection.
The Big Stone II federal Environmental Impact Statement (EIS) process led by the Western Area Power Administration (WAPA) continues to move forward. WAPA and its third party subcontractor continue to develop the Final EIS, which will include comments on the Draft EIS and the Supplemental Draft EIS, and responses to those comments. WAPA will develop a Record of Decision (ROD) following internal review and approval of the Final EIS. The electric utility anticipates publication of the ROD in the Federal Register in the second quarter of 2009. Financial close, which requires the participants to provide binding financial commitments to support their share of costs, is to occur 90 days after the EIS ROD. No one can predict the exact outcome of any of these proceedings.
The delays in approval of the Big Stone II transmission Certificate of Need in Minnesota and issuance of required permits may delay the availability of Big Stone II as a generation resource. Also, the electric utility has experienced more rapid load growth than was expected since originally filing the IRP in 2005. The electric utility is assessing ways in which to address this potential near-term generation shortfall and has requested authority from the MPUC to immediately acquire up to 110 megawatts of peaking capacity. The MPUC committed to expediting a decision on this request.
As of December 31, 2008 the electric utility has capitalized $11.6 million in costs related to the planned construction of Big Stone II. If the project is abandoned for permitting or other reasons, a portion of these capitalized costs and others incurred in future periods may be subject to expense and may not be recoverable.
• That there is reasonable assurance that Big Stone II would be more cost-effective than renewable energy beyond the statutory levels of renewable energy based on accepted estimates of construction costs and carbon dioxide;
• That the 345 kV transmission project is necessary based on identified regional and state transmission needs; and
• That the project presents risks requiring additional measures to protect the applicants’ ratepayers.

4. Regulatory Assets and Liabilities
The following table indicates the amount of regulatory assets and liabilities recorded on the Company’s consolidated balance sheet:
The regulatory asset related to prior service costs and actuarial losses on pension benefits and the regulatory liability related to the unrecognized transition obligation, prior service costs and actuarial gains on other postretirement benefits represents benefit costs and actuarial gains subject to recovery or return through rates as they are expensed over the remaining service lives of active employees included in the plans. These unrecognized benefit costs and actuarial gains were required to be recognized as components of Accumulated Other Comprehensive Income in equity under SFAS No. 158, Employer’s Accounting for Defined Benefit Pension and Other Postretirement Plans, but were determined to be eligible for treatment as regulatory assets based on their probable recovery in future retail electric rates.
Accrued Cost-of-Energy Revenue included in Accrued Utility and Cost-of-Energy Revenues will be recovered over the next 20 months.
The regulatory assets and liabilities related to Deferred Income Taxes result from changes in statutory tax rates accounted for in accordance with SFAS No. 109, Accounting for Income Taxes.
Debt Reacquisition Premiums included in Unamortized Debt Expense are being recovered from electric utility customers over the remaining original lives of the reacquired debt issues, the longest of which is 23.7 years.
Minnesota Renewable Resource Rider Accrued Revenues relate to revenues earned on qualifying 2008 renewable resource costs incurred to serve Minnesota customers since January 1, 2008 that have not been billed to Minnesota customers as of December 31, 2008. Minnesota Renewable Resource Rider Accrued Revenues are expected to be recovered over 15 months, from January 2009 through March 2010.
North Dakota Renewable Resource Rider Accrued Revenues relate to revenues earned on qualifying 2008 renewable resource costs incurred to serve North Dakota customers since January 1, 2008 that have not been billed to North Dakota customers as of December 31, 2008. North Dakota Renewable Resource Rider Accrued Revenues are expected to be recovered over 13 months, from January 2009 through January 2010.
Minnesota General Rate Case Recoverable Expenses will be recovered over a 36-month period beginning in February 2009 when revised rates established by the recent Minnesota general rate case go into effect.
December 31, December 31,(in thousands) 2008 2007
Regulatory Assets: Unrecognized Prior Service Costs and Actuarial Losses on Pension Benefits $64,490 $26,933 Accrued Cost-of-Energy Revenue 8,982 19,452 Deferred Income Taxes 7,094 8,733 Debt Reacquisition Premiums 3,357 3,745 Minnesota Renewable Resource Rider Accrued Revenues 3,045 — North Dakota Renewable Resource Rider Accrued Revenues 2,009 — Minnesota General Rate Case Recoverable Expenses 1,457 — Accumulated ARO Accretion/Depreciation Adjustment 1,437 345 Deferred Marked-to-Market Losses 1,162 771 MISO Schedule 16 and 17 Deferred Administrative Costs — ND 823 576 MISO Schedule 16 and 17 Deferred Administrative Costs — MN 526 855 Deferred Conservation Improvement Program Costs 280 518 Plant Acquisition Costs 63 107
Total Regulatory Assets $94,725 $62,035
Regulatory Liabilities: Accumulated Reserve for Estimated Removal Costs $58,768 $57,787 Deferred Income Taxes 4,943 4,502 Unrecognized Transition Obligation, Prior Service Costs and Actuarial Gains on Other Postretirement
Benefits 834 — Deferred Marked-to-Market Gains — 271 Gain on Sale of Division Office Building 139 145
Total Regulatory Liabilities $64,684 $62,705
Net Regulatory Asset (Liability) Position $30,041 $ (670)

The Accumulated Reserve for Estimated Removal Costs is reduced for actual removal costs incurred.
All Deferred Marked-to-Market Losses recorded as of December 31, 2008 are related to forward purchases of energy scheduled for delivery prior to March 2009.
MISO Schedule 16 and 17 Deferred Administrative Costs — ND will be recovered over the next 36 months.
MISO Schedule 16 and 17 Deferred Administrative Costs — MN will be recovered over the next 23 months.
Plant Acquisition Costs will be amortized over the next 17 months.
Deferred Conservation Program Costs represent mandated conservation expenditures and incentives recoverable through retail electric rates over the next 18 months.
The remaining regulatory liabilities will be paid to electric customers over the next 30 years.
If for any reason, the Company’s regulated businesses cease to meet the criteria for application of SFAS No. 71 for all or part of their operations, the regulatory assets and liabilities that no longer meet such criteria would be removed from the consolidated balance sheet and included in the consolidated statement of income as an extraordinary expense or income item in the period in which the application of SFAS No. 71 ceases.
5. Forward Contracts Classified as Derivatives
Electricity Contracts
All of the electric utility’s wholesale purchases and sales of energy under forward contracts that do not meet the definition of capacity contracts are considered derivatives subject to mark-to-market accounting. The electric utility’s objective in entering into forward contracts for the purchase and sale of energy is to optimize the use of its generating and transmission facilities and leverage its knowledge of wholesale energy markets in the region to maximize financial returns for the benefit of both its customers and shareholders. The electric utility’s intent in entering into certain of these contracts is to settle them through the physical delivery of energy when physically possible and economically feasible. The electric utility also enters into certain contracts for trading purposes with the intent to profit from fluctuations in market prices through the timing of purchases and sales.
Electric revenues include $27,236,000 in 2008, $25,640,000 in 2007 and $25,965,000 in 2006 related to wholesale electric sales and net unrealized derivative gains on forward energy contracts and sales of financial transmission rights and daily settlements of virtual transactions in the MISO market, broken down as follows for the years ended December 31:
(in thousands) 2008 2007 2006
Wholesale Sales — Company—Owned Generation $ 23,708 $ 20,345 $ 23,130
Revenue from Settled Contracts at Market Prices 520,280 389,643 385,978 Market Cost of Settled Contracts (518,866) (387,682) (383,594)
Net Margins on Settled Contracts at Market 1,414 1,961 2,384
Marked-to-Market Gains on Settled Contracts 39,375 31,243 20,950 Marked-to-Market Losses on Settled Contracts (37,138) (28,541) (20,702)
Net Marked-to-Market Gain on Settled Contracts 2,237 2,702 248
Unrealized Marked-to-Market Gains on Open Contracts 405 5,117 2,215 Unrealized Marked-to-Market Losses on Open Contracts (528) (4,485) (2,012)
Net Unrealized Marked-to-Market (Loss) Gain on Open Contracts (123) 632 203
Wholesale Electric Revenue $ 27,236 $ 25,640 $ 25,965

The following tables show the effect of marking to market forward contracts for the purchase and sale of energy on the Company’s consolidated balance sheets:
The $123,000 in recognized but unrealized net losses on the forward energy purchases and sales marked to market as of December 31, 2008 is expected to be realized on settlement as scheduled in January and February of 2009.
Of the forward energy sales contracts that are marked to market as of December 31, 2008, 100% are offset by forward energy purchase contracts in terms of volumes and delivery periods.
Natural Gas Contracts
In order to limit its exposure to fluctuations in future prices of natural gas, IPH entered into contracts with its natural gas suppliers in August 2008 for the firm purchase of natural gas to cover portions of its anticipated natural gas needs in Ririe, Idaho and Center, Colorado from September 2008 through August 2009 at fixed prices. These contracts qualify for the normal purchase exception to mark-to-market accounting under SFAS 133, as amended by SFAS 138.
Foreign Currency Exchange Forward Windows
The Canadian operations of IPH records its sales and carries its receivables in U.S. dollars but pays its expenses for goods and services consumed in Canada in Canadian dollars. The payment of its bills in Canada requires the periodic exchange of U.S. currency for Canadian currency. In order to lock in acceptable exchange rates and hedge its exposure to future fluctuations in foreign currency exchange rates between the U.S. dollar and the Canadian dollar, IPH’s Canadian subsidiary entered into forward contracts for the exchange of U.S. dollars into Canadian dollars in 2008. Each monthly contract was for the exchange of $400,000 U.S. dollars for the amount of Canadian dollars stated in each contract. The total amounts of contracts settled in 2008 and outstanding on December 31, 2008 along with net exchange losses realized in 2008 and recognized as of December 31, 2008 are presented in the following table:
December 31, December 31,(in thousands) 2008 2007
Current Asset — Marked-to-Market Gain $ 405 $ 5,210 Regulatory Asset — Deferred Marked-to-Market Loss 1,162 771
Total Assets 1,567 5,981
Current Liability — Marked-to-Market Loss (1,690) (5,078)Regulatory Liability — Deferred Marked-to-Market Gain — (271)
Total Liabilities (1,690) (5,349)
Net Fair Value of Marked-to-Market Energy Contracts $ (123) $ 632
Year ended(in thousands) December 31, 2008
Fair Value at Beginning of Year $ 632 Amount Realized on Contracts Entered into in 2007 and Settled in 2008 (1,169)Changes in Fair Value of Contracts Entered into in 2007 537 Net Fair Value of Contracts Entered into in 2007 at Year End 2008 — Changes in Fair Value of Contracts Entered into in 2008 (123)Net Fair Value at End of Year $ (123)
(in thousands) Settlement Periods USD CAD
Contracts entered into in March 2008 April 2008 — December 2008 $3,600 $3,695 Net Mark-to-Market Losses Realized on Settlement April 2008 — December 2008 (224)
Contracts entered into in July 2008 August 2008 — July 2009 $4,800 $5,003 Net Mark-to-Market Losses Realized on Settlement August 2008 — December 2008 (203) Mark-to-Market Losses on Open Contracts at Year End 2008 January 2009 — July 2009 (401)
Contracts entered into in October 2008 January 2009 — October 2009 $4,000 $5,001 Mark-to-Market Gains on Open Contracts at Year End 2008 January 2009 — October 2009 112
Net Mark-to-Market Losses Realized on Settlement in 2008 $ (427) Net Mark-to-Market Losses Recognized on Open Contracts at Year End 2008 (289) Net Mark-to-Market Losses Recognized in 2008 $ (716)
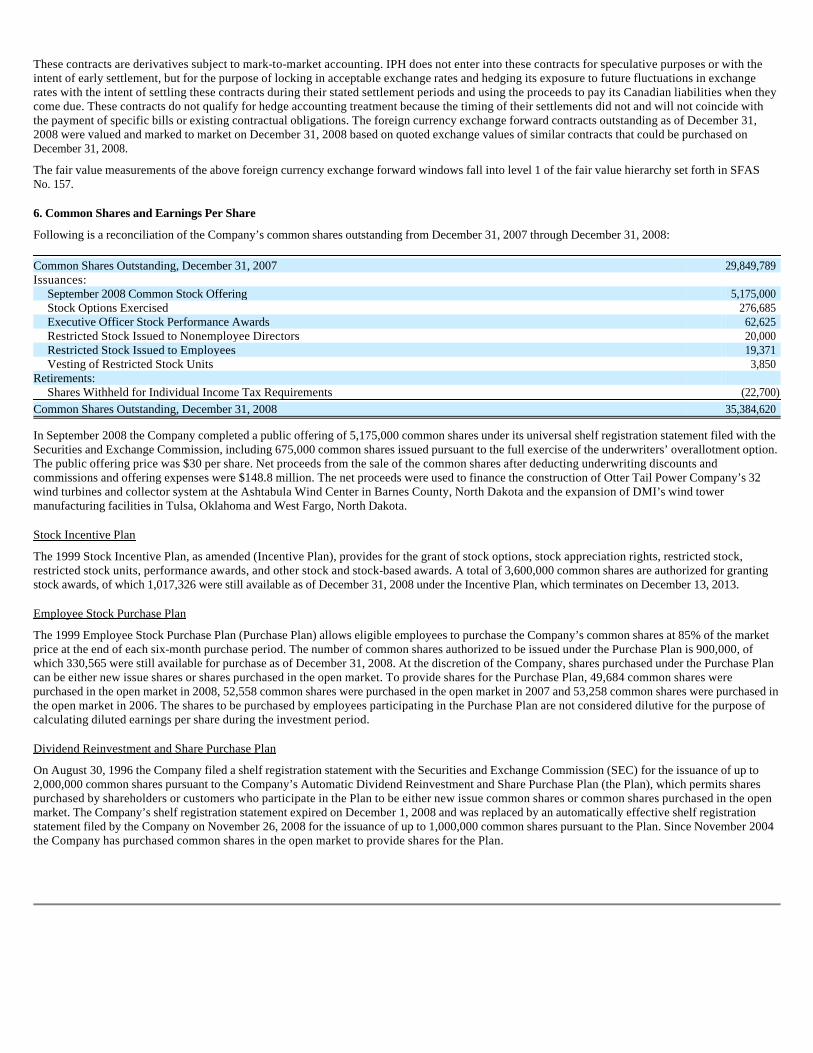
These contracts are derivatives subject to mark-to-market accounting. IPH does not enter into these contracts for speculative purposes or with the intent of early settlement, but for the purpose of locking in acceptable exchange rates and hedging its exposure to future fluctuations in exchange rates with the intent of settling these contracts during their stated settlement periods and using the proceeds to pay its Canadian liabilities when they come due. These contracts do not qualify for hedge accounting treatment because the timing of their settlements did not and will not coincide with the payment of specific bills or existing contractual obligations. The foreign currency exchange forward contracts outstanding as of December 31, 2008 were valued and marked to market on December 31, 2008 based on quoted exchange values of similar contracts that could be purchased on December 31, 2008.
The fair value measurements of the above foreign currency exchange forward windows fall into level 1 of the fair value hierarchy set forth in SFAS No. 157.
6. Common Shares and Earnings Per Share
Following is a reconciliation of the Company’s common shares outstanding from December 31, 2007 through December 31, 2008:
In September 2008 the Company completed a public offering of 5,175,000 common shares under its universal shelf registration statement filed with the Securities and Exchange Commission, including 675,000 common shares issued pursuant to the full exercise of the underwriters’ overallotment option. The public offering price was $30 per share. Net proceeds from the sale of the common shares after deducting underwriting discounts and commissions and offering expenses were $148.8 million. The net proceeds were used to finance the construction of Otter Tail Power Company’s 32 wind turbines and collector system at the Ashtabula Wind Center in Barnes County, North Dakota and the expansion of DMI’s wind tower manufacturing facilities in Tulsa, Oklahoma and West Fargo, North Dakota.
Stock Incentive Plan
The 1999 Stock Incentive Plan, as amended (Incentive Plan), provides for the grant of stock options, stock appreciation rights, restricted stock, restricted stock units, performance awards, and other stock and stock-based awards. A total of 3,600,000 common shares are authorized for granting stock awards, of which 1,017,326 were still available as of December 31, 2008 under the Incentive Plan, which terminates on December 13, 2013.
Employee Stock Purchase Plan
The 1999 Employee Stock Purchase Plan (Purchase Plan) allows eligible employees to purchase the Company’s common shares at 85% of the market price at the end of each six-month purchase period. The number of common shares authorized to be issued under the Purchase Plan is 900,000, of which 330,565 were still available for purchase as of December 31, 2008. At the discretion of the Company, shares purchased under the Purchase Plan can be either new issue shares or shares purchased in the open market. To provide shares for the Purchase Plan, 49,684 common shares were purchased in the open market in 2008, 52,558 common shares were purchased in the open market in 2007 and 53,258 common shares were purchased in the open market in 2006. The shares to be purchased by employees participating in the Purchase Plan are not considered dilutive for the purpose of calculating diluted earnings per share during the investment period.
Dividend Reinvestment and Share Purchase Plan
On August 30, 1996 the Company filed a shelf registration statement with the Securities and Exchange Commission (SEC) for the issuance of up to 2,000,000 common shares pursuant to the Company’s Automatic Dividend Reinvestment and Share Purchase Plan (the Plan), which permits shares purchased by shareholders or customers who participate in the Plan to be either new issue common shares or common shares purchased in the open market. The Company’s shelf registration statement expired on December 1, 2008 and was replaced by an automatically effective shelf registration statement filed by the Company on November 26, 2008 for the issuance of up to 1,000,000 common shares pursuant to the Plan. Since November 2004 the Company has purchased common shares in the open market to provide shares for the Plan.
Common Shares Outstanding, December 31, 2007 29,849,789 Issuances:
September 2008 Common Stock Offering 5,175,000 Stock Options Exercised 276,685 Executive Officer Stock Performance Awards 62,625 Restricted Stock Issued to Nonemployee Directors 20,000 Restricted Stock Issued to Employees 19,371 Vesting of Restricted Stock Units 3,850
Retirements: Shares Withheld for Individual Income Tax Requirements (22,700)
Common Shares Outstanding, December 31, 2008 35,384,620

Earnings Per Share
Basic earnings per common share are calculated by dividing earnings available for common shares by the weighted average number of common shares outstanding during the period. Diluted earnings per common share are calculated by adjusting outstanding shares, assuming conversion of all potentially dilutive stock options. Stock options with exercise prices greater than the market price are excluded from the calculation of diluted earnings per common share. Nonvested restricted shares granted to the Company’s directors and employees are considered dilutive for the purpose of calculating diluted earnings per share but are considered contingently returnable and not outstanding for the purpose of calculating basic earnings per share. Underlying shares related to nonvested restricted stock units granted to employees are considered dilutive for the purpose of calculating diluted earnings per share. Shares expected to be awarded for stock performance awards granted to executive officers are considered dilutive for the purpose of calculating diluted earnings per share.
Excluded from the calculation of diluted earnings per share are the following outstanding stock options which had exercise prices greater than the average market price for the years ended December 31, 2008, 2007 and 2006:
7. Share-Based Payments
Purchase Plan
The Purchase Plan allows employees through payroll withholding to purchase shares of the Company’s common stock at a 15% discount from the average market price on the last day of a six month investment period. Under SFAS No. 123 (revised 2004), Share-Based Payments (SFAS No. 123(R)), the Company is required to record compensation expense related to the 15% discount. The 15% discount resulted in compensation expense of $275,000 in 2008, $257,000 in 2007 and $235,000 in 2006. The 15% discount is not taxable to the employee and is not a deductible expense for tax purposes for the Company.
Stock Options Granted Under the Incentive Plan
Since the inception of the Incentive Plan in 1999, the Company has granted 2,041,500 options for the purchase of the Company’s common stock. All of the options granted had vested or were forfeited as of December 31, 2007. The exercise price of the options granted was the average market price of the Company’s common stock on the grant date. Under SFAS No. 123(R) accounting, compensation expense is recorded based on the estimated fair value of the options on their grant date using a fair-value option pricing model. Under SFAS No. 123(R) accounting, the fair value of the options granted has been recorded as compensation expense over the requisite service period (the vesting period of the options). The estimated fair value of all options granted under the Incentive Plan has been based on the Black-Scholes option pricing model.
Under the modified prospective application of SFAS No. 123(R) accounting requirements, the difference between the intrinsic value of nonvested options and the fair value of those options of $362,000 on January 1, 2006 was recognized on a straight-line basis as compensation expense over the remaining 16 months of the options vesting period. Accordingly, the Company recorded compensation expense of $91,000 in 2007 and $271,000 in 2006 related to options that were not vested as of January 1, 2006.
Presented below is a summary of the stock options activity:
Year Options Outstanding Range of Exercise Prices
2008 — NA2007 — NA2006 210,250 $29.74 — $31.34
Stock Option Activity 2008 2007 2006 Average Exercise Average Exercise Average Exercise Options Price Options Price Options Price
Outstanding, Beginning of Year 787,137 $ 25.73 1,091,238 $ 25.74 1,237,164 $ 25.58 Granted — — — — — — Exercised 276,685 25.23 298,601 25.73 107,458 22.88 Forfeited 2,750 27.11 5,500 28.85 38,468 28.60 Outstanding, End of Year 507,702 26.00 787,137 25.73 1,091,238 25.74
Exercisable, End of Year 507,702 26.00 787,137 25.73 1,049,713 25.69 Cash Received for Options Exercised $ 6,981,000 $ 7,682,000 $ 2,458,000 Fair Value of Options Granted During
Year none granted none granted none granted

The following table summarizes information about options outstanding as of December 31, 2008:
Restricted Stock Granted to Directors
Under the Incentive Plan, restricted shares of the Company’s common stock have been granted to members of the Company’s Board of Directors as a form of compensation. Under the application of SFAS No. 123(R) accounting requirements, compensation expense related to restricted shares is based on the fair value of the restricted shares on their grant dates. On April 14, 2008 the Company’s Board of Directors granted 20,000 shares of restricted stock to the Company’s nonemployee directors. The restricted shares vest 25% per year on April 8 of each year in the period 2009 through 2012 and are eligible for full dividend and voting rights. The grant date fair value of each share of restricted stock was $35.345 per share, the average market price on the date of grant.
Presented below is a summary of the status of directors’ restricted stock awards for the years ended December 31:
Restricted Stock Granted to Employees
Under the Incentive Plan, restricted shares of the Company’s common stock have been granted to employees as a form of compensation. Because of income tax withholding provisions in the restricted stock award agreements related to restricted stock granted to employees prior to 2006, the value of these grants is considered variable, which, under SFAS No. 123(R), requires the offsetting credit to compensation expense to be recorded as a liability. Under the modified prospective application of SFAS No. 123(R) accounting requirements and accounting rules for variable awards, compensation expense related to nonvested restricted shares granted to employees is recorded based on the estimated fair value of the restricted shares on their grant dates and adjusted for the estimated fair value of any nonvested restricted shares on each subsequent reporting date. The reporting date fair value of nonvested restricted shares granted prior to 2006 under this program is based on the average market value of the Company’s common stock on the reporting date—$23.15 on December 31, 2008.
In 2006, under SFAS No. 123(R), the amount of compensation expense recorded related to nonvested restricted shares granted to employees was based on the estimated fair value of the restricted stock grants. Under SFAS 123(R) accounting, a current liability account is credited when compensation expense is recorded. Accumulated liabilities related to nonvested restricted shares issued to employees under this program prior to 2006 will be reversed and credited to the Premium on Common Shares equity account as the shares vest.
The fair value of restricted shares issued under the revised restricted stock award agreements is not considered a liability under SFAS No. 123(R), so compensation expense related to awards granted is based on their grant-date fair value and recognized over the vesting period of the awards with the offsetting credit charged directly to equity.
On April 14, 2008 the Company’s Board of Directors granted 17,600 shares of restricted stock to the Company’s executive officers and 1,771 shares of restricted stock to a key employee under the Incentive Plan. The restricted shares vest 25% per year on April 8 of each year in the period 2009 through 2012 and are eligible for full dividend and voting rights. The grant date fair value of each share of restricted stock was $35.345 per share, the average market price on the date of grant.
Options Outstanding and Exercisable Weighted-Average Outstanding and Remaining Range of Exercisable as of Contractual Life Weighted-Average Exercise Prices 12/31/08 (yrs) Exercise price
$18.80-$21.94 87,242 1.1 $ 19.69 $21.95-$25.07 28,300 6.3 24.93 $25.08-$28.21 307,010 2.9 26.48 $28.22-$31.34 85,150 3.2 31.06
Directors’ Restricted Stock Awards 2008 2007 2006 Weighted Average Weighted Average Weighted Average Grant-Date Fair Grant-Date Fair Grant-Date Fair Shares Value Shares Value Shares Value
Nonvested, Beginning of Year 34,100 $ 30.80 32,775 $ 27.27 27,000 $ 26.32 Granted 20,000 35.345 15,200 35.04 19,800 28.24 Vested 14,800 29.92 13,875 27.10 14,025 26.82 Forfeited — — — Nonvested, End of Year 39,300 33.45 34,100 30.80 32,775 27.27
Compensation Expense Recognized $ 461,000 $ 454,000 $ 401,000 Fair Value of Shares Vested in Year 443,000 376,000 376,000

Presented below is a summary of the status of employees’ restricted stock awards for the years ended December 31:
Restricted Stock Units Granted to Employees
On April 14, 2008 the Company’s Board of Directors granted 26,050 restricted stock units to key employees under the Incentive Plan payable in common shares on April 8, 2012, the date the units vest. The grant date fair value of each restricted stock unit was $30.81 per share. Also on April 14, 2008 the Company’s Board of Directors approved the award of 600 restricted stock units to be granted effective July 1, 2008 for another key employee under the Incentive Plan payable in common shares on July 1, 2011, the date the units vest. The grant date fair value of these restricted stock units was $35.55 per share. The weighted average contractual term of stock units outstanding as of December 31, 2008 is 2.6 years.
Presented below is a summary of the status of employees’ restricted stock unit awards for the years ended December 31:
Stock Performance Awards granted to Executive Officers
The Compensation Committee of the Company’s Board of Directors has approved stock performance award agreements under the Incentive Plan for the Company’s executive officers. Under these agreements, the officers could be awarded shares of the Company’s common stock based on the Company’s total shareholder return relative to that of its peer group of companies in the Edison Electric Institute (EEI) Index over a three-year period beginning on January 1 of the year the awards are granted. The number of shares earned, if any, will be awarded and issued at the end of each three-year performance measurement period. The participants have no voting or dividend rights under these award agreements until the shares are issued at the end of the performance measurement period. Under SFAS No. 123(R) accounting requirements, the amount of compensation expense recorded related to awards granted is based on the estimated grant-date fair value of the awards as determined under a Monte Carlo valuation method.
On April 14, 2008 the Company’s Board of Directors granted performance share awards to the Company’s executive officers under the Incentive Plan for the 2008-2010 performance measurement period.
Employees’ Restricted Stock Awards 2008 2007 2006 Weighted Average Weighted Average Weighted Average Shares Fair Value Shares Fair Value Shares Fair Value
Nonvested, Beginning of Year 24,058 $ 35.46 31,666 $ 31.47 72,974 $ 28.91 Granted 19,371 35.345 17,300 35.82 — Variable/Liability Awards Vested 4,808 34.85 24,608 35.09 41,308 28.98 Nonvariable Awards Vested 4,475 35.80 300 35.30 — Forfeited — — — Nonvested, End of Year 34,146 34.72 24,058 35.46 31,666 31.47
Compensation Expense Recognized $ 434,000 $ 549,000 $ 815,000 Fair Value of Variable Awards
Vested/Liability Paid 168,000 863,000 1,197,000 Fair Value of Nonvariable Awards
Vested 160,000 11,000 —
Employees' Restricted Stock Unit Awards 2008 2007 2006 Weighted Average Weighted Average Weighted Average Restricted Stock Grant-Date Fair Restricted Stock Grant-Date Fair Restricted Stock Grant-Date Fair Units Value Units Value Units Value
Nonvested, Beginning of Year 55,480 $ 26.66 38,615 $ 24.65 — $ — Granted 26,650 30.92 23,450 30.07 47,425 25.41 Converted 3,850 25.93 4,850 26.95 7,450 29.55 Forfeited 4,695 28.07 1,735 27.03 1,360 24.36 Nonvested, End of Year 73,585 28.13 55,480 26.66 38,615 24.65
Compensation Expense Recognized $ 535,000 $ 383,000 $ 427,000 Fair Value of Units Converted in Year 100,000 131,000 220,000
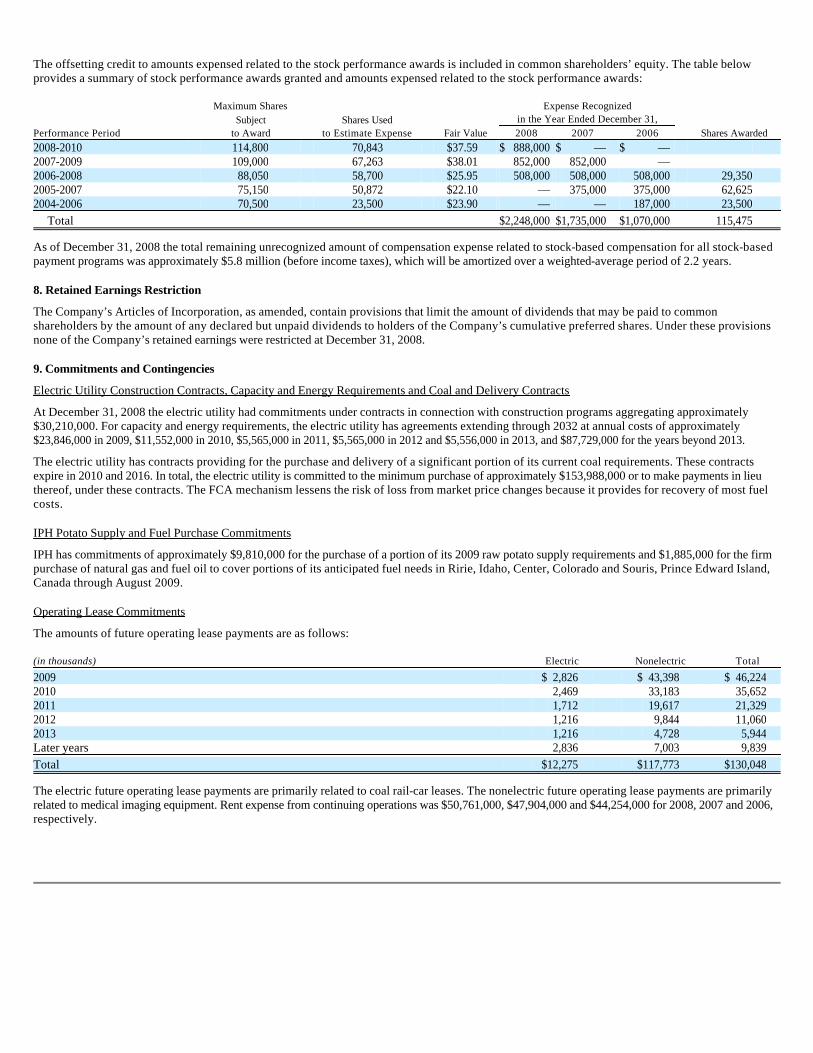
The offsetting credit to amounts expensed related to the stock performance awards is included in common shareholders’ equity. The table below provides a summary of stock performance awards granted and amounts expensed related to the stock performance awards:
As of December 31, 2008 the total remaining unrecognized amount of compensation expense related to stock-based compensation for all stock-based payment programs was approximately $5.8 million (before income taxes), which will be amortized over a weighted-average period of 2.2 years.
8. Retained Earnings Restriction
The Company’s Articles of Incorporation, as amended, contain provisions that limit the amount of dividends that may be paid to common shareholders by the amount of any declared but unpaid dividends to holders of the Company’s cumulative preferred shares. Under these provisions none of the Company’s retained earnings were restricted at December 31, 2008.
9. Commitments and Contingencies
Electric Utility Construction Contracts, Capacity and Energy Requirements and Coal and Delivery Contracts
At December 31, 2008 the electric utility had commitments under contracts in connection with construction programs aggregating approximately $30,210,000. For capacity and energy requirements, the electric utility has agreements extending through 2032 at annual costs of approximately $23,846,000 in 2009, $11,552,000 in 2010, $5,565,000 in 2011, $5,565,000 in 2012 and $5,556,000 in 2013, and $87,729,000 for the years beyond 2013.
The electric utility has contracts providing for the purchase and delivery of a significant portion of its current coal requirements. These contracts expire in 2010 and 2016. In total, the electric utility is committed to the minimum purchase of approximately $153,988,000 or to make payments in lieu thereof, under these contracts. The FCA mechanism lessens the risk of loss from market price changes because it provides for recovery of most fuel costs.
IPH Potato Supply and Fuel Purchase Commitments
IPH has commitments of approximately $9,810,000 for the purchase of a portion of its 2009 raw potato supply requirements and $1,885,000 for the firm purchase of natural gas and fuel oil to cover portions of its anticipated fuel needs in Ririe, Idaho, Center, Colorado and Souris, Prince Edward Island, Canada through August 2009.
Operating Lease Commitments
The amounts of future operating lease payments are as follows:
The electric future operating lease payments are primarily related to coal rail-car leases. The nonelectric future operating lease payments are primarily related to medical imaging equipment. Rent expense from continuing operations was $50,761,000, $47,904,000 and $44,254,000 for 2008, 2007 and 2006, respectively.
Maximum Shares Expense Recognized Subject Shares Used in the Year Ended December 31, Performance Period to Award to Estimate Expense Fair Value 2008 2007 2006 Shares Awarded
2008-2010 114,800 70,843 $37.59 $ 888,000 $ — $ — 2007-2009 109,000 67,263 $38.01 852,000 852,000 — 2006-2008 88,050 58,700 $25.95 508,000 508,000 508,000 29,350 2005-2007 75,150 50,872 $22.10 — 375,000 375,000 62,625 2004-2006 70,500 23,500 $23.90 — — 187,000 23,500
Total $2,248,000 $1,735,000 $1,070,000 115,475
(in thousands) Electric Nonelectric Total
2009 $ 2,826 $ 43,398 $ 46,224 2010 2,469 33,183 35,652 2011 1,712 19,617 21,329 2012 1,216 9,844 11,060 2013 1,216 4,728 5,944 Later years 2,836 7,003 9,839 Total $12,275 $117,773 $130,048
Dealer Floor Plan Financing
Under ShoreMaster’s floor plan financing agreement with GE Commercial Distribution Finance Corporation (CDF), ShoreMaster is required to repurchase new and unused inventory repossessed from ShoreMaster’s dealers by CDF to satisfy dealer obligations to CDF. ShoreMaster has agreed to unconditionally guarantee to CDF all current and future liabilities which any dealer owes to CDF under this agreement. Any amounts due under this guaranty will be payable despite impairment or unenforceability of CDF’s security interest with respect to inventory that may prevent CDF from repossessing the inventory. The aggregate total of amounts owed by dealers to CDF under this agreement was $5.0 million on December 31, 2008. ShoreMaster has incurred no losses under this agreement. The Company believes current available cash and cash generated from operations provide sufficient funding in the event there is a requirement to perform under this agreement. CDF has notified ShoreMaster it is exercising its right under this agreement to terminate the agreement effective February 28, 2009. The termination of the agreement will have no affect on ShoreMaster’s obligations to CDF for any products financed, advances made or approvals granted by CDF under the agreement prior to the effective termination date. Additionally, ShoreMaster is liable for any expenses incurred by CDF before or after the effective termination date in connection with the collection of any amounts or other charges as set forth in the agreement.
Sierra Club Complaint
On June 10, 2008 the Sierra Club filed a complaint in the U.S. District Court for the District of South Dakota (Northern Division) against the Company and two other co-owners of Big Stone Generating Station (Big Stone). The complaint alleges certain violations of the Prevention of Significant Deterioration and New Source Performance Standards (NSPS) provisions of the Clean Air Act and certain violations of the South Dakota State Implementation Plan (South Dakota SIP). The action further alleges the defendants modified and operated Big Stone without obtaining the appropriate permits, without meeting certain emissions limits and NSPS requirements and without installing appropriate emission control technology, all allegedly in violation of the Clean Air Act and the South Dakota SIP. The Sierra Club alleges the defendants’ actions have contributed to air pollution and visibility impairment and have increased the risk of adverse health effects and environmental damage. The Sierra Club seeks both declaratory and injunctive relief to bring the defendants into compliance with the Clean Air Act and the South Dakota SIP and to require the defendants to remedy the alleged violations. The Sierra Club also seeks unspecified civil penalties, including a beneficial mitigation project. The Company believes these claims are without merit and that Big Stone has been and is being operated in compliance with the Clean Air Act and the South Dakota SIP. The ultimate outcome of these matters cannot be determined at this time.
Federal Power Act Complaint
On August 29, 2008 Renewable Energy System Americas, Inc. (RES), a developer of wind generation and PEAK Wind Development, LLC (PEAK Wind), a group of landowners in Barnes County, North Dakota, filed a complaint with the FERC alleging that the electric utility and Minnkota Power Cooperative, Inc. (Minnkota) had acted together in violation of the Federal Power Act (FPA) to deny RES/PEAK Wind access to the Pillsbury Line, an interconnection facility which Minnkota owns to interconnect generation projects being developed by the electric utility and NextEra Energy Resources, Inc.(fka FPL Energy, Inc.) (NextEra). RES/PEAK Wind asked that (1) the FERC order Minnkota to interconnect its Glacier Ridge project to the Pillsbury Line, or in the alternative, (2) the FERC direct MISO to interconnect the Glacier Ridge project to the Pillsbury Line. RES and Peak Wind also requested that the electric utility, Minnkota and NextEra pay any costs associated with interconnecting the Glacier Ridge Project to the MISO transmission system which would result from the interconnection of the Pillsbury Line to the Minnkota transmission system, and that the FERC assess civil penalties against the electric utility. The electric utility answered the Complaint on September 29, 2008, denying the allegations of RES and PEAK Wind and requesting that the FERC dismiss the Complaint. On October 14, 2008, RES and PEAK Wind filed an Answer to the electric utility’s Answer and, restated the allegations included in the initial Complaint. RES and PEAK Wind also added a request that the FERC rescind both the electric utility’s waiver from the FERC Standards of Conduct and its market-based rate authority. On October 28, 2008, the electric utility filed a Reply, denying the allegations made by RES and PEAK Wind in its Answer. By Order issued on December 19, 2008, the FERC set the Complaint for hearing and established settlement procedures. The parties are engaged in settlement discussions. The Company believes the claims that the electric utility has violated the FPA are without merit. The ultimate outcome of this matter cannot be determined at this time.
Product Recall
Aviva Sports, Inc. (Aviva), a subsidiary of ShoreMaster, markets a variety of consumer products to catalog companies and internet based retailers. Some of these products are regulated by the U.S. Consumer Product Safety Commission (CPSC). On February 3, 2009 Aviva received a report of consumer contacts from a catalog customer related to one of Aviva’s trampoline products. Aviva has not received any personal injury claims or lawsuits related to this product. Aviva submitted notification of the complaints to the CPSC and voluntarily agreed to undertake a recall of approximately 12,000 of the trampoline products. The Company does not expect the costs of this recall to have a material effect on its consolidated financial position or results of operations.
The Company is a party to litigation arising in the normal course of business. The Company regularly analyzes current information and, as necessary, provides accruals for liabilities that are probable of occurring and that can be reasonably estimated. The Company believes the effect on its consolidated results of operations, financial position and cash flows, if any, for the disposition of all matters pending as of December 31, 2008 will not be material.
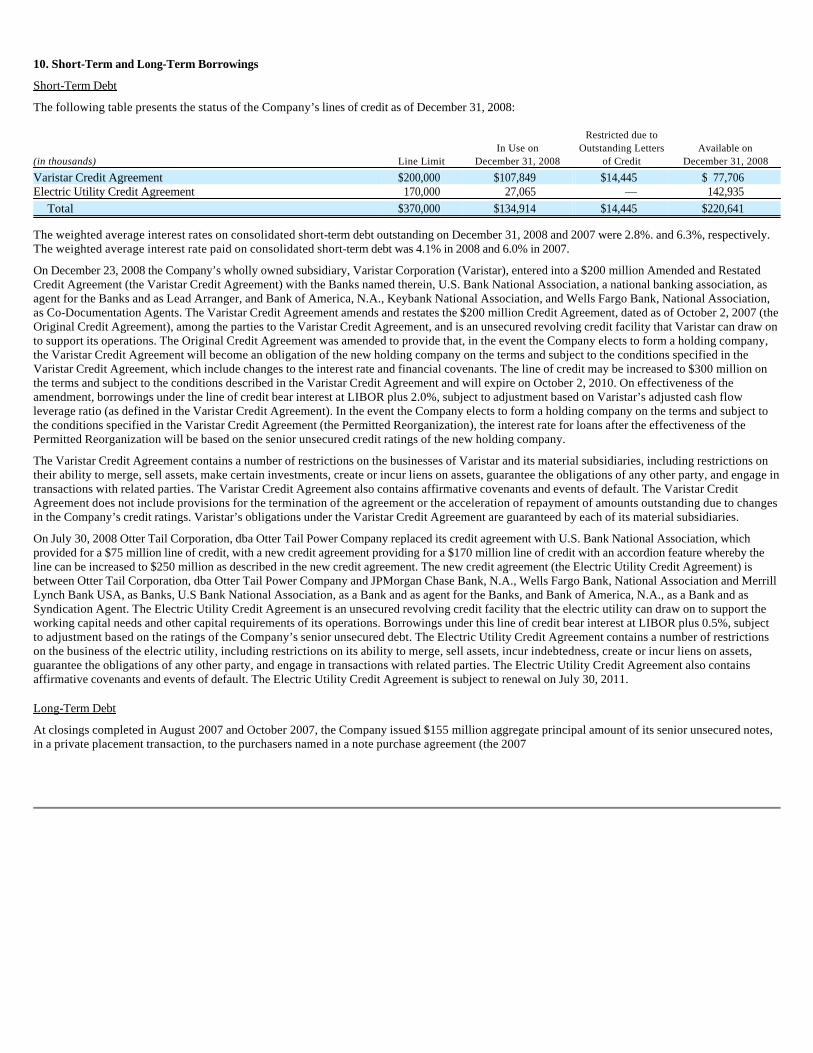
10. Short-Term and Long-Term Borrowings
Short-Term Debt
The following table presents the status of the Company’s lines of credit as of December 31, 2008:
The weighted average interest rates on consolidated short-term debt outstanding on December 31, 2008 and 2007 were 2.8%. and 6.3%, respectively. The weighted average interest rate paid on consolidated short-term debt was 4.1% in 2008 and 6.0% in 2007.
On December 23, 2008 the Company’s wholly owned subsidiary, Varistar Corporation (Varistar), entered into a $200 million Amended and Restated Credit Agreement (the Varistar Credit Agreement) with the Banks named therein, U.S. Bank National Association, a national banking association, as agent for the Banks and as Lead Arranger, and Bank of America, N.A., Keybank National Association, and Wells Fargo Bank, National Association, as Co-Documentation Agents. The Varistar Credit Agreement amends and restates the $200 million Credit Agreement, dated as of October 2, 2007 (the Original Credit Agreement), among the parties to the Varistar Credit Agreement, and is an unsecured revolving credit facility that Varistar can draw on to support its operations. The Original Credit Agreement was amended to provide that, in the event the Company elects to form a holding company, the Varistar Credit Agreement will become an obligation of the new holding company on the terms and subject to the conditions specified in the Varistar Credit Agreement, which include changes to the interest rate and financial covenants. The line of credit may be increased to $300 million on the terms and subject to the conditions described in the Varistar Credit Agreement and will expire on October 2, 2010. On effectiveness of the amendment, borrowings under the line of credit bear interest at LIBOR plus 2.0%, subject to adjustment based on Varistar’s adjusted cash flow leverage ratio (as defined in the Varistar Credit Agreement). In the event the Company elects to form a holding company on the terms and subject to the conditions specified in the Varistar Credit Agreement (the Permitted Reorganization), the interest rate for loans after the effectiveness of the Permitted Reorganization will be based on the senior unsecured credit ratings of the new holding company.
The Varistar Credit Agreement contains a number of restrictions on the businesses of Varistar and its material subsidiaries, including restrictions on their ability to merge, sell assets, make certain investments, create or incur liens on assets, guarantee the obligations of any other party, and engage in transactions with related parties. The Varistar Credit Agreement also contains affirmative covenants and events of default. The Varistar Credit Agreement does not include provisions for the termination of the agreement or the acceleration of repayment of amounts outstanding due to changes in the Company’s credit ratings. Varistar’s obligations under the Varistar Credit Agreement are guaranteed by each of its material subsidiaries.
On July 30, 2008 Otter Tail Corporation, dba Otter Tail Power Company replaced its credit agreement with U.S. Bank National Association, which provided for a $75 million line of credit, with a new credit agreement providing for a $170 million line of credit with an accordion feature whereby the line can be increased to $250 million as described in the new credit agreement. The new credit agreement (the Electric Utility Credit Agreement) is between Otter Tail Corporation, dba Otter Tail Power Company and JPMorgan Chase Bank, N.A., Wells Fargo Bank, National Association and Merrill Lynch Bank USA, as Banks, U.S Bank National Association, as a Bank and as agent for the Banks, and Bank of America, N.A., as a Bank and as Syndication Agent. The Electric Utility Credit Agreement is an unsecured revolving credit facility that the electric utility can draw on to support the working capital needs and other capital requirements of its operations. Borrowings under this line of credit bear interest at LIBOR plus 0.5%, subject to adjustment based on the ratings of the Company’s senior unsecured debt. The Electric Utility Credit Agreement contains a number of restrictions on the business of the electric utility, including restrictions on its ability to merge, sell assets, incur indebtedness, create or incur liens on assets, guarantee the obligations of any other party, and engage in transactions with related parties. The Electric Utility Credit Agreement also contains affirmative covenants and events of default. The Electric Utility Credit Agreement is subject to renewal on July 30, 2011.
Long-Term Debt
At closings completed in August 2007 and October 2007, the Company issued $155 million aggregate principal amount of its senior unsecured notes, in a private placement transaction, to the purchasers named in a note purchase agreement (the 2007
Restricted due to In Use on Outstanding Letters Available on(in thousands) Line Limit December 31, 2008 of Credit December 31, 2008
Varistar Credit Agreement $200,000 $107,849 $14,445 $ 77,706 Electric Utility Credit Agreement 170,000 27,065 — 142,935
Total $370,000 $134,914 $14,445 $220,641
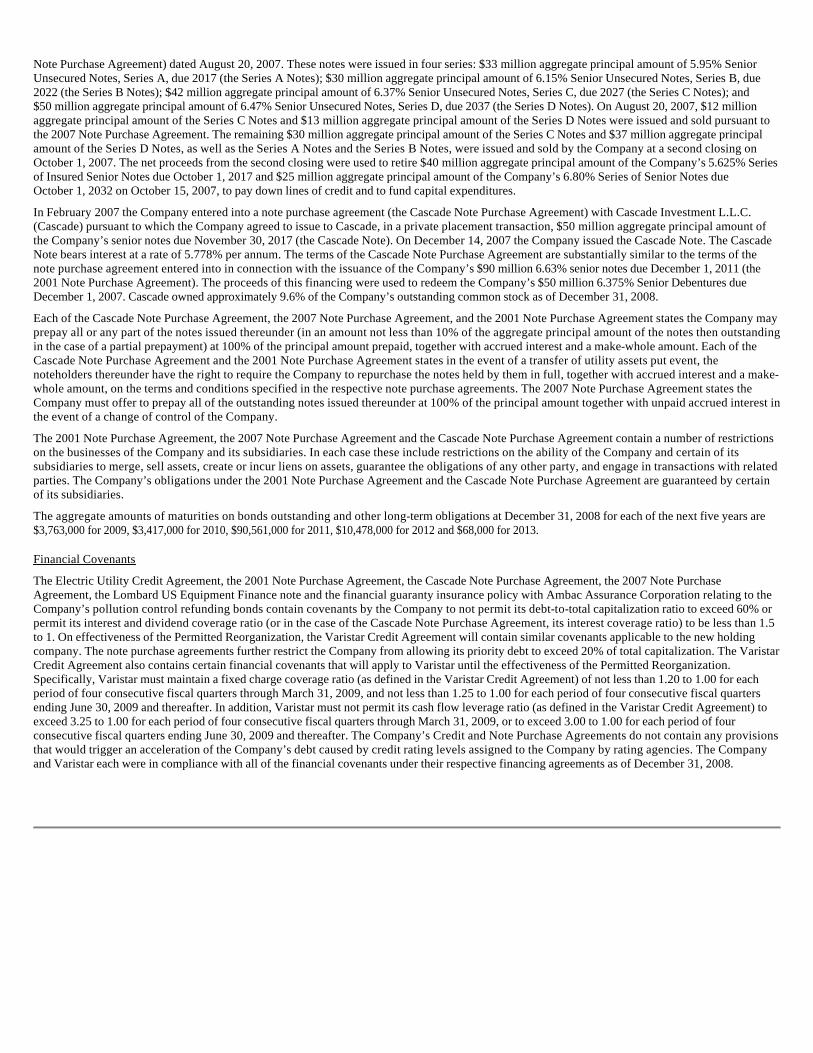
Note Purchase Agreement) dated August 20, 2007. These notes were issued in four series: $33 million aggregate principal amount of 5.95% Senior Unsecured Notes, Series A, due 2017 (the Series A Notes); $30 million aggregate principal amount of 6.15% Senior Unsecured Notes, Series B, due 2022 (the Series B Notes); $42 million aggregate principal amount of 6.37% Senior Unsecured Notes, Series C, due 2027 (the Series C Notes); and $50 million aggregate principal amount of 6.47% Senior Unsecured Notes, Series D, due 2037 (the Series D Notes). On August 20, 2007, $12 million aggregate principal amount of the Series C Notes and $13 million aggregate principal amount of the Series D Notes were issued and sold pursuant to the 2007 Note Purchase Agreement. The remaining $30 million aggregate principal amount of the Series C Notes and $37 million aggregate principal amount of the Series D Notes, as well as the Series A Notes and the Series B Notes, were issued and sold by the Company at a second closing on October 1, 2007. The net proceeds from the second closing were used to retire $40 million aggregate principal amount of the Company’s 5.625% Series of Insured Senior Notes due October 1, 2017 and $25 million aggregate principal amount of the Company’s 6.80% Series of Senior Notes due October 1, 2032 on October 15, 2007, to pay down lines of credit and to fund capital expenditures.
In February 2007 the Company entered into a note purchase agreement (the Cascade Note Purchase Agreement) with Cascade Investment L.L.C. (Cascade) pursuant to which the Company agreed to issue to Cascade, in a private placement transaction, $50 million aggregate principal amount of the Company’s senior notes due November 30, 2017 (the Cascade Note). On December 14, 2007 the Company issued the Cascade Note. The Cascade Note bears interest at a rate of 5.778% per annum. The terms of the Cascade Note Purchase Agreement are substantially similar to the terms of the note purchase agreement entered into in connection with the issuance of the Company’s $90 million 6.63% senior notes due December 1, 2011 (the 2001 Note Purchase Agreement). The proceeds of this financing were used to redeem the Company’s $50 million 6.375% Senior Debentures due December 1, 2007. Cascade owned approximately 9.6% of the Company’s outstanding common stock as of December 31, 2008.
Each of the Cascade Note Purchase Agreement, the 2007 Note Purchase Agreement, and the 2001 Note Purchase Agreement states the Company may prepay all or any part of the notes issued thereunder (in an amount not less than 10% of the aggregate principal amount of the notes then outstanding in the case of a partial prepayment) at 100% of the principal amount prepaid, together with accrued interest and a make-whole amount. Each of the Cascade Note Purchase Agreement and the 2001 Note Purchase Agreement states in the event of a transfer of utility assets put event, the noteholders thereunder have the right to require the Company to repurchase the notes held by them in full, together with accrued interest and a make-whole amount, on the terms and conditions specified in the respective note purchase agreements. The 2007 Note Purchase Agreement states the Company must offer to prepay all of the outstanding notes issued thereunder at 100% of the principal amount together with unpaid accrued interest in the event of a change of control of the Company.
The 2001 Note Purchase Agreement, the 2007 Note Purchase Agreement and the Cascade Note Purchase Agreement contain a number of restrictions on the businesses of the Company and its subsidiaries. In each case these include restrictions on the ability of the Company and certain of its subsidiaries to merge, sell assets, create or incur liens on assets, guarantee the obligations of any other party, and engage in transactions with related parties. The Company’s obligations under the 2001 Note Purchase Agreement and the Cascade Note Purchase Agreement are guaranteed by certain of its subsidiaries.
The aggregate amounts of maturities on bonds outstanding and other long-term obligations at December 31, 2008 for each of the next five years are $3,763,000 for 2009, $3,417,000 for 2010, $90,561,000 for 2011, $10,478,000 for 2012 and $68,000 for 2013.
Financial Covenants
The Electric Utility Credit Agreement, the 2001 Note Purchase Agreement, the Cascade Note Purchase Agreement, the 2007 Note Purchase Agreement, the Lombard US Equipment Finance note and the financial guaranty insurance policy with Ambac Assurance Corporation relating to the Company’s pollution control refunding bonds contain covenants by the Company to not permit its debt-to-total capitalization ratio to exceed 60% or permit its interest and dividend coverage ratio (or in the case of the Cascade Note Purchase Agreement, its interest coverage ratio) to be less than 1.5 to 1. On effectiveness of the Permitted Reorganization, the Varistar Credit Agreement will contain similar covenants applicable to the new holding company. The note purchase agreements further restrict the Company from allowing its priority debt to exceed 20% of total capitalization. The Varistar Credit Agreement also contains certain financial covenants that will apply to Varistar until the effectiveness of the Permitted Reorganization. Specifically, Varistar must maintain a fixed charge coverage ratio (as defined in the Varistar Credit Agreement) of not less than 1.20 to 1.00 for each period of four consecutive fiscal quarters through March 31, 2009, and not less than 1.25 to 1.00 for each period of four consecutive fiscal quarters ending June 30, 2009 and thereafter. In addition, Varistar must not permit its cash flow leverage ratio (as defined in the Varistar Credit Agreement) to exceed 3.25 to 1.00 for each period of four consecutive fiscal quarters through March 31, 2009, or to exceed 3.00 to 1.00 for each period of four consecutive fiscal quarters ending June 30, 2009 and thereafter. The Company’s Credit and Note Purchase Agreements do not contain any provisions that would trigger an acceleration of the Company’s debt caused by credit rating levels assigned to the Company by rating agencies. The Company and Varistar each were in compliance with all of the financial covenants under their respective financing agreements as of December 31, 2008.
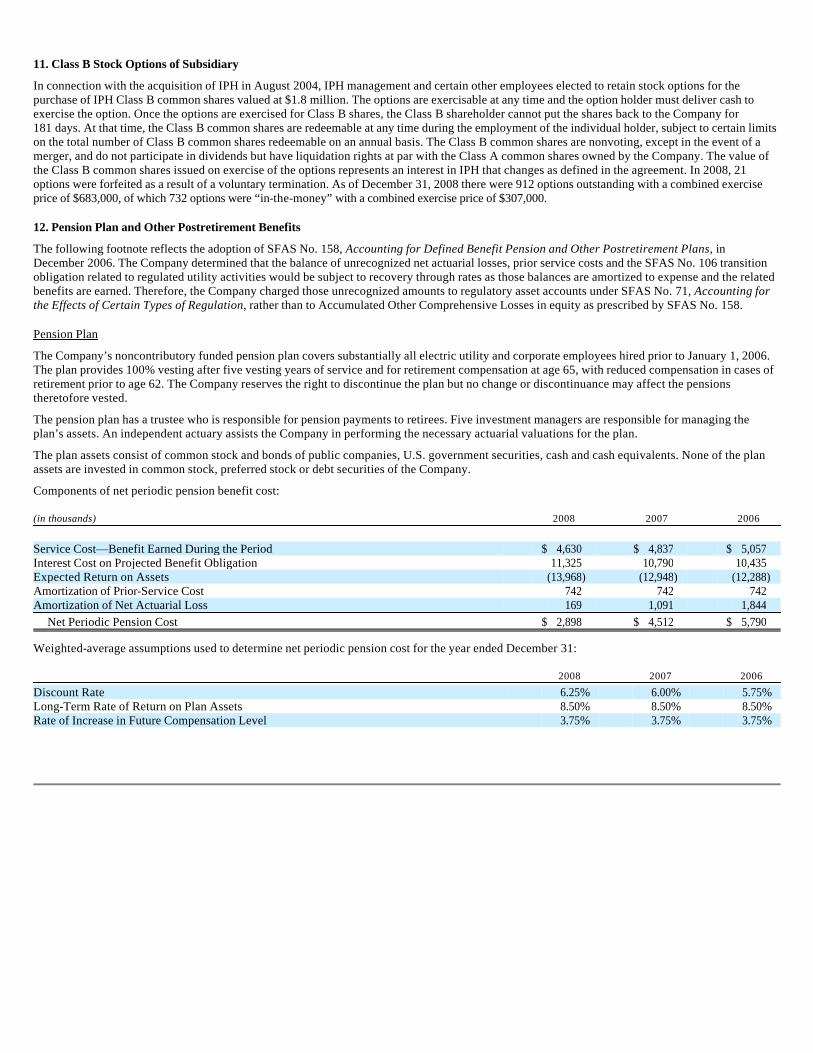
11. Class B Stock Options of Subsidiary
In connection with the acquisition of IPH in August 2004, IPH management and certain other employees elected to retain stock options for the purchase of IPH Class B common shares valued at $1.8 million. The options are exercisable at any time and the option holder must deliver cash to exercise the option. Once the options are exercised for Class B shares, the Class B shareholder cannot put the shares back to the Company for 181 days. At that time, the Class B common shares are redeemable at any time during the employment of the individual holder, subject to certain limits on the total number of Class B common shares redeemable on an annual basis. The Class B common shares are nonvoting, except in the event of a merger, and do not participate in dividends but have liquidation rights at par with the Class A common shares owned by the Company. The value of the Class B common shares issued on exercise of the options represents an interest in IPH that changes as defined in the agreement. In 2008, 21 options were forfeited as a result of a voluntary termination. As of December 31, 2008 there were 912 options outstanding with a combined exercise price of $683,000, of which 732 options were “in-the-money” with a combined exercise price of $307,000.
12. Pension Plan and Other Postretirement Benefits
The following footnote reflects the adoption of SFAS No. 158, Accounting for Defined Benefit Pension and Other Postretirement Plans, in December 2006. The Company determined that the balance of unrecognized net actuarial losses, prior service costs and the SFAS No. 106 transition obligation related to regulated utility activities would be subject to recovery through rates as those balances are amortized to expense and the related benefits are earned. Therefore, the Company charged those unrecognized amounts to regulatory asset accounts under SFAS No. 71, Accounting for the Effects of Certain Types of Regulation, rather than to Accumulated Other Comprehensive Losses in equity as prescribed by SFAS No. 158.
Pension Plan
The Company’s noncontributory funded pension plan covers substantially all electric utility and corporate employees hired prior to January 1, 2006. The plan provides 100% vesting after five vesting years of service and for retirement compensation at age 65, with reduced compensation in cases of retirement prior to age 62. The Company reserves the right to discontinue the plan but no change or discontinuance may affect the pensions theretofore vested.
The pension plan has a trustee who is responsible for pension payments to retirees. Five investment managers are responsible for managing the plan’s assets. An independent actuary assists the Company in performing the necessary actuarial valuations for the plan.
The plan assets consist of common stock and bonds of public companies, U.S. government securities, cash and cash equivalents. None of the plan assets are invested in common stock, preferred stock or debt securities of the Company.
Components of net periodic pension benefit cost:
Weighted-average assumptions used to determine net periodic pension cost for the year ended December 31:
(in thousands) 2008 2007 2006
Service Cost—Benefit Earned During the Period $ 4,630 $ 4,837 $ 5,057 Interest Cost on Projected Benefit Obligation 11,325 10,790 10,435 Expected Return on Assets (13,968) (12,948) (12,288)Amortization of Prior-Service Cost 742 742 742 Amortization of Net Actuarial Loss 169 1,091 1,844
Net Periodic Pension Cost $ 2,898 $ 4,512 $ 5,790
2008 2007 2006
Discount Rate 6.25% 6.00% 5.75%Long-Term Rate of Return on Plan Assets 8.50% 8.50% 8.50%Rate of Increase in Future Compensation Level 3.75% 3.75% 3.75%
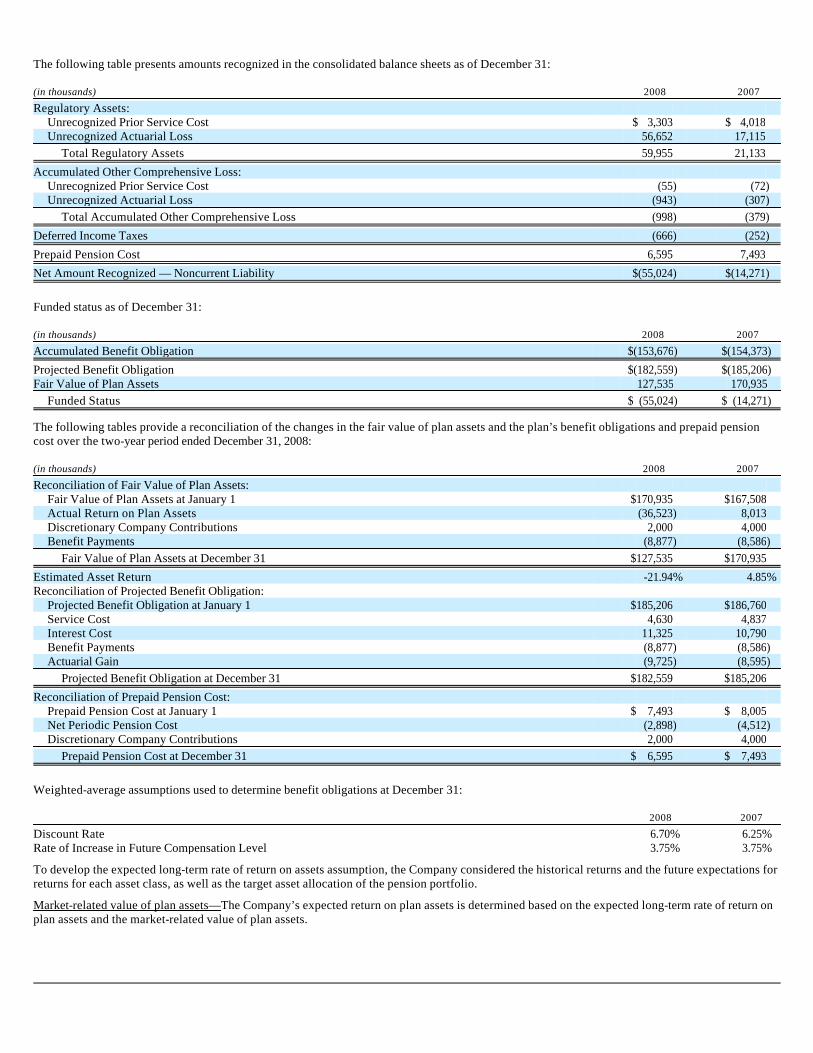
The following table presents amounts recognized in the consolidated balance sheets as of December 31:
Funded status as of December 31:
The following tables provide a reconciliation of the changes in the fair value of plan assets and the plan’s benefit obligations and prepaid pension cost over the two-year period ended December 31, 2008:
Weighted-average assumptions used to determine benefit obligations at December 31:
To develop the expected long-term rate of return on assets assumption, the Company considered the historical returns and the future expectations for returns for each asset class, as well as the target asset allocation of the pension portfolio.
Market-related value of plan assets—The Company’s expected return on plan assets is determined based on the expected long-term rate of return on plan assets and the market-related value of plan assets.
(in thousands) 2008 2007
Regulatory Assets: Unrecognized Prior Service Cost $ 3,303 $ 4,018 Unrecognized Actuarial Loss 56,652 17,115
Total Regulatory Assets 59,955 21,133
Accumulated Other Comprehensive Loss: Unrecognized Prior Service Cost (55) (72)Unrecognized Actuarial Loss (943) (307)
Total Accumulated Other Comprehensive Loss (998) (379)
Deferred Income Taxes (666) (252)
Prepaid Pension Cost 6,595 7,493
Net Amount Recognized — Noncurrent Liability $(55,024) $(14,271)
(in thousands) 2008 2007
Accumulated Benefit Obligation $(153,676) $(154,373)
Projected Benefit Obligation $(182,559) $(185,206)Fair Value of Plan Assets 127,535 170,935
Funded Status $ (55,024) $ (14,271)
(in thousands) 2008 2007
Reconciliation of Fair Value of Plan Assets: Fair Value of Plan Assets at January 1 $170,935 $167,508 Actual Return on Plan Assets (36,523) 8,013 Discretionary Company Contributions 2,000 4,000 Benefit Payments (8,877) (8,586)
Fair Value of Plan Assets at December 31 $127,535 $170,935
Estimated Asset Return -21.94% 4.85%Reconciliation of Projected Benefit Obligation:
Projected Benefit Obligation at January 1 $185,206 $186,760 Service Cost 4,630 4,837 Interest Cost 11,325 10,790 Benefit Payments (8,877) (8,586)Actuarial Gain (9,725) (8,595)
Projected Benefit Obligation at December 31 $182,559 $185,206
Reconciliation of Prepaid Pension Cost: Prepaid Pension Cost at January 1 $ 7,493 $ 8,005 Net Periodic Pension Cost (2,898) (4,512)Discretionary Company Contributions 2,000 4,000
Prepaid Pension Cost at December 31 $ 6,595 $ 7,493
2008 2007
Discount Rate 6.70% 6.25%Rate of Increase in Future Compensation Level 3.75% 3.75%
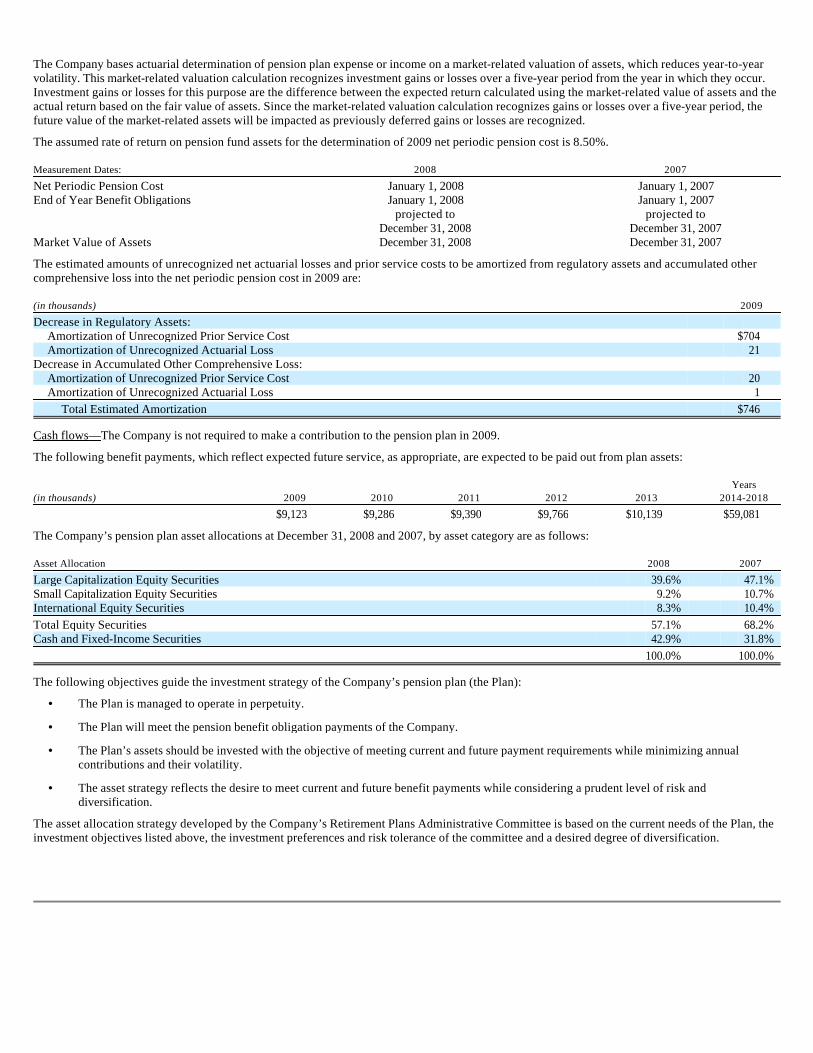
The Company bases actuarial determination of pension plan expense or income on a market-related valuation of assets, which reduces year-to-year volatility. This market-related valuation calculation recognizes investment gains or losses over a five-year period from the year in which they occur. Investment gains or losses for this purpose are the difference between the expected return calculated using the market-related value of assets and the actual return based on the fair value of assets. Since the market-related valuation calculation recognizes gains or losses over a five-year period, the future value of the market-related assets will be impacted as previously deferred gains or losses are recognized.
The assumed rate of return on pension fund assets for the determination of 2009 net periodic pension cost is 8.50%.
The estimated amounts of unrecognized net actuarial losses and prior service costs to be amortized from regulatory assets and accumulated other comprehensive loss into the net periodic pension cost in 2009 are:
Cash flows—The Company is not required to make a contribution to the pension plan in 2009.
The following benefit payments, which reflect expected future service, as appropriate, are expected to be paid out from plan assets:
The Company’s pension plan asset allocations at December 31, 2008 and 2007, by asset category are as follows:
The following objectives guide the investment strategy of the Company’s pension plan (the Plan):
The asset allocation strategy developed by the Company’s Retirement Plans Administrative Committee is based on the current needs of the Plan, the investment objectives listed above, the investment preferences and risk tolerance of the committee and a desired degree of diversification.
Measurement Dates: 2008 2007
Net Periodic Pension Cost January 1, 2008 January 1, 2007End of Year Benefit Obligations January 1, 2008 January 1, 2007 projected to projected to December 31, 2008 December 31, 2007Market Value of Assets December 31, 2008 December 31, 2007
(in thousands) 2009
Decrease in Regulatory Assets: Amortization of Unrecognized Prior Service Cost $704 Amortization of Unrecognized Actuarial Loss 21
Decrease in Accumulated Other Comprehensive Loss: Amortization of Unrecognized Prior Service Cost 20 Amortization of Unrecognized Actuarial Loss 1
Total Estimated Amortization $746
Years(in thousands) 2009 2010 2011 2012 2013 2014-2018
$9,123 $9,286 $9,390 $9,766 $10,139 $59,081
Asset Allocation 2008 2007
Large Capitalization Equity Securities 39.6% 47.1%Small Capitalization Equity Securities 9.2% 10.7%International Equity Securities 8.3% 10.4%Total Equity Securities 57.1% 68.2%Cash and Fixed-Income Securities 42.9% 31.8% 100.0% 100.0%
• The Plan is managed to operate in perpetuity.
• The Plan will meet the pension benefit obligation payments of the Company.
• The Plan’s assets should be invested with the objective of meeting current and future payment requirements while minimizing annual contributions and their volatility.
• The asset strategy reflects the desire to meet current and future benefit payments while considering a prudent level of risk and diversification.
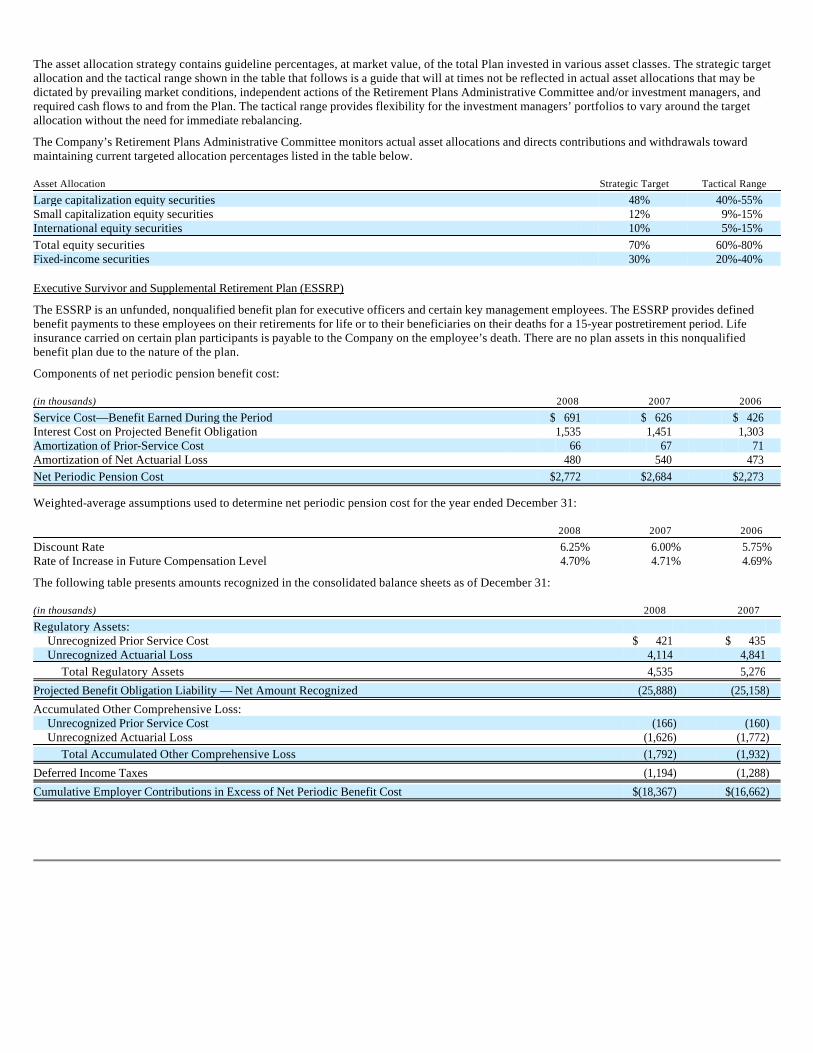
The asset allocation strategy contains guideline percentages, at market value, of the total Plan invested in various asset classes. The strategic target allocation and the tactical range shown in the table that follows is a guide that will at times not be reflected in actual asset allocations that may be dictated by prevailing market conditions, independent actions of the Retirement Plans Administrative Committee and/or investment managers, and required cash flows to and from the Plan. The tactical range provides flexibility for the investment managers’ portfolios to vary around the target allocation without the need for immediate rebalancing.
The Company’s Retirement Plans Administrative Committee monitors actual asset allocations and directs contributions and withdrawals toward maintaining current targeted allocation percentages listed in the table below.
Executive Survivor and Supplemental Retirement Plan (ESSRP)
The ESSRP is an unfunded, nonqualified benefit plan for executive officers and certain key management employees. The ESSRP provides defined benefit payments to these employees on their retirements for life or to their beneficiaries on their deaths for a 15-year postretirement period. Life insurance carried on certain plan participants is payable to the Company on the employee’s death. There are no plan assets in this nonqualified benefit plan due to the nature of the plan.
Components of net periodic pension benefit cost:
Weighted-average assumptions used to determine net periodic pension cost for the year ended December 31:
The following table presents amounts recognized in the consolidated balance sheets as of December 31:
Asset Allocation Strategic Target Tactical Range
Large capitalization equity securities 48% 40%-55%Small capitalization equity securities 12% 9%-15%International equity securities 10% 5%-15%Total equity securities 70% 60%-80%Fixed-income securities 30% 20%-40%
(in thousands) 2008 2007 2006
Service Cost—Benefit Earned During the Period $ 691 $ 626 $ 426 Interest Cost on Projected Benefit Obligation 1,535 1,451 1,303 Amortization of Prior-Service Cost 66 67 71 Amortization of Net Actuarial Loss 480 540 473 Net Periodic Pension Cost $2,772 $2,684 $2,273
2008 2007 2006
Discount Rate 6.25% 6.00% 5.75%Rate of Increase in Future Compensation Level 4.70% 4.71% 4.69%
(in thousands) 2008 2007
Regulatory Assets: Unrecognized Prior Service Cost $ 421 $ 435 Unrecognized Actuarial Loss 4,114 4,841
Total Regulatory Assets 4,535 5,276
Projected Benefit Obligation Liability — Net Amount Recognized (25,888) (25,158)
Accumulated Other Comprehensive Loss: Unrecognized Prior Service Cost (166) (160)Unrecognized Actuarial Loss (1,626) (1,772)
Total Accumulated Other Comprehensive Loss (1,792) (1,932)
Deferred Income Taxes (1,194) (1,288)
Cumulative Employer Contributions in Excess of Net Periodic Benefit Cost $(18,367) $(16,662)
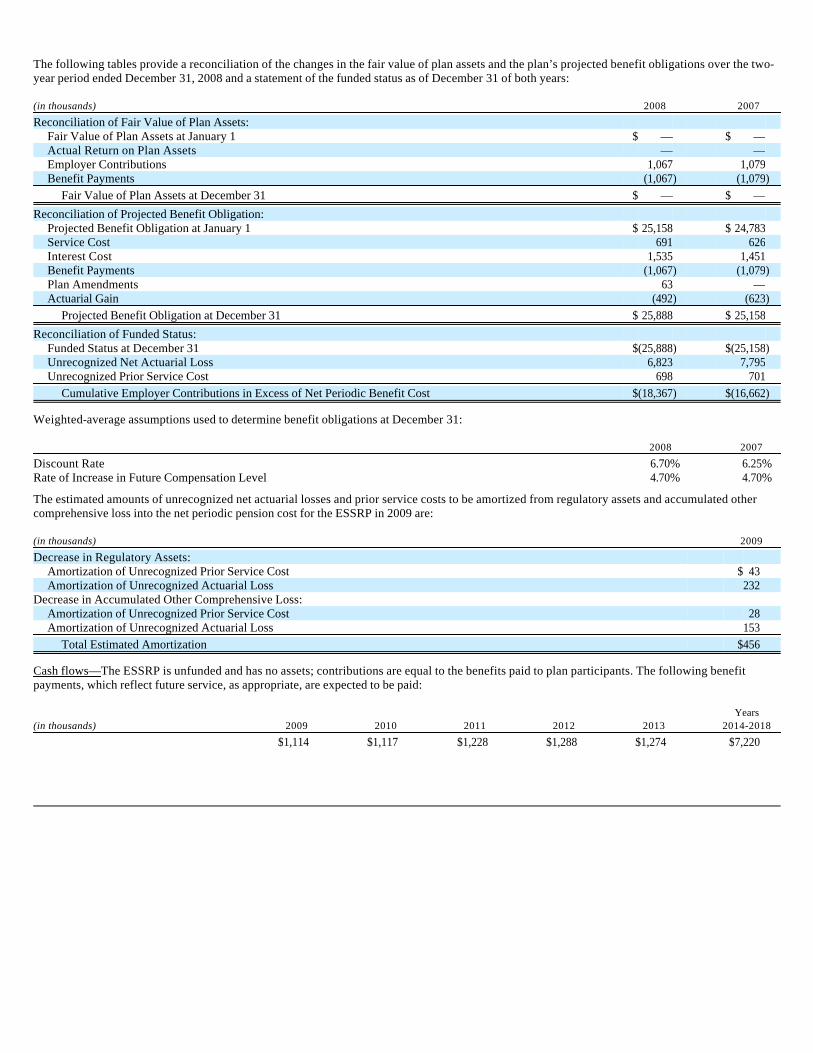
The following tables provide a reconciliation of the changes in the fair value of plan assets and the plan’s projected benefit obligations over the two-year period ended December 31, 2008 and a statement of the funded status as of December 31 of both years:
Weighted-average assumptions used to determine benefit obligations at December 31:
The estimated amounts of unrecognized net actuarial losses and prior service costs to be amortized from regulatory assets and accumulated other comprehensive loss into the net periodic pension cost for the ESSRP in 2009 are:
Cash flows—The ESSRP is unfunded and has no assets; contributions are equal to the benefits paid to plan participants. The following benefit payments, which reflect future service, as appropriate, are expected to be paid:
(in thousands) 2008 2007
Reconciliation of Fair Value of Plan Assets: Fair Value of Plan Assets at January 1 $ — $ — Actual Return on Plan Assets — — Employer Contributions 1,067 1,079 Benefit Payments (1,067) (1,079)
Fair Value of Plan Assets at December 31 $ — $ —
Reconciliation of Projected Benefit Obligation: Projected Benefit Obligation at January 1 $ 25,158 $ 24,783 Service Cost 691 626 Interest Cost 1,535 1,451 Benefit Payments (1,067) (1,079)Plan Amendments 63 — Actuarial Gain (492) (623)
Projected Benefit Obligation at December 31 $ 25,888 $ 25,158
Reconciliation of Funded Status: Funded Status at December 31 $(25,888) $(25,158)Unrecognized Net Actuarial Loss 6,823 7,795 Unrecognized Prior Service Cost 698 701
Cumulative Employer Contributions in Excess of Net Periodic Benefit Cost $(18,367) $(16,662)
2008 2007
Discount Rate 6.70% 6.25%Rate of Increase in Future Compensation Level 4.70% 4.70%
(in thousands) 2009
Decrease in Regulatory Assets: Amortization of Unrecognized Prior Service Cost $ 43 Amortization of Unrecognized Actuarial Loss 232
Decrease in Accumulated Other Comprehensive Loss: Amortization of Unrecognized Prior Service Cost 28 Amortization of Unrecognized Actuarial Loss 153
Total Estimated Amortization $456
Years(in thousands) 2009 2010 2011 2012 2013 2014-2018
$1,114 $1,117 $1,228 $1,288 $1,274 $7,220
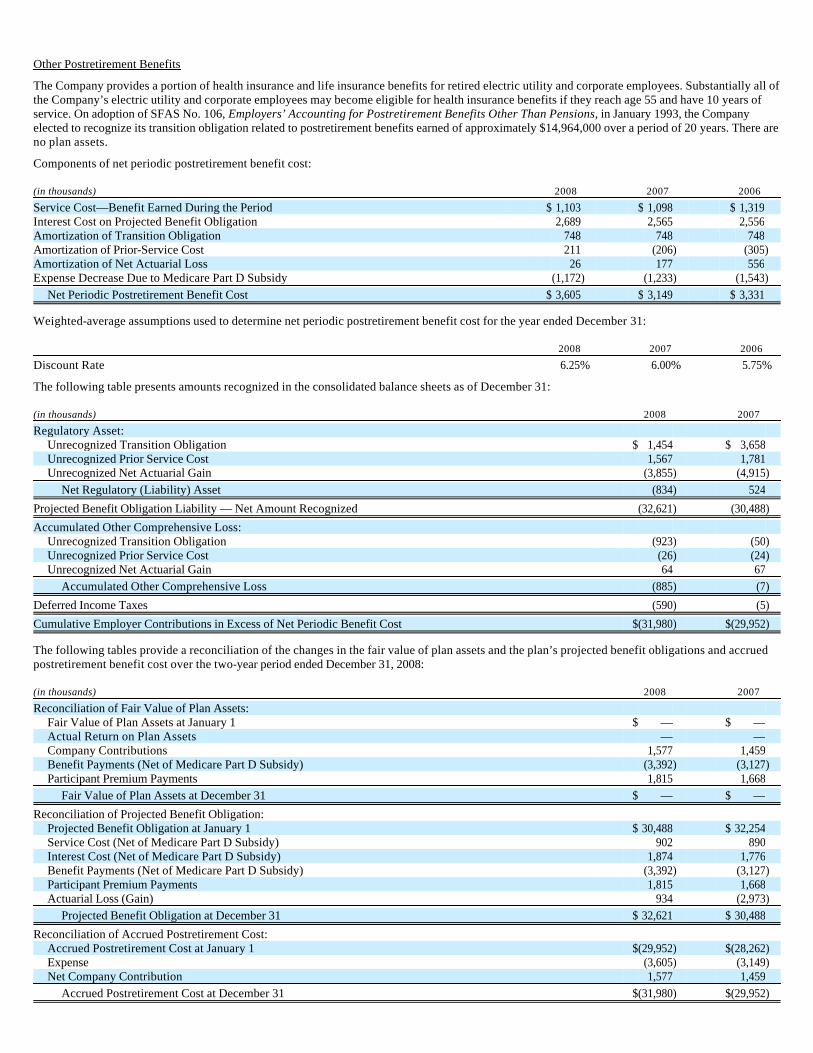
Other Postretirement Benefits
The Company provides a portion of health insurance and life insurance benefits for retired electric utility and corporate employees. Substantially all of the Company’s electric utility and corporate employees may become eligible for health insurance benefits if they reach age 55 and have 10 years of service. On adoption of SFAS No. 106, Employers’ Accounting for Postretirement Benefits Other Than Pensions, in January 1993, the Company elected to recognize its transition obligation related to postretirement benefits earned of approximately $14,964,000 over a period of 20 years. There are no plan assets.
Components of net periodic postretirement benefit cost:
Weighted-average assumptions used to determine net periodic postretirement benefit cost for the year ended December 31:
The following table presents amounts recognized in the consolidated balance sheets as of December 31:
The following tables provide a reconciliation of the changes in the fair value of plan assets and the plan’s projected benefit obligations and accrued postretirement benefit cost over the two-year period ended December 31, 2008:
(in thousands) 2008 2007 2006
Service Cost—Benefit Earned During the Period $ 1,103 $ 1,098 $ 1,319 Interest Cost on Projected Benefit Obligation 2,689 2,565 2,556 Amortization of Transition Obligation 748 748 748 Amortization of Prior-Service Cost 211 (206) (305)Amortization of Net Actuarial Loss 26 177 556 Expense Decrease Due to Medicare Part D Subsidy (1,172) (1,233) (1,543)
Net Periodic Postretirement Benefit Cost $ 3,605 $ 3,149 $ 3,331
2008 2007 2006
Discount Rate 6.25% 6.00% 5.75%
(in thousands) 2008 2007
Regulatory Asset: Unrecognized Transition Obligation $ 1,454 $ 3,658 Unrecognized Prior Service Cost 1,567 1,781 Unrecognized Net Actuarial Gain (3,855) (4,915)
Net Regulatory (Liability) Asset (834) 524
Projected Benefit Obligation Liability — Net Amount Recognized (32,621) (30,488)
Accumulated Other Comprehensive Loss: Unrecognized Transition Obligation (923) (50)Unrecognized Prior Service Cost (26) (24)Unrecognized Net Actuarial Gain 64 67
Accumulated Other Comprehensive Loss (885) (7)
Deferred Income Taxes (590) (5)
Cumulative Employer Contributions in Excess of Net Periodic Benefit Cost $(31,980) $(29,952)
(in thousands) 2008 2007
Reconciliation of Fair Value of Plan Assets: Fair Value of Plan Assets at January 1 $ — $ — Actual Return on Plan Assets — — Company Contributions 1,577 1,459 Benefit Payments (Net of Medicare Part D Subsidy) (3,392) (3,127)Participant Premium Payments 1,815 1,668
Fair Value of Plan Assets at December 31 $ — $ —
Reconciliation of Projected Benefit Obligation: Projected Benefit Obligation at January 1 $ 30,488 $ 32,254 Service Cost (Net of Medicare Part D Subsidy) 902 890 Interest Cost (Net of Medicare Part D Subsidy) 1,874 1,776 Benefit Payments (Net of Medicare Part D Subsidy) (3,392) (3,127)Participant Premium Payments 1,815 1,668 Actuarial Loss (Gain) 934 (2,973)
Projected Benefit Obligation at December 31 $ 32,621 $ 30,488
Reconciliation of Accrued Postretirement Cost: Accrued Postretirement Cost at January 1 $(29,952) $(28,262)Expense (3,605) (3,149)Net Company Contribution 1,577 1,459
Accrued Postretirement Cost at December 31 $(31,980) $(29,952)

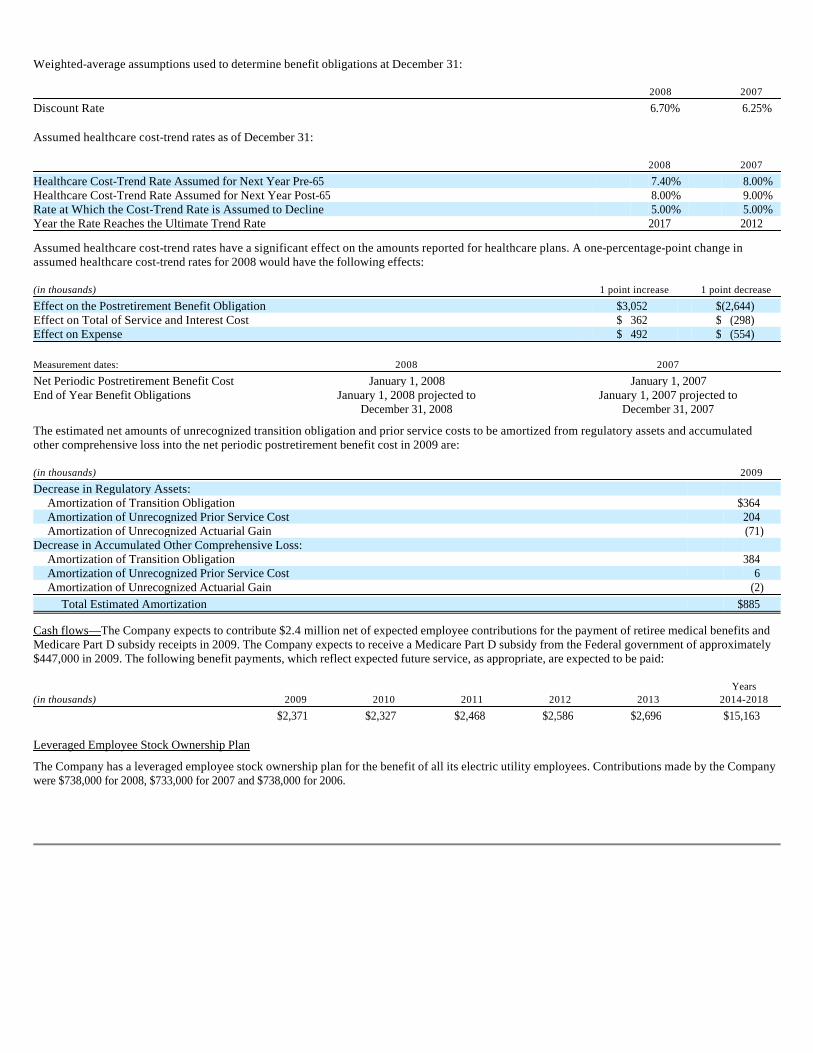
Weighted-average assumptions used to determine benefit obligations at December 31:
Assumed healthcare cost-trend rates as of December 31:
Assumed healthcare cost-trend rates have a significant effect on the amounts reported for healthcare plans. A one-percentage-point change in assumed healthcare cost-trend rates for 2008 would have the following effects:
The estimated net amounts of unrecognized transition obligation and prior service costs to be amortized from regulatory assets and accumulated other comprehensive loss into the net periodic postretirement benefit cost in 2009 are:
Cash flows—The Company expects to contribute $2.4 million net of expected employee contributions for the payment of retiree medical benefits and Medicare Part D subsidy receipts in 2009. The Company expects to receive a Medicare Part D subsidy from the Federal government of approximately $447,000 in 2009. The following benefit payments, which reflect expected future service, as appropriate, are expected to be paid:
Leveraged Employee Stock Ownership Plan
The Company has a leveraged employee stock ownership plan for the benefit of all its electric utility employees. Contributions made by the Company were $738,000 for 2008, $733,000 for 2007 and $738,000 for 2006.
2008 2007
Discount Rate 6.70% 6.25%
2008 2007
Healthcare Cost-Trend Rate Assumed for Next Year Pre-65 7.40% 8.00%Healthcare Cost-Trend Rate Assumed for Next Year Post-65 8.00% 9.00%Rate at Which the Cost-Trend Rate is Assumed to Decline 5.00% 5.00%Year the Rate Reaches the Ultimate Trend Rate 2017 2012
(in thousands) 1 point increase 1 point decrease
Effect on the Postretirement Benefit Obligation $3,052 $(2,644)Effect on Total of Service and Interest Cost $ 362 $ (298)Effect on Expense $ 492 $ (554) Measurement dates: 2008 2007
Net Periodic Postretirement Benefit Cost January 1, 2008 January 1, 2007End of Year Benefit Obligations January 1, 2008 projected to January 1, 2007 projected to December 31, 2008 December 31, 2007
(in thousands) 2009
Decrease in Regulatory Assets: Amortization of Transition Obligation $364 Amortization of Unrecognized Prior Service Cost 204 Amortization of Unrecognized Actuarial Gain (71)
Decrease in Accumulated Other Comprehensive Loss: Amortization of Transition Obligation 384 Amortization of Unrecognized Prior Service Cost 6 Amortization of Unrecognized Actuarial Gain (2)
Total Estimated Amortization $885
Years(in thousands) 2009 2010 2011 2012 2013 2014-2018
$2,371 $2,327 $2,468 $2,586 $2,696 $15,163

13. Fair Value of Financial Instruments
The following methods and assumptions were used to estimate the fair value of each class of financial instruments for which it is practicable to estimate that value:
Cash and Short-Term Investments—The carrying amount approximates fair value because of the short-term maturity of those instruments.
Long-Term Debt—The fair value of the Company’s long-term debt is estimated based on the current rates available to the Company for the issuance of debt. About $10.4 million of the Company’s long-term debt, which is subject to variable interest rates, approximates fair value.
14. Property, Plant and Equipment
The estimated service lives for rate-regulated properties is 5 to 65 years. For nonelectric property the estimated useful lives are from 3 to 40 years.
December 31, 2008 December 31, 2007 Carrying Fair Carrying Fair(in thousands) Amount Value Amount Value
Cash and Short-Term Investments $ 7,565 $ 7,565 $ 39,824 $ 39,824 Long-Term Debt (339,726) (308,283) (342,694) (354,242)
(in thousands) December 31,
2008 December 31,
2007
Electric Plant Production $ 590,252 $ 439,541 Transmission 201,456 191,949 Distribution 337,296 322,107 General 76,643 75,320
Electric Plant 1,205,647 1,028,917 Less Accumulated Depreciation and Amortization 421,177 401,006
Electric Plant Net of Accumulated Depreciation 784,470 627,911 Construction Work in Progress 25,547 33,772
Net Electric Plant $ 810,017 $ 661,683
Nonelectric Operations Plant Equipment $ 220,985 $ 181,743 Buildings and Leasehold Improvements 80,281 62,563 Land 19,766 13,284
Nonelectric Operations Plant 321,032 257,590 Less Accumulated Depreciation and Amortization 126,893 105,738
Nonelectric Plant Net of Accumulated Depreciation 194,139 151,852 Construction Work in Progress 33,413 40,489
Net Nonelectric Operations Plant $ 227,552 $ 192,341
Net Plant $1,037,569 $ 854,024
Service Life Range(years) Low High
Electric Fixed Assets: Production Plant 34 62 Transmission Plant 40 55 Distribution Plant 15 55 General Plant 5 65
Nonelectric Fixed Assets: Equipment 3 12 Buildings and Leasehold Improvements 7 40

15. Income Taxes
The total income tax expense differs from the amount computed by applying the federal income tax rate (35% in 2008, 2007 and 2006) to net income before total income tax expense for the following reasons:
The Company’s deferred tax assets and liabilities were composed of the following on December 31:
(in thousands) 2008 2007 2006
Tax Computed at Federal Statutory Rate $ 17,556 $28,675 $27,232 Increases (Decreases) in Tax from:
State Income Taxes Net of Federal Income Tax Benefit 2,806 2,945 2,261 Differences Reversing in Excess of Federal Rates 1,089 929 1,271 Federal Production Tax Credit (3,234) (3) — Investment Tax Credit Amortization (1,125) (1,137) (1,146)Dividend Received/Paid Deduction (718) (714) (718)North Dakota Wind Tax Credit Amortization (567) (32) — Affordable Housing Tax Credits (55) (285) (839)Section 199 Domestic Production Activities Deduction — (1,159) (524)Permanent and Other Differences (715) (1,251) (431)
Total Income Tax Expense $ 15,037 $27,968 $27,106
Income Tax Expense—Discontinued Operations $ — $ — $ 252 Overall Effective Federal and State Income Tax Rate 30.0% 34.1% 34.9%Income Tax Expense Includes the Following:
Current Federal Income Taxes $(19,813) $23,210 $26,276 Current State Income Taxes (1,115) 2,371 4,232 Deferred Federal Income Taxes 39,051 2,832 (937)Deferred State Income Taxes 5,280 2,116 (189)Foreign Income Taxes (3,385) (1,104) (291)Federal Production Tax Credit (3,234) (3) — Investment Tax Credit Amortization (1,125) (1,137) (1,146)North Dakota Wind Tax Credit Amortization (567) (32) — Affordable Housing Tax Credits (55) (285) (839)
Total $ 15,037 $27,968 $27,106
(in thousands) 2008 2007
Deferred Tax Assets Related to North Dakota Wind Tax Credits $ 35,902 $ 12,999 Benefit Liabilities 32,932 30,789 Cost of Removal 22,920 22,537 Differences Related to Property 10,300 8,703 SFAS No. 158 Liabilities 9,650 10,504 Net Operating Loss Carryforward 6,379 1,815 Amortization of Tax Credits 4,946 4,505 Vacation Accrual 3,003 2,926 Unearned Revenue 1,829 1,733 Other 3,790 2,248
Total Deferred Tax Assets $ 131,651 $ 98,759
Deferred Tax Liabilities
Differences Related to Property $(212,419) $(166,445)Related to North Dakota Wind Tax Credits (10,074) (4,340)SFAS No. 158 Regulatory Asset (9,650) (10,504)Transfer to Regulatory Asset (7,093) (8,732)Excess Tax over Book Pension (2,599) (2,953)Other (4,516) (4,398)
Total Deferred Tax Liabilities $(246,351) $(197,372)
Deferred Income Taxes $(114,700) $ (98,613)

On January 1, 2007 the Company adopted the provisions of FIN No. 48. The cumulative effect of adoption of FIN No. 48, which is reported as an adjustment to the beginning balance of retained earnings, was $118,000. As of the date of adoption, the total amount of unrecognized tax benefits for uncertain tax positions was $1,874,000. The amount of unrecognized tax benefits that, if recognized, would impact the effective tax rate was $575,000 as of January 1, 2007.
The following table summarizes the activity related to our unrecognized tax benefits:
The balance of unrecognized tax benefits as of December 31, 2008 would reduce our effective tax rate if recognized. The total amount of unrecognized tax benefits as of December 31, 2008 is not expected to change significantly within the next 12 months. The Company and its subsidiaries file a consolidated U.S. federal income tax return and various state and foreign income tax returns. As of December 31, 2008 the Company is no longer subject to U.S. federal income tax examinations by tax authorities for years before 2005. As of December 31, 2008 the Company’s earliest open tax year in which an audit can be initiated by state taxing authorities in the Company’s major operating jurisdictions is 2004 for Minnesota and 2005 for North Dakota. The Company classifies interest and penalties on tax uncertainties as components of the provision for income taxes. Amounts accrued for interest and penalties on tax uncertainties as of December 31, 2008 were not material.
16. Asset Retirement Obligations (AROs)
The Company’s AROs are related to coal-fired generation plants, 27 wind turbines located near Langdon, North Dakota and 32 wind turbines at the Ashtabula Wind Energy Center in North Dakota and include site restoration, closure of ash pits, and removal of storage tanks, structures, generators and asbestos. The Company has legal obligations associated with the retirement of a variety of other long-lived tangible assets used in electric operations where the estimated settlement costs are individually and collectively immaterial. The Company has no assets legally restricted for the settlement of any of its AROs.
During 2008, the electric utility recorded new obligations related to the removal of 32 wind turbines located at the Ashtabula Wind Energy Center in Barnes County, North Dakota and restoration of the tower sites and made revisions to previously recorded obligations related to site restoration, closure of ash pits, and removal of storage tanks, structures, generators and asbestos at its coal-fired generation plants.
The measurements used to determine the fair values of electric utility’s AROs fall into level 3, of the fair value hierarchy set forth in SFAS No. 157, Fair Value Measurements. The electric utility determined the fair value of its future obligations related to the removal of 32 wind turbines located at the Ashtabula Wind Energy Center by engaging an outside engineering firm with expertise in demolition and removal to provide an estimate of the current costs to remove these assets, then projected the costs forward to 2033 using an inflation rate of 3.1% per year and discounted this amount back to its present value using a credit adjusted risk free rate of 9.0%.
During 2007, the Company recorded new obligations related to the removal of 27 wind turbines located near Langdon, North Dakota and restoration of the tower sites but did not make any revisions to previously recorded obligations.
(in thousands) Total
Balance at January 1, 2008 $ 506 Increases Related to Current Year Tax Positions — Expiration of the Statute of Limitations for the Assessment of Taxes (222)Balance at December 31, 2008 $ 284
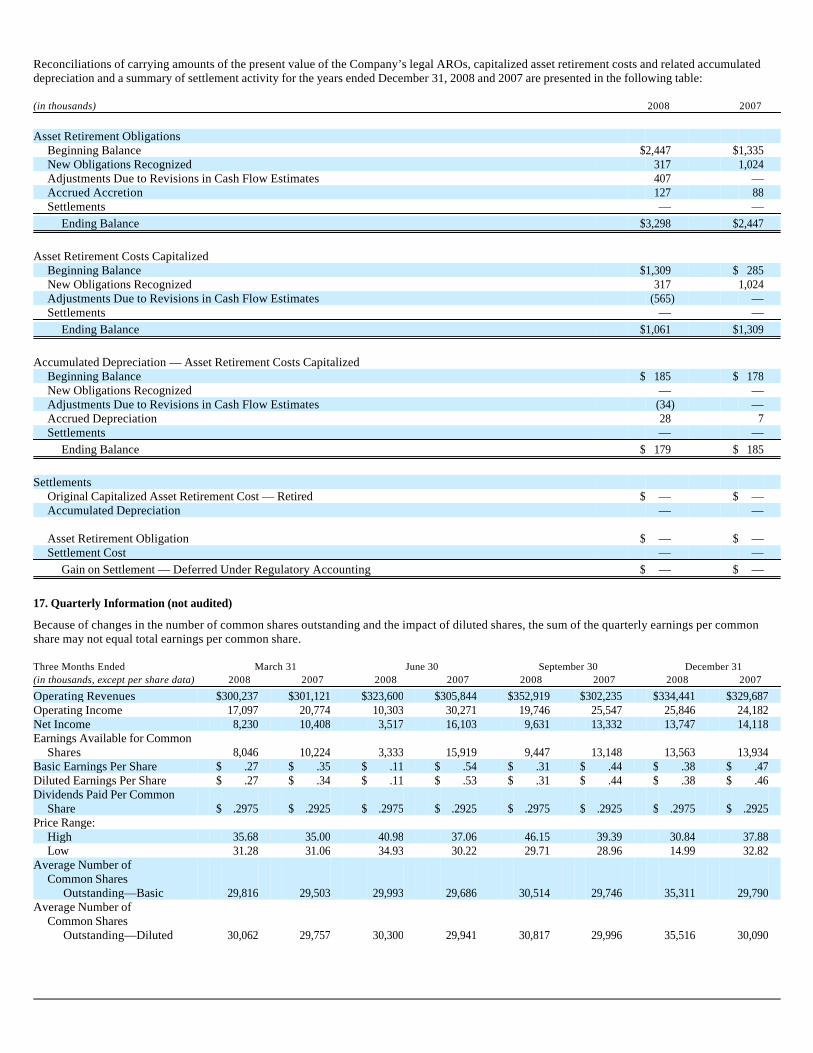
Reconciliations of carrying amounts of the present value of the Company’s legal AROs, capitalized asset retirement costs and related accumulated depreciation and a summary of settlement activity for the years ended December 31, 2008 and 2007 are presented in the following table:
17. Quarterly Information (not audited)
Because of changes in the number of common shares outstanding and the impact of diluted shares, the sum of the quarterly earnings per common share may not equal total earnings per common share.
(in thousands) 2008 2007
Asset Retirement Obligations
Beginning Balance $2,447 $1,335 New Obligations Recognized 317 1,024 Adjustments Due to Revisions in Cash Flow Estimates 407 — Accrued Accretion 127 88 Settlements — —
Ending Balance $3,298 $2,447
Asset Retirement Costs Capitalized
Beginning Balance $1,309 $ 285 New Obligations Recognized 317 1,024 Adjustments Due to Revisions in Cash Flow Estimates (565) — Settlements — —
Ending Balance $1,061 $1,309
Accumulated Depreciation — Asset Retirement Costs Capitalized
Beginning Balance $ 185 $ 178 New Obligations Recognized — — Adjustments Due to Revisions in Cash Flow Estimates (34) — Accrued Depreciation 28 7 Settlements — —
Ending Balance $ 179 $ 185
Settlements
Original Capitalized Asset Retirement Cost — Retired $ — $ — Accumulated Depreciation — —
Asset Retirement Obligation $ — $ — Settlement Cost — —
Gain on Settlement — Deferred Under Regulatory Accounting $ — $ —
Three Months Ended March 31 June 30 September 30 December 31(in thousands, except per share data) 2008 2007 2008 2007 2008 2007 2008 2007
Operating Revenues $300,237 $301,121 $323,600 $305,844 $352,919 $302,235 $334,441 $329,687 Operating Income 17,097 20,774 10,303 30,271 19,746 25,547 25,846 24,182 Net Income 8,230 10,408 3,517 16,103 9,631 13,332 13,747 14,118 Earnings Available for Common
Shares 8,046 10,224 3,333 15,919 9,447 13,148 13,563 13,934 Basic Earnings Per Share $ .27 $ .35 $ .11 $ .54 $ .31 $ .44 $ .38 $ .47 Diluted Earnings Per Share $ .27 $ .34 $ .11 $ .53 $ .31 $ .44 $ .38 $ .46 Dividends Paid Per Common
Share $ .2975 $ .2925 $ .2975 $ .2925 $ .2975 $ .2925 $ .2975 $ .2925 Price Range:
High 35.68 35.00 40.98 37.06 46.15 39.39 30.84 37.88 Low 31.28 31.06 34.93 30.22 29.71 28.96 14.99 32.82
Average Number of Common Shares Outstanding—Basic 29,816 29,503 29,993 29,686 30,514 29,746 35,311 29,790
Average Number of Common Shares Outstanding—Diluted 30,062 29,757 30,300 29,941 30,817 29,996 35,516 30,090
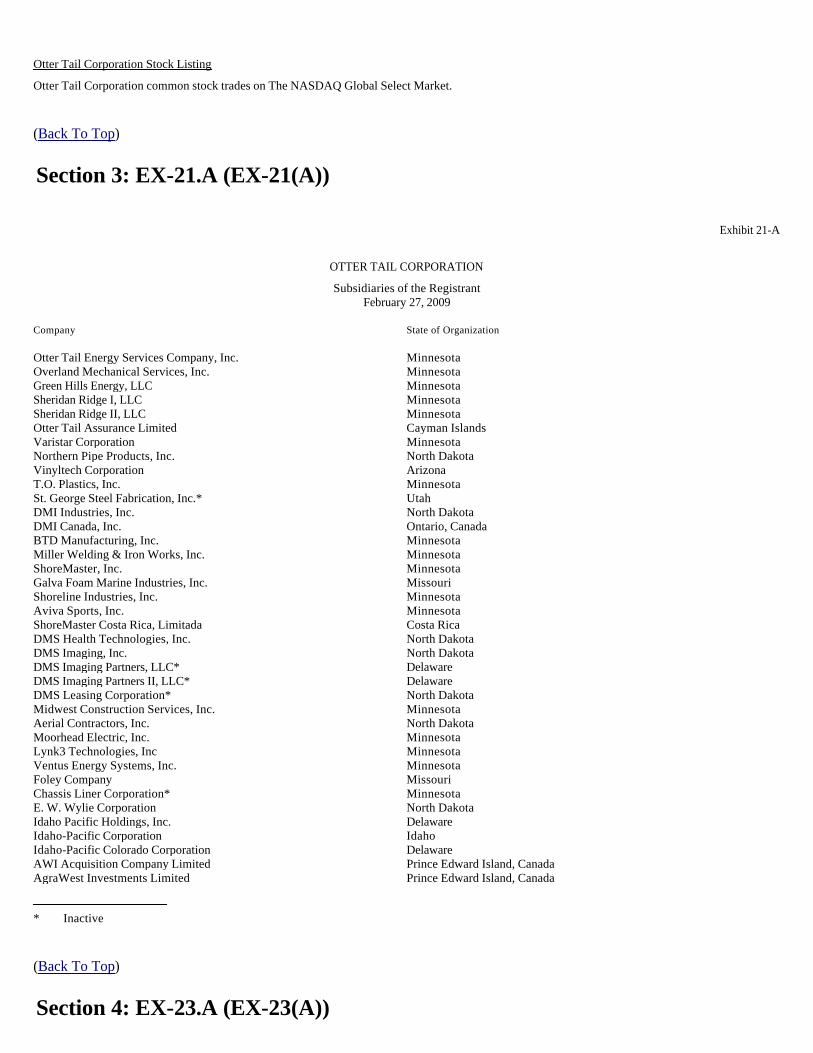
Otter Tail Corporation Stock Listing
Otter Tail Corporation common stock trades on The NASDAQ Global Select Market.
(Back To Top)
Exhibit 21-A
OTTER TAIL CORPORATION
Subsidiaries of the Registrant February 27, 2009
(Back To Top)
Section 3: EX-21.A (EX-21(A))
Company State of Organization Otter Tail Energy Services Company, Inc. MinnesotaOverland Mechanical Services, Inc. MinnesotaGreen Hills Energy, LLC MinnesotaSheridan Ridge I, LLC MinnesotaSheridan Ridge II, LLC MinnesotaOtter Tail Assurance Limited Cayman IslandsVaristar Corporation MinnesotaNorthern Pipe Products, Inc. North DakotaVinyltech Corporation ArizonaT.O. Plastics, Inc. MinnesotaSt. George Steel Fabrication, Inc.* UtahDMI Industries, Inc. North DakotaDMI Canada, Inc. Ontario, CanadaBTD Manufacturing, Inc. MinnesotaMiller Welding & Iron Works, Inc. MinnesotaShoreMaster, Inc. MinnesotaGalva Foam Marine Industries, Inc. MissouriShoreline Industries, Inc. MinnesotaAviva Sports, Inc. MinnesotaShoreMaster Costa Rica, Limitada Costa RicaDMS Health Technologies, Inc. North DakotaDMS Imaging, Inc. North DakotaDMS Imaging Partners, LLC* DelawareDMS Imaging Partners II, LLC* DelawareDMS Leasing Corporation* North DakotaMidwest Construction Services, Inc. MinnesotaAerial Contractors, Inc. North DakotaMoorhead Electric, Inc. MinnesotaLynk3 Technologies, Inc MinnesotaVentus Energy Systems, Inc. MinnesotaFoley Company MissouriChassis Liner Corporation* MinnesotaE. W. Wylie Corporation North DakotaIdaho Pacific Holdings, Inc. DelawareIdaho-Pacific Corporation IdahoIdaho-Pacific Colorado Corporation DelawareAWI Acquisition Company Limited Prince Edward Island, CanadaAgraWest Investments Limited Prince Edward Island, Canada
* Inactive
Section 4: EX-23.A (EX-23(A))

EXHIBIT 23-A
CONSENT OF INDEPENDENT REGISTERED PUBLIC ACCOUNTING FIRM
We consent to the incorporation by reference in Registration Statement Nos. 333-155747 on Form S-3 and 333-25261, 333-73041, 333-73075 and 333-136841 on Form S-8 of our report dated February 25, 2009 relating to the consolidated financial statements of Otter Tail Corporation and its subsidiaries (the “Company”) and management’s report on the effectiveness of internal control over financial reporting appearing in the 2008 Annual Report to Shareholders of the Company and incorporated by reference in this Annual Report on Form 10-K of the Company for the year ended December 31, 2008.
/s/ Deloitte & Touche LLP
Minneapolis, Minnesota February 27, 2009
(Back To Top)
Exhibit 24-A
POWER OF ATTORNEY
I, KEVIN G. MOUG, do hereby constitute and appoint JOHN D. ERICKSON and GEORGE A. KOECK, or any one of them, my Attorney-in-Fact for the purpose of signing, in my name and on my behalf as Chief Financial Officer of Otter Tail Corporation, the Annual Report of Otter Tail Corporation on Form 10-K for its fiscal year ended December 31, 2008, and any and all amendments to said Annual Report, and to deliver on my behalf said Annual Report and any and all amendments thereto, as each thereof is so signed, for filing with the Securities and Exchange Commission pursuant to the Securities Exchange Act of 1934, as amended.
Date: February 3, 2009
In Presence of:
Section 5: EX-24.A (EX-24(A))
/s/ Kevin G. Moug Kevin G. Moug
/s/ Jackie Rogness /s/ Dawn Doyel
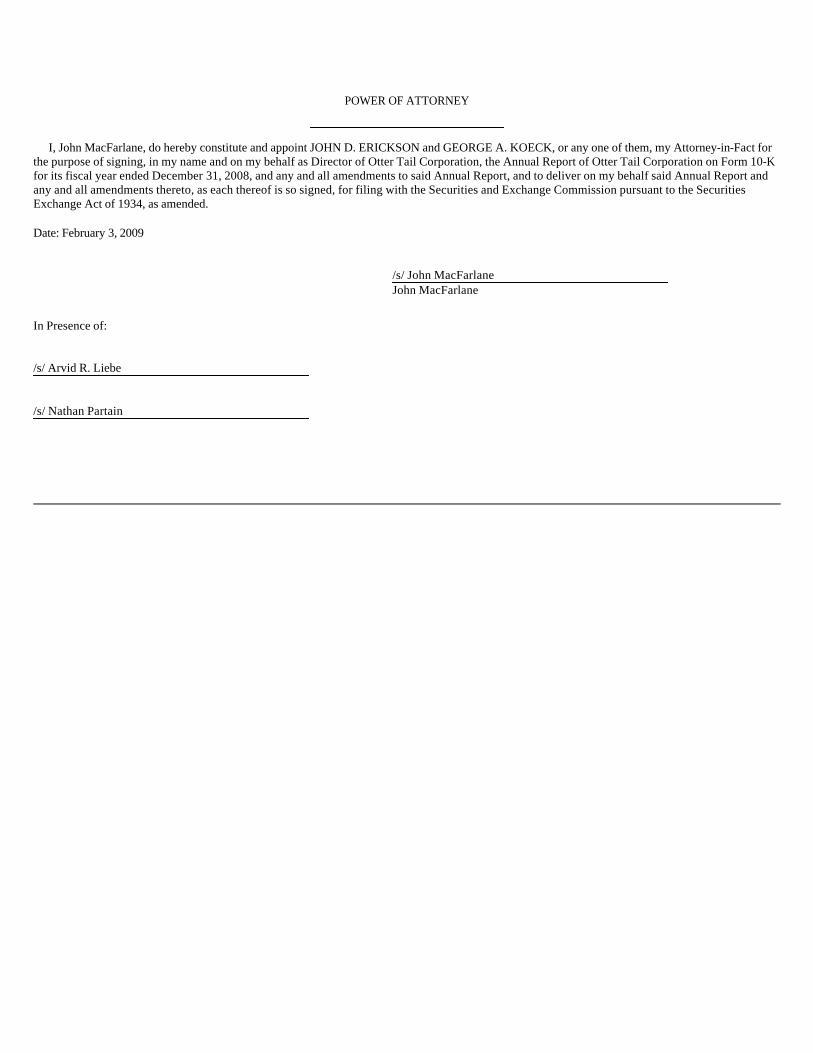
POWER OF ATTORNEY
I, John MacFarlane, do hereby constitute and appoint JOHN D. ERICKSON and GEORGE A. KOECK, or any one of them, my Attorney-in-Fact for the purpose of signing, in my name and on my behalf as Director of Otter Tail Corporation, the Annual Report of Otter Tail Corporation on Form 10-K for its fiscal year ended December 31, 2008, and any and all amendments to said Annual Report, and to deliver on my behalf said Annual Report and any and all amendments thereto, as each thereof is so signed, for filing with the Securities and Exchange Commission pursuant to the Securities Exchange Act of 1934, as amended.
Date: February 3, 2009
In Presence of:
/s/ John MacFarlane John MacFarlane
/s/ Arvid R. Liebe /s/ Nathan Partain

POWER OF ATTORNEY
I, Karen Bohn, do hereby constitute and appoint JOHN D. ERICKSON and GEORGE A. KOECK, or any one of them, my Attorney-in-Fact for the purpose of signing, in my name and on my behalf as Director of Otter Tail Corporation, the Annual Report of Otter Tail Corporation on Form 10-K for its fiscal year ended December 31, 2008, and any and all amendments to said Annual Report, and to deliver on my behalf said Annual Report and any and all amendments thereto, as each thereof is so signed, for filing with the Securities and Exchange Commission pursuant to the Securities Exchange Act of 1934, as amended.
Date: February 3, 2009
In Presence of:
/s/ Karen Bohn Karen Bohn
/s/ John D. Erickson /s/ Lauris N. Molbert
POWER OF ATTORNEY
I, Arvid Liebe, do hereby constitute and appoint JOHN D. ERICKSON and GEORGE A. KOECK, or any one of them, my Attorney-in-Fact for the purpose of signing, in my name and on my behalf as Director of Otter Tail Corporation, the Annual Report of Otter Tail Corporation on Form 10-K for its fiscal year ended December 31, 2008, and any and all amendments to said Annual Report, and to deliver on my behalf said Annual Report and any and all amendments thereto, as each thereof is so signed, for filing with the Securities and Exchange Commission pursuant to the Securities Exchange Act of 1934, as amended.
Date: February 3, 2009
In Presence of:
/s/ Arvid Liebe Arvid Liebe
/s/ Michelle Kommer /s/ George A. Koeck

POWER OF ATTORNEY
I, Edward J. McIntyre, do hereby constitute and appoint JOHN D. ERICKSON and GEORGE A. KOECK, or any one of them, my Attorney-in-Fact for the purpose of signing, in my name and on my behalf as Director of Otter Tail Corporation, the Annual Report of Otter Tail Corporation on Form 10-K for its fiscal year ended December 31, 2008, and any and all amendments to said Annual Report, and to deliver on my behalf said Annual Report and any and all amendments thereto, as each thereof is so signed, for filing with the Securities and Exchange Commission pursuant to the Securities Exchange Act of 1934, as amended.
Date: February 3, 2009
In Presence of:
/s/ Edward J. McIntyre Edward J. McIntyre
/s/ James B. Stake /s/ Gary Spies

POWER OF ATTORNEY
I, Joyce Nelson Schuette, do hereby constitute and appoint JOHN D. ERICKSON and GEORGE A. KOECK, or any one of them, my Attorney-in-Fact for the purpose of signing, in my name and on my behalf as Director of Otter Tail Corporation, the Annual Report of Otter Tail Corporation on Form 10-K for its fiscal year ended December 31, 2008, and any and all amendments to said Annual Report, and to deliver on my behalf said Annual Report and any and all amendments thereto, as each thereof is so signed, for filing with the Securities and Exchange Commission pursuant to the Securities Exchange Act of 1934, as amended.
Date: February 3, 2009
In Presence of:
/s/ Joyce Nelson Schuette Joyce Nelson Schuette
/s/ Nathan Partain /s/ Kevin Moug
POWER OF ATTORNEY
I, Nathan Partain, do hereby constitute and appoint JOHN D. ERICKSON and GEORGE A. KOECK, or any one of them, my Attorney-in-Fact for the purpose of signing, in my name and on my behalf as Director of Otter Tail Corporation, the Annual Report of Otter Tail Corporation on Form 10-K for its fiscal year ended December 31, 2008, and any and all amendments to said Annual Report, and to deliver on my behalf said Annual Report and any and all amendments thereto, as each thereof is so signed, for filing with the Securities and Exchange Commission pursuant to the Securities Exchange Act of 1934, as amended.
Date: February 3, 2009
In Presence of:
/s/ Nathan Partain Nathan Partain
/s/ John MacFarlane /s/ Arvid R. Liebe
POWER OF ATTORNEY
I, Gary Spies, do hereby constitute and appoint JOHN D. ERICKSON and GEORGE A. KOECK, or any one of them, my Attorney-in-Fact for the purpose of signing, in my name and on my behalf as Director of Otter Tail Corporation, the Annual Report of Otter Tail Corporation on Form 10-K for its fiscal year ended December 31, 2008, and any and all amendments to said Annual Report, and to deliver on my behalf said Annual Report and any and all amendments thereto, as each thereof is so signed, for filing with the Securities and Exchange Commission pursuant to the Securities Exchange Act of 1934, as amended.
Date: February 3, 2009
In Presence of:
/s/ Gary Spies Gary Spies
/s/ Michelle Kommer /s/ Edward James McIntyre

POWER OF ATTORNEY
I, James Stake, do hereby constitute and appoint JOHN D. ERICKSON and GEORGE A. KOECK, or any one of them, my Attorney-in-Fact for the purpose of signing, in my name and on my behalf as Director of Otter Tail Corporation, the Annual Report of Otter Tail Corporation on Form 10-K for its fiscal year ended December 31, 2008, and any and all amendments to said Annual Report, and to deliver on my behalf said Annual Report and any and all amendments thereto, as each thereof is so signed, for filing with the Securities and Exchange Commission pursuant to the Securities Exchange Act of 1934, as amended.
Date: February 3, 2009
In Presence of:
(Back To Top)
Exhibit 31.1
CERTIFICATION PURSUANT TO SECTION 302 OF THE SARBANES-OXLEY ACT OF 2002
I, John D. Erickson, certify that:
1. I have reviewed this Annual Report on Form 10-K of Otter Tail Corporation;
2. Based on my knowledge, this report does not contain any untrue statement of a material fact or omit to state a material fact necessary to make the statements made, in light of the circumstances under which such statements were made, not misleading with respect to the period covered by this report;
3. Based on my knowledge, the financial statements, and other financial information included in this report, fairly present in all material respects the financial condition, results of operations and cash flows of the registrant as of, and for, the periods presented in this report;
4. The registrant’s other certifying officer and I are responsible for establishing and maintaining disclosure controls and procedures (as defined in Exchange Act Rules 13a-15(e) and 15d-15(e)) and internal control over financial reporting (as defined in Exchange Act Rules 13a-15(f) and 15d-15(f)) for the registrant and have:
(a) designed such disclosure controls and procedures, or caused such disclosure controls and procedures to be designed under our supervision, to ensure that material information relating to the registrant, including its consolidated subsidiaries, is made known to us by others within those entities, particularly during the period in which this report is being prepared;
(b) designed such internal control over financial reporting, or caused such internal control over financial reporting to be designed under our supervision, to provide reasonable assurance regarding the reliability of financial reporting and the preparation of financial statements for external purposes in accordance with generally accepted accounting principles;
(c) evaluated the effectiveness of the registrant’s disclosure controls and procedures and presented in this report our conclusions about the effectiveness of the disclosure controls and procedures, as of the end of the period covered by this report based on such evaluation; and
(d) disclosed in this report any change in the registrant’s internal control over financial reporting that occurred during the registrant’s most recent fiscal quarter (the registrant’s fourth fiscal quarter in the case of an annual report) that has materially affected, or is reasonably likely to
/s/ James Stake James Stake
/s/ Edward James McIntyre /s/ Gary Spies
Section 6: EX-31.1 (EX-31.1)

materially affect, the registrant’s internal control over financial reporting; and
5. The registrant’s other certifying officer and I have disclosed, based on our most recent evaluation of internal control over financial reporting, to the registrant’s auditors and the audit committee of the registrant’s board of directors (or persons performing the equivalent functions):
(a) all significant deficiencies and material weaknesses in the design or operation of internal control over financial reporting which are reasonably likely to adversely affect the registrant’s ability to record, process, summarize and report financial information; and
(b) any fraud, whether or not material, that involves management or other employees who have a significant role in the registrant’s internal control over financial reporting.
Date: February 27, 2009
(Back To Top)
Exhibit 31.2
CERTIFICATION PURSUANT TO SECTION 302 OF THE SARBANES-OXLEY ACT OF 2002
I, Kevin G. Moug, certify that:
1. I have reviewed this Annual Report on Form 10-K of Otter Tail Corporation;
2. Based on my knowledge, this report does not contain any untrue statement of a material fact or omit to state a material fact necessary to make the statements made, in light of the circumstances under which such statements were made, not misleading with respect to the period covered by this report;
3. Based on my knowledge, the financial statements, and other financial information included in this report, fairly present in all material respects the financial condition, results of operations and cash flows of the registrant as of, and for, the periods presented in this report;
4. The registrant’s other certifying officer and I are responsible for establishing and maintaining disclosure controls and procedures (as defined in Exchange Act Rules 13a-15(e) and 15d-15(e)) and internal control over financial reporting (as defined in Exchange Act Rules 13a-15(f) and 15d-15(f)) for the registrant and have:
(a) designed such disclosure controls and procedures, or caused such disclosure controls and procedures to be designed under our supervision, to ensure that material information relating to the registrant, including its consolidated subsidiaries, is made known to us by others within those entities, particularly during the period in which this report is being prepared;
(b) designed such internal control over financial reporting, or caused such internal control over financial reporting to be designed under our supervision, to provide reasonable assurance regarding the reliability of financial reporting and the preparation of financial statements for external purposes in accordance with generally accepted accounting principles;
(c) evaluated the effectiveness of the registrant’s disclosure controls and procedures and presented in this report our conclusions about the effectiveness of the disclosure controls and procedures, as of the end of the period covered by this report based on such evaluation; and
(d) disclosed in this report any change in the registrant’s internal control over financial reporting that occurred during the registrant’s most recent fiscal quarter (the registrant’s fourth fiscal quarter in the case of an annual report) that has materially affected, or is reasonably likely to materially affect, the registrant’s internal control over financial reporting; and
5. The registrant’s other certifying officer and I have disclosed, based on our most recent evaluation of internal control over financial reporting, to the registrant’s auditors and the audit committee of the registrant’s board of directors (or persons performing the equivalent functions):
(a) all significant deficiencies and material weaknesses in the design or operation of internal control over financial reporting which are reasonably likely to adversely affect the registrant’s ability to record, process, summarize and report financial information; and
(b) any fraud, whether or not material, that involves management or other employees who have a significant role in the registrant’s internal control over financial reporting.
Date: February 27, 2009
/s/ John D. Erickson John D. Erickson President and Chief Executive Officer
Section 7: EX-31.2 (EX-31.2)
/s/ Kevin G. Moug Kevin G. Moug Chief Financial Officer

(Back To Top)
Exhibit 32.1
CERTIFICATION PURSUANT TO SECTION 906 OF THE SARBANES-OXLEY ACT OF 2002
In connection with the Annual Report of Otter Tail Corporation (the “Company”) on Form 10-K for the period ended December 31, 2008 as filed with the Securities and Exchange Commission on the date hereof (the “Report”), I, John D. Erickson, President and Chief Executive Officer of the Company, certify, pursuant to 18 U.S.C. Section 1350, as adopted pursuant to Section 906 of the Sarbanes-Oxley Act of 2002, that:
(Back To Top)
Exhibit 32.2
CERTIFICATION PURSUANT TO SECTION 906 OF THE SARBANES-OXLEY ACT OF 2002
In connection with the Annual Report of Otter Tail Corporation (the “Company”) on Form 10-K for the period ended December 31, 2008 as filed with the Securities and Exchange Commission on the date hereof (the “Report”), I, Kevin G. Moug, Chief Financial Officer and Treasurer of the Company, certify, pursuant to 18 U.S.C. Section 1350, as adopted pursuant to Section 906 of the Sarbanes-Oxley Act of 2002, that:
(Back To Top)
Section 8: EX-32.1 (EX-32.1)
1. The Report fully complies with the requirements of Section 13(a) or 15(d) of the Securities Exchange Act of 1934; and
2. The information contained in the Report fairly presents, in all material respects, the financial condition and results of operations of the Company.
/s/ John D. Erickson John D. Erickson
President and Chief Executive Officer February 27, 2009
Section 9: EX-32.2 (EX-32.2)
1. The Report fully complies with the requirements of Section 13(a) or 15(d) of the Securities Exchange Act of 1934; and
2. The information contained in the Report fairly presents, in all material respects, the financial condition and results of operations of the Company.
/s/ Kevin G. Moug Kevin G. Moug
Chief Financial Officer February 27, 2009