osn mood tracking: exploring the use of online social ... · that can discover osn users whose...
TRANSCRIPT
OSN Mood Tracking: Exploring theUse of Online Social Network Activityas an Indicator of Mood Changes
James Alexander LeeSchool of Engineering andDigital ArtsUniversity of Kent, [email protected]
Lu BaiSchool of Engineering andDigital ArtsUniversity of Kent, [email protected]
Christos EfstratiouSchool of Engineering andDigital ArtsUniversity of Kent, [email protected]
Permission to make digital or hard copies of part or all of this work for personal orclassroom use is granted without fee provided that copies are not made or distributedfor profit or commercial advantage and that copies bear this notice and the full citationon the first page. Copyrights for third-party components of this work must be honored.For all other uses, contact the owner/author(s).Ubicomp/ISWC’16 Adjunct , September 12–16, 2016, Heidelberg, GermanyCopyright is held by the owner/author(s). Publication rights licensed to ACM.ACM 978-1-4503-4462-3/16/09...$15.00.http://dx.doi.org/10.1145/2968219.2968304
AbstractOnline social networks (OSNs) have become an integralpart of our everyday lives, where we share our thoughtsand feelings. This study analyses the extent to which thechanges of an individual’s real-world psychological moodcan be inferred by tracking their online activity on Face-book and Twitter. By capturing activities from the OSNs andground truth data via experience sampling, it was found thatmood changes can be detected within a window of 7 daysfor 61% of the participants by using specific, combined on-line activity signals. The participants fall into three distinctgroups: those whose mood correlates positively with theironline activity, those who correlate negatively and thosewho display a weak correlation. We trained two classifiersto identify these groups using features from their online ac-tivity, which achieved precision of 95.2% and 84.4% respec-tively. Our results suggest that real-world mood changescan be passively tracked through online activity on OSNs.
Author KeywordsOnline Social Networks; Facebook; Twitter; Social Psychol-ogy; Emotion; Mood; Sentiment Analysis.
ACM Classification KeywordsH.3.5 [Information Storage and Retrieval]: Online Informa-tion Services

IntroductionReal-world communication between individuals is a multi-modal experience, involving much more than the exchangeof verbal information. Every day social interactions are en-riched by our natural ability to interpret visual or auditoryclues that help us understand the emotional state of ourcounterpart [1]. In recent decades a significant part of oursocial lives have shifted into the digital world, through theuse of online social networks (OSNs) such as Facebookand Twitter. However, compared to real-world social inter-actions, OSNs do not facilitate the discovery of emotionalor mood changes of the users, unless they are explicitly de-clared by the users themselves. Considering the significantrole that OSNs play in the daily lives of individuals, we be-lieve that there is great value in transforming OSNs into anaffective communication medium where mood or emotionalchanges can be passively communicated.
In this paper we explore the feasibility of inferring moodchanges of OSN users by analysing their online activityon Facebook and Twitter. A number of previous studieshave demonstrated that online activity can be a predictorfor the detection of long-term psychological conditions [5]or a means for larger scale analysis of emotional trendsin groups [12]. In this work we aim to identify signals fromboth Facebook and Twitter that can be exploited to detectindividual user’s mood changes within a relatively short timeframe (7 days).
Affective communication may involve the understanding ofthe psychological state of users participating in an interac-tion. However, considering that OSN communication is typ-ically asynchronous and sparse, we believe that real-timeemotional detection in the context of OSNs is impracticaland possibly unfeasible. Instead our aim is to capture psy-chological mood changes that can span over longer periods
of time. The term “mood” is used to describe longer lastingchanges of psychological state [7] and differs from the tradi-tional concept of “emotion”. Emotions such as anger, fear orhappiness are short, intense episodes triggered by a spe-cific person or event that can last a few minutes or hours.Mood is a state that lasts a lot longer and is less intensethan emotion. A person’s mood will generally remain stablefor hours to days in length and does not usually have a trig-ger. In this work we demonstrate that OSN activity of userscan contain signals that can reveal the mood changes ofindividual users. We do so by exploring the relationship be-tween online activity and actual mood changes, capturedthrough experience sampling over a period of one month.
More specifically, we conducted a study involving 36 uni-versity students lasting for one month. Using online activitytraces captured from their Facebook and Twitter accountsas well as self reported daily logs of mood changes, wedemonstrate that it is feasible to detect changes of moodwithin a window of 7 days, for 61% of the participants. Wedeveloped a machine learning classifier that can identifywhich users demonstrate such correlations, along with thetype of correlation (positive / negative). With these resultswe demonstrate the feasibility of an automated techniquethat can discover OSN users whose activity is strongly cor-related with mood change and predict the type of moodchanges that can be observed, aggregated over a windowof 7 days. To the best of our knowledge this is the first caseof exploring links between OSN activities and real-worldmood data captured through experience sampling. Thisapproach allows us to find evidence about correlationsbetween online activity and real-world mood for particulartypes of social networking users.

Related WorkResearch exploring psychological state online has shownvarying results. Sentiment analysis on Facebook statusupdates has been shown to predict subjective well-being,such as satisfaction with life [9]. Sentiment analysis hasalso been used on Twitter to analyse and visualise moodacross different locations in Brazil over a 24 hour period [10],to track changes in worldwide emotion in response to ma-jor social, political, cultural and economic events [3] and todetect emotions in the tweets of individuals [2]. It has beensuggested that research which intends to analyse psycho-logical state should be backed by ground truth data to beconsidered as an accurate representation of real life [5].
Mood is improving Mood is declining
Activity-to-moodtracker
Negativecorrelation
Positivecorrelation
How is the mood
correlated with online activity?
Weak correlation=
Unpredictable
Strong correlation=
Predictable
Is the userpredictable?
Figure 1: The mood trackingsystem. (i) User’s Facebook andTwitter accounts are passivelytracked. (ii) Identify whether thisuser’s mood changes can bepredicted through online activity.(iii) Identify whether their mood ispositively or negatively correlatedwith their online activity. (iv) Onlineactivity used to passively trackmood changes.
OSNs have also been used for purposes other than ex-ploring psychological state. Using sentiment analysis ongeotagged tweets, researchers have been able to track thespread of influenza [14]. Twitter has been used to detectand diagnose major depressive disorder by backdating ayear of Twitter usage. This work used specific online fea-tures which are synonymous with real-world depressionsymptoms, such as depressive lexicon, interaction withother users and time of tweets representing insomnia [5].Furthermore, features on Facebook such as sentiment,number of posts and overall usage patterns have beenused to detect, characterise and predict postpartum de-pression in new mothers [4]. More recent work exploreslinguistic and interaction-based metrics on Reddit supportcommunities to detect the shift from mental health discus-sion to suicidal thoughts [6].
In the majority of this work, the primary focus is on the anal-ysis of aggregated data over large populations or relativelylong time periods. Ground truth is typically coarse-grained,representing particular conditions or significant shifts inmental state. In contrast, in our work we are considering
the case of short term (in the scale of days) individualisedtracking of mood changes. Furthermore, we attempt to ex-plore online activity in relationship to fine-grained groundtruth, captured through experience sampling.
MotivationThis work aims to explore the feasibility of inferring changesin the mood of individuals through the analysis of their ac-tivity in OSNs. Our aim is to develop a system that can infermood state signals in order to enhance online social inter-actions. Specifically, we envisage a system that can act asa “soft sensor” that can predict mood changes through on-line social data.
In order to achieve this we aim to develop a multilevel clas-sifier that predicts the change of mood for OSN users. Asseen in Figure 1, we consider a system that consists of:(i) a classifier that can identify OSN users whose moodchanges can be predicted through online activity, (ii) a clas-sifier that can identify how their online activity is related totheir current mood, and (iii) a tracker that maps online activ-ity to mood changes. We attempt to construct such systemexperimentally. Specifically, using appropriately collecteddatasets, we explore whether mood changes can be cor-related with particular features extracted from online activ-ities on social networking sites. The results of this analysisis then used to train the classifiers that can identify userswhose mood changes can be predicted using online data.
Data collectionMethodologyWe conducted a study where we collected both online dataand ground truth data about the mood changes of OSNusers. Each participant was requested to share informationwith the research team about both their OSN activity and toreport mood changes during the study.

RecruitmentThe study was aimed at OSN users who maintain a rela-tively frequent interaction with Facebook and Twitter. Con-sidering the general statistics about daily use of OSNs [11]we targeted younger adults between 18-25 years old whoare considered more active online users. Specifically wetargeted students at a British University. The study was ad-vertised through a range of University forums and each in-terested student was asked to submit a short survey abouthow often they use OSNs. Of the 73 people who initiallyregistered their interest, 36 were chosen to participate inthe study.
Figure 2: Surveying theparticipant’s mood (top) andemotion (bottom) within the Easy Mapplication.
We ran the study during the end of the academic year andover the summer break. Our intention was to ensure thatstudents who participated would be part of the study duringtheir exam period as well as the summer break. With thisapproach we anticipated that participants would demon-strate a wider variability of mood changes, possibly due toexam pressure and the relaxed summer break period thatfollowed. Each participant was expected to be part of thestudy for approximately one month including part of theirexam period and at least two weeks after the end of theirexams. The average duration of participation was 28 days.
Ground Truth DataThe ground truth data collection required participants to in-stall the smartphone application Easy M 1 for Android orPACO 2 for iOS. Both applications prompted the partici-pants at 10pm every day to answer two questions: “Howwas your mood today, for the whole day in general?” and“How do you currently feel right now?”. Participants couldrespond to Q1 on a 7-point Likert scale with clearly markedextremes: -3 (bad) - +3 (good) (Figure 2 (top)). The one di-
1http://easy-m.io/2http://pacoapp.com/
mensional input was selected to match with the commonlyused Positive and Negative Affect Schedule (PANAS) todetect mood states [16]. Q2 was answered using an affectgrid, initially proposed by Russell [13], in which the partici-pant can easily record their emotion on a two dimensionalgrid: valance (x) and arousal (y) (Figure 2 (bottom)). Thetwo questions were carefully worded to ensure the partici-pants understood and could differentiate between the twoanswers that were required. By including questions aboutboth their general mood throughout the day, and their emo-tional state at the time of question, our intention was to en-sure that participants would not erroneously report theircurrent emotional state as their daily mood.
In order to maximise the response rate for the ground truthcollection we tried to keep the required interaction to theabsolute minimum (one notification per day). 10pm waschosen for the notification time which is before most partic-ipants are likely to be asleep. At the end of the study, theoverall response rate for the ground truth was 88%.
Self-reported mood changes are considered subjective.Particular people may tend to be more positive or nega-tive in general about their mood. To accommodate for suchbias we followed the same methodology as in [8]: We nor-malised the reported mood using the z-score as an objec-tive metric of mood change: zit =
xit−µi
σiwhere xit is the
mood reported by the participant i on date t, µi and σi arethe average and standard deviation of mood for that partici-pant over the duration of the study.
Online DataOnline data involved data about the participants’ activitieson Facebook and Twitter. Two crawlers were developed thatcollected online activity data from both OSNs. For Face-book, we used the Graph API to collect data about the par-ticipant’s activity from their personal timeline and their home

feed. These included their own posts along with likes andcomments on other people’s posts. It is important to notethat we were able to collect personal posts regardless ofthe privacy settings (i.e. public, friends only). The crawleralso collected select profile information such as the partici-pant’s demographics. From Twitter, the crawler collected allof the participant’s tweets, including replies and retweets,together with their friends and followers using their API. Thecrawlers were active for the duration of the study, collectinglive data every hour which was later compiled into a singledata feed for the whole duration of the study.
Data CleaningFollowing the end of the study, both datasets were cleaned.Specifically, days at the beginning and end of the studywere trimmed where there were no ground truth reportssubmitted by the participant. Some participants unneces-sarily reported their mood more than once per day, in whichcase the later time was used. Moreover, a number of partic-ipants were removed from the analysis using the followingheuristics: (i) the same mood was reported for every day ofthe study, or (ii) after trimming, the dataset was less than 15days long. After cleaning, the dataset consisted of a total of16 participants including 406 individual days of data (avg.25 days per participant) and 1,760 online actions (posts,likes, etc.) performed by the participants.
Mood detection
Facebook - posts
Posts per window (avg.) 1.4Days without posts per win-dow (avg.)
5.69 days
Twitter - tweets
Tweets per window (avg.) 11.2Days without tweets perwindow (avg.)
6.39 days
Table 1: Sparsity of posts andtweets within a 7-day window. Onaverage, almost six of the sevendays are without posts and tweetsfrom the participants.
It is reasonable to expect that mood detection may not bepossible for every OSN user. For some individuals their on-line activity can be more revealing of their psychologicalstate than others. In our analysis, we tested different fea-tures, looking at the percentage of users for whom therewas a statistically significant correlation (p < 0.05) withmood change (mood z-score).
FeaturesUsing the OSN activity dataset, features were generatedfor each individual participant for the duration of the study.Values were calculated over a sliding window of n days,with n−1 days overlap. The optimal size of the window wasestimated experimentally as shown in the “Results” section.
Sentiment AnalysisSentiment analysis has been applied widely to discover theemotional context of messages exchanged online, includ-ing OSNs [8, 12, 15]. We employed sentiment analysis onthe statuses and tweets that participants posted on Face-book and Twitter, using the Linguistic Inquiry Word Count(LIWC) dictionary. Through the LIWC toolkit we calculatedthe sentiment score S of each post using a method similarto [8]: S =
(npos−nneg)N where npos is the number of posi-
tive words, nneg is the number of negative words and N isthe total number of words in a post (S ∈ [−1, 1]).
For each participant we estimated the average sentimentscore per post within a window of 7 days and calculated thePearson correlation with the mood z-score over the samewindow. The number of participants that demonstrated sta-tistically significant correlations (p < 0.05) between theirmood and the sentiment score was relatively low. Specifi-cally for the Facebook posts, 38% of the participants showcorrelations between mood and sentiment score, and forTwitter only 6%. An interesting observation here is the cleardifference in participant behaviour on the two OSNs. Thesame participants appear to be more revealing of their psy-chological state on Facebook than on Twitter. To someextent this is expected considering that Twitter is a publicmedium compared with Facebook which could be arguedas being a more personal experience including friends andfamily. One possible explanation for the low performanceof the sentiment score, is the relatively sparse dataset that
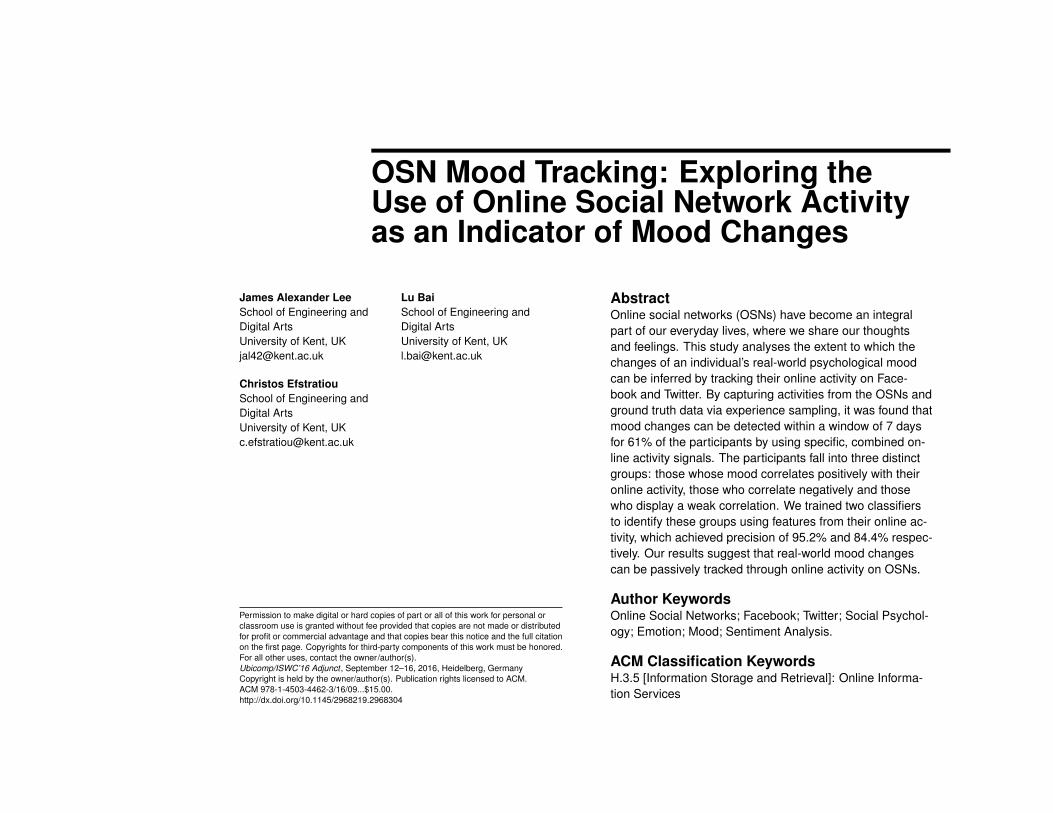
can be used for sentiment analysis. Within a window of 7days, less than 1.5 days on average contain users’ poststhat can be analysed (Table 1). Twitter usage, for our par-ticipants in particular, was especially limited. Overall, sen-timent score appeared to be a poor metric to identify real-world mood changes within a relatively short time frame.
0% 10% 20% 30% 40% 50% 60% 70%tSentiment
tTime0_5tDaysSinceLastActivity
fTypeStatusfTypeVideofTime12_17
tTypeRetweettTime6_11
tTime18_23tAverageStringLength
fPostCountfTime0_5
fTime6_11tTypeReply
tHashtagCounttMentionCount
tMentionCountUniquefComments
fTypeLinkfTypePhotofTime18_23fSentiment
tTime12_17tActivity
fAverageStringLengthfPostsToFriends
fLikestTypeStatus
activeActivitypassiveActivity
fDaysSinceLastActivityfActivity
totalOnlineActivity
Participants with significant correlations with mood (p<0.05)
Figure 3: The percentage ofparticipants who show significantcorrelations (p < 0.05) for eachfeature.
Statistical FeaturesUsing the datasets from Facebook and Twitter we calcu-lated the most significant actions that a user can performon the specific OSNs. These included counts of the follow-ing actions: Facebook status updates, likes, comments,posted links / photos / videos, Twitter posts, retweets, hash-tag counts and mention counts. We consider these val-ues as a reflection of the overall behaviour of each user onthese OSNs. One important point is that the complete set ofthese features is significantly more dense than the plain tex-tual posts / tweets that were considered for the sentimentanalysis. This enabled us to work with denser datasets ag-gregated over a similar time window.
We expanded the feature set with a number of calculated/ aggregate features that were derived from the plain fea-tures. Specifically, we calculated the total activity on eachOSN (fActivity and tActivity for Facebook and Twit-ter), as a sum of all the counts of online actions that theuser performs (e.g. posts, likes, comments, etc. on Face-book). We also calculated their overall online activitytotalOnlineActivity = fActivity + tActivity. This isa reflection of how active each participant was online irre-spective of the type of activity they performed. This was avery dense metric with values for almost every day of thestudy for every participant.
Motivated by the results from the work by De Choudhuryet al [5] we enriched our set with features that captured thetime of day that participants were active. Specifically, fea-
Feature Descriptionf/tSentiment Average sentiment score for posts and tweets
f/tAverageStringLength Average length of post on Facebook / tweet
fActivity # posts, likes, comments, posts to friends
tActivity # of tweets
activeActivity # posts, comments, tweets and replies
passiveActivity # likes and retweets
fLikes # likes on Facebook
fComments # comments on Facebook
fPostsToFriends # posts on friend’s timelines
tHashtagCount # hashtags and mentions in tweetstMentionCount
tMentionCountUnique # unique mentions in tweets
fPostCount # of posts and # of posts per typefTypeStatus/Link/ Pho-tos/Video
tPostCount # tweets and # of tweet per typetTypeStatus/Reply/Retweet
totalOnlineActivity fActivity + tActivity
f/tTimeA_B # of posts on Facebook / tweets within a time pe-riod (e.g. fTime6_11: # posts at 6:00–11:00)
f/tDaysSinceLastActivity # days since the participant was last active onFacebook and Twitter
Table 2: Description of features
tures fT ime0_5, fT ime6_11, etc. contain the averagecount of actions performed within the corresponding timewindows: 00:00–05:00, 06:00–11:00 and so forth.
Finally, we wanted to capture the level of engagement ofeach participant with each OSN. Based on common expe-rience with Facebook and Twitter, we classified the differ-ent types of online actions as “active” or “passive”. Activeactions contained actions such as submitting an originalpost or commenting on somebody else’s post, while passive
-1.00-0.75-0.50-0.250.000.250.500.751.00
p1 p2 p3 p4 p5 p6 p7 p8 p9 p10 p11 p12 p13 p14 p15 p16Cor
rela
tion
coef
ficie
nt
Participants
Total online activity Facebook activity Twitter activity
positive (p < 0.05) negative (p < 0.05) weak (p > 0.05)
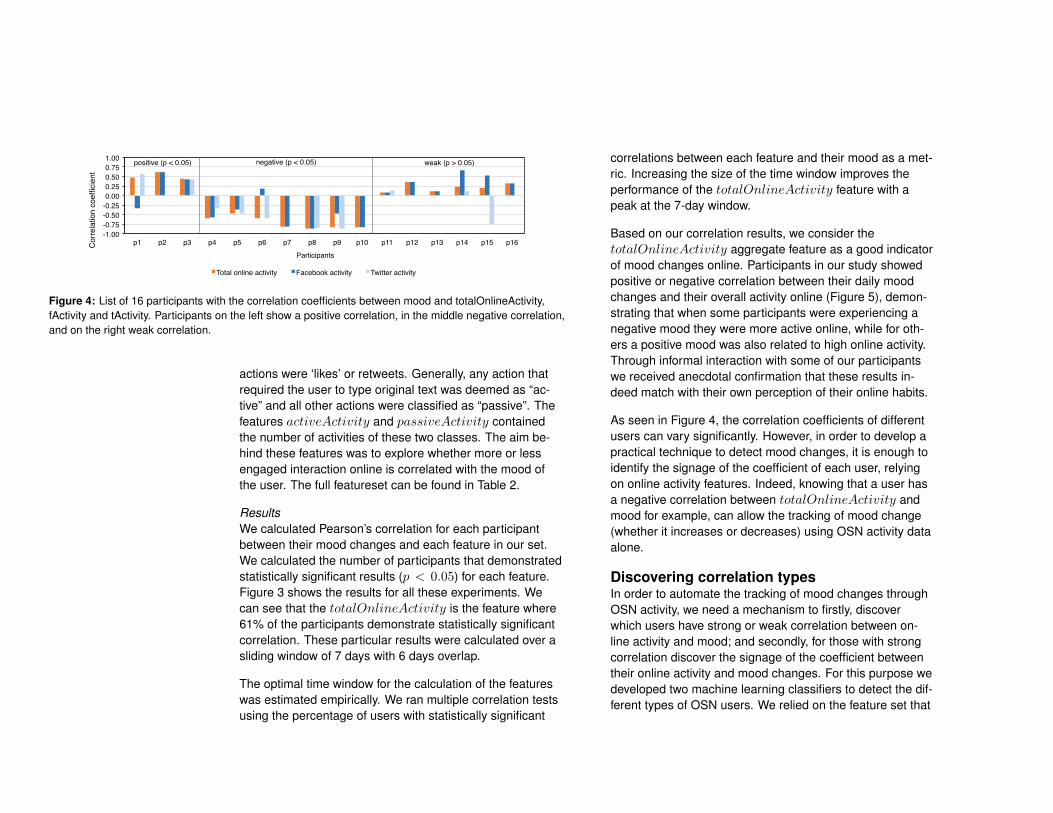
Figure 4: List of 16 participants with the correlation coefficients between mood and totalOnlineActivity,fActivity and tActivity. Participants on the left show a positive correlation, in the middle negative correlation,and on the right weak correlation.
actions were ‘likes’ or retweets. Generally, any action thatrequired the user to type original text was deemed as “ac-tive” and all other actions were classified as “passive”. Thefeatures activeActivity and passiveActivity containedthe number of activities of these two classes. The aim be-hind these features was to explore whether more or lessengaged interaction online is correlated with the mood ofthe user. The full featureset can be found in Table 2.
ResultsWe calculated Pearson’s correlation for each participantbetween their mood changes and each feature in our set.We calculated the number of participants that demonstratedstatistically significant results (p < 0.05) for each feature.Figure 3 shows the results for all these experiments. Wecan see that the totalOnlineActivity is the feature where61% of the participants demonstrate statistically significantcorrelation. These particular results were calculated over asliding window of 7 days with 6 days overlap.
The optimal time window for the calculation of the featureswas estimated empirically. We ran multiple correlation testsusing the percentage of users with statistically significant
correlations between each feature and their mood as a met-ric. Increasing the size of the time window improves theperformance of the totalOnlineActivity feature with apeak at the 7-day window.
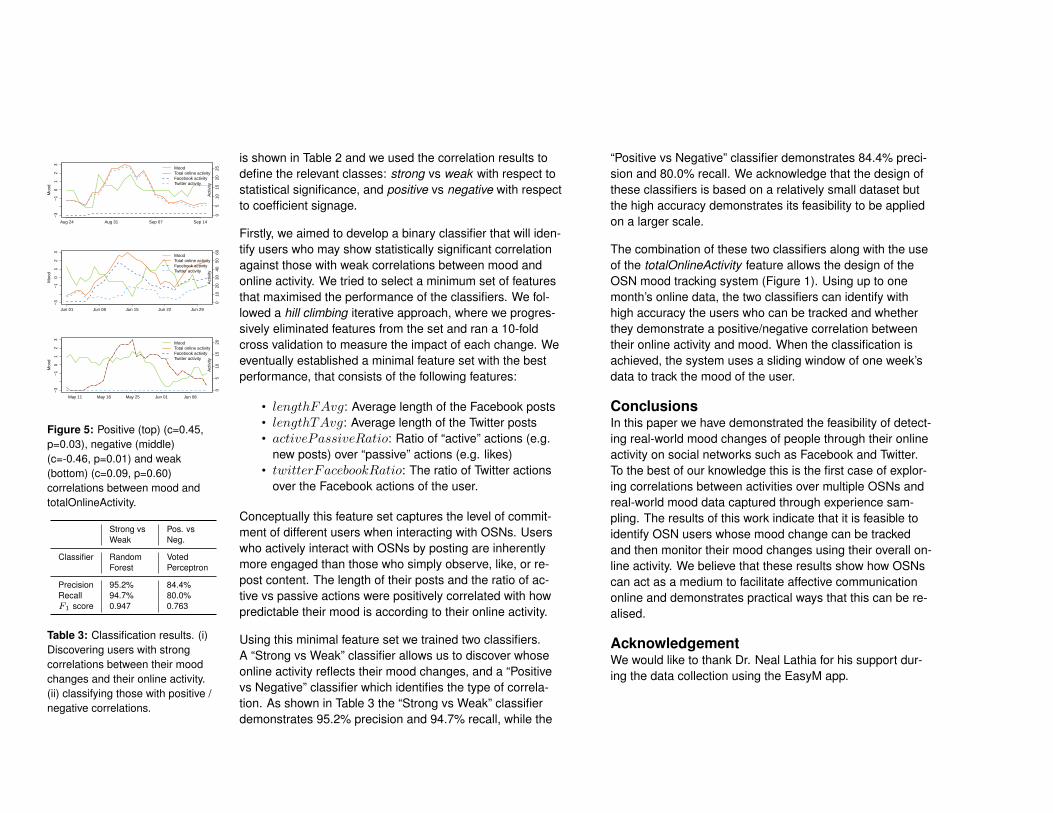
Based on our correlation results, we consider thetotalOnlineActivity aggregate feature as a good indicatorof mood changes online. Participants in our study showedpositive or negative correlation between their daily moodchanges and their overall activity online (Figure 5), demon-strating that when some participants were experiencing anegative mood they were more active online, while for oth-ers a positive mood was also related to high online activity.Through informal interaction with some of our participantswe received anecdotal confirmation that these results in-deed match with their own perception of their online habits.
As seen in Figure 4, the correlation coefficients of differentusers can vary significantly. However, in order to develop apractical technique to detect mood changes, it is enough toidentify the signage of the coefficient of each user, relyingon online activity features. Indeed, knowing that a user hasa negative correlation between totalOnlineActivity andmood for example, can allow the tracking of mood change(whether it increases or decreases) using OSN activity dataalone.
Discovering correlation typesIn order to automate the tracking of mood changes throughOSN activity, we need a mechanism to firstly, discoverwhich users have strong or weak correlation between on-line activity and mood; and secondly, for those with strongcorrelation discover the signage of the coefficient betweentheir online activity and mood changes. For this purpose wedeveloped two machine learning classifiers to detect the dif-ferent types of OSN users. We relied on the feature set that
is shown in Table 2 and we used the correlation results todefine the relevant classes: strong vs weak with respect tostatistical significance, and positive vs negative with respectto coefficient signage.
Aug 24 Aug 31 Sep 07 Sep 14
−3
−1
01
23
05
1015
2025
Moo
d
Act
ivity
MoodTotal online activityFacebook activityTwitter activity
Jun 01 Jun 08 Jun 15 Jun 22 Jun 29
−3
−1
01
23
010
2030
4050
60
Moo
d
Act
ivity
MoodTotal online activityFacebook activityTwitter activity
May 11 May 18 May 25 Jun 01 Jun 08
−3
−1
01
23
05
1015
20
Moo
d
Act
ivity
MoodTotal online activityFacebook activityTwitter activity
Figure 5: Positive (top) (c=0.45,p=0.03), negative (middle)(c=-0.46, p=0.01) and weak(bottom) (c=0.09, p=0.60)correlations between mood andtotalOnlineActivity.
Strong vsWeak
Pos. vsNeg.
Classifier RandomForest
VotedPerceptron
Precision 95.2% 84.4%Recall 94.7% 80.0%F1 score 0.947 0.763
Table 3: Classification results. (i)Discovering users with strongcorrelations between their moodchanges and their online activity.(ii) classifying those with positive /negative correlations.
Firstly, we aimed to develop a binary classifier that will iden-tify users who may show statistically significant correlationagainst those with weak correlations between mood andonline activity. We tried to select a minimum set of featuresthat maximised the performance of the classifiers. We fol-lowed a hill climbing iterative approach, where we progres-sively eliminated features from the set and ran a 10-foldcross validation to measure the impact of each change. Weeventually established a minimal feature set with the bestperformance, that consists of the following features:
• lengthFAvg: Average length of the Facebook posts• lengthTAvg: Average length of the Twitter posts• activePassiveRatio: Ratio of “active” actions (e.g.
new posts) over “passive” actions (e.g. likes)• twitterFacebookRatio: The ratio of Twitter actions
over the Facebook actions of the user.
Conceptually this feature set captures the level of commit-ment of different users when interacting with OSNs. Userswho actively interact with OSNs by posting are inherentlymore engaged than those who simply observe, like, or re-post content. The length of their posts and the ratio of ac-tive vs passive actions were positively correlated with howpredictable their mood is according to their online activity.
Using this minimal feature set we trained two classifiers.A “Strong vs Weak” classifier allows us to discover whoseonline activity reflects their mood changes, and a “Positivevs Negative” classifier which identifies the type of correla-tion. As shown in Table 3 the “Strong vs Weak” classifierdemonstrates 95.2% precision and 94.7% recall, while the
“Positive vs Negative” classifier demonstrates 84.4% preci-sion and 80.0% recall. We acknowledge that the design ofthese classifiers is based on a relatively small dataset butthe high accuracy demonstrates its feasibility to be appliedon a larger scale.
The combination of these two classifiers along with the useof the totalOnlineActivity feature allows the design of theOSN mood tracking system (Figure 1). Using up to onemonth’s online data, the two classifiers can identify withhigh accuracy the users who can be tracked and whetherthey demonstrate a positive/negative correlation betweentheir online activity and mood. When the classification isachieved, the system uses a sliding window of one week’sdata to track the mood of the user.
ConclusionsIn this paper we have demonstrated the feasibility of detect-ing real-world mood changes of people through their onlineactivity on social networks such as Facebook and Twitter.To the best of our knowledge this is the first case of explor-ing correlations between activities over multiple OSNs andreal-world mood data captured through experience sam-pling. The results of this work indicate that it is feasible toidentify OSN users whose mood change can be trackedand then monitor their mood changes using their overall on-line activity. We believe that these results show how OSNscan act as a medium to facilitate affective communicationonline and demonstrates practical ways that this can be re-alised.
AcknowledgementWe would like to thank Dr. Neal Lathia for his support dur-ing the data collection using the EasyM app.
REFERENCES1. M Argyle. 1972. Non-verbal communication in human
social interaction. In Non-verbal communication.Cambridge U. Press, 243–270.
2. RC Balabantaray, M Mohammad, and N Sharma.2012. Multi-class twitter emotion classification: A newapproach. International Journal of Applied InformationSystems 4, 1 (2012), 48–53.
3. J Bollen, H Mao, and A Pepe. 2011. Modeling publicmood and emotion: Twitter sentiment andsocio-economic phenomena. In Proceedings ofICWSM’11. 450–453.
4. M De Choudhury, S Counts, EJ Horvitz, and A Hoff.2014. Characterizing and predicting postpartumdepression from shared facebook data. In Proceedingsof the 17th ACM conference on CSCW’14. ACM,626–638.
5. M De Choudhury, M Gamon, S Counts, and E Horvitz.2013. Predicting Depression via Social Media. InProceedings of ICWSM’13.
6. M De Choudhury, E Kiciman, M Dredze, GCoppersmith, and M Kumar. 2016. Discovering shifts tosuicidal ideation from mental health content in socialmedia. In Proceedings of CHI’16. ACM, 2098–2110.
7. P Ekkekakis. 2012. Affect, Mood, and Emotion. InMeasurement in sport and exercise psychology,RC Eklund G Tenenbaum and A Kamata (Eds.).321–332.
8. A DI Kramer. 2010. An unobtrusive behavioral model ofgross national happiness. In Proceedings of theCHI’10. ACM, 287–290.
9. P Liu, W Tov, M Kosinski, DJ Stillwell, and L Qiu. 2015.Do Facebook Status Updates Reflect Subjective
Well-Being? Cyberpsychology, Behavior, and SocialNetworking 18, 7 (2015), 373–379.
10. DN Prata, KP Soares, MA Silva, DQ Trevisan, and PLetouze. 2016. Social Data Analysis of Brazilian’sMood from Twitter. International Journal of SocialScience and Humanity 6, 3 (2016), 179.
11. Pew Internet Project. 2014. Social Networking FactSheet. (2014). http://www.pewinternet.org/fact-sheets/social-networking-fact-sheet/
12. D Quercia, J Ellis, L Capra, and J Crowcroft. 2012.Tracking gross community happiness from tweets. InProceedings of CHI’12. ACM, 965–968.
13. J A Russell, A Weiss, and GA Mendelsohn. 1989.Affect grid: a single-item scale of pleasure and arousal.Journal of personality and social psychology 57, 3(1989), 493.
14. A Sadilek, HA Kautz, and V Silenzio. 2012. ModelingSpread of Disease from Social Interactions. InProceedings of ICWSM’12.
15. N Wang, M Kosinski, DJ Stillwell, and J Rust. 2014.Can well-being be measured using Facebook statusupdates? Validation of Facebook’s Gross NationalHappiness Index. Social Indicators Research 115, 1(2014), 483–491.
16. D Watson, LA Clark, and A Tellegen. 1988.Development and validation of brief measures ofpositive and negative affect: the PANAS scales. Journalof personality and social psychology 54, 6 (1988),1063.