osc ib revision guides books/group 3... · the material in this revision guide has been developed...
TRANSCRIPT
OSC IB REVISION GUIDESfor the International Baccalaureate Diploma Programme
oscOSC IB Revision Guides Published by OSC Publishing, Aristotle House, Aristotle Lane Oxford 0X2 6TP, UK
IB EconomicsHL 1st editiorf^QdC*Copyright © 2004 Stephen Holroyd
978-1-904534-51-8
No part of this publication may be reproduced, stored in a retrieval system, or transmitted in any form or by any means, without the prior permission of the publishers.
PHOTOCOPYING ANY PAGES FROM THIS PUBLICATION IS PROHIBITED.
The material in this Revision Guide has been developed independently of the International Baccalaureate Organisation.
OSC IB Revision Guides are available in most major IB subject areas.Full details of all our current titles, prices and sample pages as well as future releases are available on our website.
How to orderOrders can be made via the website, e-mail, fax, phone or mail; contact numbers and addresses below.
OSCAristotle House, Aristotle Lane Oxford 0X2 6TP, UK T : +44 (0) 1865 512802 F : +44 (0) 1865 512335 E : [email protected] W: osc-ib.com
About the authorStephen Holroyd is an experienced economics teacher and has been teaching the IB for twelve years. He has examined for the IB since 1999 and teaches regularly on OSC revision courses. He is currently head of Economics, Politics and Business Studies at Malvern College, Worcestershire, England.
Social responsibilityThe OSC team are extremely proud that our profits benefit the McCall MacBain Foundation, funding socially beneficial activities in health, education, and the environment.
Title texture: Photocopy tonerPrinted by: WFM Print Solutions, Tonbridge, Kent
CONTENTS
ABOUT THIS BO O K............................................................... ..3Introduction to Economics......................................................4M icroeconom ics.......................................................................7
Demand.......................................................................... ..7Supply............................................................................. ..9Equilibrium.........................................................................10Government Intervention in the M arket..........................12
Elasticities of Demand and Supply........................................ ...17Price Elasticity of Demand............................................ ..17Cross Elasticity of Demand.............................................19Income Elasticity of Demand...........................................20Price Elasticity of Supply.................................................20
Market Failure and Government Response.............................22Externalities.......................................................................22Negative Externalities.................................................... ..22Positive Externalities..................................................... ..25Public Goods....................................................................27Merit and Demerit G oods................................................26Monopoly Power............................................................. .26
Theory of the Firm.....................................................................29Aims and Objectives of F irm s................................................. .29
Costs in the Short R un .....................................................29Costs in the Long R u n .....................................................30Revenue......................................................................... ..32P rofit................................................................................ ..34Perfect Competition....................................................... ..35Monopoly........................................................................ ..36Perfect Competition and Monopoly Compared........... ..37Monopolistic Competition................................................38Oligopoly......................................................................... .39Price Discrimination.................................................... .....40
M acroeconom ics......................................................................42Measuring National Income.................................................. ... 42Circular Flow of Income.............................................................42Macroeconomic M ode ls ..........................................................43
Macro Policy Objectives................................................ ...43Aggregate Demand and Supply Analysis.................... ..44The Multiplier and Accelerator...................................... ..48Demand-side and Supply-side Policies...........................49
Unemployment and Inflation.....................................................51Unemployment............................................................. ....51Inflation........................................................................ .....53The Keynesian/Monetarist Debate............................... .56
International Economics.........................................................61Reasons for Trade......................................................................61
Absolute Advantage...................................................... ..61Comparative Advantage................................................ .61
T rad el Protectionism.................................................................63Economic integration..................................................................64Balance of Payments............................................................... .65Exchange Rates........................................................................66Balance of Payments and Exchange Rates............................69Terms of Trade....................................................................... ....71
Development Economics........................................................72Distinction between Growth and Development.................... ... 72Characteristics of Economic G rowth...................................... ..72Indicators of Economic Development.......................................73Sources of Economic Development....................................... ..73Consequences of Growth......................................................... ..74Barriers to Economic Growth/Development..............................75Development Strategies.......................................................... ..77Revision Advice....................................................................... ..83Examination Technique and Model Answers.................... ..85
Multiple Choice............................................................... ..85Essays............................................................................ ...86Short Answers...................................................................87Data Response............................................................... ..92
Acknowledgements
In writing this guide I am indebted to the word-processing skills of Sophie Holroyd.

ABOUT THIS BOOK
This is not a textbook. By the time you read this, you should already have covered the whole syllabus and have attempted some examination-style questions. This guide will give you a solid outline of all the material in the Higher Economics Syllabus, but it should be used in conjunction with your experiences in class, your own notes, your textbooks, and past papers.
In this guide the emphasis is on subject knowledge, the structure of that knowledge, and how to answer examination questions. The final exam is not only a test of knowledge, but also a test of how you use economic theories and concepts to solve economic questions and problems. A good candidate will therefore see the contents of this book more as a toolkit with which they can successfully tackle the questions with which they are faced and maximise their exam mark. At the end of each section there are sample IB-type questions for you to put this approach into practice. The answer/model plans for these questions are in the final section of the guide so that you can attempt the questions as you progress through each section and then check your efforts by turning to the back of the guide. All successful candidates will have attempted as many past papers and examination-style questions as possible. It is the most efficient and effective way to test the knowledge you are consolidating in your revision programme. Although your final examination does not include multiple choice questions I have included a few at the end of each section as they are a good test of your basic knowledge.
Key terms are printed in bold type and definitions are signalled by italicised type.
This guide contains a considerable number of diagrams, and I make no apologies for this! Whilst I might have had to be economical with the explanation of some ideas, diagrams could not be sacrificed. They are central to all aspects of the examination. You will be asked questions about diagrams, and any good candidate will be expected to use diagrams to illustrate their work.
Each page is printed with a wide margin. As I go through each area of the syllabus I have highlighted key exam skills and hints relevant to that particular area in this margin.
Please feel free to email me at [email protected] with any feedback, so later editions of this guide may be revised to improve the help given to candidates.
Best of luck for your revision!
Stephen Holroyd
It is important that you understand that the act of investment involves the buying of capital goods and has nothing to do with money.
INTRODUCTION TO ECONOMICS
SCARCITY
The basic economic problem is scarcity. But, to be more accurate, the problem is finite resources (land, labour, capital and enterprise) in relation to infinite wants. Because these resources are finite, individual consumers, firms and governments constantly have to make choices between having one thing, and not having another. These choices can be focused down into three questions.
What to produce?How to produce?For whom to produce?
All economies, whether tending to command or to free market, exist as an attempted solution to these three questions. All economies, including developed and less developed, face the same problem, and therefore the same questions. For example, developed economies might face the choice between more nuclear weapons or more healthcare, whereas a less developed country (LDC) might face a choice between clean water and basic vaccination programmes.
Factors of Production are the scarce resources that an economy has at its disposal to produce goods and services.
Land represents natural resources Labour is the human resourceCapital is goods that are used to produce other goods, and requires an economy to forgo current consumption. Enterprise, also a human resource, organises the three other factors to produce goods and services. The reward for this risky activity is profit.
Allocation of these resources can be organised through several different Economic Systems. In the end, all economies are mixed, although some will tend towards free market (e.g. UK, USA), and others will tend towards centrally planned or command (North Korea, Cuba). Traditional systems still exist in many of the poorest LDCs, and involve actions such as barter, gift and communal activities
Opportunity Cost is the cost of the next best thing forgone. As long as economic resources are used in the production of a good or service, a cost is involved, even if a price is not. Opportunity Cost is a classic early multiple choice question.
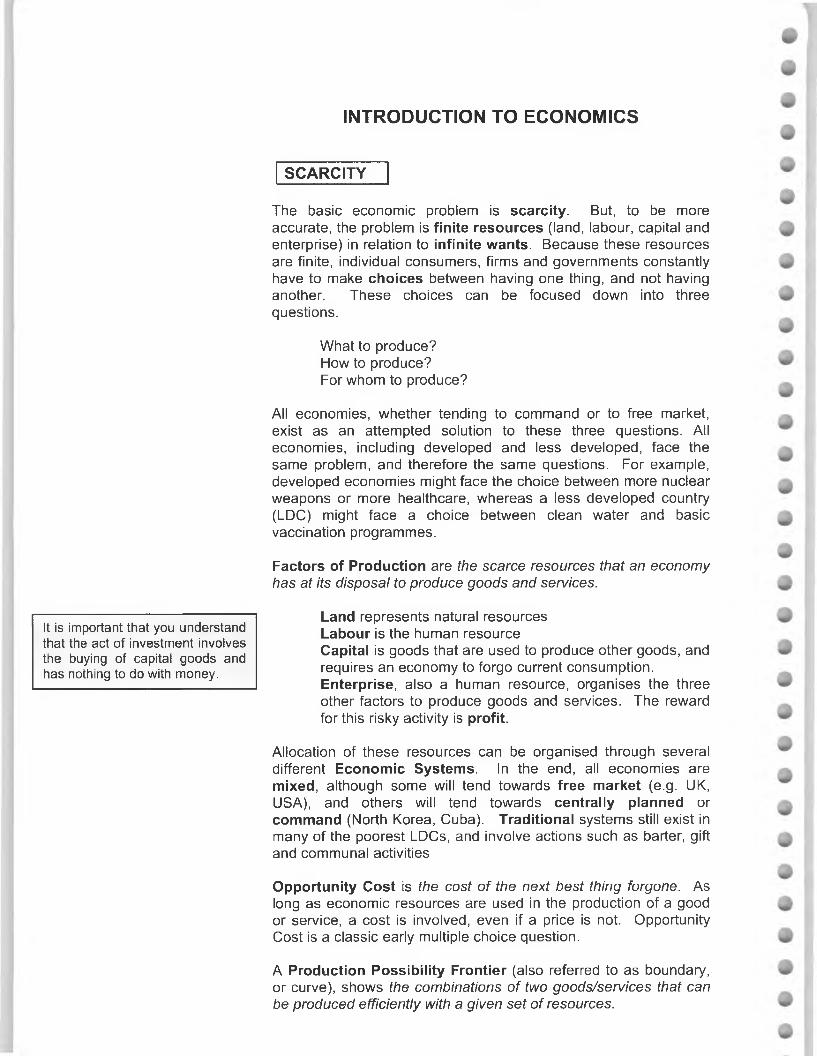
A Production Possibility Frontier (also referred to as boundary, or curve), shows the combinations of two goods/services that can be produced efficiently with a given set o f resources.
X
You will normally see a curved PPF, because as more of one good (X) is produced, more of the other good (Y) has to be given up in order to produce each marginal unit of (X). As we shall see later on, this is due to the law of diminishing returns.
Any combination of goods produced within the PPF (A) means that there are unemployed resources. Points on the PPF (B) represent different bundles of goods, but with fully employed resources. Points beyond the PPF (C) are currently unattainable. In order to attain these points, an economy would have to increase the number of resources, increase the productivity (efficiency) of its current resources, or improve technology. For example, Brazil discovers offshore oil, a developed economy invests in its human capital, and car factories become robotised.
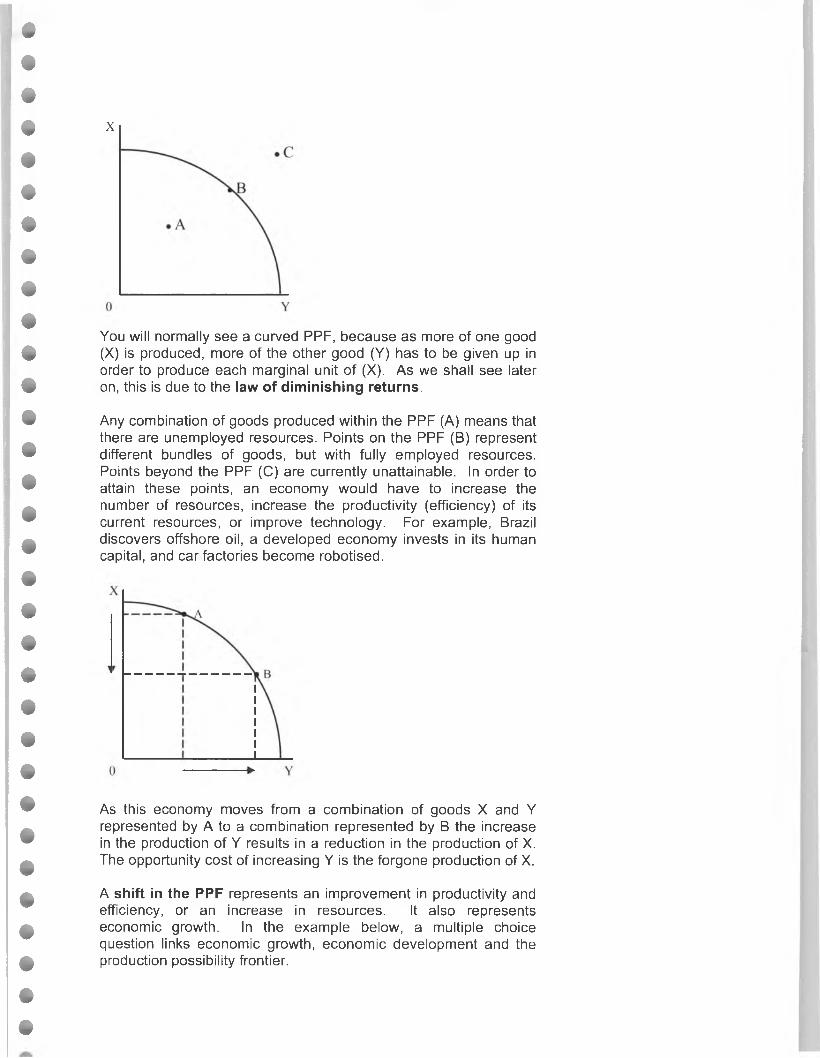
As this economy moves from a combination of goods X and Y represented by A to a combination represented by B the increase in the production of Y results in a reduction in the production of X. The opportunity cost of increasing Y is the forgone production of X.
A shift in the PPF represents an improvement in productivity and efficiency, or an increase in resources. It also represents economic growth. In the example below, a multiple choice question links economic growth, economic development and the production possibility frontier.
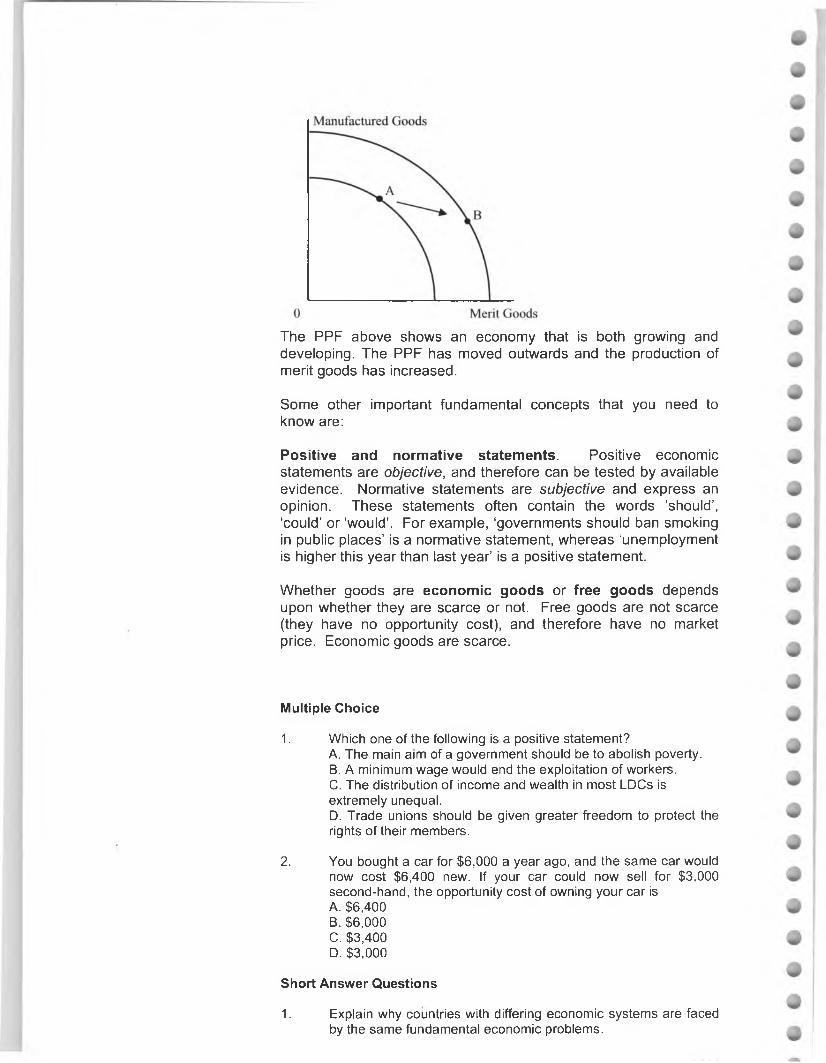
The PPF above shows an economy that is both growing and developing. The PPF has moved outwards and the production of merit goods has increased.
Some other important fundamental concepts that you need to know are:
Positive and normative statements. Positive economic statements are objective, and therefore can be tested by available evidence. Normative statements are subjective and express an opinion. These statements often contain the words ‘should’, ‘could’ or ‘would’. For example, ‘governments should ban smoking in public places’ is a normative statement, whereas ‘unemployment is higher this year than last year’ is a positive statement.
Whether goods are economic goods or free goods depends upon whether they are scarce or not. Free goods are not scarce (they have no opportunity cost), and therefore have no market price. Economic goods are scarce.
Multiple Choice
1. Which one of the following is a positive statement?A. The main aim of a government should be to abolish poverty.B. A minimum wage would end the exploitation of workers.C. The distribution of income and wealth in most LDCs is extremely unequal.D. Trade unions should be given greater freedom to protect the rights of their members.
2. You bought a car for $6,000 a year ago, and the same car would now cost $6,400 new. If your car could now sell for $3,000 second-hand, the opportunity cost of owning your car isA. $6,400B. $6,000C. $3,400D. $3,000
Short Answer Questions
1. Explain why countries with differing economic systems are faced by the same fundamental economic problems.
2. Use a production possibilities frontier to explain why a country choosing to consume or invest faces the concept of opportunity cost.
MICROECONOMICS
MARKETS
A market is a place where buyers (demand) and sellers (supply) meet. Prices are determined in a free market solely by the interaction of demand and supply. As we shall see later on, governments can and do intervene to influence both price and output, and therefore the allocation of resources.
Demand
You cannot avoid knowing about this most important area of syllabus areas. You MUST expect it to be tested in all three papers on markets, how they work, how governments intervene in them and how they fail.
Effective demand is a want backed by money, and the willingness to pay. Other things being equal, more will be demanded at lower prices than at higher prices, and so there will be an inverse relationship between price and quantity.
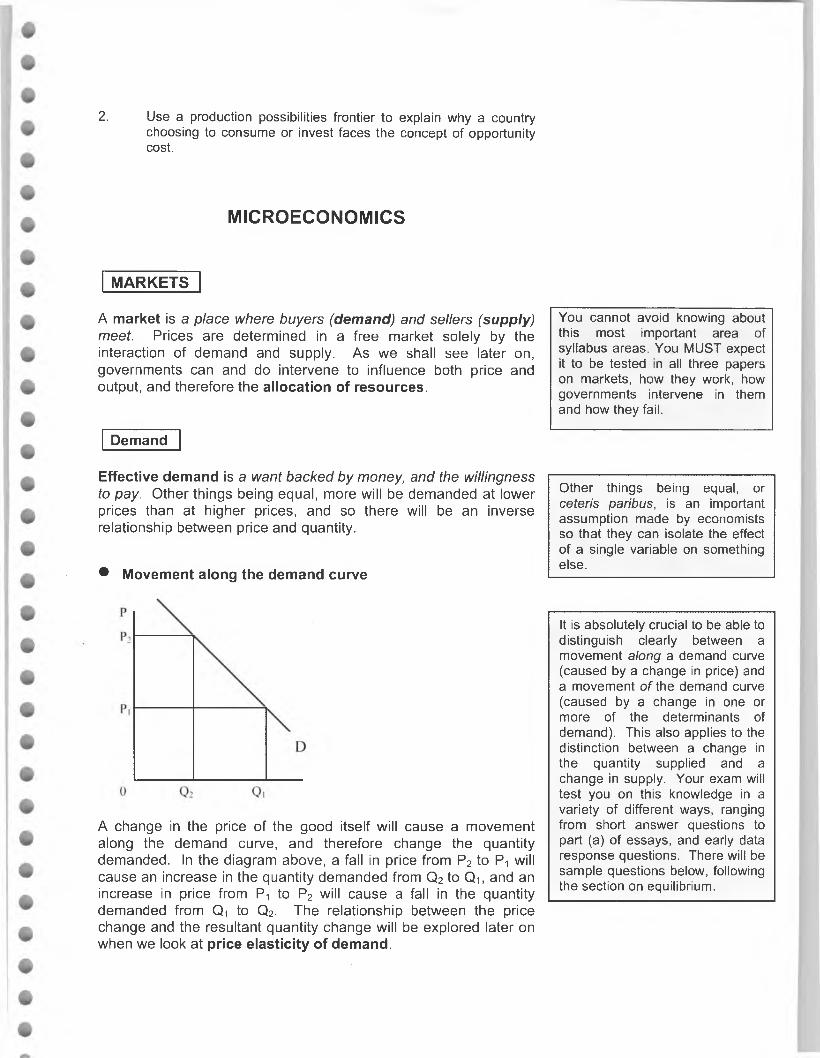
• Movement along the demand curve
A change in the price of the good itself will cause a movement along the demand curve, and therefore change the quantity demanded. In the diagram above, a fall in price from P2 to Pt will cause an increase in the quantity demanded from Q2 to Qi, and an increase in price from P1 to P2 will cause a fall in the quantity demanded from Q-i to Q2. The relationship between the price change and the resultant quantity change will be explored later on when we look at price elasticity of demand.
Other things being equal, or ceteris paribus, is an important assumption made by economists so that they can isolate the effect of a single variable on something else.
It is absolutely crucial to be able to distinguish clearly between a movement along a demand curve (caused by a change in price) and a movement of the demand curve (caused by a change in one or more of the determinants of demand). This also applies to the distinction between a change in the quantity supplied and a change in supply. Your exam will test you on this knowledge in a variety of different ways, ranging from short answer questions to part (a) of essays, and early data response questions. There will be sample questions below, following the section on equilibrium.
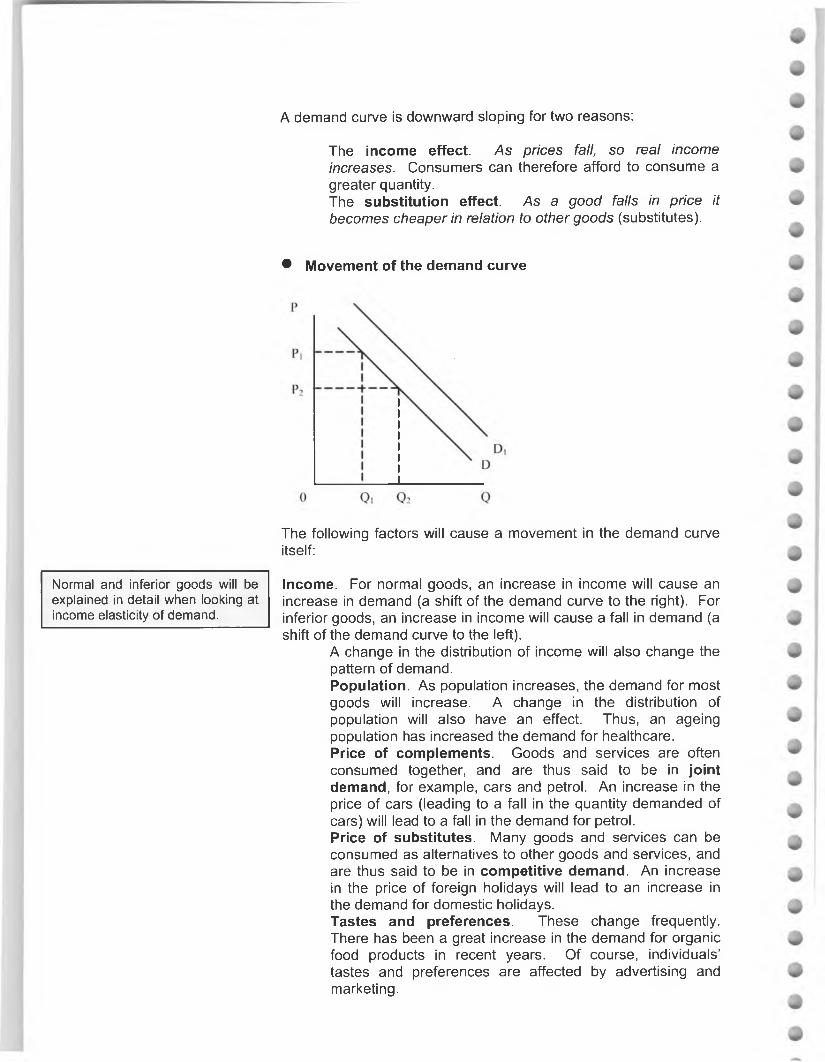
A demand curve is downward sloping for two reasons:
Normal and inferior goods will be explained in detail when looking at income elasticity of demand.
The income effect. As prices fall, so real income increases. Consumers can therefore afford to consume a greater quantity.The substitution effect. As a good falls in price it becomes cheaper in relation to other goods (substitutes).
• Movement of the demand curve
The following factors will cause a movement in the demand curve itself:
Income. For normal goods, an increase in income will cause an increase in demand (a shift of the demand curve to the right). For inferior goods, an increase in income will cause a fall in demand (a shift of the demand curve to the left).
A change in the distribution of income will also change the pattern of demand.Population. As population increases, the demand for most goods will increase. A change in the distribution of population will also have an effect. Thus, an ageing population has increased the demand for healthcare.Price of complements. Goods and services are often consumed together, and are thus said to be in joint demand, for example, cars and petrol. An increase in the price of cars (leading to a fall in the quantity demanded of cars) will lead to a fall in the demand for petrol.Price of substitutes. Many goods and services can be consumed as alternatives to other goods and services, and are thus said to be in competitive demand. An increase in the price of foreign holidays will lead to an increase in the demand for domestic holidays.Tastes and preferences. These change frequently. There has been a great increase in the demand for organic food products in recent years. Of course, individuals’ tastes and preferences are affected by advertising and marketing.
• Perverse demand curvesThere are three reasons why a demand curve might display a positive relationship between price and quantity, resulting in an upward-sloping demand curve. These are:
Goods of conspicuous consumption, (also known as Veblenesque goods). Some people buy luxury goods for ‘snob value’, for example expensive trainers.Speculative goods. As share prices rise, the quantity demanded of these shares increases, as individuals predict further price increases.Giffen goods. If a good is very inferior and represents a large part of a consumer's expenditure then the income effect of an increase in price may outweigh the substitution effect so leading to an increase in the quantity demanded.
Supply
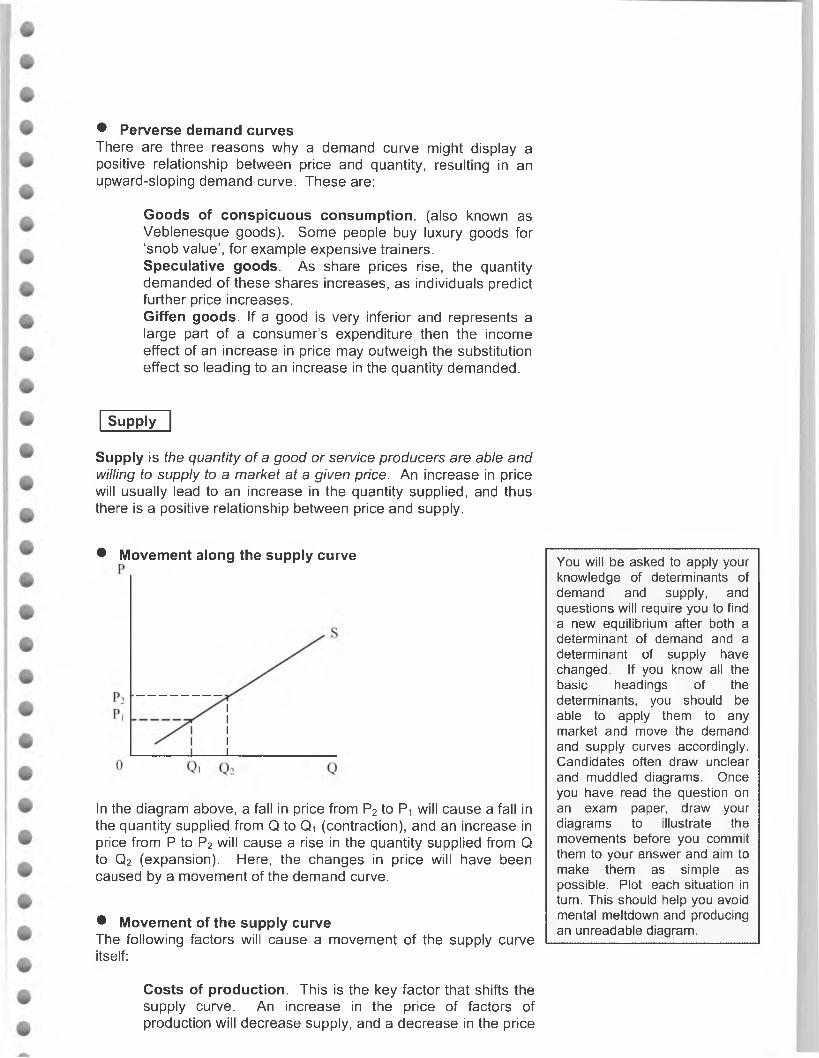
Supply is the quantity of a good or service producers are able and willing to supply to a market at a given price. An increase in price will usually lead to an increase in the quantity supplied, and thus there is a positive relationship between price and supply.
• Movement along the supply curve
In the diagram above, a fall in price from P2 to Pt will cause a fall in the quantity supplied from Q to Qt (contraction), and an increase in price from P to P2 will cause a rise in the quantity supplied from Q to Q2 (expansion). Here, the changes in price will have been caused by a movement of the demand curve.
• Movement of the supply curveThe following factors will cause a movement of the supply curve itself:
You will be asked to apply your knowledge of determinants of demand and supply, and questions will require you to find a new equilibrium after both a determinant of demand and a determinant of supply have changed. If you know all the basic headings of the determinants, you should be able to apply them to any market and move the demand and supply curves accordingly. Candidates often draw unclear and muddled diagrams. Once you have read the question on an exam paper, draw your diagrams to illustrate the movements before you commit them to your answer and aim to make them as simple as possible. Plot each situation in turn. This should help you avoid mental meltdown and producing an unreadable diagram.
Costs of production. This is the key factor that shifts the supply curve. An increase in the price of factors of production will decrease supply, and a decrease in the price

of factors of production will increase supply. An increase in the productivity of factors will increase supply.Technology. Technological advances reduce costs of production and so shift the supply curve to the right.New firms entering a market. Any new firm that enters a market will increase market supply. This will be explored more when looking at perfect competition.Indirect taxes and subsidies. Taxes will decrease supply, and subsides will increase supply.Price of substitutes. A rise in the price of apples will encourage fruit growers to move from growing pears etc. to producing apples, and thus the supply of pears will decrease.
S to Si represents a decrease in supply and S to S2 represents an increase in supply.
Equilibrium: the interaction of demand and supply
Examination questions in all three papers frequently ask candidates to illustrate, explain and analyse price changes, and a flexible knowledge of the determinants of demand and supply and the forces that lead to equilibrium is something that any successful candidate must have. You should see the determinants of demand and supply as flexible tools that you can apply to any market (house prices, oil prices and commodity prices) to explain price movements.
Equilibrium exists when demand equals supply (P,Q). Disequilibrium exists if there is a situation of excess demand (at Pi) or excess supply (at P2).
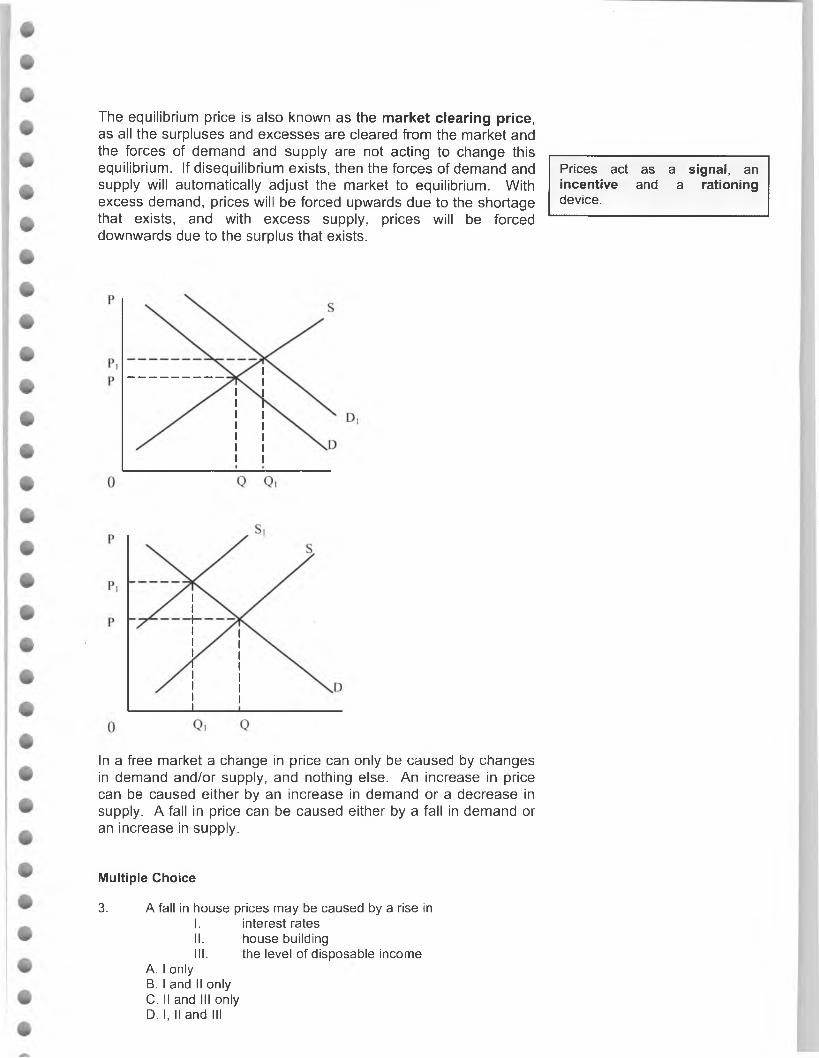
The equilibrium price is also known as the market clearing price, as all the surpluses and excesses are cleared from the market and the forces of demand and supply are not acting to change this equilibrium. If disequilibrium exists, then the forces of demand and supply will automatically adjust the market to equilibrium. With excess demand, prices will be forced upwards due to the shortage that exists, and with excess supply, prices will be forced downwards due to the surplus that exists.
Prices act as a signal, an incentive and a rationingdevice.
In a free market a change in price can only be caused by changes in demand and/or supply, and nothing else. An increase in price can be caused either by an increase in demand or a decrease in supply. A fall in price can be caused either by a fall in demand or an increase in supply.
Multiple Choice
3. A fall in house prices may be caused by a rise inI. interest ratesII. house buildingIII. the level of disposable income
A. I onlyB. I and II onlyC. II and III onlyD. I, II and III
4. Which of the following factors will cause the demand curve for a good to shift to the right?A. a reduction in indirect taxationB. a fall in the price of a substituteC. a fall in the price of a complementD. a decrease in income
5. Which one of the following statements referring to the price system is true?A. The consumer has complete sovereignty in the market.B. All members of society have their needs met by the price system.C. High prices ration scarce goods in accordance with the effective demand of consumers.D. The relative strength of consumer demand is signalled by low prices.
Short Answer Questions
3. Why does the price of a rented apartment in a popular holiday destination vary throughout the year?
4. A train company decides to reduce passenger fares. Explain the possible economic outcomes using economic concepts.
Price controls: government intervention in the market
It is important that you see the links between government intervention in the market, price elasticity of demand and supply, and market failure.
Governments intervene in markets because they believe that the equilibrium reached by the free market is not desirable. In other words, they believe that price and/or quantity are in the wrong place. Thus they employ a variety of methods to move both price and quantity. For example, most governments believe that the free market equilibrium price of cigarettes would be too low and therefore they tax them. Of course, there are issues of market failure involved here.
Questions are frequently asked about max/min prices in the multiple choice paper. Watch out for the question that puts the max price above or the min price below equilibrium. Such prices would have no effect on the market.
• Maximum and Minimum PricesA maximum price is also known as a price ceiling, and to beeffective it must be set below the market clearing price. A minimum price is also known as a price floor, and to be effective it must be set above the market clearing price. A classic example of a minimum price is minimum wage legislation, with the surplus Q3 to Q4 being unemployment in the labour market.
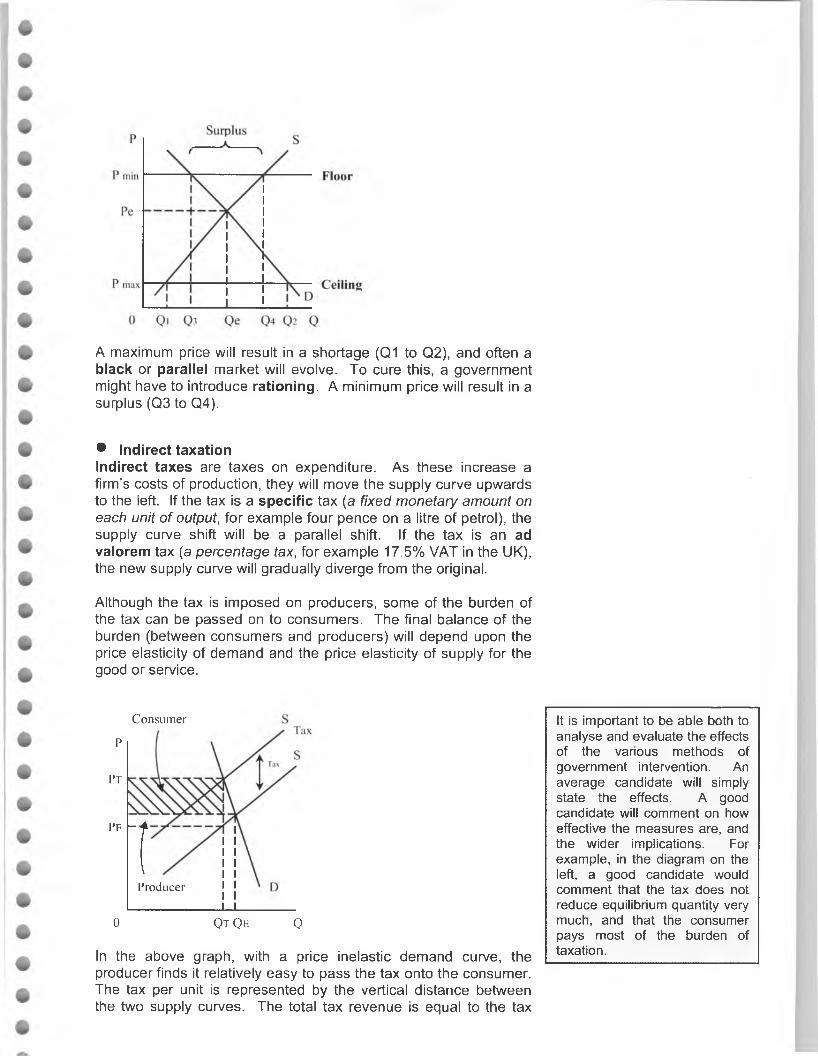
A maximum price will result in a shortage (Q1 to Q2), and often a black or parallel market will evolve. To cure this, a government might have to introduce rationing. A minimum price will result in a surplus (Q3 to Q4).
• Indirect taxationIndirect taxes are taxes on expenditure. As these increase a firm’s costs of production, they will move the supply curve upwards to the left. If the tax is a specific tax (a fixed monetary amount on each unit of output, for example four pence on a litre of petrol), the supply curve shift will be a parallel shift. If the tax is an ad valorem tax (a percentage tax, for example 17.5% VAT in the UK), the new supply curve will gradually diverge from the original.
Although the tax is imposed on producers, some of the burden of the tax can be passed on to consumers. The final balance of the burden (between consumers and producers) will depend upon the price elasticity of demand and the price elasticity of supply for the good or service.
Pt
Pe
Consumer
P
'(Producer
0 Qt Q e 0
In the above graph, with a price inelastic demand curve, the producer finds it relatively easy to pass the tax onto the consumer. The tax per unit is represented by the vertical distance between the two supply curves. The total tax revenue is equal to the tax
It is important to be able both to analyse and evaluate the effects of the various methods of government intervention. An average candidate will simply state the effects. A good candidate will comment on how effective the measures are, and the wider implications. For example, in the diagram on the left, a good candidate would comment that the tax does not reduce equilibrium quantity very much, and that the consumer pays most of the burden of taxation.
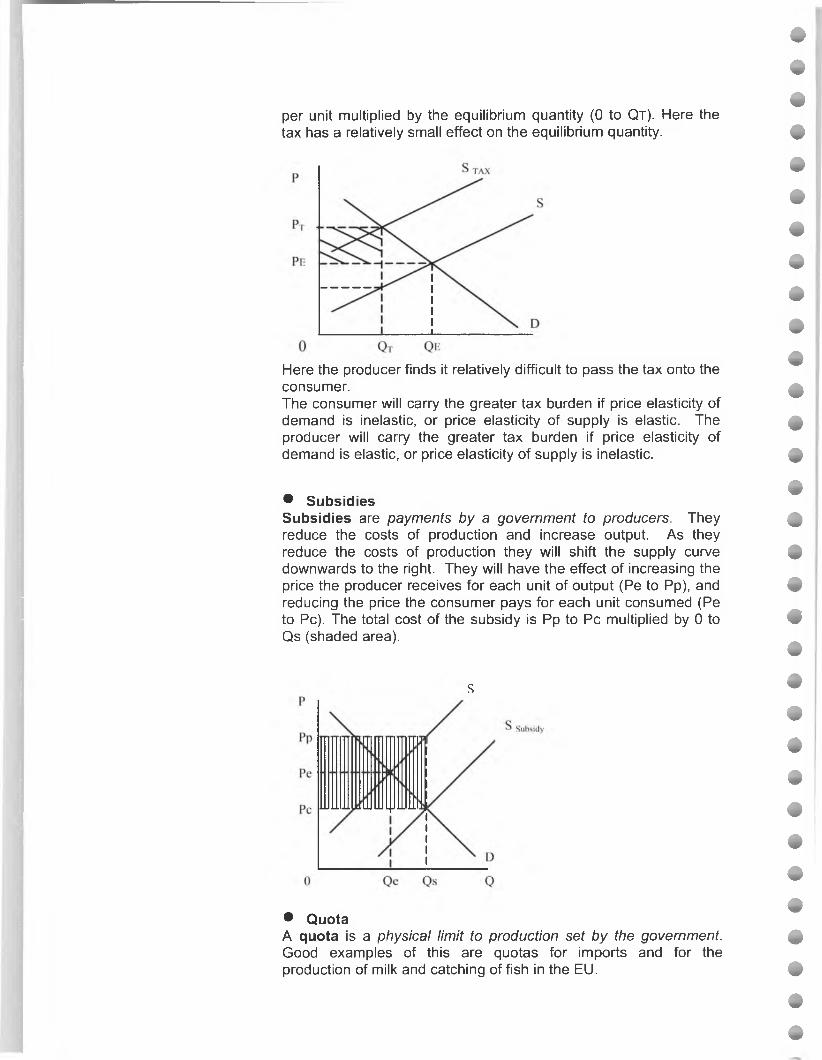
per unit multiplied by the equilibrium quantity (0 to Qt ). Here the tax has a relatively small effect on the equilibrium quantity.
Here the producer finds it relatively difficult to pass the tax onto the consumer.The consumer will carry the greater tax burden if price elasticity of demand is inelastic, or price elasticity of supply is elastic. The producer will carry the greater tax burden if price elasticity of demand is elastic, or price elasticity of supply is inelastic.
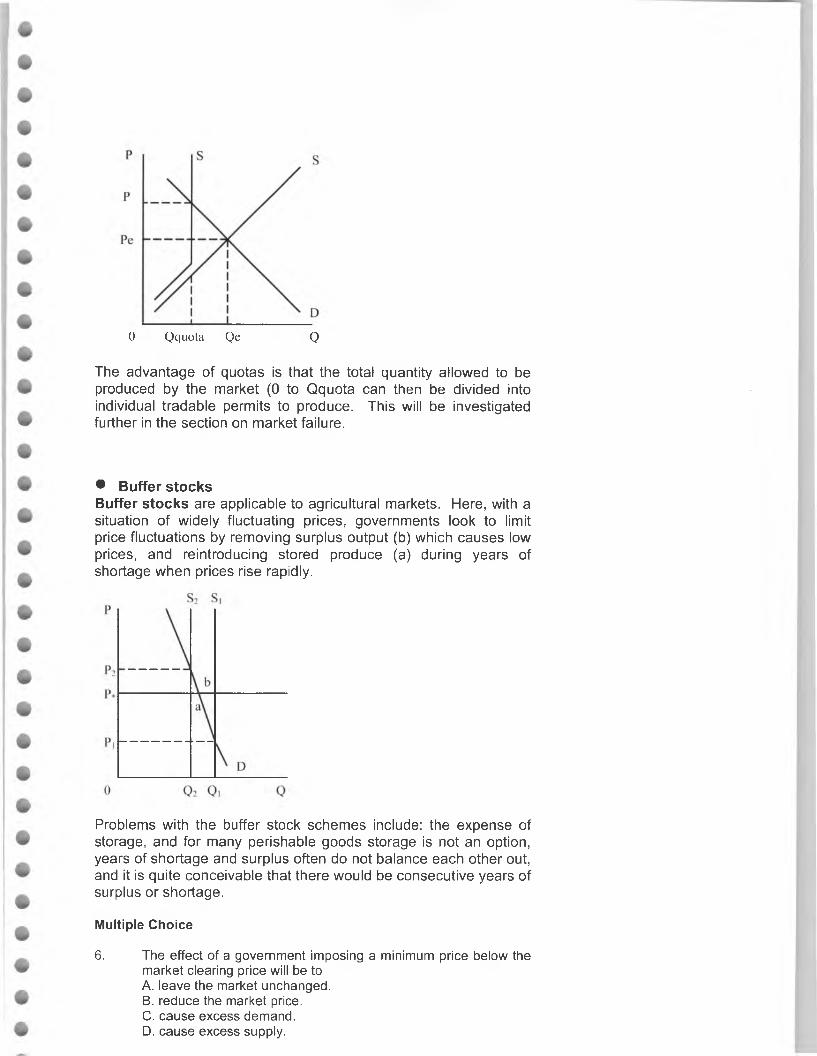
* SubsidiesSubsidies are payments by a government to producers. They reduce the costs of production and increase output. As they reduce the costs of production they will shift the supply curve downwards to the right. They will have the effect of increasing the price the producer receives for each unit of output (Pe to Pp), and reducing the price the consumer pays for each unit consumed (Pe to Pc). The total cost of the subsidy is Pp to Pc multiplied by 0 to Qs (shaded area).
S
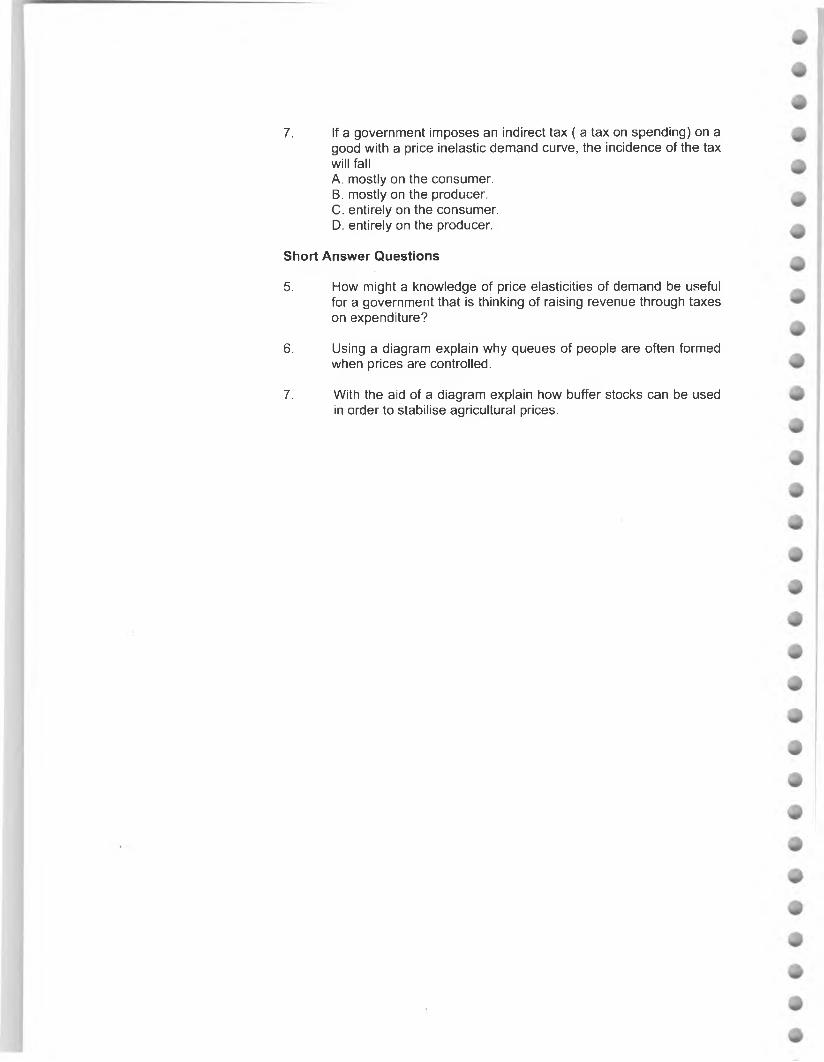
• QuotaA quota is a physical limit to production set by the government. Good examples of this are quotas for imports and for the production of milk and catching offish in the EU.
0 Qquota Qe Q
The advantage of quotas is that the total quantity allowed to be produced by the market (0 to Qquota can then be divided into individual tradable permits to produce. This will be investigated further in the section on market failure.
• Buffer stocksBuffer stocks are applicable to agricultural markets. Here, with a situation of widely fluctuating prices, governments look to limit price fluctuations by removing surplus output (b) which causes low prices, and reintroducing stored produce (a) during years of shortage when prices rise rapidly.
Problems with the buffer stock schemes include: the expense of storage, and for many perishable goods storage is not an option, years of shortage and surplus often do not balance each other out, and it is quite conceivable that there would be consecutive years of surplus or shortage.
Multiple Choice
6. The effect of a government imposing a minimum price below the market clearing price will be toA. leave the market unchanged.B. reduce the market price.C. cause excess demand.D. cause excess supply.
7. If a government imposes an indirect tax ( a tax on spending) on a good with a price inelastic demand curve, the incidence of the tax will fallA. mostly on the consumer.B. mostly on the producer.C. entirely on the consumer.D. entirely on the producer.
Short Answer Questions
5. How might a knowledge of price elasticities of demand be useful for a government that is thinking of raising revenue through taxes on expenditure?
6. Using a diagram explain why queues of people are often formed when prices are controlled.
7. With the aid of a diagram explain how buffer stocks can be used in order to stabilise agricultural prices.
ELASTICITIES OF DEMAND AND SUPPLY
Elasticity measures the responsiveness of one variable to a change in another.
Price Elasticity of Demand
Price Elasticity of Demand (PED) measures the responsiveness of the quantity demanded to a change in price.
PED = % change in quantity demanded % change in price
An alternative formula which is very useful is
PED = AQ/Q AP/P
where AQ is the change in quantity demanded, Q is the original quantity, AP is the change in price, and P is the original price.
The calculation of PED results in a coefficient, or real number, and this tells us two major things about the responsiveness of the quantity demanded to a change in price.
Sign (positive or negative) gives information about the direction of the relationship. For all Normal goods, PED will be negative, as there is a negative relationship between price and quantity on a downward-sloping demand curve. We always ignore this negative sign. If PED is positive, then we have a perverse demand curve. Magnitude. The size of the number resulting from the elasticity calculation tells us about the degree of response. The bigger the number, the bigger the response, and vice versa.
PED >1 means the good is price elastic PED < 1 means the good is price inelastic PED = 1 means the good has unit elasticity PED = 0 means the good is perfectly price inelastic PED = 00 means the good is perfectly price elastic
Whilst the topic of elasticity in the IB syllabus is strictly a part of the Business Economics section, I feel that it is much more helpful to have an understanding of the concept of elasticity before government intervention in the market is studied in detail.
Many students have major problems with the topic of elasticity. They frequently see it as an isolated topic and an excuse for examiners to ask questions which involve numbers. The concept of elasticity is immensely important for economists, as it enables us more accurately to picture, analyse and evaluate what goes on in the real world. Without PED and PES our demand and supply analysis would not be half as effective.
Students should always look to comment on elasticity wherever they can, and if they are required or feel it necessary to draw a market, they should carefully consider whether they can use their knowledge of PED and PES to draw demand and supply curves which accurately reflect the market situation. For example, diagrams to illustrate agricultural markets should always have price inelastic demand and supply curves.
Price elastic means that the quantity demanded is highly responsive to a change in price. In the diagram below a change in price from Pi to P2 results in a large response in the quantity demanded from Q1 to Q2:
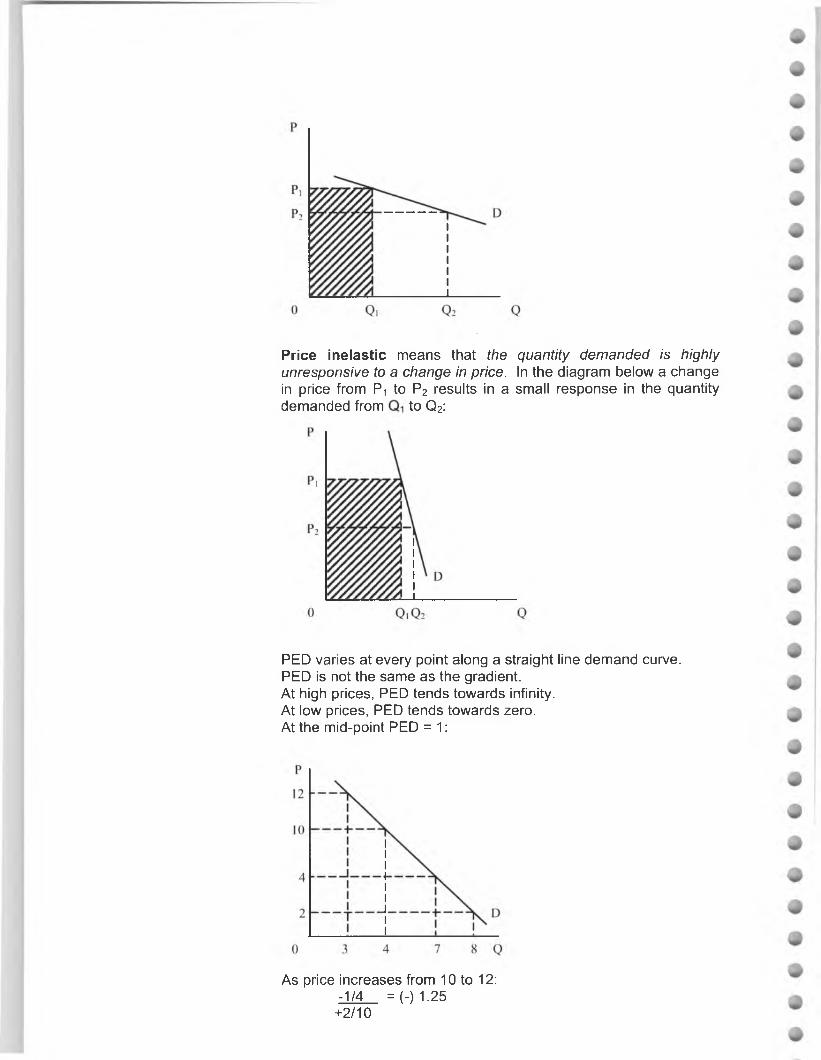
Price inelastic means that the quantity demanded is highly unresponsive to a change in price. In the diagram below a change in price from Pi to P2 results in a small response in the quantity demanded from to Q2:
PED varies at every point along a straight line demand curve. PED is not the same as the gradient.At high prices, PED tends towards infinity.At low prices, PED tends towards zero.At the mid-point PED = 1:
As price increases from 10 to 12: -1/4 = (-) 1.25 +2/10
As price increases from 2 to 4: -1/8 =(-) 0.125
+2/2
• Determinants of PEDCloseness of substitutes. PED will be more price elastic if there are close substitutes available.Luxury or necessity. Luxury goods tend to be price elastic, and necessities tend to be price inelastic.Percentage of income spent on the good. The smaller the percentage of income spent on a good, the more price inelastic demand will be.Time period. In the long run, demand tends to be more price elastic, as it takes time for consumers to react to price changes.
• PED and Total Revenue (TR)
TR = P x Q.
Total revenue is a useful way to check the PED of a demand curve. If a rise in price causes total revenue to increase, then PED is inelastic. If an increase in price causes total revenue to decrease, then the demand curve is price elastic. If an increase in price causes total revenue to increase then the demand curve is price inelastic. If a change in price does not change total revenue, the PED is unitary (= 1).
In the diagrams on the previous page TR at P2 = 0P2 x 0Q2. After an increase in price, TR at Pi = OPi x OQi (shaded area).
PED will appear again when we look at price discrimination, and the effects of a depreciation in the exchange rate on the balance of payments.
Cross Elasticity of Demand
Cross Elasticity of Demand (XED) measures the responsiveness of the quantity demanded of one good to a change in price of another.
XED = % change in quantity demanded good A % change in price good B
An alternative formula which is very useful is
XED = AQA/QA APb/Pb
where AQa is the change in quantity demanded of good A, Qa is the original quantity of good A, APB is the change in price of goodB, and Pb is the original price of good B.
Sign (positive or negative). Substitutes (goods in competitive demand) will have a positive XED.
You should see the link between XED and the price of other goods, which was compliments and substitutes as determinants of demand (see p. 8). A fall in the price of a complement will cause an increase in demand (a shift of the demand curve to the right) for the good that is in joint demand. A fall in the price of a substitute will cause a decrease in demand (a shift of the demand curve to the left) for the good that is in competitive rifimanri
Short answer questions quite often ask candidates to comment upon the determinants of demand and supply. If you know your determinants these are very simple questions on which to score high marks. Price elasticity of supply questions are often tied into the short run.
Complements (goods in joint demand) will have a negative XED.Magnitude. The higher the value of XED the closer the relationship (either complement or substitute) will be between the two goods in question.
Income Elasticity of Demand
Income Elasticity of Demand (YED) measures the responsiveness o f the quantity demanded to a change in the real income of consumers.
YED = % change in quantity demanded % change in real income
An alternative formula which is very useful is
YED = AQ/Q AY/Y
where AQ is the change in quantity demanded, Q is the original quantity, AY is the change in income, and Y is the original income.
Sign (positive or negative). Positive means that the good is a normal good (as income increases, so will the quantity demanded). Here an increase in income will result in the demand curve shifting to the right. Negative means that the good is an inferior good (as income increases, so the quantity demanded will fall). Here an increase in income will result in the demand curve shifting to the left. Magnitude. The higher the value of YED the closer the relationship will be between a change in income and the change in the quantity demanded.
Price Elasticity of Supply
Price Elasticity of Supply (PES) measures the responsiveness of the quantity supplied to a change in price.
PES = % change in quantity supplied % change in price
An alternative formula which is very useful is
PES = AQs/Qs AP/P
where AQs is the change in quantity supplied, Qs is the original quantity supplied, AP is the change in price, and P is the original price.
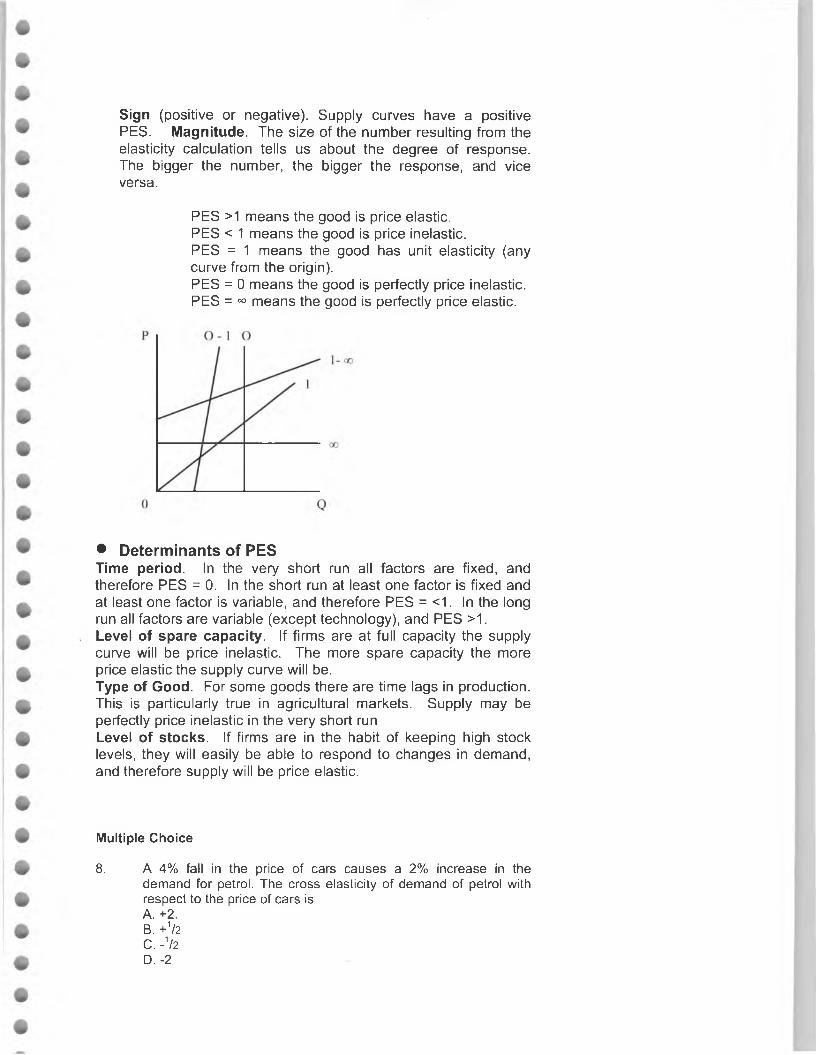
Sign (positive or negative). Supply curves have a positive PES. Magnitude. The size of the number resulting from the elasticity calculation tells us about the degree of response. The bigger the number, the bigger the response, and vice versa.
PES >1 means the good is price elastic.PES < 1 means the good is price inelastic.PES = 1 means the good has unit elasticity (any curve from the origin).PES = 0 means the good is perfectly price inelastic. PES = 00 means the good is perfectly price elastic.
• Determinants of PESTime period. In the very short run all factors are fixed, and therefore PES = 0. In the short run at least one factor is fixed and at least one factor is variable, and therefore PES = <1. In the long run all factors are variable (except technology), and PES >1.Level of spare capacity. If firms are at full capacity the supply curve will be price inelastic. The more spare capacity the more price elastic the supply curve will be.Type of Good. For some goods there are time lags in production. This is particularly true in agricultural markets. Supply may be perfectly price inelastic in the very short runLevel of stocks. If firms are in the habit of keeping high stock levels, they will easily be able to respond to changes in demand, and therefore supply will be price elastic.
Multiple Choice
8. A 4% fall in the price of cars causes a 2% increase in the demand for petrol. The cross elasticity of demand of petrol with respect to the price of cars isA. +2.B. +1/2C. -1/2D. -2
9. The price elasticity of demand for a product will be equal to -4 when aA. 0.1% reduction in price causes a 0.4% increase in quantity demanded.B. 0.1% increase in price causes a 4% reduction in quantity demanded.C. 4% reduction in price causes a 1% increase in quantity demanded.D. 4% increase in price causes a 1% reduction in quantity demanded.
Short Answer Questions
8. A business-person thinks that halving the prices their goods sell for will double their revenue. Explain why this might not happen.
9. Explain why the price elasticities of demand for and supply of primary commodities tend to be low in the short run.
10. What determines whether the demand for a product is price elastic or price inelastic?
This is a very important part of the syllabus, and there are plenty of current real-world examples of market failure. Your exam will contain questions on market failure, particularly on the short answer and essay paper. When writing about market failure it is important that you are able to explain exactly why the market fails, and analyse the causes of these failures. Once failure has been explained, cures or responses should not only be listed and described, but evaluated. For each type of market failure, can you complete the sentence “the market fails because...”? If you use this sentence and successfully complete it in your answer, you will have shown your examiner that you can analyse the causes of market failure.
MARKET FAILURE AND GOVERNMENT RESPONSE
Market Failure is any situation when the market mechanism fails to allocate scarce resources efficiently. This is often seen as a rationale for government intervention. The four main types of market failure are:
Negative and Positive Externalities Public Goods Merit and Demerit Goods Monopoly Power
You should also be aware of income and wealth inequality.
Externalities
Here the market fails because it fails to measure the true costs or benefits o f production or consumption. Externalities are the costs or benefits of production or consumption that are experienced by third parties, but not by the producers and consumers who cause them.
Negative externalities
Classic examples of negative externalities are any form of pollution and traffic congestion. They are best illustrated as negative
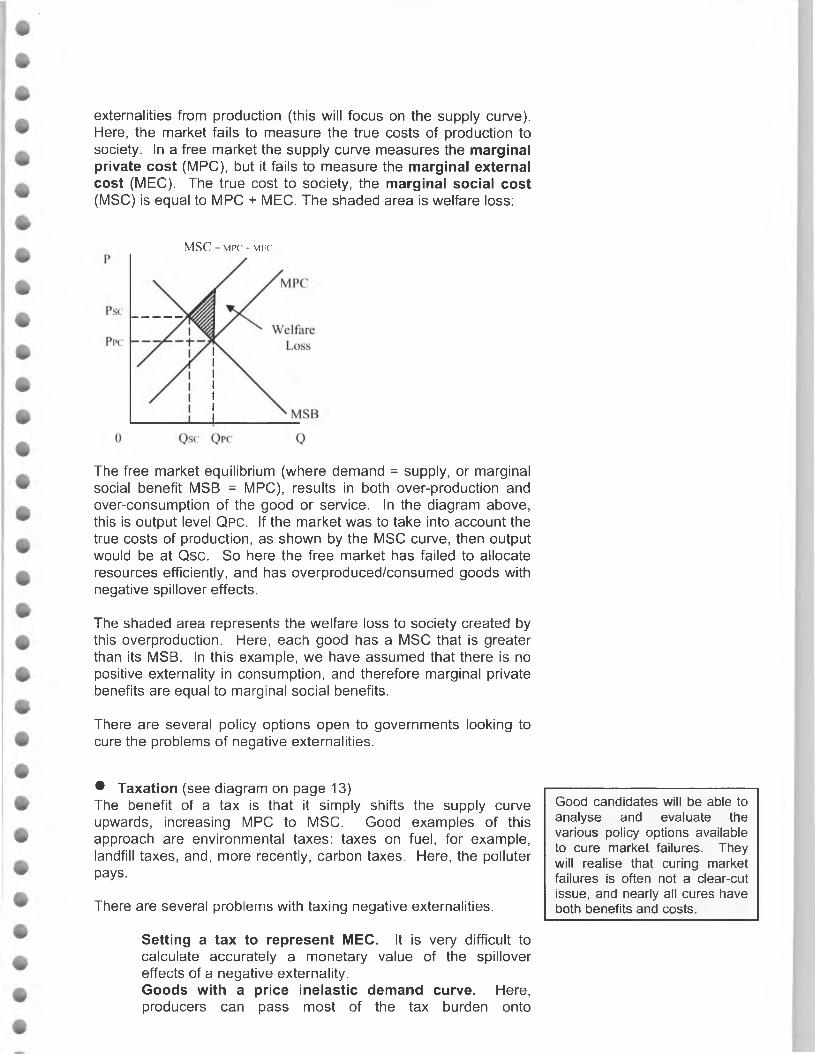
externalities from production (this will focus on the supply curve). Here, the market fails to measure the true costs of production to society. In a free market the supply curve measures the marginal private cost (MPC), but it fails to measure the marginal external cost (MEC). The true cost to society, the marginal social cost (MSC) is equal to MPC + MEC. The shaded area is welfare loss:
MSC = MPC + MEC
The free market equilibrium (where demand = supply, or marginal social benefit MSB = MPC), results in both over-production and over-consumption of the good or service. In the diagram above, this is output level Qpc. If the market was to take into account the true costs of production, as shown by the MSC curve, then output would be at Qsc. So here the free market has failed to allocate resources efficiently, and has overproduced/consumed goods with negative spillover effects.
The shaded area represents the welfare loss to society created by this overproduction. Here, each good has a MSC that is greater than its MSB. In this example, we have assumed that there is no positive externality in consumption, and therefore marginal private benefits are equal to marginal social benefits.
There are several policy options open to governments looking to cure the problems of negative externalities.
• Taxation (see diagram on page 13)The benefit of a tax is that it simply shifts the supply curve upwards, increasing MPC to MSC. Good examples of this approach are environmental taxes: taxes on fuel, for example, landfill taxes, and, more recently, carbon taxes. Here, the polluter pays.
There are several problems with taxing negative externalities.
Setting a tax to represent MEC. It is very difficult to calculate accurately a monetary value of the spillover effects of a negative externality.Goods with a price inelastic demand curve. Here, producers can pass most of the tax burden onto
Good candidates will be able to analyse and evaluate the various policy options available to cure market failures. They will realise that curing market failures is often not a clear-cut issue, and nearly all cures have both benefits and costs.
consumers, and so output/consumption will not radically be reduced.The regressive nature of some taxation. Income inequality may be widened.International competitiveness. If a country takes a unilateral action to tax negative externalities, it may make its exports less competitive as prices rise.Optimal tax rates. High taxes might not reduce consumption at all, but create black markets and other illegal activities.
• Tradable PermitsTradable permits are used to limit the negative activities of firms. These can vary from the emission of polluting gases to the overfishing of the North Sea. The optimal level of pollution or production is set by a government or regulatory body (see quota diagram on page 14), and this total is then divided into individual firm permits to pollute or produce. Firms are able both to buy and sell these permits. In the case of pollution, firms have an obvious incentive to be environmentally efficient so they can sell their permits to other firms (a very profitable activity). In the case of production permits, firms are allowed to maintain their income while they are not producing (for example a North Sea trawler might be out of action through repairs, but could still rent out their permits to other firms). Also, efficient producers can buy quotas from less efficient firms to increase their output.
These tradable permits are presently one of the front-line responses to market failure.
• RegulationGovernments can intervene directly with measures such as quotas to set the optimal level of production/consumption. Most firms today have to comply with minimum environmental requirements. For example, building regulations in the UK stipulate minimum insulation requirements for all new buildings.
There are several problems with regulation:
Setting a limit. It is very easy to over- or underestimate a limit that coincides with a socially efficient outcome.Costs of regulation. All forms of regulations are costly to administer and enforce.Benefits greater than costs. Some firms will still not reduce pollution if the benefits from pollution are greater than the costs of doing so (fines).
• Extending property rightsProperty rights are the legal right to own or to do something. If individuals have the legal right to clean air, for example, and this right is easily and effectively enforced through the courts, then
polluting activities can be stopped, and/or financial recompense is available.
This approach is only effective in societies where property rights are easily enforced. This is often not the case in many less developed economies and also many of the previously centrally planned economies.
• International cooperationThe 1997 United Nations pact, signed at Kyoto required the major industrialised nations to make meaningful reductions in greenhouse gas emissions. The EU’s target was to cut 1990 emission levels by 8% before 2010. In 2004 a report stated that only two countries (UK and Sweden) out of the then 15 would be able to meet these targets. Of course the USA still refuses to sign up to the treaty and this is a major blow to any international agreement to cut emissions. International agreements are beset by political problems with the process of negotiation often taking some time. Policing of agreements is very difficult and there are great incentives to ‘cheat’. In October 2004 Russia agreed to ratify the Kyoto agreement. Now 30 countries are committed to legally binding reductions in greenhouse gasses (5% on 1990 levels).
Positive externalities
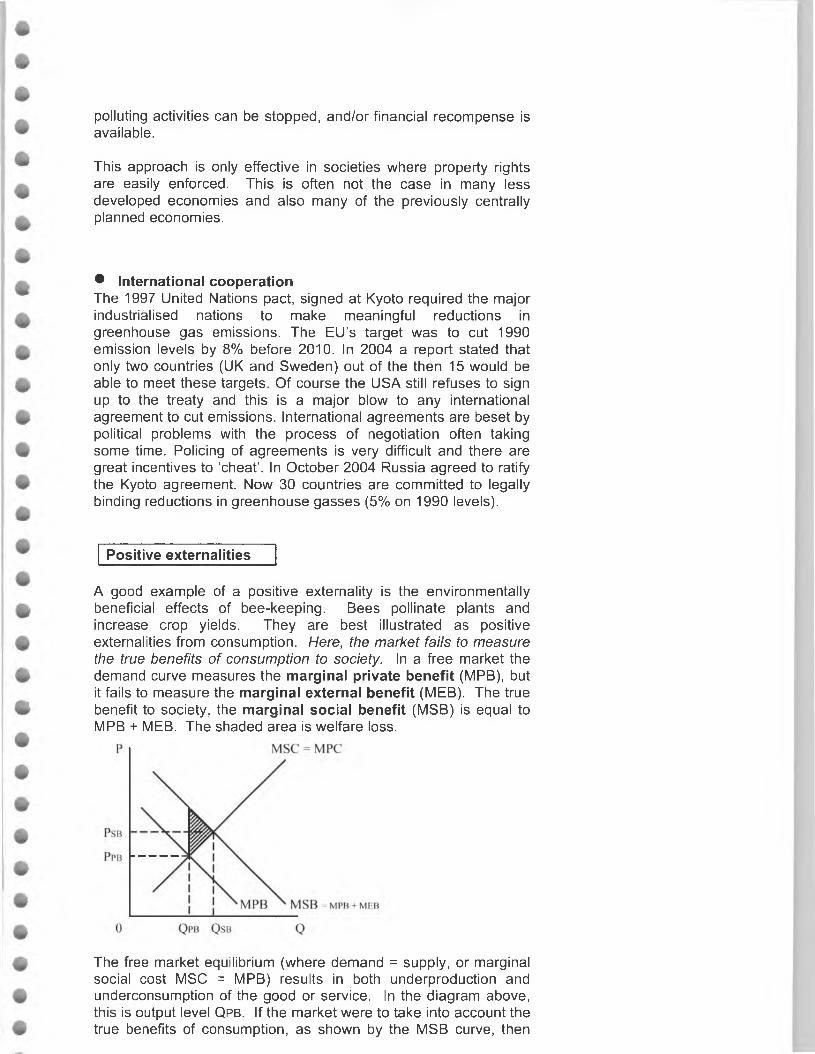
A good example of a positive externality is the environmentally beneficial effects of bee-keeping. Bees pollinate plants and increase crop yields. They are best illustrated as positive externalities from consumption. Here, the market fails to measure the true benefits of consumption to society. In a free market the demand curve measures the marginal private benefit (MPB), but it fails to measure the marginal external benefit (MEB). The true benefit to society, the marginal social benefit (MSB) is equal to MPB + MEB. The shaded area is welfare loss.
The free market equilibrium (where demand = supply, or marginal social cost MSC = MPB) results in both underproduction and underconsumption of the good or service. In the diagram above, this is output level Qpb. If the market were to take into account the true benefits of consumption, as shown by the MSB curve, then
output/consumption would be at Qsb. Here the free market has failed to allocate resources efficiently, and has underproduced/ consumed goods with positive spillover effects.
The shaded area represents the welfare loss to society created by this underconsumption. Here, each good has a MSB that is greater than its MSC. In this example, we have assumed that there is no negative externality in production, and therefore marginal private costs are equal to marginal social costs.
There are several policy options open to governments looking to increase the consumption of goods with positive externalities.
• SubsidiesSubsidies aim to reduce the marginal private costs (MPC) of production until the equilibrium level of output is reached (Qsb). As with taxes in the case of negative externalities, the problem here is one of information. It is very hard to gain accurate estimates of costs, benefits and the external effects associated with positive externalities. If demand is price inelastic, then a subsidy will only result in a small increase in consumption.
• Free ProvisionIn many countries both education and most healthcare services are provided free of charge at the point of consumption.
• InformationOne of the best ways of increasing the consumption of goods with positive externalities is to educate and inform people of the benefits, and so encourage people to make informed consumption choices.
Public Goods
Here the market fails because the key features of public goods are non-excludability and non-rivalry in consumption.
Non-excludability means that even if you have paid for a good you cannot confine its use to yourself.Non-rivalry means that the consumption of a good does not reduce its availability to others.
Good examples of public goods are national defence and street- lighting.
In a free market, public goods would not be provided because of the two above features, and because individuals could free-ride on others’ consumption.
Merit and Demerit Goods
Here the market fails because consumers make choices which society defines as wrong. In the case of merit goods, consumers consume too few goods and services that are seen as being good for them (like education, art galleries). In the case of demerit goods, consumers consume too many goods and services that are seen as being bad for them (alcohol and cigarettes, for example). Merit goods can also (but not always) have positive externalities. Demerit goods can also (but not always) have negative externalities.
If merit and demerit goods do have externalities, then the cures mentioned above can be used. But education and information are very valid approaches, as consumer choices are at the heart of the failure of the market mechanism.
It is important that you do not automatically assume that merit goods are goods with positive externalities and vice versa, and that demerit goods are goods with negative externalities and vice versa. This is an area in which candidates often muddle their definitions.
Monopoly Power
A detailed diagrammatic analysis of market power will be undertaken in the Theory of the Firm section of this Revision Guide.
Here the market fails because monopolies (single sellers, or firms with 100% market share) erect barriers to entry, preventing competition. These barriers enable them to develop market power (the ability to increase prices). Monopolies will tend to result in both higher prices and lower output, and a decrease in economic efficiency (with prices greater than market cost and output not produced at minimum average cost), although, as we shall see later on, this might not necessarily always be the case.
There are a wide variety of cures for market power open to government::
Banning. The formation of monopolies can be banned and existing monopolies split up. This is the approach taken by the Sherman Act in America.Investigation and Regulation. Most countries have organisations that investigate concentrating markets (in the UK this is the Competition Commission in combination with the Office of Fair Trading). These organisations make decisions about whether or not mergers/takeovers/ monopolies are in the public interest. They also investigate trading practices. Recent examples include the concentration of UK supermarkets, concern over the actions of Microsoft in America, and the EU competition ruling on the production of vitamin supplements. The powers that individual regulatory organisations have vary widely from country to country (from fines to prison sentences).Regulation of Privatised Industries. Most economies have privatised some or many of their previous nationalised industries in recent decades. Because these risk becoming private monopolies, they tend to be regulated in terms of price and quality of service provision, alongside measures
Along with externalities, this is the key area of market failure on which exams focus. You should be prepared to answer both short answer and essay questions on monopolies and the comparison of monopoly with other market forms, especially perfect competition. Whilst the diagrammatic analysis is both detailed and complex, it is a very well-structured part of the syllabus. With some careful planning, therefore, you should be able to produce well-directed written answers to examination questions.
An understanding of contestable market theory often discriminates between the average and the good exam candidate. It is a theory that realises the limitations of the more traditional approaches to monopolies. Any analysis of monopoly or cures for monopoly situations should include this theory.
to reduce barriers to entry and therefore encourage competition. This has been especially true in the UK.
Contestable Markets. This is potentially the most successful cure for monopoly power, as it is centred around removing the barriers to entry which created the problem inthe first place. Here, the main cause for concern is not the number of firms in a particular market, but the degree of threat posed by potential new entrants. The threat of entry from other firms can only exist if there are no effective barriers. This threat of entry on its own is often seen as being the key factor that encourages firms which might potentially exploit their monopoly power to behave themselves and not abuse their position.
Laissez-faire. Some economists suggest that the problems created by monopolies are best cured by the actions of a free market.
Multiple Choice
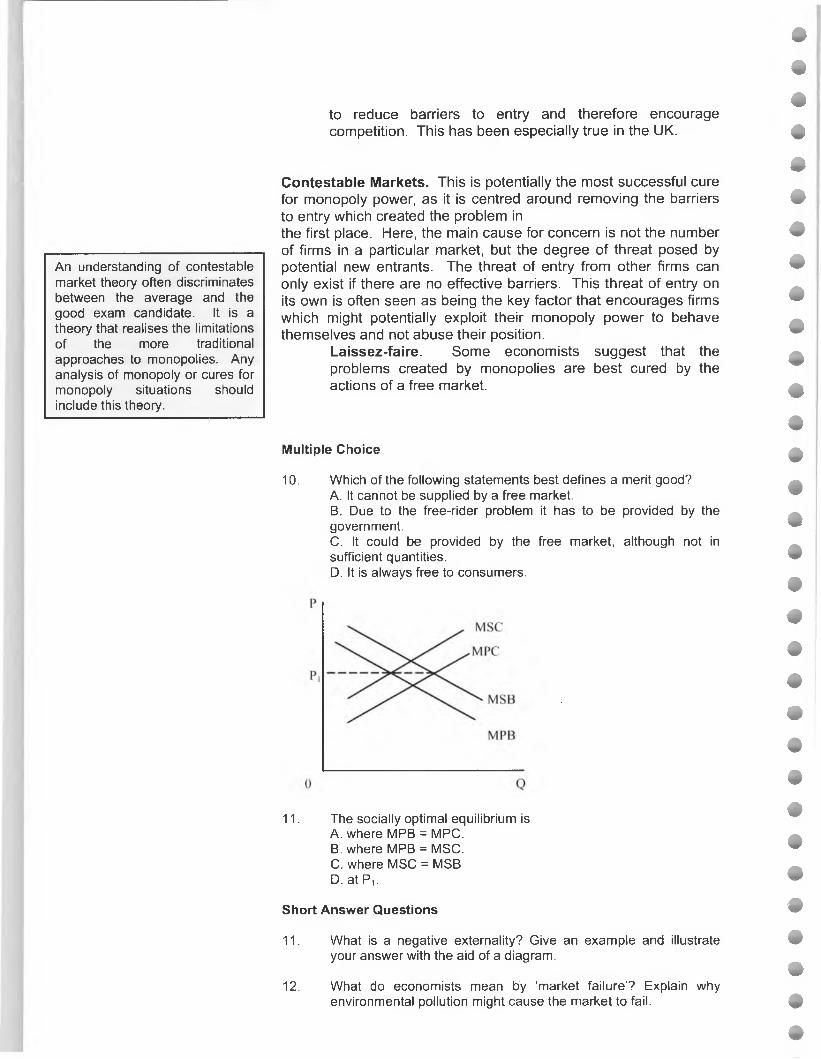
10. Which of the following statements best defines a merit good?A. It cannot be supplied by a free market.B. Due to the free-rider problem it has to be provided by the government.C. It could be provided by the free market, although not in sufficient quantities.D. It is always free to consumers.
11. The socially optimal equilibrium isA. where MPB = MPC.B. where MPB = MSC.C. where MSC = MSBD. at P■].
Short Answer Questions
11. What is a negative externality? Give an example and illustrate your answer with the aid of a diagram.
12 . What do economists mean by ‘market failure’? Explain why environmental pollution might cause the market to fail.

THEORY OF THE FIRM
AIMS AND OBJECTIVES OF FIRMS
There is a wide range of possible aims and objectives for firms to target, including sales revenue maximisation, output maximisation, managerial goals, behavioural goals, market share and satisfising, but underpinning much of the theory in this section is the aim of profit maximisation.
Profits = total revenue - total cost
Profit maximisation dominates this section. You need, however, to understand where a firm might maximise sales revenue/total revenue or output for multiple choice questions.
Total revenue = price x quantity
Total cost = average cost x quantity
(Or fixed costs + variable costs)
To understand effectively how a firm works, you need to understand costs and revenue in some detail.
COST THEORY
Costs in the Short Run
A firm is a combination of the four factors o f production. These four factors are transformed into output. As these factors must be paid for, production incurs costs.
In the short run, at least one factor is variable, and at least one factor is fixed. Even though the firm’s size is fixed, increasing amounts of a variable factor (e.g. labour) can be added to the firm.
Here the law of diminishing returns applies. This law states that as successive units of the variable factor are added, the extra (marginal) output produced will at first increase and then decrease. This results in the marginal product (MP) and average product (AP) curves below:Output
Questions asking you to distinguish between short and long run costs do appear in the short answer paper, but elsewhere all you will be required to do is to draw your cost curves accurately, and in combination with revenue curves, analyse the behaviour of firms.
TC = FC + VC ATC = TC / Q ATC = AFC + AVC AFC = FC / Q AVC = VC / Q MC = ATC / AQ MC = the slope of TC
AP
0 Variable Factor

Of course, each time a unit of the variable factor is added a new cost is incurred. If this new cost allows output first to increase and then decrease, the marginal costs and average variable costs must first decrease and then increase. This results in the marginal cost (MC) and average variable cost (AVC) curves below. Marginal cost is the cost of producing one extra unit of output:
Fixed costs are the cost of producing nothing, and so average fixed costs (AFC) fall as output increases. Total costs are the sum of fixed and variable costs, and so average total costs are the sum of average fixed costs and average variable costs. In the diagram above, ATC is created by adding the AVC and AFC lines together.
Costs in the Long Run
In the long run, all factors are variable, and therefore a firm can change its size (scale).
If a firm increases its size, then one of three things can happen to output:
1. Output can increase more than proportionately (increasing returns to scale).2. Output can increase proportionately (constant returns to scale).3. Output can increase less than proportionately (decreasing returns to scale).
1. will cause average costs to fall, 2. will cause average costs to remain constant, and 3. will cause average costs to rise, resulting in the long run average cost curve below.

It is economies of scale that cause average costs to fall in the long run, and diseconomies of scale that cause average costs to rise in the long run.
Economies of scale can be divided into the following categories:
Financial economies Marketing economies Technical economies Purchasing economies Managerial economies
Diseconomies of scale tend to be very firm specific, but a classic problem is communication.
Multiple Choice
12.
Output Total Cost
0 10010 11520 15030 17540 220
Using the table above, at an output level of 20 Average Variable Cost is calculated to beA. 2.5B. 7C. 14D. 130
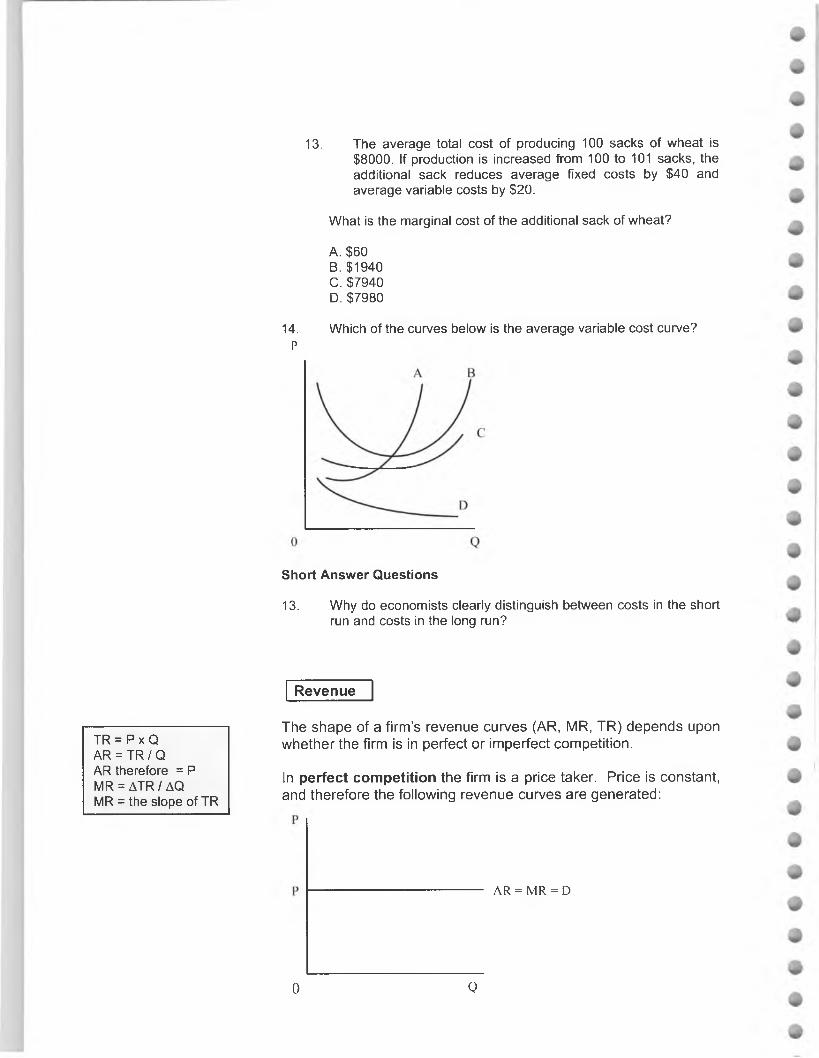
13. The average total cost of producing 100 sacks of wheat is $8000. If production is increased from 100 to 101 sacks, the additional sack reduces average fixed costs by $40 and average variable costs by $20.
What is the marginal cost of the additional sack of wheat?
A. $60B. $1940C. $7940D. $7980
14. Which of the curves below is the average variable cost curve?P
Short Answer Questions
13. Why do economists clearly distinguish between costs in the short run and costs in the long run?
Revenue
TR = PxQAR = TR / QAR therefore = PMR = ATR / AQMR = the slope of TR
The shape of a firm’s revenue curves (AR, MR, TR) depends upon whether the firm is in perfect or imperfect competition.
In perfect competition the firm is a price taker. Price is constant, and therefore the following revenue curves are generated:
AR = MR = D
0 Q
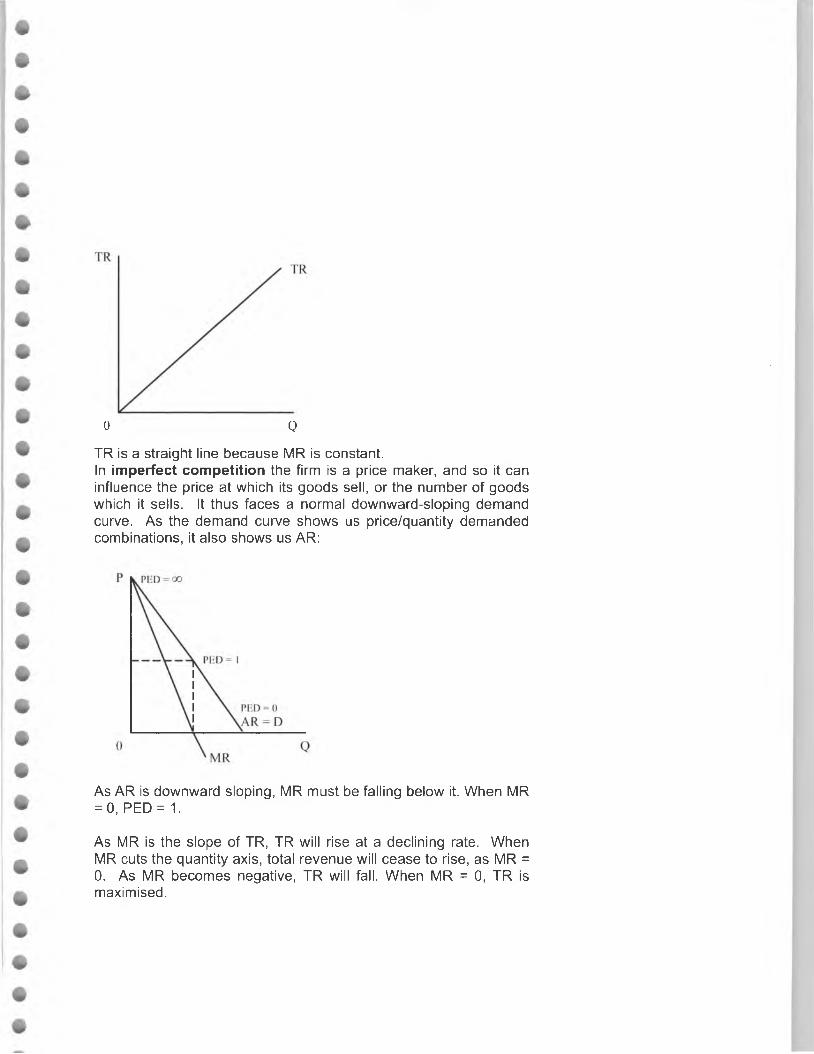
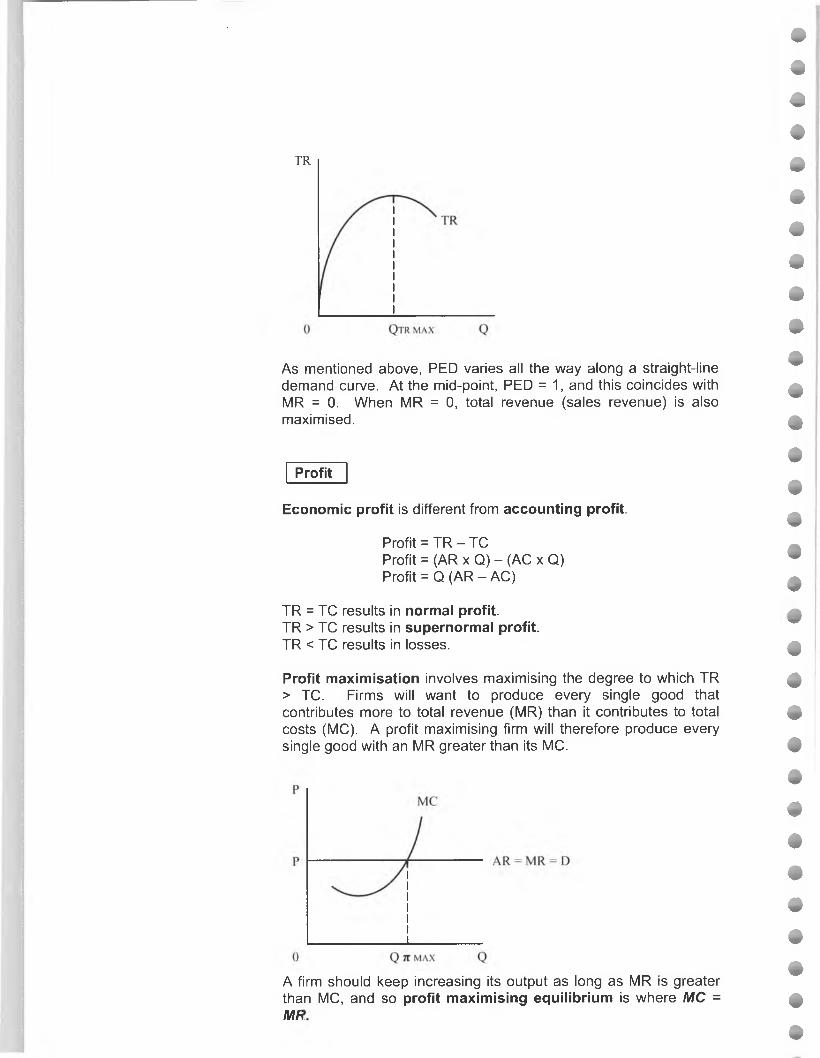
0 0TR is a straight line because MR is constant.In imperfect competition the firm is a price maker, and so it can influence the price at which its goods sell, or the number of goods which it sells. It thus faces a normal downward-sloping demand curve. As the demand curve shows us price/quantity demanded combinations, it also shows us AR:
As AR is downward sloping, MR must be falling below it. When MR = 0, PED = 1.
As MR is the slope of TR, TR will rise at a declining rate. When MR cuts the quantity axis, total revenue will cease to rise, as MR =0. As MR becomes negative, TR will fall. When MR = 0, TR is maximised.
TR
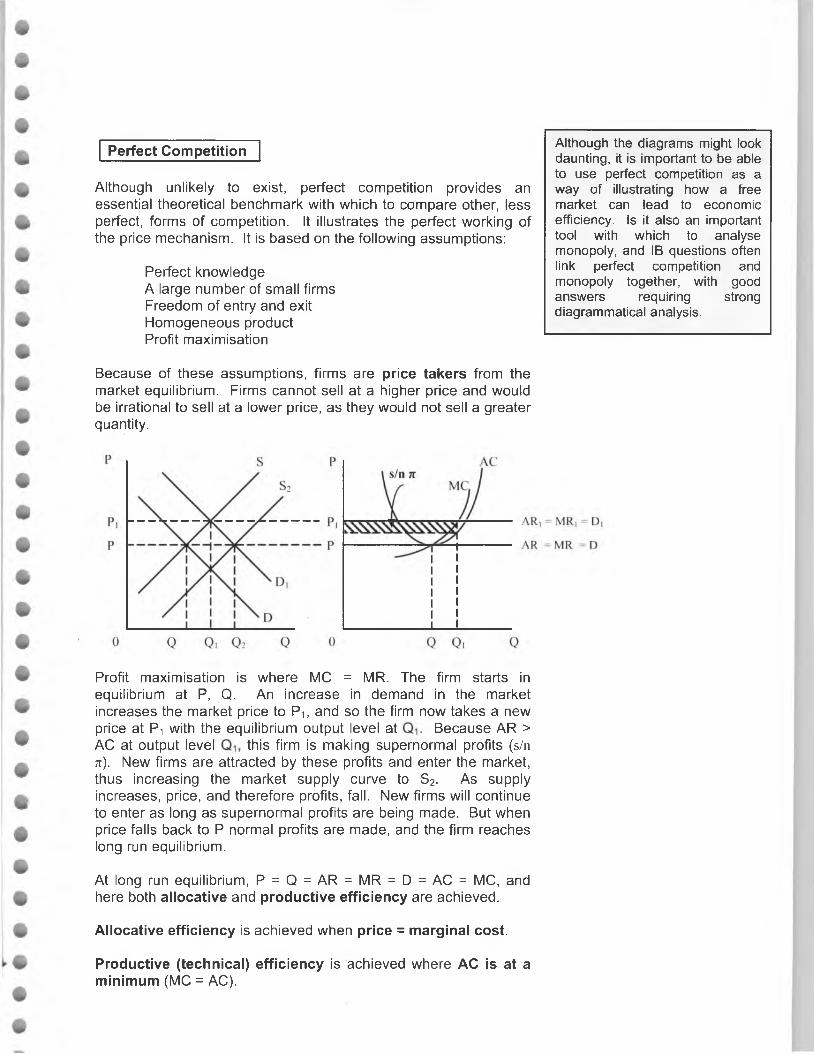
As mentioned above, PED varies all the way along a straight-line demand curve. At the mid-point, PED = 1, and this coincides with MR = 0. When MR = 0, total revenue (sales revenue) is also maximised.
Profit
Economic profit is different from accounting profit.
Profit = TR - TCProfit = (AR x Q) - (AC x Q)Profit = Q (AR - AC)
TR = TC results in normal profit.TR > TC results in supernormal profit.TR < TC results in losses.
Profit maximisation involves maximising the degree to which TR > TC. Firms will want to produce every single good that contributes more to total revenue (MR) than it contributes to total costs (MC). A profit maximising firm will therefore produce every single good with an MR greater than its MC.
A firm should keep increasing its output as long as MR is greater than MC, and so profit maximising equilibrium is where MC = MR.
Perfect Competition
Although unlikely to exist, perfect competition provides an essential theoretical benchmark with which to compare other, less perfect, forms of competition. It illustrates the perfect working of the price mechanism. It is based on the following assumptions:
Perfect knowledge A large number of small firms Freedom of entry and exit Homogeneous product Profit maximisation
Although the diagrams might look daunting, it is important to be able to use perfect competition as a way of illustrating how a free market can lead to economic efficiency. Is it also an important tool with which to analyse monopoly, and IB questions often link perfect competition and monopoly together, with good answers requiring strong diagrammatical analysis.
Because of these assumptions, firms are price takers from the market equilibrium. Firms cannot sell at a higher price and would be irrational to sell at a lower price, as they would not sell a greater quantity.
Profit maximisation is where MC = MR. The firm starts in equilibrium at P, Q. An increase in demand in the market increases the market price to Pi, and so the firm now takes a new price at P-\ with the equilibrium output level at Because AR > AC at output level this firm is making supernormal profits (s/n n). New firms are attracted by these profits and enter the market, thus increasing the market supply curve to S2. As supply increases, price, and therefore profits, fall. New firms will continue to enter as long as supernormal profits are being made. But when price falls back to P normal profits are made, and the firm reaches long run equilibrium.
At long run equilibrium, P = Q = AR = MR = D = AC = MC, and here both allocative and productive efficiency are achieved.
Allocative efficiency is achieved when price = marginal cost.
Productive (technical) efficiency is achieved where AC is at aminimum (MC = AC).

Perfect competition is said to lead to a Pareto optimal situation where the allocation of resources cannot be changed to make someone better off without making someone worse off.Here we have made the important assumption that there are no externalities in this market.
In perfect competition, the MC curve is the firm’s supply curve.In the short run, this extends down towards the AVC curve. The shut-down condition is that firms will stay in business as long as they are covering their variable costs. But in the long run firms will only stay in business if they cover their average costs.
Monopoly
A pure monopoly is a single seller (a firm that produces 100% of market output), although it is assumed that any firm with a market share in excess of 25% will have market power.
A monopoly market is characterised by a firm which is
A single seller Produces branded goods Creates barriers to entry Maximises profits
As the firm is the market, the firm’s revenue curves will be downward sloping. It is barriers to entry (economies of scale, legal barriers, sunk costs, capital costs, brand loyalty, control of inputs, predatory pricing) that give a monopoly its market power (the power to change price).
The monopoly will maximise profits where MC = MR. P, Q is both the short run and the long run equilibrium, because barriers to entry stop new firms entering, and supernormal profits persist in the long run. In the long run a monopoly produces at a point which is both allocatively and productively inefficient.
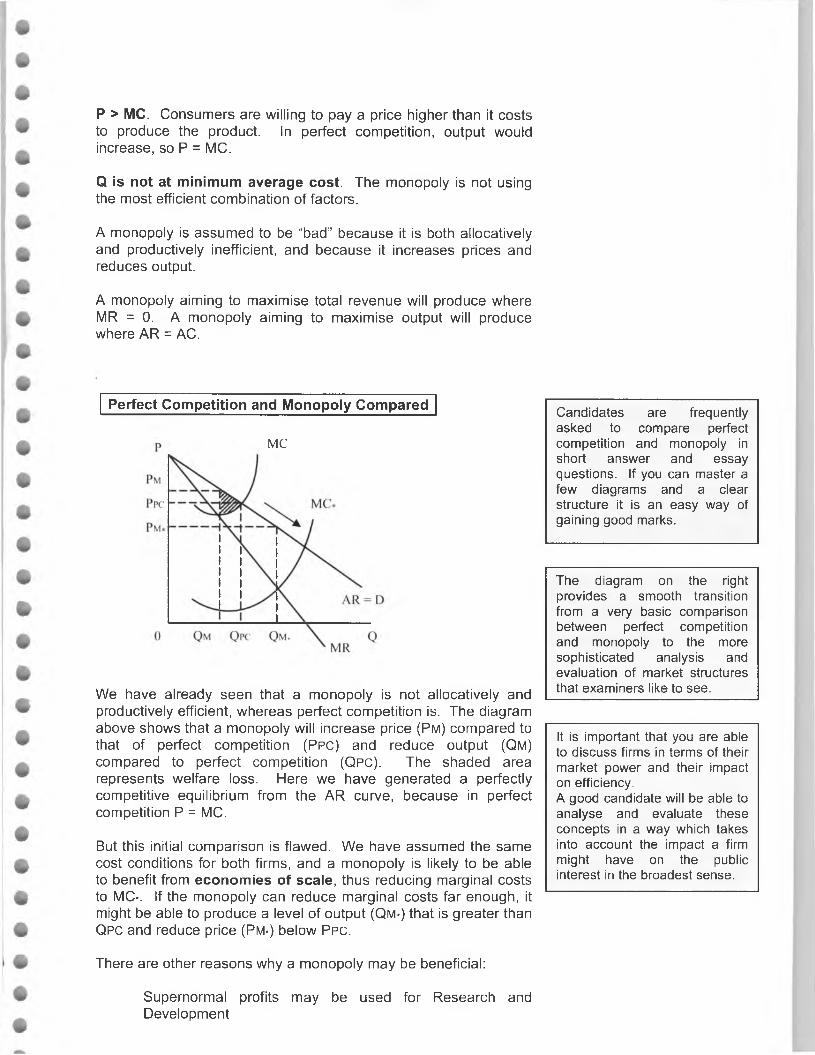
P > MC. Consumers are willing to pay a price higher than it costs to produce the product. In perfect competition, output would increase, so P = MC.
Q is not at minimum average cost. The monopoly is not using the most efficient combination of factors.
A monopoly is assumed to be “bad" because it is both allocatively and productively inefficient, and because it increases prices and reduces output.
A monopoly aiming to maximise total revenue will produce where MR = 0. A monopoly aiming to maximise output will produce where AR = AC.
Perfect Competition and Monopoly Compared
MC
We have already seen that a monopoly is not allocatively and productively efficient, whereas perfect competition is. The diagram above shows that a monopoly will increase price (Pm) compared to that of perfect competition (Ppc) and reduce output (Qm) compared to perfect competition (Qpc). The shaded area represents welfare loss. Here we have generated a perfectly competitive equilibrium from the AR curve, because in perfect competition P = MC.
But this initial comparison is flawed. We have assumed the same cost conditions for both firms, and a monopoly is likely to be able to benefit from economies of scale, thus reducing marginal costs to MC*. If the monopoly can reduce marginal costs far enough, it might be able to produce a level of output (Qm*) that is greater than Qpc and reduce price (Pm*) below Ppc.
There are other reasons why a monopoly may be beneficial:
Supernormal profits may be used for Research andDevelopment
The diagram on the right provides a smooth transition from a very basic comparison between perfect competition and monopoly to the more sophisticated analysis and evaluation of market structures that examiners like to see.
Candidates are frequently asked to compare perfect competition and monopoly in short answer and essay questions. If you can master a few diagrams and a clear structure it is an easy way of gaining good marks.
It is important that you are able to discuss firms in terms of their market power and their impact on efficiency.A good candidate will be able to analyse and evaluate these concepts in a way which takes into account the impact a firm might have on the public interest in the broadest sense.
Monopolies may be beneficial for both employment and export revenues “Creative destruction”Contestable market theory
Multiple Choice
15. A monopoly firm decides to maximise revenues instead of its current goal of maximising profits. What will happen to the price that it charges and the level of output that it produces?
Price QuantityA. Rises FallsB. Falls RisesC. Falls FallsD. Rises Rises
Short Answer Questions
14. What will happen to price and output if a perfectly competitive firm becomes a monopoly?
Monopolistic Competition
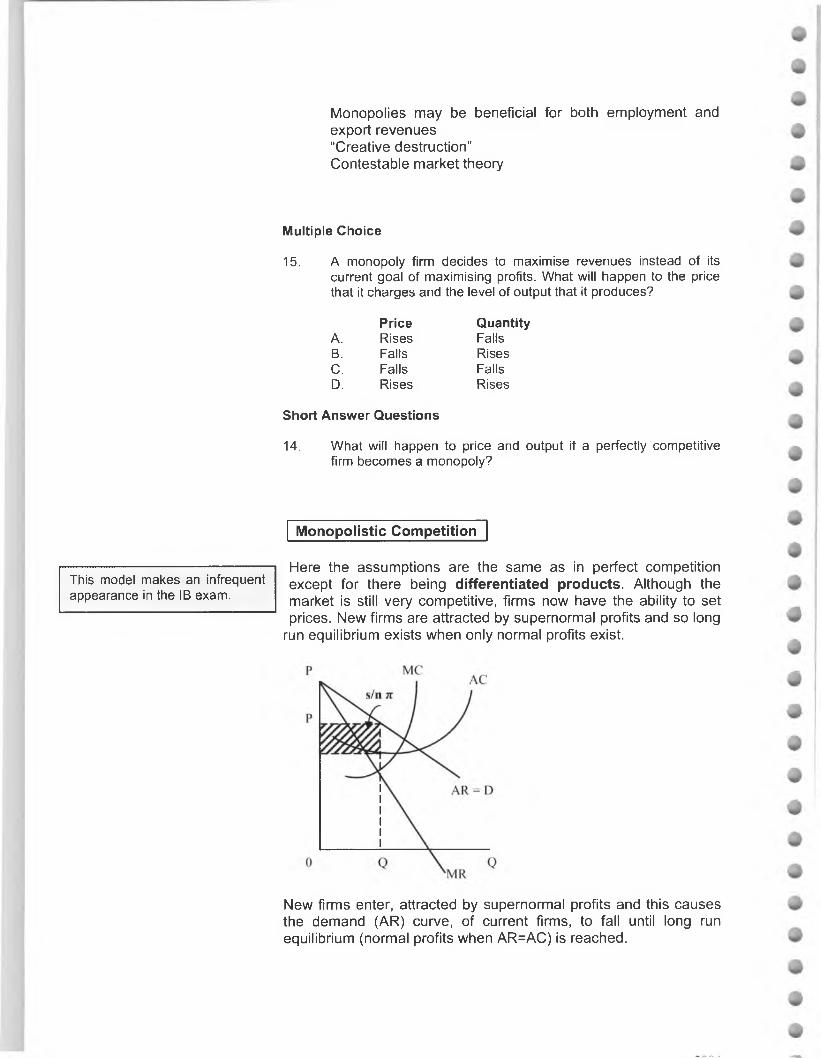
— -------------------------- ---------------1 Here the assumptions are the same as in perfect competitionThis model makes an infrequent except for there being differentiated products. Although the appearance in the IB exam. market is still very competitive, firms now have the ability to set
prices. New firms are attracted by supernormal profits and so long run equilibrium exists when only normal profits exist.
New firms enter, attracted by supernormal profits and this causes the demand (AR) curve, of current firms, to fall until long run equilibrium (normal profits when AR=AC) is reached.
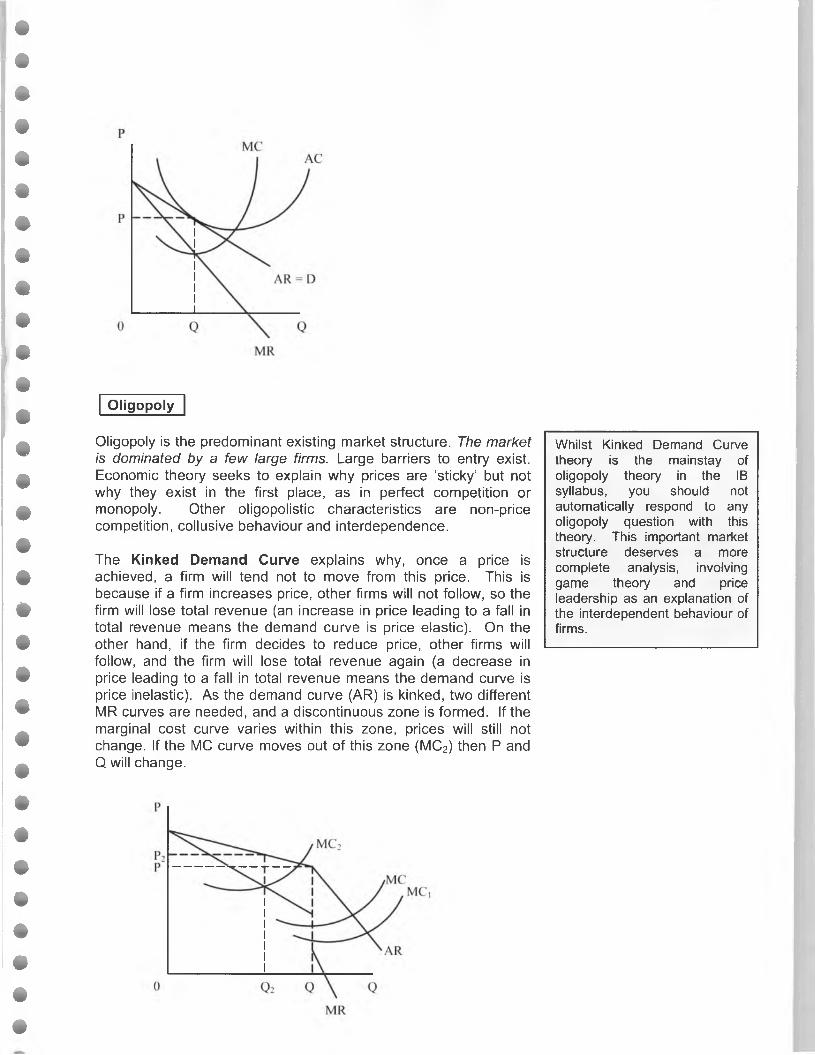
Oligopoly
Oligopoly is the predominant existing market structure. The market is dominated by a few large firms. Large barriers to entry exist. Economic theory seeks to explain why prices are ‘sticky’ but not why they exist in the first place, as in perfect competition or monopoly. Other oligopolistic characteristics are non-price competition, collusive behaviour and interdependence.
The Kinked Demand Curve explains why, once a price is achieved, a firm will tend not to move from this price. This is because if a firm increases price, other firms will not follow, so the firm will lose total revenue (an increase in price leading to a fall in total revenue means the demand curve is price elastic). On the other hand, if the firm decides to reduce price, other firms will follow, and the firm will lose total revenue again (a decrease in price leading to a fall in total revenue means the demand curve is price inelastic). As the demand curve (AR) is kinked, two different MR curves are needed, and a discontinuous zone is formed. If the marginal cost curve varies within this zone, prices will still not change. If the MC curve moves out of this zone (MC2) then P and Q will change.
Whilst Kinked Demand Curve theory is the mainstay of oligopoly theory in the IB syllabus, you should not automatically respond to any oligopoly question with this theory. This important market structure deserves a more complete analysis, involving game theory and price leadership as an explanation of the interdependent behaviour of firms.

Throughout Theory of the Firm you should be able to apply the concepts of productive and allocative efficiency, and illustrate them in diagrams when assessing different market structures.
Game Theory explains interdependence. What is often called ‘the prisoner’s dilemma’ illustrates the choices a firm faces when deciding whether to make a competitive change to price or to cooperate with rival firms.
FirmX$3.00 $2.70
Firm $3.00 $15 mill each $7.5 millY $18 mill
$2.70 $18 mill $12 mill each$7.5 mill
The box shows the outcomes of each firm’s decision to change price. If Firm Y cuts its price from $3.00 to $2.70 and X does not follow, then Y’s profits will rise to $18 mill and X’s profits will fall to $7.5 mill. If firm X follows the cut in price both firms will experience a fall in their profits to $12 mill. If Y kept its price at $3.00 and firm X cut its price to $2.70, Y’s profits would fall to $7.5 mill. This is the dominant strategy in this game. The safe option (maximin) is to cut price knowing that the other firm might follow and so the loss of profits is minimised. The more optimistic approach (maximax) is to cut price and hope that the other firm does not follow. Therefore the same strategy, cutting price, is followed in both approaches.
Price Leadership Models illustrate situations in which a single firm leads other firms in price-making decisions. The leading firm changes price, and other firms follow. Dominant firm price leadership is where the dominant firm in a market sets the price and other follow. Barometric firm price leadership is where the firm that others believe reflects market conditions most accurately sets the price and others follow.
Price Discrimination
Price discrimination occurs when different consumers are charged different prices for the same good or service. Firms price discriminate to turn consumer surplus into profit. There are three conditions which must exist for this to take place.
A firm must have monopoly power There is no possibility of resale Different groups must be identified clearly
For example, students and pensioners often pay reduced rates for goods such as train tickets.
1st degree price discrimination is when firms charge consumers the maximum price they are willing to pay.2nd degree price discrimination is when firms charge different prices according to how much is consumed.
3rd degree price discrimination is when a market is divided into two or more discrete markets each with its own price. This is the most common form of price discrimination.
For price discrimination to be effective, a firm must be a price maker, markets must be easily separated in terms of factors such as time and place, there must be no possibility of resale, and price elasticity of demand must differ in each individual market.
Firms able to price discriminate will benefit from an increase in total revenue. They may also be able to force competitive firms out of business, by cross-subsidising on markets (predatory pricing). Some consumers will benefit from the lower prices, and if profits are reinvested they will benefit from reinvestment and possible lower future costs.
Multiple Choice
16. If price is greater than marginal costA. a monopoly will increase output and reduce price.B. allocative efficiency does not exist.C. a perfectly competitive firm will reduce its output.D. a government should subsidise output.
17. Oligopolists will tend not to decrease prices whenI. demand is price inelastic.II. other producers may follow.III. the quantity demanded will fall.
A. I onlyB. I and IIC. II and IIID. I, II and III
Short Answer Questions
15. How might an oligopolistic firm seek to increase its profits?
MACROECONOMICS
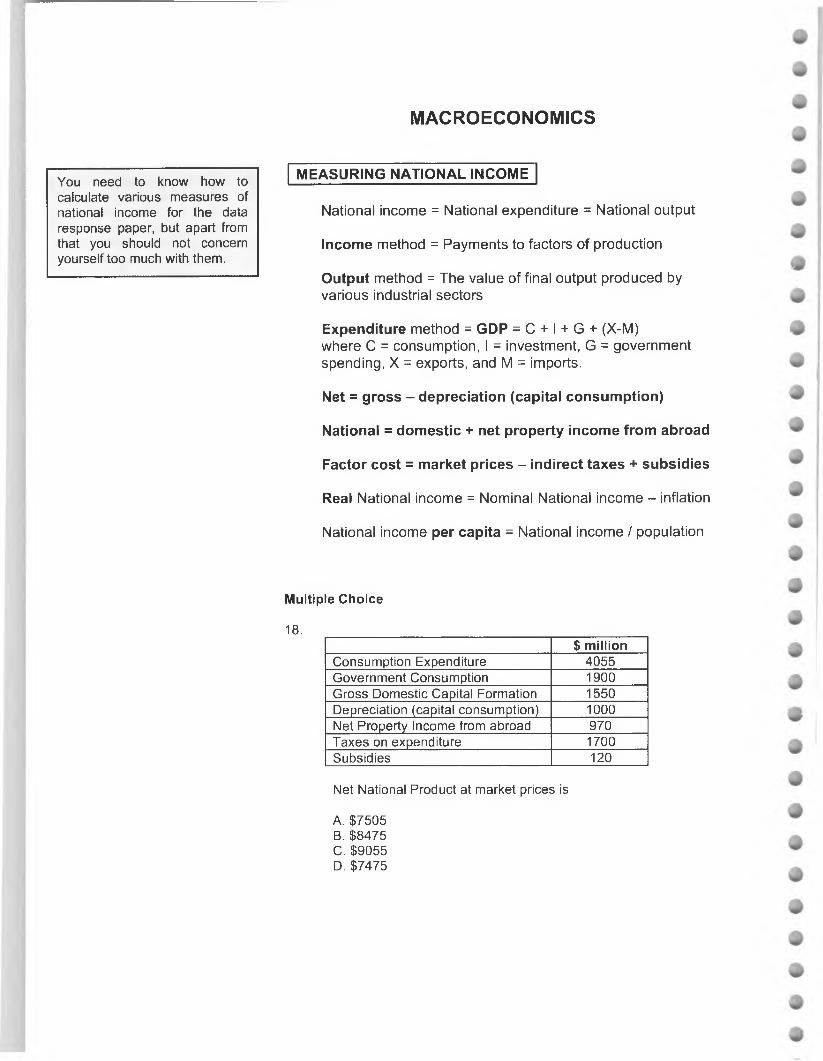
You need to know how to calculate various measures of national income for the data response paper, but apart from that you should not concern yourself too much with them.
MEASURING NATIONAL INCOME
National income = National expenditure = National output
Income method = Payments to factors of production
Output method = The value of final output produced by various industrial sectors
Expenditure method = GDP = C + I + G + (X-M) where C = consumption, I = investment, G = government spending, X = exports, and M = imports.
Net = gross - depreciation (capital consumption)
National = domestic + net property income from abroad
Factor cost = market prices - indirect taxes + subsidies
Real National income = Nominal National income - inflation
National income per capita = National income / population
Multiple Choice
18. ____$ million
Consumption Expenditure 4055Government Consumption 1900Gross Domestic Capital Formation 1550Depreciation (capital consumption) 1000Net Property Income from abroad 970Taxes on expenditure 1700Subsidies 120
Net National Product at market prices is
A .$7505B .$8475C .$9055D .$7475

Income flowing into the flow is known as injections (J), and income flowing out of the flow is known as withdrawals (W).
J = G + I + X W = T + S + M
Equilibrium level of national income exists when planned J = planned W. This equilibrium level of income might not necessarily coincide with the full employment level of national income. The total level of income in the circular flow at any given time period is equal to national income.
MACROECONOMIC MODELS
Macro Policy Objectives
1) Economic growth and developmentAll economies have growth as a target, as it represents an improvement in the standard of living. This will be dealt with more fully in the Development Economics section below.
2) Full employmentLow levels of unemployment are desirable as the costs of unemployment are high.
3) Price StabilityLow and stable inflation is a dominant target of all developed and most developing economies. It is seen as having major benefits for all macroeconomic goals.
Circular flow, injections and withdrawals and the 45° diagrams have been largely superseded by aggregate demand and aggregate supply analysis, for analysing and evaluating macroeconomicpolicies and the achievement of macroeconomic goals.
4) External equilibriumThe balance of payments is concerned with payments to and from abroad for goods and services. An exchange rate is the price of one currency in terms of another.
Policy conflicts exist between these four goals. Economic growth may cause rising inflation, although reducing unemployment. A reduction in inflation may cause a slowing down in growth and an increase in unemployment.
Aggregate Demand and Supply Analysis
AD and AS analysis is the main system for analysing macro- economic problems and policies. Once mastered, you will find that it is a very flexible tool, and one which is easily brought into any macro- economic situation. You should be able to manipulate AD/AS diagrams accurately, to explain any macroeconomic situation. AD/AS has superseded the Keynesian 45° diagram.
Equilibrium level of national income is where aggregate demand (AD) is equal to aggregate supply (AS).
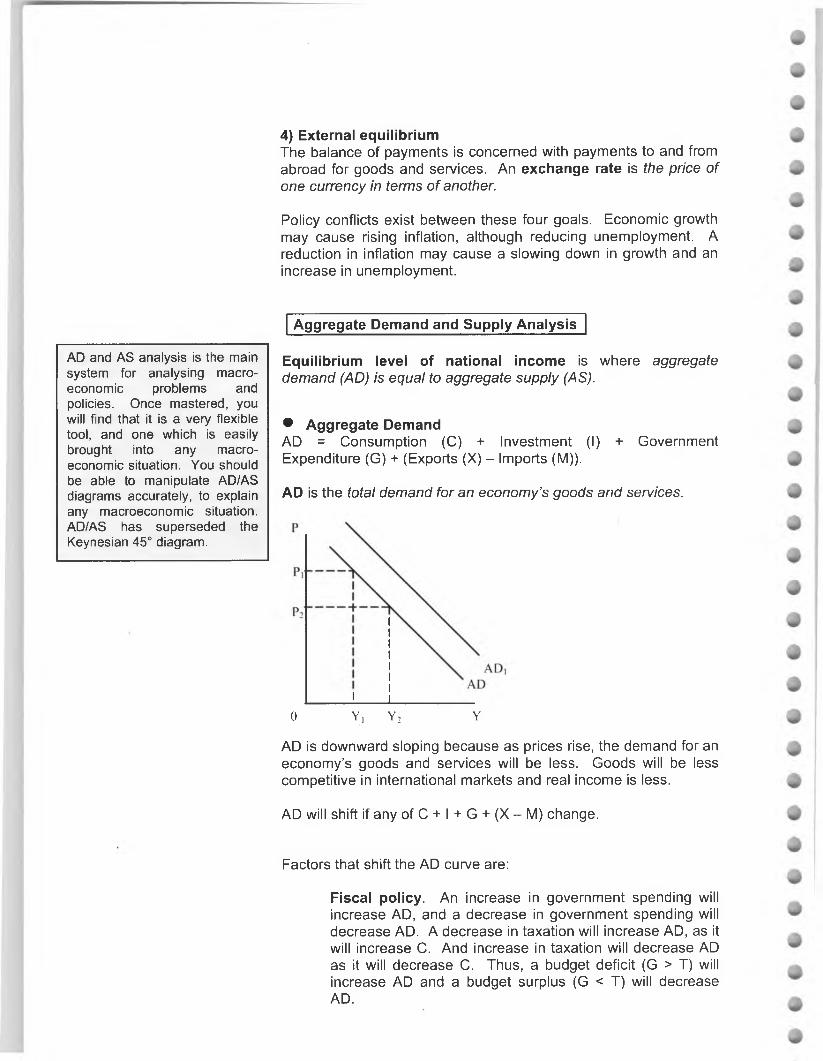
• Aggregate DemandAD = Consumption (C) + Investment (I) + Government Expenditure (G) + (Exports (X) - Imports (M)).
AD is the total demand for an economy’s goods and services.
_______ i i______________0 Y, Y2 Y
AD is downward sloping because as prices rise, the demand for an economy’s goods and services will be less. Goods will be less competitive in international markets and real income is less.
AD will shift if any of C + I + G + (X - M) change.
Factors that shift the AD curve are:
Fiscal policy. An increase in government spending will increase AD, and a decrease in government spending will decrease AD. A decrease in taxation will increase AD, as it will increase C. And increase in taxation will decrease AD as it will decrease C. Thus, a budget deficit (G > T) will increase AD and a budget surplus (G < T) will decrease AD.
Monetary policy. An increase in the rate of interest will decrease AD by increasing saving and so reducing consumption, by decreasing investment, and by strengthening the exchange rate and so reducing exports. A decrease in the rate of interest would have the opposite effect.
Exchange Rates. An increase in the value of an economy’s currency will, other things being equal, make an economy’s export less competitive and so reduce AD. The opposite is also the case.
• Aggregate SupplyAS represents the total value of goods and services that an economy can produce in a given time period.
AS
In the short run AS is upwards sloping because, as prices rise, firms find it profitable to increase their output, and new firms will start producing.
In the long run, AS is vertical as the economy is at full capacity. Output cannot therefore be increased in responses to increases in aggregate demand.
Factors that shift the short run AS curve are:
Changes to raw material and component costs Taxes and subsidies Changes to labour costs
There is a lot of controversy over the shape of the AS curve. This affects the final outcome of any shift in the AD curve. The implication of macro policies and the potential solutions to macro problems all depend upon one’s view of the shape of the s-curve. There is, however, agreement over the AS curve being vertical when an economy reaches full employment. The disagreement lies in whether an economy is always at full employment or not. Keynesians believe that an economy is not necessarily in equilibrium at full employment.
Factors that shift the long run AS curve are:
Changes to the stock of productive resources Changes to productivity Changes to technology
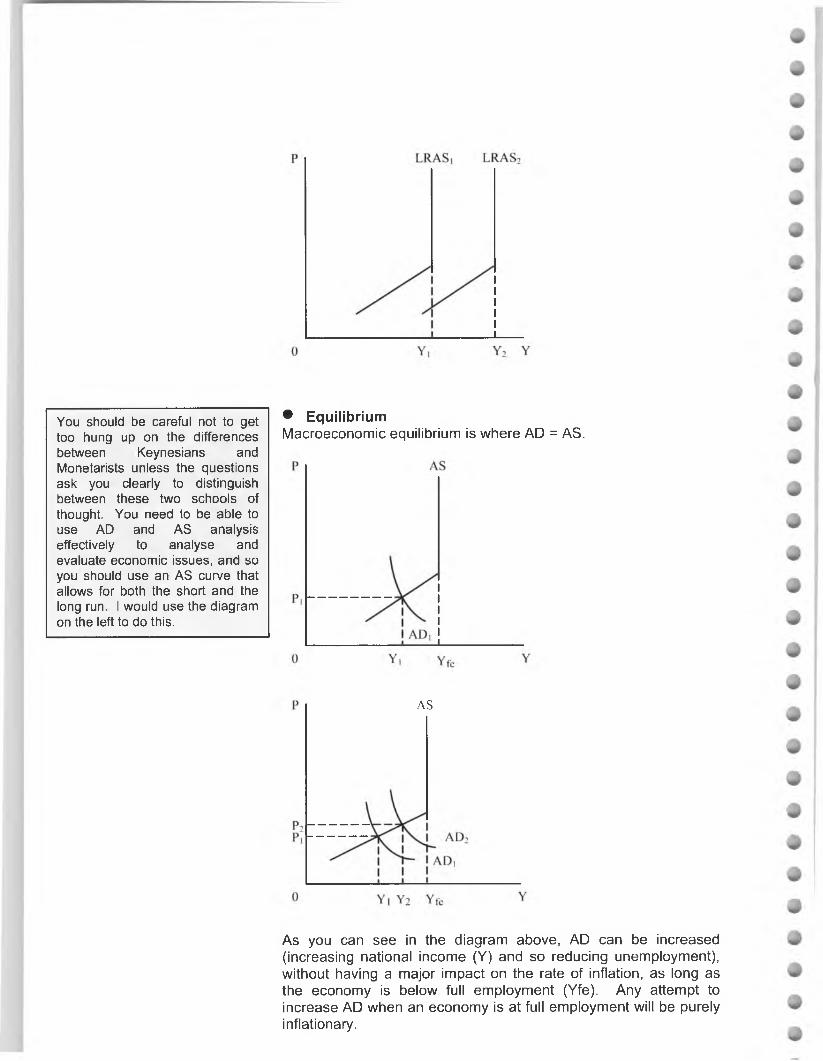
You should be careful not to get too hung up on the differences between Keynesians and Monetarists unless the questions ask you clearly to distinguish between these two schools of thought. You need to be able to use AD and AS analysis effectively to analyse and evaluate economic issues, and so you should use an AS curve that allows for both the short and the long run. I would use the diagram on the left to do this.
• EquilibriumMacroeconomic equilibrium is where AD = AS.
AS
As you can see in the diagram above, AD can be increased (increasing national income (Y) and so reducing unemployment), without having a major impact on the rate of inflation, as long as the economy is below full employment (Yfe). Any attempt to increase AD when an economy is at full employment will be purely inflationary.

Monetarists and New Classical economists believe that an economy is always at full employment, and therefore the AS curve is vertical.
LRAS
As you can see in the diagram above, any increase in AD will be purely inflationary in the long run. Here, an increase in AD from ADi to AD2 will increase output, reducing unemployment in the short run. However, it will also increase the rate of inflation, reducing short run aggregate supply from SRASi to SRAS2, leading to a return to LRAS, but at a higher rate of inflation.
The implication of AS at full employment is that when an economy reaches this point, the only way to increase national income and reduce unemployment without causing inflation is to use supply- side policies to move the AS curve outwards to the right.
Macroeconomic policy is in effect a balance between demand-side and supply-side policies. AD can be allowed or encouraged to increase as long as there is room on the supply side for it to do so. Most developed economies can only sustain a 2-3% growth rate of national income without causing inflation to accelerate.
Governments need to use demand-side policies (fiscal and monetary policies) to make sure that AD does not grow out of control whilst using supply-side policies to encourage the growth of productive potential to make sure that economic growth is sustainable at low rates of inflation.
Multiplier and Accelerator
* Multiplier
The multiplier effect is the proportion by which an initial increase in injections (G, I or X) causes a greater final increase in the level of national income.
The size of the multiplier depends upon the marginal propensities to consume and withdrawal (MPC and MPW). The greater the MPC (the less the MPW as all income is either consumed or withdrawn (Y = C + W)) the greater the multiplier will be. This is because a greater proportion of an increase in income will be spent with domestic firms. Household saving and consumption plans are difficult to predict and so the value of the multiplier is hard to predict and it may change over time.
• Accelerator
The accelerator is the relationship between a change in the level of national income and the level of investment that this induces. Firms invest in capital goods when the demand for goods and services is growing. Conversely, a fall in consumer demand will also lead to a fall in capital investment. Because of the nature of investment (capital goods tend to last for a number of years and are therefore expensive), the level of investment will tend to be greater than the initial change in demand that stimulated the decision to increase capacity.
If the rate of growth of national income is increasing then investment will rise by a multiple of this growth rate.If the rate of growth of national income is decreasing then investment will fall.If national income is constant then only replacement investment will take place.If national income falls then there will be no investment.
• Multiplier and Accelerator interaction
An initial increase in anything that stimulates a rise in aggregate demand (such as an increase in government spending) will have a multiplied effect on national income and this increase in national income in turn will have an accelerator effect on investment. This increase in investment will have a multiplied effect on national income and then the process repeats itself. Of course anything that causes national income to fall will have a multiplier/accelerator interaction in the opposite direction.
This interaction can help explain why booms and slumps start.
19. Government spending increases by $200 and as a result national income increases by $800. What is the value of the marginal propensity to consume?A. 0.25B. 4C. 0.8D. 0.75
Multiple Choice
20. An increase in aggregate demand is most likely toA. increase an economy’s capacity.B. increase a budget deficit.C. reduce the rate of interest.D. increase the rate of inflation.
21. Which of the following is not a determinant of aggregate demand?
A. Investment.B. Domestic consumption.C. Labour mobility.D. Export revenues.
22. An example of a supply-side policy isA. a reduction in the rate of interestB. a reduction in the size of the budget deficit.C. an increase in direct taxation.D. the provision of government grants for training.
Short Answer Questions
16. Using an aggregate demand and aggregate supply diagram analyse the likely effects of a cut in the rate of interest.
DEMAND-SIDE AND SUPPLY-SIDE POLICIES
Demand-side Policies
• Fiscal PolicyFiscal policy is the use of government spending and taxation to influence AD, raise revenue, redistribute income and influence consumption patterns. The way in which government spending and taxation influences AD has already been mentioned above, but there can be problems with fiscal policy.
Problems with Fiscal Policy:
Time lags. It will take at least 18 months for the full effects for a change in fiscal policy to be felt.Finance Inflexibility. Fiscal programmes are very hard to adjust in the face of changing circumstances.Budget deficits can lead to increases in interest rates and taxation.Crowding out. Budget deficits need to be financed by borrowing. The public sector needs to compete with the private sector for funds, and so will have to offer higher rates of interest. Thus the private sector will be forced to offer high interest rates as well, discouraging investment and spending. Some economists argue that this will only happen when an economy is at full capacity.
Because of the limitations of fiscal policy, most governments focus their demand-side policies around monetary policy and the rate of interest in particular. Fiscal policy is now often used to improve the supply-side of an economy, for example by cutting direct taxes and benefits.
• Monetary PolicyMonetary policy is the use of the rate of interest predominantly to influence AD (the money supply control and targeting the exchange rate can also be used). Monetary policy also has its potential problems:
Investment is interest inelastic. Investment is more dependent upon expectations than the rate of interest.One policy fits all. The rate of interest can be seen as a rather blunt tool, as a central bank’s rate of interest decision applies to all institutions and all aspects of an economy.Goodhart’s Law. Once a measure of the money supply is chosen to be controlled it becomes a poor measure of the money supply as financial institutions will find different ways of lending money in response to controls. Disintermediation. The banking system is bypassed by companies and other institutions lending to each other directly and not through the usual financial institutions, such as banks.
Most developed economies now actively use the rate of interest to influence AD. Independent central banks dominate rate of interest decision-making. They are able to respond instantly to changing economic circumstances, whereas fiscal policy often has to wait for the democratic wheels to turn.
Supply-side Policies
Supply-side policies aim to increase an economy’s productive potential by:
Increasing labour mobilityIncreasing incentives/decreasing disincentives to workIncreasing the productivity of labourIncreasing investment, innovation and enterprise
Policies tend to focus on microeconomics
Deregulation Privatisation Education and training Trade Union reforms Income tax cuts Benefit reformWelfare to work programmes Minimum wage
UNEMPLOYMENT AND INFLATION
Unemployment
The Unemployed are the people who are registered as willing, able and available for work at the market clearing wage, but who are unable to find work.
Underemployment is when workers who want full-time jobs are only able to find part-time employment. Low wages and output per worker are reflections of work with low rates o f productivity.
There is a debate about how to measure unemployment. Should unemployment figures just include those who are able to claim benefits (and who therefore have to satisfy a stringent set of criteria)? Or should unemployment figures include all those who have been actively looking for work whether they are eligible for benefits or not? Using the first measure (claimant count), unemployment in the UK as of August 2004 stood at 2.7%. Using the second measure (labour force survey), unemployment stood at 4.7%.
The costs of unemployment are:
Loss of outputWaste of productive potentialGovernment finances (loss of tax revenue, increased benefit spending)Social problemsLoss of consumer spending
Both short answers and essays ask easy factual questions about the types, causes and cures of both unemployment and inflation.

The types (causes) of unemployment are:
Whilst you need to know individual types of unemployment, the voluntary/involuntary distinction links the problem clearly into AD/AS analysis. You should structure the analysis and evaluation of the problems and cures associated with unemployment around the AD/AS framework.
Cyclical (Demand Deficient)FrictionalSeasonalStructuralReal Wage (Classical)Technological
These can be divided into involuntary (cyclical) and voluntary (the rest of the above list) types of unemployment. This distinction has important implications for the cure of unemployment. A traditional approach to the types of unemployment simply provides a descriptive list. A much more useful (and more modern) approach is to divide unemployment into voluntary and involuntary. Involuntary is caused by demand-side problems, and voluntary is caused by supply-side problems. This way of categorising unemployment provides us with a clear framework of strategies to reduce unemployment.
The cures for involuntary unemployment are based on demand-side policies. Economic growth can be stimulated and sustained by:
Fiscal policy (cut taxes, increase government spending) Monetary policy (reduce the rate of interest)
The cures for voluntary unemployment are based on supply- side policies. AS can be increased by:
Increasing incentives to work Decreasing disincentives to work Increasing labour mobility Human capital improvements
• The Natural Rate of UnemploymentThe natural rate, also known as the equilibrium rate, is anyunemployment that exists when the aggregate demand for labour equals the aggregate supply o f labour. In the diagram below this is Li to t_2 and as such is voluntary unemployment. Supply-side policies should be used as a cure. The natural rate exists at the full employment level of income (where there is no demand deficient unemployment) and this is where the AS curve is vertical. This again emphasises the need for supply-side policies.
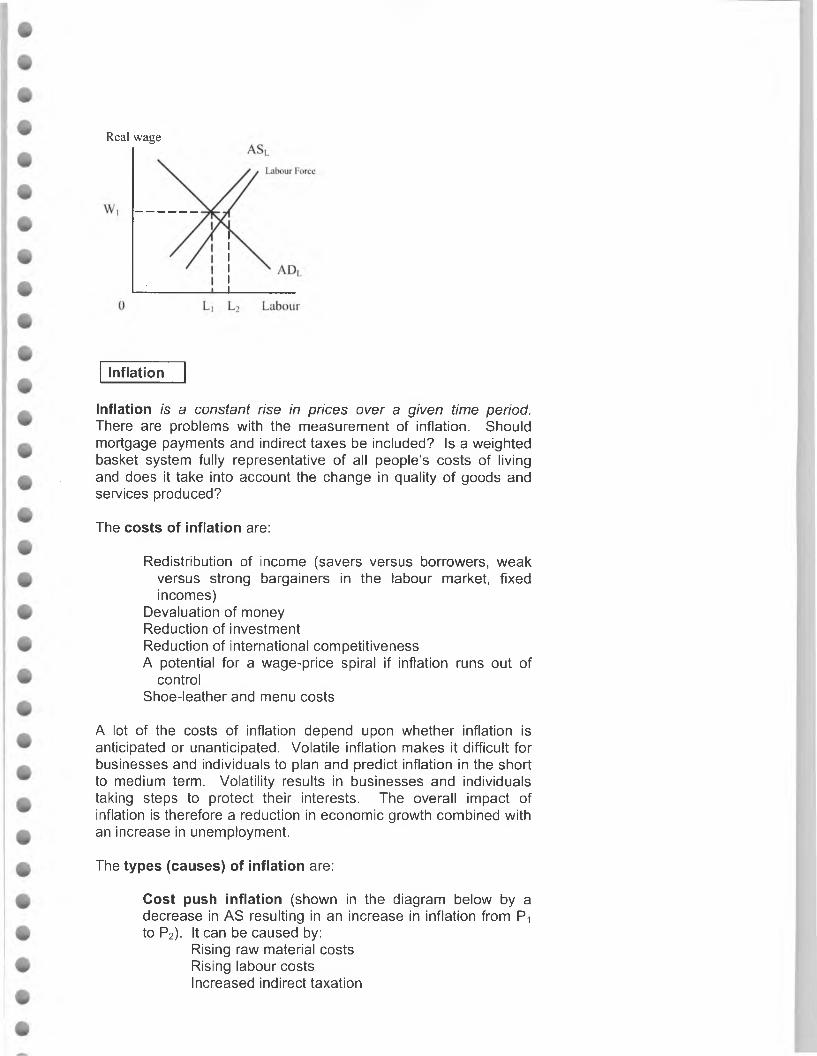
Real wage
Inflation
Inflation is a constant rise in prices over a given time period. There are problems with the measurement of inflation. Should mortgage payments and indirect taxes be included? Is a weighted basket system fully representative of all people’s costs of living and does it take into account the change in quality of goods and services produced?
The costs of inflation are:
Redistribution of income (savers versus borrowers, weak versus strong bargainers in the labour market, fixed incomes)
Devaluation of money Reduction of investment Reduction of international competitiveness A potential for a wage-price spiral if inflation runs out of
controlShoe-leather and menu costs
A lot of the costs of inflation depend upon whether inflation is anticipated or unanticipated. Volatile inflation makes it difficult for businesses and individuals to plan and predict inflation in the short to medium term. Volatility results in businesses and individuals taking steps to protect their interests. The overall impact of inflation is therefore a reduction in economic growth combined with an increase in unemployment.
The types (causes) of inflation are:
Cost push inflation (shown in the diagram below by a decrease in AS resulting in an increase in inflation from Pt to P2). It can be caused by:
Rising raw material costs Rising labour costs Increased indirect taxation
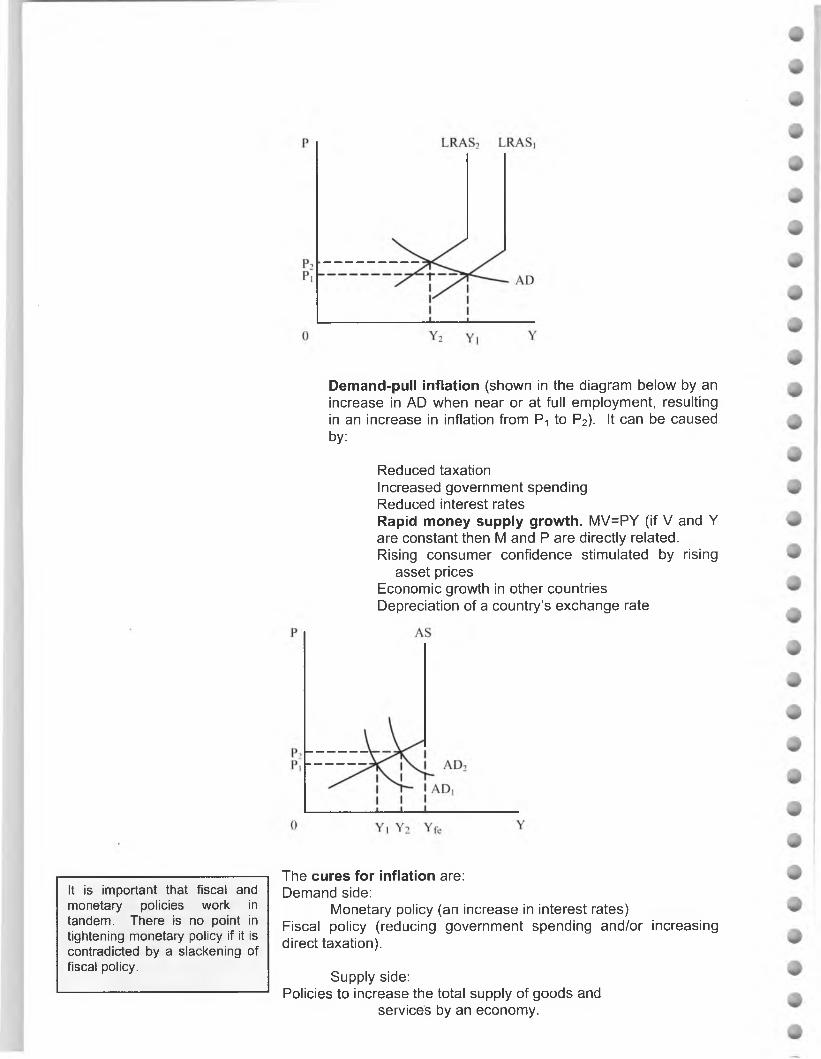
It is important that fiscal and monetary policies work in tandem. There is no point in tightening monetary policy if it is contradicted by a slackening of fiscal policy.
Demand-pull inflation (shown in the diagram below by an increase in AD when near or at full employment, resulting in an increase in inflation from P-i to P2). It can be caused by:
Reduced taxationIncreased government spendingReduced interest ratesRapid money supply growth. MV=PY (if V and Yare constant then M and P are directly related.Rising consumer confidence stimulated by rising
asset prices Economic growth in other countries Depreciation of a country’s exchange rate
The cures for inflation are:Demand side:
Monetary policy (an increase in interest rates)Fiscal policy (reducing government spending and/or increasing direct taxation).
Supply side:Policies to increase the total supply of goods and
services by an economy.
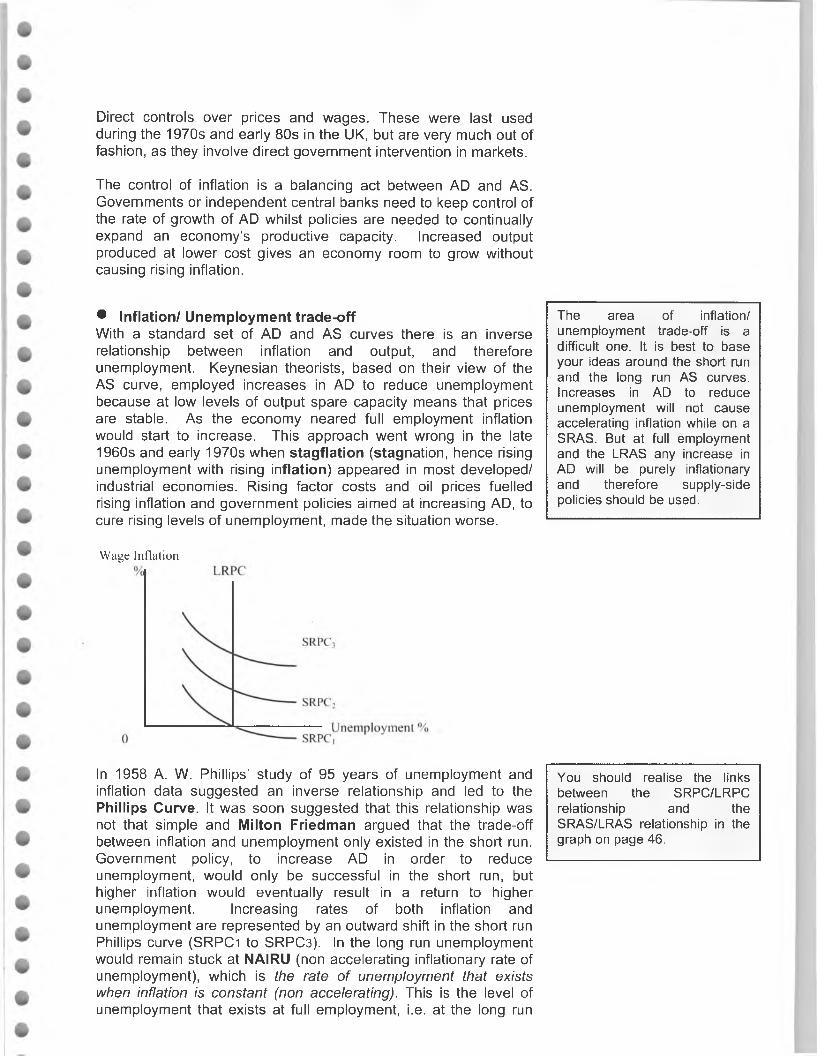
Direct controls over prices and wages. These were last used during the 1970s and early 80s in the UK, but are very much out of fashion, as they involve direct government intervention in markets.
The control of inflation is a balancing act between AD and AS. Governments or independent central banks need to keep control of the rate of growth of AD whilst policies are needed to continually expand an economy’s productive capacity. Increased output produced at lower cost gives an economy room to grow without causing rising inflation.
• Inflation/ Unemployment trade-offWith a standard set of AD and AS curves there is an inverse relationship between inflation and output, and therefore unemployment. Keynesian theorists, based on their view of the AS curve, employed increases in AD to reduce unemployment because at low levels of output spare capacity means that prices are stable. As the economy neared full employment inflation would start to increase. This approach went wrong in the late 1960s and early 1970s when stagflation (stagnation, hence rising unemployment with rising inflation) appeared in most developed/ industrial economies. Rising factor costs and oil prices fuelled rising inflation and government policies aimed at increasing AD, to cure rising levels of unemployment, made the situation worse.
The area of inflation/ unemployment trade-off is a difficult one. It is best to base your ideas around the short run and the long run AS curves. Increases in AD to reduce unemployment will not cause accelerating inflation while on a SRAS. But at full employment and the LRAS any increase in AD will be purely inflationary and therefore supply-side policies should be used.
Wage Inflation
In 1958 A. W. Phillips’ study of 95 years of unemployment and inflation data suggested an inverse relationship and led to the Phillips Curve. It was soon suggested that this relationship was not that simple and Milton Friedman argued that the trade-off between inflation and unemployment only existed in the short run. Government policy, to increase AD in order to reduce unemployment, would only be successful in the short run, but higher inflation would eventually result in a return to higher unemployment. Increasing rates of both inflation and unemployment are represented by an outward shift in the short run Phillips curve (SRPC1 to SRPC3). In the long run unemployment would remain stuck at NAIRU (non accelerating inflationary rate of unemployment), which is the rate of unemployment that exists when inflation is constant (non accelerating). This is the level of unemployment that exists at full employment, i.e. at the long run
You should realise the links between the SRPC/LRPC relationship and the SRAS/LRAS relationship in the graph on page 46.
vertical AS curve. The solution yet again is supply-side economics.
Multiple Choice
23. The long run Phillips curveA. shows an inverse relationship between the rate of inflation and the rate of unemployment.B. can be moved using reflationary fiscal policies.C. is vertical and represents the natural rate of unemployment.D. represents involuntary unemployment.
24. An effective cure for involuntary unemployment would involveA. an increase in the rate of interest.B. running a budget deficit.C. protectionist measures against foreign imports.D. taxation and benefit reforms to improve incentives to work.
25. The most likely outcome of a central bank increasing the rate of interest at the same time as a cut in government spending isA. a fall in aggregate demand but an increase in inflation.B. a decrease in aggregate supply coupled with an increase in output.C. a decrease in inflation but an increase in unemployment.D an improvement in the current account on the balance of payments.
Short Answer Questions
17. What policies might an economist advise if an economy was suffering from ‘demand-deficient’ (cyclical) unemployment?
18. What is voluntary unemployment and what can be done about it?
Students frequently find this a very confusing area. Both schools of thought seem to have persuasive arguments to account for the way in which the economic world works. Good economics is about differing opinions! The extremistproponents of these two schools of thought will carry on arguing well into the future. You should focus on their different views on the workings of the market, the rationale and effects of government intervention and the shape of the AS curve, and be prepared to illustrate, analyse and evaluate each side of the debate.
The Keynesian/Monetarist Debate
Keynesians believe that:
Markets are slow to adjustAn economy can be in equilibrium below full employment Governments should and can effectively intervene to
stabilise an economy Fiscal is more effective than monetary policy
Monetarists believe that:
Markets workEconomies tend towards full employment Inflation is caused by excessive money supply growth Governments should intervene really only to control
inflation by controlling money supply growth
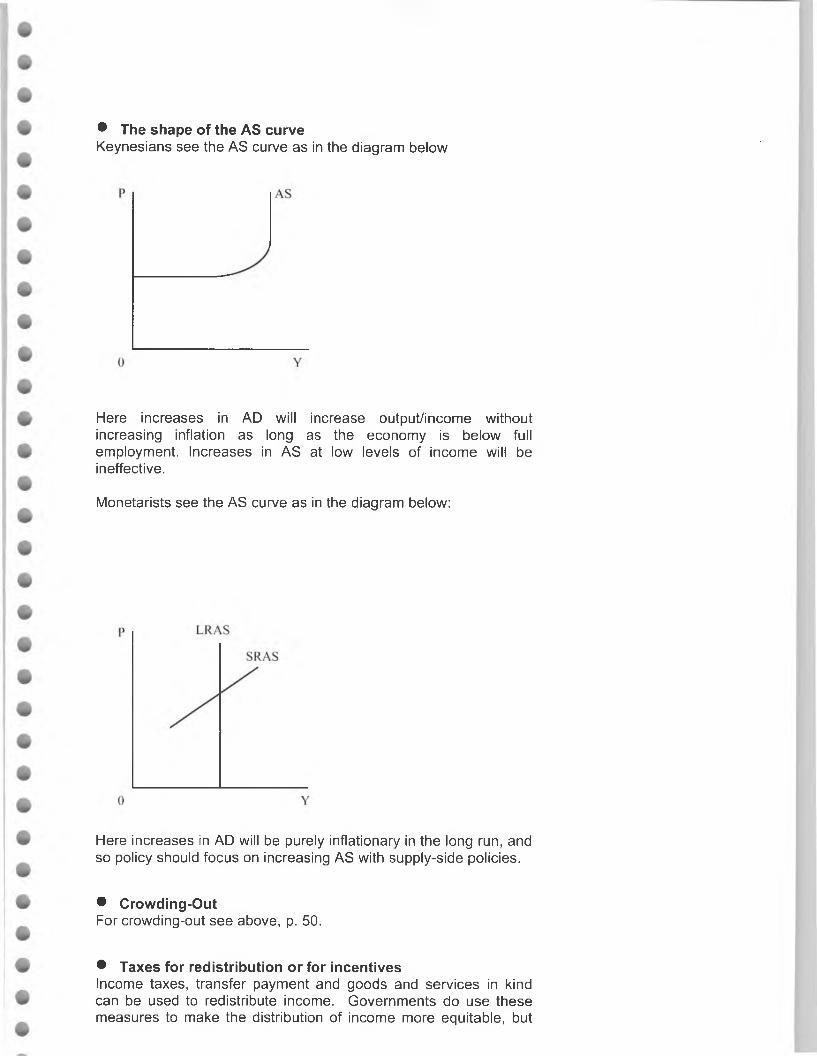
• The shape of the AS curveKeynesians see the AS curve as in the diagram below
Here increases in AD will increase output/income without increasing inflation as long as the economy is below full employment. Increases in AS at low levels of income will be ineffective.
Monetarists see the AS curve as in the diagram below:
Here increases in AD will be purely inflationary in the long run, and so policy should focus on increasing AS with supply-side policies.
• Crowding-OutFor crowding-out see above, p. 50.
• Taxes for redistribution or for incentivesIncome taxes, transfer payment and goods and services in kind can be used to redistribute income. Governments do use these measures to make the distribution of income more equitable, but
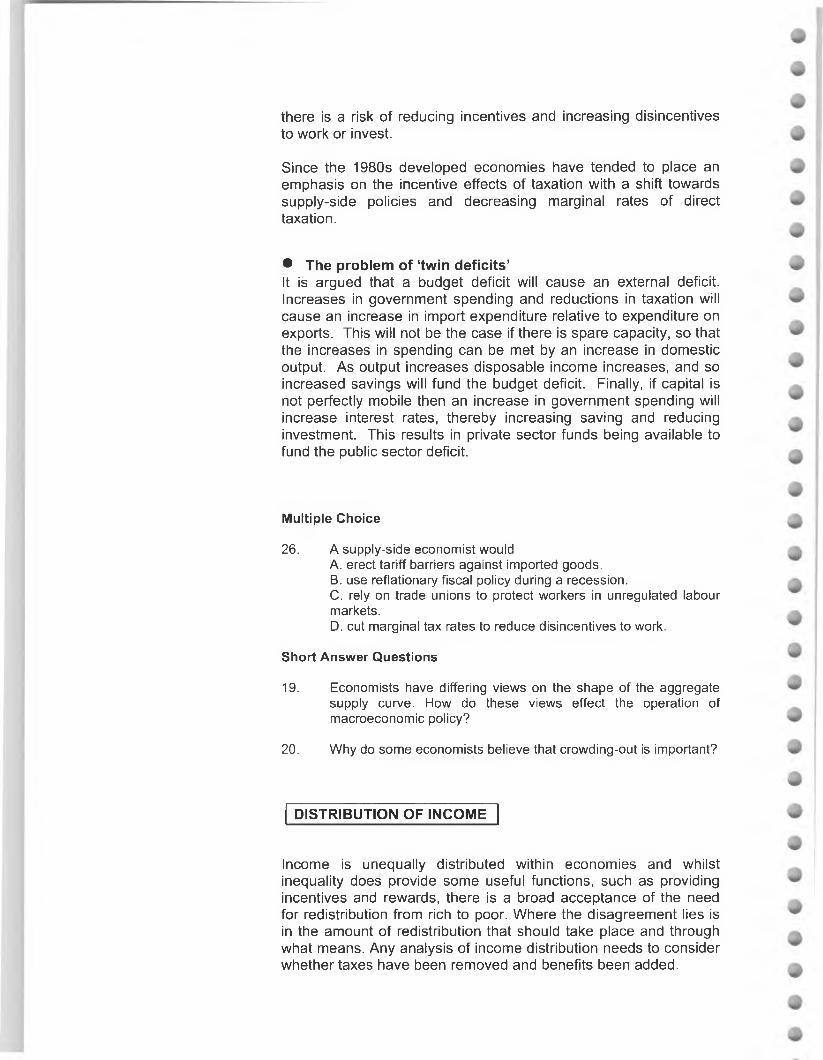
there is a risk of reducing incentives and increasing disincentives to work or invest.
Since the 1980s developed economies have tended to place an emphasis on the incentive effects of taxation with a shift towards supply-side policies and decreasing marginal rates of direct taxation.
• The problem of ‘twin deficits’It is argued that a budget deficit will cause an external deficit. Increases in government spending and reductions in taxation will cause an increase in import expenditure relative to expenditure on exports. This will not be the case if there is spare capacity, so that the increases in spending can be met by an increase in domestic output. As output increases disposable income increases, and so increased savings will fund the budget deficit. Finally, if capital is not perfectly mobile then an increase in government spending will increase interest rates, thereby increasing saving and reducing investment. This results in private sector funds being available to fund the public sector deficit.
Multiple Choice
26. A supply-side economist wouldA. erect tariff barriers against imported goods.B. use reflationary fiscal policy during a recession.C. rely on trade unions to protect workers in unregulated labour markets.D. cut marginal tax rates to reduce disincentives to work.
Short Answer Questions
19. Economists have differing views on the shape of the aggregate supply curve. How do these views effect the operation of macroeconomic policy?
20. Why do some economists believe that crowding-out is important?
DISTRIBUTION OF INCOME
Income is unequally distributed within economies and whilst inequality does provide some useful functions, such as providing incentives and rewards, there is a broad acceptance of the need for redistribution from rich to poor. Where the disagreement lies is in the amount of redistribution that should take place and through what means. Any analysis of income distribution needs to consider whether taxes have been removed and benefits been added.
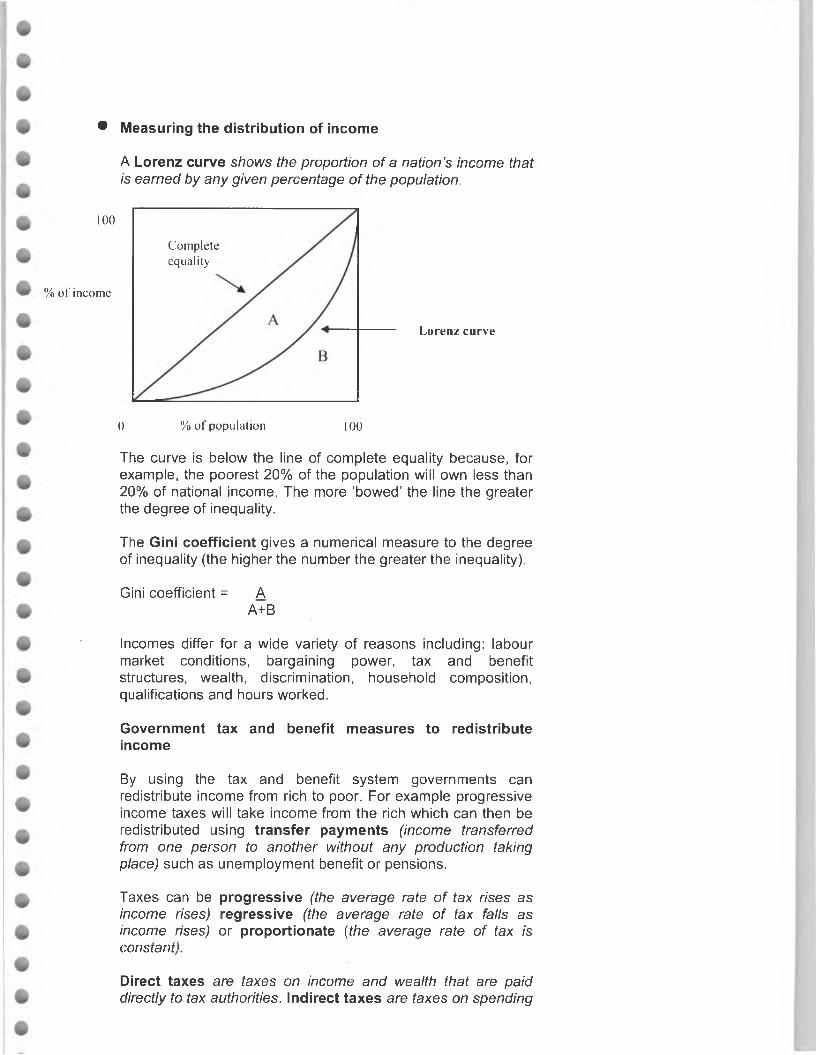
• Measuring the distribution of income
A Lorenz curve shows the proportion of a nation’s income that is earned by any given percentage o f the population.
100
% of income
Complete
equality
Lorenz curve
0 % of population 100
The curve is below the line of complete equality because, for example, the poorest 20% of the population will own less than 20% of national income. The more ‘bowed’ the line the greater the degree of inequality.
The Gini coefficient gives a numerical measure to the degree of inequality (the higher the number the greater the inequality).
Gini coefficient = A A+B
Incomes differ for a wide variety of reasons including: labour market conditions, bargaining power, tax and benefit structures, wealth, discrimination, household composition, qualifications and hours worked.
Government tax and benefit measures to redistribute income
By using the tax and benefit system governments can redistribute income from rich to poor. For example progressive income taxes will take income from the rich which can then be redistributed using transfer payments (income transferred from one person to another without any production taking place) such as unemployment benefit or pensions.
Taxes can be progressive (the average rate of tax rises as income rises) regressive (the average rate of tax falls as income rises) or proportionate (the average rate of tax is constant).
Direct taxes are taxes on income and wealth that are paid directly to tax authorities. Indirect taxes are taxes on spending
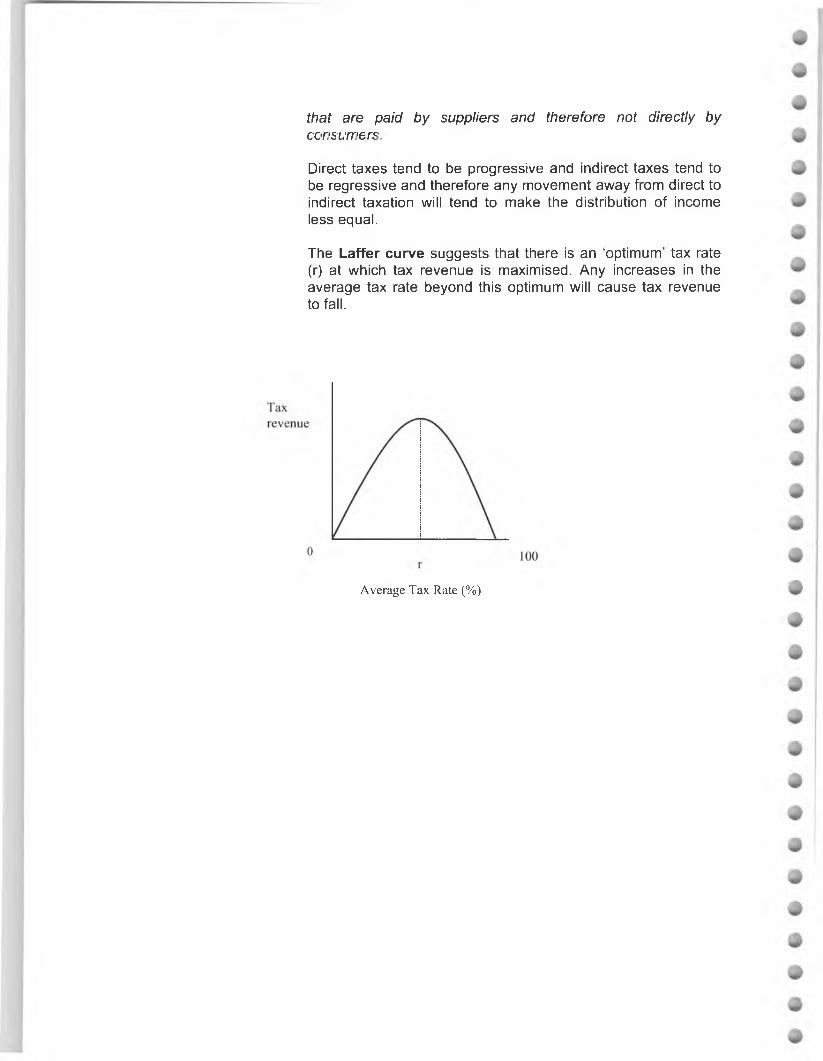
that are paid by suppliers and therefore not directly by consumers.
Direct taxes tend to be progressive and indirect taxes tend to be regressive and therefore any movement away from direct to indirect taxation will tend to make the distribution of income less equal.
The Laffer curve suggests that there is an ‘optimum’ tax rate (r) at which tax revenue is maximised. Any increases in the average tax rate beyond this optimum will cause tax revenue to fall.
Average Tax Rate (%)
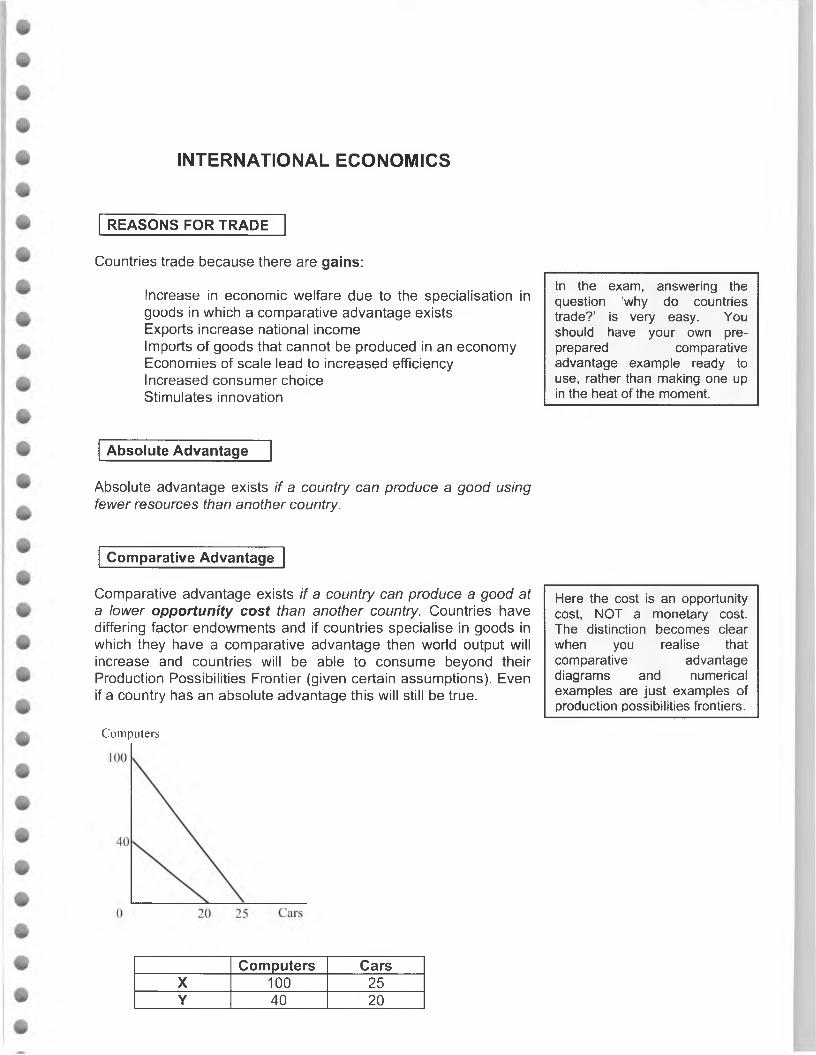
INTERNATIONAL ECONOMICS
REASONS FOR TRADE
Countries trade because there are gains:
Increase in economic welfare due to the specialisation ingoods in which a comparative advantage existsExports increase national incomeImports of goods that cannot be produced in an economyEconomies of scale lead to increased efficiencyIncreased consumer choiceStimulates innovation
In the exam, answering the question ‘why do countries trade?’ is very easy. You should have your own preprepared comparative advantage example ready to use, rather than making one up in the heat of the moment.
Absolute Advantage
Absolute advantage exists if a country can produce a good using fewer resources than another country.
Comparative Advantage
Comparative advantage exists if a country can produce a good at a lower opportunity cost than another country. Countries have differing factor endowments and if countries specialise in goods in which they have a comparative advantage then world output will increase and countries will be able to consume beyond their Production Possibilities Frontier (given certain assumptions). Even if a country has an absolute advantage this will still be true.
Here the cost is an opportunity cost, NOT a monetary cost. The distinction becomes clear when you realise that comparative advantagediagrams and numerical examples are just examples of production possibilities frontiers.
Computers
Computers CarsX 100 25Y 40 20

Both the diagram and the table above show the production possibilities of countries X and Y with a given set of resources. Here country X has an absolute advantage in both goods (it can produce more of both goods with the same resources as Y). From the graph we can see that the opportunity costs of production of each good differ in each country because the PPFs are not parallel. X has a comparative advantage in computers and Y has a comparative advantage in cars.
In X:the opportunity cost of producing 1 computer is 1/4of a car (100/100 -> 25/100)the opportunity cost of producing 1 car is 4 computers (25/25 ->100/25)
In Y:the opportunity cost of producing 1 computer is 1/2of a car (40/40 -> 20/40)the opportunity cost of producing 1 car is 2 computers (20/20 -> 40/20)
So if country X can buy cars from Y for less than 4 computers and Y can sell cars to X for more than 2 computers then both countries will gain. If country Y can buy computers for less than !4 car and country X can sell computers for more than % car then both countries will gain.
Here the terms of trade will be 1 c a r : 3 computers.
The above model is based on the following assumptions:
Two countries and two productsEach country has a given set of resourcesPerfect factor mobilityNo transport costsConstant returns to scaleNo externalities from production
Comparative advantage is limited by the existence of barriers to trade in the real world, it ignores transport costs, it assumes perfect factor mobility and the fact that specialisation could cause either economies or diseconomies of scale.
Multiple Choice
27. The table below indicates the number of cars and computers that two countries can produce given the same resources.
Country Cars ComputersX 16 4Y 4 2
From the table it can be concluded thatA. the two countries would not benefit from trade.B. X has a comparative advantage in both goods.C. X has a comparative advantage in cars but not in computers.D. Y has a comparative advantage in cars but not computers.
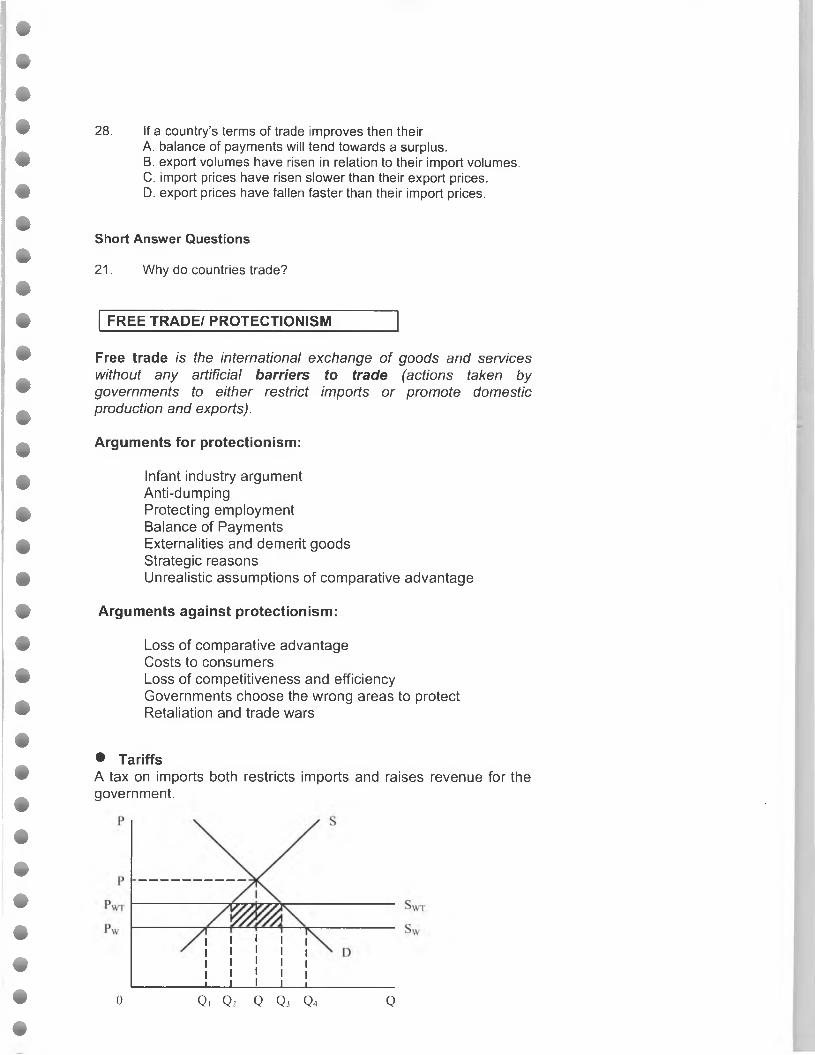
28. If a country’s terms of trade improves then theirA. balance of payments will tend towards a surplus.B. export volumes have risen in relation to their import volumes.C. import prices have risen slower than their export prices.D. export prices have fallen faster than their import prices.
Short Answer Questions
21. Why do countries trade?
FREE TRADE/ PROTECTIONISM
Free trade is the international exchange of goods and services without any artificial barriers to trade (actions taken by governments to either restrict imports or promote domestic production and exports).
Arguments for protectionism:
Infant industry argument Anti-dumping Protecting employment Balance of Payments Externalities and demerit goods Strategic reasonsUnrealistic assumptions of comparative advantage
Arguments against protectionism:
Loss of comparative advantageCosts to consumersLoss of competitiveness and efficiencyGovernments choose the wrong areas to protectRetaliation and trade wars
• TariffsA tax on imports both restricts imports and raises revenue for the government.
0 Q, Oz Q Q3 Q4 Q
It is important that you are able to analyse and evaluate the effects of protectionist measures. Whilst there might be short-term gains, such as a reduction in imports and tax revenue for the government, there will always be an increase in prices and a loss of economic welfare due to a reduction in consumption, an increase in consumer prices, and increased output from inefficient domestic firms. Of course, there is always the threat of retaliation as well.
Here D and S represent domestic demand for and domestic supply of a particular good and the pre-trade equilibrium is at (P,Q). The world price of this good (P w ) is lower that the price of domestically produced goods (P) and so quantity demanded increases from Q to Q4 and the quantity supplied by domestic firms falls to Qi. This shortfall (Qi to Q4) is covered by imports. Now this country decides to put a tariff on imports and so this increases the price of imports (P w t) so reducing the quantity demanded to Q3 and increasing the quantity supplied by domestic firms to Q2. This reduced shortfall is covered by a reduced number of imports (Q2to Q3).
The government will gain revenue from this tariff equal to the area (Q2to Q3) x the distance between Pw and Pwt (shaded area).
The final effects of a tariff will depend upon the price elasticities of demand and supply.
• QuotasA quota is a physical limit on imports in terms of volume or value.
• SubsidiesSubsidies reduce domestic prices and make them more competitive in relation to cheaper imported goods.
• Administrative BarriersCountries can make it difficult to import goods by using bureaucratic delays and tight safety restrictions
• Voluntary Export RestraintsBi-lateral agreements by countries to limit their imports to each other based on specific quotas.
ECONOMIC INTEGRATION
Globalization,as defined by the OECD, is ‘the geographical dispersion of industrial and service activities and the cross-border networking of companies’. The rate of growth of international trade far exceeds the rate of growth of world output. This process has been happening for many centuries but today’s communications systems and the growth of MNCs/TNCs have accelerated the pace of globalisation.
• Trading BlocksA Free Trade Area is created when countries form a trading area within which they move goods and services freely but each individual country retains its own barriers to outside countries.In a Customs Union individual country trade barriers no longer exist and there is a unified trade policy.
A Common Market is a customs union with the free movement of factors of production as well.
Customs Unions may cause either Trade Creation (a shift of production from high cost to low cost countries) or Trade Diversion (a shift in production from low cost countries outside the union to high cost, although tariff free, countries inside the union).
The reluctance to surrender both political and economic sovereignty may act as a barrier to integration.
• Trade Agreements/WTOGATT/WTO tightly restricts members actions to impose tariffs and quotas. Many countries have sought to use less obvious barriers to trade such as subsidies and safety and production quality standards. Many developed economies are facing increased competition from developing economies with lower costs of production and therefore they are having to cope with the implications for employment and output. Recent WTO meetings have been characterised by clashes between the developed and developing economies about just how ‘free’ trade is.
BALANCE OF PAYMENTS
The Balance of Payments is an account of a country’s financial transactions with the rest of the world. The current account measures trade in goods and services and net investment income and transfers. The capital account measures capital flows (shares, government debt and foreign investment).The Balance of Payments must balance. If a country runs a current account deficit then this must be funded by a capital account surplus. This surplus can either come from foreign direct investment, attracting short term inflows of funds through attractive rates of interest or the selling of government foreign currency reserves.
Multiple Choice
29. Which of the following is the distinguishing feature of a single market?A. A common external tariff.B. Free trade between member states of goods and services.C. Free movement of factors of production between member states.D. A common fiscal policy.
30. Which of the following is most likely to improve a country’s balance of payments on current account?A. An increase in the value of the currency in foreign exchange markets.B. An increase in national income.C. A decrease in national income.D. An increase in the budget deficit.
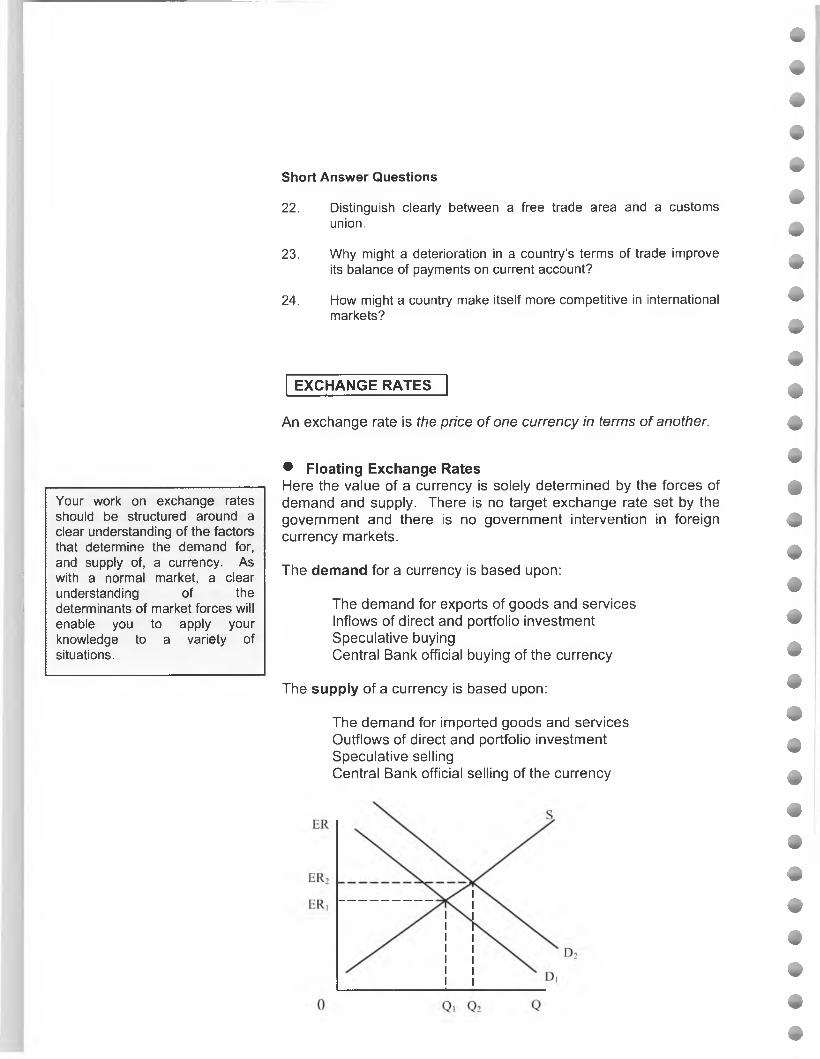
Your work on exchange rates should be structured around a clear understanding of the factors that determine the demand for, and supply of, a currency. As with a normal market, a clear understanding of the determinants of market forces will enable you to apply your knowledge to a variety of situations.
Short Answer Questions
22. Distinguish clearly between a free trade area and a customs union.
23. Why might a deterioration in a country’s terms of trade improve its balance of payments on current account?
24. How might a country make itself more competitive in international markets?
EXCHANGE RATES
An exchange rate is the price of one currency in terms of another.
• Floating Exchange RatesHere the value of a currency is solely determined by the forces of demand and supply. There is no target exchange rate set by the government and there is no government intervention in foreign currency markets.
The demand for a currency is based upon:
The demand for exports of goods and services Inflows of direct and portfolio investment Speculative buyingCentral Bank official buying of the currency
The supply of a currency is based upon:
The demand for imported goods and services Outflows of direct and portfolio investment Speculative sellingCentral Bank official selling of the currency
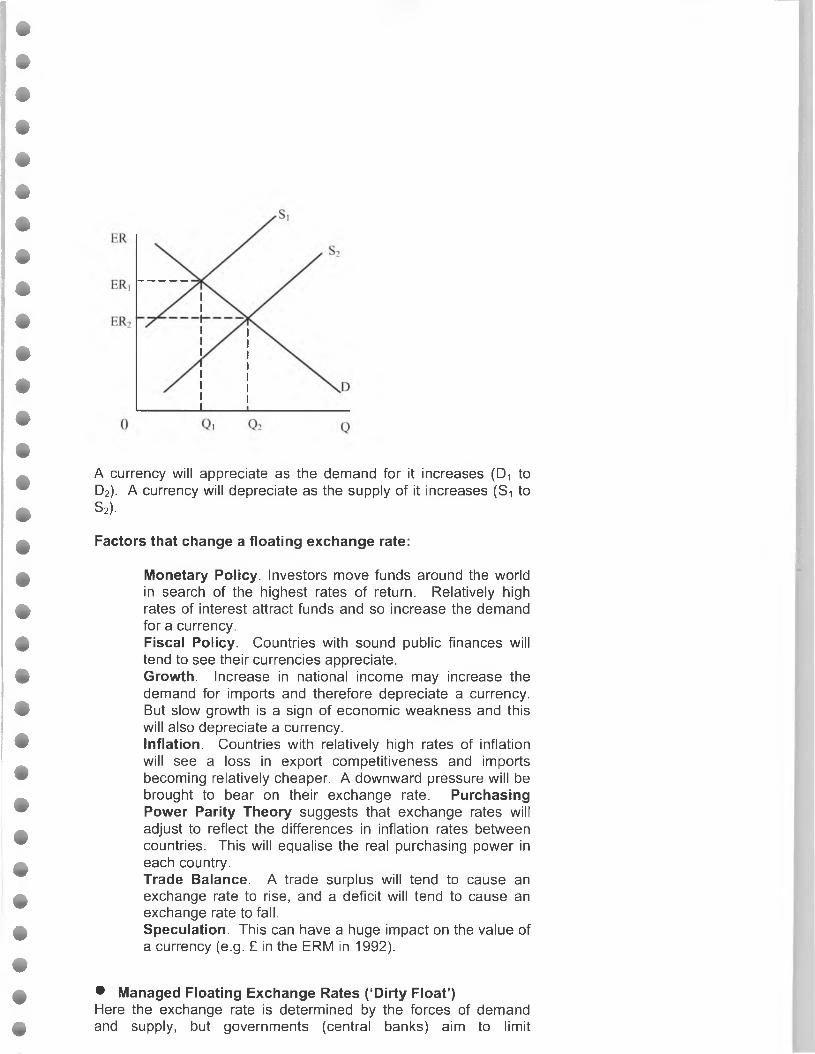
A currency will appreciate as the demand for it increases (Dt to D2). A currency will depreciate as the supply of it increases (Si toS2).
Factors that change a floating exchange rate:
Monetary Policy. Investors move funds around the world in search of the highest rates of return. Relatively high rates of interest attract funds and so increase the demand for a currency.Fiscal Policy. Countries with sound public finances will tend to see their currencies appreciate.Growth. Increase in national income may increase the demand for imports and therefore depreciate a currency. But slow growth is a sign of economic weakness and this will also depreciate a currency.Inflation. Countries with relatively high rates of inflation will see a loss in export competitiveness and imports becoming relatively cheaper. A downward pressure will be brought to bear on their exchange rate. Purchasing Power Parity Theory suggests that exchange rates will adjust to reflect the differences in inflation rates between countries. This will equalise the real purchasing power in each country.Trade Balance. A trade surplus will tend to cause an exchange rate to rise, and a deficit will tend to cause an exchange rate to fall.Speculation. This can have a huge impact on the value of a currency (e.g. £ in the ERM in 1992).
• Managed Floating Exchange Rates (‘Dirty Float’)Here the exchange rate is determined by the forces of demand and supply, but governments (central banks) aim to limit
fluctuations and might ‘manage’ the value of the currency to achieve a macroeconomic goal such as low inflation or to stimulate export growth.
• Semi-fixed Exchange RateHere the exchange rate will have a specific target and will be a dominant part of economic policy. The government will intervene to maintain the value of the currency within certain bands using the rate of interest and/or currency reserves.
• Fixed Exchange RateHere the exchange rate cannot fluctuate from the central rate.
• Common Currencies and Monetary IntegrationHere countries replace their national currencies and replace them with a common currency. The best example of this is the Euro. Monetary policy, controlled by a single central bank covering all countries (the ECB).
Advantages of a floating exchange rate:
Advantages of fixed exchange rates:
Inflation disciplineCertainty through currency stability increases trade Reduces costs of currency hedging for firms
Advantages of a strong currency:
Reduced import costs Inflationary discipline Improvement in the terms of trade Increased real purchasing power abroad
Disadvantages of a strong currency:
Increased import penetrationExports struggle to maintain competitivenessReduces economic growthAsymmetrical effects on regions and sectors
Depreciation vs. devaluation
A depreciation is the fall in value of a currency under a floating exchange rate system caused by movements in the demand for and supply of the currency. A devaluation is the fall in the value of
The disadvantages of each system are the opposite of the advantages of the alternative system. For example, a floating exchange rate does not provide inflation discipline, and a fixed exchange rate requires currency reserves.
No need for currency reserves Monetary policy free to target domestic goals Automatic balance of payments adjustment Reduced risk of speculation
a currency in a fixed exchange rate system after a conscious decision by a government to reduce the value of its currency.
Appreciation vs. revaluation
An appreciation is the rise in value of a currency under a floating exchange rate system caused by movements in the demand for and supply of the currency. A revaluation is the rise in the value of a currency in a fixed exchange rate system after a conscious decision by a government to increase the value of its currency.
Short Answer Questions
25. Explain why a country’s exchange rate might fall in value.
26. Use a demand and supply diagram to explain how changes in the rate of interest effect the value of a currency.
BALANCE OF PAYMENTS AND EXCHANGE RATES
• Changes in the Exchange RateA devaluation of an exchange rate will make exports more competitive and imports more expensive and vice versa.
The final impact of a devaluation on the balance of payments will depend upon the Marshall-Lerner condition (a devaluation in the exchange rate will improve the balance of payments if the sum of the price elasticities and demand for exports and imports is greater than 1). A devaluation might take time to have a positive effect on the balance of payments, and it might even make thing worse initially, because of the ‘J’ curve effect. It takes time for traders to adjust to new prices and so the Marshall-Lerner condition is not immediately satisfied.
• Changes in Aggregate DemandThere is obviously a strong link between international trade and
AD=C+I+G+(X-M).An increase in export revenues will increase AD, and an increase in expenditure on imports will decrease AD.
For a country with a high marginal propensity to import, an increase in AD will increase import expenditure and so move the balance of payments towards a deficit.
• ProtectionismA country with a fixed exchange rate will not be able to rely upon a devaluation in order to improve the competitiveness of its exports
and so it might well have to consider protectionist measures to attempt to improve its balance of payments.
• Expenditure Switching and Expenditure ChangingUnder a managed exchange rate system there are some long term options for making balance of payments adjustments.
Expenditure switching aims to encourage domestic consumers to switch expenditure from imports to domestic goods using policies such as protectionism, devaluation (see Marshall-Lerner condition and the ‘J’ curve) and increasing competitiveness.
Expenditure changing aims to reduce aggregate demand and so reduce expenditure on imports by using fiscal and monetary policies to influence AD.
Supply-side policies aim to increase the productive potential of an economy enabling it to produce goods for which there is an international market and in a competitive manner.
• Persistent Current Account DeficitsA deficit is caused by cyclical and structural factors and apersistent deficit will tend to be caused by structural factors. An economy might have a problem with its competitiveness or that it simply does not produce the type of goods that are needed by its domestic consumers or in export markets. In a floating exchange rate system the currency will depreciate but in a fixed exchange rate system this is not an option. Here the government will have to encourage inflows on the capital account and buy up excess foreign currency (this can only happen in the short term as it requires foreign currency reserves to be used).
A country might improve its international competitiveness by increasing productivity, reducing the costs of production, devaluing the currency, improving the quality of output, encouraging investment and innovation and stimulating competition by reducing protectionist measures.
Short Answer Questions
27. Explain how a devaluation of a particular country’s currency might not actually improve its balance of payments.
28. How might a cut in the rate of interest affect the external account of a country?
29. Why might a country experiencing economic growth also experience a current account deficit?
TERMS OF TRADE
Terms of Trade measure the rate at which one good is exchanged for another.
Index of Terms of Trade = Index of Export Prices x 100Index of Import Prices
An improvement in the terms of trade means that export prices have risen relative to import prices.
Changes in the terms of trade have impacts both on an economy’s domestic economy and on the balance of payments. Non-oil exporting developing countries have faced falling terms of trade since the 1970s and so LDCs have had to sell greater quantities of exports in order to pay for imports. LDCs tend to produce and export primary products which have a low income elasticity of demand. On the other hand they tend to import manufactured goods that have a higher positive income elasticity of demand so as world income increases demand-side factors increase the price of manufactured goods faster than primary products. On the supply side developed economies have overproduced agricultural goods (especially through the CAP in the EU) and this oversupply has further depressed primary product prices. With the demand for primary products being price inelastic any increase in supply will have a greater depressing effect on prices.
The effect on the balance of payments will depend upon the price elasticities of demand for exports and imports (see Marshall-Lerner condition page 69).
DEVELOPMENT ECONOMICSIn terms of content, Development Economics is how the IB syllabus differentiates itself from almost all other economics syllabuses. Because of this, development questions will always be a strong feature of all the IB examination papers. You MUST, therefore be prepared to answer questions on this area of the syllabus.
INTRODUCTION TO DEVELOPMENT
Distinction between Growth and Development
Growth is not the same as development. Growth, measured in terms of an increase in GDP is a quantitative measure.Real GDP per capita figures are an inadequate means of making comparisons both within countries and between countries.
Limitations of GDP as a measure to compare welfare between countries:
The ‘shadow’ economy often means that GDP calculations are an underestimation of actual GDP. In Nigeria it is estimated that the ‘shadow’ economy represents 77% of GDP.Regional variations exist within countries.Externalities are not accounted for.New products and improvements in quality are not accounted for.Some countries have more leisure time for similar levels of GDP.Currencies in one country may not have the same purchasing power as in another country and so a common currency ($) may be used to make comparisons.Even with a common currency not all goods are traded, products are regionally differentiated, there are local taxes and currencies fluctuate.
Development is a qualitative measure of an improvement in the quality of life. An economy can grow without developing.
Development Economics is a dangerous area for most students, because they forget all the pure theories and concepts around which good economics is structured. Instead,Development Economics tends to slide into an unstructured mass of anecdotal stories which do little to explain, analyse and evaluate the problems experienced by developing economies. Good Development Economics will make use of as many economic concepts as any other area of the syllabus. To help you with this, economic concepts are highlighted in bold type.
Characteristics of Economic Growth
• Variations in long run growth ratesGiven compound growth rates, small differences in annual growth rates can open up wide gaps in growth and income between countries. Poor countries find it easier to achieve high growth rates than rich countries as they are growing from comparatively low levels of income. Growth also needs to take into account changes in population (GDP per capita).
• Changes associated with economic growth
Primary=>Secondary=>Tertiary (changes driven by income elasticity of demand)
UrbanisationGrowth of GDP per capita
Increases in productivityIncreased international trade
Indicators of Development
• IndicatorsAs development is so hard to define, a variety of indicators can be used:
GNP/GDP per capita (low-, middle- and high-income countries). These figures are limited in their use, e.g. income distribution.
Birth rates in LDCs tend to be double that in developed countries.
Population growth tends to be high in LDCs, because of poverty, and the age structure is weighted towards the young.
Literacy rates are a problem for LDCs.Energy consumption per capita is low in LDCs.Distribution of income tends to be more unequal in LDCs
although this is not always true. Poverty is closely linked both to the characteristics of underdevelopment and the barriers to development.
Life expectancy is the number of years that a newborn baby can expect to live given constant health standards, and is much lower in LDCs.
Urbanisation means that LDC cities grow rapidly as the rural poor move to find jobs.
GNP/GDP per capita= GNP/GDP
PopulationYou should be able todistinguish between real andnominal GDP/GNP.Real = nominal - inflation
• Composite IndicatorsThe Human Development Index (HDI) combines GNP per capita, life expectancy and literacy rates, and shows that growth does not necessarily equal development. There are countries with low GNP per capita and yet a high HDI and vice versa ( in 2002 Sweden has a GNP per capita rank of 15th yet an HDI rank of 2nd)
SOURCES OF ECONOMIC DEVELOPMENT
• Natural FactorsMany LDCs have abundant natural resources. Agriculture is especially important as an export sector, and is an area for initial mechanisation, productivity gains and growth. Agricultural land is finite and therefore the law of diminishing returns’ applies as more labour is added to the land. Many LDCs have had problems with severe weather, low agricultural productivity, worsening terms of trade and rising prices for crucial pesticides and fertilisers.
• Human Factors
People create wealth. An expanding population might mean a plentiful labour supply but it will also tend to reduce GNP per capita. The quality of labour is important and so investment in education and training needs to take place but it involves an opportunity cost. Entrepreneurs are also needed. Social and cultural barriers often exist and inhibit change, new methods of working, and a more scientific approach to production.
• Technological FactorsInvestment is the forgoing of current consumption for increased future consumption. Technological change and capital investment often go hand-in-hand. Development depends upon appropriate technology enabling LDCs to focus on reducing poverty instead of simply enabling income to increase.
• Institutional FactorsInvestment cannot take place unless there is saving, but saving requires there to be surplus income. Financial institutions such as stock exchanges, savings and investment banks play an important role in channelling savings towards investment opportunities. These often do not effectively exist for small firms and farms, and this is where a large part of economic activity happens in LDCs and where inroads can be made into poverty. Institutional factors that contribute to development are banking systems, education systems, health care, infrastructure and a stable political system.
CONSEQUENCES OF GROWTH
• Pollution and environmental degradationAll economies damage the environment as they grow. Developed economies with high consumption demand cause environmental damage, as do countries developing from modest foundations. Deforestation caused by clearing for farm land, use for fuel and the exporting of timber causes soil erosion and contributes to global warming and a loss of biodiversity. Over-farming leads to soil degradation. Hazardous waste products are generated by unregulated industries and slums. Polluted water generates disease. Air pollution is caused by lack of government controls on pollution, overpopulation and the burning for fuel of polluting materials. Carbon dioxide emissions deplete the ozone layer, causing global warming.
• Income inequalityIf growth is given a priority as opposed to development, investment has a central part to play. In order for investment to occur there needs to be saving by a high income sector, and this requires an unequal distribution of income. In most LDCs the richest 10% of the population own 40-50% of the total national income.
• Sustainable developmentmeans that economic growth in the short run must not compromise the ability of an economy in the long run to meet the needs of future generations.
At the moment many of our actions, particularly those that are permanent and irreversible, are limiting the actions of future generations. The problem is that whilst a majority of pollution is caused by highly industrialised economies, serious and unsustainable environmental consequences will be experienced if LDCs use the same industrial techniques. But if LDCs have to develop in a more sustainable way their growth and development will be hampered and slowed. Problems such as air pollution and solid and hazardous waste are caused by urbanisation, soil degredation is caused by over farming, deforestation, loss of biodiversity and atmospheric changes all exist as economies grow.
Solutions:
Government provision of basic sanitation and clean waterExtension of property rightsProhibition of polluting activitiesPollution taxesTradable pollution permitsFinding environmental actions that actually promote growth Education of farmers and communities Family planningRemoval of subsidies that encourage the use of fossil fuels
BARRIERS TO ECONOMIC DEVELOPMENT
• Poverty cycleLow income => low savings (in order to save a surplus is required and this is difficult to generate with low incomes and subsistence living) => low investment (the forgoing of current consumption in order to increase future consumption; this forgoing of consumption is not possible in subsistence economies) => low income => etc.
• Institutional and political factorsTaxes, legal frameworks, over-regulation, a lack of effective property rights and traditional thoughts and practices can all provide the wrong incentives and act as barriers to development. Also a lack of basic infrastructure inhibits development.
Political instability, a lack of national cohesion and the cultural and economic attitudes needed for economic growth as well as the
desire by developed countries to maintain the present status quo all act as barriers to growth.
In the formal economy activities are recorded officially but in many LDCs economic activity is often unrecorded and even illegal and this is the informal economy. In Nigeria it has been estimated that 77% of economic activity takes place in the informal economy.
• International tradeAdverse movements in the terms of trade and protectionist measures by developed economies are both strong barriers to development. The causes of an adverse movement in the terms of trade has already been covered. Many LDCs are concerned that countries such as the USA and those in the European Union support free trade on the one hand and yet use subsidies (such as the Common Agricultural Policy) as trade barriers. These are used to unfairly support their domestic industries with the result that world markets are flooded with surplus goods, driving prices down.
• International financeDebts involve huge servicing costs which have to be paid before anything else. Debt therefore severely hampers a country’s attempt to develop, as income has to be used for debt repayment rather than investment in capital, human capital or social and economic infrastructure. A rescheduling of debts has often be accompanied by forced structural reforms. These reforms have been based upon market forces, supply-side policies, deflationary fiscal and monetary policies to target inflation, the reduction of government debt and the encouragement of exports by devaluing the currency. These reforms have often been a painful experience for many LDCs, resulting in reduced welfare provision and widening income distribution.
LDCs can also suffer problems by not being able to convert their domestic currency (non-convertible currency) for foreign currencies causing obvious problems for international trade.
Capital flight is a capital outflow from any country but for LDCs this can be a particular problem as valuable funds for investment resources move to another country.
• Other barriersUnderemployment and informal markets (parallel markets) hide the true picture of economic activity in many LDCs. Infrastructure is key to unlocking the supply-side constraints that inhibit development, but infrastructure is sadly lacking in most LDCs.
DEVELOPMENT STRATEGIES
• Harrod-Domar growth modelSavings generate funds for investment. An economy’s growth rate depends upon: the level of savings
the efficiency of the investment that these savings generate (the lower the capital/output ratio the higher the growth rate)the rate of depreciation (the higher the rate of depreciation the lower the growth rate).
In practice high levels of savings are hard to generate and diminishing returns effect successive units of capital. Many LDCs lack the necessary financial infrastructure with which to put investors in touch with savers. The cultural environment and infrastructure, such as roads and telecommunications, required for investment might not exist. Investment also needs a quality labour force. Injections of capital into many LDCs have not lead to growth as they become constrained by huge debts. In fact many countries that do experience growth do not see an increase in the rate of savings.
Growth and development strategies are analysed and evaluated under each heading.
• Structural change/dual sector modelAn economy can be divided into the rural subsistence and modern urban industrial sectors. LDCs tend to have a lot of their labour focused on the rural sector and here productivity is very low (law of diminishing marginal returns). In fact marginal productivity might be zero. If labour can be transferred into the urban industrial sector it will be more productive and the economy would grow. Higher urban wages are the key to labour transferring and higher wages result from higher productivity with profits being reinvested the urban sector will develop further. This process continues until all the rural sector is transferred.
But not all profits will be reinvested and capital can act as a substitute for labour and so growth might not create an increase in urban employment. In fact in many developing economies unemployment in urban areas is just as much a problem as in rural areas.
• AidAid is divided into two types. Bilateral aid is given by an individual government and multilateral aid is given by multilateral agencies such as the World Bank. NGOs provide considerable unofficial aid. Aid still represents a small percentage of developed countries’ GNP: under 2% for most, and under 0.5% for many.
Aid can help to fill resource gaps, which probably most often appear as a lack of capital goods. Aid can also involve developing much needed skills with which the aid itself can effectively be used. Tied aid is very common, and donor countries often have one eye on how they will benefit from giving aid. Aid can also delay much needed reforms, do little to reduce income inequalities and support/fund dictatorships.
Grants may be used to fund specific projects or education and soft loans have lower rates of interest and less tight conditions. Food aid might be given using surpluses.
There are often less than ideal motives for countries giving aid with politics and self interest in LDCs with abundant natural resources playing a part.
Benefits of aid: Fills savings and foreign exchange gapsFunds health/education/infrastructure Recovery from disaster
Disadvantages of aid: Does not reach those most in needLDCs lack skills to carry out projects effectivelyFood aid causes dependency Tied aidDependency culture develops Aid strengthens government control Industrialisation might happen too quickly Resources diverted away from productive sectors
Whilst aid might help fill in ‘gaps’ and certainly NGOs do provide a lot of important funds, which often bypass governments and so reach the people most in need, aid is no substitute for sound economic policies and good economic management in general.
• Foreign Investment (MCNs/ TNCs)Foreign investment is often centred on the activities of MNCs (multi national corporations) or TNCs (transnational corporations) who are controlled in developed countries. These corporations do not just bring investment funds into LDCs, but they also bring new technology, training, entrepreneurial skills (helping fill resource gaps), opening new markets and having a multiplier effect on the wider economy. These new enterprises create jobs, generate export and tax revenue. On the other hand, monopolistic MNCs can be criticised for being inefficient, exploiting cheap labour and avoiding paying tax wherever possible.
The impact on development of foreign investment is less clear. It is argued that MNCs are potentially anti-development because capital intensive technology is not appropriate for countries with an excess supply of labour. In addition, income inequality widens between MNC workers and non-MNC workers, goods are
produced that are inappropriate for LDCs, and they have undue influence over governments.
• Open, outward-oriented vs. Closed, inward-orientedAn open, outward-oriented strategy aims to encourage export production to fund imports, and a closed, inward-oriented strategy aims to discourage imports and provide domestically produced substitutes.
An open, outward-oriented strategy embraces free trade (although facing problems caused by developed world protectionism), MNCs and the free movement of productive resources. Because of the problems mentioned above with primary products, exports will tend to centre on manufactured goods. This approach has been key to rapid growth rates in China and India.In theory, countries should specialise in producing goods and services in which they have a comparative advantage. Practically, for most LDCs, this means primary goods. Developed economies dominate world trade, with LDCs representing around 20% of world exports (although this figure is inflated by LDCs that export oil). A dependence on primary products has resulted in a slow growth of exports (low YED and protectionism by developed countries), fast growth of imports (high YED), and worsening terms of trade.
A closed, inward-oriented strategy erects tariffs and other protectionist measures. It does not embrace the activities of MNCs, and restricts the movement of resources. Many countries taking this approach have experienced low growth (Ghana, and many South American countries).
• InvestmentInvestment requires saving and saving requires surplus income. Because funds for investment are so scarce, a choice has to be made between physical capital versus human capital. Physical capital produces growth whereas human capital produces development.
Capital investment often initially focuses on agriculture, the dominant sector in most LDCs. Human capital programmes focus on health, education and often population. These two strategies are linked, because the problems that they are targeting are interrelated.
• Fair trade organizationsThe 48 least-developed countries are home to 10 per cent of the world's citizens and their share of world exports has declined to0.4 per cent over the past two decades. The USA and EU contain roughly the same number of people and account for nearly 50 per cent of world exports. Small traders find it hard to compete in a world in which trade has been ‘liberalised’ by the WTO. If small traders and LDCs can be helped to overcome the significant

barriers to fair trade then trade can be a solution to slow growth and underdevelopment.
Fair trade guarantees a price for producers that covers their costs of production and provides a sustainable living. It also provides long-term contracts and business training vital for long-term stability. Fair trade allows consumers to purchase goods that actually start to favour commodity producers in LDCs.
• Micro-credit schemesMicro-credit schemes are systems of small loans for income- generating activities (e.g fish farming, mat weaving, small scale retailing and brick making) which enable poor communities in LDCs to gain some economic stability. Schemes are planned to provide people with the resources they need without encouraging debt. Micro-credit represents a significant way in which people can make a difference to their own lives without the dependence associated with hand-outs. Credit is often only given after a period of skill and financial training has been completed and the schemes are designed to meet the particular needs and circumstances of those individuals taking part. Schemes aim to enable communities to diversify their skills so that communities do not suffer the problems associated with an over-concentration on one particular skill. Most micro-credit institutions also encourage saving.
• Free market vs. PlanningWith the existence of market failure and weak market structures it is easy to see why planning was initially seen as a possible solution. Corruption, weak governments, closed, inward-oriented approaches, a lack of incentives and conflicting aims meant that planning failed to deliver results.
To use free markets effectively many preconditions need to exist:
Law and orderStable government, property rights, independent legalsystem, stable currencyTrust in institutions and firmsA culture of rationality not traditionalismSocial mobilityFreely available information
In the end the solution is a mixed economy with a balance between planning and the free market.
• International financial institutionsAfter the collapse of the Bretton Woods system in the early 1970s the IMF has focused on LDC debt. IMF loans are dependent upon strict programmes of structural reforms.
The World Bank or IBRD attempts to encourage growth and development through loans for investment with accompanying advice and tight conditions for repayment. Structural adjustment programmes have caused many problems for the LDCs associated with these two international institutions. Whilst targeting growth, programmes have been criticised for causing dedevelopment.Recent changes in IMF and IBRD programmes have meant that LDC governments have been restricted in their use of fiscal policy. Government spending is restricted, and tax systems are reformed to collect revenue more effectively, be more progressive and to counter tax avoidance/evasion by the wealthy. Most policies, focusing on reforming the structure of LDC economies, are supply-side policies. Given the structure of these economies, an active demand management policy is hard to organise. Stabilisation programmes often impart a sharp shock to LDC economies with which they are not able to cope with. The tightening of domestic monetary and fiscal policies reduces aggregate demand leading to recession. The IMF ‘blueprint’ often fails to recognise the differences between individual countries and there are cases where countries that have followed a different path from that suggested by the IMF have been able to develop just as well, if not better, than those following IMF advice.
• Commodity agreementsCommodity prices have been both falling and unstable. Whilst producers benefit from stabilising and increasing prices, consumers certainly do not. Schemes to increase prices depend upon expensive subsidies or management schemes and they tend to produce surpluses and therefore misallocate resources. Of course, OPEC has brought major benefits for its members.
Multiple Choice
31. Which of the following is a common feature of a Less Developed Country?A. High per capita energy consumption.B. An ageing population.C. A high dependency on primary commodities.D. A relatively small agricultural sector.
32. Economic development is more likely to result from economic growth if there is alsoA. an increase in the birth rate.B. a reduction in expenditure on merit goods.C. an change in the distribution of income in favour of poorer citizens.D. an increase in the use of protectionist measures.
33. Structural adjustment programmes, imposed by the IMF, have tended to result in a short runA. decrease in unemployment.B. increase in the equality of income.
C. increase in export revenues.D. reduction in government welfare expenditure.
34. Which of the following is not a barrier to growth in many less developed countries?A. A low savings ratio.B. Free trade.C. Capital flight.D. Volatile primary product prices.
Short Answer Questions
30. Distinguish clearly between growth and development.
31. What is ‘sustainable development’ and why is it so important?
32. Explain why the terms of trade have moved against most LDCs and what have been the consequences?
33. How will a country’s economy change if it moves from a ‘closed, inward-oriented’ development strategy to an ‘open, outward- oriented’ development strategy?
34. How might the actions of developed countries in international trade act as a barrier to LDC development?

REVISION ADVICE
Whatever subject you are revising for, your aims, and to a certain extent, your methods, are the same. You are aiming to learn your subject material, and to develop exam skills.
Each person has to find the revision technique which works best for them. If you are in the final stages of your IB revision in the run-up to your exams you will probably have been able to try out some techniques already in your trial exams and will know whether they have worked for you or not. If they have not worked, then don’t use them again. Try something different.
One of the dangers of just reading through your notes (apart from the fact that this tends to send even the most enthusiastic student to sleep) is that you will confuse understanding with memory. Understanding and memory are different brain functions. You understand your notes, but you can never be sure that you have actually acquired and internalised the information they contain. You must test your knowledge to be sure of this.
The good news is that this doesn’t have to mean sitting through three-hour trial exam papers! To learn your material, you will have to go over it again and again (there is no substitute for this repetition: it’s the way that your brain creates the neurological connections which constitute memory). Practise the techniques that you will be using in the exam: multiple choice, brainstorming, short answer plans, essay plans (you will be doing essay plans in the exam!), graph drawing etc., all of which will enable you to test your knowledge, and develop and practise exam skills in an efficient timeframe. The most effective time period to revisit a chunk of material is between 20-30 minutes; any more and your brain’s efficiency starts to decline (the law of diminishing marginal returns), and any less it doesn’t have time to get into gear. In 20 minutes you can do two essay plans.
Always start with what you know. Say, for example, you are revising monopoly. Your first revision of this topic might start with a blank sheet of paper on which you write everything you can think of about monopoly. After you have spent 10 minutes on this, go back to your notes and see what you didn’t know. Add this information to your brainstorm. The next time you revise this topic do, for example, three monopoly short answer questions. Don’t waste time actually writing them... just jot down an essay plan for them (don’t forget the graphs), then go back to your notes once again and see what you forgot. You should remember more than the first time. Not only will you be testing your monopoly knowledge and increasing it as you go over the material for a second time, but you will be forcing yourself to plan, and almost best of all, you will be forced to write three different plans which answer the questions in a structured way, rather than writing your catch-all standard answer on monopoly. While it is difficult to predict what is going to come up on a paper, it’s a certainty that

you won’t see a question inviting you to ‘Write down everything you know about monopoly’. Your third revision of monopoly might see you writing out those short answers in full, or doing a couple of essay plans.
The key to making your revision work is to organise your time. Make a revision plan. This plan should divide the topics you need to revise into the total amount of time you have left before the exam. Don’t wait: do it today! There’s always less time than you think. Don’t leave out this important stage in the revision process: you might be working away happily thinking you are accomplishing a great deal, without a sense of how much you are effectively getting covered. Plan to cover each topic at least three times, and include in your plan the method you are going to use to cover the material, whether a brainstorm, getting a really full set of notes, doing three short answer questions, an essay plan or two, or some multiple choices.
This method helps to calm exam fears. As you progress through your revision plan, you will have positive proof your knowledge is improving as you revisit each topic. You will know your revision is working. You will be in control of the process, and will be focusing on small, manageable tasks rather than a gigantic formless mass of syllabus material. Almost everyone will be worried about their upcoming exams, no matter what grade they will get. Just because you are worried does not mean that you are not going to do well.
With a structured set of notes, a realistic revision plan and some good old-fashioned graft, you can do well. Probably better than you think! I wish you all the very best of luck with your revision, and with your exam.
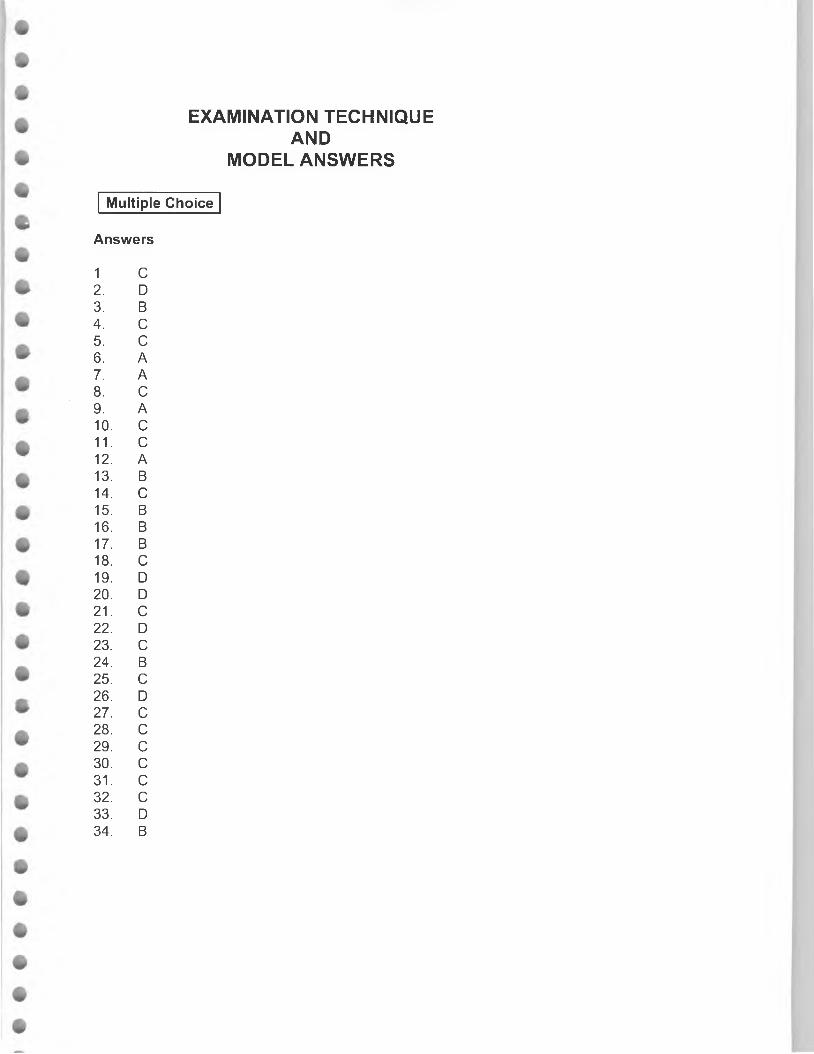
EXAMINATION TECHNIQUE AND
MODEL ANSWERS
Multiple Choice
Answers
1 C2. D3. B4. C5. C6. A7. A8. C9. A10. C11. C12. A13. B14. C15. B16. B17. B18. C19. D20. D21. C22. D23. C24. B25. C26. D27. C28. C29. C30. C31. C32. C33. D34. B

Essays
Paper One: 1 hour, 1 question from 4 questions
The four questions will cover all five sections of the syllabus although section one is brief and will tend not to have a question focusing on it with the first (micro) question based on section two.
One hour enables you to plan and write an effective answer with ease.
Examination Technique
The problem with giving model answers for essays in this kind of revision guide is that one has to be provided for each area of the syllabus, and space constraints prevent this here. If you are getting together to revise with friends, you might want to compare essays you have done in the past, looking carefully at where your teacher has indicated good and bad practice, and where marks have been indicated in the margin, as well as comments for your future improvement. One surprisingly effective thing to do is to mark each others’ essays, using the readily available markschemes. This will give you a real insight into what points actually constitute marks.
There is a danger of pre-learning answers to essays in one’s revision, resulting in generalised, unfocused and unstructured answers in an exam. The suggestions offered on the use of essay planning in one’s revision in the revision advice section above will help you to avoid this pitfall.
Examiners often comment on candidates who do not separate the two parts of essays. The markscheme the examiner is working with instructs him or her to award marks specifically in each part of the question. If your answer to a two-part question consists of one undifferentiated answer, your examiner will struggle to apply the markscheme. It is also something which is calculated to annoy your examiner! Another frequent mistake is to provide information in part A which should really be in part B. Careful planning (practised in your revision) will solve this problem entirely.
Well-planned and written essays will address the command words of the question (e.g. ‘Explain’, Discuss’). If you are not sure about the precise meanings of the various command words, then your revision period is your chance to find out. Good sources of this information are to be found in guides which are specifically designed to help with essay writing.
I have placed much emphasis on the use of diagrams in all your work. Marks are available in your examiner’s markscheme for your graphs. In essays they must be clearly drawn and accurately labelled and fully integrated into the text (‘in the diagram below...’ ‘this is shown in the diagram below...’. Weak candidates do not use diagrams, and if they do, they are messy, incorrectly labelled,
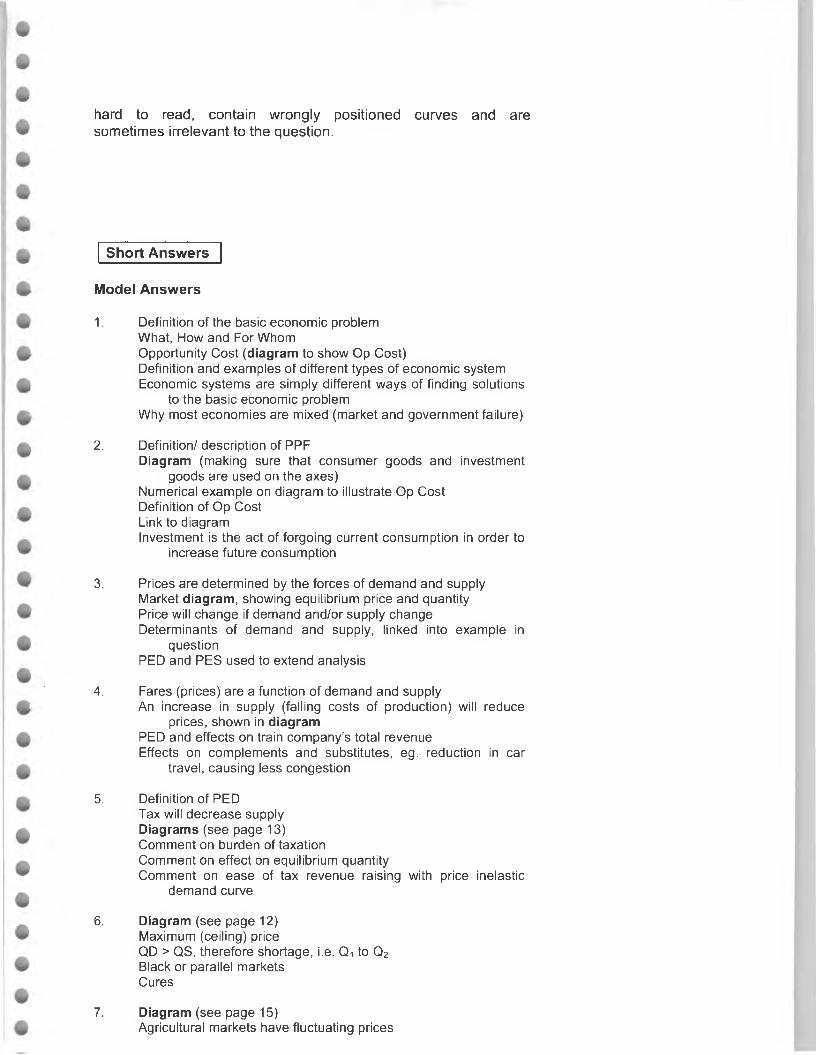
hard to read, contain wrongly positioned curves and are sometimes irrelevant to the question.
Short Answers
Model Answers
1. Definition of the basic economic problem What, How and For WhomOpportunity Cost (diagram to show Op Cost)Definition and examples of different types of economic system Economic systems are simply different ways of finding solutions
to the basic economic problem Why most economies are mixed (market and government failure)
2. Definition/ description of PPFDiagram (making sure that consumer goods and investment
goods are used on the axes)Numerical example on diagram to illustrate Op Cost Definition of Op Cost Link to diagramInvestment is the act of forgoing current consumption in order to
increase future consumption
3. Prices are determined by the forces of demand and supply Market diagram, showing equilibrium price and quantity Price will change if demand and/or supply change Determinants of demand and supply, linked into example in
questionPED and PES used to extend analysis
4. Fares (prices) are a function of demand and supplyAn increase in supply (falling costs of production) will reduce
prices, shown in diagram PED and effects on train company’s total revenue Effects on complements and substitutes, eg. reduction in car
travel, causing less congestion
5. Definition of PEDTax will decrease supply Diagrams (see page 13)Comment on burden of taxation Comment on effect on equilibrium quantity Comment on ease of tax revenue raising with price inelastic
demand curve
6. Diagram (see page 12)Maximum (ceiling) priceQD > OS, therefore shortage, i.e. Q! to Q2Black or parallel marketsCures
7. Diagram (see page 15)Agricultural markets have fluctuating prices
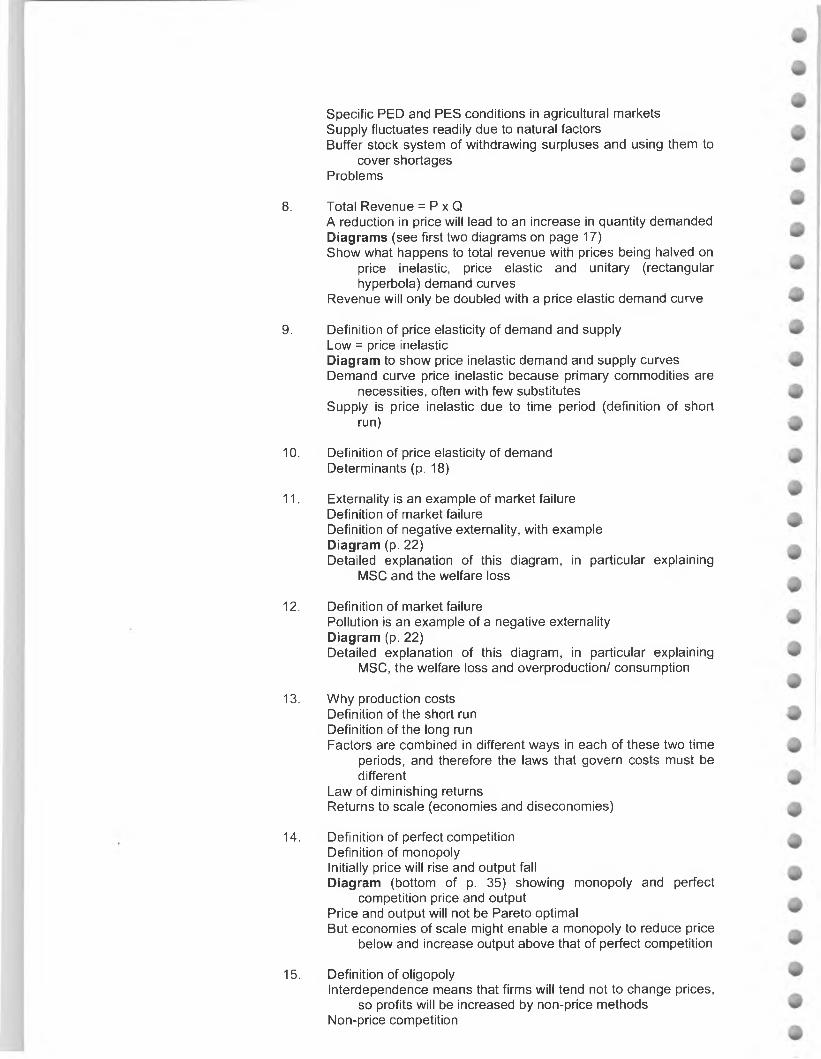
Specific PED and PES conditions in agricultural markets Supply fluctuates readily due to natural factors Buffer stock system of withdrawing surpluses and using them to
cover shortages Problems
8. Total Revenue = P x QA reduction in price will lead to an increase in quantity demanded Diagrams (see first two diagrams on page 17)Show what happens to total revenue with prices being halved on
price inelastic, price elastic and unitary (rectangular hyperbola) demand curves
Revenue will only be doubled with a price elastic demand curve
9. Definition of price elasticity of demand and supply Low = price inelasticDiagram to show price inelastic demand and supply curves Demand curve price inelastic because primary commodities are
necessities, often with few substitutes Supply is price inelastic due to time period (definition of short
run)
10. Definition of price elasticity of demand Determinants (p. 18)
11. Externality is an example of market failure Definition of market failureDefinition of negative externality, with example Diagram (p. 22)Detailed explanation of this diagram, in particular explaining
MSC and the welfare loss
12. Definition of market failurePollution is an example of a negative externality Diagram (p. 22)Detailed explanation of this diagram, in particular explaining
MSC, the welfare loss and overproduction/ consumption
13. Why production costs Definition of the short run Definition of the long runFactors are combined in different ways in each of these two time
periods, and therefore the laws that govern costs must be different
Law of diminishing returns Returns to scale (economies and diseconomies)
14. Definition of perfect competition Definition of monopolyInitially price will rise and output fallDiagram (bottom of p. 35) showing monopoly and perfect
competition price and output Price and output will not be Pareto optimal But economies of scale might enable a monopoly to reduce price
below and increase output above that of perfect competition
15. Definition of oligopolyInterdependence means that firms will tend not to change prices,
so profits will be increased by non-price methods Non-price competition
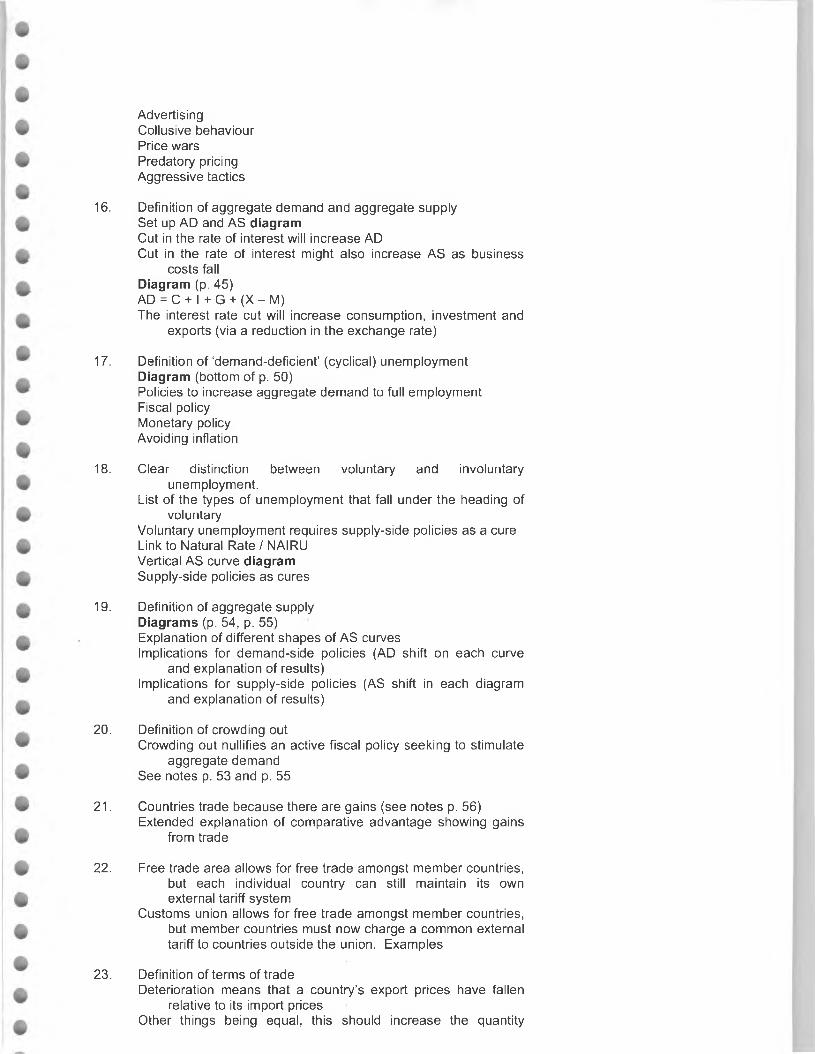
Advertising Collusive behaviour Price wars Predatory pricing Aggressive tactics
16. Definition of aggregate demand and aggregate supply Set up AD and AS diagramCut in the rate of interest will increase AD Cut in the rate of interest might also increase AS as business
costs fall Diagram (p. 45)AD = C + I + G + (X - M)The interest rate cut will increase consumption, investment and
exports (via a reduction in the exchange rate)
17. Definition of ‘demand-deficient’ (cyclical) unemployment Diagram (bottom of p. 50)Policies to increase aggregate demand to full employment Fiscal policy Monetary policy Avoiding inflation
18. Clear distinction between voluntary and involuntaryunemployment.
List of the types of unemployment that fall under the heading of voluntary
Voluntary unemployment requires supply-side policies as a cure Link to Natural Rate / NAIRU Vertical AS curve diagram Supply-side policies as cures
19. Definition of aggregate supply Diagrams (p. 54, p. 55)Explanation of different shapes of AS curves Implications for demand-side policies (AD shift on each curve
and explanation of results)Implications for supply-side policies (AS shift in each diagram
and explanation of results)
20. Definition of crowding outCrowding out nullifies an active fiscal policy seeking to stimulate
aggregate demand See notes p. 53 and p. 55
21. Countries trade because there are gains (see notes p. 56) Extended explanation of comparative advantage showing gains
from trade
22. Free trade area allows for free trade amongst member countries,but each individual country can still maintain its own external tariff system
Customs union allows for free trade amongst member countries, but member countries must now charge a common external tariff to countries outside the union. Examples
23. Definition of terms of tradeDeterioration means that a country’s export prices have fallen
relative to its import prices Other things being equal, this should increase the quantity
demanded of exports in relation to the quantity demanded of imports (if export prices fall and import prices rise)
The final impact would all depend upon the size of the price movements and the PED for exports and imports
24. A country might improve its international competitiveness by increasing productivity, reducing the costs of production, devaluing the currency, improving the quality of output, encouraging investment and innovation and stimulating competition by reducing protectionist measures
25. Exchange rates are determined by the demand for and supply ofa currency
Exchange rate will fall either because demand has decreased and/or supply has increased
Diagrams (p. 62. p. 63)Factors that determine the demand for and supply of a currency
26. Exchange rates are determined by the demand for and supply ofa currency
An exchange rate will be effected by a change in the rate of interest depending upon how the determinants of demand and supply are effected
Diagrams (p. 62. p. 63)It of course depends upon which country the rate of interest
change occurs in Example:An increase in the UK's interest rate will increase the demand for
poundsAn increase in the Eurozone’s interest rate will increase the
supply of pounds
27. A devaluation is a fall in the value of a country’s currency ininternational currency markets
Export prices will fall and import prices will rise Effects will depend upon the impact of price changes on the
expenditure on exports and imports PED Exports and ImportsMarshall-Lerner condition (here the sum of PED for exports and
the PED for imports would have to be <1)
28. External account is the Balance of Payments Effects on the capital accountEffects on the current account via changes in the exchange rate The final effect of any devaluation will depend upon the Marshall-
Lerner condition29. Definition of economic growth
As economies grow so do consumption levels and many economies (especially developed economies) have a high propensity to import
If imports grow faster than exports then a current account deficit will be the result (reasons for exports not increasing)
30. Growth is a quantitative measureIncrease in national income or income per capita (variety of
measures)Development is a qualitative measure Indicators of development Composite indicators
31. Definition of sustainable developmentExamples of development that is and is not sustainable Ways in which future growth might be inhibited Link to negative externalities
32. Definition of terms of tradeExplanation of what a movement against means (export prices
have fallen relative to import prices)Type of goods exported and imported Low income elasticity of demand for primary good Surpluses of primary goods depress world prices Falling demand for many commoditiesHigh income elasticity of demand for imported manufactured
goods
33. Definition of a ‘closed, inward-oriented’ economy Definition of an ‘open, outward-oriented’ economy UnemploymentStructural change (decline in protected industries)Increased imports leading to increased choice Increased competition may reduce pricesIncreased exports with specialisation in goods with a
comparative advantage
34. WTO aims to reduce barriers to tradeDeveloped counties promote ‘free trade’ as a development
strategy (World Bank/IBRD loans)Increasing use of complex barriers to trade by developed
economies (subsidies and quality/health and safety regulations)
Subsidised agricultural production in the developed world has depressed world prices therefore there has been an adverse movement in the terms of trade for many developed countries
These actions inhibit developing countries’ exports Developing countries are flooded by cheap imports from
subsidised developed economy production
Examination Technique
Paper Two: 1 hour, 3 short answers from a choice of 6.
The six questions will cover all five sections of the syllabus.
This means 20 minutes per short answer, and this includes planning time.
In general there will be three questions covering syllabus areas 1 and 2 (Introduction to microeconomics and Microeconomics) and three questions covering syllabus areas 3, 4 and 5 (Macroeconomics, International Issues and Development
Economics). There will be at least one question on Development Economics.
Timing is a crucial examination technique in paper 2, and examiners comment on this. You must write three good short answers to get good marks on this paper. Your revision should incorporate practising doing a short answers in 20 minutes. Now is your chance to prove to yourself that you do have enough time to plan your answer, and, indeed, that a planned answer results in a well-structured and focused answer which will gain you more marks.
Examiners will be looking for relevant theories and concepts (definitions) applied to the actual question. They also want to see relevant diagrams which are fully integrated into the text. Note that almost all the answers given above feature a diagram.
A good short answer is well structured and for top marks will contain some analysis and evaluation of the question and the theory used. Because of the time pressure, there is no time to put anything down that is not pure, structured theory. Extended stories and anecdotes are a waste of time unless examples are asked for in the question.
Data Response
Examination Technique
Paper Three: 2 hours, 3 questions from a choice of 5
The five questions will cover all five sections of the syllabus.
Choose the question by reading all of the individual question parts, especially those with the most marks. Allocate the time you spend on the different parts of the question according to the distribution of the marks. You should spend double the amount of time on a 8-mark question than you spend on a 4-mark question. This sounds obvious, but a number of students will misallocate their resources each year with catastrophic results. Make sure that you are not one of them!
Data response answers must be planned like any good short answer or essay. Use both the text and the data available to you to illustrate your answers. In general, you will be able to answer the first few questions from the material provided in the question. The opening questions will require you to be able to provide definitions of key terms in the text. The next questions will often ask you to use a diagram to explain either and event described in the text or to explain a specific piece of theory that is applicable to the text. Later questions will require your own knowledge of the subject area. The final question will require you to analyse and evaluate an issue based upon the text and as these are difficult skills this question is awarded 8/20 marks. If you are to
perform well in this paper, which represents 40% of the total available examination marks, then you must seek to maximise you marks on this question.
As with all the questions asked across all three papers you should look to use diagrams and real-world examples were appropriate.

, Supporting youj l A throughout your IBDP journeyosot̂
IB specialists | Expert teaching | Focus on individual needs | Publishers of IB Study Guides
OSC The journey
*OSC is a highly professional company based in Oxford, UK, with 20 years' experience specialising solely in the International Baccalaureate Diploma Programme. We have a fantastic reputation amongst IB schools worldwide. We offer support to IB students throughout their IB studies by providing effective vacation time revision courses and summer schools, in fabulous locations around the world. All our courses are taught by experienced IB teachers from top international IB schools who work for OSC during their vacation time. They are experts in revision and review and many are IB examiners.
OSC Pre-IB Summer School
Boston, USA and Oxford, UK. Join this course to make the strong start needed in your IB studies. Our experienced IB teachers work on your English and Maths, Science and Humanities, and fine-tune your Study Skills to meet the challenge ahead of you. Includes a fantastic social programme.
OSC Mid-IB Summer Schools
Boston, USA and Cambridge, UK. Following your first year in the IBDP, this course improves your knowledge and fills in any gaps you may have. Then it prepares you for your final year - helping you to get a head start on year 2 and your mock exams. Includes a fantastic social programme.
OSC IB Spring Revision Courses
Oxford, UK and Hong Kong. Revising for exams alone in the final spring break is tough - maintaining momentum and ignoring distractions. Make the most of your time with a short intensive revision course with experienced IB teachers.
OSC IB Pre-exam Courses
Australia in July and September. Students on OSC’s IB Pre-exam Courses rapidly increase both their understanding of and familiarity with their subjects, and their ability to write exams.
OSC Getting into University
USA and UK. Choosing a university and a course to study are 2 of the biggest decisions anyone ever makes. OSC’s experienced College Counsellors guide students who are considering the UK or USA as university destinations through these critical choices.
OSC IB Study Guides
We help 1000s of students with their revision with our highly acclaimed series of IB Study Guides. The authors are IB teachers who teach with us on our IB Revision Courses in their vacations, and are experts in the techniques of revision and review.
Choose from over 50 titles - which include separate HL, SL and options guides in the following subject areas:
BiologyBusiness & ManagementChemistryEconomicsEnglish A1French BGeographyHistoryMathematicsPhysicsPsychology

Aristotle House, Aristotle Lane, Oxford 0X2 6TP, UK
+44 (0) 1865 512802+44 (0) 1865 [email protected]
OSC has been organising IB Spring Revision Courses and Summer Schools, since 1990 and has helped thousands of IB students prepare for their exams.
OSC knows the value of an intensive review of a syllabus and the confidence such study can build. But our students are also keen to have written material which provides a complete overview of a course. OSC commissioned a series of IB Revision Guides to fu lfil this need. They have been written both to complement the courses and to aid those who are unable to attend.
OSC IB Revision Guides can be used throughout the IB course, but will be particularly useful before tests, mock and final exams. The books are written by experienced IB teachers who have had the advantage of teaching on our OSC IB Revision Courses, so they are particularly experienced in understanding what students imminently facing their exams need and want.
OSC IB Revision Guides provide:• Active revision and review to target the student’s effort
where it is needed• Practical advice on how to tackle IB exam questions• A complete, concise overview of the syllabus• Excellent value for money• The resource to help students do their best in the exam