orleans avenue outfall canal - louisiana state … · orleans avenue outfall canal in three volumes...
TRANSCRIPT
r I
Te '7 .Ph dV'\l~ { ~ 8'3 V,3
DESIGN MEMORANDUM NO. 19
GENERAL DESIGN
ORLEANS AVENUE OUTFALL CANAL
IN THREE VOLUMES
VOLUME III
DEPARTMENT OF THE ARMY NEW ORLEANS DISTRICT, CORPS OF ENGINEERS
NEW ORLEANS, LOUISIANA
AUGUST 1988
SERIAL NO. 60
TECHNICAL REPORT HL-87-
HURRICANE PROTECTION STRUCTURE FOR LONDON AVENUE OUTFALL CANAL
LAKE PONTCHARTRAIN, NEW ORLEANS, LOUISIANA
Hydraulic Model Investigation
by
James R. Leech
Hydraulics Laboratory
DEPARTMENT OF THE ARMY Waterways Experiment Station, Corps of Engineers
PO Box 631, Vicksburg, Mississippi 39180-0631
November 1987
Final Report
Approved For Public Release; Distribution Unlimited
Prepared for US Army Engineer District, New Orleans New Orleans, Louisiana 70160-0267

Destroy this report when no longer needed. Do not return it to the originator.
The findings in this report are not to be construed as an official Department of the Army position unless so designated
by other authorized documents.
The contents of this report are not to be used for advertising, publication, or promotional purposes. Citation of trade names does not constitute an official endorsement or approval of the use of
such commercial products.
Unclassified SECURITY CLASSIFICATION OF THIS PAGE
REPORT DOCUMENTATION PAGE I Form Approved OMS No. 0704-Or88
la. REPORT SECURITY CLASSIFICATION 1 b. RESTRICTIVE MARKINGS Unclassified
2a. SECURITY CLASSIFICATION AUTHORITY 3. DISTRIBUTION / AVAILABILITY OF REPORT
2b. DECLASSIFICATION / DOWNGRADING SCI~EDULE Approved for public release; distribution unlimited
4. PERFORMING ORGANIZATION REPORT NUMBER(S) S. MONITORING ORGANIZATION REPORT NUMBER(S)
Technical Report HL-87
6a. NAME OF PERFORMING ORGANIZATION 6b. OFFICE SYMBOL 7a. NAME OF MONITORING ORGANIZATION USAEWES (If applicable)
Hydraulics Laboratory WESHS-S 6e. ADDRESS (City, State, and ZIP Code) 7b. ADDRESS (City, State, and ZIP Code)
PO Box 631 Vicksburg, MS 39180-0631
8a. NAME OF FUNDING/SPONSORING 8b. OFFICE SYMBOL 9. PROCUREMENT INSTRUMENT IDENTIFICATION NUMBER ORGANIZATION (If applicable)
T1~Avn N .. u n.,.l .. "n", T.M1IT1m_U
8e. ADDRESS (City, State, and ZIP Code) 10. SOURCE OF FUNDING NUMBERS
PO Box 60267 PROGRAM PROJECT TASK WORK UNIT ELEMENT NO. NO. NO. ACCESSION NO.
New Orleans, LA 70160-0267
11. TITLE (Include Security Classification)
Hurricane Protection Structure for London Avenue Outfall Canal, Lake Pontchartrain, N .. u Orl .. ",n" T.n,,", ""' "n"
12. PERSONAL AUTHOR(S)
T ..... ,.,., T"m .. ", 1l 13a. TYPE OF REPORT r 3b. TIME COVERED r4. DATE OF REPORT (Yea"Month, Day) JS. PAGE COUNT Final report FROM 1984 TO 1986 November 1987 161
16. SUPPLEMENTARY NOTATION
Available from National Technical Information Service, 5285 Port Royal Road, Springfield, VA ??11\1
17. COSA TI CODES 18. SUBJECT TERMS (Continue on reverse if necessary and identify by block number)
FIELD GROUP SUB-GROUP Alignment Gates Similitude Waves Canal Head loss Surge Drainage Pumps Torque
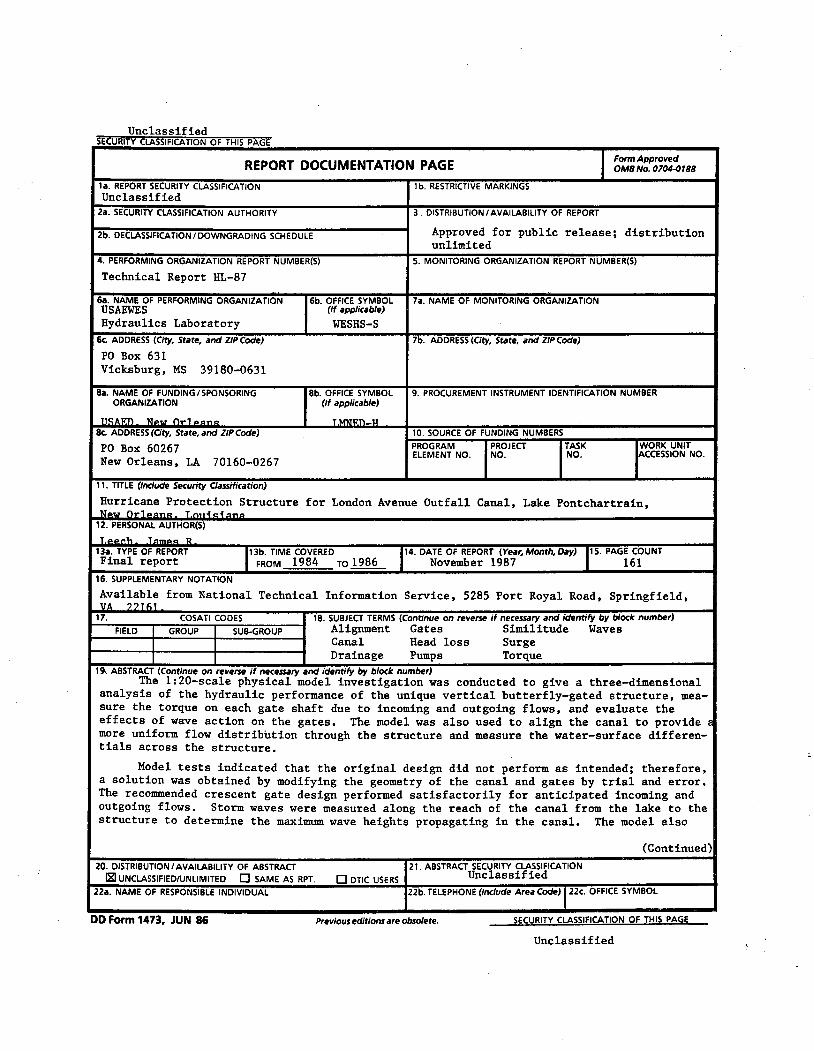
19. ABSTRACT (Continue on reverse if necessary and identify by block number) The 1:20-scale physical model investigation was conducted to give a three-dimensional
analysis of the hydraulic performance of the unique vertical butterfly-gated structure, mea-sure the torque on each gate shaft due to incoming and outgoing flows, and evaluate the effects of wave action on the gates. The model was also used to align the canal to provide 8
more uniform flow distribution through the structure and measure the water-surface differen-tials across the structure.
Model tests indicated that the original design did not perform as intended; therefore, a solution was obtained by modifying the geometry of the canal and gates by trial and error. The recommended crescent gate design performed satisfactorily for anticipated incoming and outgoing flows. Storm waves were measured along the reach of the canal from the lake to the structure to determine the maximum wave heights propagating in the canal. The model also
(Continued)
20. DISTRIBUTION / AVAILABILITY OF ABSTRACT 21. ABSTRACT SECURITY CLASSIFICATION
~ UNCLASSIFIEDIUNLIMITED o SAME AS RPT. o DTIC USERS Unclassified 22a. NAME OF RESPONSIBLE INDIVIDUAL 22b. TELEPHONE (Include Area Code) 122'. OFFICE SYMBOL
DD Form 1473. JUN 86 Previous editions are obsolete. SECURITY CLASSIFICATION OF THIS PAGE
Unclassified

Unclassified
19. ABSTRACT (Continued).
indicated. that the torque on each gate shaft decreased with waves superimposed during pumping operations and increased with waves superimposed during storm surges.
The results of the torque measurements are presented in Appendix A to give design information for sizing the dampening device which operates as a shock absorber, the vertical shafts, operating machinery, and structural components.
lIpclass1fied
PREFACE
The model investigation reported herein was authorized by the Office,
Chief of Engineers, US Army, on 15 May 1984 at the request of the US Army
Engineer District, New Orleans (LMN).
The study was conducted during the period May 1984 to January 1986 in
the Hydraulics Laboratory (HL) and the Coastal Engineering Research Center
(CERC) of the US Army Engineer Waterways Experiment Station (WES), under the
direction of Mr. F. A. Herrmann, Jr., Chief, HL, and under the general super
vision of Messrs. J. L. Grace, Jr., Chief, Hydraulic Structures Division,
G. A. Pickering, Acting Chief, Hydraulic Structures Division, and
N. R. Oswalt, Chief, Spillways and Channels Branch (SCB).The project engi
neer for the model study was Mr. J. R. Leech, assisted by Mr. S. T.
Maynord, SCB. This report was prepared by Mr. Leech and edited by Mrs. Nancy
Johnson, Information Products Division, under the Inter-Agency Personnel
Agreement Act. Mr. Bobby P. Fletcher, SCB, provided valuable guidance during
model design and operation.
During the course of the investigation, Messrs. L. Cook, R. Louque,
E. Walker, and F. Weaver, US Army Engineer Division, Lower Mississippi Valley,
and COL Eugene S. Witherspoon, Messrs. F. Chatry, C. Soileau, R. Guizerix,
V. Stutts, J. Combe, T. Hassenboehler, and D. Strecker, and Ms. J. Hote, LMN,
visited WES to discuss the program and results of model tests, observe the
model in operation, and correlate these results with design studies.
COL Dwayne G. Lee, CE, is the Commander and Director of WES.
Dr. Robert W. Whalin is the Technical Director.
1
CONTENTS
PREFACE. • • • • • • • • • . • • • • • • • • • • • • • • • • • • • . • • . • • • • • • • • • • • • • • • • • • • • • • • • • • • • • • 1
CONVERSION FACTORS, NON-SI TO SI (METRIC) UNITS OF MEASUR~ENT....................................................... 3
PART I: INTRODUCTION •• .............................................. 5
Prototype. . . . . . . . . . . . . . . . . . . . . . . . . . . . . . . . . . . . . . . . . . . . . . . . . . . . . . . . 5 Purpose and Scope of Model Study................................. 6
PART II: MODEL •••••••••••••••••••••••••••••••••••••
Description ................................................ . Scale Relations ••••••••.•••••••••••••••••
PART III: TESTS AND RESULTS •••••••••••••••••••••••••••••••••••••••••••
Canal •••• Gates ••••
. ........................... . PART IV: CONCLUSIONS AND RECOMMENDATIONS •••••••••••••••••••••••••••••
TABLES 1-3
PHOTOS 1-4
PLATES 1-62
APPENDIX A: TORQUE MEASUREMENTS ON BUTTERFLY GATES, TYPE 33 DESIGN •• e· •••••••••••••••••••••••
2
8
8 9
10
10 10
25
Al
CONVERSION FACTORS, NON-SI TO SI (METRIC) UNITS OF MEASUREMENT
Non-SI units of measurement used in this report can be converted to SI
(metric) units as follows:
Multiply By To Obtain
acres 4,046.873 square metres
cubic feet 0.02831685 cubic metres
degrees (angle) 0.01745329 radians
feet 0.3048 metres
foot-kips 1.355818 metre-kilonewtons
gallons 3.785412 cubic decimetres
inches 2.54 centimetres
miles (US statute) 1.609344 kilometres
pounds (mass) 0.4535924 kilograms
square miles (US statute) 2.589998 square kilometres
3

.j:oo
"" 5' ~
'" '< '< a ~
",\S~I ~ ~I rPI .\"1:,..."
p o N
I ~ "', ~Iz ! tUMPING STATiON
H N
MODEL LlMITS·-.......... ~~
"~ ... --i, ~~'r\fJ"'"
NE\\' ORLEil..NS
I
nl \ l~~ ..... ) LAKEEF~O~~L~~P~RT~ l
GULF OF MEXICO
VICINITY MAP .. ~(~"'IL.~S ..
INDEX MAP SCALE OF MILES
6 """eo\' .............
N U. S. ARMY ENGINIEP DIISTIUCT. HEW OftLaANS COIIPS ___ ,ND:RS
Figure 1. Vicinity and location map
'- . ./
HURRICANE PROTECTION STRUCTURE FOR LONDON AVENUE OUTFALL CANAL
LAKE PONTCHARTRAIN, NEW ORLEANS, LOUISIANA
Hydraulic Model Investigation
PART I: INTRODUCTION
Prototype
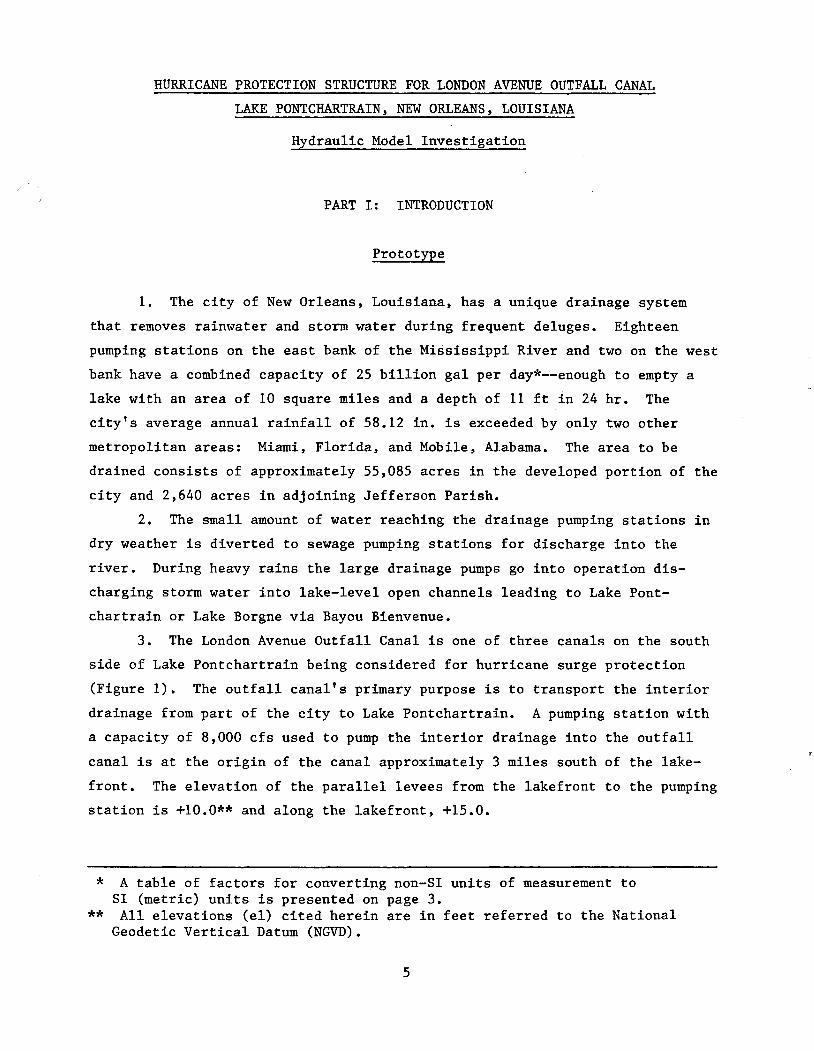
1. The city of New Orleans, Louisiana, has a unique drainage system
that removes rainwater and storm water during frequent deluges. Eighteen
pumping stations on the east bank of the Mississippi River and two on the west
bank have a combined capacity of 25 billion gal per day*--enough to empty a
lake with an area of 10 square miles and a depth of 11 ft in 24 hr. The
city's average annual rainfall of 58.12 in. is exceeded by only two other
metropolitan areas: Miami, Florida, and Mobile, Alabama. The area to be
drained consists of approximately 55,085 acres in the developed portion of the
city and 2,640 acres in adjoining Jefferson Parish.
2. The small amount of water reaching the drainage pumping stations in
dry weather is diverted to sewage pumping stations for discharge into the
river. During heavy rains the large drainage pumps go into operation dis
charging storm water into lake-level open channels leading to Lake Pont
chartrain or Lake Borgne via Bayou Bienvenue.
3. The London Avenue Outfall Canal is one of three canals on the south
side of Lake Pontchartrain being considered for hurricane surge protection
(Figure 1). The outfall canal's primary purpose is to transport the interior
drainage from part of the city to Lake Pontchartrain. A pumping station with
a capacity of 8,000 cfs used to pump the interior drainage into the outfall
canal is at the origin of the canal approximately 3 miles south of the lake
front. The elevation of the parallel levees from the lakefront to the pumping
station is +10.0** and along the lakefront, +15.0.
* A table of factors for converting non-SI units of measurement to SI (metric) units is presented on page 3.
** All elevations (el) cited herein are in feet referred to the National Geodetic Vertical Datum (NGVD).
5
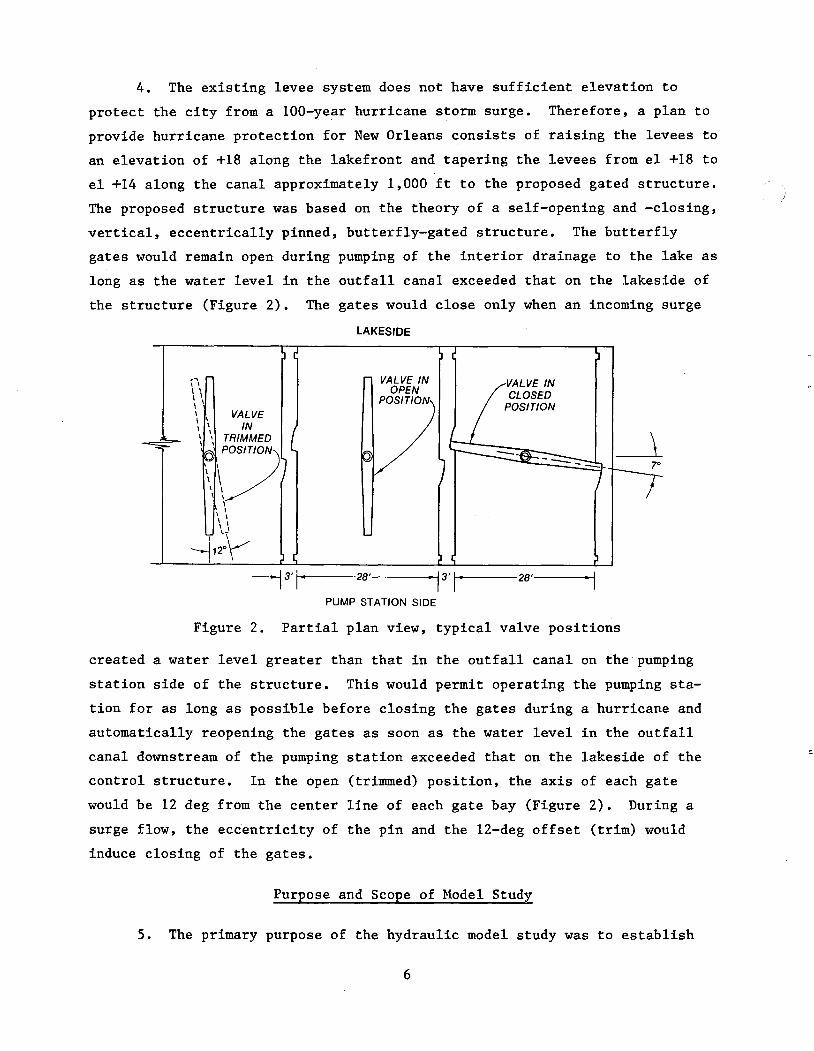
4. The existing levee system does not have sufficient elevation to
protect the city from a 100-year hurricane storm surge. Therefore, a plan to
provide hurricane protection for New Orleans consists of raising the levees to
an elevation of +18 along the lakefront and tapering the levees from el +18 to
el +14 along the canal approximately 1,000 ft to the proposed gated structure.
The proposed structure was based on the theory of a self-opening and -closing,
vertical, eccentrically pinned, butterfly-gated structure. The butterfly
gates would remain open during pumping of the interior drainage to the lake as
long as the water level in the outfall canal exceeded that on the lakeside of
the structure (Figure 2). The gates would close only when an incoming surge
,~
" \ \ \ ' " VALVE \ \ IN \ .. TRIMMED
,P
70SIT/ON
\ , \ \ , \ ,
\ , ' \ \
\ ' ,) I \
__ +2°Y , '
LAKESIDE
VALVE IN OPEN
POSIT/ON
VALVE IN CLOSED
POSIT/ON
---i 3' 1-+1' --28'------i°13'11-+ • --28'
PUMP STATION SIDE
'j
Figure 2. Partial plan view, typical valve positions
created a water level greater than that in the outfall canal on the pumping
station side of the structure. This would permit operating the pumping sta
tion for as long as possible before closing the gates during a hurricane and
automatically reopening the gates as soon as the water level in the outfall
canal downstream of the pumping station exceeded that on the lakeside of the
control structure. In the open (trimmed) position, the axis of each gate
would be 12 deg from the center line of each gate bay (Figure 2). During a
surge flow, the eccentricity of the pin and the 12-deg offset (trim) would
induce closing of the gates.
Purpose and Scope of Model Study
5. The primary purpose of the hydraulic model study was to establish
6
whether or not the conceptual designs for the proposed butterfly valve struc
ture would permit automatic flow-induced opening or closing of the valve when
subjected, respectively, to pumped flows or hurricane surges. Other informa
tion to be derived from the model study included proper canal configuration to
ensure uniform flow for both inlet and exit conditions; magnitude of torques
on valve trunnions, when subjected to various flows, wave conditions, and gate
openings; and head differential across the proposed structure for one final
recommended gate design. The determination of the proper gate shape, trunnion
location, and amount of eccentricity proved to be a significant part of the
overall study effort.
7
PART II: MODEL
Description
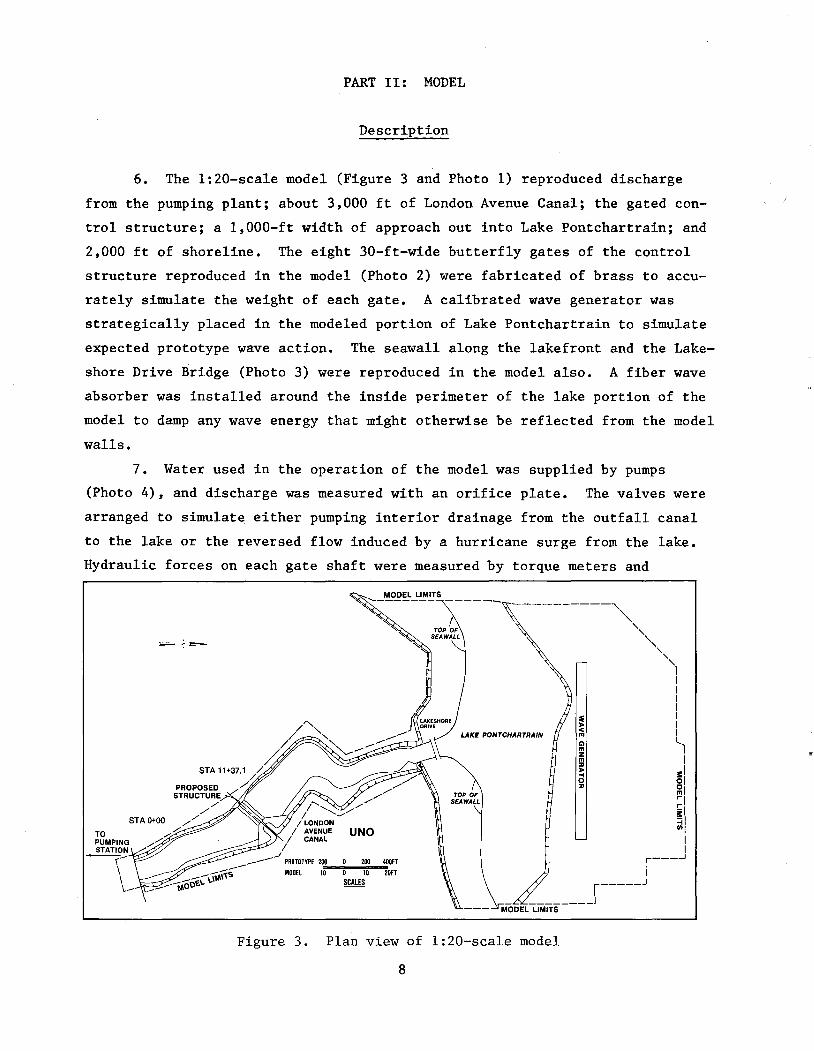
6. The 1:20-scale model (Figure 3 and Photo 1) reproduced discharge
from the pumping plant; about 3,000 ft of London Avenue Canal; the gated con
trol structure; a 1,000-ft width of approach out into Lake Pontchartrain; and
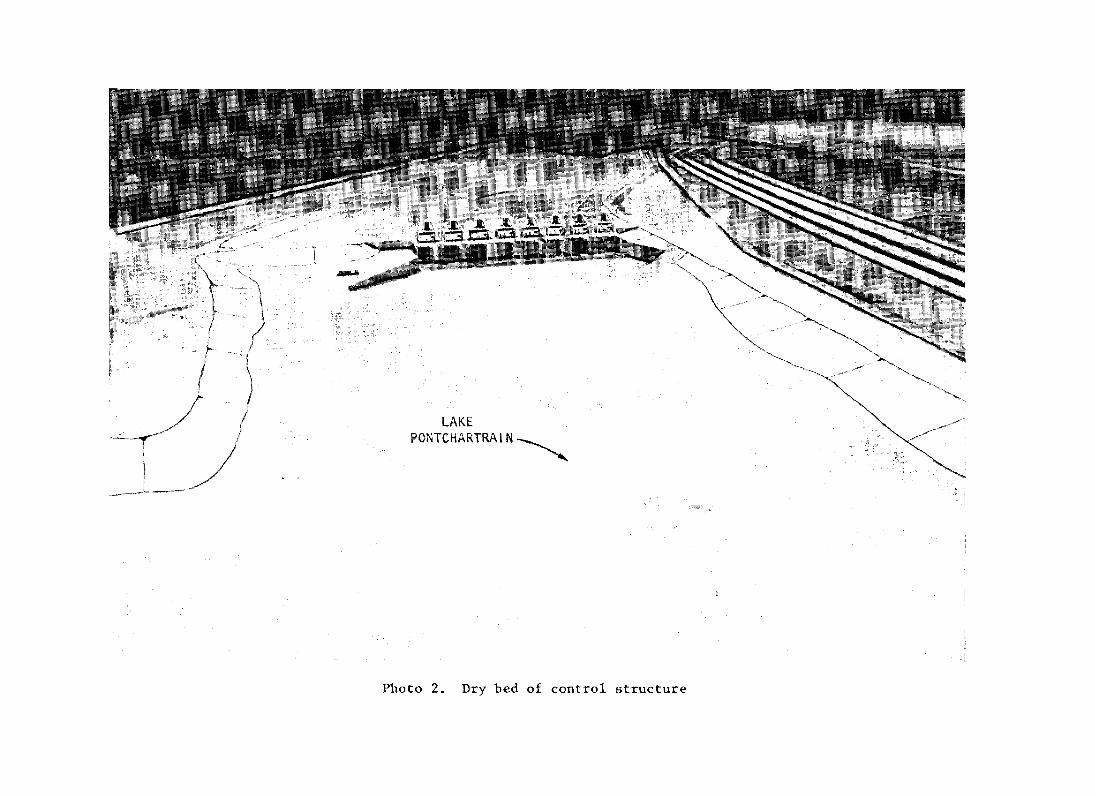
2,000 ft of shoreline. The eight 30-ft-wide butterfly gates of the control
structure reproduced in the model (Photo 2) were fabricated of brass to accu
rately simulate the weight of each gate. A calibrated wave generator was
strategically placed in the modeled portion of Lake Pontchartrain to simulate
expected prototype wave action. The seawall along the lakefront and the Lake
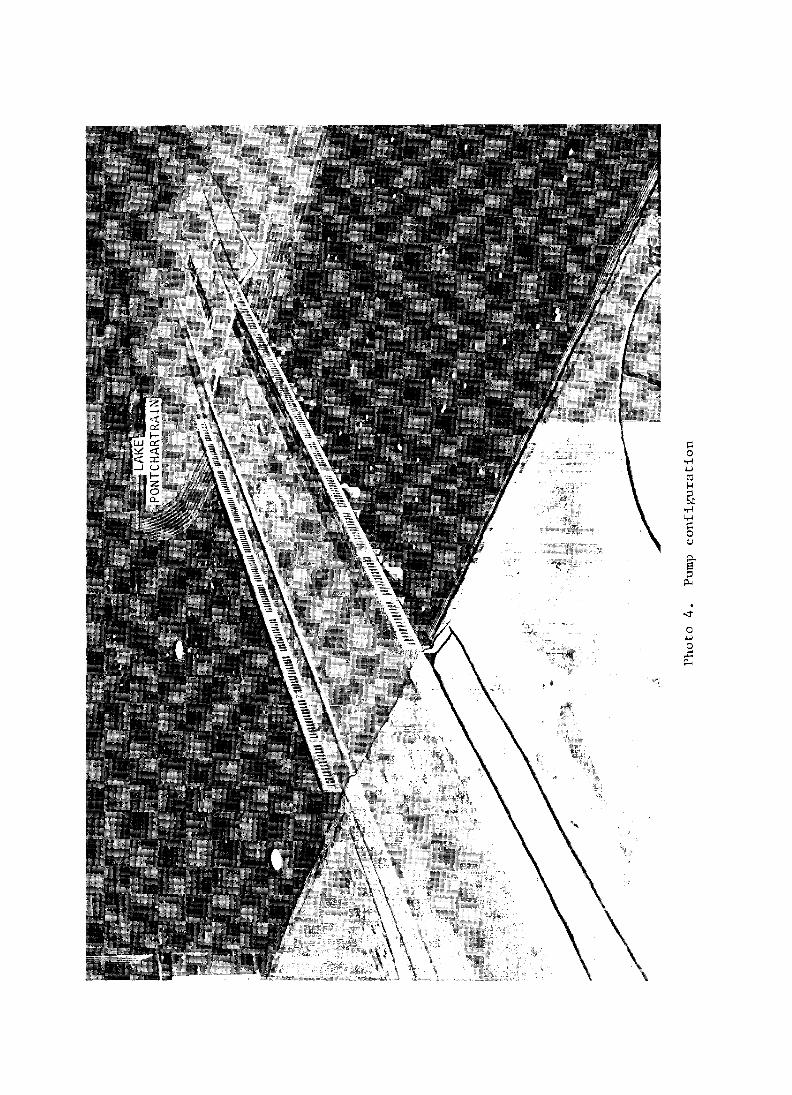
shore Drive Bridge (Photo 3) were reproduced in the model also. A fiber wave
absorber was installed around the inside perimeter of the lake portion of the
model to damp any wave energy that might otherwise be reflected from the model
walls.
7. Water used in the operation of the model was supplied by pumps
(Photo 4), and discharge was measured with an orifice plate. The valves were
arranged to simulate. either pumping interior drainage from the outfall canal
to the lake or the reversed flow induced by a hurricane surge from the lake.
Hydraulic forces on each gate shaft were measured by torque meters and
TO PUMPING STATION
PROPOSED STRUCTURE
,/ ,/
STAO+OO ,/ ",/-'/
///
I LONDON I AVENUE
I CANAL I
_---' PROTOTYPE 200
LAKE PONTCHARTRAIN
UNO
200 400FT ------r\ --_--J"tAi1s MODEL 10 o 10 20FT \ \.- _---"'OOE\. SCALES
Figure 3. Plan view of 1:20-scale model
8

recorded and analyzed by a computer. Water-surface elevations were measured
with point gages. Wave heights and periods were obtained with computerized
wave gages. Pumped and surge flows were observed by injecting dye and con
fetti into the flow.
Scale Relations
8. The accepted equations of hydraulic similitude, based upon Froudian
criteria, were used to express mathematical relations between the dimensions
and hydraulic quantities of the model and prototype. General relations
expressed in terms of the model scale or length ratio
follows:
L r
are presented as
Scale Relations Dimension* Ratio Model:Prototype
Length L 1:20 r
Area A = L2 1:400 r r
Discharge Qr = LS/ 2 1:1,788.84
r
Torque T = L4 1:160,000 r r
* Dimensions are in terms of length.
9

PART III: TESTS AND RESULTS
Canal
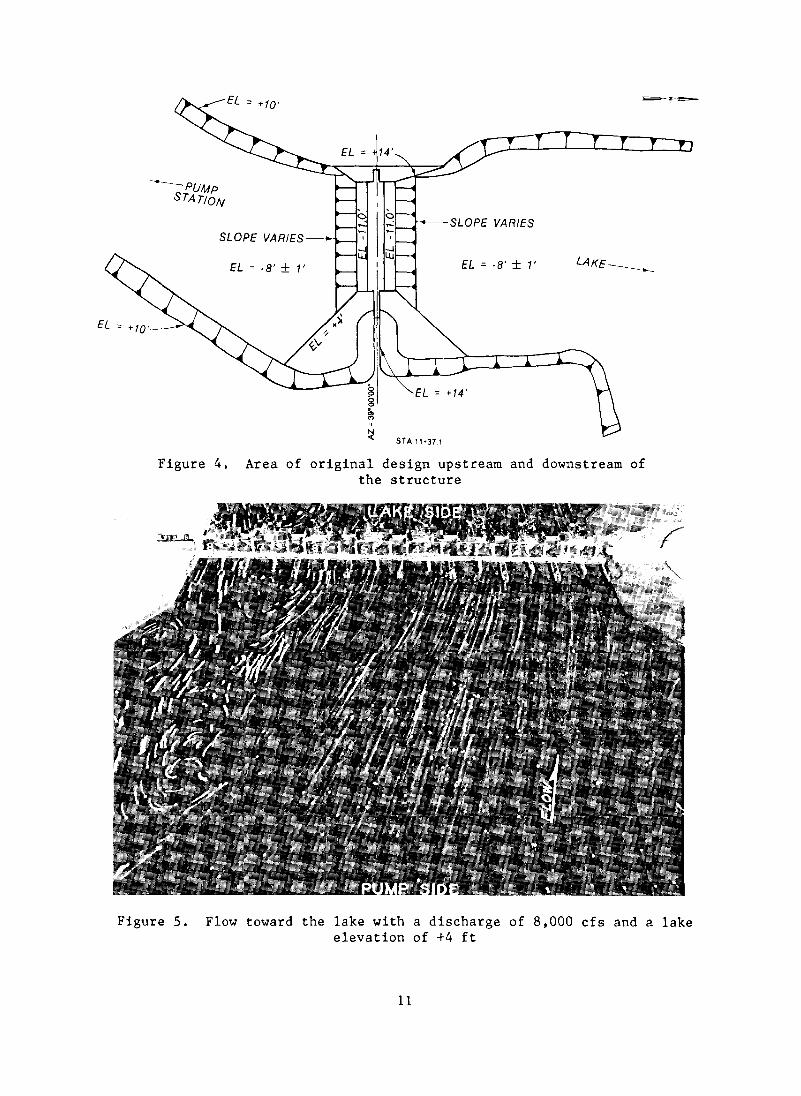
9. The original canal alignment (Figure 4) was tested by locking the
gates in the 12-deg trimmed position (Figure 2), and injecting dye and con
fetti into the flow. Flow patterns through the structure were asymmetric for
all anticipated pumped flows and water-surface elevations. Tests indicated
that for the gates to function properly, the canal would have to be realigned
to provide more even flow distribution through the structure. Figure 5 shows
an eddy that generated reverse flow conditions through gate bays 7 and 8. The
gates were numbered as shown in Figure 5.
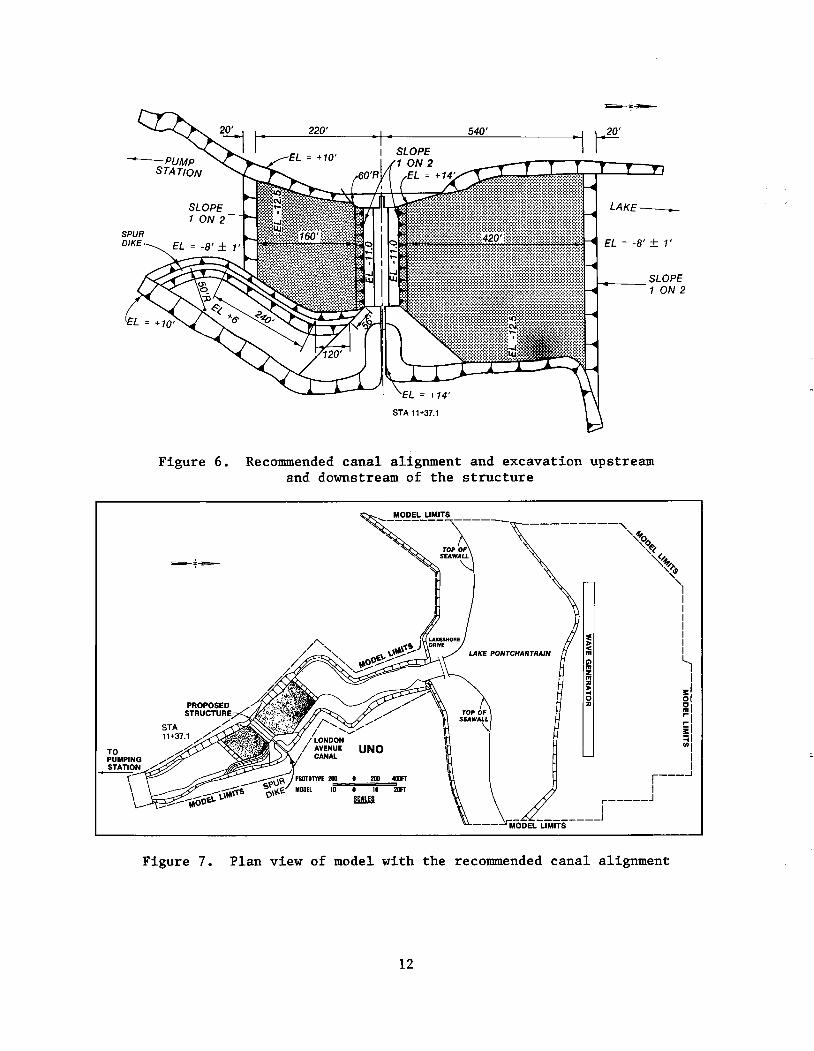
10. The adverse flow conditions through the structure were attributed
to poor entry conditions resulting from siting the structure in an existing
bend in the canal (Figure 4). Flow distribution in the canal approach to the
structure was improved by moving the levee on the west side of the canal west
ward 40 ft for a distance along the levee of 220 ft upstream and 540 ft down
stream from the structure while maintaining the existing canal side slopes
(Figures 6 and 7). Flow contractions induced by flow along the west wing wall
(Figure 4) on the pump station side of the structure were eliminated for all
pumped flow conditions by streamlining the wing wall with a 60-ft radius as
shown in Figures 6 and 7. Flow distribution along the east side of the canal
was improved by the addition of a spur dike. Flow distribution through the
structure was also improved by excavating upstream and downstream from the
structure (Figure 6). Acceptable flow conditions through the structure were
achieved by the recommended canal design shown in Figures 6 and 7.
11. Figure 8 shows the recommended canal design with a more uniform
flow distribution in the approach and through the structure. For some pumped
flow conditions, an eddy continued along the west levee; however, it had no
adverse effect on flow through the structure.
Gates
Gate design
12. Observations during operation of the model with the recommended
canal design indicated that the type 1 vertical butterfly gates (Figure 9)
10
SLOPE VARIES SLOPE VARIES-
EL = -8' ± l' EL = -8' ± l' LAKE ____ ~
STA 11+37.1
Figure 4. Area of original design upstream and downstream of the structure
Figure 5. Flow toward the lake with a discharge of 8,000 cfs and a lake elevation of +4 ft
11
STA 11+37.1
LAKE_
EL = -8' ± l'
1-+-__ SLOPE 1 ON 2
Figure 6. Recommended canal alignment and excavation upstream and downstream of the structure
UNO
200 400FT
10 0 10 20FT SCALES
Figure 7. Plan view of model with the recommended canal alignment
12

Figure 8. Flow toward the lake with a discharge of 8,000 cfs and a lake elevation of +7 ft
LAKE SIDE
15'9"
PIER
PIER
14'3"
J PUMP STATION SIDE
Figure 9. Type 1 gate design
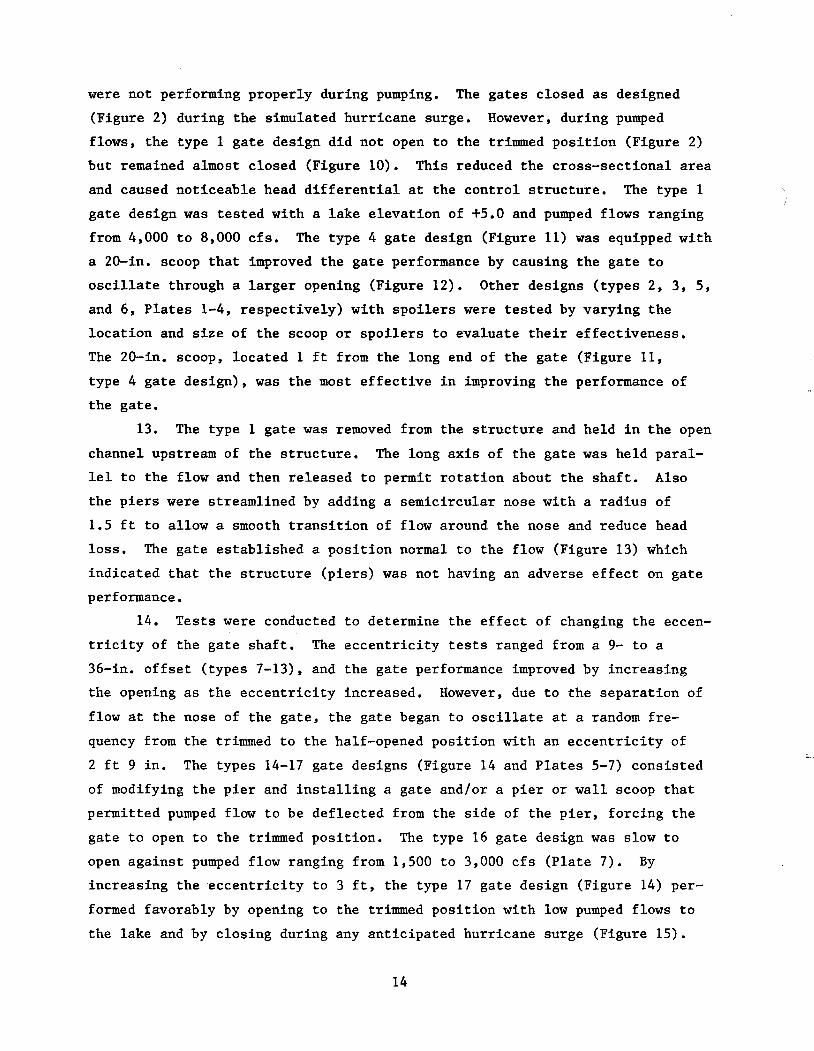
were not performing properly during pumping. The gates closed as designed
(Figure 2) during the simulated hurricane surge. However, during pumped
flows, the type 1 gate design did not open to the trimmed position (Figure 2)
but remained almost closed (Figure 10). This reduced the cross-sectional area
and caused noticeable head differential at the control structure. The type 1
gate design was tested with a lake elevation of +5.0 and pumped flows ranging
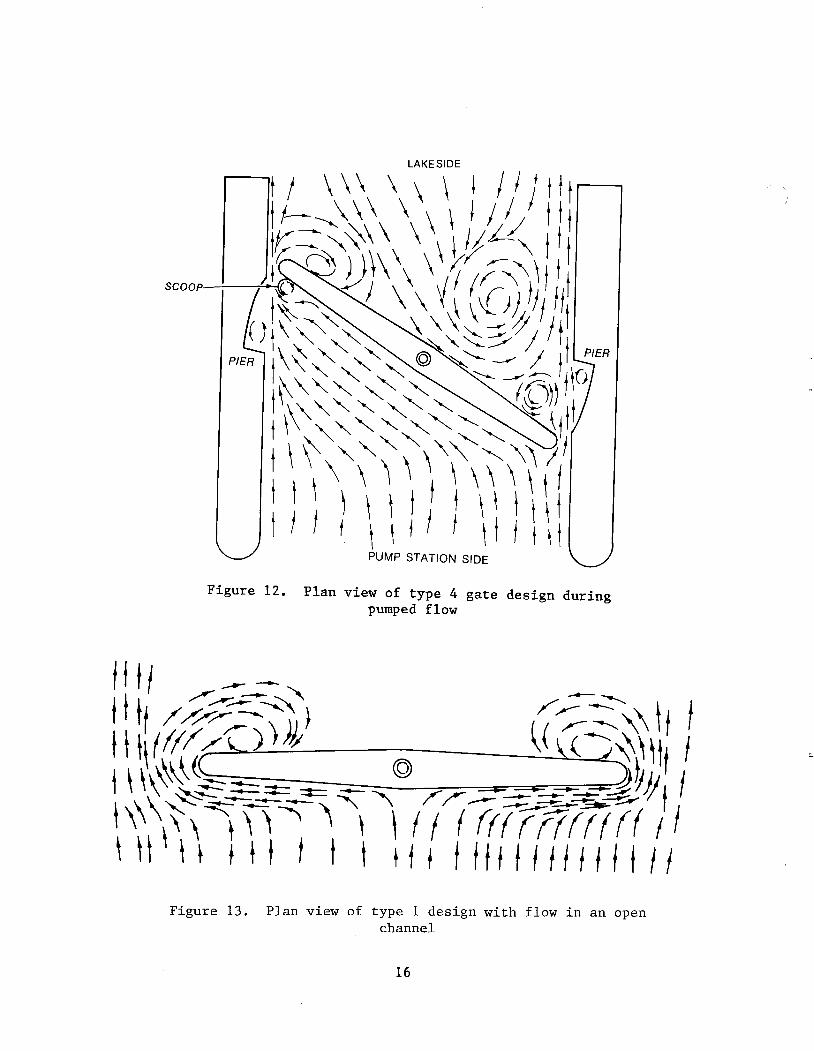
from 4,000 to 8,000 cfs. The type 4 gate design (Figure 11) was equipped with
a 20-in. scoop that improved the gate performance by causing the gate to
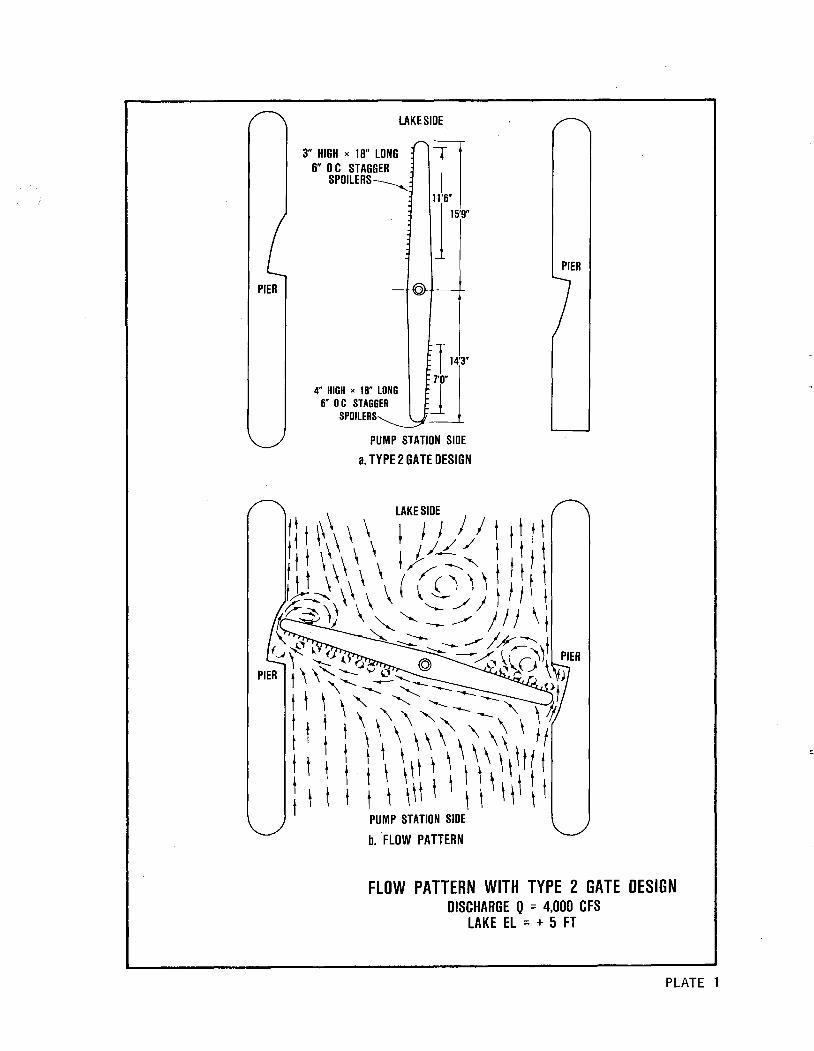
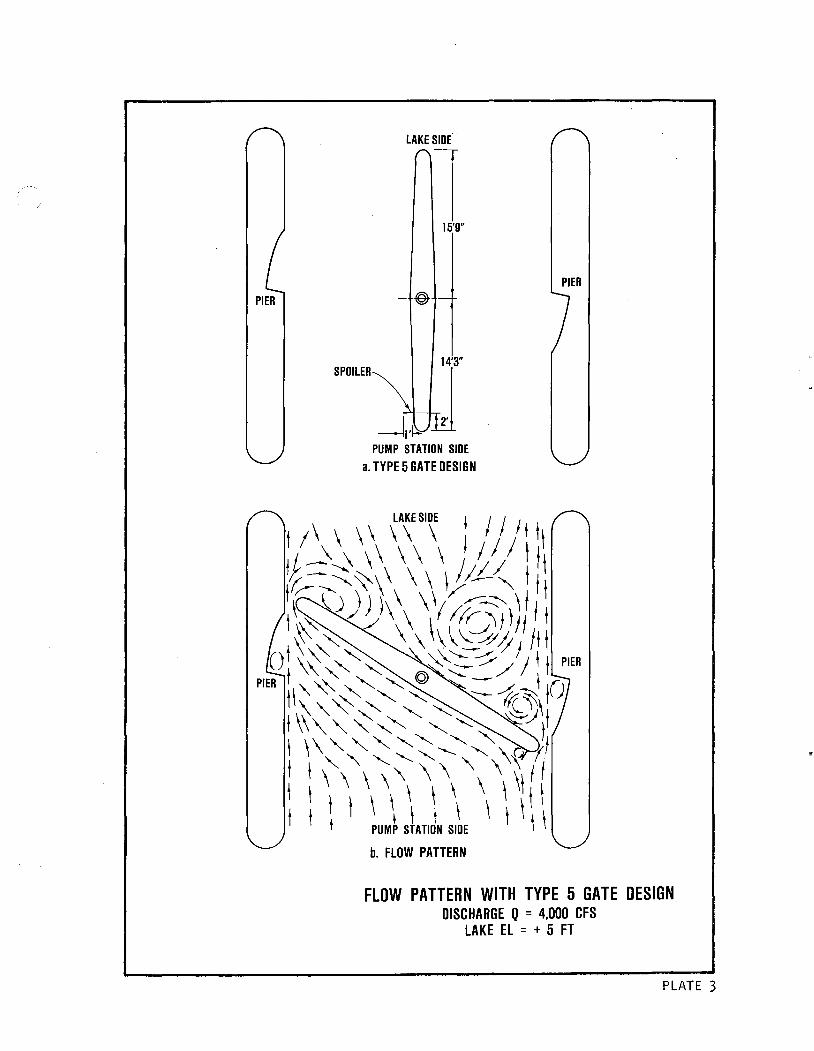
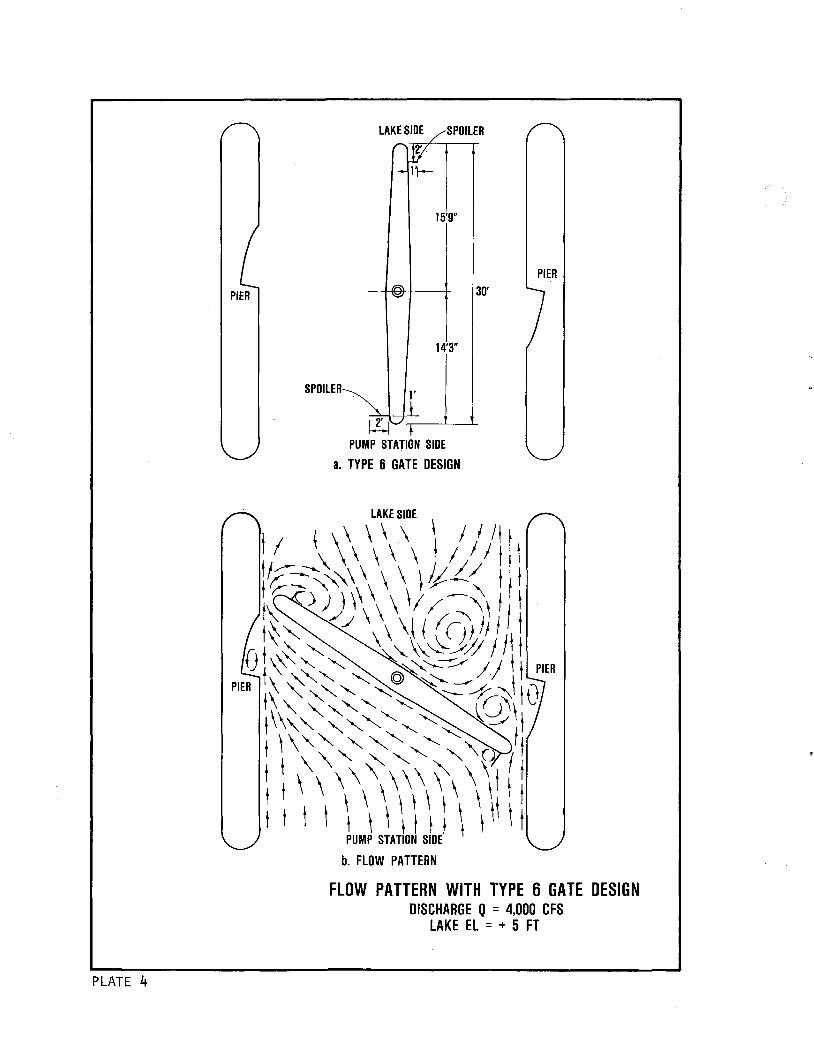
oscillate through a larger opening (Figure 12). Other designs (types 2, 3, 5,
and 6, Plates 1-4, respectively) with spoilers were tested by varying the
location and size of the scoop or spoilers to evaluate their effectiveness.
The 20-in. scoop, located 1 ft from the long end of the gate (Figure 11,
type 4 gate design), was the most effective in improving the performance of
the gate.
13. The type 1 gate was removed from the structure and held in the open
channel upstream of the structure. The long axis of the gate was held paral
lel to the flow and then released to permit rotation about the shaft. Also
the piers were streamlined by adding a semicircular nose with a radius of
1.5 ft to allow a smooth transition of flow around the nose and reduce head
loss. The gate established a position normal to the flow (Figure 13) which
indicated that the structure (piers) was not having an adverse effect on gate
performance.
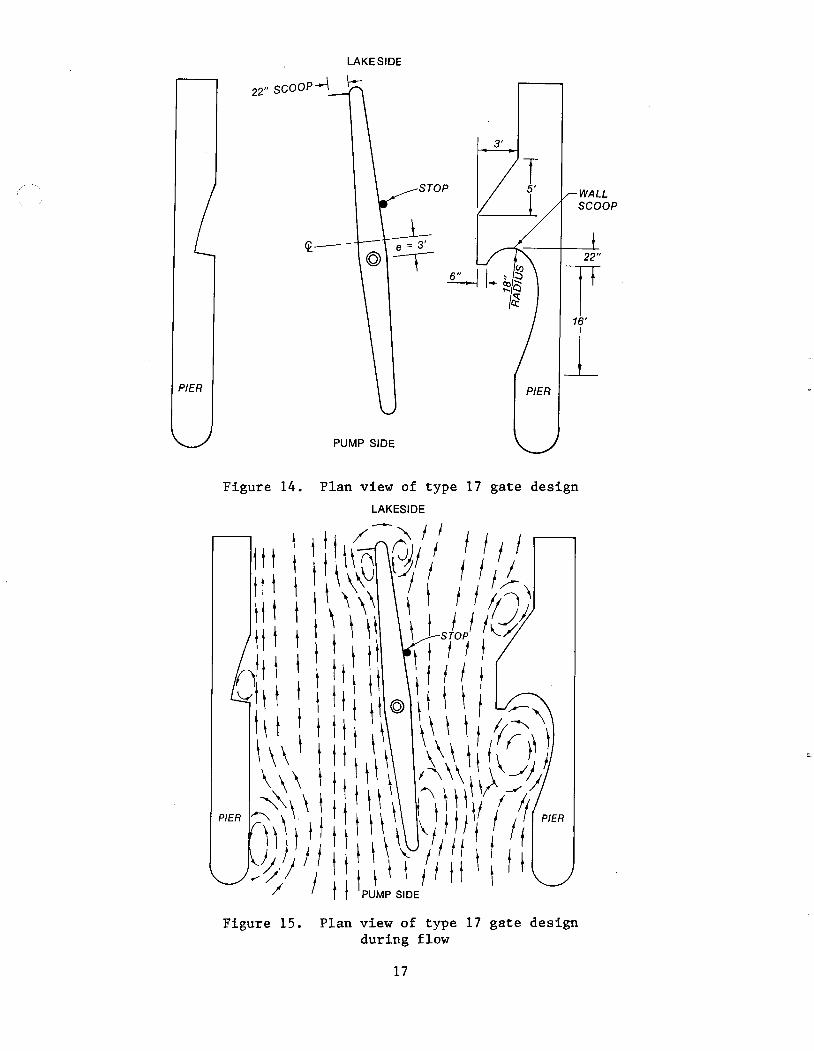
14. Tests were conducted to determine the effect of changing the eccen
tricity of the gate shaft. The eccentricity tests ranged from a 9- to a
36-in. offset (types 7-13), and the gate performance improved by increasing
the opening as the eccentricity increased. However, due to the separation of
flow at the nose of the gate, the gate began to oscillate at a random fre
quency from the trimmed to the half-opened position with an eccentricity of
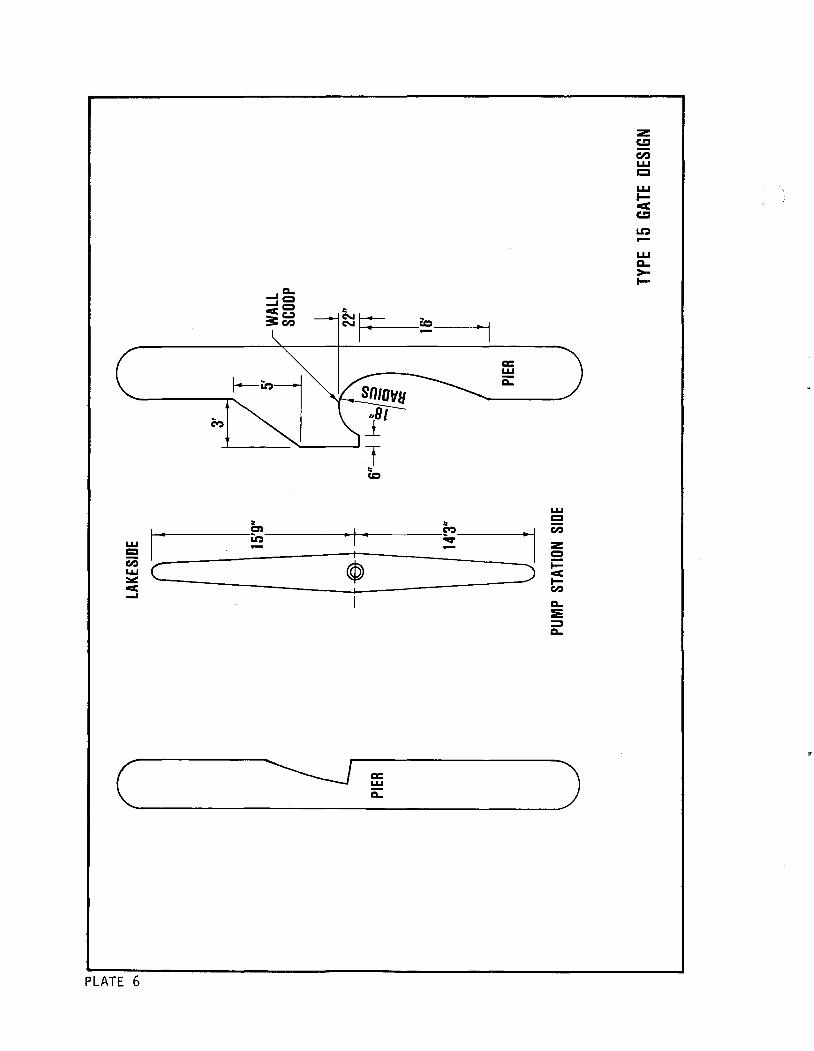
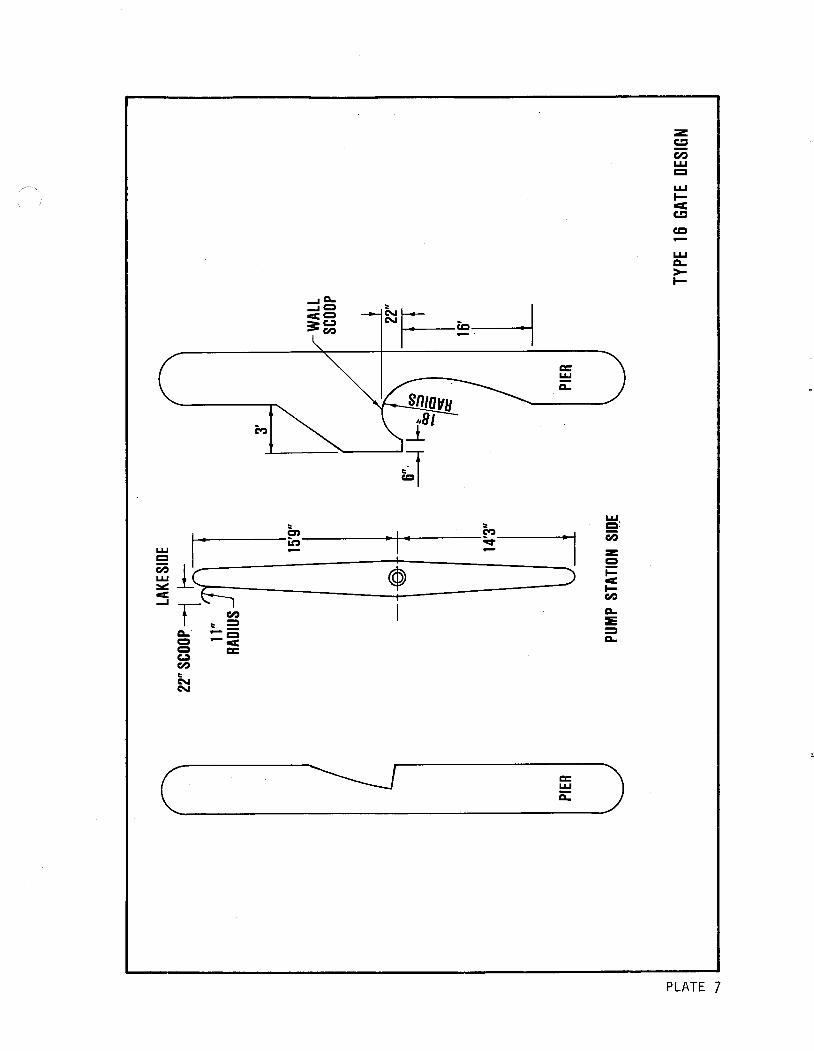
2 ft 9 in. The types 14-17 gate designs (Figure 14 and Plates 5-7) consisted
of modifying the pier and installing a gate and/or a pier or wall scoop that
permitted pumped flow to be deflected from the side of the pier, forcing the
gate to open to the trimmed position. The type 16 gate design was slow to
open against pumped flow ranging from 1,500 to 3,000 cfs (Plate 7). By
increasing the eccentricity to 3 ft, the type 17 gate design (Figure 14) per
formed favorably by opening to the trimmed position with low pumped flows to
the lake and by closing during any anticipated hurricane surge (Figure 15).
14
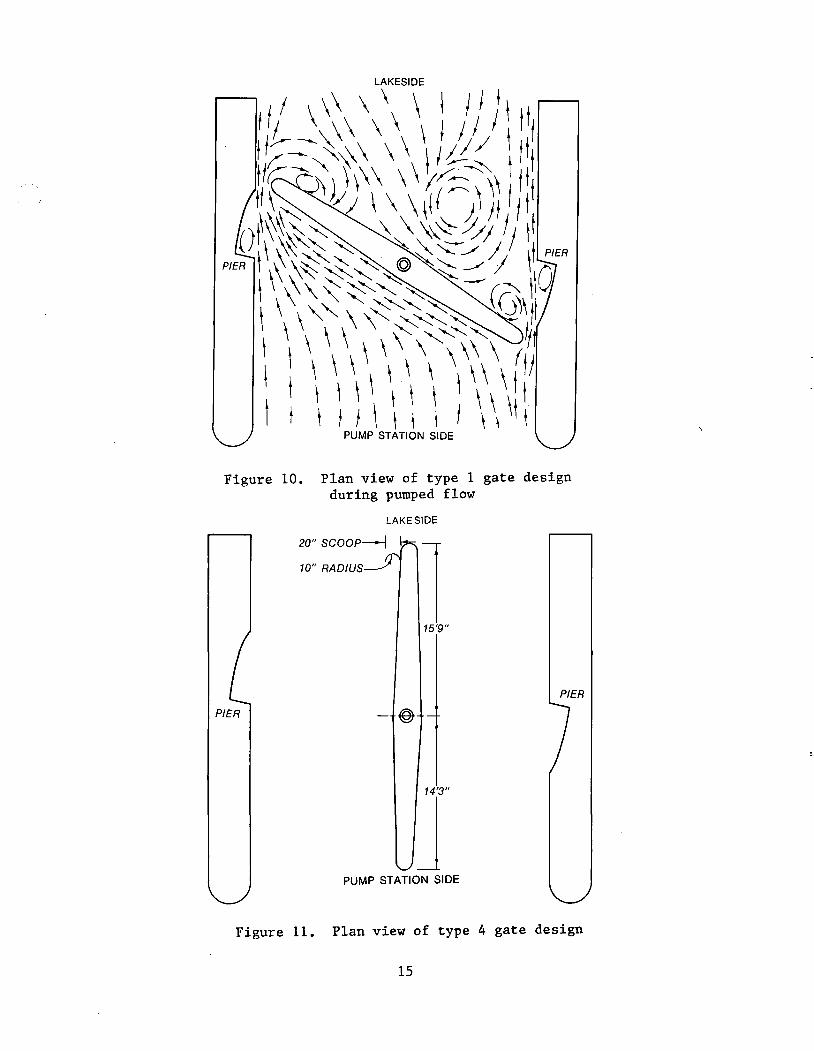
Figure 10. Plan view of type 1 gate design during pumped flow
LAKESIDE
10" RADIUS 1 15'9"
PIER
PIER -@
PUMP STATION SIDE
Figure 11. Plan view of type 4 gate design
15
PUMP STATION SIDE
Figure 12. Plan view of type 4 gate design during pumped flow
Figure 13. Plan view of type 1 design with flow in an open channel
16
PIER
LAKESIDE
3'
22"
r 16'
1 PIER
PUMP SIDE
Figure 14. Plan view of type 17 gate design
LAKESIDE
Figure 15. Plan view of type 17 gate design during flow
17
However, this design was undesirable due to the increased head loss through
the structure caused by the pier scoop in the pier wall. Integrated testing
of the shape of the gate scoops or spoilers indicated the rounded and/or
straight forms performed identically.
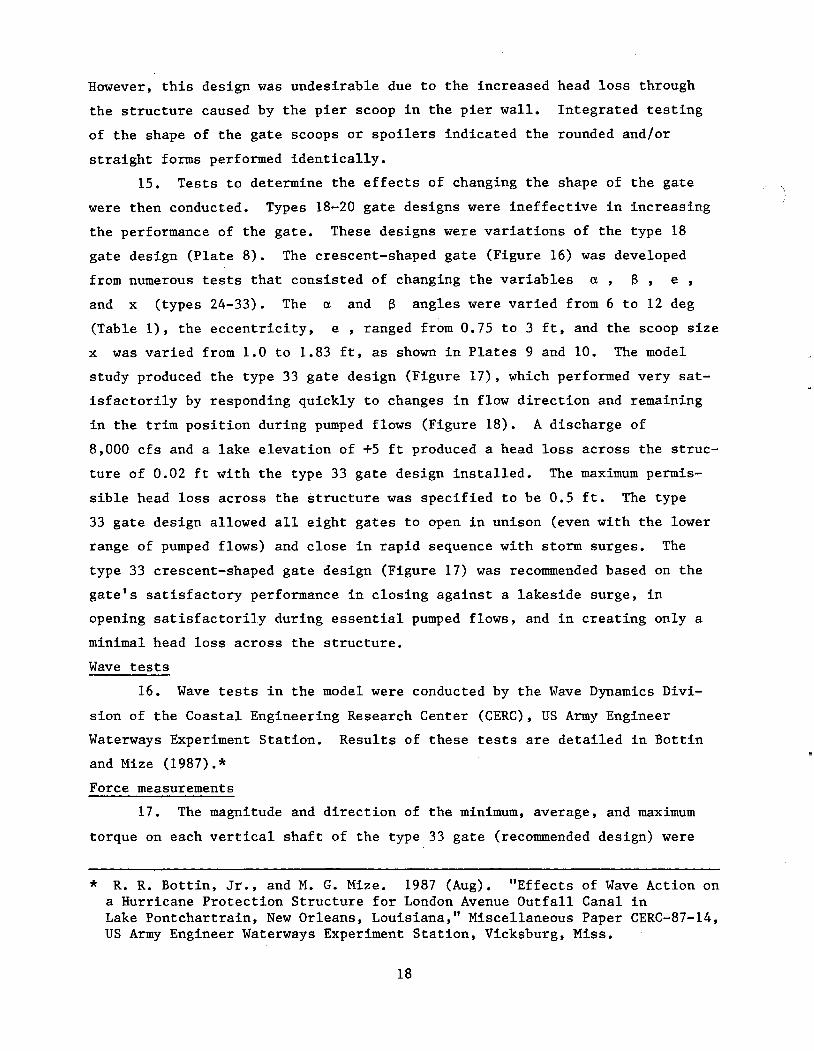
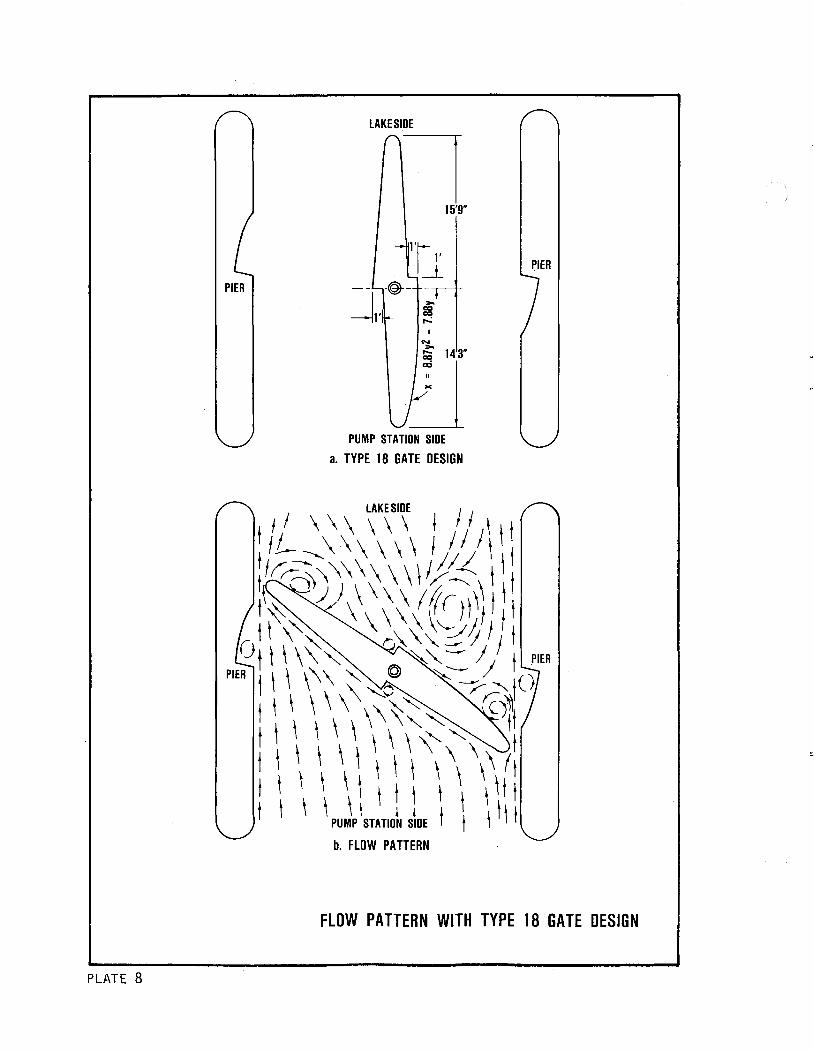
15. Tests to determine the effects of changing the shape of the gate
were then conducted. Types 18-20 gate designs were ineffective in increasing
the performance of the gate. These designs were variations of the type 18
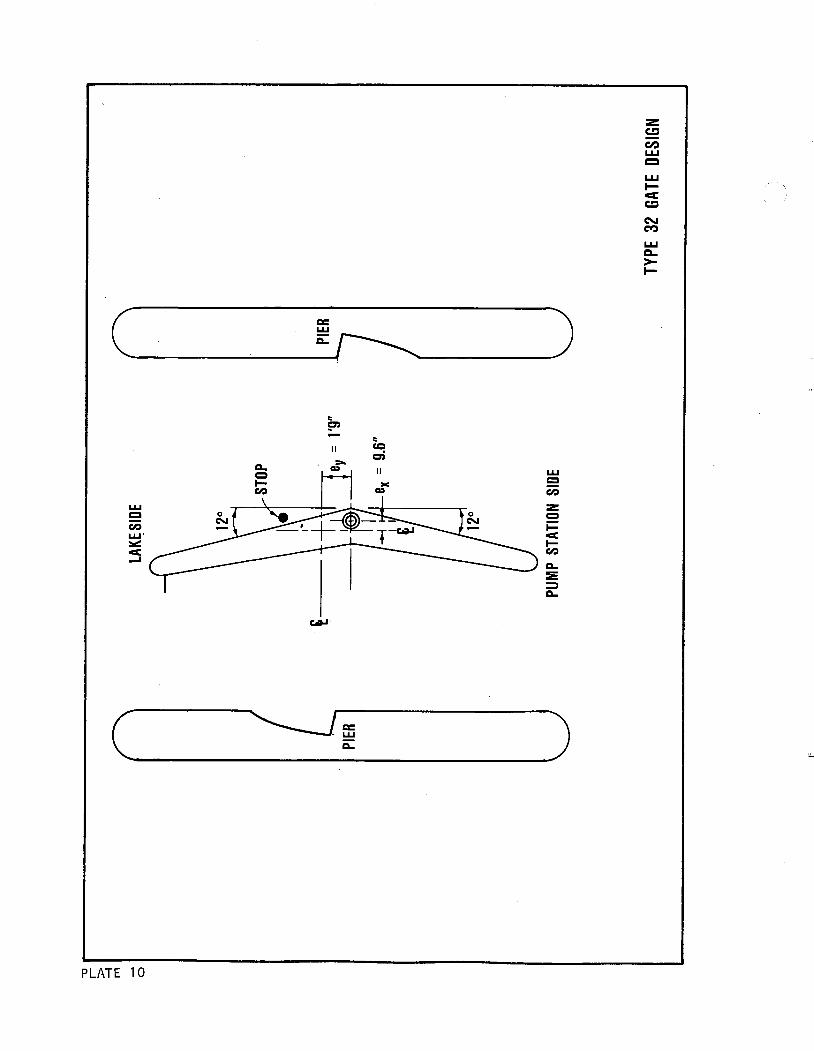
gate design (Plate 8). The crescent-shaped gate (Figure 16) was developed
from numerous tests that consisted of changing the variables a, B, e,
and x (types 24-33). The a and B angles were varied from 6 to 12 deg
(Table 1), the eccentricity, e, ranged from 0.75 to 3 ft, and the scoop size
x was varied from 1.0 to 1.83 ft, as shown in Plates 9 and 10. The model
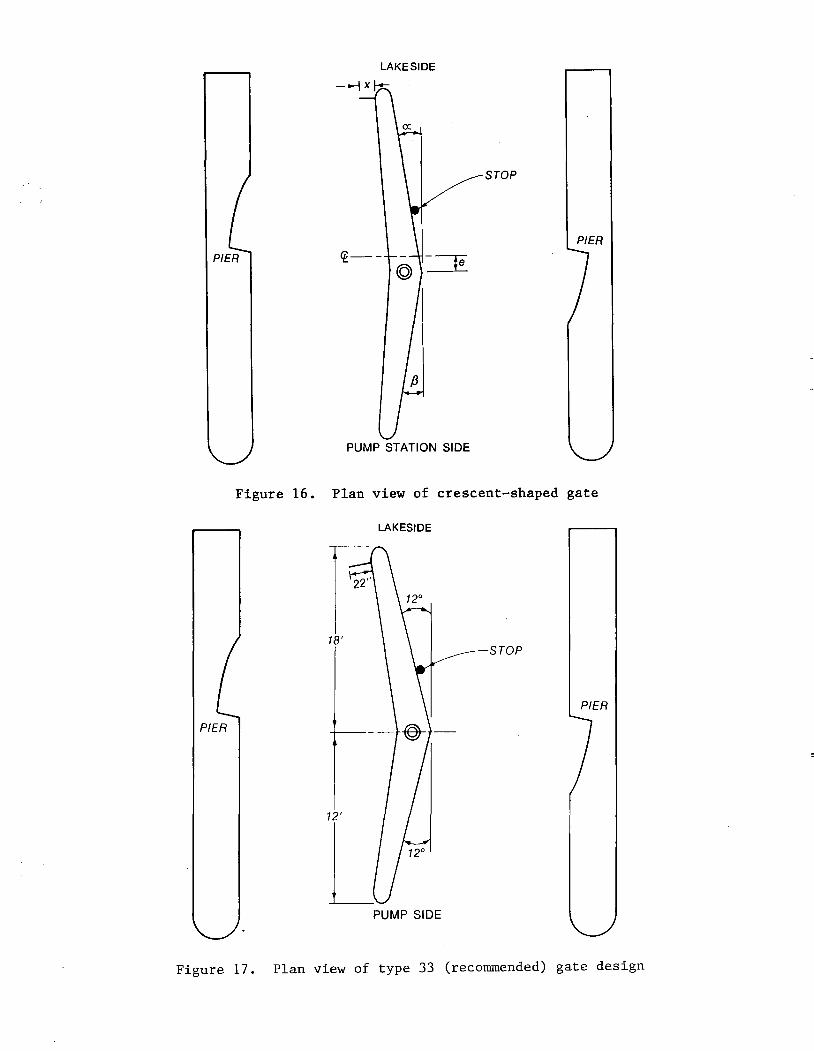
study produced the type 33 gate design (Figure 17), which performed very sat
isfactorily by responding quickly to changes in flow direction and remaining
in the trim position during pumped flows (Figure 18). A discharge of
8,000 cfs and a lake elevation of +5 ft produced a head loss across the struc
ture of 0.02 ft with the type 33 gate design installed. The maximum permis
sible head loss across the structure was specified to be 0.5 ft. The type
33 gate design allowed all eight gates to open in unison (even with the lower
range of pumped flows) and close in rapid sequence with storm surges. The
type 33 crescent-shaped gate design (Figure 17) was recommended based on the
gate's satisfactory performance in closing against a lakeside surge, in
opening satisfactorily during essential pumped flows, and in creating only a
minimal head loss across the structure.
Wave tests
16. Wave tests in the model were conducted by the Wave Dynamics Divi
sion of the Coastal Engineering Research Center (CERC), us Army Engineer
Waterways Experiment Station. Results of these tests are detailed in Bottin
and Mize (1987).*
Force measurements
17. The magnitude and direction of the minimum, average, and maximum
torque on each vertical shaft of the type 33 gate (recommended design) were
* R. R. Bottin, Jr., and M. G. Mize. 1987 (Aug). "Effects of Wave Action on a Hurricane Protection Structure for London Avenue Outfall Canal in Lake Pontchartrain, New Orleans, Louisiana," Miscellaneous Paper CERC-87-14, US Army Engineer Waterways Experiment Station, Vicksburg, Miss.
18
PIER
LAKESIDE
---p b::;:
(f--
PUMP STATION SIDE
STOP
PIER
Figure 16. Plan view of crescent-shaped gate
LAKESIDE
STOP
PIER
PIER
PUMP SIDE
Figure 17. Plan view of type 33 (recommended) gate design
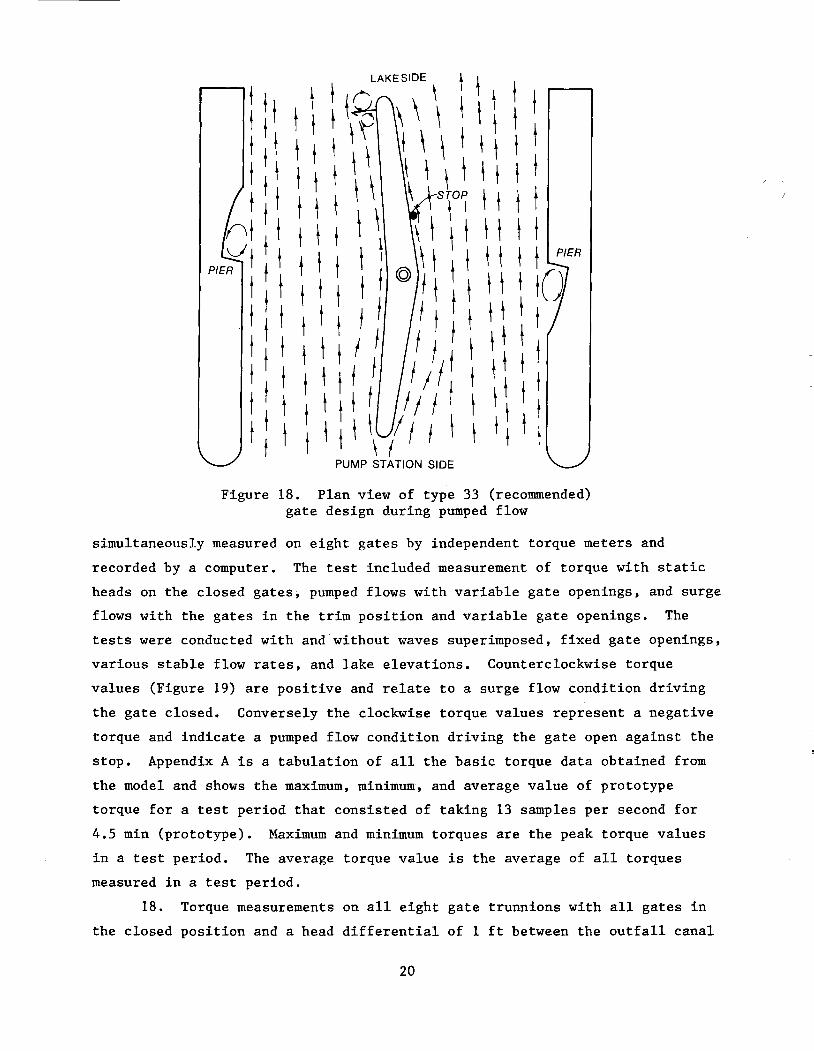
Figure 18. Plan view of type 33 (recommended) gate design during pumped flow
simultaneously measured on eight gates by independent torque meters and
recorded by a computer. The test included measurement of torque with static
heads on the closed gates, pumped flows with variable gate openings, and surge
flows with the gates in the trim position and variable gate openings. The
tests were conducted with and without waves superimposed, fixed gate openings,
various stable flow rates, and lake elevations. Counterclockwise torque
values (Figure 19) are positive and relate to a surge flow condition driving
the gate closed. Conversely the clockwise torque values represent a negative
torque and indicate a pumped flow condition driving the gate open against the
stop. Appendix A is a tabulation of all the basic torque data obtained from
the model and shows the maximum, minimum, and average value of prototype
torque for a test period that consisted of taking 13 samples per second for
4.5 min (prototype). Maximum and minimum torques are the peak torque values
in a test period. The average torque value is the average of all torques
measured in a test period.
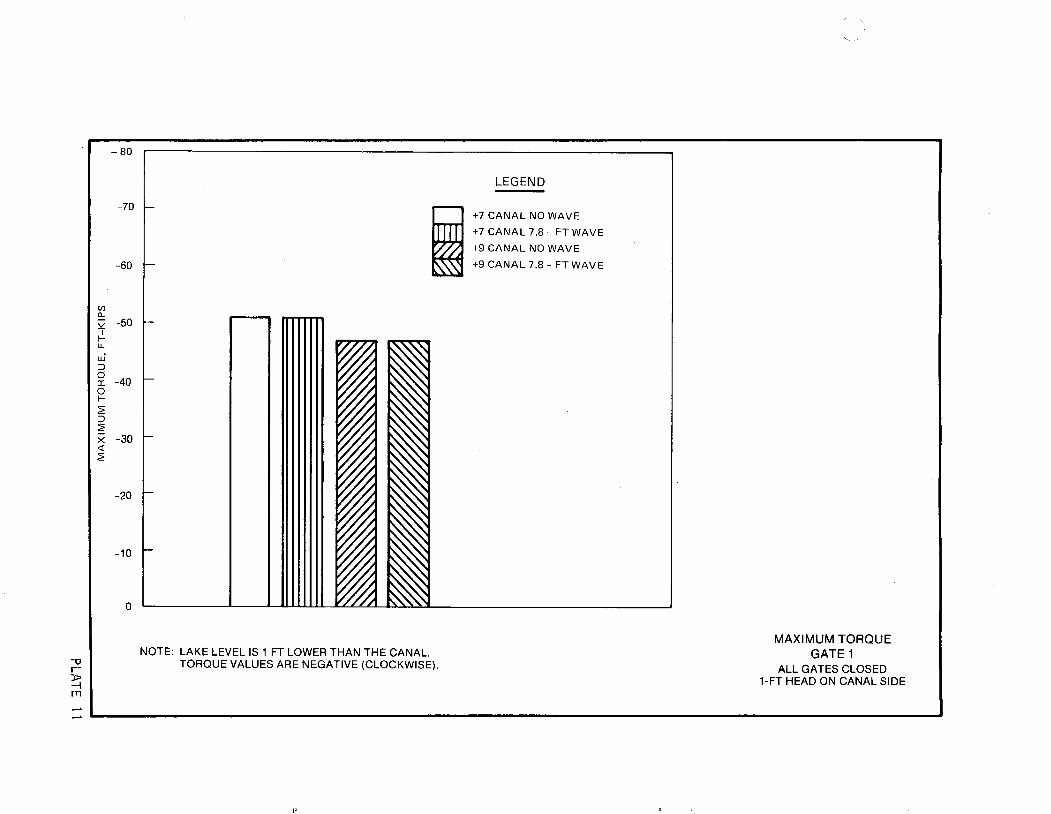
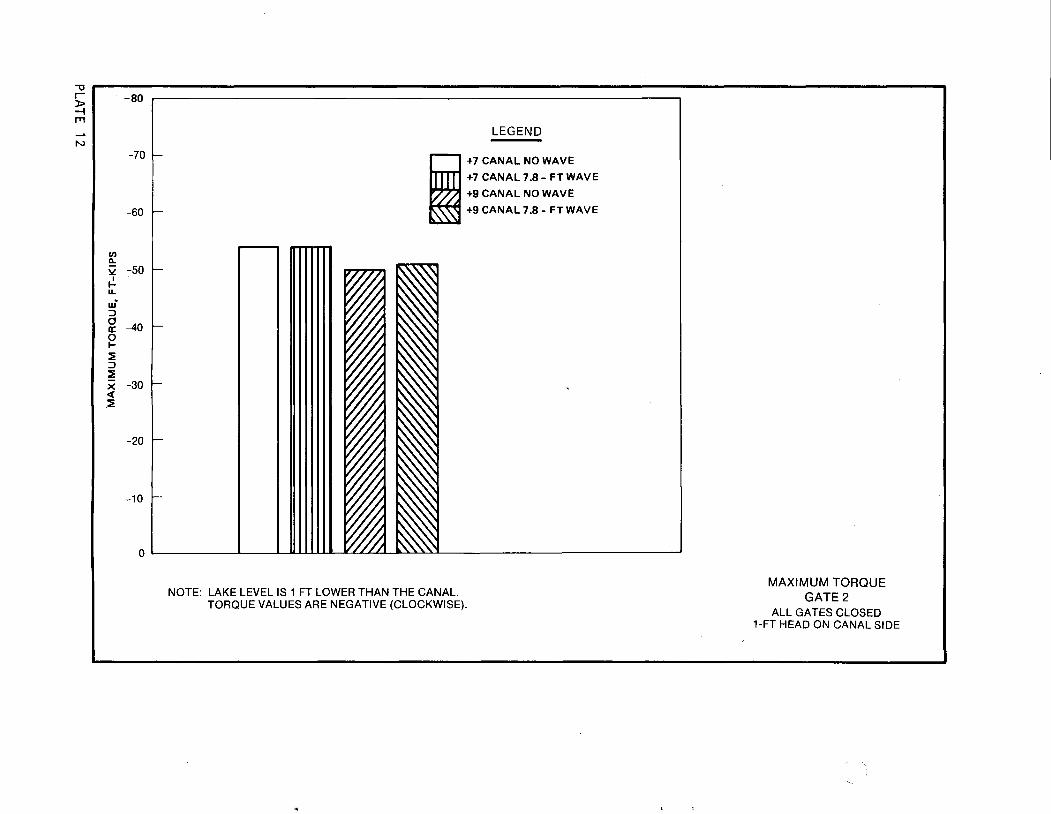
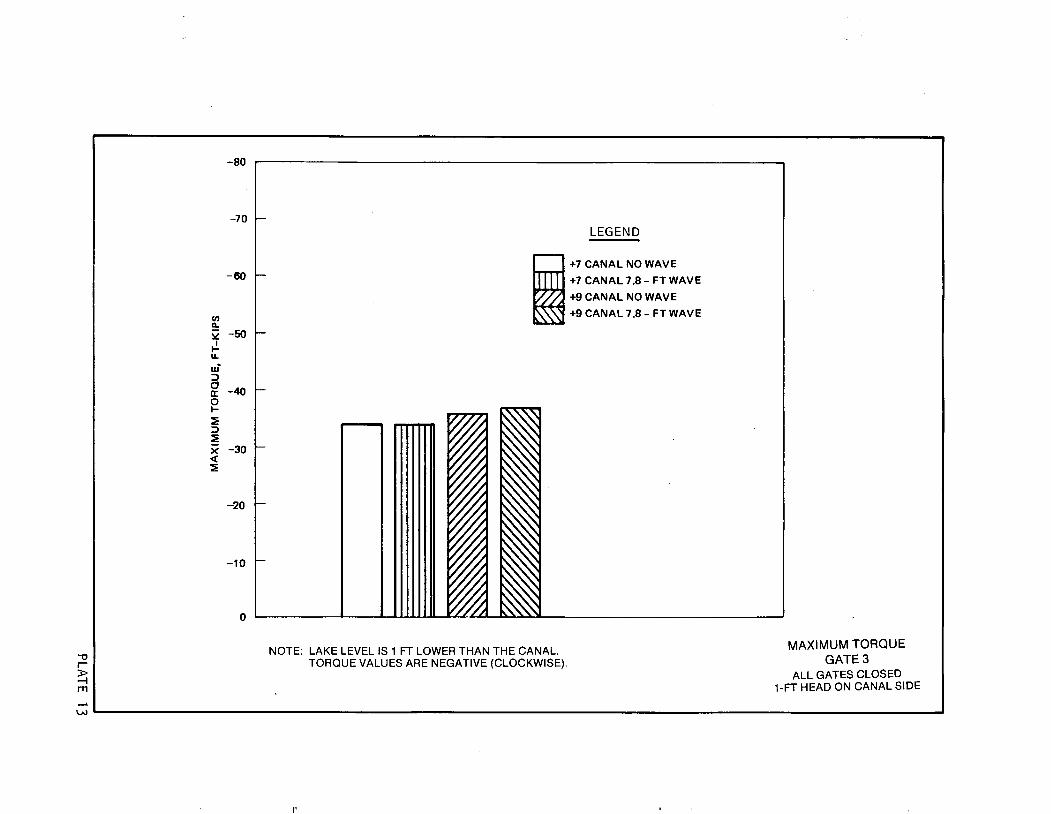
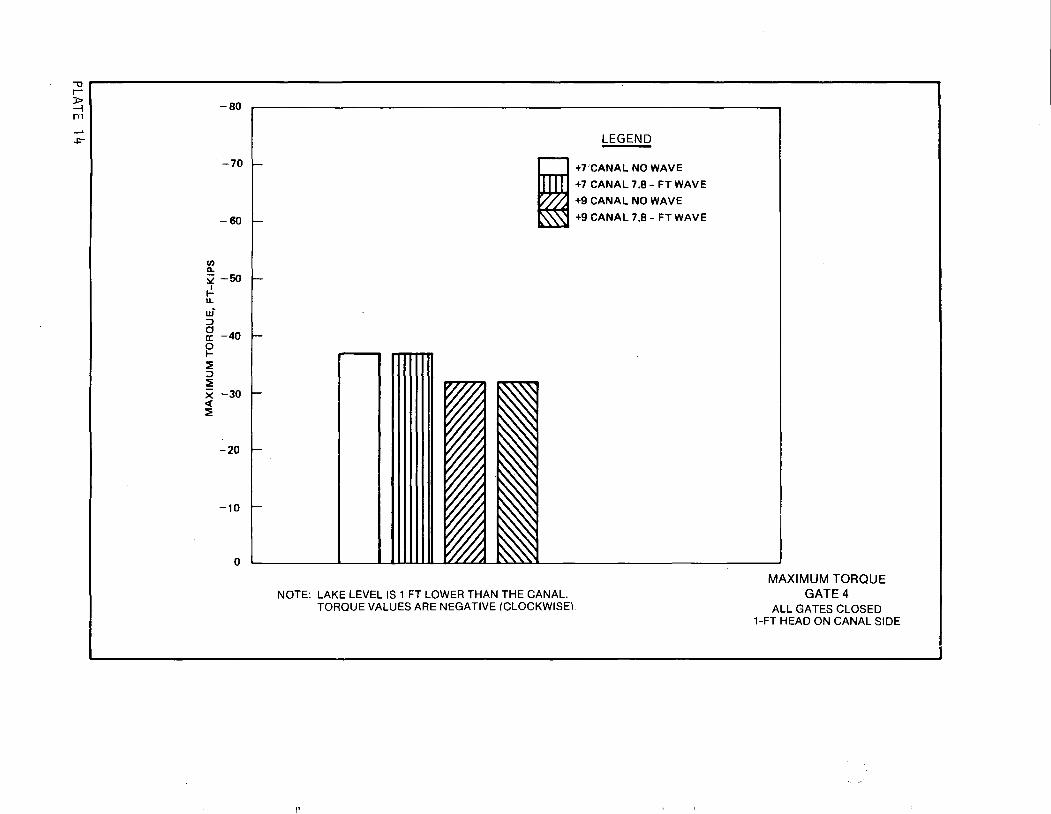
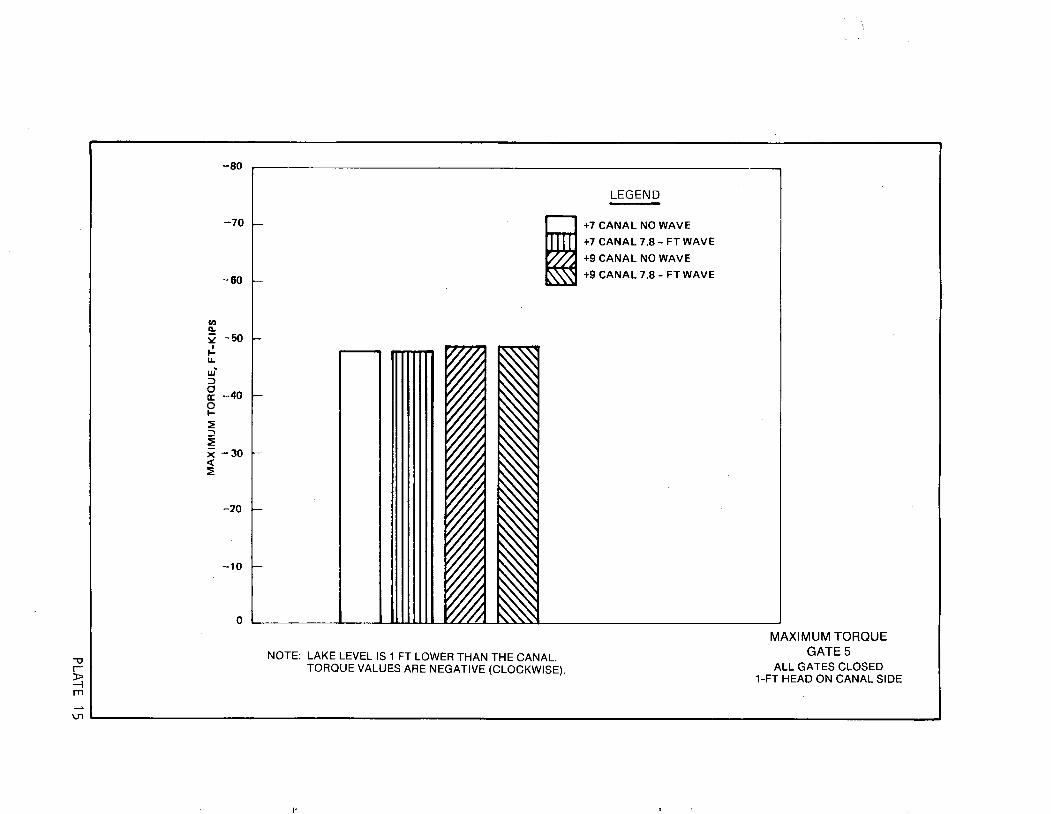
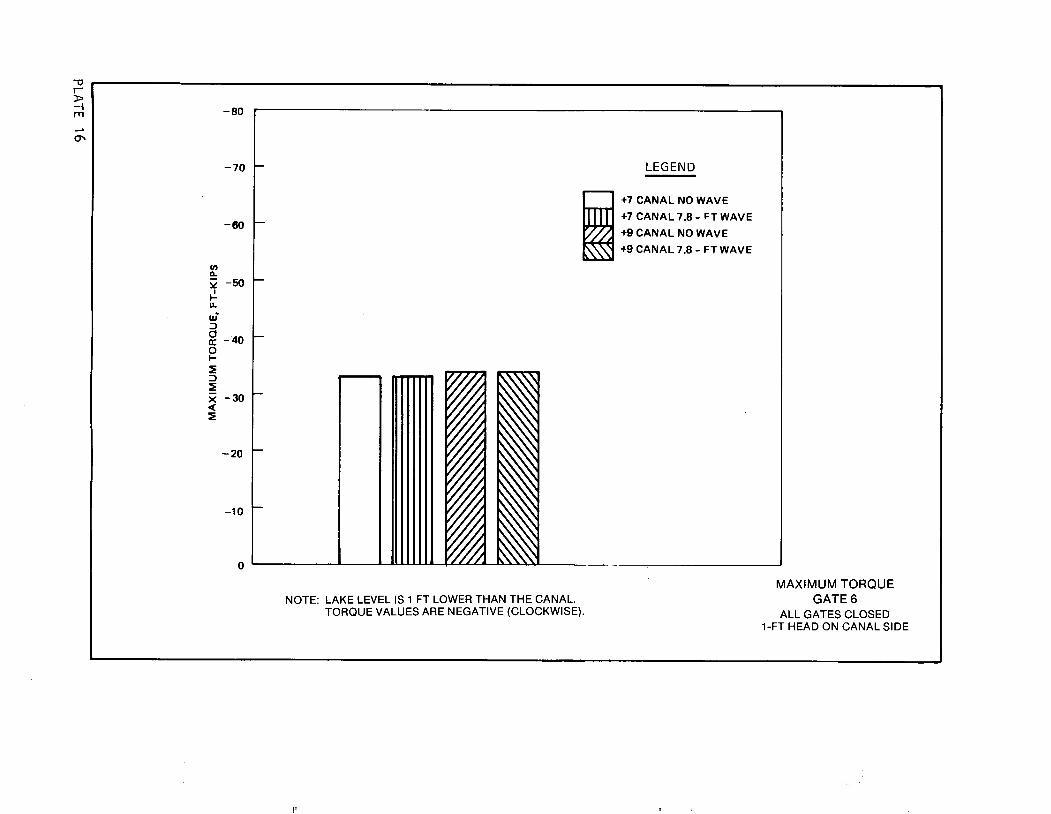
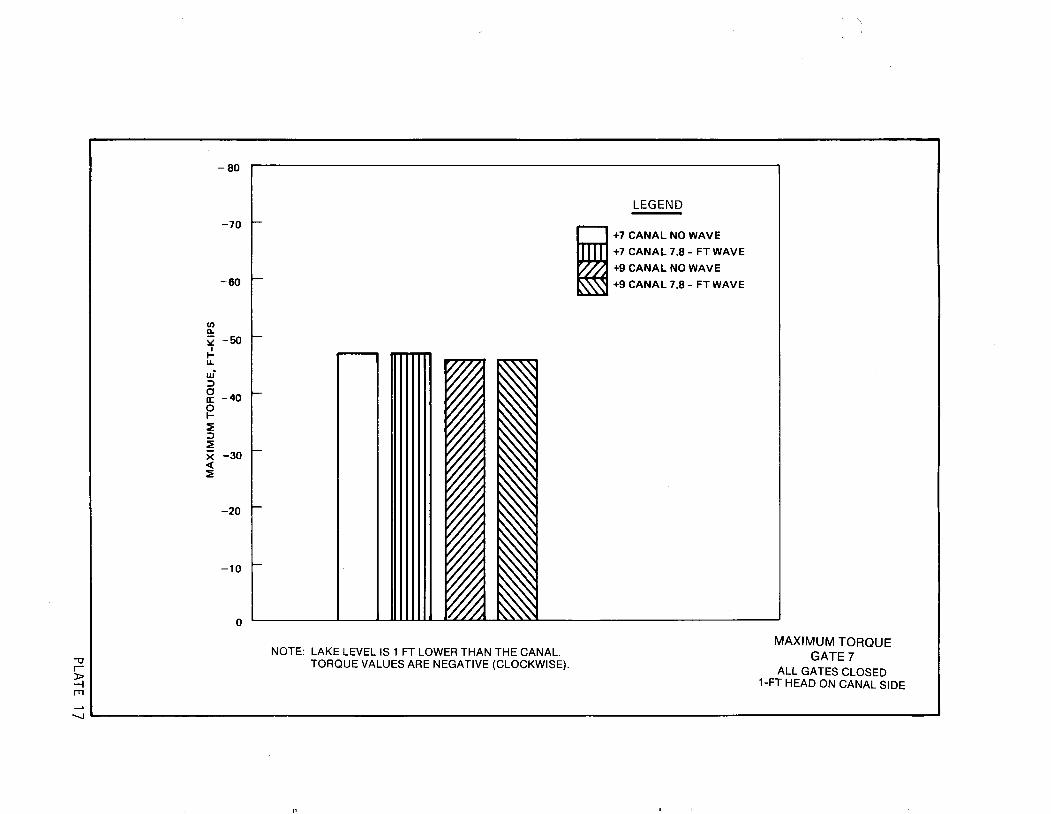
18. Torque measurements on all eight gate trunnions with all gates in
the closed position and a head differential of 1 ft between the outfall canal
20

LAKESIDE
STOP
PIER ( PIER TORQUE +
PUMP SIDE
Figure 19. Sign convention. Counterclockwise is positive. Note: Angle of closure is measured from the stop
and the lake were obtained simultaneously for water levels in the canal of
el +7 and el +9. This test determined the amount of torque developed with
1 ft of head differential and was essential in the design of a dampening
device. Torques were obtained without waves and with waves having a period
of 7.3 sec and a height of 7.8 ft from the north-northwest direction.
Plates 11-18 show the maximum torques (clockwise direction) measured on each
of the eight trunnions during these four test conditions.
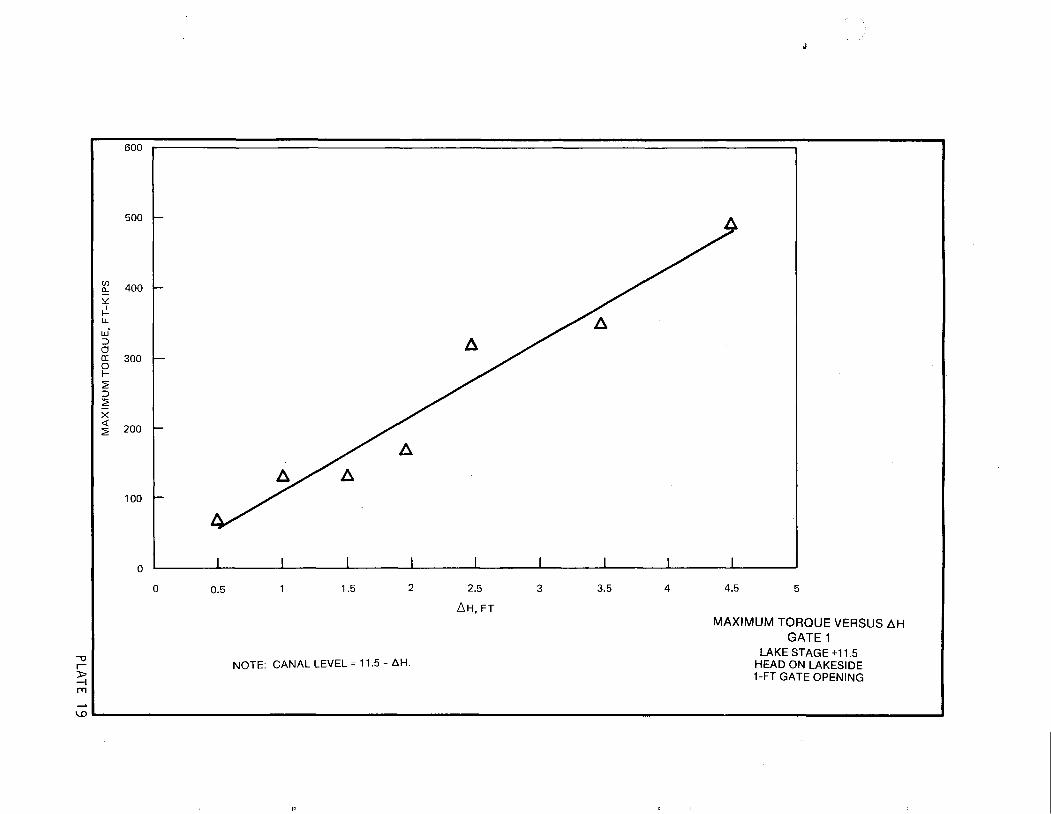
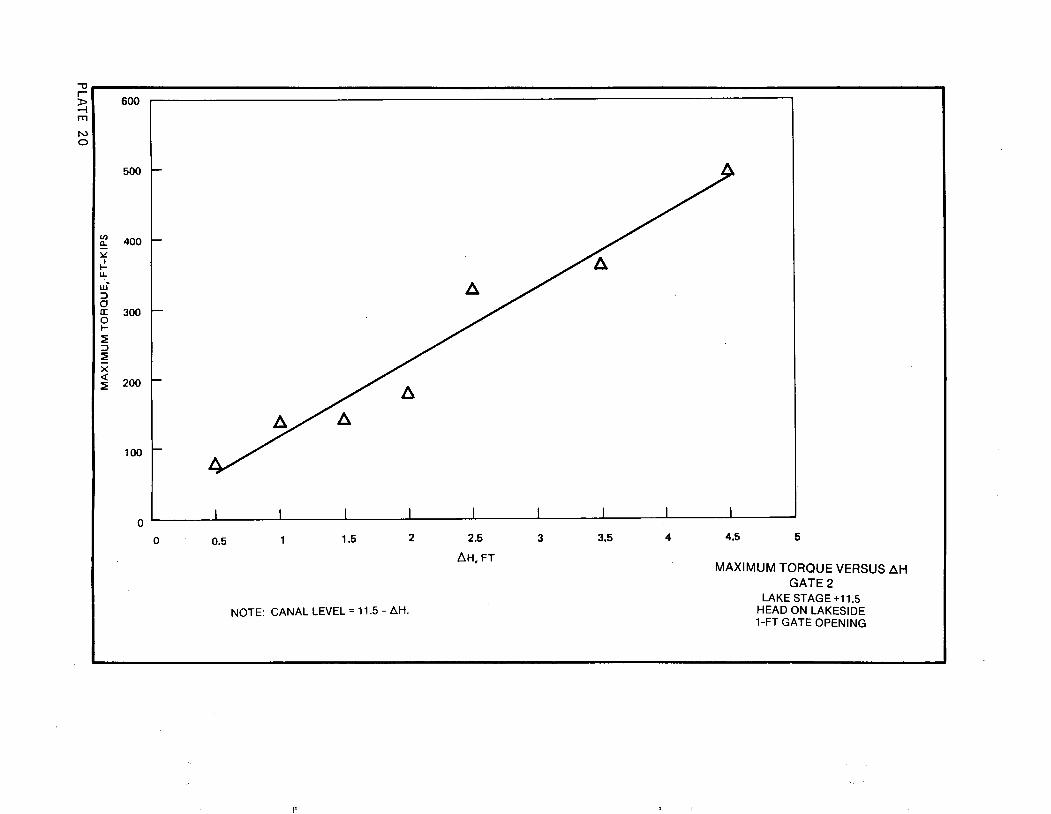
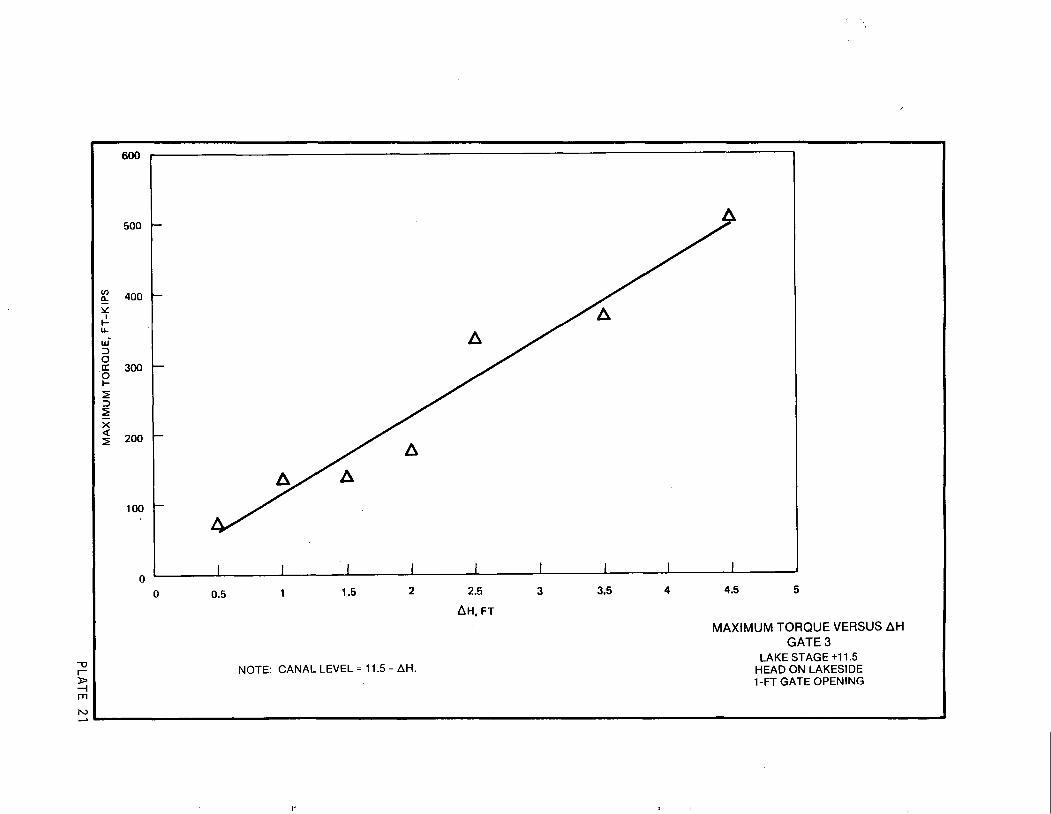
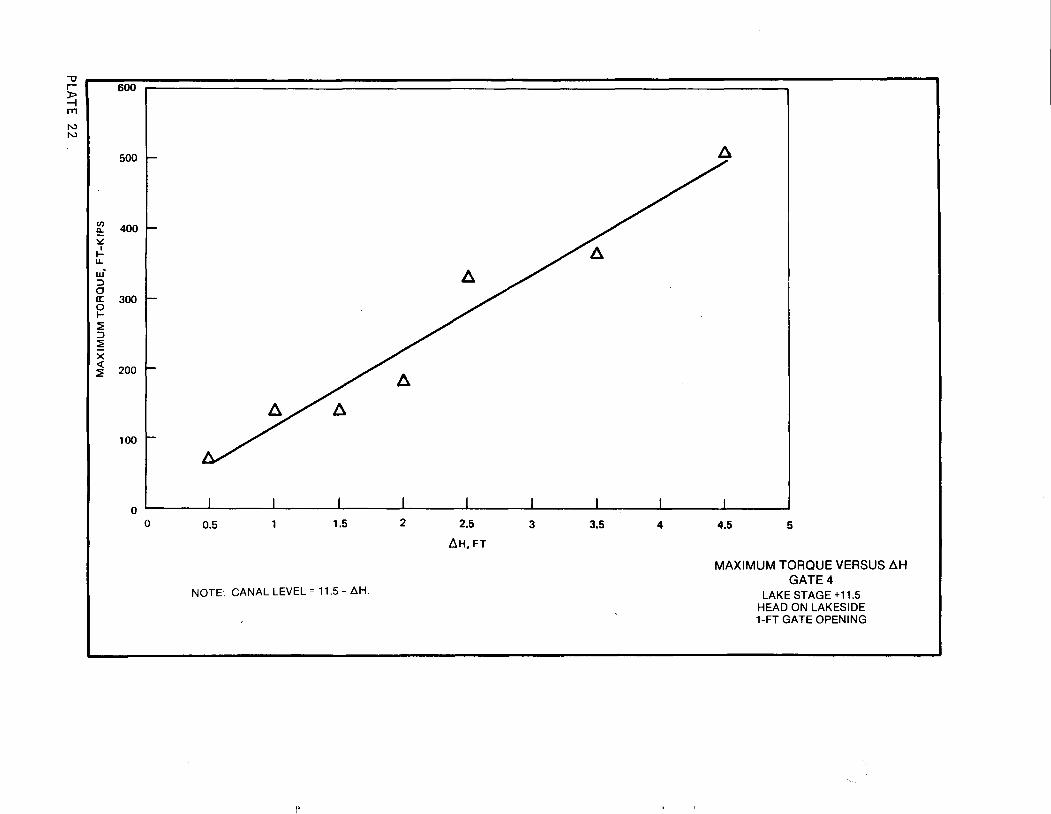
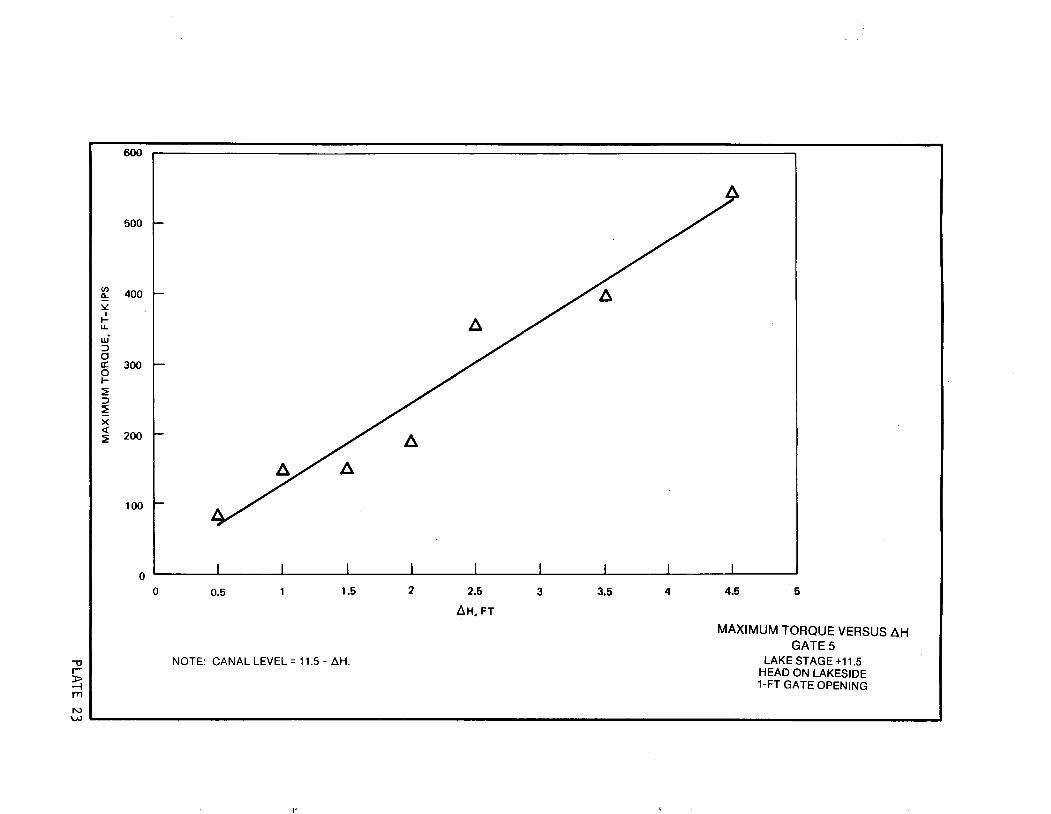
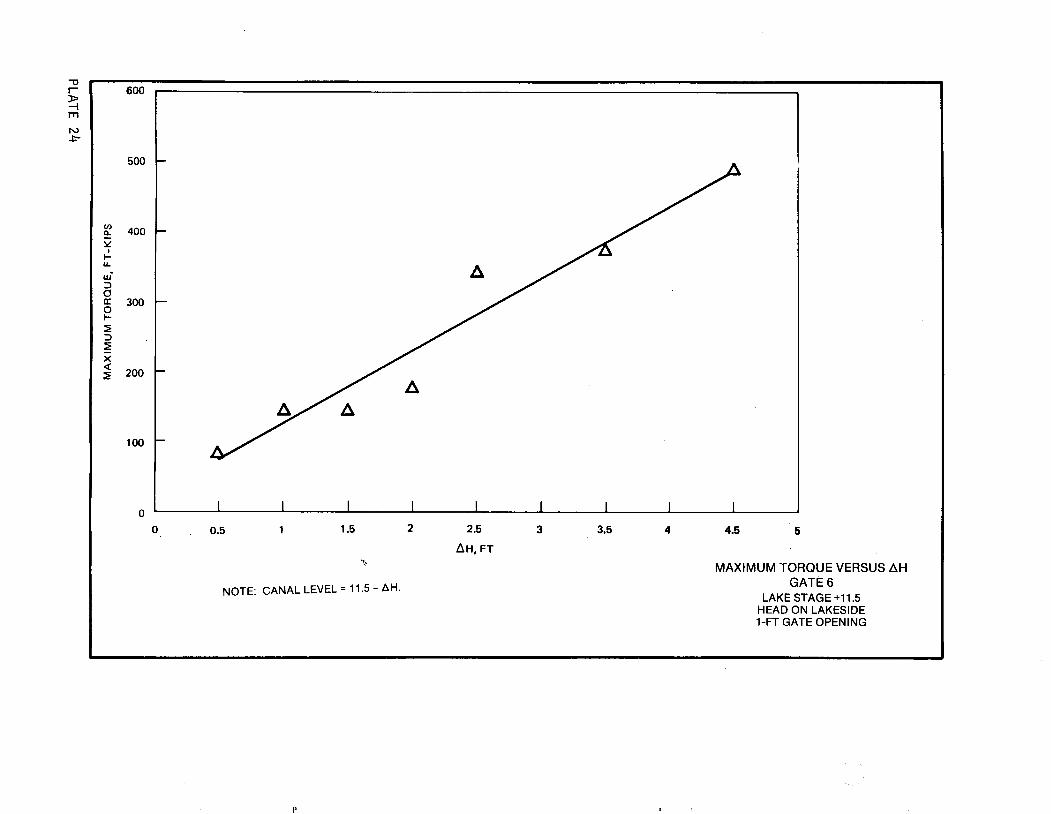
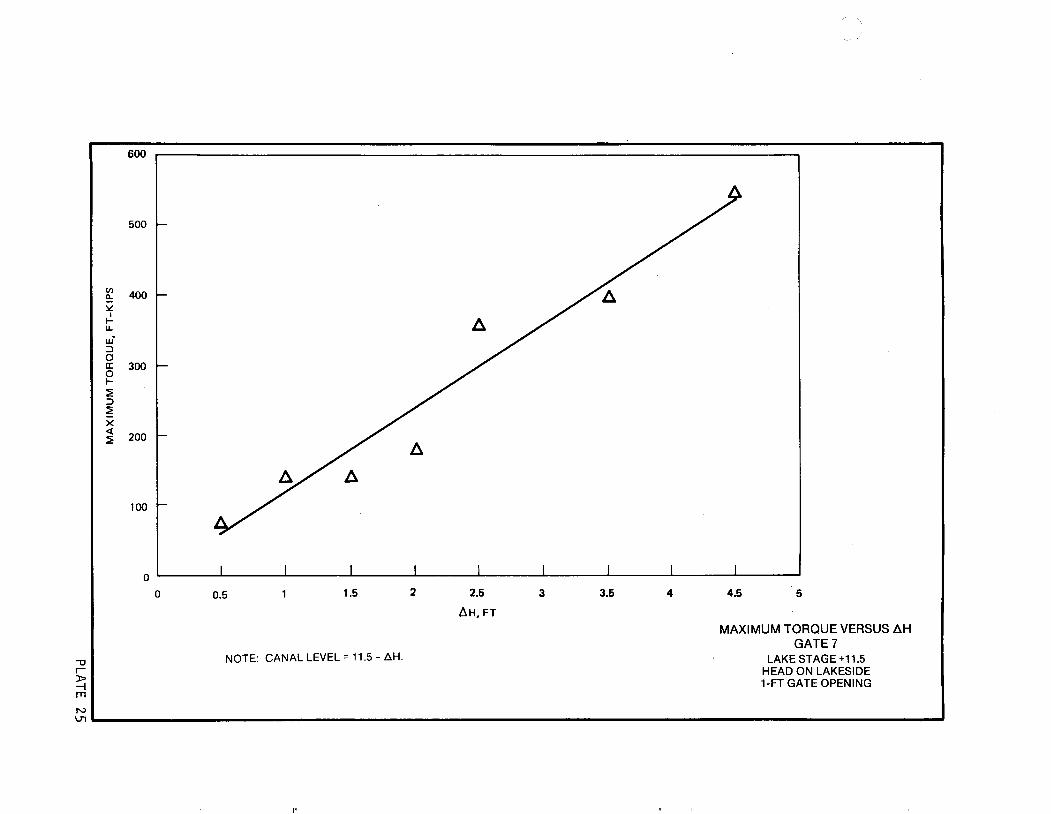
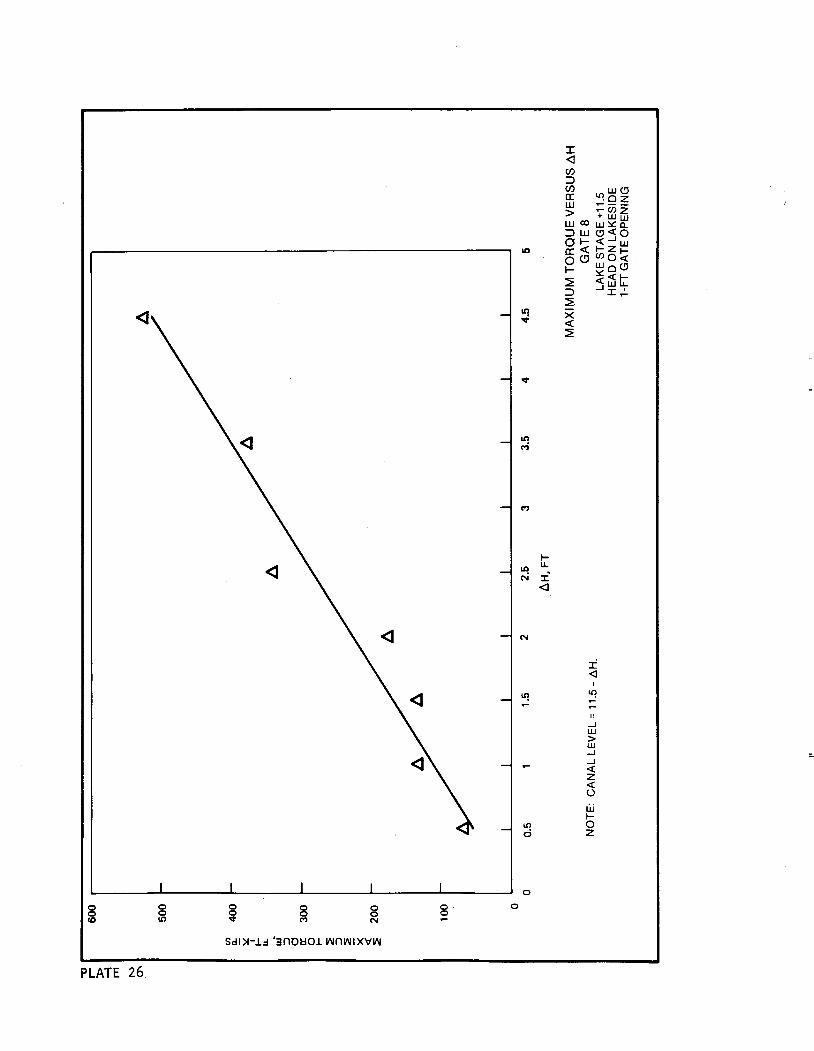
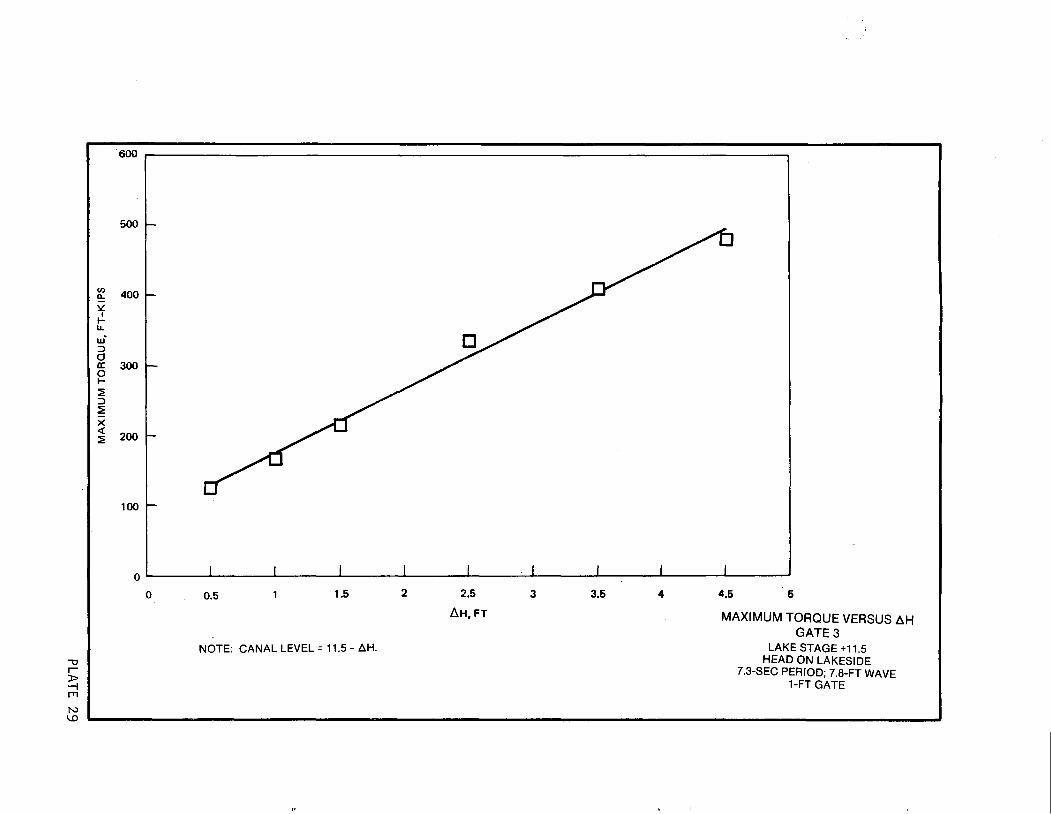
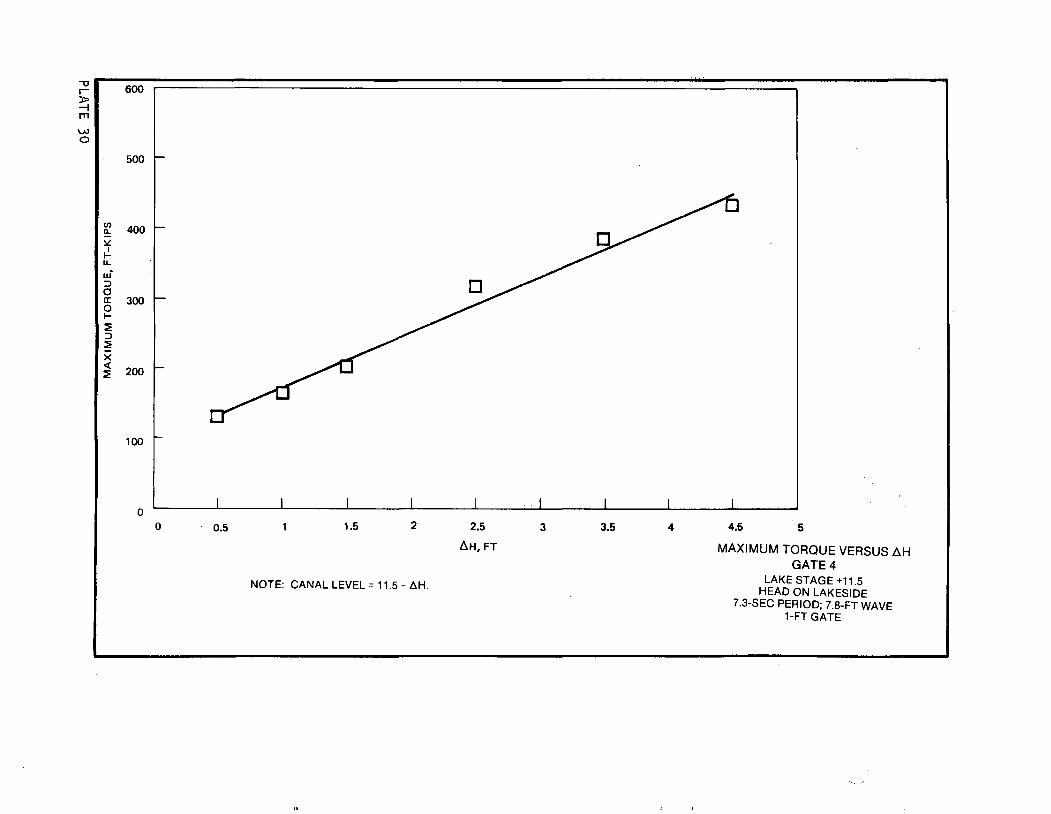
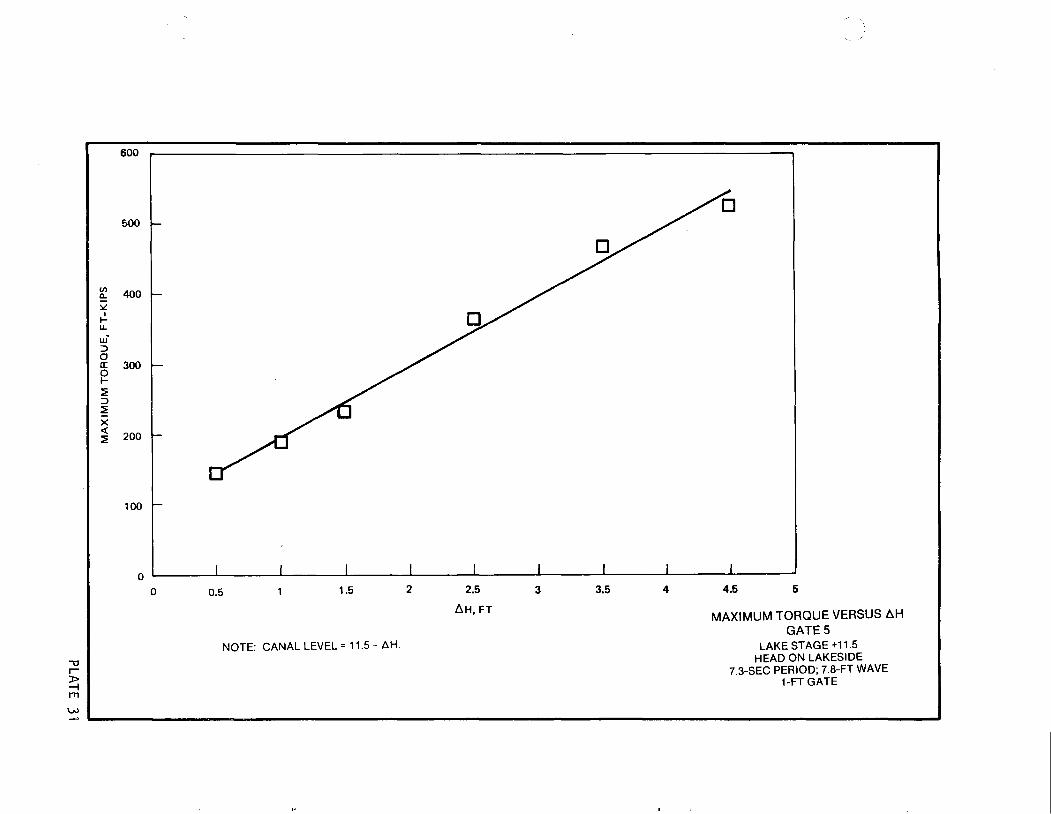
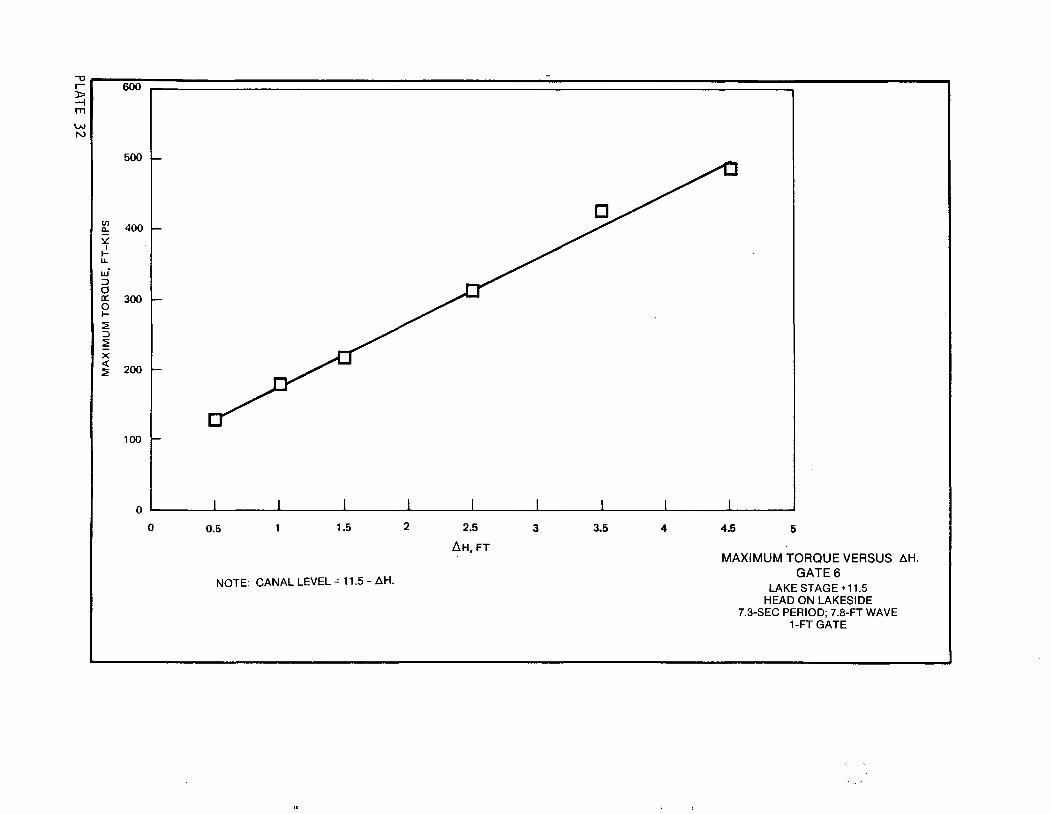
19. Results of tests to measure torque (counterclockwise direction)
versus head differential ~H with flow from the lake to the canal, a lake
elevation of +11.5 ft, and a I-ft gate opening (measured from the side of the
pier to the side of the gate) are presented in Plates 19-26. These tests
simulated the amount of torque to be absorbed by the dampening device with the
gates in a stationary position; however, the effects of the dynamic forces
developed as the gates slammed into the closed position are not included in
the data. A least squares fit of the data presented in the plots indicates a
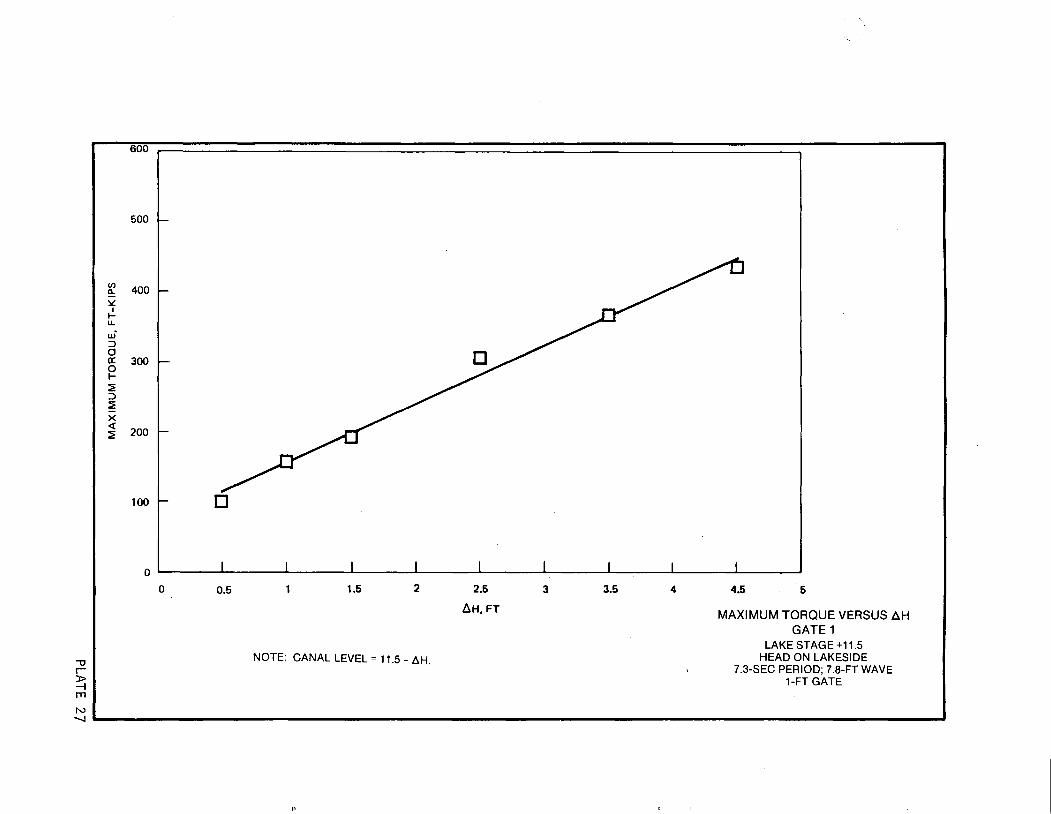
linear relation between torque and head differential. Plates 27-34 present
21
results of similar test conditions with 7.3-sec-period and 7.8-ft-high waves
generated from the north-northwest. Waves from this direction had more impact
on the structure than the other directions tested. Wave test results are
published in Bottin and Mize (1987).*
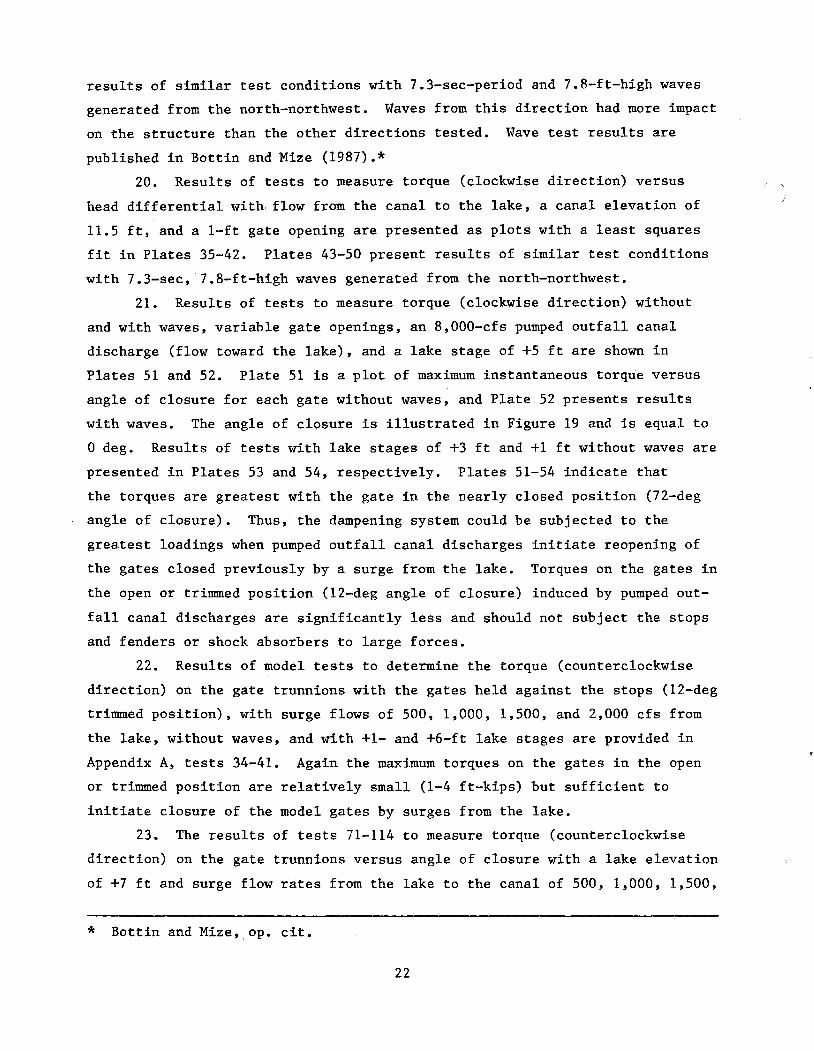
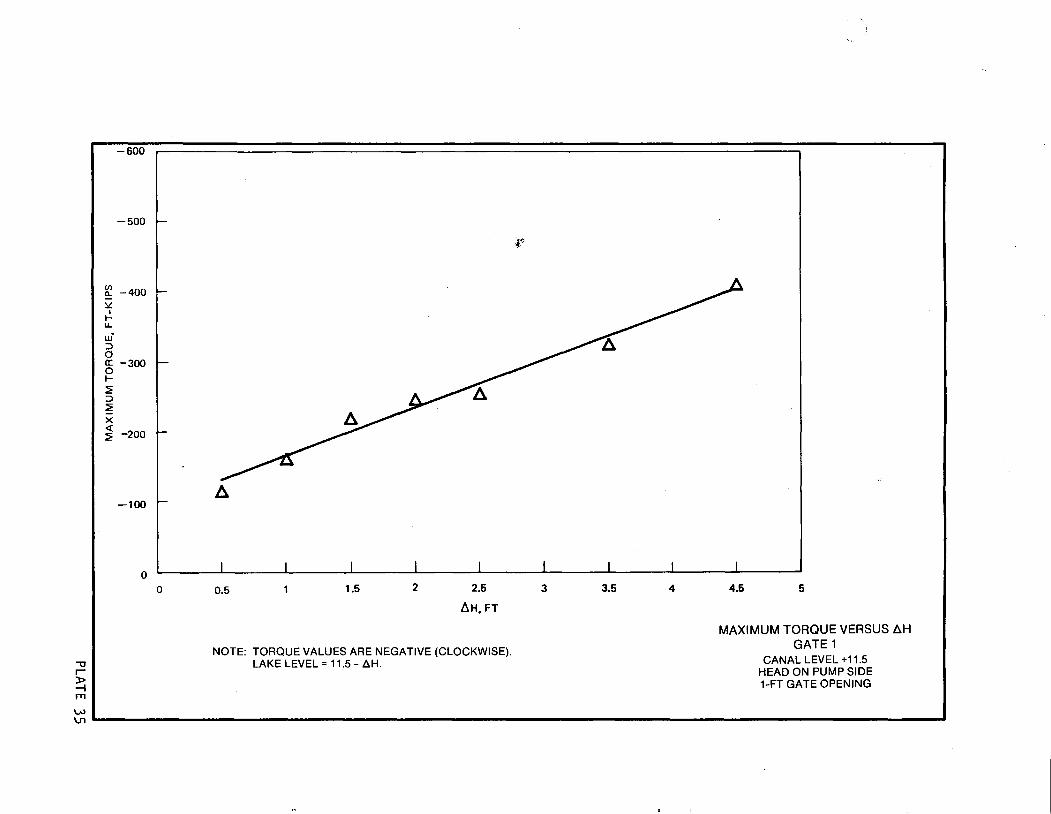
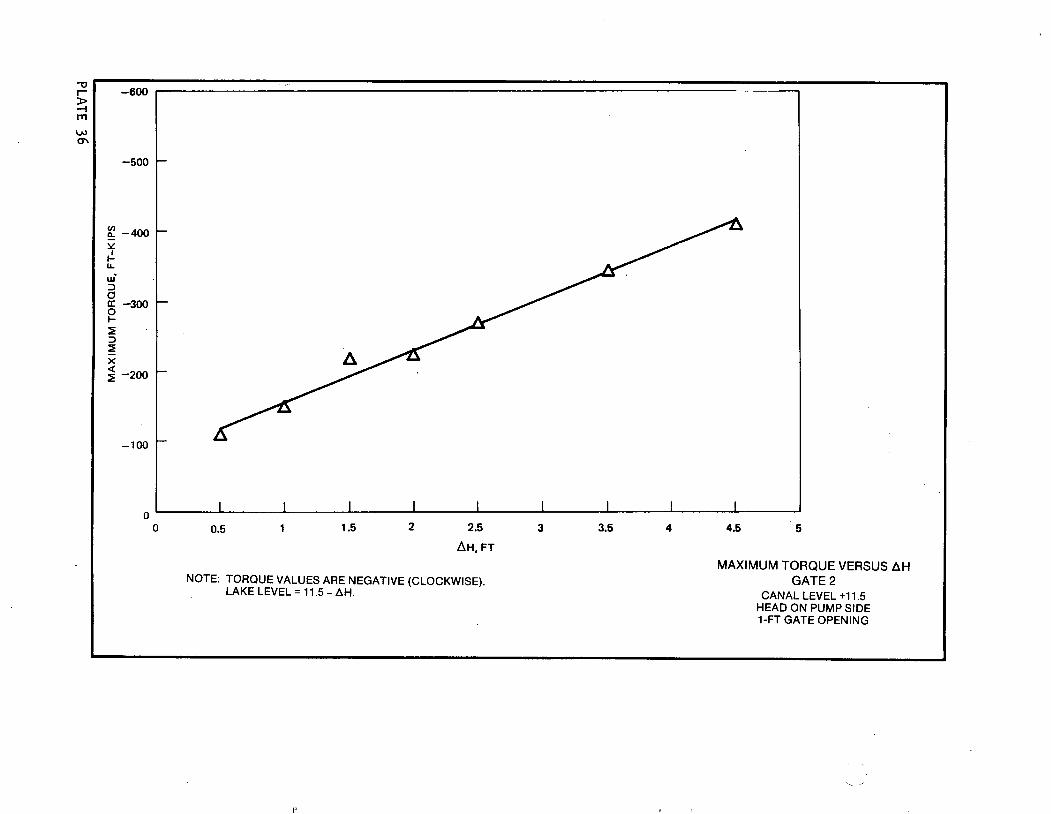
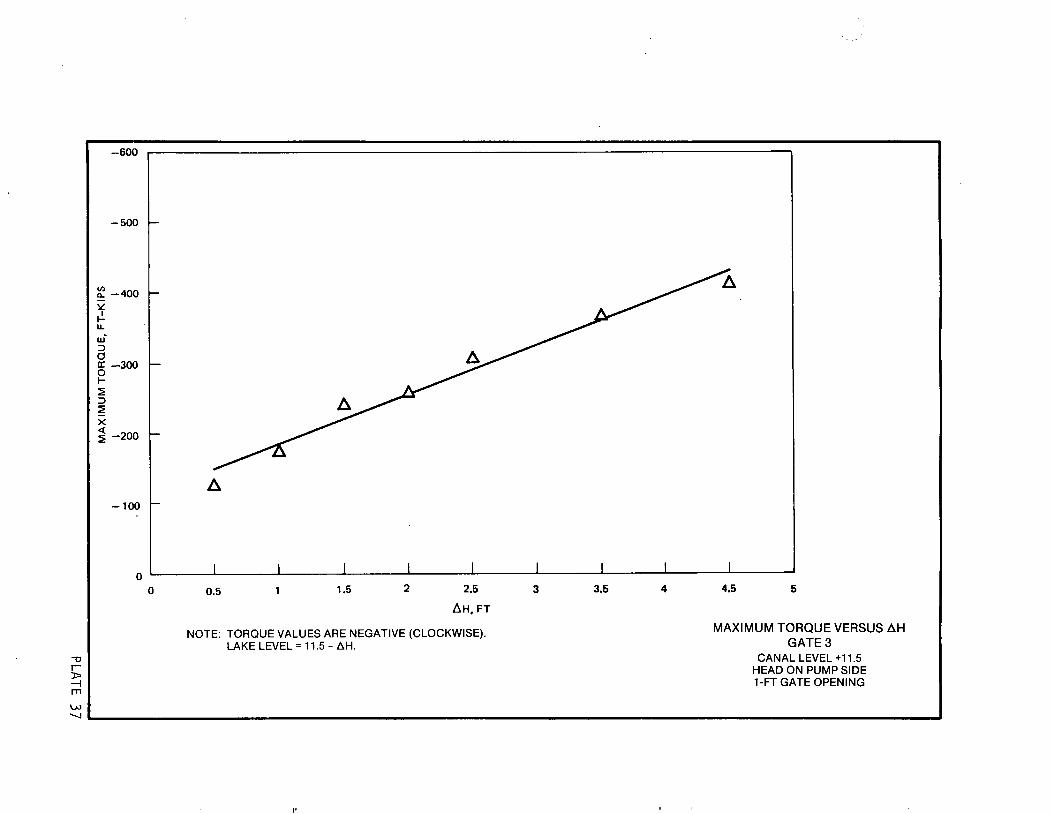
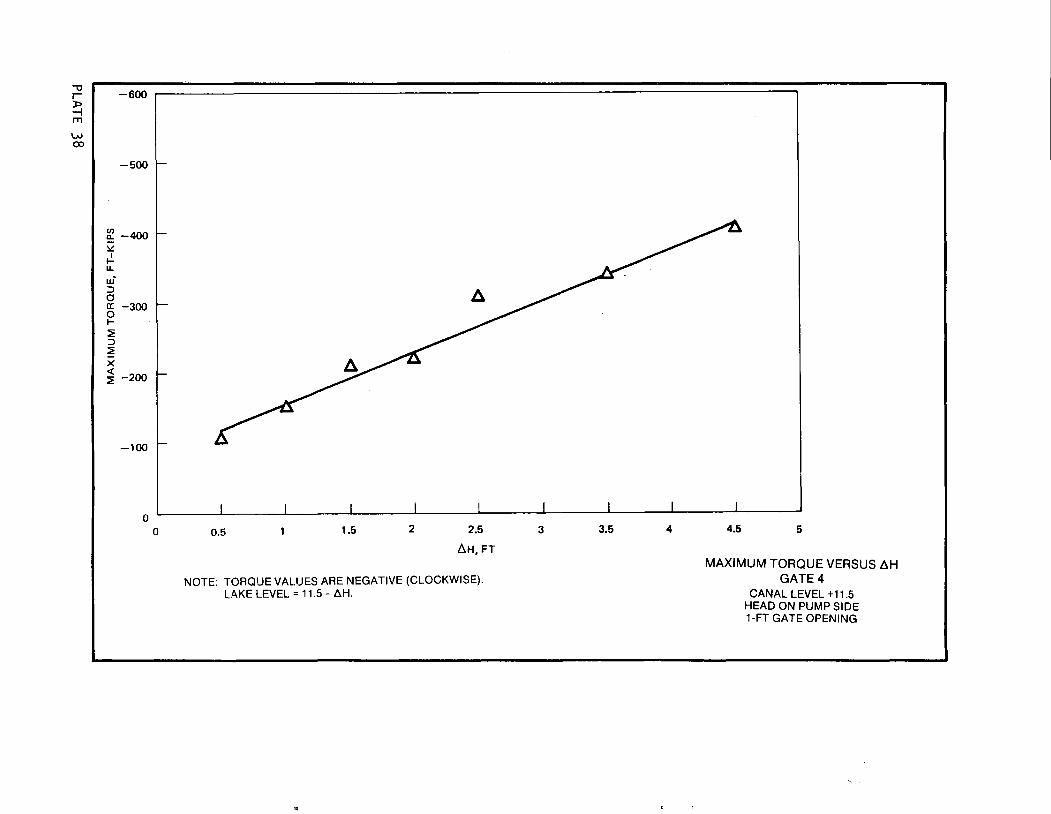
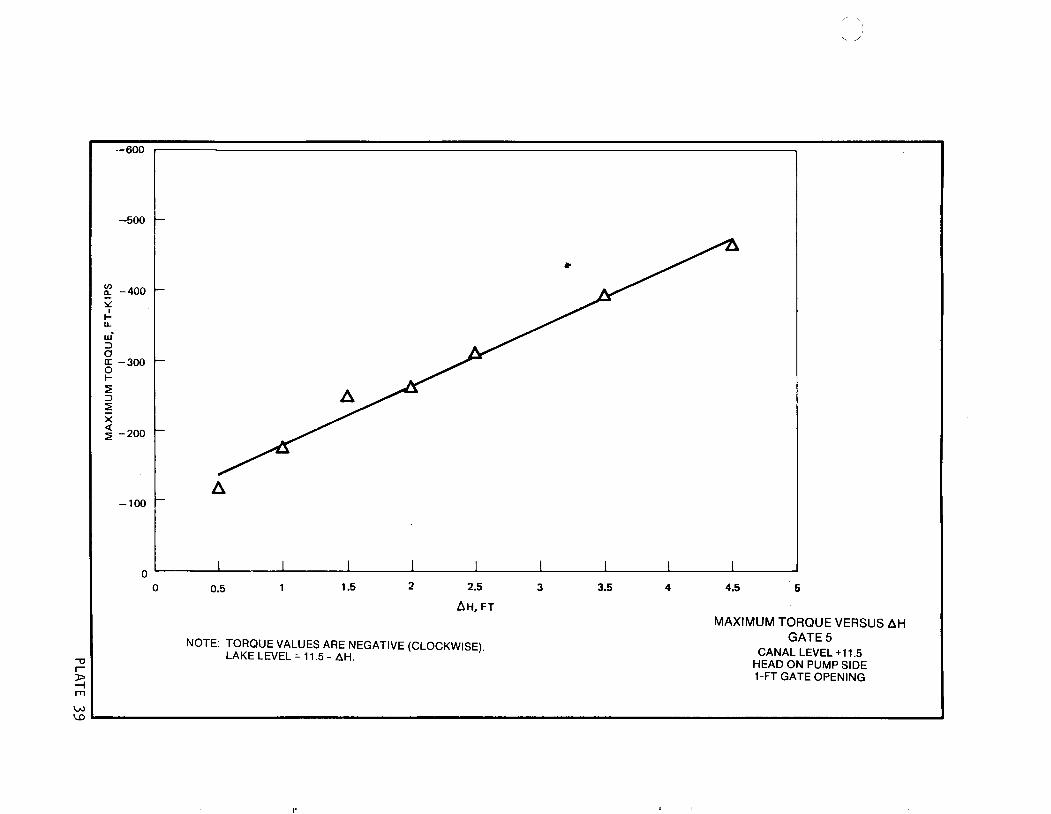
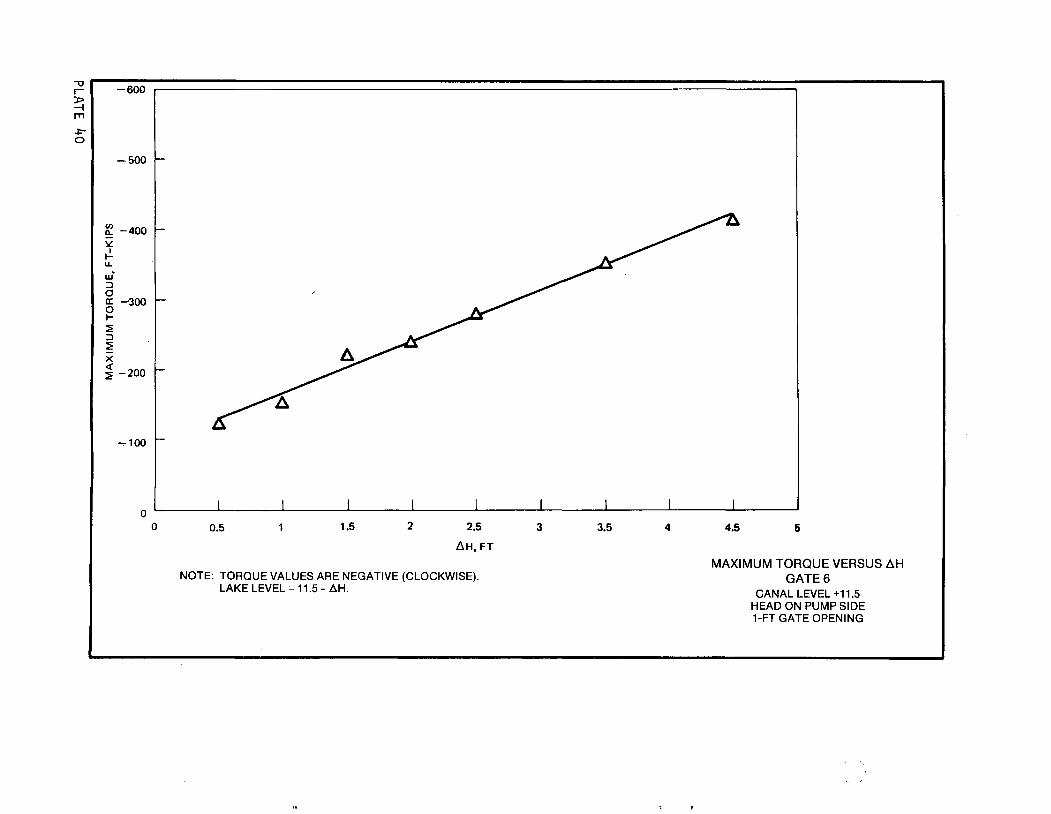
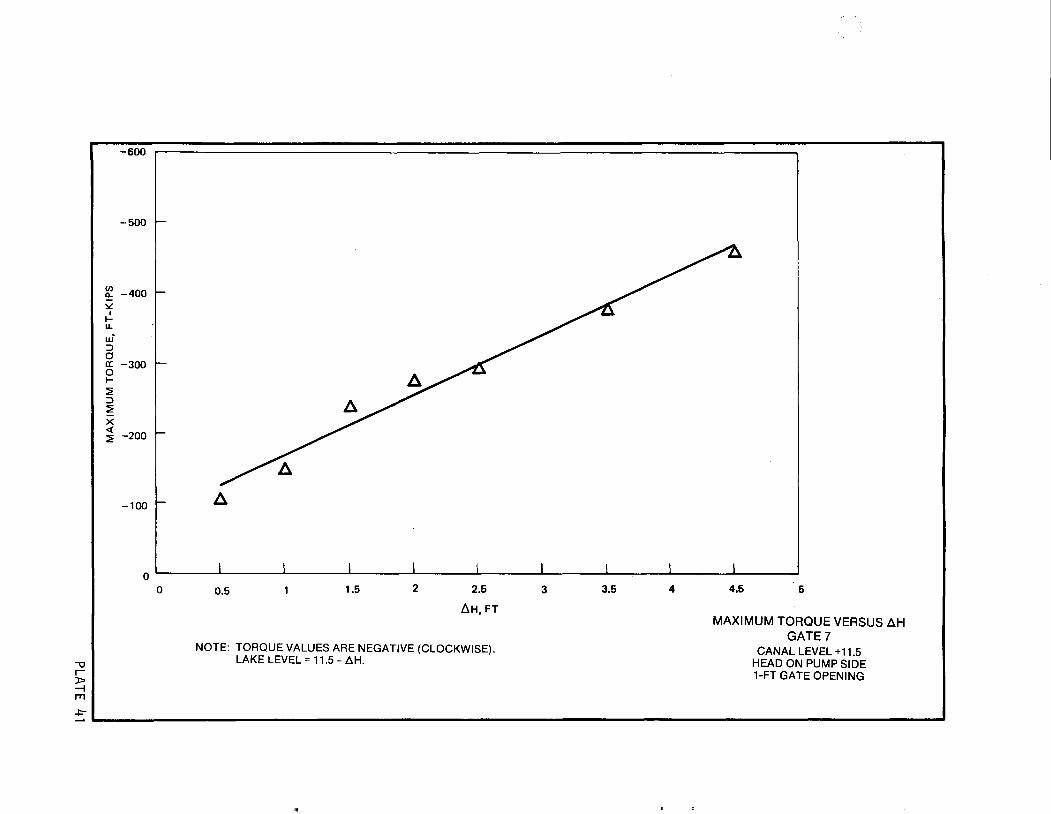
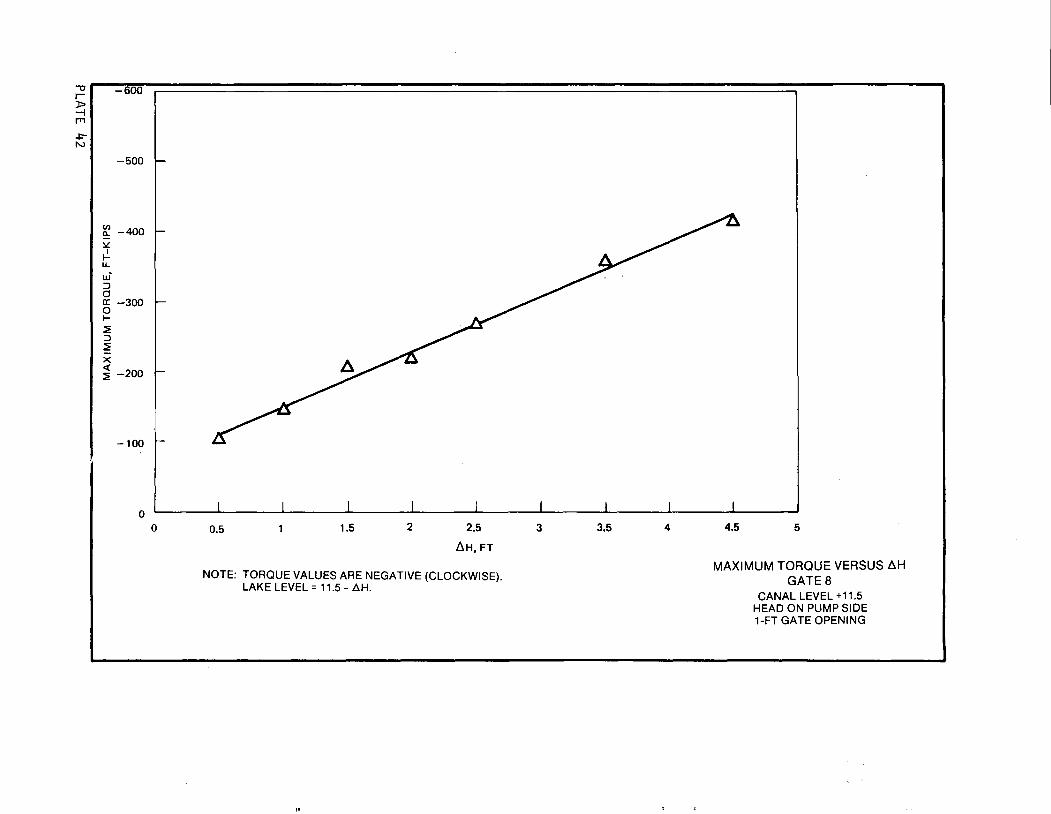
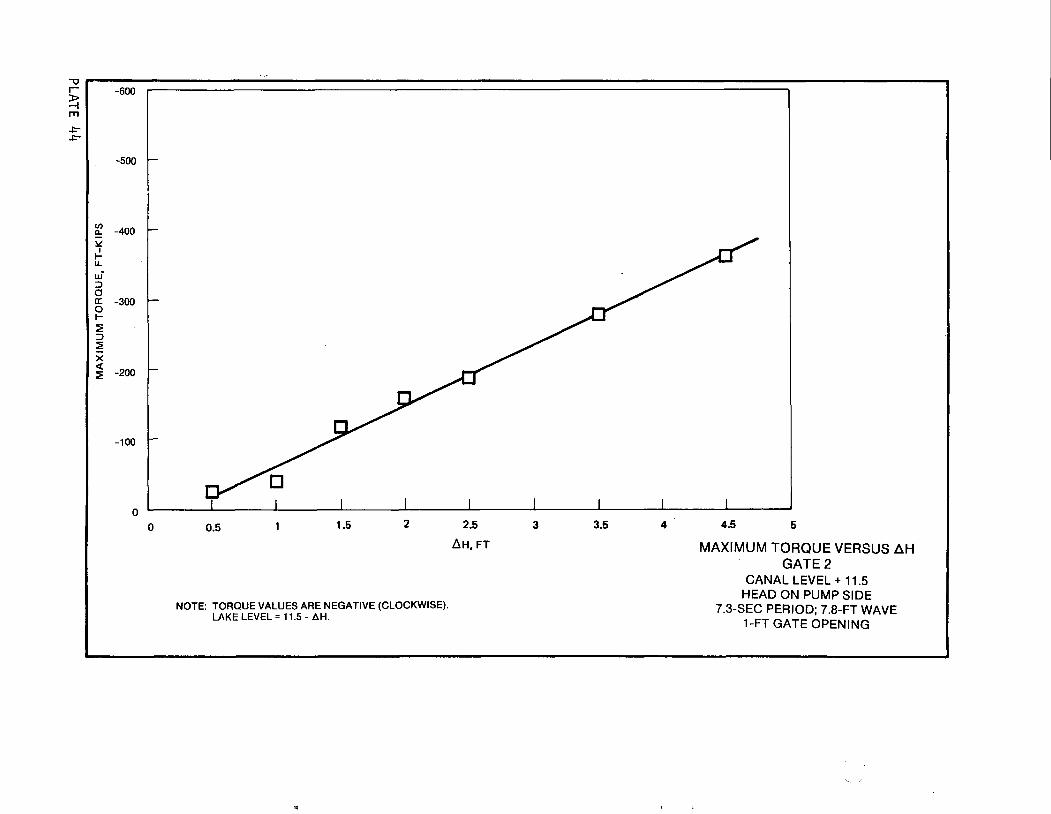
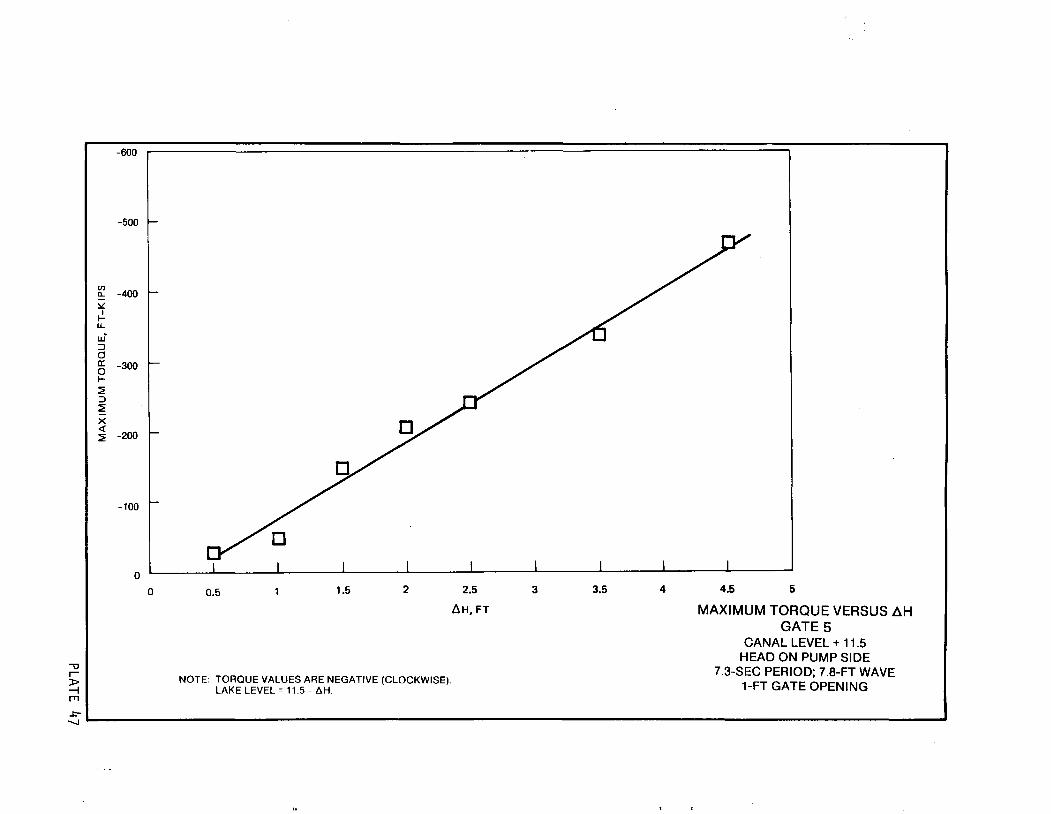
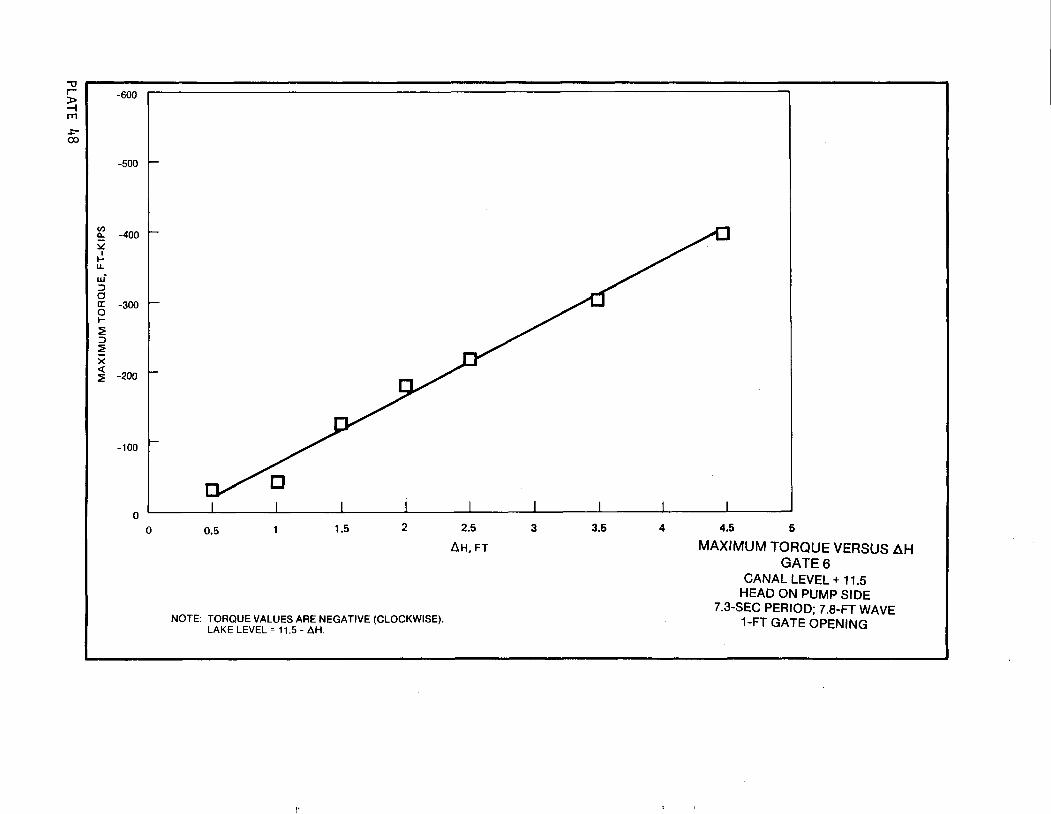
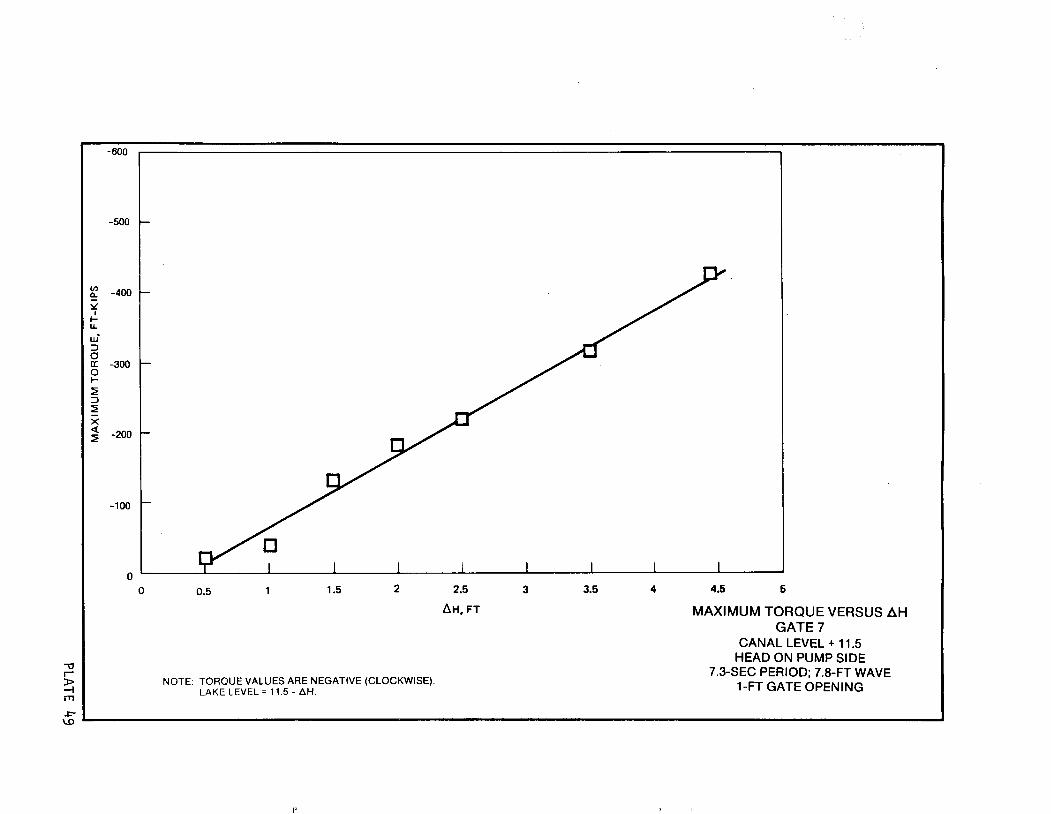
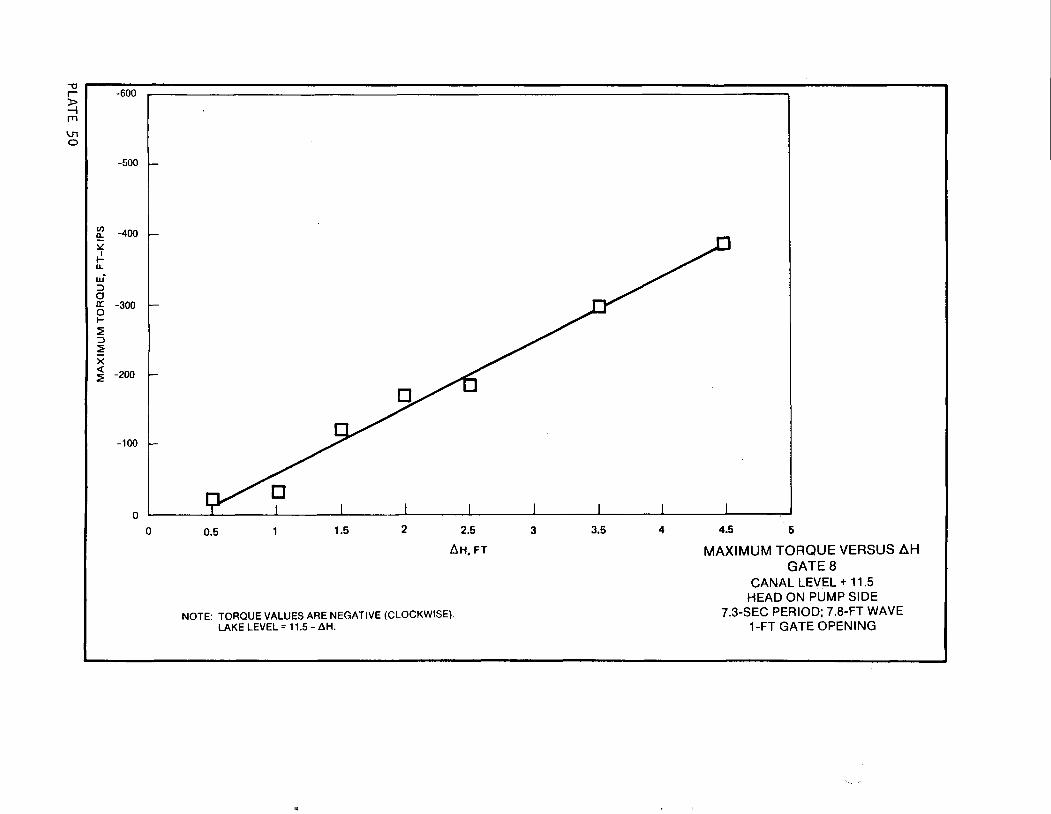
20. Results of tests to measure torque (clockwise direction) versus
head differential with flow from the canal to the lake, a canal elevation of
11.5 ft, and a 1-ft gate opening are presented as plots with a least squares
fit in Plates 35-42. Plates 43-50 present results of similar test conditions
with 7.3-sec, 7.8-ft-high waves generated from the north-northwest.
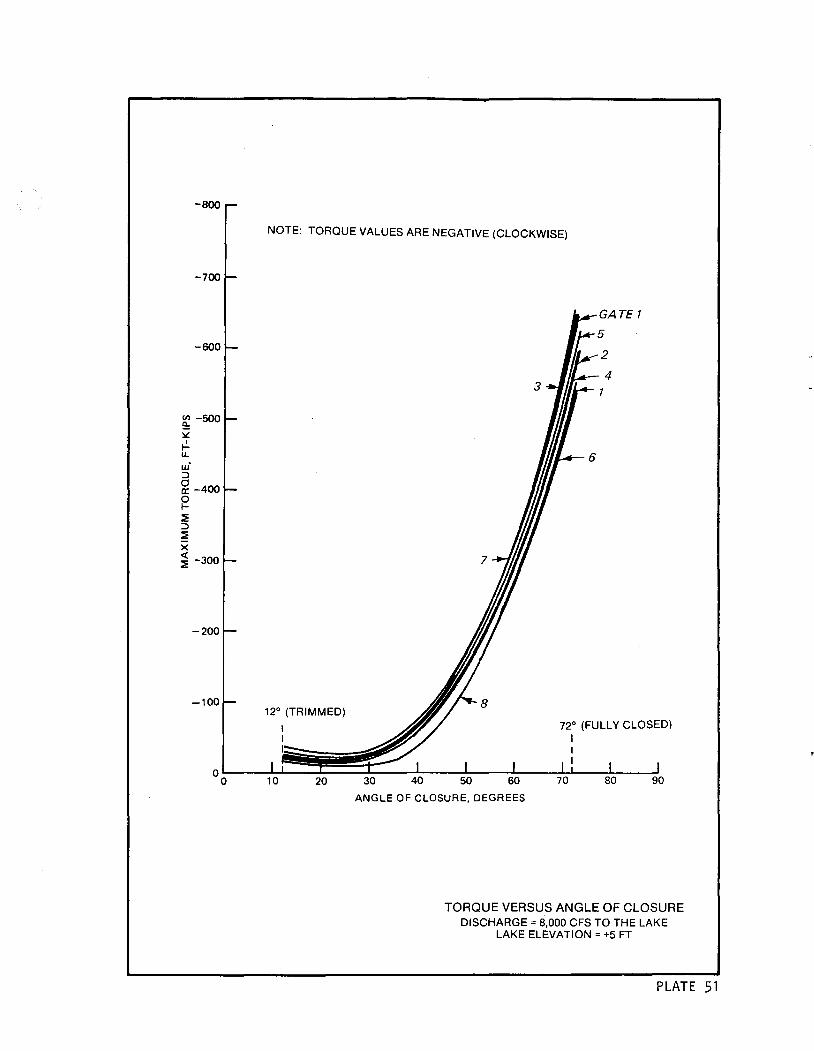
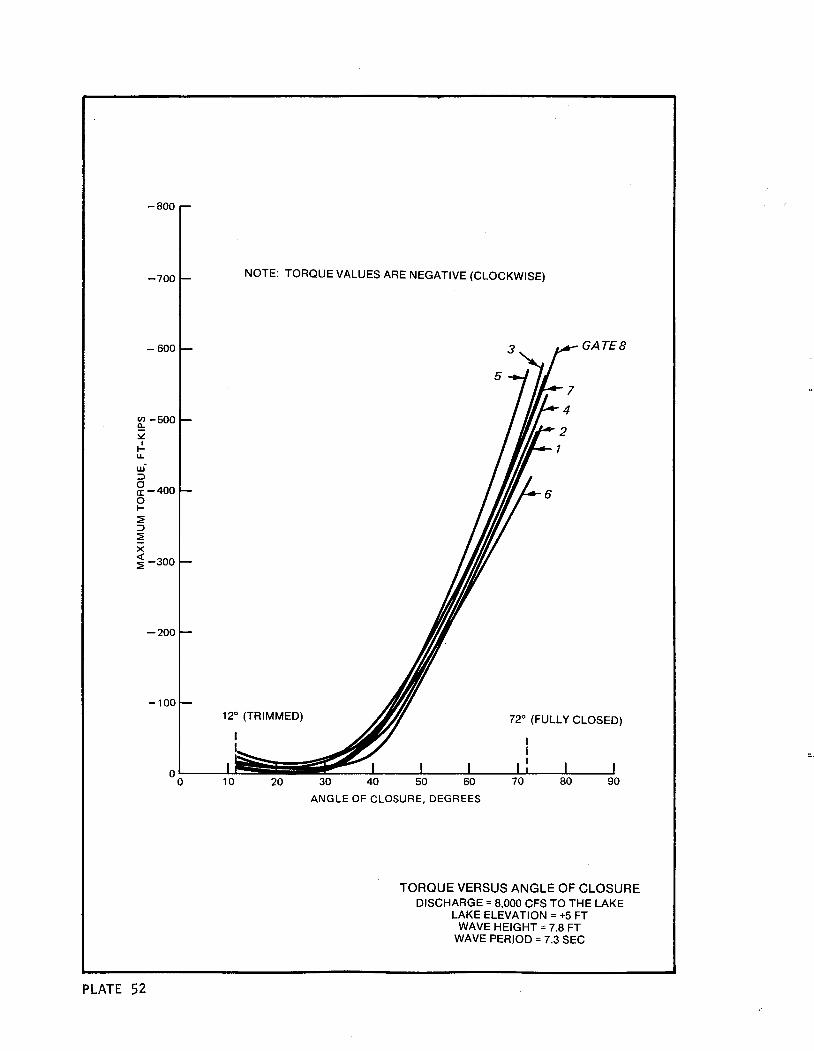
21. Results of tests to measure torque (clockwise direction) without
and with waves, variable gate openings, an 8,000-cfs pumped outfall canal
discharge (flow toward the lake), and a lake stage of +5 ft are shown in
Plates 51 and 52. Plate 51 is a plot of maximum instantaneous torque versus
angle of closure for each gate without waves, and Plate 52 presents results
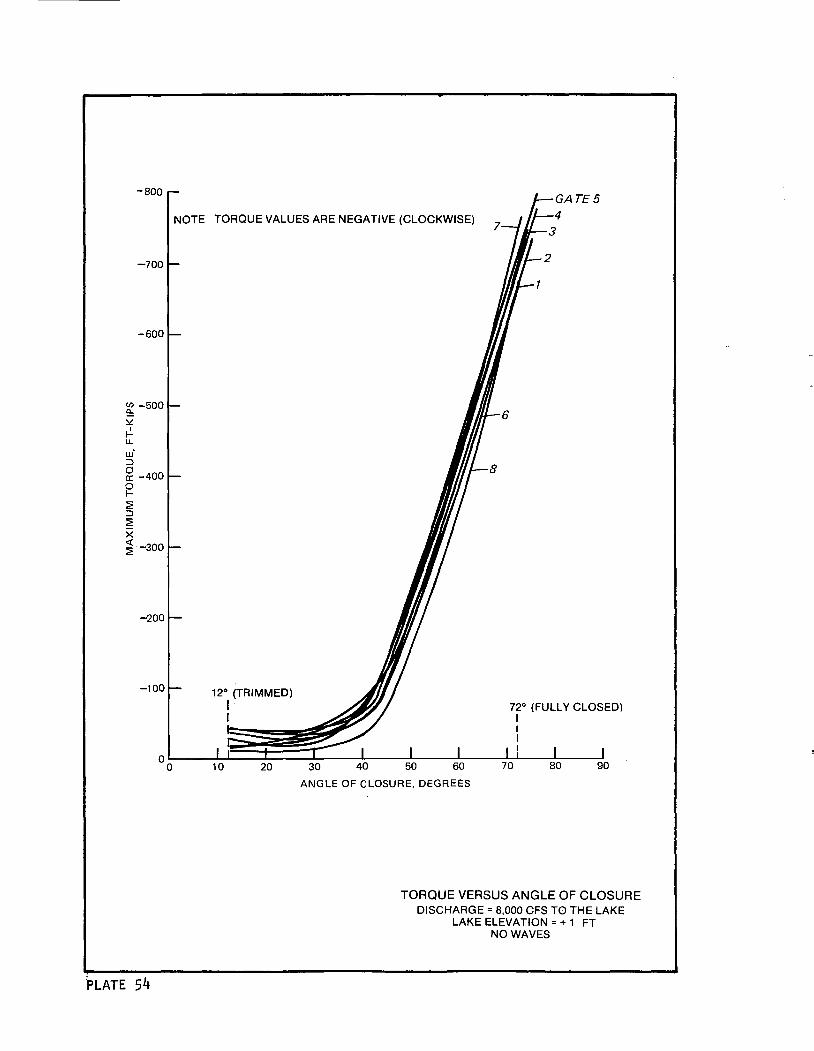
with waves. The angle of closure is illustrated in Figure 19 and is equal to
o deg. Results of tests with lake stages of +3 ft and +1 ft without waves are
presented in Plates 53 and 54, respectively. Plates 51-54 indicate that
the torques are greatest with the gate in the nearly closed position (72-deg
angle of closure). Thus, the dampening system could be subjected to the
greatest loadings when pumped outfall canal discharges initiate reopening of
the gates closed previously by a surge from the lake. Torques on the gates in
the open or trimmed position (12-deg angle of closure) induced by pumped out
fall canal discharges are significantly less and should not subject the stops
and fenders or shock absorbers to large forces.
22. Results of model tests to determine the torque (counterclockwise
direction) on the gate trunnions with the gates held against the stops (12-deg
trimmed position), with surge flows of 500, 1,000, 1,500, and 2,000 cfs from
the lake, without waves, and with +1- and +6-ft lake stages are provided in
Appendix A, tests 34-41. Again the maximum torques on the gates in the open
or trimmed position are relatively small (1-4 ft-kips) but sufficient to
initiate closure of the model gates by surges from the lake.
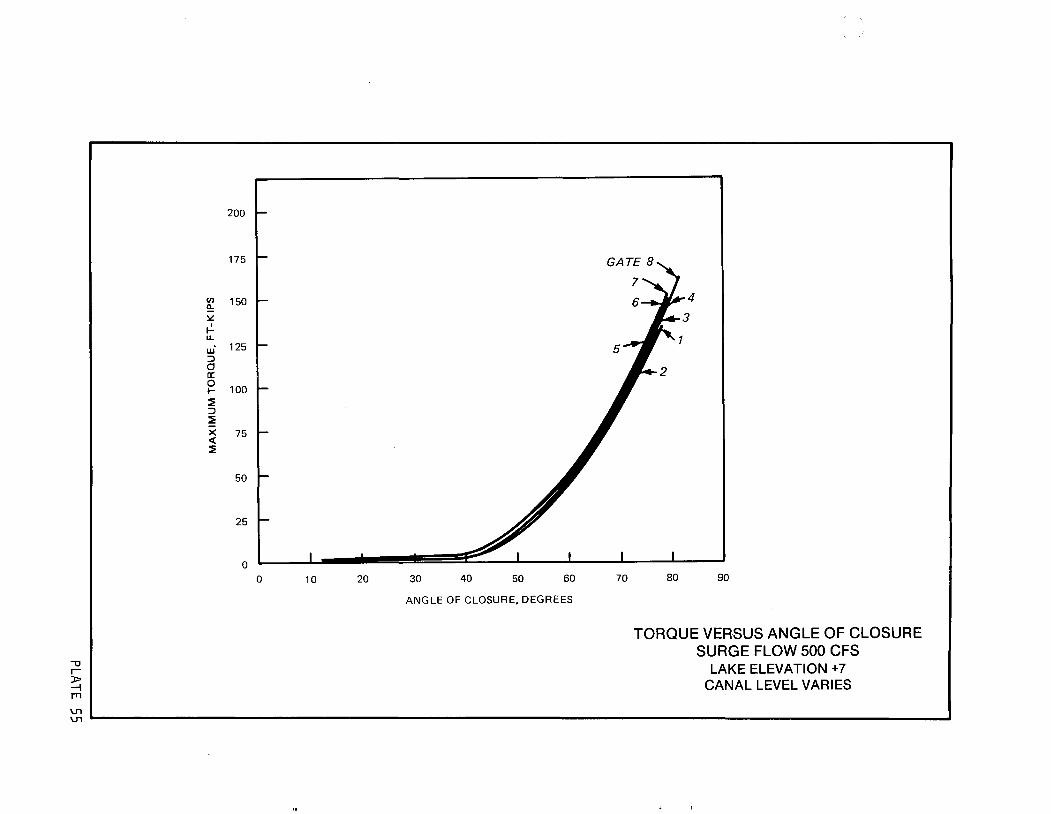
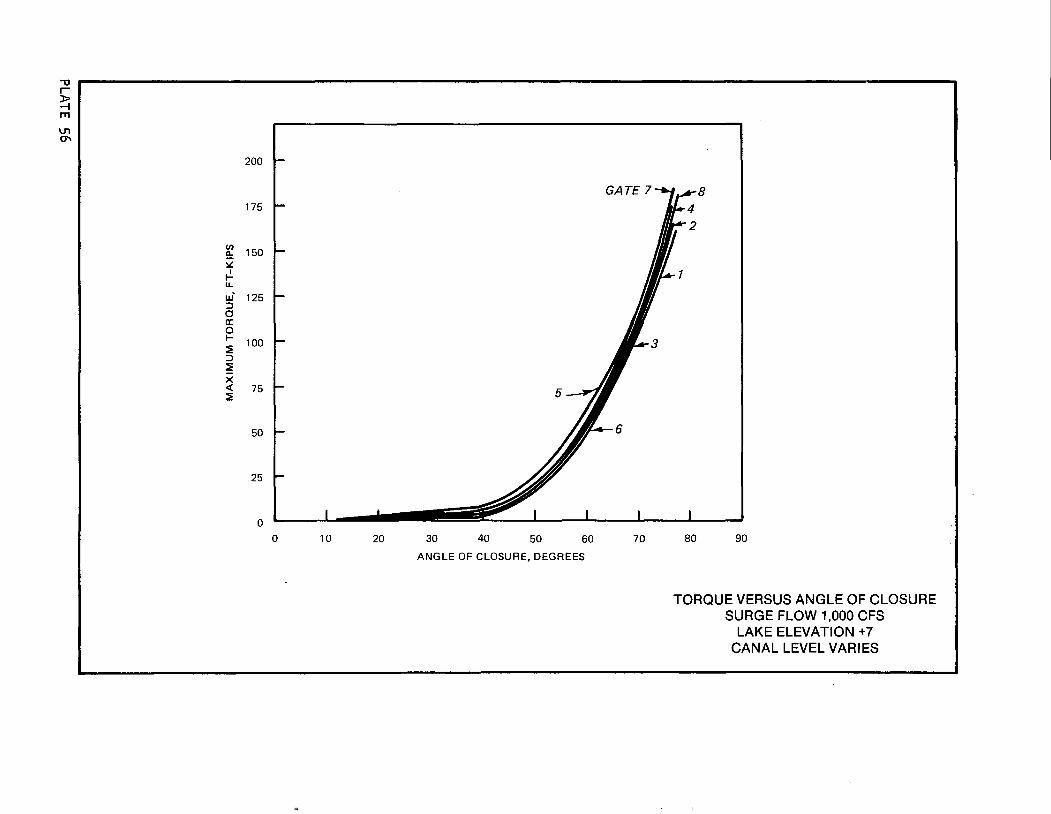
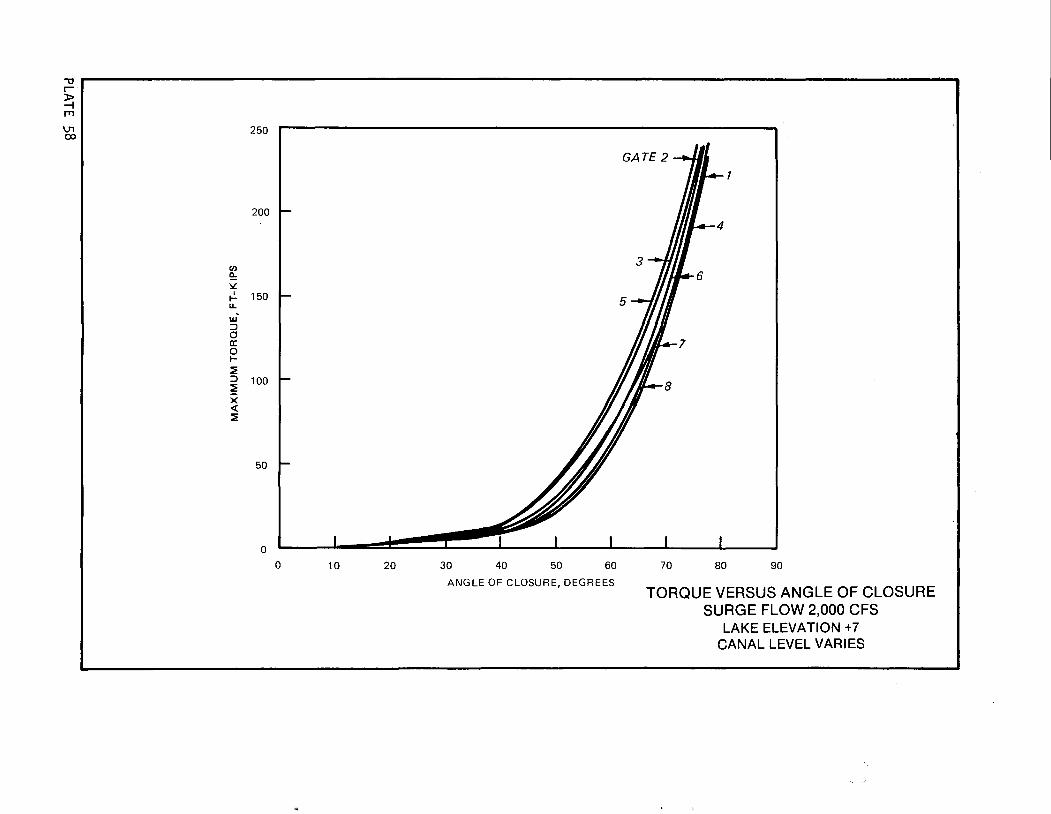
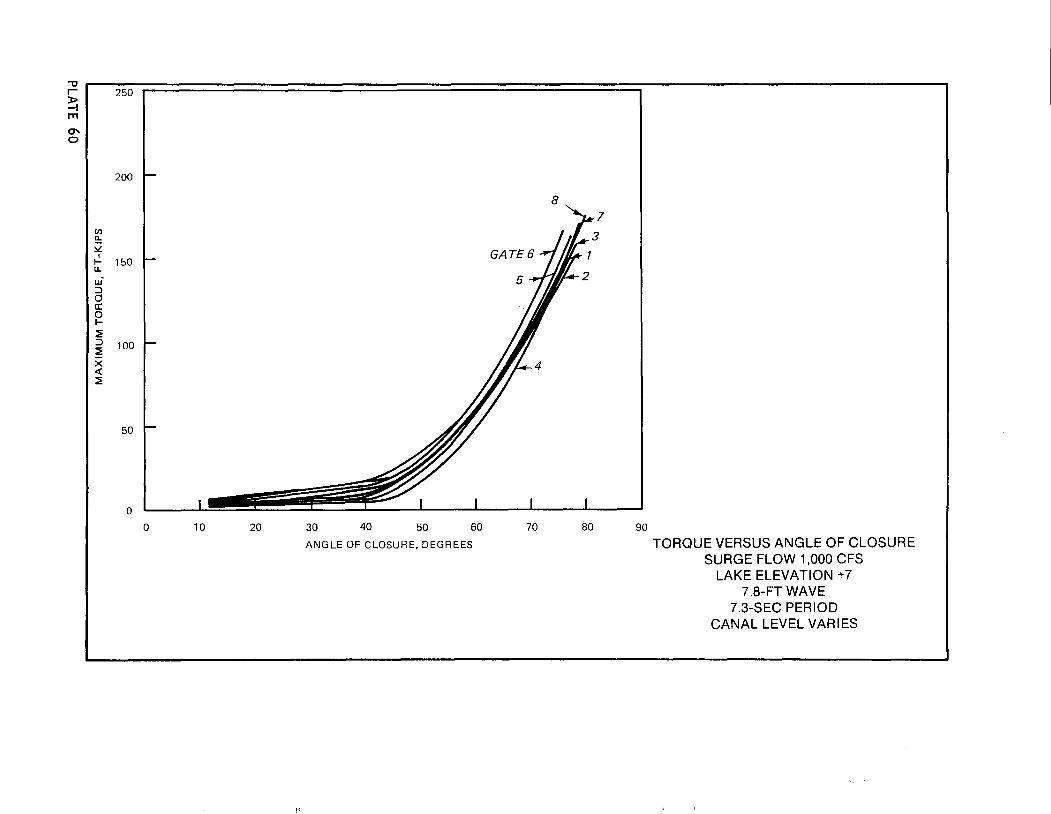
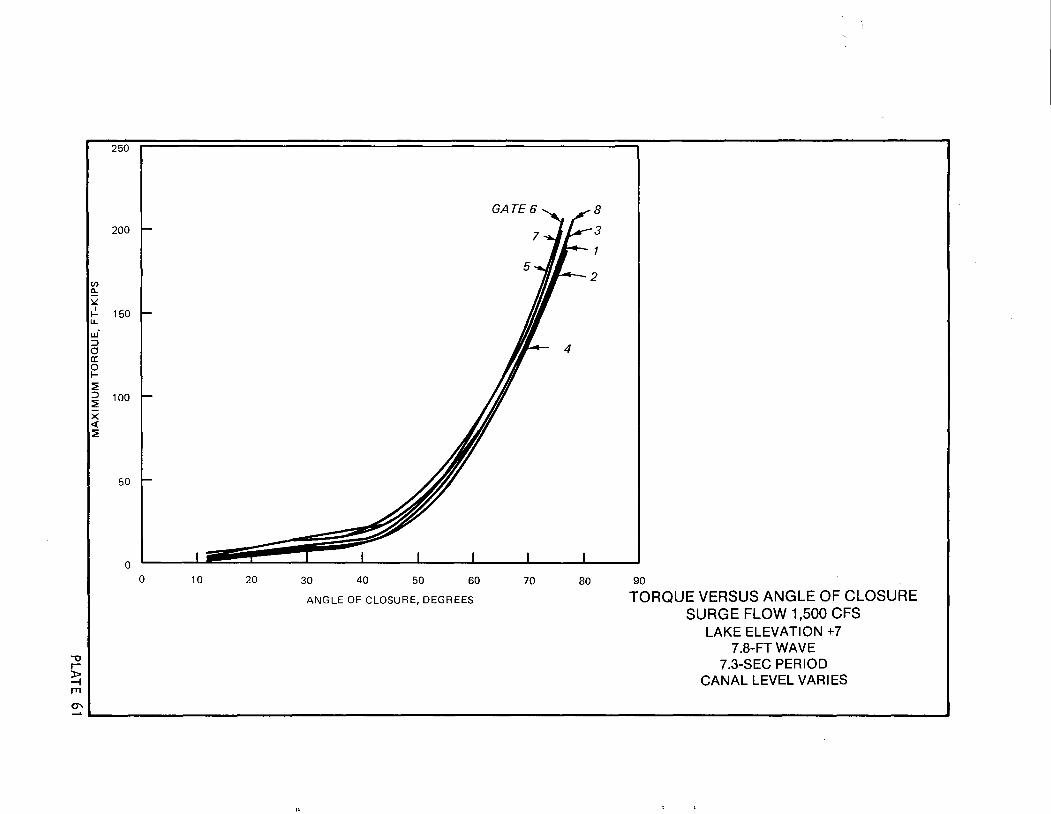
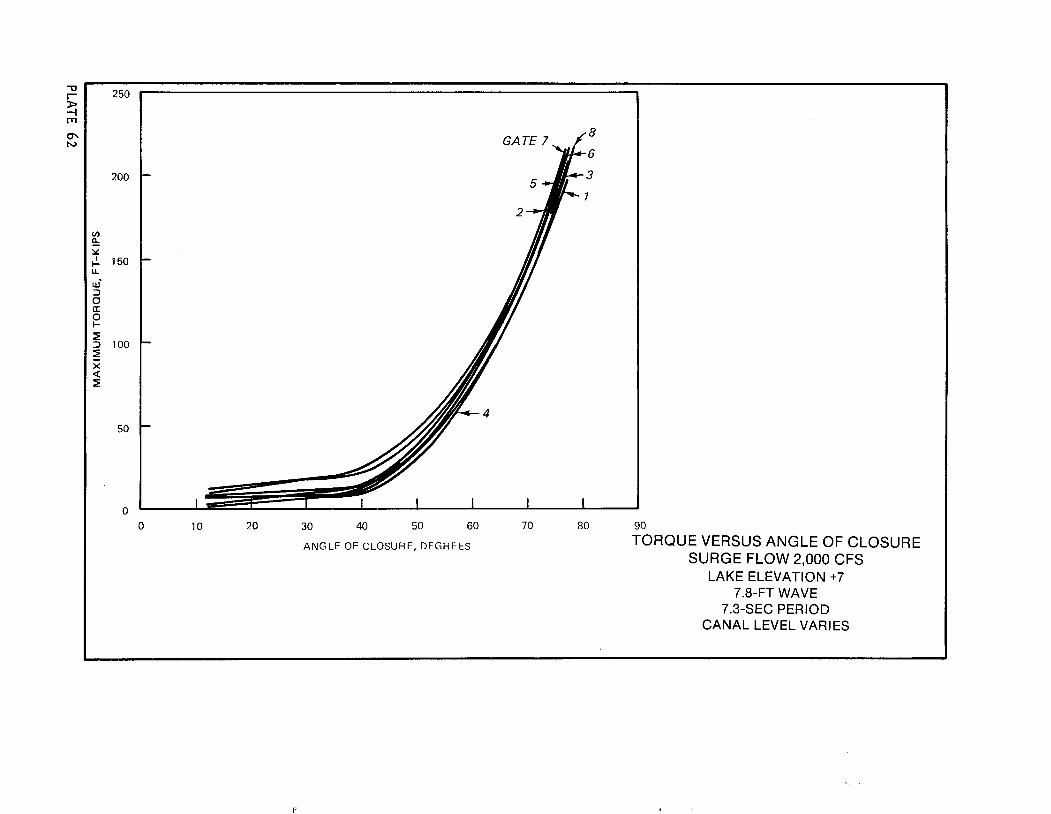
23. The results of tests 71-114 to measure torque (counterclockwise
direction) on the gate trunnions versus angle of closure with a lake elevation
of +7 ft and surge flow rates from the lake to the canal of 500, 1,000, 1,500,
* Bottin and Mize, op. cit.
22
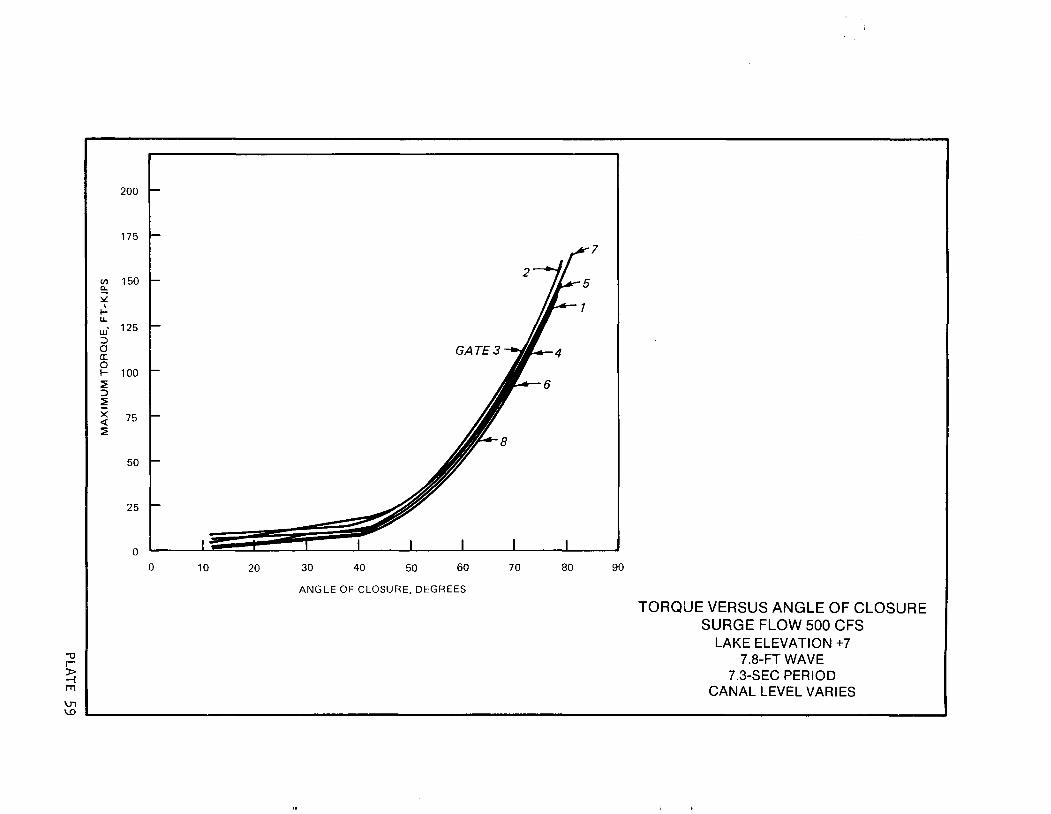
and 2,000 cfs are provided in Plates 55-58. Similar results obtained from
tests 115-158 conducted with 7.8-ft-high and 7.3-sec-period waves generated
from the north-northwest direction, a lake elevation of +7 ft, and surge flow
rates of 500, 1,000, 1,500, and 2,000 cfs are provided in Plates 59-62. The
curves in Plates 55-62 indicate that the 45-deg angle of closure is where the
torque measurement makes a dramatic increase in magnitude due to the shape of
the gate.
24. Torque values of 4 and 7 ft-kips were induced on gates 1 and 8,
respectively, when they were positioned 24 deg from the stop, and the other
six gates were positioned against the stop during tests 159-162 (see Appen
dix A). Values of torque on gates 2-6 with gates 1 and 8 closed are shown in
Appendix A as tests 163-166. Tests 167-170 were conducted with gates 7 and 8
positioned 24 deg from the stop with the other gates against the stop. A
torque of about 7 ft-kips was created on gate 8. Torques on gates 1-6 were
not increased significantly with gates 7 and 8 closed (see tests 171-174 of
Appendix A). Torques of about 3 and 4 ft-kips were created on gates 4 and 5,
respectively, when they were positioned 24 deg from the stop with the other
gates positioned against their stops (tests 175-178), and only 1 and 2 ft
kips, respectively, were measured when the gates were closed (tests 179-182).
25. Results of torque measurements with a lake elevation of +1 ft and
surge flows of 500, 1,000, 1,500, and 2,000 cfs with all gates open 6 deg from
the stop are presented in Appendix A, tests 183-186. Similar results with all
gates open 12 deg from their stops are presented in Appendix A, tests 187-190.
Water-surface differential through structure
26. Results of model tests to measure the differential at the structure
between the water surfaces on the pumping station and the lakes ides of the
structure with a pumped canal discharge of 8,000 cfs and a lake elevation of
+7 ft are presented in Table 2. Various combinations of gate positions were
used to measure the water-surface differentials. The objective was to see
which combinations of gate positions created a differential in excess of
0.5 ft. Excessive water-surface differentials occurred when gate bays car
rying a higher percentage of flow were restricted.
27. Results of model tests to determine water-surface elevations up
stream and downstream of the proposed London Avenue structure are presented in
Table 3. Tests included measuring the water-surface elevation with lake
23
stages of +11.5 and +7.0 ft and a discharge of 8,000 cfs simulating pumping to
the lake. Horizontal distances upstream and downstream of the structure were
measured from the pier nose on their respective sides.
24
PART IV: CONCLUSIONS AND RECOMMENDATIONS
28. The recommended canal alignment was obtained by observing flow pat
terns in the 1:20-scale physical model and modifying the canal to achieve
acceptable hydraulic performance. Tests conducted to evaluate the canal
alignment indicated that a uniform approach flow was necessary for flow
induced opening and closing of the gates.
29. The type 33 gate design consisted of 3-ft eccentricity, 22-in. gate
scoop, and a 24-deg angle (Figure 17). The gate design performed satisfacto
rily in the model over the full range of expected prototype conditions by
closing with the incoming hurricane surge and opening with pump flow. The
geometry of the type 33 gate design was derived for the anticipated flow con
ditions at this site-specific study. Any variation on the hydraulic condi
tions or the gate geometry will affect the performance of the gate and should
be investigated further.
30. Torque measurements were obtained without and with waves super
imposed on pumped and surge flows. Test results were affected by wave action;
increasing the torque up to 25 percent for a surge condition and decreasing
the torque by as much as 10 percent for a low pumped flow condition.
31. Torque measurements were collected for a wide range of conditions
for design purposes to include sizing the vertical shaft, mechanical compo
nents, dampening device, and structural components. Test conditions with the
gates fully opened or closed yielded the values of torque that will allow com
parison to the amount of torque necessary to overcome the dampening device and
internal friction. The dampening device, which was not a physical component
of this study, will be a vital link in the system to absorb most of the
dynamic forces, therefore preventing the gate from slamming, and regulate the
speed of opening and closing. It is recommended that these dynamic forces be
investigated further in a larger scale model prior to prototype design.
32. For other applications of this gate design, consideration should be
given to the concentration of suspended load at the proposed location. The
crescent-gated structure would be subjected to silting in or being blocked
open if heavy debris were present in the system. However, this site-specific
application is located downstream of a pumping station where a large percent
age of debris is filtered out by the trashracks of the pumping plant, and the
water has a very low suspended load concentration. In the prototype 9 in. of
25
clearance will be provided between the bottom of the gate and the basic slab
in an attempt to prevent debris or silt from jamming the gate.
26
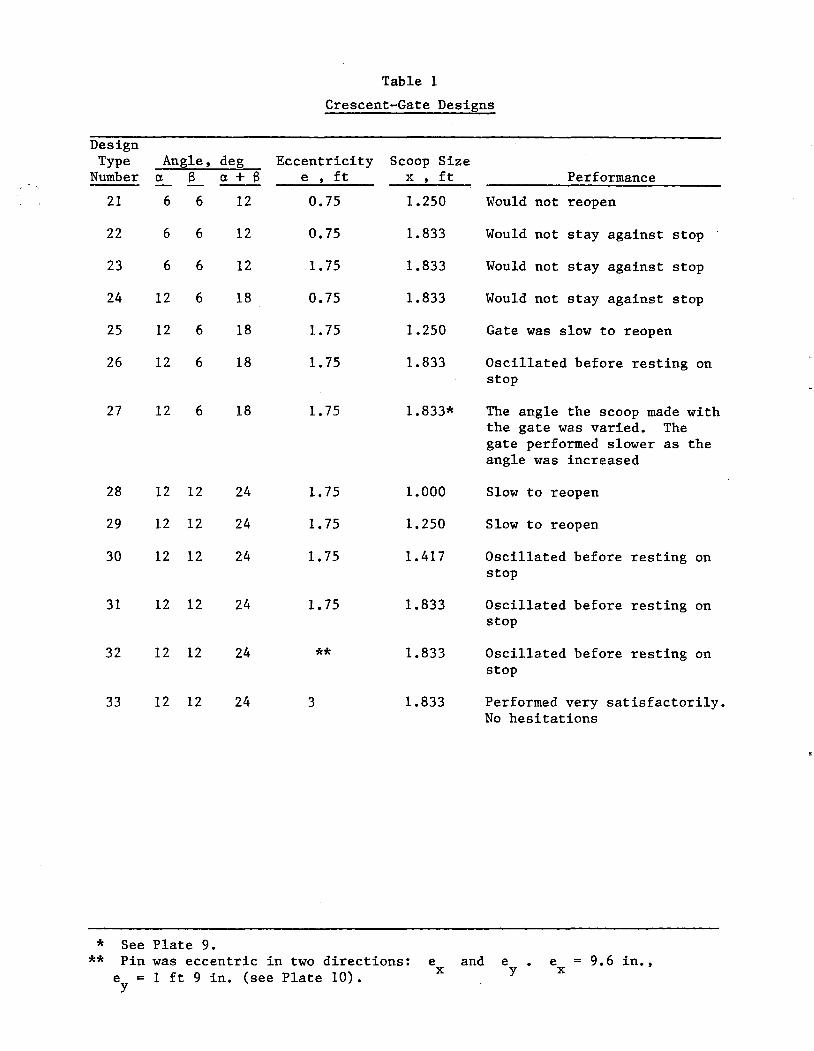
Table 1
Crescent-Gate Designs
Design Type Angle, deg Eccentricity Scoop Size
Number ex (3 ex + (3 e , ft x , ft Performance
21 6 6 12 0.75 1.250 Would not reopen
22 6 6 12 0.75 1.833 Would not stay against stop
23 6 6 12 1. 75 1.833 Would not stay against stop
24 12 6 18 0.75 1.833 Would not stay against stop
25 12 6 18 1. 75 1.250 Gate was slow to reopen
26 12 6 18 1. 75 1.833 Oscillated before resting on stop
27 12 6 18 1. 75 1.833* The angle the scoop made with the gate was varied. The gate performed slower as the angle was increased
28 12 12 24 1. 75 1.000 Slow to reopen
29 12 12 24 1. 75 1.250 Slow to reopen
30 12 12 24 1. 75 1.417 Oscillated before resting on stop
31 12 12 24 1. 75 1.833 Oscillated before resting on stop
32 12 12 24 ** 1.833 Oscillated before resting on stop
33 12 12 24 3 1.833 Performed very satisfactorily. No hesitations
* See Plate 9. ** Pin was eccentric in two directions:
e = 1 ft 9 in. (see Plate 10). y
e and e x y e x 9.6 in.,
--
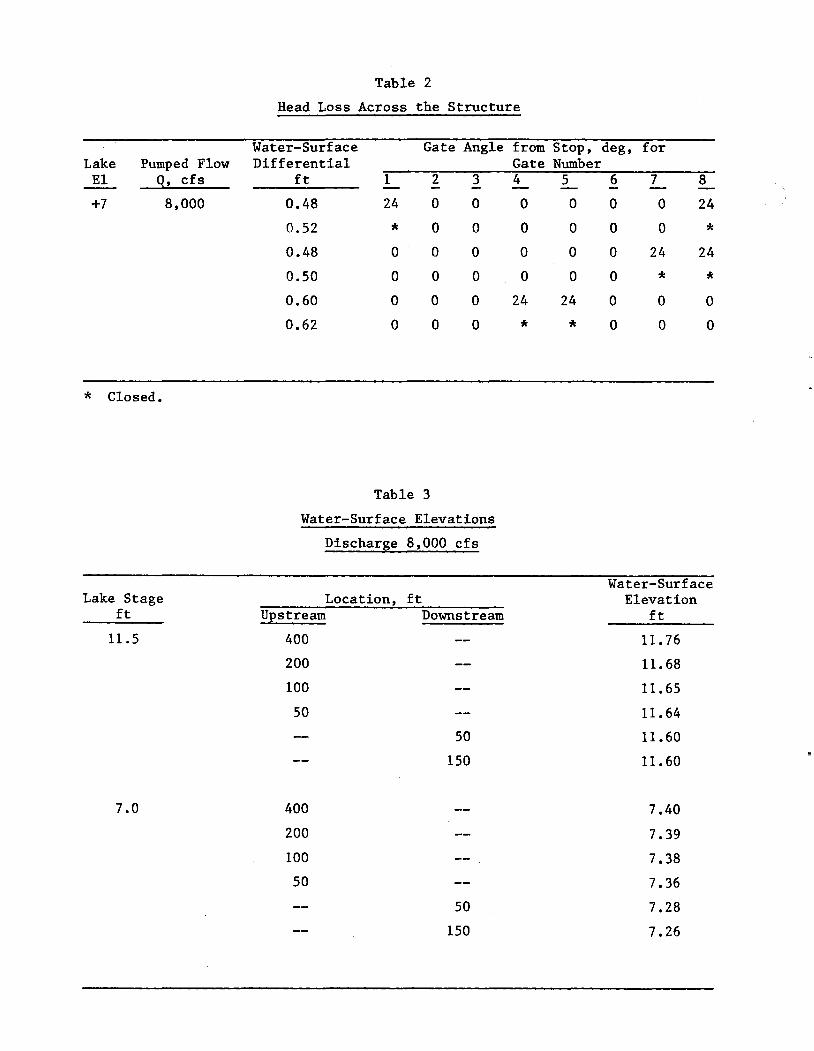
Table 2
Head Loss Across the Structure
Water-Surface Gate Angle from Stop, deg, for Lake Pumped Flow Differential Gate Number El Q, cfs ft 1 2 3 4 5 6 7 8 - -+7 8,000 0.48 24 0 0 0 0 0 0 24
0.52 * 0 0 0 0 0 0 * 0.48 0 0 0 0 0 0 24 24
0.50 0 0 0 0 0 0 * * 0.60 0 0 0 24 24 0 0 0
0.62 0 0 0 * * 0 0 0
* Closed.
Table 3
Water-Surface Elevations
Discharge 8,000 cfs
Water-Surface Lake Stage Location, ft Elevation
ft Upstream Downstream ft
11.5 400 11.76
200 11.68
100 11.65
50 11.64
50 11.60
150 11.60
7.0 400 7.40
200 7.39
100 7.38
50 7.36
50 7.28
150 7.26
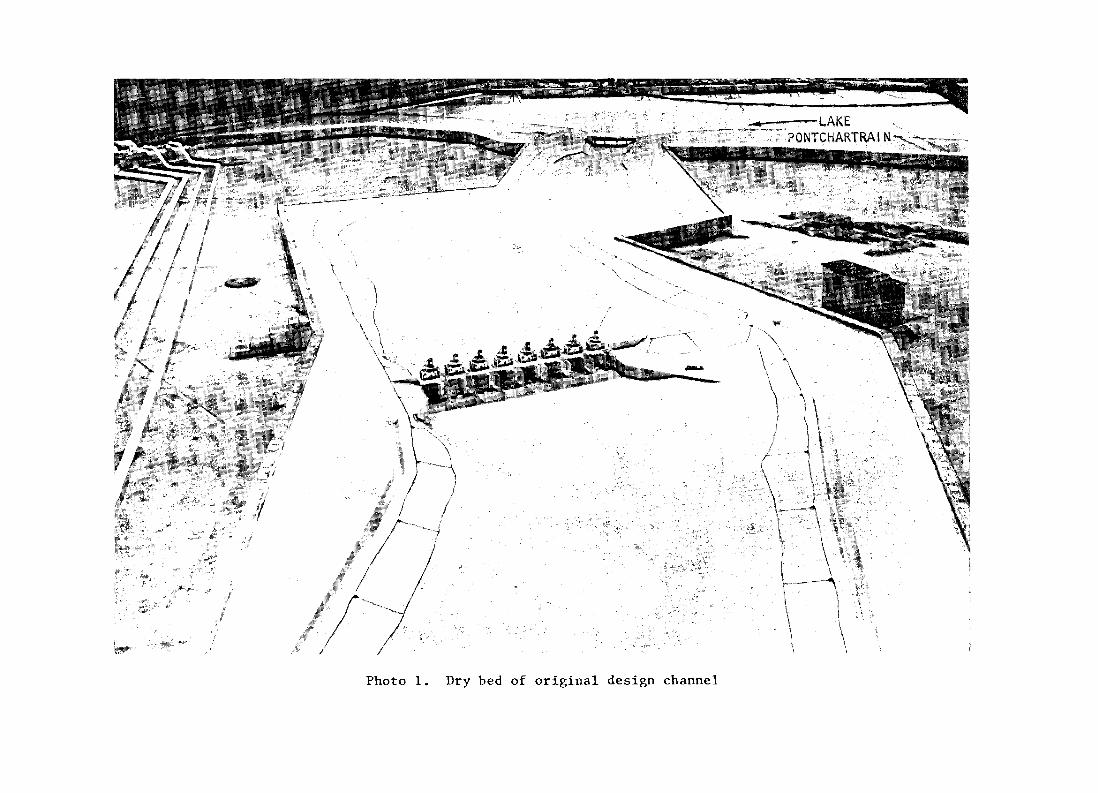
Photo 1. Dry bed of original design channel
LAKE PONTCHARTRA I N ~
Photo 2. Dry bed of control structure

PIER
LAKESIDE
·3" HIGH x 18" LONG D 6" 0 C STAGGER
SPDlLERS---------.....
. r15'~
-@-
4" HIGH x 18" LONG 6" 0 C STAGGER
SPOILERS
T 14'3"
11 PUMP STATION SIDE
a. TYPE 2 GATE DESIGN
PUMP STATION SIDE
b. FLOW PATTERN
PIER
FLOW PATTERN WITH TYPE 2 GATE DESIGN DISCHARGE Q = 4,000 CFS
LAKE EL = + 5 FT
PLATE 1

PIER
PLATE 2
lAKESIDE
3" HIGH x 18" lONG
II 6" 0 C STAGGER SPOILERS
J .15'9"
PIER
- ~
J PUMP STATION SIDE
a. TYPE 3 GATE DESIGN
b. FLOW PATTERN
FLOW PATTERN WITH TYPE 3 GATE DESIGN DISCHARGE Q = 4,000 CFS
LAKE EL = + 5 FT
PIER
lAKE SlOE·
1 15'9"
PIER
14'3" SPOILER
I 2' -11'~
PUMP STATION SlOE
a. TYPE 5 GATE DESIGN
FLOW PATTERN WITH TYPE 5 GATE DESIGN DISCHARGE Q = 4,000 CFS
LAKE EL = + 5 FT
PLATE 3
PIER
PLATE It
SPOILER
15'9"
PIER
30'
14'3"
SPOILER l'
PUMP STATION SlOE
a. TYPE 6 GATE DESIGN
FLOW PATTERN WITH TYPE 6 GATE DESIGN DISCHARGE Q = 4,000 CFS
LAKE EL = + 5 FT

a.. CI t-m
LLI CI .m LLI ~ < .....I
cc LLI
ii:
-\}-\@
\ ~
LLI CI m :z CI i= < t-m a.. ::E :::::) a..
c_. __ "----1~r::-a..ffi~ =====)
L.L.I CL.. >.....
PLATE 5
a: LoU
'-----M.-....~~J i~VH a:
L--__."--__ T ~
LoU CI CI) ="-----+-1------- ~ ---~·-II ~ " . ~ -1----- in ~
~4 ~----~;~--------=~ ~ ~C ~ "-~ - I ~ < ~ ~ "-
(------"'------J a: LoU
a... )
PLATE 6
a:::: LI.I
a..
~ ~ :E: 1-1-----iD....,..------· +-1 ----~------I·I
~ll , ) s tt:E=l:::gg:-----~IS-----
.. --c a.. c c (.) U)
-cc a::::
c ___ "-----1 ___ ~_)
:z: c:::J
CIl IoU CI
IoU le c:::J
cc -IoU CI... >I-
PLATE 7
PIER
PLATE 8
LAKESIDE
~ I' I'r
.-L -- -(@-- -
-JI' ~ I
15'9"
~I PUMP STATION SIDE
3. TYPE 18 GATE DESIGN
PIER
FLOW PATTERN WITH TYPE 18 GATE DESIGN

c........-.--_'-----1 __ ~ __ )
PLATE 9
~
~ ~
II CQ
c::ri LU CI CI)
LU z: CI C)
CI) ~ LUI cr: ::.:::: I--cr: CI) -J a..
:iE :::::) a..
c.J'
( '-----1~ ) ___ a.. __
PLATE 10
-u r » -I rn
-80
70 l LEGEND
~ +7 CANAL NO WAVE +7 CANAL 7.8 - FT WAVE
+9 CANAL NO WAVE
-60 r +9 CANAL 7.8 - FTWAVE
en 0..
~ -50 I
l-ll.
w' :J
)i1 -40 0 I-:2; :J :2;
X -30 <:{ :2;
-20
-10
o
NOTE: LAKE LEVEL IS 1 FT LOWER THAN THE CANAL. TORQUE VALUES ARE NEGATIVE (CLOCKWISE).
MAXIMUM TORQUE GATE 1
ALL GATES CLOSED 1-FT HEAD ON CANAL SIDE
" ~I -I rn
~I
-80
LEGEND
-70 t-~ ., CANAL NO WAVE
+7 CANAL 7.8- FTWAVE
+9 CANAL NO WAVE
-6l +9 CANAL 7.8 - FT WAVE
" , , , E , • U) Q,
~ -50 t!-IL
w' ::J 0 a: -40 0 ~
::!; ::J ::!;
X -30 c{ ::!;
-20
-10
o I 1 11111111 V///A ~~~"I
NOTE: LAKE LEVEL IS 1 FT LOWER THAN THE CANAL. TORQUE VALUES ARE NEGATIVE (CLOCKWISE).
MAXIMUM TORQUE GATE 2
ALL GATES CLOSED 1-FT HEAD ON CANAL SIDE
'"0 r » -I rn
-80
-70 LEGEND
~ +7 CANAL NO WAVE -60 r +7 CANAL 7.8- FTWAVE
+9 CANAL NO WAVE
+9 CANAL 7.8 - FT WAVE en Q.
;;£ -50 t!. IL
w' ::J a a:: -40 0 I-~ ::J ~ X -30 c(
~
-20
-10
o I 1 11111111 V///A ~~~
NOTE: LAKE LEVEL IS 1 FT LOWER THAN THE CANAL. TORQUE VALUES ARE NEGATIVE (CLOCKWISE).
MAXIMUM TORQUE GATE 3
ALL GATES CLOSED 1-FT HEAD ON CANAL SIDE
~I~----------------------------------------------------------------------------------~
-u r
~I ITI
"""" I
(/) Q.
-so
-70
-60
;;£-50 ~ IL.
w' :::> o ' a: -40
~ :!: :::> :!: x -30 ~ :!:
-20
-10
o
LEGEND
~ +7 CANAL NO WAVE
+7 CANAL7.S- FTWAVE
+9 CANAL NO WAVE
+9 CANAL 7.S - FT WAVE
NOTE: LAKE LEVEL IS 1 FT LOWER THAN THE CANAL. TORQUE VALUES ARE NEGATIVE (CLOCKWISE)
MAXIMUM TORQUE GATE 4
ALL GATES CLOSED 1-FT HEAD ON CANAL SIDE
""0 r-
~ rn
\11
II) Q.
-80
-70
-60
;;£ -SO
~ lL
w' :::> o a:: -40 o I-::!! :::> ::!! X -30 <t ::!!
-20
-10
o
LEGEND
~ +7 CANAL NO WAVE
+7 CANAL 7.8- FTWAVE
+9 CANAL NO WAVE
+9 CANAL 7.8 - FT WAVE
I 11111111 v///A ~
NOTE: LAKE LEVEL IS 1 FT LOWER THAN THE CANAL. TORQUE VALUES ARE NEGATIVE (CLOCKWISE).
MAXIMUM TORQUE GATES
ALL GATES CLOSED l-FT HEAD ON CANAL SIDE
." r )::> -I IT1
"'I
II) Q.
-80
-70
-60
i2 -50 t!-IL
w' :l o a: -40
~ ~ :l ~ x -30 « ~
-20
-10
LEGEND
~ +7 CANAL NO WAVE
+7 CANAL 7.8 - FT WAVE
+9 CANAL NO WAVE
+9 CANAL 7.8 - FTWAVE
o 1111111. 'f"'LA """'"
NOTE: LAKE LEVEL IS 1 FT LOWER THAN THE CANAL. TORQUE VALUES ARE NEGATIVE (CLOCKWISE).
MAXIMUM TORQUE GATE 6
ALL GATES CLOSED 1-FT HEAD ON CANAL SIDE
-0 r ::; ITI
III a..
-80
-70
-60
il -50 ~ u.
w' ::> o a: -40
~ ~ ::> ~ x -30 <{ ~
-20
-10
o
NOTE: LAKE LEVEL IS 1 FT LOWER THAN THE CANAL. TORQUE VALUES ARE NEGATIVE (CLOCKWISE).
LEGEND
~ +7 CANAL NO WAVE
+7 CANAL 7.8 - FT WAVE
+9 CANAL NO WAVE
+9 CANAL 7.8 - FT WAVE
MAXIMUM TORQUE GATE?
ALL GATES CLOSED 1-FT HEAD ON CANAL SIDE
~~I--------------------------------------------------------------------------~

" r ):> -I m
co
(/) 0..
-80
-70
-60
~ -50 t!-IL
w' :::> o a: -40 o I-~ :::> ~ x -30 ~ ~
-20
-10
o
~
NOTE: LAKE LEVEL IS 1 FT LOWER THAN THE CANAL. TORQUE VALUES ARE NEGATIVE (CLOCKWISE).
LEGEND
+7 CANAL NO WAVE
+7 CANAL 7.8- FTWAVE
+9 CANAL NO WAVE
+9 CANAL 7.8 - FTWAVE
MAXIMUM TORQUE GATE 8
ALL GATES CLOSED 1-FT HEAD ON CANAL SIDE
-u r » -l ITI
Cfl a. :.( , f-LL
w' :J 0 a: 0 f-:2: :J :2: x « :2:
600
500
400
300
200
100
o o 0.5 1.5 2
NOTE: CANAL LEVEL = 11.5 - t.H.
2.5
i'lH, FT
3 3.5 4 4.5 5
MAXIMUM TORQUE VERSUS ~H GATE 1
LAKE STAGE +11.5 HEAD ON LAKESIDE 1-FT GATE OPENING
~L' __________________________________________________________________________________________________________________ ~
'"
""'0
~I 600 6(
rn
N o
Ul Q.
~ I
I-u.. w' ::J a a: 0 I-~ ::J ~
X ct ~
500
400
300
200
100
0~1 ____ ~ ____ L_ __ ~L_ __ ~ ____ ~ ____ ~ ____ ~ __ ~ ____ ~ ____ ~
o 0.5 1.5 2
NOTE: CANAL LEVEL = 11.5 - ll.H.
"
2.5 3 3.5 4 4.5 5
t.H. FT MAXIMUM TORQUE VERSUS ~H
GATE 2 LAKE STAGE +11.5
HEAD ON LAKESIDE 1-FT GATE OPENING
IJ r ~ ~ m
en Q..
~ I
l-Ll..
w' ::::> a II: 0 I-~ ::::> ~
x « ~
600
500
400
300
200
100
o o 0,5 1.5 2
NOTE: CANAL LEVEL = 11.5 - t.H,
2.5
6H,FT
3 3.5 4 4.5 5
MAXIMUM TORQUE VERSUS 6H GATE 3
LAKE STAGE +11,5 HEAD ON LAKESIDE 1-FT GATE OPENING
tv L' __________________________________________________________________________________________________________________________________ ~
""tI r » -I IT1
N N
en Il.
~ I
l-LL
w' :::l 0 a:: 0 I-~ :::l ~
X ~ ~
600
500 L A
400
300
200
100
o ~ ______ L-______ L-______ L-______ L-______ L-______ ~ ______ ~~ ____ ~ ______ ~ ____ ~
o 0.5 1.5
NOTE: CANAL LEVEL = 11.5 - t.H.
2 2.5
~H.FT
3 3.5 4 4.5 5
MAXIMUM TORQUE VERSUS t:.H GATE 4
LAKE STAGE +11.5 HEAD ON LAKESIDE 1-FT GATE OPENING
-0 r~ ~ rn
~
II) Q.
¥ I
I-u.. w' ::> a a: 0 I-~ ::> ~
x « ~
600
500
400
300
200
100
o o 0.5 1.5 2
NOTE: CANAL LEVEL = 11.5 - t.H.
2.5
t.H, FT
3 3.5 4 4.5 5
MAXIMUM TORQUE VERSUS AH GATES
LAKE STAGE +11.5 HEAD ON LAKESIDE 1-FT GATE OPENING
\N ~----------______________________________________________________________________________________________________ ~
"
""0 r 600
~ fTI
N J:-
en c... :.c
I I-u. w' ::> a a: 0 I-~ ::> ~
x ~ ~
500
400
300
200
100
o o 3 3.5 4
'\.
NOTE: CANAL LEVEL = 11.5 - t.H.
4.5 5
MAXIMUM TORQUE VERSUS bH GATE 6
LAKE STAGE +11.5 HEAD ON LAKESIDE 1-FT GATE OPENING
OJ r~ ~ rn
~
en Q.
~ I
l-lL.
w' :::l 0 a: 0 I-~ :::l ~
X <{ ~
600
500
400
300
200
100
o o 0.5 1.5 2
NOTE: CANAL LEVEL = 11.5 - t.H.
2.5
~H.FT
3 3.5 4 4.5 5
MAXIMUM TORQUE VERSUS h.H GATE 7
LAKE STAGE +11.5 HEAD ON LAKESIDE 1-FT GATE OPENING
~L' __________________________________________________________________________________________________ ----------------________________ ~
"
<J
:3 o IQ
Sdl)l-.1::1 '3nOl:l0.1 VIInVIII X'VVII
PLATE 26
CO)
N
It'!
Ll)
ci
o
I <l C/)
=> C/) a: w >
x « ::2
I <l
I
"?
" -I W > W -I ~
-I « z « u W l-0 z
-0 r ):> -I rn
N -...J
en 0-
:..:: I
l-LL.
w' :::> a a: 0 I-~ :::> ~
x ~ ~
600
500
400
300
200
100 o
OLI ____ ~ ____ ~ ______ L_ ____ ~ ____ ~ ____ _L ____ _L ____ ~ ____ ~ ____ ~
o 0.5 1.5 2 2.5 3 3.5 4 4.5 6
~H.FT
NOTE: CANAL LEVEL = 11.5 - AH.
MAXIMUM TORQUE VERSUS flH GATE 1
LAKE STAGE +11.5 HEAD ON LAKESIDE
7.3-SEC PERIOD; 7.8-FT WAVE l-FT GATE

~ I 600 ;:ri I N 00
II) 11-
~ I
f-II..
w' :::> a a: 0 f-::!: :::> ::!: x <i ::!:
500
400
300
200
100
0~1----~------~----~------L-----~----~------L-----~----~----~ o 0.5 1.5 2 2.5 3 3.5 4 4.5 6
LlH, FT
NOTE: CANAL LEVEL'" 11.5 - t.H.
MAXIMUM TORQUE VERSUS AH GATE 2
LAKE STAGE +11.5 HEAD ON LAKESIDE
7.3-SEC PERIOD; 7.8-FT WAVE 1-FT GATE
"U r » -I (T1
N \.0
(I) c.. ~
I .... LL
w' ::J d II: 0 .... ~ ::J ~
X <{
~
600 I
500
400
300
200
100
0._ 1.5
NOTE: CANAL LEVEL = 11.5 - t.H.
MAXIMUM TORQUE VERSUS f1H GATE 3
LAKE STAGE +11.5 HEAD ON LAKESIDE
7.3-SEC PERIOD; 7.8-FT WAVE 1-FT GATE
srl--~600;-~==================================================~'========~------------~ rn
~ o
500
CI) 400 Q.
:.I: I
I-u. w' ::l 0 a: 300 0 I-~ ::l ~
X ~
200 ~
100
o o 0.5 1.5 2
NOT~ CANAL LEVEL = 11,5-6H,
2.5
ilH, FT
3 3.5 4 4.5 5
MAXIMUM TORQUE VERSUS L\H GATE 4
LAKE STAGE +11,5 HEAD ON LAKESIDE
7,3-SEC PERIOD; 7,8-FT WAVE 1-FT GATE
""C r J> -l rn
V.J
Ul Cl.
:.<: I
I-u. w· ::> 0 a: 0 I-~ ::> ~
x ~ ~
600
500
400
300
200
100
o o 0.5 1.5
NOTE: CANAL LEVEL = 11.5 - l>H.
2 2.5
~H.FT
3 3.5 4 4.5 5
MAXIMUM TORQUE VERSUS t.H GATE 5
LAKE STAGE +11.5 HEAD ON LAKESIDE
7.3-SEC PERIOD; 7.8-FT WAVE 1-FT GATE
""'0
~11~60ro0r================--- .. ··~~ --======;---I
en Q.
~ I
I-u.. w' :J 0 a: 0 I-~ :J ~
X <{ ~
500
400
300
200
100
o ~I ____ ~ ____ ~ ______ L_ ____ ~ ____ ~ ____ ~ ____ _L ____ ~ ____ ~ ____ ~
o 0.5 1.5
NOTE: CANAL LEVEL = 11.5 - t.H.
2 2.5 i1H. FT
3 3.5 4 4.5 5
MAXIMUM TORQUE VERSUS t.H. GATE 6
LAKE STAGE +11.5 HEAD ON LAKESIDE
7.3-SEC PERIOD; 7.8-FT WAVE 1-FT GATE

""0 r » -I IT1
W W
til Q.
~ I
t-IL.
w' ::> a a: 0 t-~ ::> ~
x <{
~
600
500
400
300
200
100
o o 3 3.5 4
NOTE: CANAL LEVEL = 11.5 - t.H.
4.5 5
MAXIMUM TORQUE VERSUS t.H. GATE 7
LAKE STAGE +11.5 HEAD ON LAKESIDE
7.3-SEC PERIOD; 7.8-FT WAVE 1-FT GATE

""tI r :t:> -I rn
VJ .j::-
en Q..
~ I
l-Ll.
w' ::> a a: 0 I-:!: ::> :!: x « :!:
600 Ir---------------------------------------------------------------------------------~
500
400
300
200
100
Ol~----~----~----~----~----~----~------~----~----~----~ o 0.5 1.5
NOTE: CANAL LEVEL = 11.5 - .t.H.
I'
2 2.5
~H.FT
3 3.5 4 4.5 5
MAXIMUM TORQUE VERSUS .t.H GATE 8
LAKE STAGE +11.5 HEAD ON LAKESIDE
7.3-SEC PERIOD; 7.8-FT WAVE 1-FT GATE
-u r ):> -I FT1
\AI V1
-600
-500
~ -400 ~
I Iu.. w' ::l o :5 -300 I-~ ::l ~
X ~ ~ -200
-100
o o
t:.
0.5 1.5 2 2.5
b.H. FT
NOTE: TORQUE VALUES ARE NEGATIVE (CLOCKWISE). LAKE LEVEL = 11.5 - ~H.
f'
3 3.5 4 5
MAXIMUM TORQUE VERSUS t-H GATE 1
CANAL LEVEL +11.5 HEAD ON PUMP SIDE 1-FT GATE OPENING
~I ~ -i IT1
W (T\
I
-600
-500
~ -400 ::0/: .,!. u. w' :::l o ~ -300 I-~ :::l ~
X <t ~ -200
-100
o o 0.5 1.5 2 2.5
t.H. FT
NOTE: TORQUE VALUES ARE NEGATIVE (CLOCKWISE). LAKE LEVEL = 11.5 - l!.H.
3 3.5 4 4.5 5
MAXIMUM TORQUE VERSUS AH GATE 2
CANAL LEVEL +11.5 HEAD ON PUMP SIDE 1-FT GATE OPENING
" ~
~ r~ ~ rn
-600
-500
~ -400 ~
I Iu. w' :::l o gj -300 I~ :::l ~
X <{ ~ -200
-100
a
o LI ____ -L ____ ~ ______ L_ ____ L_ ____ ~ ____ ~ ____ _L ____ ~ ____ ~ ____ ~
o 0.5 1.5 2 2.5
ilH, FT
NOTE: TORQUE VALUES ARE NEGATIVE (CLOCKWISE). LAKE LEVEL = 11.5 - t.H.
3 3.5 4 4.5 5
MAXIMUM TORQUE VERSUS AH GATE 3
CANAL LEVEL +11.5 HEAD ON PUMP SIDE 1-FT GATE OPENING
~ ~I--------------------------------------------------------------------------------------------------------~
""1J r ):> -l I"T'I
W ex>
-600
-500
~ -400 ~
~ u.. w' ~ a ~ -300 I~ ~ ~
X <t ~ -200
-100
o L-____ -L ______ ~ ____ ~ ______ _L ______ ~ ____ ~ ______ ~ ____ ~ ______ ~ ____ ~
o 0.5 1.5 2 2.5
~H.FT
NOTE: TORQUE VAL.UES ARE NEGATIVE (CLOCKWISE). LAKE LEVEL = 11.5 - ~H.
"
3 3.5 4 4.5 5
MAXIMUM TORQUE VERSUS l1H GATE 4
CANAL LEVEL +11.5 HEAD ON PUMP SIDE l·FT GATE OPENING
IJ r~ ~ m
-600
-500
~ -400 ~
~ u.. w' :l a ~ -300 I~ :l ~
X ~ ~ -200
-100 ll.
o LI ____ ~ ______ ~ ____ _L ____ ~L_ ____ ~ ____ _L ______ L_ ____ ~ ____ ~ ____ ~
o 0.5 1.5 2 2.5 3 3.5 4 4.5 5
~H.FT
NOTE: TORQUE VALUES ARE NEGATIVE (CLOCKWISE). LAKE LEVEL = 11.5 - AH.
MAXIMUM TORQUE VERSUS ~H GATE 5
CANAL LEVEL +11.5 HEAD ON PUMP SIDE 1-FT GATE OPENING
~I~----------------------------------------------------------------------------------~
~I » -I IT1
0l:-e
-600
-500
~ -400 ~
I Iu. w' :::> a ~ ~300 I~ :::> ~
x ex: ~ -200
-100
0~1 ----~----~----~----~--~----~----~----~----~--~ o 0.5 1.5 2 2.5 3 3.5
~H.FT
NOTE: TORQUE VALUES ARE NEGATIVE (CLOCKWISE). LAKE LEVEL = 11.5 - t.H.
I'
4 4.5 5
MAXIMUM TORQUE VERSUS ~H GATE 6
CANAL LEVEL +11.5 HEAD ON PUMP SIDE 1-FT GATE OPENING
~ r ~ ~ ~
-600
-500
~ -400 ::.<:
I lLl.
w' :::> a ~ -300 I-~ :::> ~
x ~ ~ -200
-100
o o
A
0.5 1.5 2 2.5
LlH, FT
NOTE: TORQUE VALUES ARE NEGATIVE (CLOCKWISE). LAKE LEVEL = 11.5 - l1H.
3 3.5 4 4.5 6
MAXIMUM TORQUE VERSUS LlH GATE 7
CANAL LEVEL +11.5 HEAD ON PUMP SIDE 1-FT GATE OPENING
~~I------------------------------------------------------------------------~
~ .-----=-600 :t> -l rr1
.j:-N
I -500
~ -400 ~
~ u.. w' ::J a :5 -300 f~ ::J ~
X c:{ ~ -200
-100
o o 1.5 2 2.5
6H,FT
NOTE: TORQUE VALUES ARE NEGATIVE (CLOCKWISE). LAKE LEVEL = 11.5 - t.H.
3 3.5 4 4.5 5
MAXIMUM TORQUE VERSUS ~H GATE 8
CANAL LEVEL +11.5 HEAD ON PUMP SIDE 1-FT GATE OPENING

""'C r l> -I IT1
J:W
en Il..
~ I
I-u.. w' :::> a a: 0 I-~ :::> ~
x <{
~
-600
-500
-400
-300
-200
-100
o o 0.5 1.5 2 2.5
LlH, FT
NOTE: TORQUE VALUES ARE NEGATIVE (CLOCKWISE). LAKE LEVEL = 11.5 - t.H.
3 3.5 4 4.5 5
MAXIMUM TORQUE VERSUS ~H GATE 1
CANAL LEVEL + 11.5 HEAD ON PUMP SIDE
7.3-SEC PERIOD; 7.8-FT WAVE 1-FT GATE OPENING
""0
'I ):> -600
--I ('T1
~ ~
I -500
(I) -400 0-
~ I
l-Ll..
w' :::l a a: -300 0 I-~ :::l ~
X « -200 ~
-100
o o 0.5 1.5 2
NOTE: TORQUE VALUES ARE NEGATIVE (CLOCKWISE). LAKE LEVEL = 11.5 - l1H.
I'
2.5
LlH, FT
3 3.5 4 4.5 5
MAXIMUM TORQUE VERSUS aH GATE 2
CANAL LEVEL + 11.5 HEAD ON PUMP SIDE
7.3-SEC PERIOD; 7.8-FT WAVE 1-FT GATE OPENING

""'I!lI r ~ ITI
CIl Il.
::.I: I
I-u. w' :::> a II: 0 I-:2 :::> :2 x <{
:2
-600
-500
-400
-300
-200
-100
o o 0.5 1.5 2
NOTE: TORQUE VALUES ARE NEGATIVE (CLOCKWISE). LAKE LEVEL = 11.5 - 6H.
2.5
~H.FT
3 3.5 4 4.5 6
MAXIMUM TORQUE VERSUS ~H GATE 3
CANAL LEVEL + 11.5 HEAD ON PUMP SIDE
7.3-SEC PERIOD; 7.8-FT WAVE 1-FT GATE OPENING
~ L' ____________________________________________________________________________________________________________________________________ ~

-0 r ::t> -I rn
-'=" 0'\
en Q..
~ I
l-I£.
w' ::J 0 a: 0 I-~ ::J ~
X <f ~
-600
-500
-400
-300
-200
-100
o I~ ______ ~ ______ L-______ ~ ______ ~ ______ ~ ______ ~ ______ ~ ______ ~ ______ ~ ____ ~
o 0.5 1.5 2 2.5
i!.H, FT
NOTE: TORQUE VALUES ARE NEGATIVE (CLOCKWISE). LAKE LEVEL = 11.5 - t.H.
3 3.5 4 4.5 5
MAXIMUM TORQUE VERSUS 6H GATE 4
CANAL LEVEL + 11.5 HEAD ON PUMP SIDE
7.3-SEC PERIOD; 7.8-FT WAVE 1-FT GATE OPENING
~ r~ ~ m
Ul 0-
~ I
t-IL
w' ::J 0 a:: 0 t-::2: ::J ::2: x or:{
::2:
-600
-500
-400
-300
-200
-100
o o 0.5 1.5 2
NOTE: TORQUE VALUES ARE NEGATIVE (CLOCKWISE). LAKE LEVEL = 11.5 - t.H.
2.5
ilH, FT
3 3.5 4 4.5 5
MAXIMUM TORQUE VERSUS ~H GATE 5
CANAL LEVEL + 11.5 HEAD ON PUMP SIDE
7.3-SEC PERIOD; 7.8-FT WAVE 1-FT GATE OPENING
~I~------------------------------------------------------------------------------------------~
""0 I )::0 -600 -I IT1
J:-00
I -500
en Il. -400 ~
I .... U.
w' :::> d a: 0
-300
.... :!: :::> :!: X <{
:!: -200
-100
o o 0.5 1.5 2
NOTE: TORQUE VALUES ARE NEGATIVE (CLOCKWISE). LAKE LEVEL = 11.5 - 6H.
2.5
LlH. FT
3 3.5 4 4.5 5
MAXIMUM TORQUE VERSUS AH GATE 6
CANAL LEVEL + 11.5 HEAD ON PUMP SIDE
7.3-SEC PERIOD; 7.8-FT WAVE 1-FT GATE OPENING
~ r~ ~ rn
III !l.
~ I
I-u. w' :::> a II: 0 I-:2 :::> :2 x <{
:2
-600
-500
-400
-300
-200
-100
I T o 4 4.5 5 0.5 1.5 2 3 3.5 o 2.5
ilH. FT
NOTE: TORQUE VALUES ARE NEGATIVE (CLOCKWISE). LAKE LEVEL = 11.5 - 6H.
MAXIMUM TORQUE VERSUS aH GATE 7
CANAL LEVEL + 11.5 HEAD ON PUMP SIDE
7.3-SEC PERIOD; 7.8-FT WAVE 1-FT GATE OPENING
~~I------------------------------------------------------------------------------------------~
-c r )::> -I ('T\
\J"1 0
-600
-500
en -400 Il.
~ I
t-Il.
w' :::> 0 II: -300 0 t-~ :::> ~
X <I: ~ -200
-100
o ~I ______ -L ______ -L ______ ~ ______ ~ ______ ~ ______ ~ ______ ~ ______ ~ ______ ~ ______ ~
o 0.5 1.5 2 2.5
~H.FT
NOTE: TORQUE VALUES ARE NEGATIVE (CLOCKWISE). LAKE LEVEL = 11.5 - 6H.
3 3.5 4 4.5 5
MAXIMUM TORQUE VERSUS ~H GATE 8
CANAL LEVEL + 11.5 HEAD ON PUMP SIDE
7.3-SEC PERIOD; 7.8-FT WAVE 1-FT GATE OPENING
-800
-700
-600
~ -soo ~
~ u.. w' ::>
~ -400 o f-~ ::> ~
X
~ -300
-200
-100
NOTE: TORQUE VALUES ARE NEGATIVE (CLOCKWISE)
3
12° (TRIMMED)
GATE 1
5
2
.'.'-.-- 4
72° (FULLY CLOSED) I
oL.t-~~~~~G--J o 10 20 30 40 50 60
ANGLE OF CLOSURE, DEGREES
TORQUE VERSUS ANGLE OF CLOSURE DISCHARGE = 8,000 CFS TO THE LAKE
LAKE ELEVATION = +5 FT
PLATE 51
-800
-700
-600
(I) -500 c.. ~
t-!. u.. w' ::> ~-400 o I-~ ::> ~
X
~ -300
-200
-100
PLATE 52
NOTE: TORQUE VALUES ARE NEGATIVE (CLOCKWISE)
12° (TRIMMED)
I
72° (FULLY CLOSED)
ANGLE OF CLOSURE, DEGREES
TORQUE VERSUS ANGLE OF CLOSURE DISCHARGE = 8,000 CFS TO THE LAKE
LAKE ELEVATION = +5 FT WAVE HEIGHT = 7.8 FT
WAVE PERIOD = 7.3 SEC

-800
-700
-600
~ -500 :>!
r!-LL
w' :> o a: -400 o I-:2 :> :2 x ~ -300
-200
-100
GATEB NOTE: TORQUE VALUES ARE NEGATIVE (CLOCKWISE)
7
3 2
12° (TRIMMED) 72° (FULLY CLOSED)
OL-__ ~LL __ ~===-~ ____ -L ____ -L ____ ~ ____ ~~ __ ~ __ ~
o 10 20 30 40 50 60 70 80 90
ANGLE OF CLOSURE, DEGREES
TORQUE VERSUS ANGLE OF CLOSURE DISCHARGE = 8,000 CFS TO THE LAKE
LAKE ELEVATION = +3 FT NO WAVES
PLATE 53
-800
-700
-600
~ -500 :II:
~ u.. w' ~
~ -400 o I-:2 ~
:2 x <t :2 -300
-200
-100
NOTE TORQUE VALUES ARE NEGATIVE (CLOCKWISE)
120 (TRIMMED) I I
7
8
6
720 (FULLY CLOSED) I
00~----110J§~=2tO~==:3IO::==~4~0----~5~0~---6~0~--~)L---J~--~·
PLATE 54
ANGLE OF CLOSURE, DEGREES
TORQUE VERSUS ANGLE OF CLOSURE DISCHARGE = 8,000 CFS TO THE LAKE
LAKE ELEVATION = + 1 FT NO WAVES
-u r )::> --I 1"1"\
\Jl \Jl
II) a.. ::.£
I l-Ll.
w' :::)
0 a: 0 I-~ :::)
~
X ~ ~
200
175
150
125
100
75
50
25
0 0 10 20 30 40 50 60
ANGLE OF CLOSURE, DEGREES
70 80 90
TORQUE VERSUS ANGLE OF CLOSURE SURGE FLOW 500 CFS
LAKE ELEVATION +7 CANAL LEVEL VARIES
"'C r » -I JTI
\J1 0'
200
175
en 150 !!:
:.i: I
l-LL.
w' 125 ::> 0 a: 0 I- 100 ~ ::> ~ x <t ~
75
50
25
0
0 10 20 30 40 50 60
ANGLE OF CLOSURE, DEGREES
70
8
80 90
TORQUE VERSUS ANGLE OF CLOSURE SURGE FLOW 1,000 CFS
LAKE ELEVATION +7 CANAL LEVEL VARIES

\J r-
~ rn
Vl ~ :w:: ~ u.. w' :::> 0 a: 0 f-::!: :::> ::!: X <! ::!:
200
175
150
125
100
75
50
25
0
0 10 20 30 40 50 60
ANGLE OF CLOSURE, DEGREES
8
--..,--2
70 80 90
TORQUE VERSUS ANGLE OF CLOSURE SURGE FLOW 1,500 CFS
LAKE ELEVATION +7 CANAL LEVEL VARIES
~L' __________________________________________________________________________________________________ ------------------------------~
" r
~ rn
250 V1 00
200
VJ ~ ~ ,
150 l-Ll..
w' ::J 0 a: 0 I-
:::!: ::J 100 :::!: x <{
:::!:
50
o o 10 20 30 40 50 60
ANGLE OF CLOSURE, DEGREES
GATE21'
70 80 90
TORQUE VERSUS ANGLE OF CLOSURE SURGE FLOW 2,000 CFS
LAKE ELEVATION +7 CANAL LEVEL VARIES
"'1J r» -I rn
V1 ~
Vl 0..
:.:: I
f-u.. w-:::l a a: 0 f-
::::!: :::l ::::!: x ~ ::::!:
200
175
150
125
100
75
50
25
0 0 10 20 30 40 50 60 70
ANGLE OF CLOSURE, DEGREES
7
80 90
TORQUE VERSUS ANGLE OF CLOSURE SURGE FLOW 500 CFS
LAKE ELEVATION +7 7.8-FTWAVE
7.3-SEC PERIOD CANAL LEVEL VARIES
"'C r » 250
-I IT1
0' 0
I 200
en c.. :.!
I I- 150 u. w' :::> a ex: 0 I-:!: :::> 100 :!: x <t: :!:
50
o o 10 20 30 40 50 60 70
ANGLE OF CLOSURE, DEGREES
,"
8
~7
80 90
TORQUE VERSUS ANGLE OF CLOSURE SURGE FLOW 1,000 CFS
LAKE ELEVATION +7 7.8-FT WAVE
7.3-SEC PERIOD CANAL LEVEL VARIES
" r
~ rn 0"
en Cl.
~ I
l-Ll.
w' => 0 a: 0 I-::!: => ::!: X ~ ::!:
250
200 t-
150
100
50
o o 10 20 30 40 50 60 70
ANGLE OF CLOSURE, DEGREES
8
11.-3
2
80 90
TORQUE VERSUS ANGLE OF CLOSURE SURGE FLOW 1,500 CFS
LAKE ELEVATION +7 7.8-FTWAVE
7.3-SEC PERIOD CANAL LEVEL VARI ES
~I 250 :l> -I ITI
~I 200 t-
en Il.
::.:: I 150 I-~
w' :::> a II: 0 I-
:::!: :::> 100 :::!: x « :::!:
50
o o 10 20
GATE 7 ~ /8 6
..-3
30 40 50 60 70 80
ANGLE OF CLOSURE, DEGREES
90
TORQUE VERSUS ANGLE OF CLOSURE SURGE FLOW 2,000 CFS
LAKE ELEVATION +7 7.8-FT WAVE
7.3-SEC PERIOD CANAL LEVEL VARIES
APPENDIX A: TORQUE MEASUREMENTS ON BUTTERFLY GATES TYPE 33 DESIGN
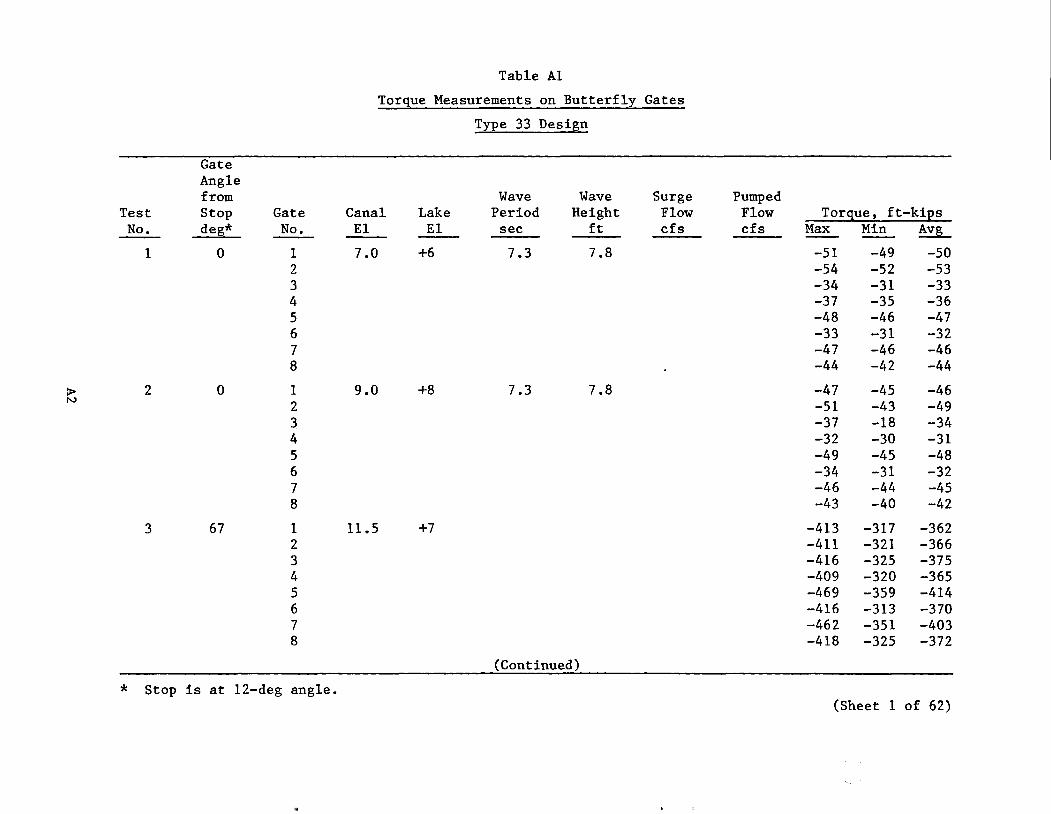
Table Al
Torque Measurements on Butterf1l Gates
Type 33 Design
Gate Angle from Wave Wave Surge Pumped
Test Stop Gate Canal Lake Period Height Flow Flow Torgue, ft-kiEs No. deg* No. E1 E1 sec ft cfs cfs Max Min Avg
1 0 1 7.0 +6 7.3 7.8 -51 -49 -50 2 -54 -52 -53 3 -34 -31 -33 4 -37 -35 -36 5 -48 -46 -47 6 -33 -31 -32 7 -47 -46 -46 8 -44 -42 -44
:> 2 0 1 9.0 +8 7.3 7.8 -47 -45 -46 N 2 -51 -43 -49
3 -37 -18 -34 4 -32 -30 -31 5 -49 -45 -48 6 -34 -31 -32 7 -46 -44 -45 8 -43 -40 -42
3 67 1 11.5 +7 -413 -317 -362 2 -411 -321 -366 3 -416 -325 -375 4 -409 -320 -365 5 -469 -359 -414 6 -416 -313 -370 7 -462 -351 -403 8 -418 -325 -372
(Continued)
* Stop is at 12-deg angle. (Sheet 1 of 62)
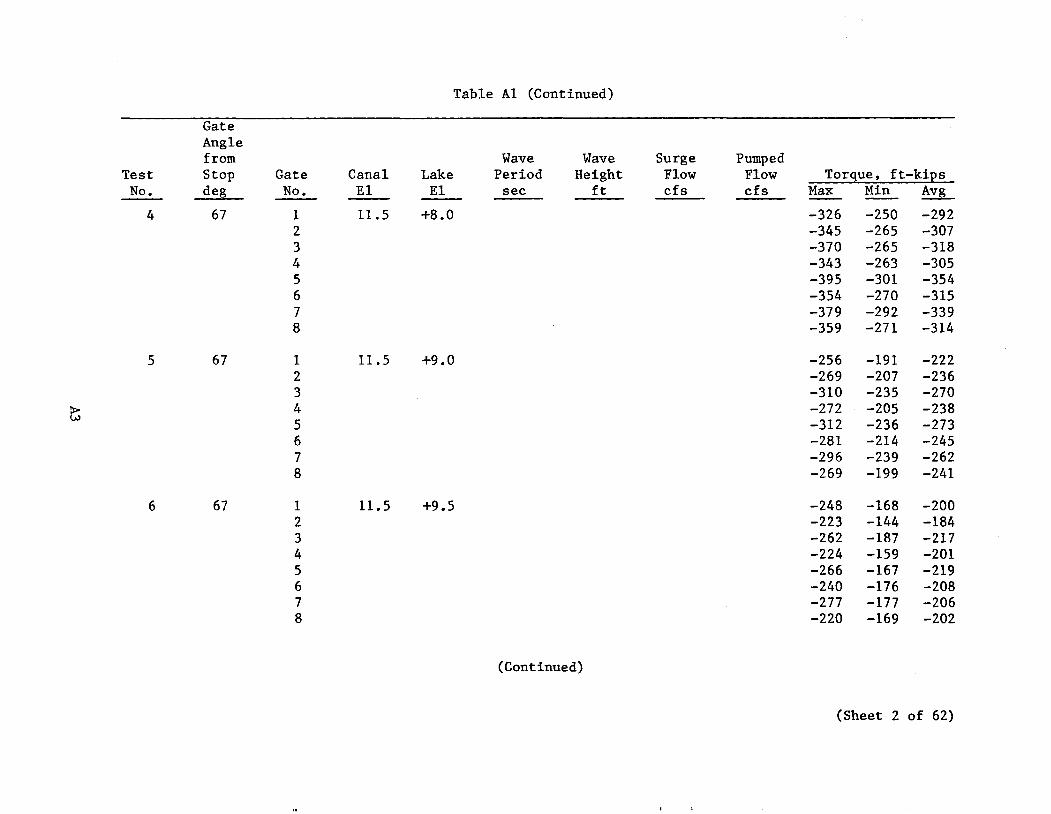
Table Al (Continued)
Gate Angle from Wave Wave Surge Pumped
Test Stop Gate Canal Lake Period Height Flow Flow Torque, ft-ki:es No. deg No. EI EI sec ft cfs cfs Max Min Avg
4 67 1 11.5 +8.0 -326 -250 -292 2 -345 -265 -307 3 -370 -265 -318 4 -343 -263 -305 5 -395 -301 -354 6 -354 -270 -315 7 -379 -292 -339 8 -359 -271 -314
5 67 1 11.5 +9.0 -256 -191 -222 2 -269 -207 -236 3 -310 -235 -270
P> 4 -272 -205 -238 VJ
5 -312 -236 -273 6 -281 -214 -245 7 -296 -239 -262 8 -269 -199 -241
6 67 1 11.5 +9.5 -248 -168 -200 2 -223 -144 -184 3 -262 -187 -217 4 -224 -159 -201 5 -266 -167 -219 6 -240 -176 -208 7 -277 -177 -206 8 -220 -169 -202
(Continued)
(Sheet 2 of 62)
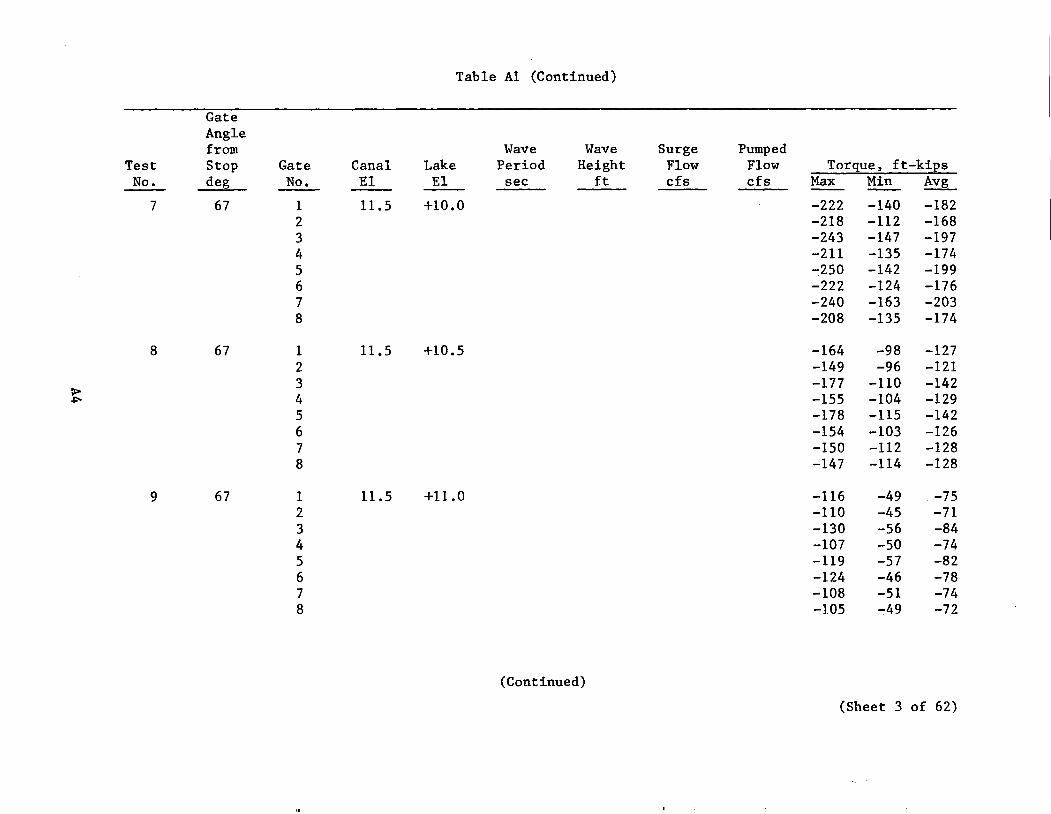
Table Al (Continued)
Gate Angle from Wave Wave Surge Pumped
Test Stop Gate Canal Lake Period Height Flow Flow Torque, ft-kiEs No. deg No. EI EI sec ft cfs cfs Max Min Avg
7 67 1 11.5 +10.0 -222 -140 -182 2 -218 -112 -168 3 -243 -147 -197 4 -211 -135 -174 5 -250 -142 -199 6 -222 -124 -176 7 -240 -163 -203 8 -208 -135 -174
8 67 1 11.5 +10.5 -164 -98 -127 2 -149 -96 -121
> 3 -177 -110 -142 .po 4 -155 -104 -129
5 -178 -115 -142 6 -154 -103 -126 7 -150 -112 -128 8 -147 -114 -128
9 67 1 11.5 +11.0 -116 -49 -75 2 -110 -45 -71 3 -130 -56 -84 4 -107 -50 -74 5 -119 -57 -82 6 -124 -46 -78 7 -108 -51 -74 8 -105 -49 -72
(Continued)
(Sheet 3 of 62)
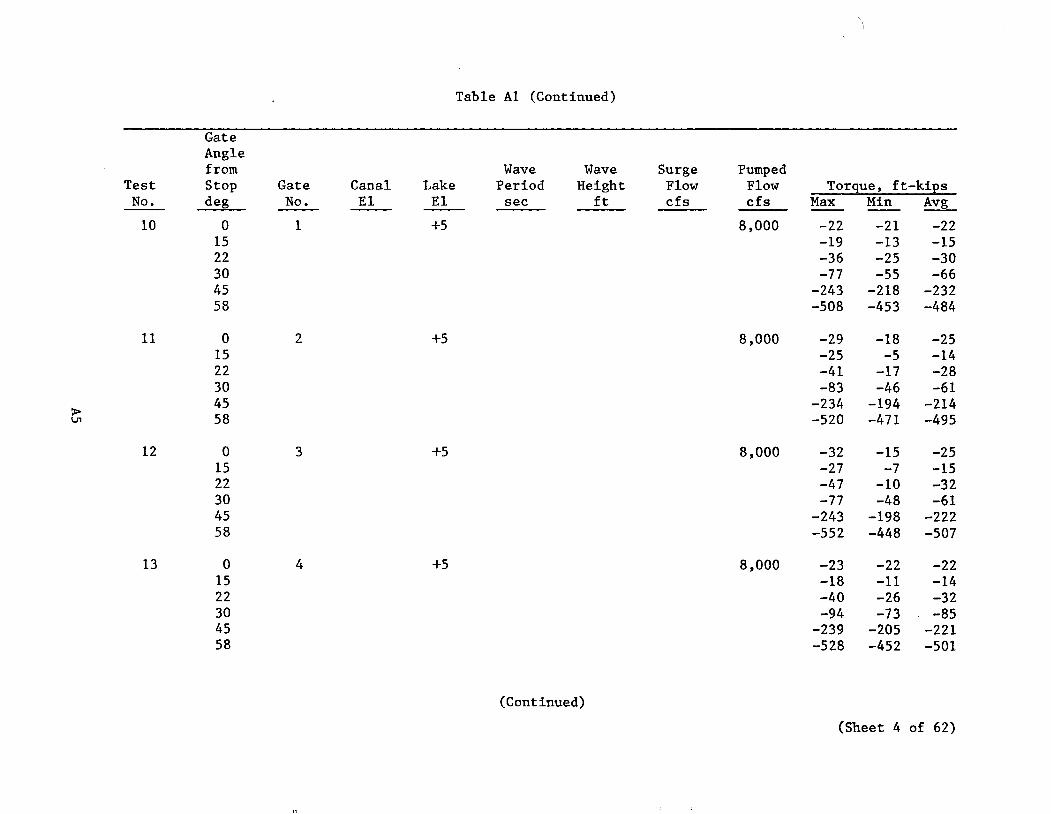
Table Al (Continued)
Gate Angle from Wave Wave Surge Pumped
Test Stop Gate Canal Lake Period Height Flow Flow Torque, ft-kiEs No. deg No. El El sec ft cfs cfs Max Min Avg
10 0 1 +5 8,000 -22 -21 -22 15 -19 -13 -15 22 -36 -25 -30 30 -77 -55 -66 45 -243 -218 -232 58 -508 -453 -484
11 0 2 +5 8,000 -29 -18 -25 15 -25 -5 -14 22 -41 -17 -28 30 -83 -46 -61
> 45 -234 -194 -214
VI 58 -520 -471 -495
12 0 3 +5 8,000 -32 -15 -25 15 -27 -7 -15 22 -47 -10 -32 30 -77 -48 -61 45 -243 -198 -222 58 -552 -448 -507
13 0 4 +5 8,000 -23 -22 -22 15 -18 -11 -14 22 -40 -26 -32 30 -94 -73 -85 45 -239 -205 -221 58 -528 -452 -501
(Continued)
(Sheet 4 of 62)
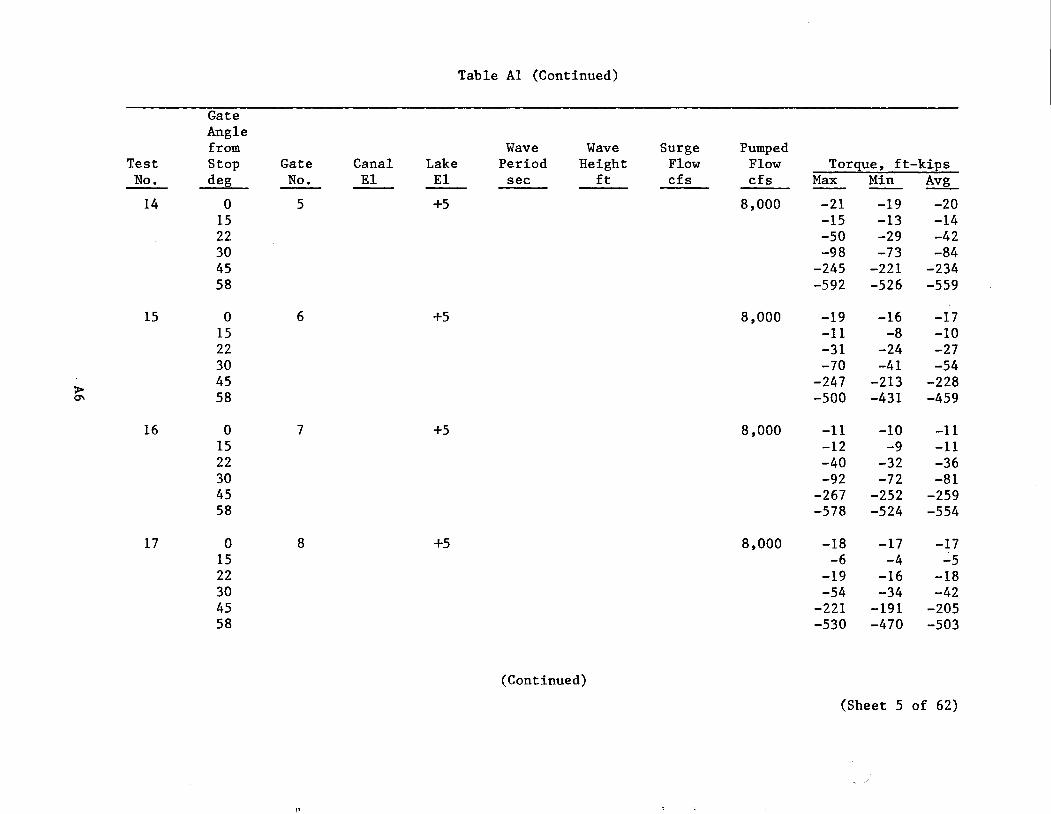
Table Al (Continued)
Gate Angle from Wave Wave Surge Pumped
Test Stop Gate Canal Lake Period Height Flow Flow Torque, ft-kips No. deg No. El El sec ft cfs cfs Max Min Avg
14 0 5 +5 8,000 -21 -19 -20 15 -15 -13 -14 22 -50 -29 -42 30 -98 -73 -84 45 -245 -221 -234 58 -592 -526 -559
15 0 6 +5 8,000 -19 -16 -17 15 -11 -8 -10 22 -31 -24 -27 30 -70 -41 -54
> 45 -247 -213 -228
'" 58 -500 -431 -459
16 0 7 +5 8,000 -11 -10 -11 15 -12 -9 -11 22 -40 -32 -36 30 -92 -72 -81 45 -267 -252 -259 58 -578 -524 -554
17 0 8 +5 8,000 -18 -17 -17 15 -6 -4 -5 22 -19 -16 -18 30 -54 -34 -42 45 -221 -191 -205 58 -530 -470 -503
(Continued)
(Sheet 5 of 62)
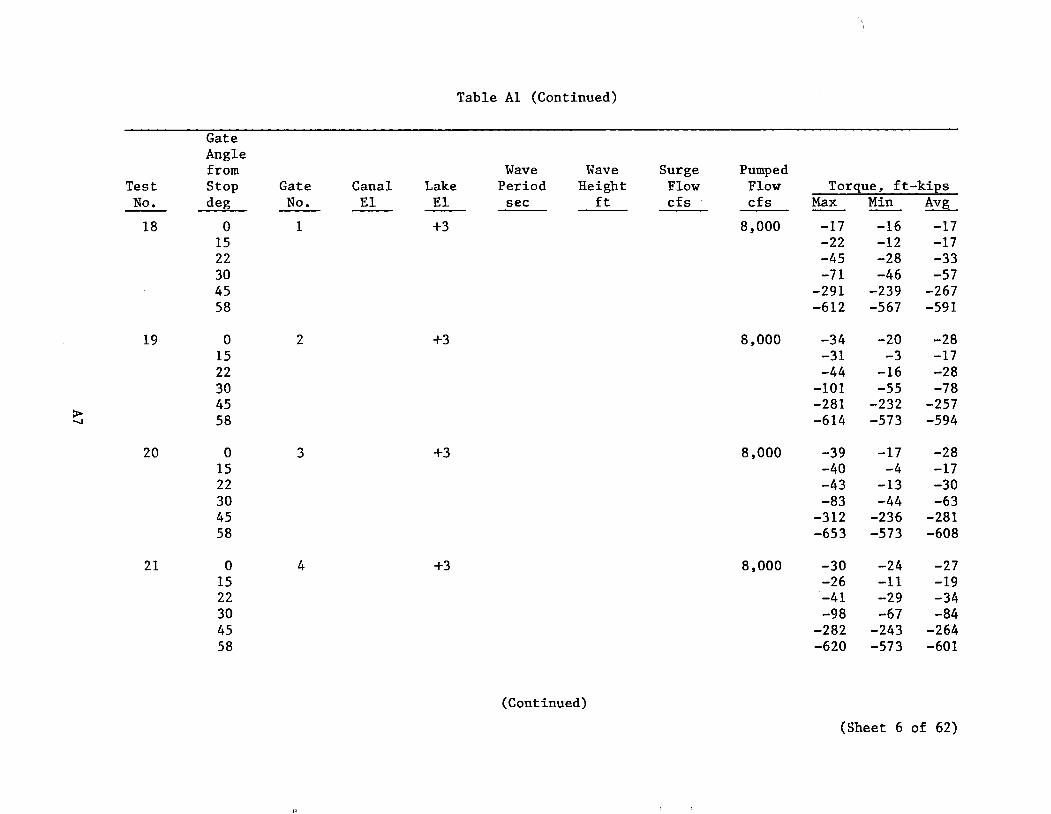
Table Al (Continued)
Gate Angle from Wave Wave Surge Pumped
Test Stop Gate Canal Lake Period Height Flow Flow Torque, ft-kips No. deg No. El El see ft efs efs Max Min Avg
18 0 1 +3 8,000 -17 -16 -17 15 -22 -12 -17 22 -45 -28 -33 30 -71 -46 -57 45 -291 -239 -267 58 -612 -567 -591
19 0 2 +3 8,000 -34 -20 -28 15 -31 -3 -17 22 -44 -16 -28 30 -101 -55 -78 45 -281 -232 -257
> 58 -614 -573 -594 ......
20 0 3 +3 8,000 -39 -17 -28 15 -40 -4 -17 22 -43 -13 -30 30 -83 -44 -63 45 -312 -236 -281 58 -653 -573 -608
21 0 4 +3 8,000 -30 -24 -27 15 -26 -11 -19 22 -41 -29 -34 30 -98 -67 -84 45 -282 -243 -264 58 -620 -573 -601
(Continued)
(Sheet 6 of 62)
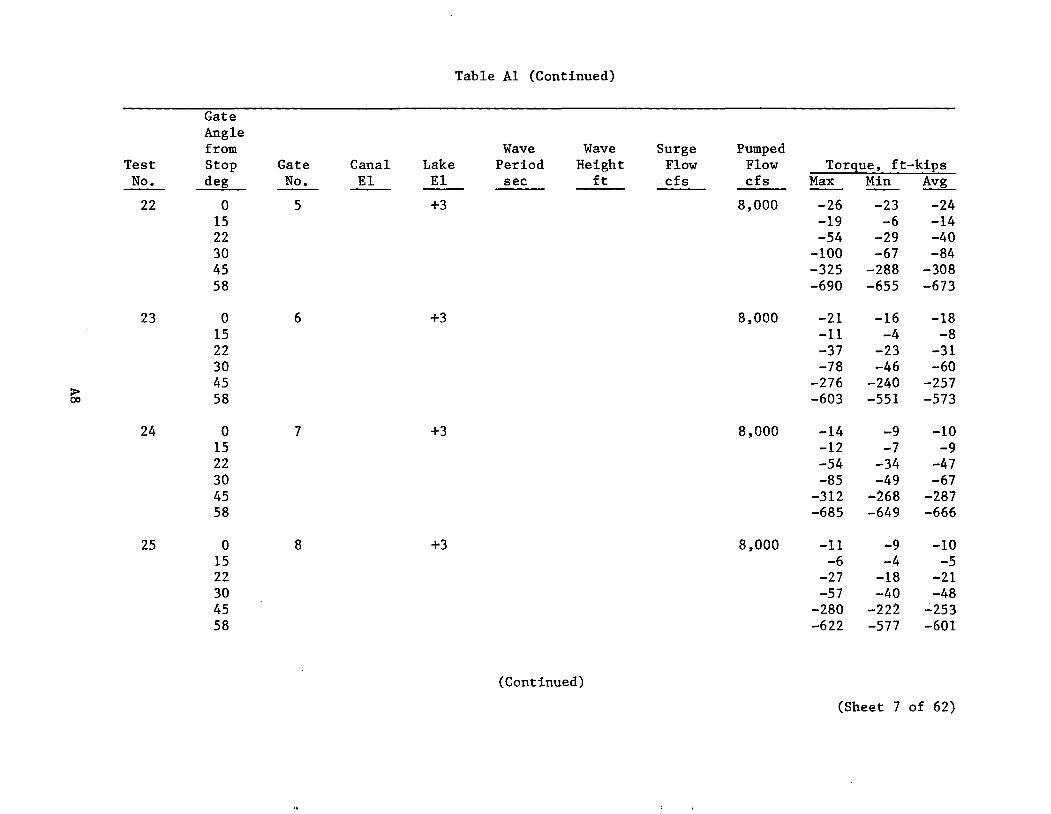
Table Al (Continued)
Gate Angle from Wave Wave Surge Pumped
Test Stop Gate Canal Lake Period Height Flow Flow Torque, ft-kiEs No. deg No. EI EI sec ft cfs cfs Max Min Avg
22 0 5 +3 8,000 -26 -23 -24 15 -19 -6 -14 22 -54 -29 -40 30 -100 -67 -84 45 -325 -288 -308 58 -690 -655 -673
23 0 6 +3 8,000 -21 -16 -18 15 -11 -4 -8 22 -37 -23 -31 30 -78 -46 -60 45 -276 -240 -257
> 58 -603 -551 -573 00
24 0 7 +3 8,000 -14 -9 -10 15 -12 -7 -9 22 -54 -34 -47 30 -85 -49 -67 45 -312 -268 -287 58 -685 -649 -666
25 0 8 +3 8,000 -11 -9 -10 15 -6 -4 -5 22 -27 -18 -21 30 -57 -40 -48 45 -280 -222 -253 58 -622 -577 -601
(Continued)
(Sheet 7 of 62)
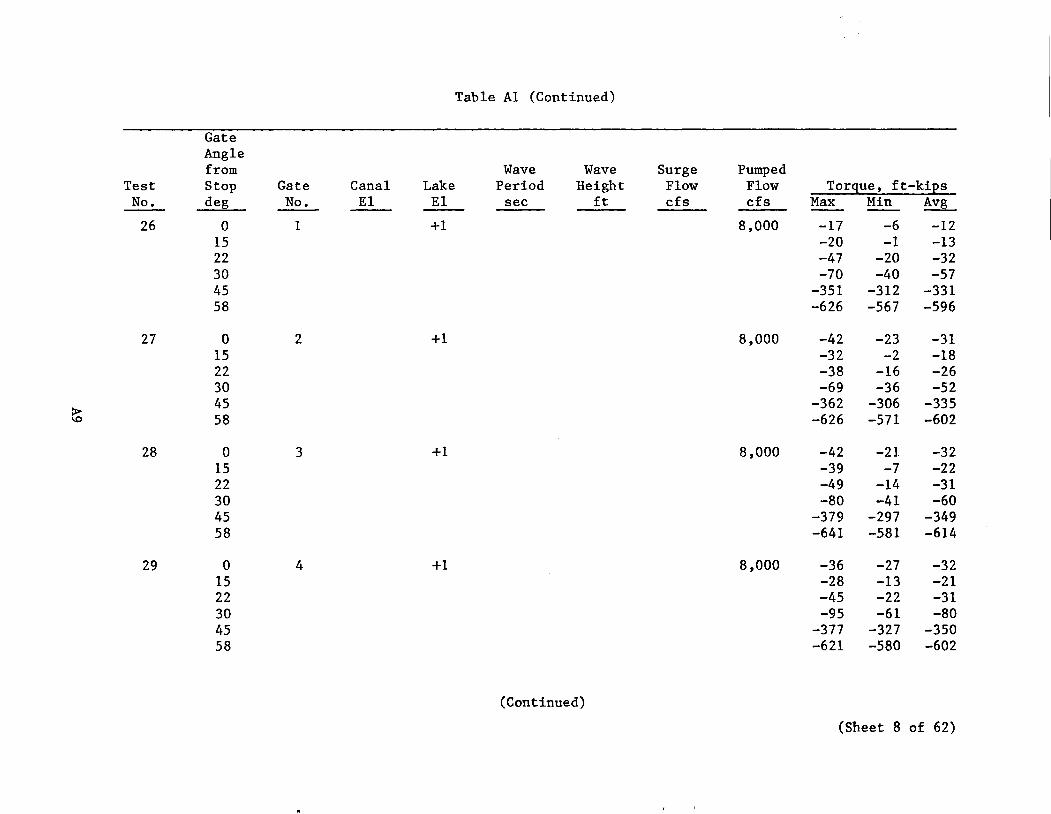
Table Al (Continued)
Gate Angle from Wave Wave Surge Pumped
Test Stop Gate Canal Lake Period Height Flow Flow Torque, ft-kips No. deg No. El El sec ft cfs cfs Max Min Avg
26 0 1 +1 8,000 -17 -6 -12 15 -20 -1 -13 22 -47 -20 -32 30 -70 -40 -57 45 -351 -312 -331 58 -626 -567 -596
27 0 2 +1 8,000 -42 -23 -31 15 -32 -2 -18 22 -38 -16 -26 30 -69 -36 -52
> 45 -362 -306 -335 \0 58 -626 -571 -602
28 0 3 +1 8,000 -42 -21 -32 15 -39 -7 -22 22 -49 -14 -31 30 -80 -41 -60 45 -379 -297 -349 58 -641 -581 -614
29 0 4 +1 8,000 -36 -27 -32 15 -28 -13 -21 22 -45 -22 -31 30 -95 -61 -80 45 -377 -327 -350 58 -621 -580 -602
(Continued)
(Sheet 8 of 62)
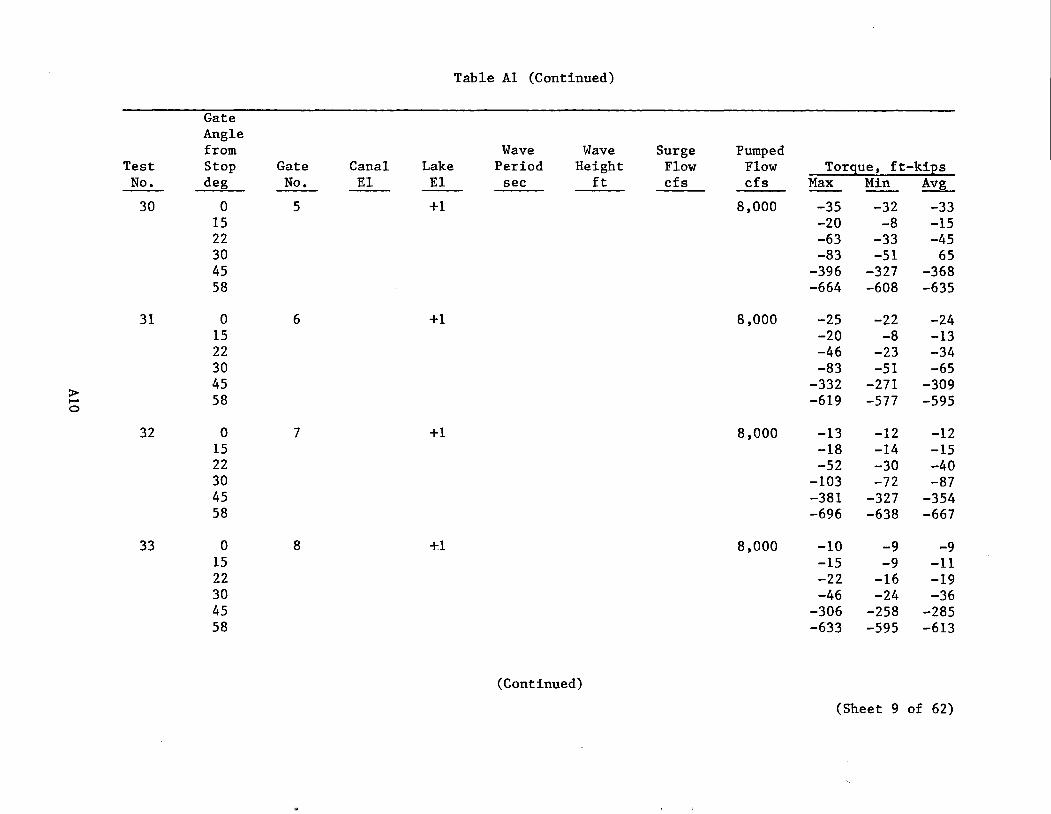
Table Al (Continued)
Gate Angle from Wave Wave Surge Pumped
Test Stop Gate Canal Lake Period Height Flow Flow Torque, ft-kips No. de1L- No. EI EI sec ft cfs cfs Max Min Avg
30 0 5 +1 8,000 -35 -32 -33 15 -20 -8 -15 22 -63 -33 -45 30 -83 -51 65 45 -396 -327 -368 58 -664 -608 -635
31 0 6 +1 8,000 -25 -22 -24 15 -20 -8 -13 22 -46 -23 -34 30 -83 -51 -65 45 -332 -271 -309 > 58 -619 -577 -595 ....
0
32 0 7 +1 8,000 -13 -12 -12 15 -18 -14 -15 22 -52 -30 -40 30 -103 -72 -87 45 -381 -327 -354 58 -696 -638 -667
33 0 8 +1 8,000 -10 -9 -9 15 -15 -9 -11 22 -22 -16 -19 30 -46 -24 -36 45 -306 -258 -285 58 -633 -595 -613
(Continued)
(Sheet 9 of 62)
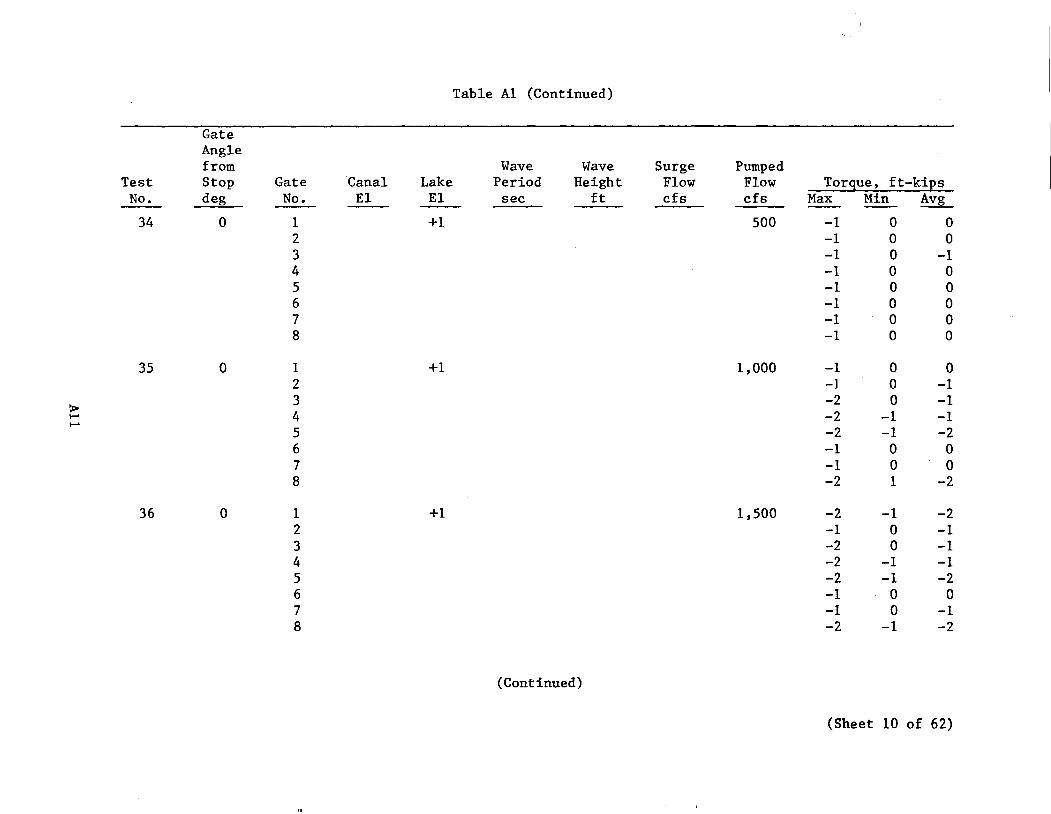
Table Al (Continued)
Gate Angle from Wave Wave Surge Pumped
Test Stop Gate Canal Lake Period Height Flow Flow Torgue, ft-kips No. deg No. E1 E1 sec ft cfs cfs Max Min Avg
34 0 1 +1 500 -1 0 0 2 -1 0 0 3 -1 0 -1 4 -1 0 0 5 -1 0 0 6 -1 0 0 7 -1 0 0 8 -1 0 0
35 0 1 +1 1,000 -1 0 0 2 -1 0 -1
> 3 -2 0 -1 ..... 4 -2 -1 -1 .....
5 -2 -1 -2 6 -1 0 0 7 -1 0 0 8 -2 1 -2
36 0 1 +1 1,500 -2 -1 -2 2 -1 0 -1 3 -2 0 -1 4 -2 -1 -1 5 -2 -1 -2 6 -1 0 0 7 -1 0 -1 8 -2 -1 -2
(Continued)
(Sheet 10 of 62)
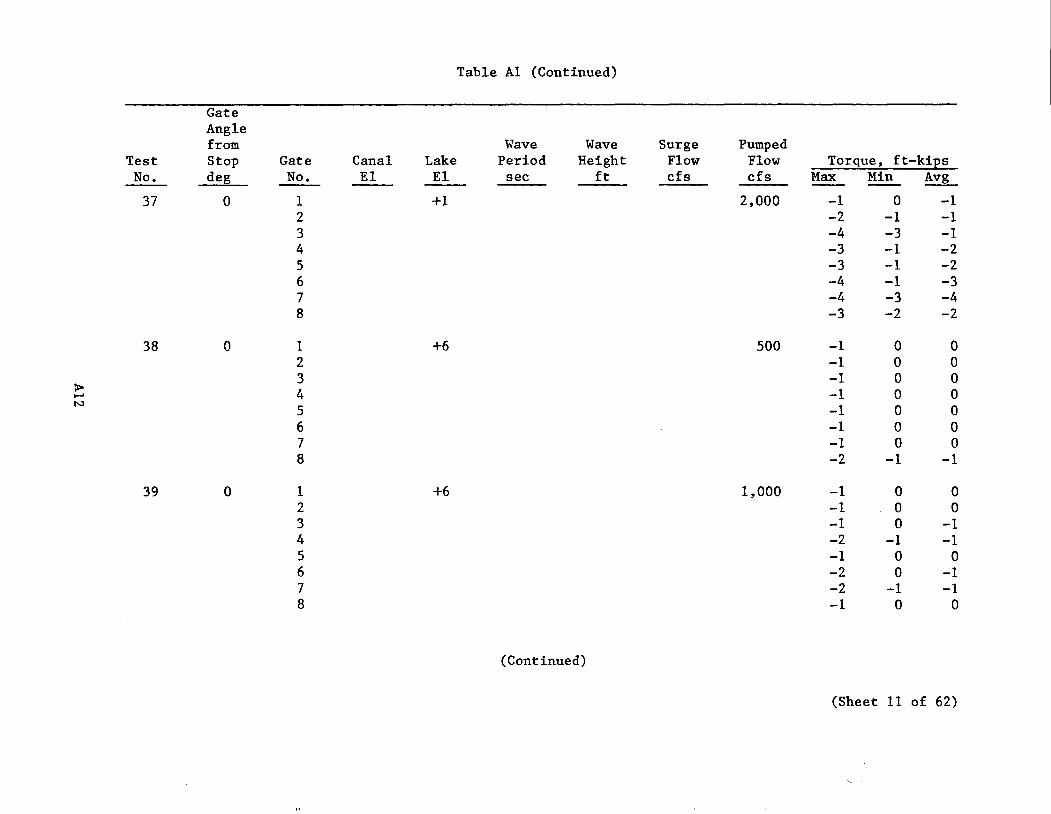
Table Al (Continued)
Gate Angle from Wave Wave Surge Pumped
Test Stop Gate Canal Lake Period Height Flow Flow Torque, ft-kips No. deg No. EI EI sec ft cfs cfs Max Min Avg
37 0 1 +1 2,000 -1 0 -1 2 -2 -1 -1 3 -4 -3 -1 4 -3 -1 -2 5 -3 -1 -2 6 -4 -1 -3 7 -4 -3 -4 8 -3 -2 -2
38 0 1 +6 500 -1 0 0 2 -1 0 0 3 -1 0 0
> 4 -1 0 0 t-' N
5 -1 0 0 6 -1 0 0 7 -1 0 0 8 -2 -1 -1
39 0 1 +6 1,000 -1 0 0 2 -1 0 0 3 -1 0 -1 4 -2 -1 -1 5 -1 0 0 6 -2 0 -1 7 -2 -1 -1 8 -1 0 0
(Continued)
(Sheet 11 of 62)
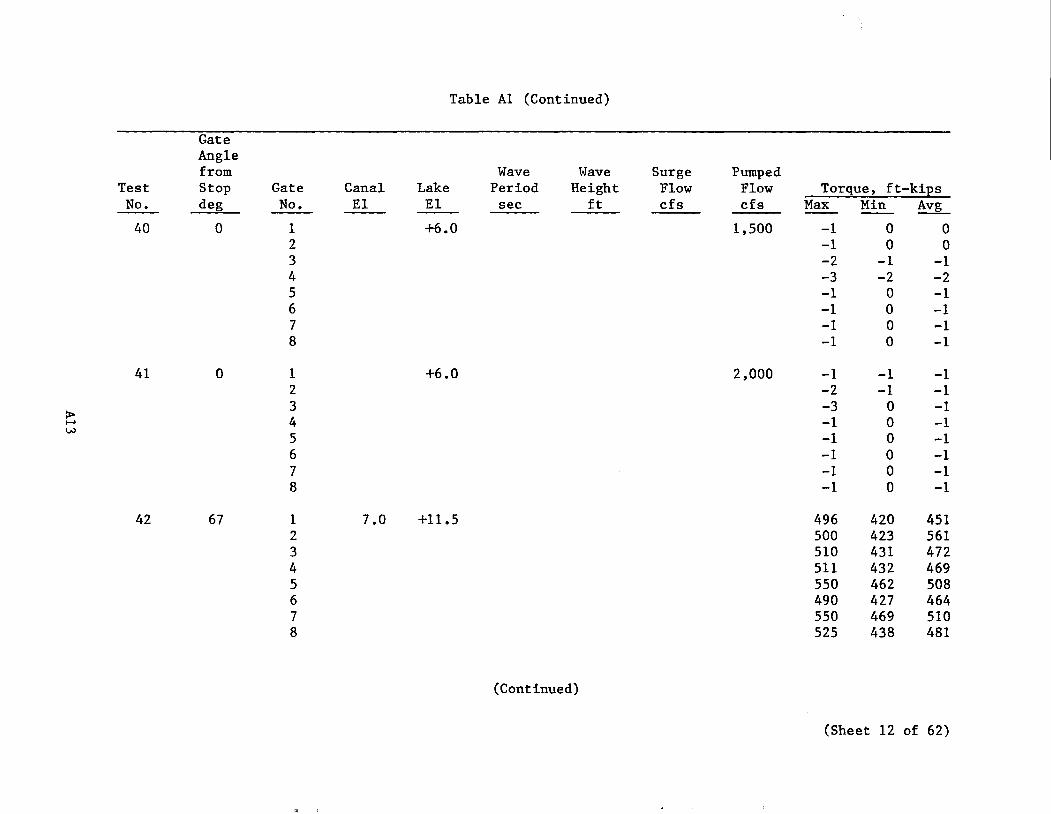
Table A1 (Continued)
Gate Angle from Wave Wave Surge Pumped
Test Stop Gate Canal Lake Period Height Flow Flow Torque, ft-kips No. deg No. EI EI see ft efs efs Max Min Avg
40 0 1 +6.0 1,500 -1 0 0 2 -1 0 0 3 -2 -1 -1 4 -3 -2 -2 5 -1 0 -1 6 -1 0 -1 7 -1 0 -1 8 -1 0 -1
41 0 1 +6.0 2,000 -1 -1 -1 2 -2 -1 -1
> 3 -3 0 -1
t-' 4 -1 0 -1 w 5 -1 0 -1 6 -1 0 -1 7 -1 0 -1 8 -1 0 -1
42 67 1 7.0 +11.5 496 420 451 2 500 423 561 3 510 431 472 4 511 432 469 5 550 462 508 6 490 427 464 7 550 469 510 8 525 438 481
(Continued)
(Sheet 12 of 62)
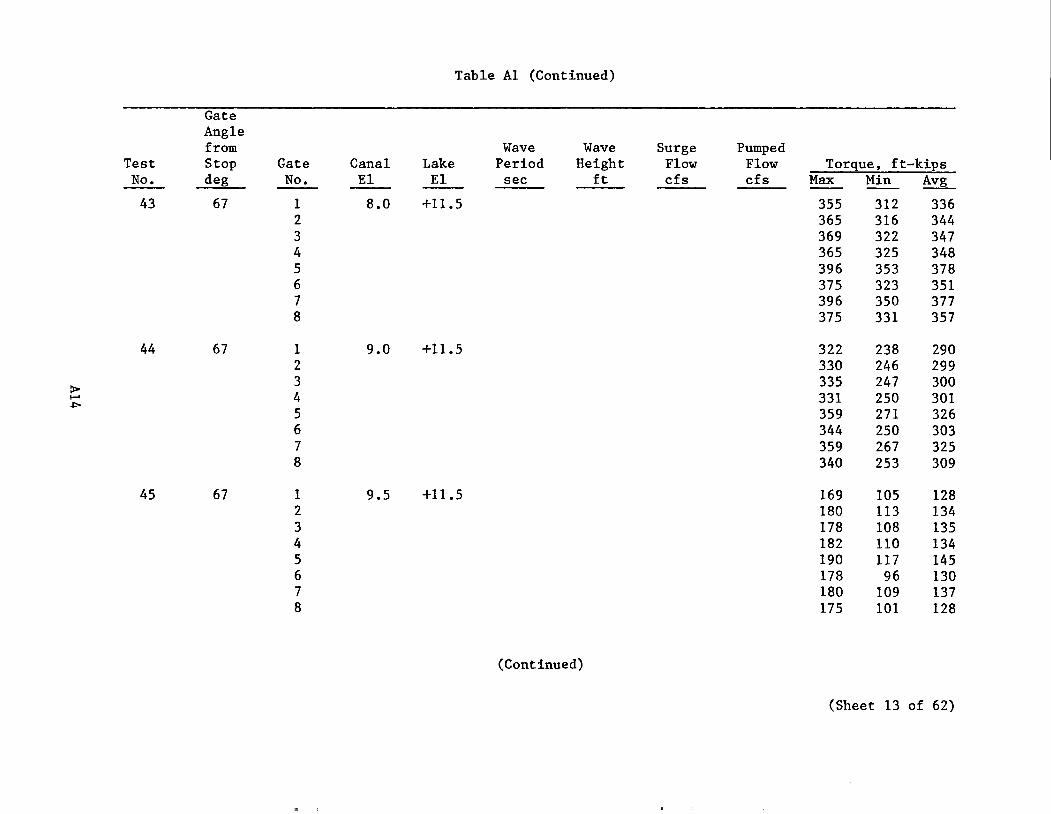
Table Al (Continued)
Gate Angle from Wave Wave Surge Pumped
Test Stop Gate Canal Lake Period Height Flow Flow Torque, ft-kiEs No. deg No. EI EI sec ft cfs cfs Max Min Avg
43 67 1 8.0 +11.5 355 312 336 2 365 316 344 3 369 322 347 4 365 325 348 5 396 353 378 6 375 323 351 7 396 350 377 8 375 331 357
44 67 1 9.0 +11.5 322 238 290 2 330 246 299
> 3 335 247 300 ..... 4 331 250 301 .po
5 359 271 326 6 344 250 303 7 359 267 325 8 340 253 309
45 67 1 9.5 +11.5 169 105 128 2 180 113 134 3 178 108 135 4 182 110 134 5 190 117 145 6 178 96 130 7 180 109 137 8 175 101 128
(Continued)
(Sheet 13 of 62)
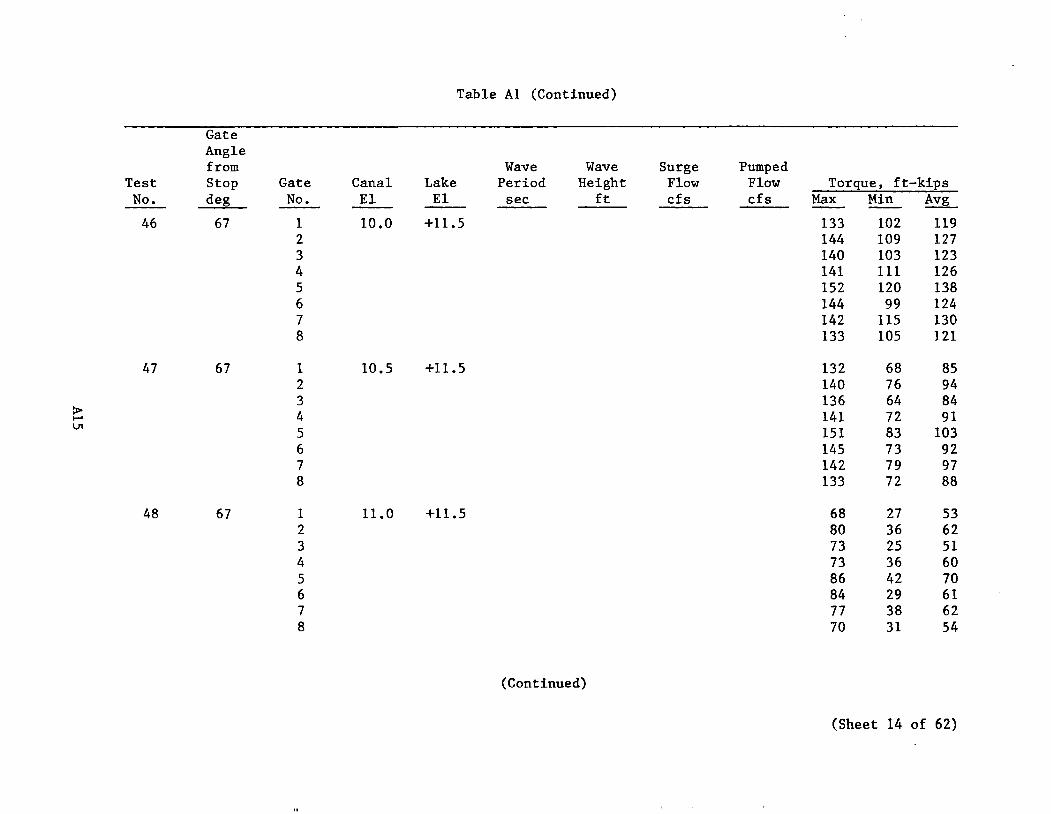
Table Al (Continued)
Gate Angle from Wave Wave Surge Pumped
Test Stop Gate Canal Lake Period Height Flow Flow Torque, ft-kips No. deg No. El El sec ft cfs cfs Max Min Avg
46 67 1 10.0 +11.5 133 102 119 2 144 109 12.7 3 140 103 123 4 141 111 126 5 152 120 138 6 144 99 124 7 142 115 130 8 133 105 121
47 67 1 10.5 +11.5 132 68 85 2 140 76 94 3 136 64 84
:> 4 141 72 91 1-4 VI 5 151 83 103
6 145 73 92 7 142 79 97 8 133 72 88
48 67 1 11.0 +11.5 68 27 53 2 80 36 62 3 73 25 51 4 73 36 60 5 86 42 70 6 84 29 61 7 77 38 62 8 70 31 54
(Continued)
(Sheet 14 of 62)

Table Al (Continued)
Gate Angle from Wave Wave Surge Pumped
Test Stop Gate Canal Lake Period Height Flow Flow Torque, ft-kips No. deg No. EI EI sec ft cfs cfs Max Min Avg
49 67 1 7 +11.5 7.3 7.8 438 375 406 2 447 373 406 3 482 393 428 4 433 366 394 5 528 449 481 6 487 431 456 7 498 442 467 8 466 401 428
50 67 1 8 +11.5 7.3 7.8 368 252 313 2 399 258 323
> 3 411 241 324
.... 4 385 230 305 0\
5 469 280 374 6 426 279 340 7 449 307 360 8 388 285 333
51 67 1 9 +11.5 7.3 7.8 308 200 242 2 330 190 245 3 338 171 240 4 318 173 234 5 365 228 285 6 312 232 263 7 326 244 279 8 295 224 257
(Continued)
(Sheet 15 of 62)
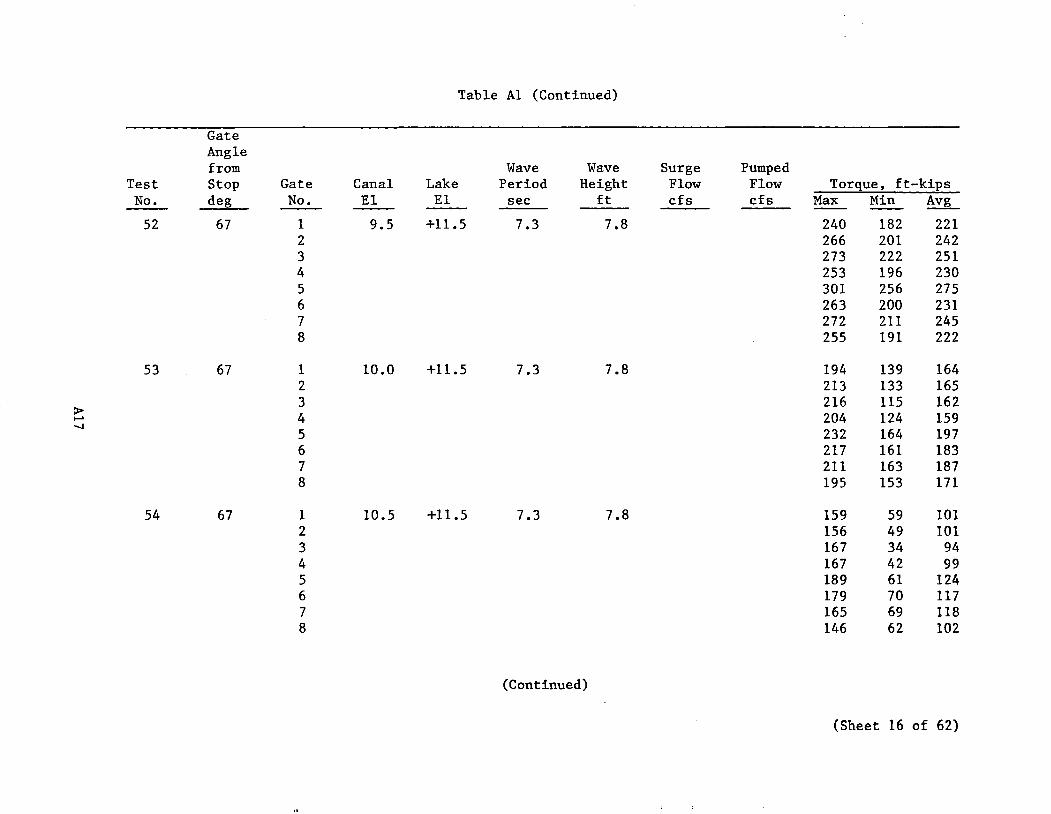
Table Al (Continued)
Gate Angle from Wave Wave Surge Pumped
Test Stop Gate Canal Lake Period Height Flow Flow Torque, ft-kips No. deg No. EI EI sec ft cfs cfs Max Min Avg
52 67 1 9.5 +ll.5 7.3 7.8 240 182 221 2 266 201 242 3 273 222 251 4 253 196 230 5 301 256 275 6 263 200 231 7 272 2ll 245 8 255 191 222
53 67 1 10.0 +ll.5 7.3 7.8 194 139 164 2 213 133 165 3 216 ll5 162
> 4 204 124 159 t-' -...J
5 232 164 197 6 217 161 183 7 2ll 163 187 8 195 153 171
54 67 1 10.5 +ll.5 7.3 7.8 159 59 101 2 156 49 101 3 167 34 94 4 167 42 99 5 189 61 124 6 179 70 ll7 7 165 69 ll8 8 146 62 102
(Continued)
(Sheet 16 of 62)
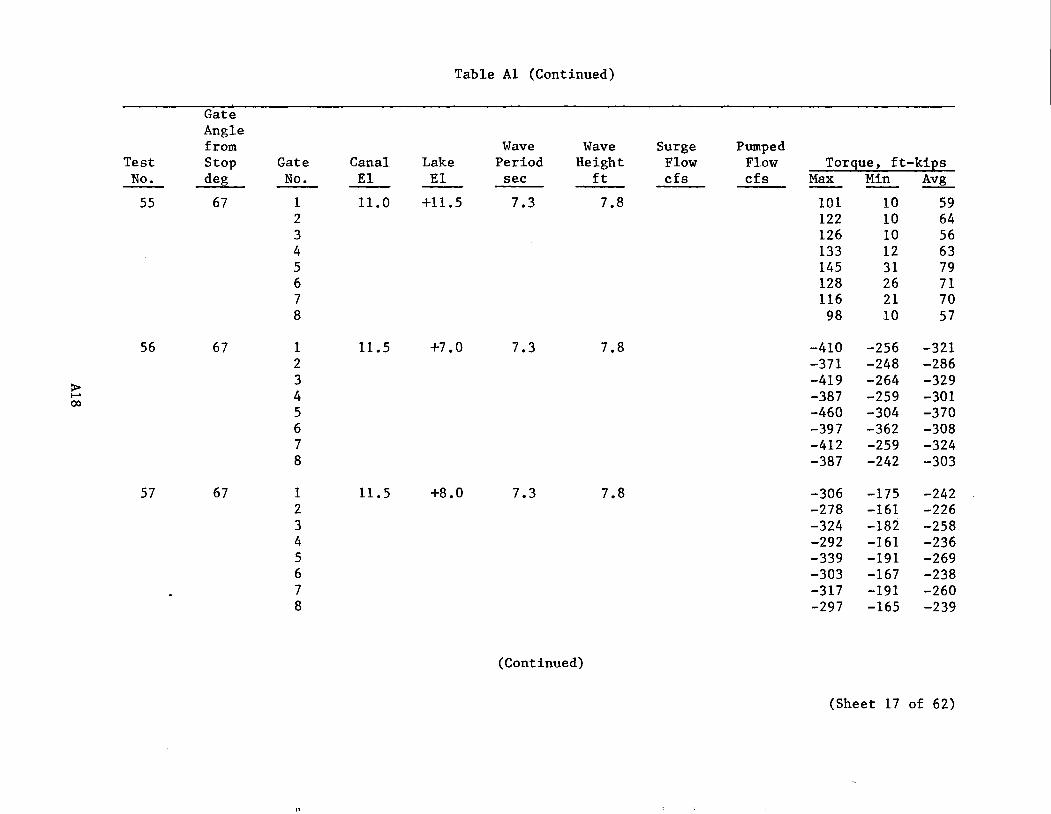
Table Al (Continued)
Gate Angle from Wave Wave Surge Pumped
Test Stop Gate Canal Lake Period Height Flow Flow Torque, ft-kips No. deg No. El EI see ft efs efs Max Min Avg
55 67 1 11.0 +11.5 7.3 7.8 101 10 59 2 122 10 64 3 126 10 56 4 133 12 63 5 145 31 79 6 128 26 71 7 116 21 70 8 98 10 57
56 67 1 11.5 +7.0 7.3 7.8 -410 -256 -321 2 -371 -248 -286
> 3 -419 -264 -329 t-' 4 -387 -259 -301 CIO
5 -460 -304 -370 6 -397 -362 -308 7 -412 -259 -324 8 -387 -242 -303
57 67 1 11.5 +8.0 7.3 7.8 -306 -175 -242 2 -278 -161 -226 3 -324 -182 -258 4 -292 -161 -236 5 -339 -191 -269 6 -303 -167 -238 7 -317 -191 -260 8 -297 -165 -239
(Continued)
(Sheet 17 of 62)
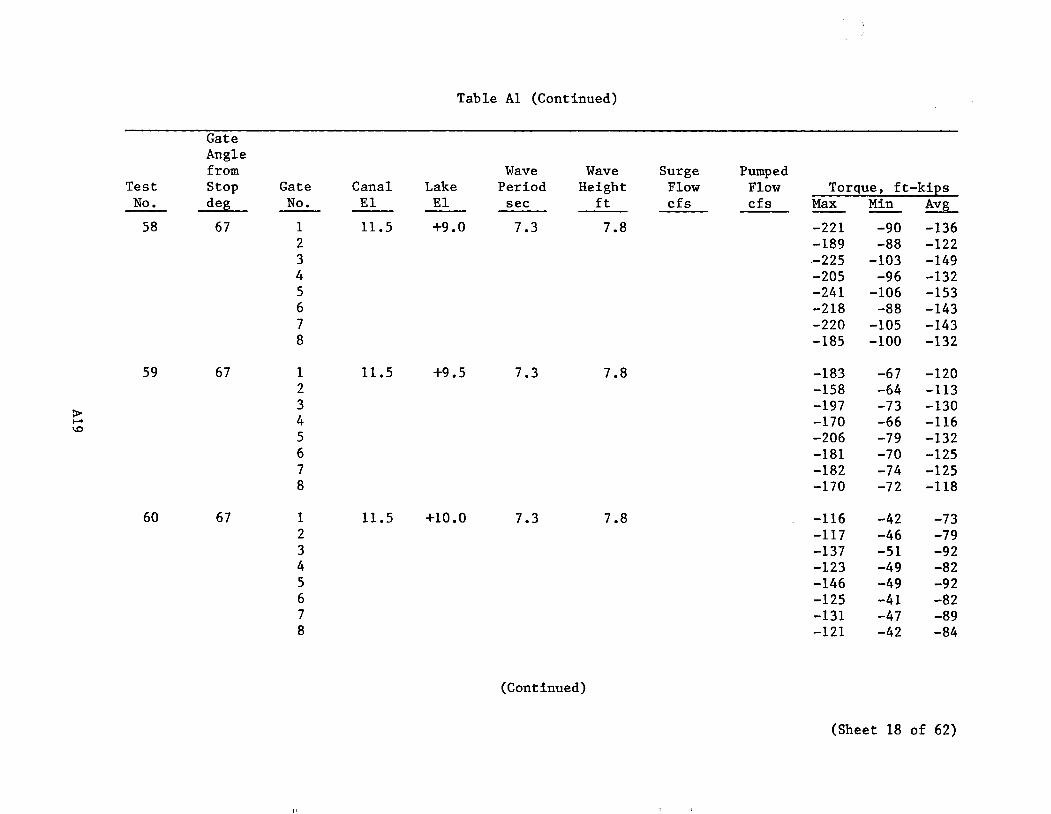
Table Al (Continued)
Gate Angle from Wave Wave Surge Pumped
Test Stop Gate Canal Lake Period Height Flow Flow Torque, ft-kips No. de~ No. EI EI sec ft cfs cfs Max Min Avg
58 67 1 11.5 +9.0 7.3 7.8 -221 -90 -136 2 -189 -88 -122 3 -225 -103 -149 4 -205 -96 -132 5 -241 -106 -153 6 -218 -88 -143 7 -220 -105 -143 8 -185 -100 -132
59 67 1 11.5 +9.5 7.3 7.8 -183 -67 -120 2 -158 -64 -113 3 -197 -73 -130 > 4 -170 -66 -116 ......
\0 5 -206 -79 -132 6 -181 -70 -125 7 -182 -74 -125 8 -170 -72 -118
60 67 1 11.5 +10.0 7.3 7.8 -116 -42 -73 2 -117 -46 -79 3 -137 -51 -92 4 -123 -49 -82 5 -146 -49 -92 6 -125 -41 -82 7 -131 -47 -89 8 -121 -42 -84
(Continued)
(Sheet 18 of 62)
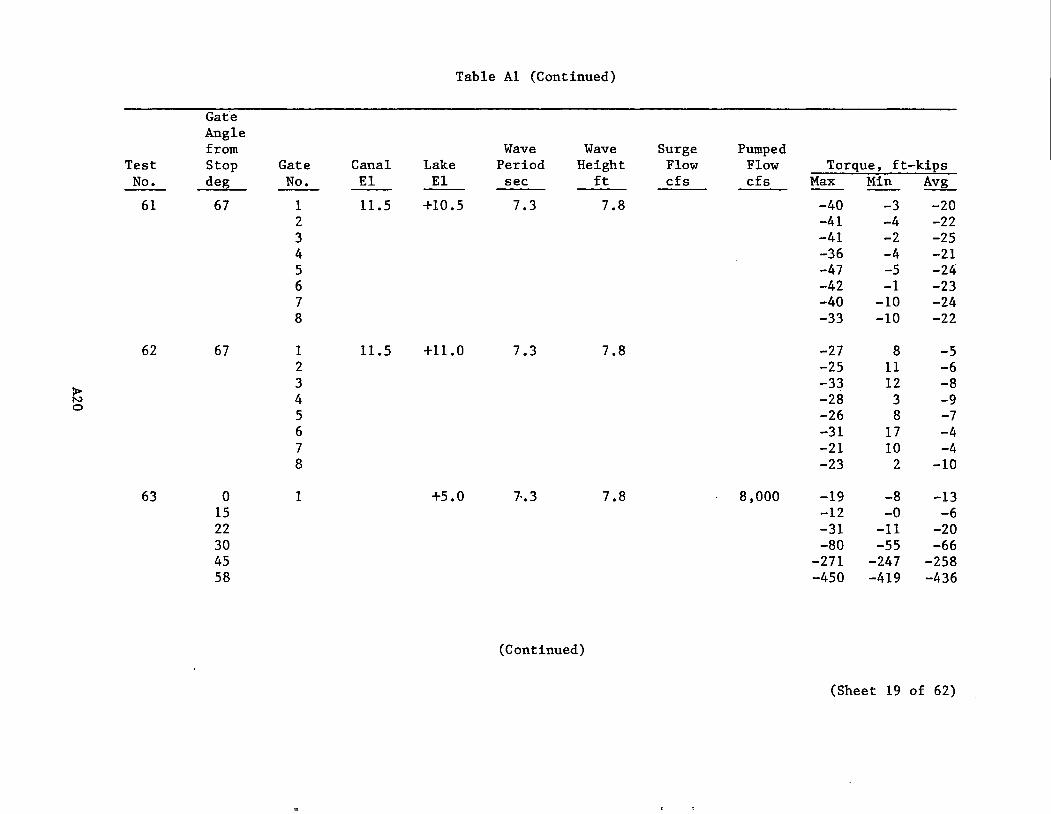
Table Al (Continued)
Gate Angle from Wave Wave Surge Pumped
Test Stop Gate Canal Lake Period Height Flow Flow Torque, ft-kips No. de1L- No. EI EI sec ft cfs cfs Max Min Avg
61 67 1 11.5 +10.5 7.3 7.8 -40 -3 -20 2 -41 -4 -22 3 -41 -2 -25 4 -36 -4 -21 5 -47 -5 -24 6 -42 -1 -23 7 -40 -10 -24 8 -33 -10 -22
62 67 1 11.5 +11.0 7.3 7.8 -27 8 -5 2 -25 11 -6
> 3 -33 12 -8 N 4 -28 3 -9 0
5 -26 8 -7 6 -31 17 -4 7 -21 10 -4 8 -23 2 -10
63 0 1 +5.0 7·.3 7.8 8,000 -19 -8 -13 15 -12 -0 -6 22 -31 -11 -20 30 -80 -55 -66 45 -271 -247 -258 58 -450 -419 -436
(Continued)
(Sheet 19 of 62)
,.
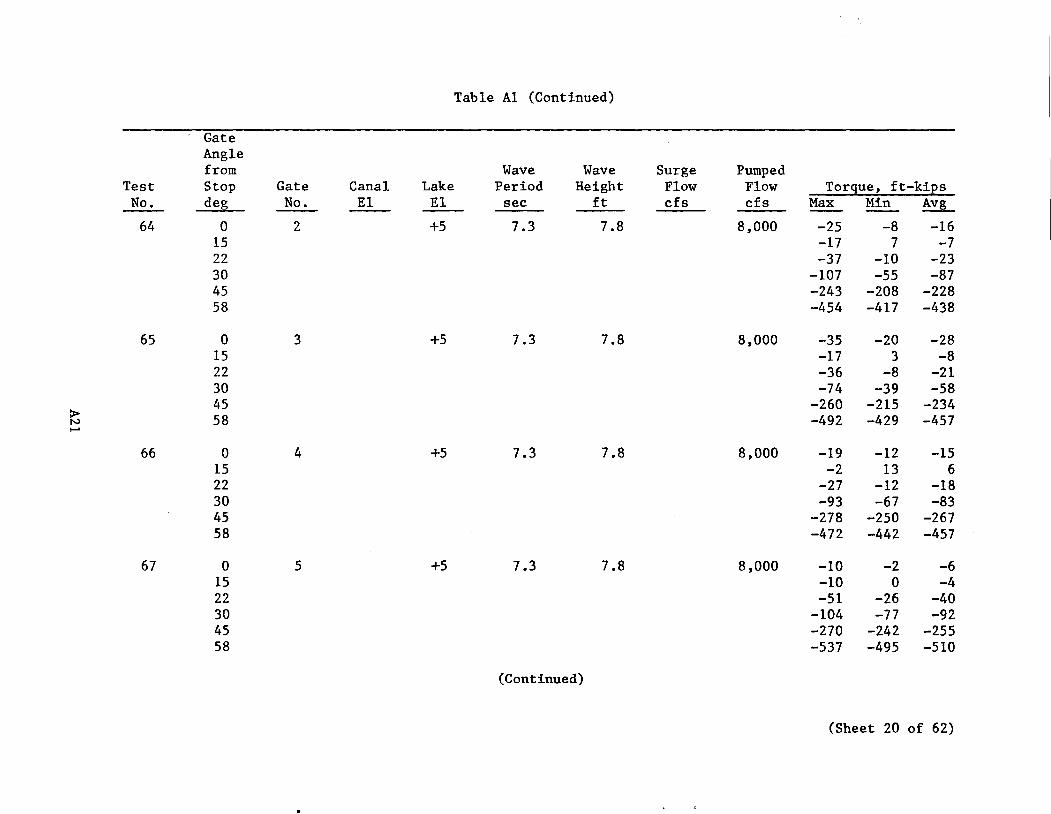
Table Al (Continued)
Gate Angle from Wave Wave Surge Pumped
Test Stop Gate Canal Lake Period Height Flow Flow Torque, ft-kips No. deg No. EI EI sec ft cfs cfs Max Min Avg
64 0 2 +5 7.3 7.8 8,000 -25 -8 -16 15 -17 7 -7 22 -37 -10 -23 30 -107 -55 -87 45 -243 -208 -228 58 -454 -417 -438
65 0 3 +5 7.3 7.8 8,000 -35 -20 -28 15 -17 3 -8 22 -36 -8 -21 30 -74 -39 -58 45 -260 -215 -234
> 58 -492 -429 -457 N .....
66 0 4 +5 7.3 7.8 8,000 -19 -12 -15 15 -2 13 6 22 -27 -12 -18 30 -93 -67 -83 45 -278 -250 -267 58 -472 -442 -457
67 0 5 +5 7.3 7.8 8,000 -10 -2 -6 15 -10 0 -4 22 -51 -26 -40 30 -104 -77 -92 45 -270 -242 -255 58 -537 -495 -510
(Continued)
(Sheet 20 of 62)
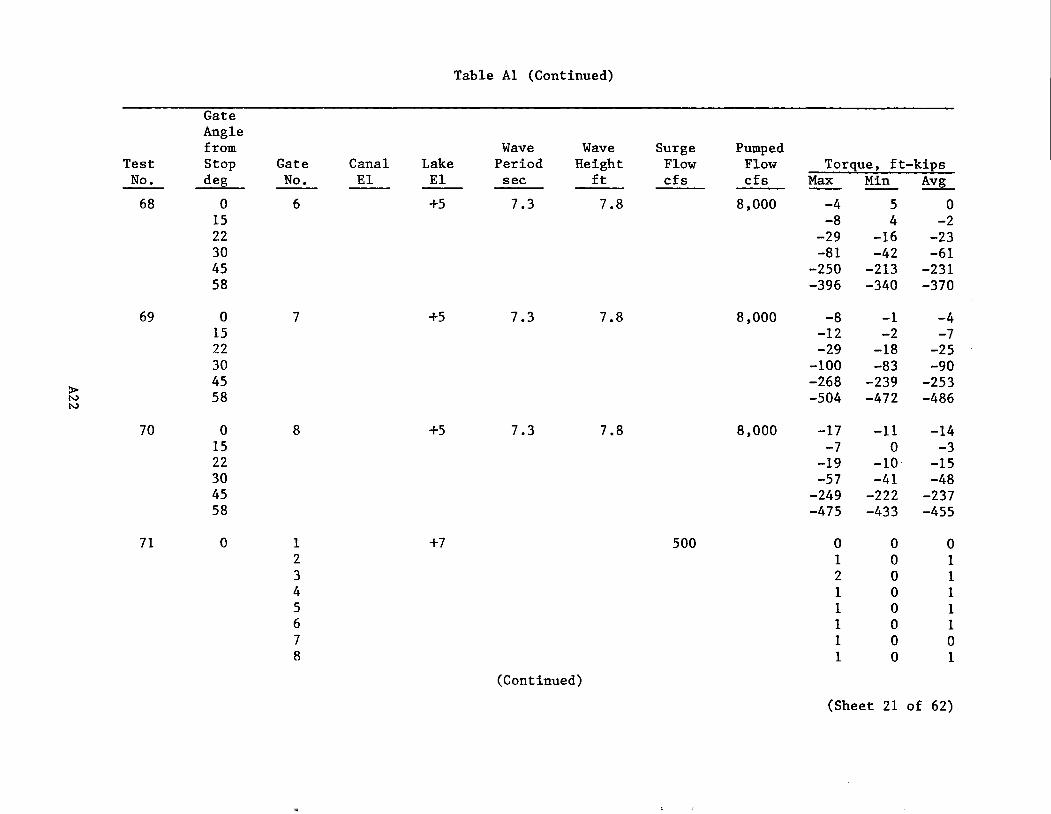
Table Al (Continued)
Gate Angle from Wave Wave Surge Pumped
Test Stop Gate Canal Lake Period Height Flow Flow Torque, ft-kips No. deg No. El El sec ft cfs cfs Max Min Avg
68 0 6 +5 7.3 7.8 8,000 -4 5 0 15 -8 4 -2 22 -29 -16 -23 30 -81 -42 -61 45 -250 -213 -231 58 -396 -340 -370
69 0 7 +5 7.3 7.8 8,000 -8 -1 -4 15 -12 -2 -7 22 -29 -18 -25 30 -100 -83 -90
> 45 -268 -239 -253
N 58 -504 -472 -486 N
70 0 8 +5 7.3 7.8 8,000 -17 -11 -14 15 -7 0 -3 22 -19 -10 -15 30 -57 -41 -48 45 -249 -222 -237 58 -475 -433 -455
71 0 1 +7 500 0 0 0 2 1 0 1 3 2 0 1 4 1 0 1 5 1 0 1 6 1 0 1 7 1 0 0 8 1 0 1
(Continued)
(Sheet 21 of 62)
"

Table A1 (Continued)
Gate Angle from Wave Wave Surge Pumped
Test Stop Gate Canal Lake Period Height Flow Flow Torque, ft-kiEs No. deg No. EI EI sec ft cfs cfs Max Min Avg
72 0 1 +7 1,000 0 0 0 2 1 0 1 3 2 0 1 4 1 1 1 5 1 0 1 6 1 0 1 7 1 0 1 8 1 1 1
73 0 1 +7 1,500 0 0 0 2 1 0 1 3 1 0 1
> 4 1 1 1 N W
5 1 0 0 6 1 0 1 7 1 0 1 8 1 1 1
74 0 1 +7 2,000 0 0 0 2 1 0 0 3 1 1 1 4 1 1 1 5 1 0 1 6 1 0 1 7 1 1 1 8 1 1 1
(Continued)
(Sheet 22 of 62)

Table Al (Continued)
Gate Angle from Wave Wave Surge Pumped
Test Stop Gate Canal Lake Period Height Flow Flow Torque, ft-ki:es No. deg No. El El see ft efs efs Max Min Avg
75 6 1 +7 500 1 0 0 2 2 1 1 3 3 0 1 4 1 0 1 5 1 0 1 6 2 1 1 7 1 1 1 8 1 0 1
76 6 1 +7 1,000 1 0 0 2 1 1 1
> 3 2 1 1 N 4 1 0 1 .po
5 1 0 1 6 2 1 1 7 1 1 1 8 1 1 1
77 6 1 +7 1,500 1 0 0 2 1 1 1 3 2 1 1 4 1 1 1 5 1 1 1 6 2 1 2 7 1 1 1 8 1 1 1
(Continued)
(Sheet 23 of 62)
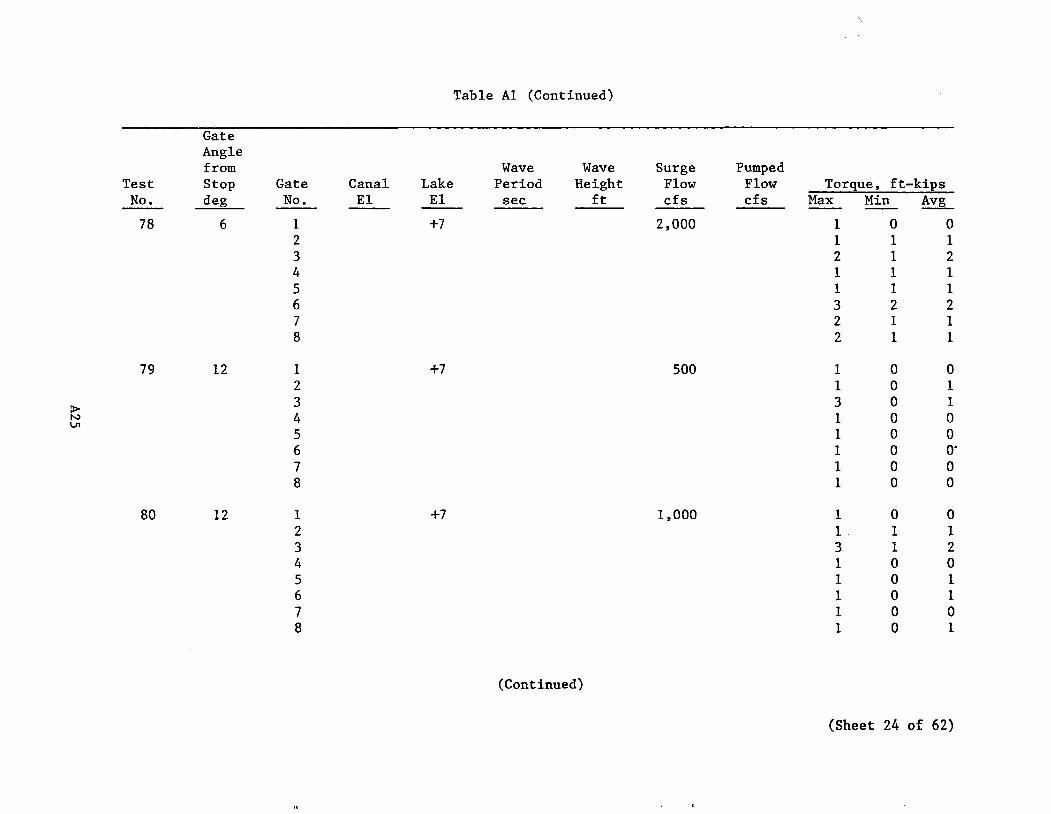
Table Al (Continued)
Gate Angle from Wave Wave Surge Pumped
Test Stop Gate Canal Lake Period Height Flow Flow Torque, ft-kiEs No. deg No. EI EI sec ft cfs cfs Max Min Avg
78 6 1 +7 2,000 1 0 0 2 1 1 1 3 2 1 2 4 1 1 1 5 1 1 1 6 3 2 2 7 2 1 1 8 2 1 1
79 12 1 +7 500 1 0 0 2 1 0 1
> 3 3 0 1 N 4 1 0 0 V1
5 1 0 0 6 1 0 o· 7 1 0 0 8 1 0 0
80 12 1 +7 1,000 1 0 0 2 1 1 1 3 3 1 2 4 1 0 0 5 1 0 1 6 1 0 1 7 1 0 0 8 1 0 1
(Continued)
(Sheet 24 of 62)
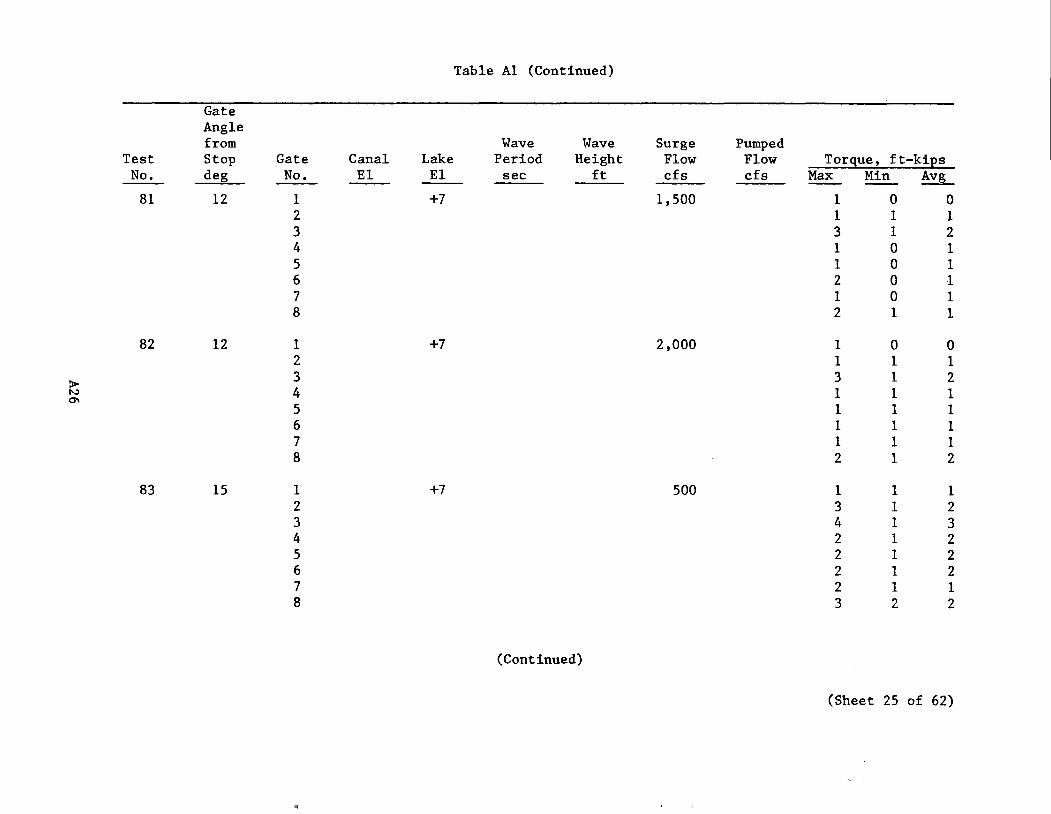
Table Al (Continued)
Gate Angle from Wave Wave Surge Pumped
Test Stop Gate Canal Lake Period Height Flow Flow Torque, ft-kips No. deg No. El El sec ft cfs cfs Max Min Avg
81 12 1 +7 1,500 1 0 0 2 1 1 1 3 3 1 2 4 1 0 1 5 1 0 1 6 2 0 1 7 1 0 1 8 2 1 1
82 12 1 +7 2,000 1 0 0 2 1 1 1
P> 3 3 1 2 N 4 1 1 1 0\
5 1 1 1 6 1 1 1 7 1 1 1 8 2 1 2
83 15 1 +7 500 1 1 1 2 3 1 2 3 4 1 3 4 2 1 2 5 2 1 2 6 2 1 2 7 2 1 1 8 3 2 2
(Continued)
(Sheet 25 of 62)

Table Al (Continued)
Gate Angle from Wave Wave Surge Pumped
Test Stop Gate Canal Lake Period Height Flow Flow Torque, ft-kiEs No. deg No. EI EI sec ft cfs cfs Max Min Avg
84 15 1 +7 1,000 1 1 1 2 2 2 2 3 2 1 2 4 4 3 3 5 3 2 3 6 3 2 3 7 2 1 2 8 3 3 3
85 15 1 +7 1,500 1 1 1 2 2 2 2 3 3 2 1
P> 4 2 2 2 N -....I
5 3 2 3 6 2 2 2 7 2 2 2 8 3 3 3
86 15 1 +7 2,000 1 1 1 2 3 2 2 3 4 2 3 4 5 4 4 5 3 3 3 6 5 3 4 7 3 2 3 8 4 4 4
(Continued)
(Sheet 26 of 62)

Table Al (Continued)
Gate Angle from Wave Wave Surge Pumped
Test Stop Gate Canal Lake Period Height Flow Flow Torque, ft-kips No. deg No. El El see ft efs efs Max Min Avg
87 18 1 +7 500 2 1 1 2 5 3 4 3 6 2 4 4 5 4 4 5 4 3 4 6 4 3 4 7 3 2 2 8 6 5 5
88 18 1 +7 1,000 2 1 1 2 3 3 3
> 3 3 2 3 N 4 5 4 4 00
5 4 3 4 6 4 3 4 7 3 2 3 8 5 5 5
89 18 1 +7 1,500 1 1 1 2 3 3 3 3 4 3 4 4 5 4 5 5 4 4 4 6 4 4 4 7 3 3 3 8 5 5 5
(Continued)
(Sheet 27 of 62)

Table Al (Continued)
Gate Angle from Wave Wave Surge Pumped
Test Stop Gate Canal Lake Period Height Flow Flow Torque, ft-kips No. deg No. El El sec ft cfs cfs Max Min Avg
90 18 1 +7 2,000 1 1 1 2 4 3 3 3 5 3 4 4 5 4 5 5 4 4 4 6 5 4 4 7 3 3 3 8 6 5 5
91 22 1 +7 500 2 2 2 2 5 3 3
> 3 6 2 4 N 4 4 3 3 \0
5 6 4 5 6 4 3 4 7 4 3 4 8 6 5 5
92 22 1 +7 1,000 3 1 2 2 4 3 4 3 5 3 3 4 3 3 3 5 5 5 5 6 4 3 4 7 4 2 3 8 4 4 4
(Continued)
(Sheet 28 of 62)

Table Al (Continued)
Gate Angle from Wave Wave Surge Pumped
Test Stop Gate Canal Lake Period Height Flow Flow Torque, ft-kiEs No. deg No. El El sec ft cfs cfs Max Min Avg
93 22 1 +7 1,500 4 3 4 2 5 4 4 3 6 5 5 4 3 3 3 5 6 5 6 6 6 5 6 7 7 6 7 8 ~ 8 8
94 22 1 +7 2,000 4 3 4 2 6 6 6
> 3 7 7 7 \..oJ 4 4 4 4 0
5 7 6 7 6 7 6 7 7 8 7 8 8 9 8 9
95 24 1 +7 500 3 2 2 2 5 3 3 3 7 2 4 4 4 3 3 5 6 5 5 6 4 3 4 7 4 3 4 8 6 5 5
(Continued)
(Sheet 29 of 62)

Table Al (Continued)
Gate Angle from Wave Wave Surge Pumped
Test Stop Gate Canal Lake Period Height Flow Flow Torque, ft-kips No. deg No. El EI sec ft cfs cfs Max Min Avg
96 24 1 +7 1,000 3 2 2 2 4 3 4 3 5 3 4 4 3 3 3 5 5 5 5 6 4 3 4 7 4 3 4 8 5 5 5
97 24 1 +7 1,500 4 4 4 2 5 4 5 3 6 5 5
:> 4 3 3 3 w I-'
5 6 6 6 6 6 6 6 7 7 7 7 8 9 9 9
98 24 1 +7 2,000 4 4 4 2 6 5 6 3 8 7 7 4 4 3 4 5 7 7 7 6 7 6 7 7 8 8 8 8 10 9 10
(Continued)
(Sheet 30 of 62)

Table Al (Continued)
Gate Angle from Wave Wave Surge Pumped
Test Stop Gate Canal Lake Period Height Flow Flow Torque, ft-kips No. deg No. El El sec ft cfs cfs Max Min Avg --
99 30 1 +7 500 6 5 6 2 5 4 4 3 7 4 6 4 8 8 8 5 10 10 10 6 8 8 8 7 8 8 8 8 9 8 8
100 30 1 +7 1,000 8 7 7 2 6 4 5 3 8 3 6
> 4 12 11 11 \..oJ N
5 13 13 13 6 11 9 9 7 13 13 13 8 12 10 11
101 30 1 +7 1,500 13 6 8 2 16 4 9 3 18 5 12 4 12 10 11 5 14 11 12 6 12 8 10 7 14 12 13 8 12 9 10
(Continued)
(Sheet 31 of 62)
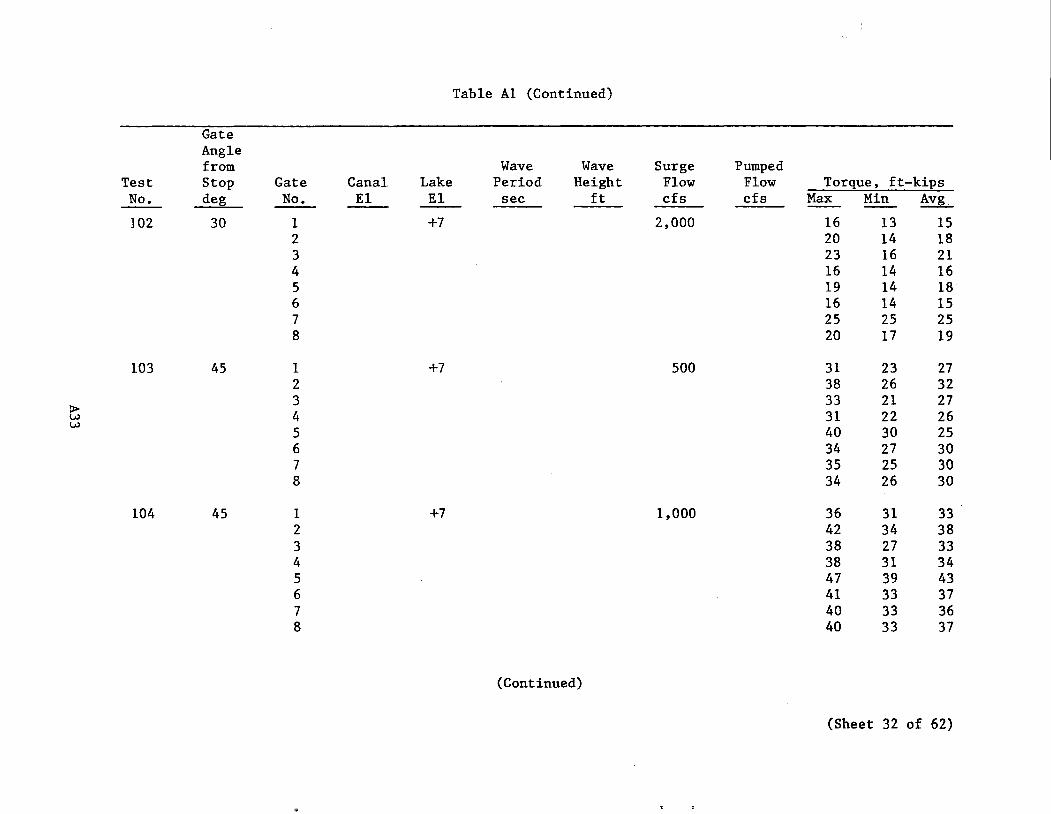
Table Al (Continued)
Gate Angle from Wave Wave Surge Pumped
Test Stop Gate Canal Lake Period Height Flow Flow Torque, ft-kips No. deg No. EI EI sec ft cfs cfs Max Min Avg
102 30 1 +7 2,000 16 13 15 2 20 14 18 3 23 16 21 4 16 14 16 5 19 14 18 6 16 14 15 7 25 25 25 8 20 17 19
103 45 1 +7 500 31 23 27 2 38 26 32 3 33 21 27
> 4 31 22 26 w w
5 40 30 25 6 34 27 30 7 35 25 30 8 34 26 30
104 45 1 +7 1,000 36 31 33 2 42 34 38 3 38 27 33 4 38 31 34 5 47 39 43 6 41 33 37 7 40 33 36 8 40 33 37
(Continued)
(Sheet 32 of 62)
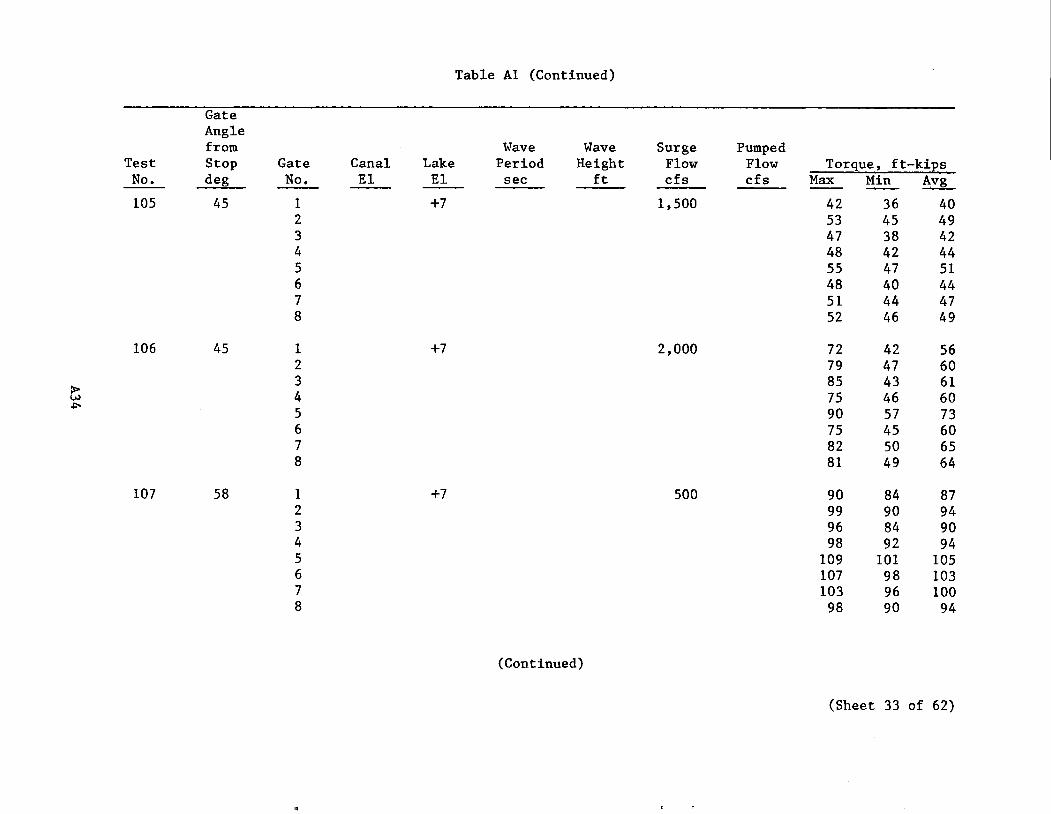
Table Al (Continued)
Gate Angle from Wave Wave Surge Pumped
Test Stop Gate Canal Lake Period Height Flow Flow Torque, ft-kiEs No. deg No. E1 E1 see ft efs efs Max Min Avg
105 45 1 +7 1,500 42 36 40 2 53 45 49 3 47 38 42 4 48 42 44 5 55 47 51 6 48 40 44 7 51 44 47 8 52 46 49
106 45 1 +7 2,000 72 42 56 2 79 47 60 3 85 43 61 > 4 75 46 60 w
.po 5 90 57 73 6 75 45 60 7 82 50 65 8 81 49 64
107 58 1 +7 500 90 84 87 2 99 90 94 3 96 84 90 4 98 92 94 5 109 101 105 6 107 98 103 7 103 96 100 8 98 90 94
(Continued)
(Sheet 33 of 62)
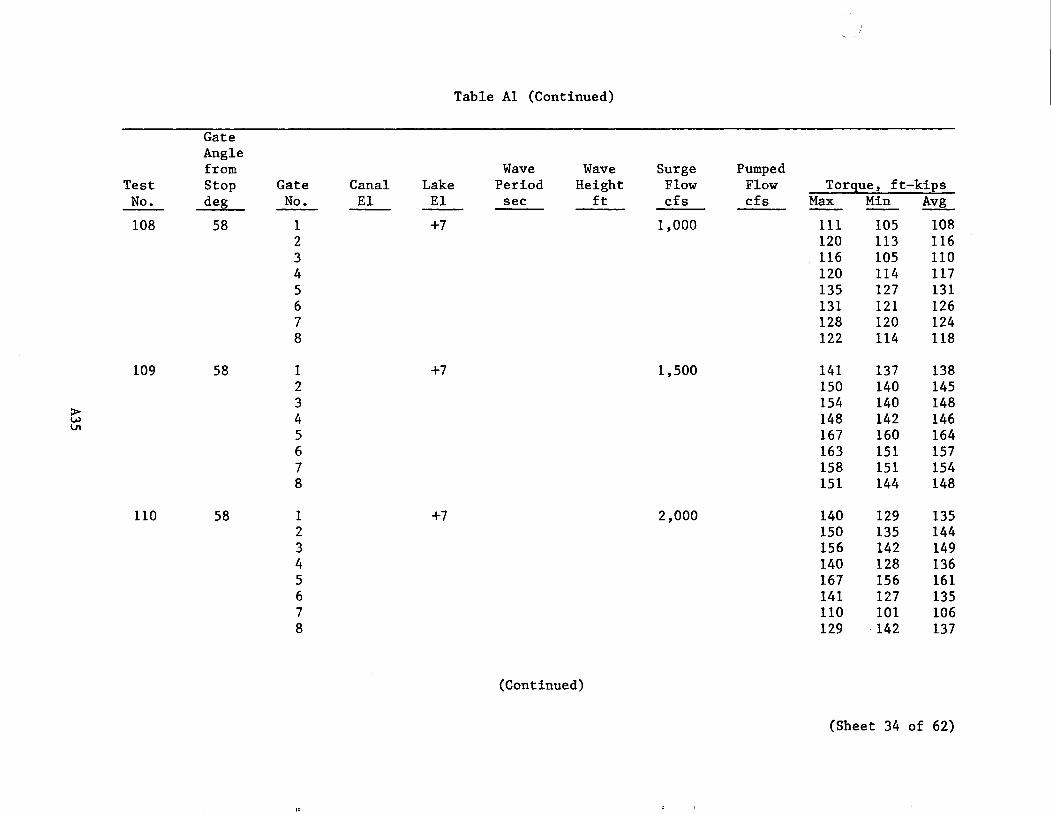
Table Al (Continued)
Gate Angle from Wave Wave Surge Pumped
Test Stop Gate Canal Lake Period Height Flow Flow Torgue, ft-kips No. deg No. El El see ft efs efs Max Min Avg
108 58 1 +7 1,000 111 105 108 2 120 113 116 3 116 105 110 4 120 114 117 5 135 127 131 6 131 121 126 7 128 120 124 8 122 114 118
109 58 1 +7 1,500 141 137 138 2 150 140 145 3 154 140 148
> 4 148 142 146 w VI
5 167 160 164 6 163 151 157 7 158 151 154 8 151 144 148
110 58 1 +7 2,000 140 129 135 2 150 135 144 3 156 142 149 4 140 128 136 5 167 156 161 6 141 127 135 7 110 101 106 8 129 142 137
(Continued)
(Sheet 34 of 62)
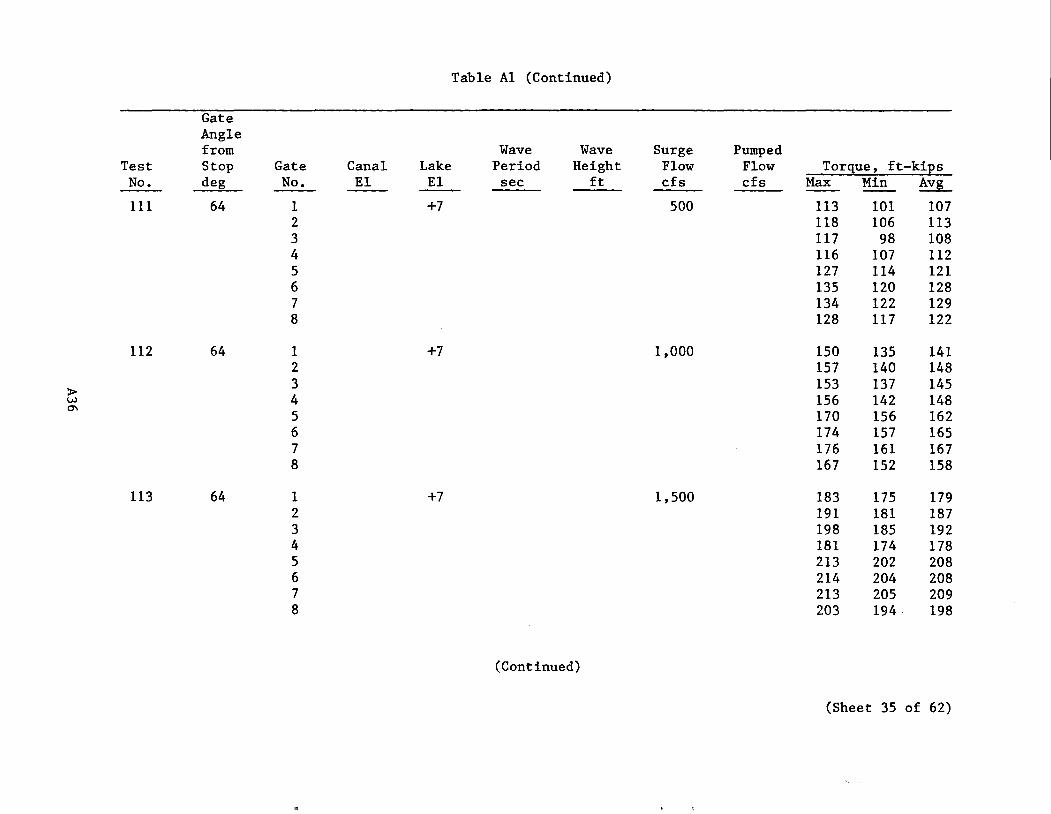
Table Al (Continued)
Gate Angle from Wave Wave Surge Pumped
Test Stop Gate Canal Lake Period Height Flow Flow Torgue, ft-kiEs No. deg No. EI EI sec -- ft cfs cfs Max Min Avg
III 64 1 +7 500 113 101 107 2 118 106 113 3 117 98 108 4 116 107 112 5 127 114 121 6 135 120 128 7 134 122 129 8 128 117 122
112 64 1 +7 1,000 150 135 141 2 157 140 148
> 3 153 137 145 w 4 156 142 148 ~
5 170 156 162 6 174 157 165 7 176 161 167 8 167 152 158
113 64 1 +7 1,500 183 175 179 2 191 181 187 3 198 185 192 4 181 174 178 5 213 202 208 6 214 204 208 7 213 205 209 8 203 194 198
(Continued)
(Sheet 35 of 62)
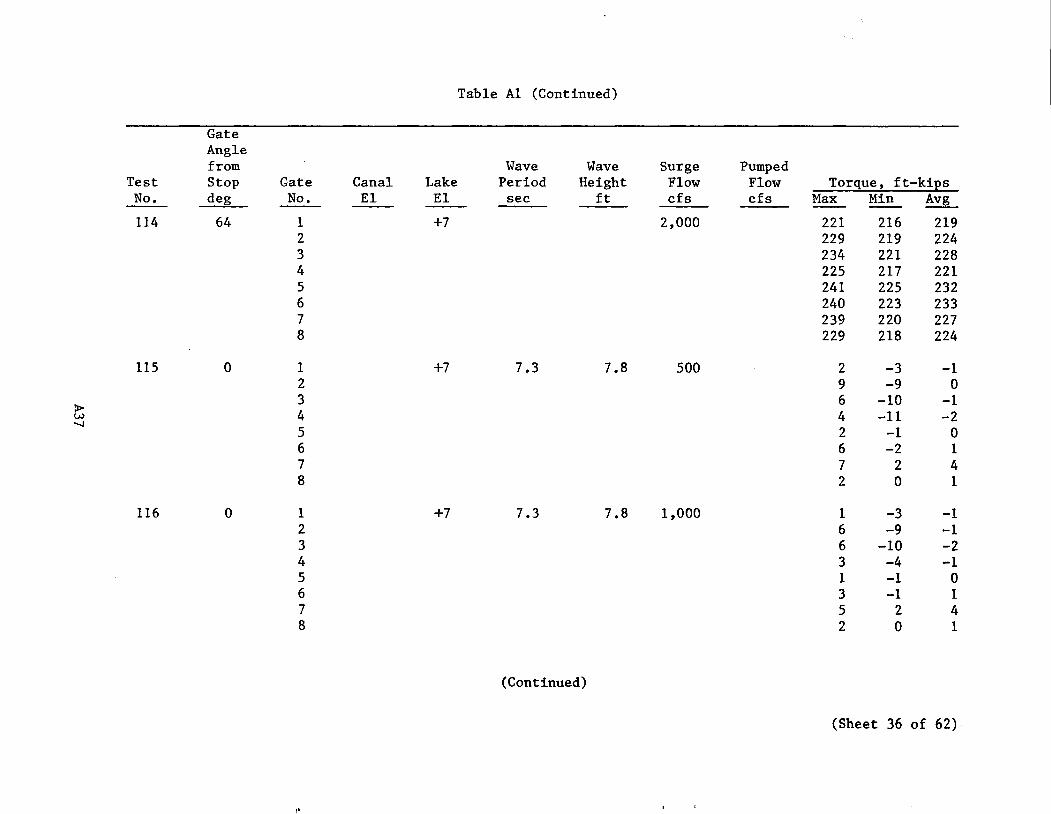
Table Al (Continued)
Gate Angle from Wave Wave Surge Pumped
Test Stop Gate Canal Lake Period Height Flow Flow Torque, ft-kips No. de~ No. EI EI sec ft cfs cfs Max Min Avg
114 64 1 +7 2,000 221 216 219 2 229 219 224 3 234 221 228 4 225 217 221 5 241 225 232 6 240 223 233 7 239 220 227 8 229 218 224
115 0 1 +7 7.3 7.8 500 2 -3 -1 2 9 -9 0
> 3 6 -10 -1
w 4 4 -11 -2 ...... 5 2 -1 0 6 6 -2 1 7 7 2 4 8 2 0 1
116 0 1 +7 7.3 7.8 1,000 1 -3 -1 2 6 -9 -1 3 6 -10 -2 4 3 -4 -1 5 1 -1 0 6 3 -1 1 7 5 2 4 8 2 0 1
(Continued)
(Sheet 36 of 62)
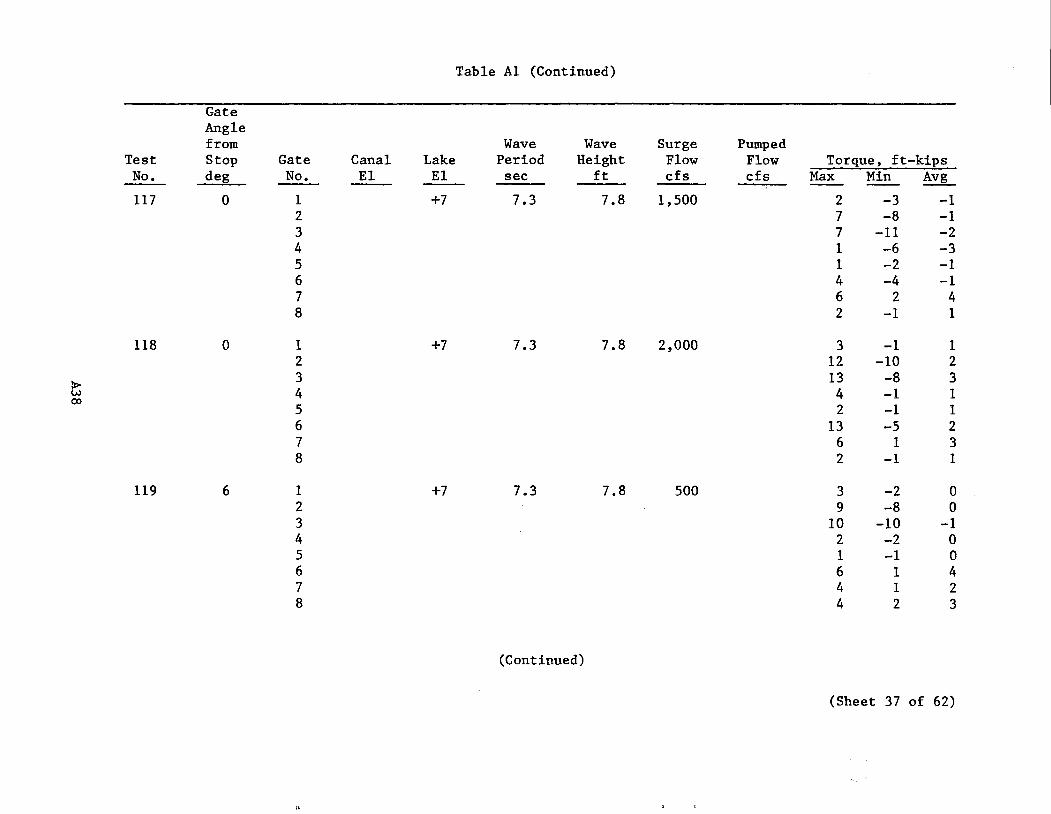
Table Al (Continued)
Gate Angle from Wave Wave Surge Pumped
Test Stop Gate Canal Lake Period Height Flow Flow Torque, ft-kips No. deg No. EI EI sec ft cfs cfs Max Min Avg
117 0 1 +7 7.3 7.8 1,500 2 -3 -1 2 7 -8 -1 3 7 -11 -2 4 1 -6 -3 5 1 -2 -1 6 4 -4 -1 7 6 2 4 8 2 -1 1
118 0 1 +7 7.3 7.8 2,000 3 -1 1 2 12 -10 2
> 3 13 -8 3 Vol 4 4 -1 1 00
5 2 -1 1 6 13 -5 2 7 6 1 3 8 2 -1 1
119 6 1 +7 7.3 7.8 500 3 -2 0 2 9 -8 0 3 10 -10 -1 4 2 -2 0 5 1 -1 0 6 6 1 4 7 4 1 2 8 4 2 3
(Continued)
(Sheet 37 of 62)

Table Al (Continued)
Gate Angle from Wave Wave Surge Pumped
Test Stop Gate Canal Lake Period Height Flow Flow Torque, ft-kips No. deg No. EI EI sec ft cfs cfs Max Min Avg
120 6 1 +7 7.3 7.8 1,000 3 -3 0 2 10 -11 1 3 11 -11 -2 4 8 -1 2 5 2 0 1 6 10 3 5 7 6 0 3 8 4 -1 3
121 6 1 +7 7.3 7.8 1,500 2 -1 0 2 7 -7 0 3 10 -7 0
> 4 3 -1 1 w \C
5 2 -1 1 6 7 1 5 7 5 2 4 8 5 3 4
122 6 1 +7 7.3 7.8 2,000 7 -7 2 2 14 -11 2 3 21 -11 2 4 11 -6 3 5 4 0 2 6 15 -3 5 7 5 2 3 8 5 2 4
(Continued)
(Sheet 38 of 62)
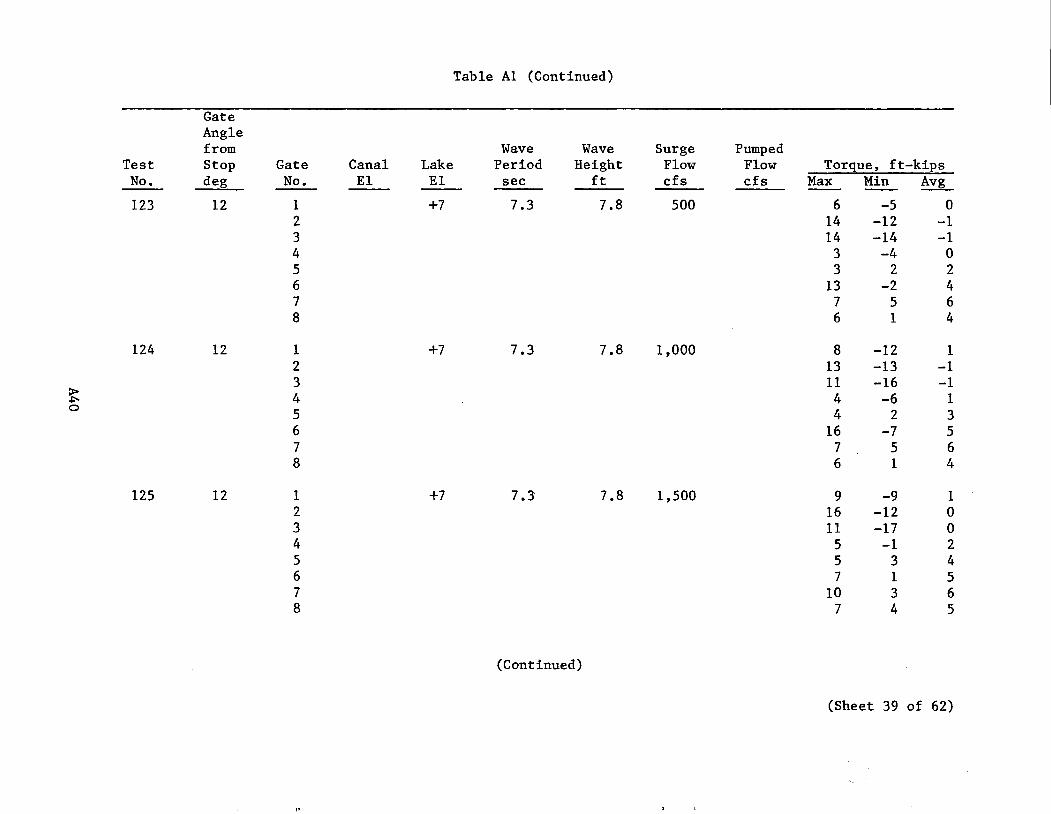
Table Al (Continued)
Gate Angle from Wave Wave Surge Pumped
Test Stop Gate Canal Lake Period Height Flow Flow Torque, ft-kips No. deg No. El El sec ft cfs cfs Max Min Avg
123 12 1 +7 7.3 7.8 500 6 -5 0 2 14 -12 -1 3 14 -14 -1 4 3 -4 0 5 3 2 2 6 13 -2 4 7 7 5 6 8 6 1 4
124 12 1 +7 7.3 7.8 1,000 8 -12 1 2 13 -13 -1 3 11 -16 -1
> 4 4 -6 1 ~ 0 5 4 2 3
6 16 -7 5 7 7 5 6 8 6 1 4
125 12 1 +7 7.3 7.8 1,500 9 -9 1 2 16 -12 0 3 11 -17 0 4 5 -1 2 5 5 3 4 6 7 1 5 7 10 3 6 8 7 4 5
(Continued)
(Sheet 39 of 62)

Table Al (Continued) ,
, Gate Angle from Wave Wave Surge Pumped
Test Stop Gate Canal Lake Period Height Flow Flow Torque, ft-kips No. deg No. EI EI sec ft cfs cfs Max Min Avg
126 12 1 +7 7.3 7.8 2,000 6 -5 2 2 11 -8 2 3 18 -13 3 4 8 -3 3 5 5 3 4 6 7 2 5 7 9 6 7 8 12 1 5
127 15 1 +7 7.3 7.8 500 8 0 3 2 18 -13 2
> 3 17 -12 2 .po 4 5 2 3 .....
5 8 3 5 6 15 -7 4 7 8 1 5 8 8 0 5
128 15 1 +7 7.3 7.8 1,000 8 -3 2 2 20 -18 1 3 18 -18 1 4 4 1 2 5 7 4 5 6 12 1 5 7 8 3 6 8 9 6 7
(Continued)
(Sheet 40 of 62)
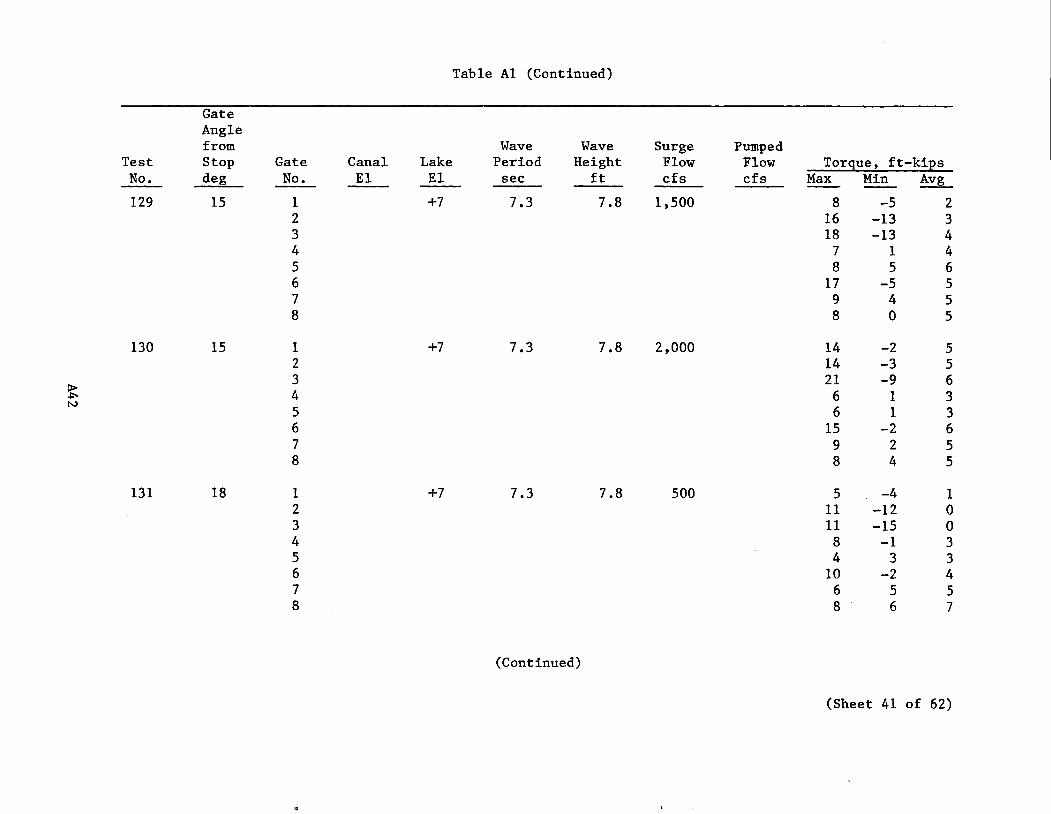
Table Al (Continued)
Gate Angle from Wave Wave Surge Pumped
Test Stop Gate Canal Lake Period Height Flow Flow Torque, ft-kiEs No. deg No. EI EI sec ft cfs cfs Max Min Avg
129 15 1 +7 7.3 7.8 1,500 8 -5 2 2 16 -13 3 3 18 -13 4 4 7 1 4 5 8 5 6 6 17 -5 5 7 9 4 5 8 8 0 5
130 15 1 +7 7.3 7.8 2,000 14 -2 5 2 14 -3 5
> 3 21 -9 6
.po 4 6 1 3 "" 5 6 1 3
6 15 -2 6 7 9 2 5 8 8 4 5
131 18 1 +7 7.3 7.8 500 5 -4 1 2 11 -12 0 3 11 -15 0 4 8 -1 3 5 4 3 3 6 10 -2 4 7 6 5 5 8 8 6 7
(Continued)
(Sheet 41 of 62)

Table Al (Continued)
Gate Angle from Wave Wave Surge Pumped
Test Stop Gate Canal Lake Period Height Flow Flow Torgue, ft-kiES No. deg No. El El sec ft cfs cfs Max Min Avg
132 18 1 +7 7.3 7.8 1,000 10 -9 1 2 22 -16 1 3 12 -12 0 4 6 -2 2 5 7 1 4 6 10 0 6 7 7 5 6 8 8 6 7
133 18 1 +7 7.3 7.8 1,500 13 -7 3 2 16 -12 2 3 16 -15 1
P> 4 6 3 4 ~ w
5 9 5 7 6 11 4 7 7 7 4 6 8 8 5 7
134 18 1 +7 7.3 7.8 2,000 8 1 3 2 12 -4 3 3 13 -6 3 4 7 4 5 5 7 6 6 6 6 3 4 7 7 6 6 8 9 6 7
(Continued)
(Sheet 42 of 62)

BLANK
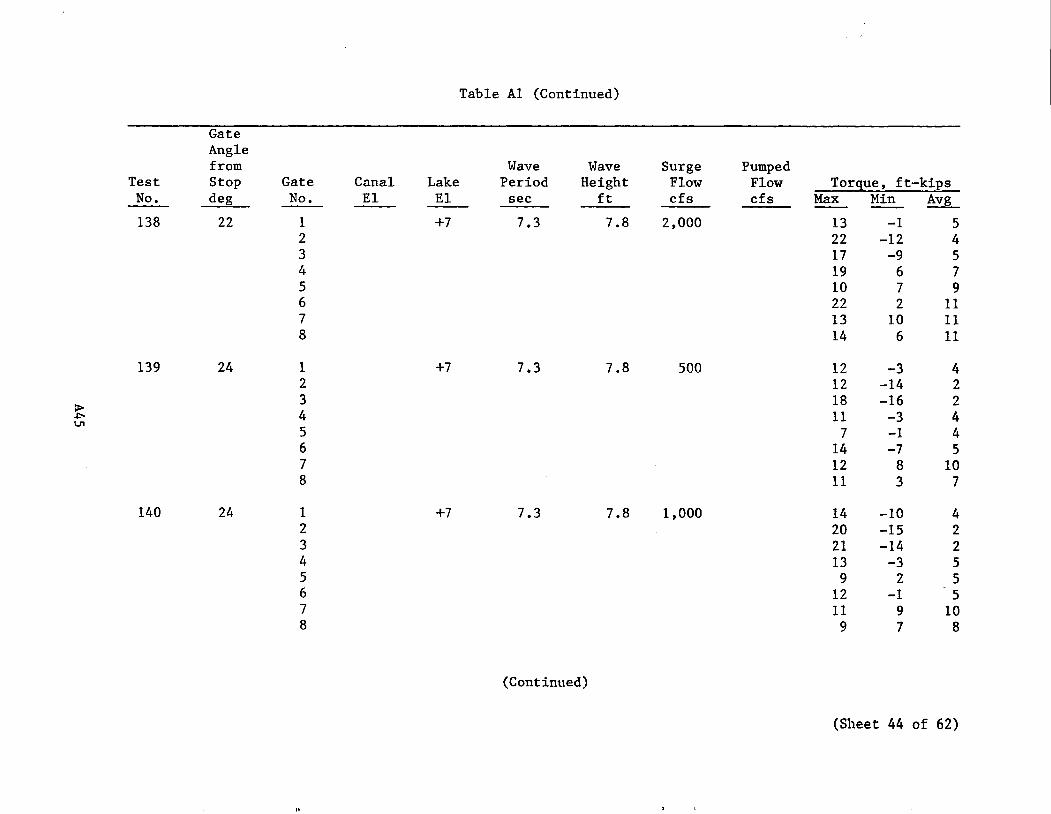
Table Al (Continued)
Gate Angle from Wave Wave Surge Pumped
Test Stop Gate Canal Lake Period Height Flow Flow Torque, ft-kips No. deg No. EI EI sec ft cfs cfs Max Min Avg
138 22 1 +7 7.3 7.8 2,000 13 -1 5 2 22 -12 4 3 17 -9 5 4 19 6 7 5 10 7 9 6 22 2 11 7 13 10 11 8 14 6 11
139 24 1 +7 7.3 7.8 500 12 -3 4 2 12 -14 2 3 18 -16 2 :> 4 11 -3 4 ~
VI 5 7 -1 4 6 14 -7 5 7 12 8 10 8 11 3 7
140 24 1 +7 7.3 7.8 1,000 14 -10 4 2 20 -15 2 3 21 -14 2 4 13 -3 5 5 9 2 5 6 12 -1 5 7 11 9 10 8 9 7 8
(Continued)
(Sheet 44 of 62)
"
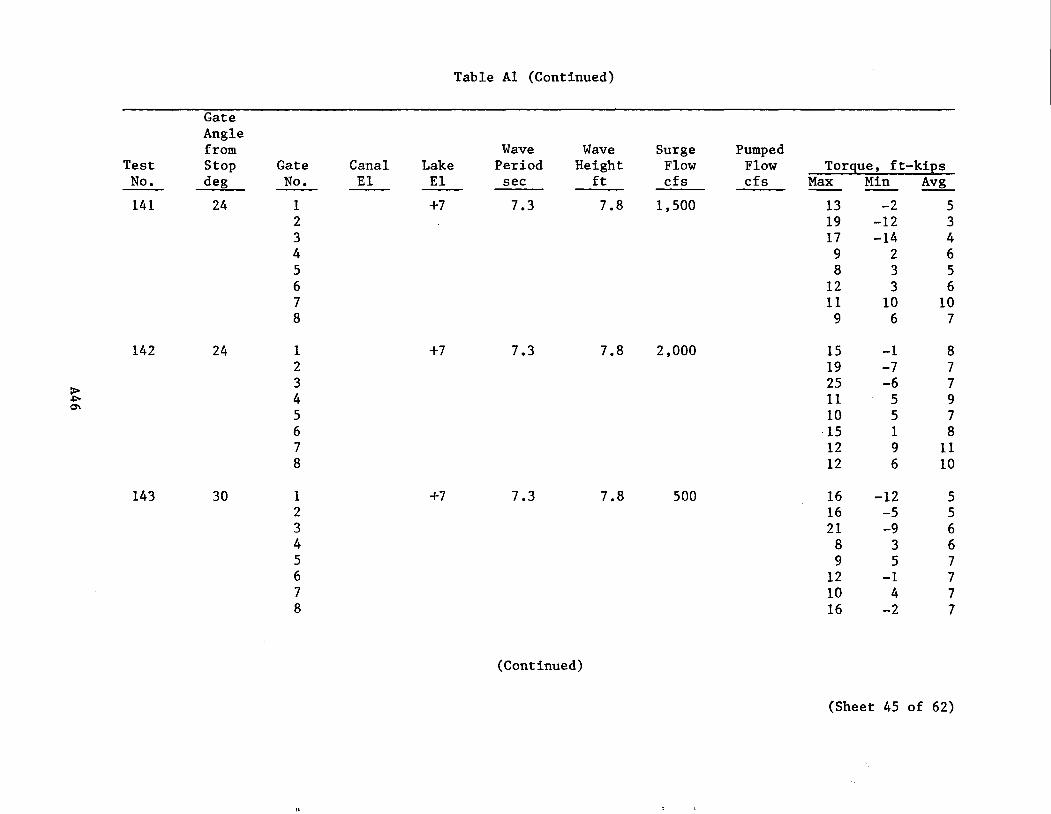
Table Al (Continued)
Gate Angle from Wave Wave Surge Pumped
Test Stop Gate Canal Lake Period Height Flow Flow Torgue, ft-kips No. deg No. EI EI sec ft cfs cfs Max Min Avg
141 24 1 +7 7.3 7.8 1,500 13 -2 5 2 19 -12 3 3 17 -14 4 4 9 2 6 5 8 3 5 6 12 3 6 7 11 10 10 8 9 6 7
142 24 1 +7 7.3 7.8 2,000 15 -1 8 2 19 -7 7
> 3 25 -6 7 ~ 4 11 5 9 0\
10 5 5 7 6 15 1 8 7 12 9 11 8 12 6 10
143 30 1 +7 7.3 7.8 500 16 -12 5 2 16 -5 5 3 21 -9 6 4 8 3 6 5 9 5 7 6 12 -1 7 7 10 4 7 8 16 -2 7
(Continued)
(Sheet 45 of 62)

Table Al (Continued)
Gate Angle -
from Wave Wave Surge Pumped Test Stop Gate Canal Lake Period Height Flow Flow Torque, ft-kips
No. deg No. EI EI sec ft cfs cfs Max Min Avg
144 30 1 +7 7.3 7.8 1,000 15 -5 6 2 18 -7 6 3 24 -10 7 4 9 6 7 5 15 5 9 6 17 4 8 7 11 7 9 8 10 2 7
145 30 1 +7 7.3 7.8 1,500 25 -1 7 2 29 -3 8
> 3 29 -7 9 .j:'oo 4 21 6 10 -..J
5 21 8 11 6 23 4 9 7 17 6 9 8 25 2 9
146 30 1 +7 7.3 7.8 2,000 22 -5 9 2 33 -9 10 3 35 -14 11 4 13 6 10 5 15 8 12 6 28 -1 12 7 15 5 12 8 15 9 12
(Continued)
(Sheet 46 of 62)
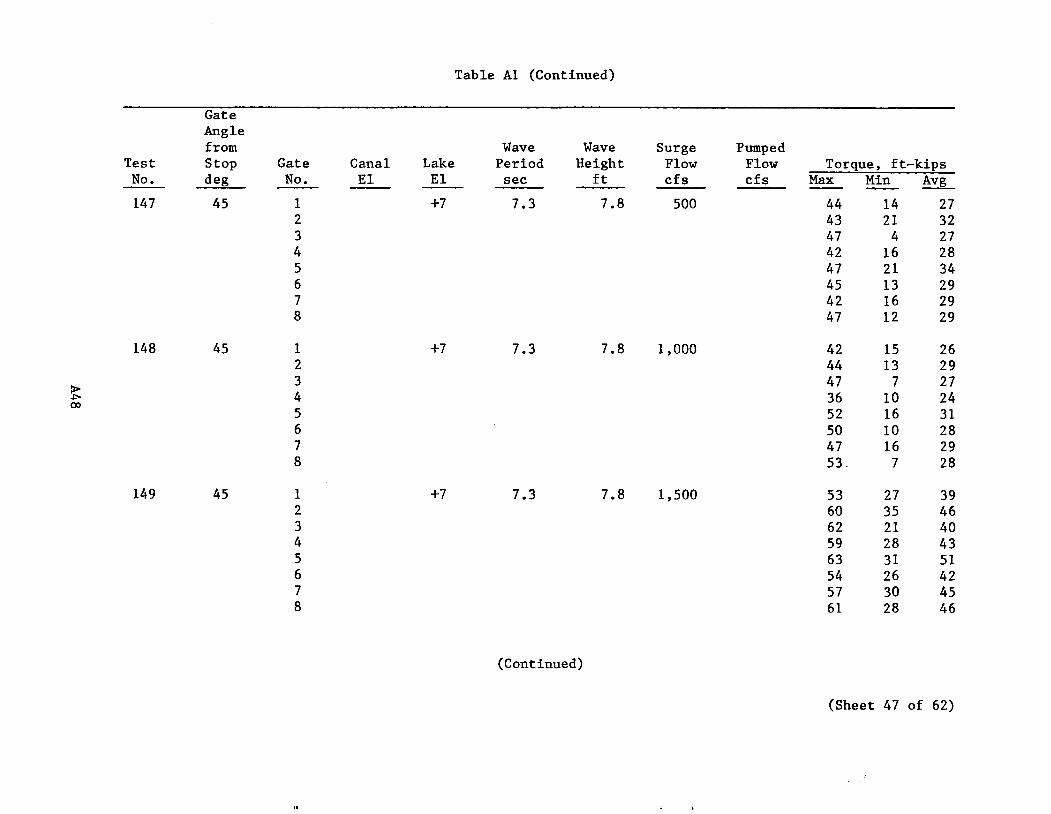
Table Al (Continued)
Gate Angle from Wave Wave Surge Pumped
Test Stop Gate Canal Lake Period Height Flow Flow Torque, ft-kips No. deg No. EI EI sec ft cfs cfs Max Min Avg
147 45 1 +7 7.3 7.8 500 44 14 27 2 43 21 32 3 47 4 27 4 42 16 28 5 47 21 34 6 45 13 29 7 42 16 29 8 47 12 29
148 45 1 +7 7.3 7.8 1,000 42 15 26 2 44 13 29 3 47 7 27
P> 4 36 10 24 J:-00
5 52 16 31 6 50 10 28 7 47 16 29 8 53. 7 28
149 45 1 +7 7.3 7.8 1,500 53 27 39 2 60 35 46 3 62 21 40 4 59 28 43 5 63 31 51 6 54 26 42 7 57 30 45 8 61 28 46
(Continued)
(Sheet 47 of 62)
"
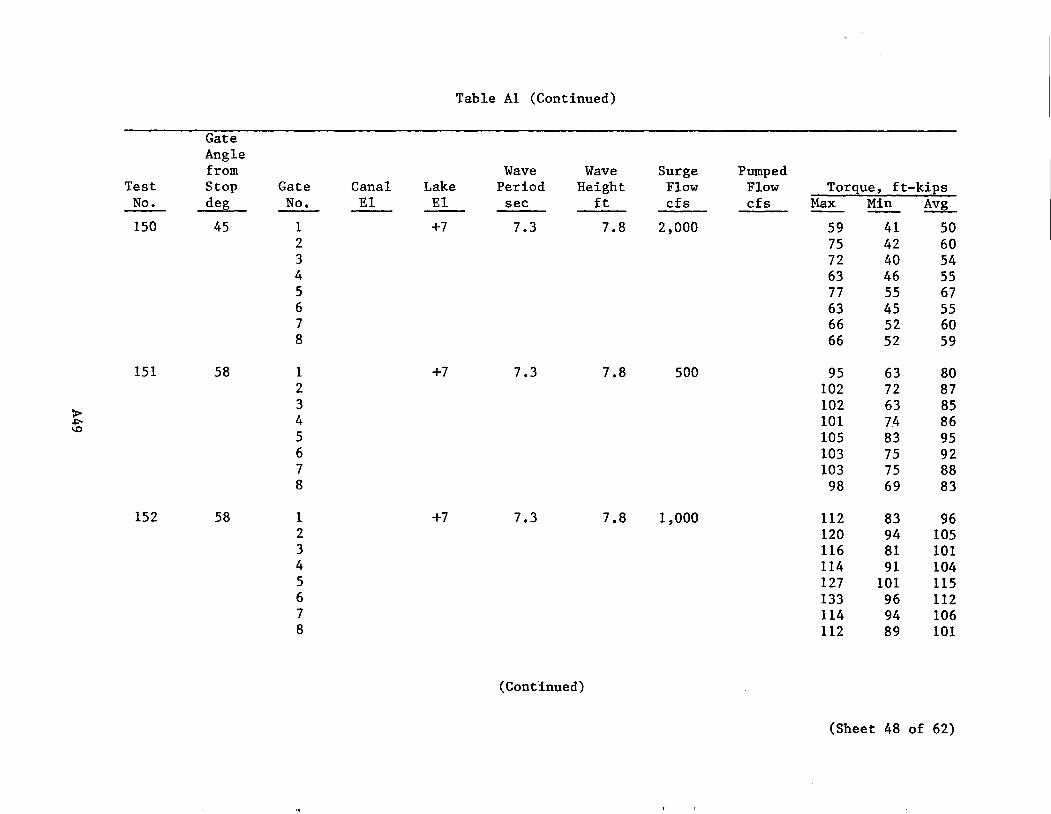
Table Al (Continued)
Gate Angle from Wave Wave Surge Pumped
Test Stop Gate Canal Lake Period Height Flow Flow Torque, ft-kips No. deg No. EI EI sec ft cfs cfs Max Min Avg
150 45 1 +7 7.3 7.8 2,000 59 41 50 2 75 42 60 3 72 40 54 4 63 46 55 5 77 55 67 6 63 45 55 7 66 52 60 8 66 52 59
151 58 1 +7 7.3 7.8 500 95 63 80 2 102 72 87 3 102 63 85 > 4 101 74 86 ~
1.0 5 105 83 95 6 103 75 92 7 103 75 88 8 98 69 83
152 58 1 +7 7.3 7.8 1,000 112 83 96 2 120 94 105 3 116 81 101 4 114 91 104 5 127 101 115 6 133 96 112 7 114 94 106 8 112 89 101
(Continued)
(Sheet 48 of 62)
!'
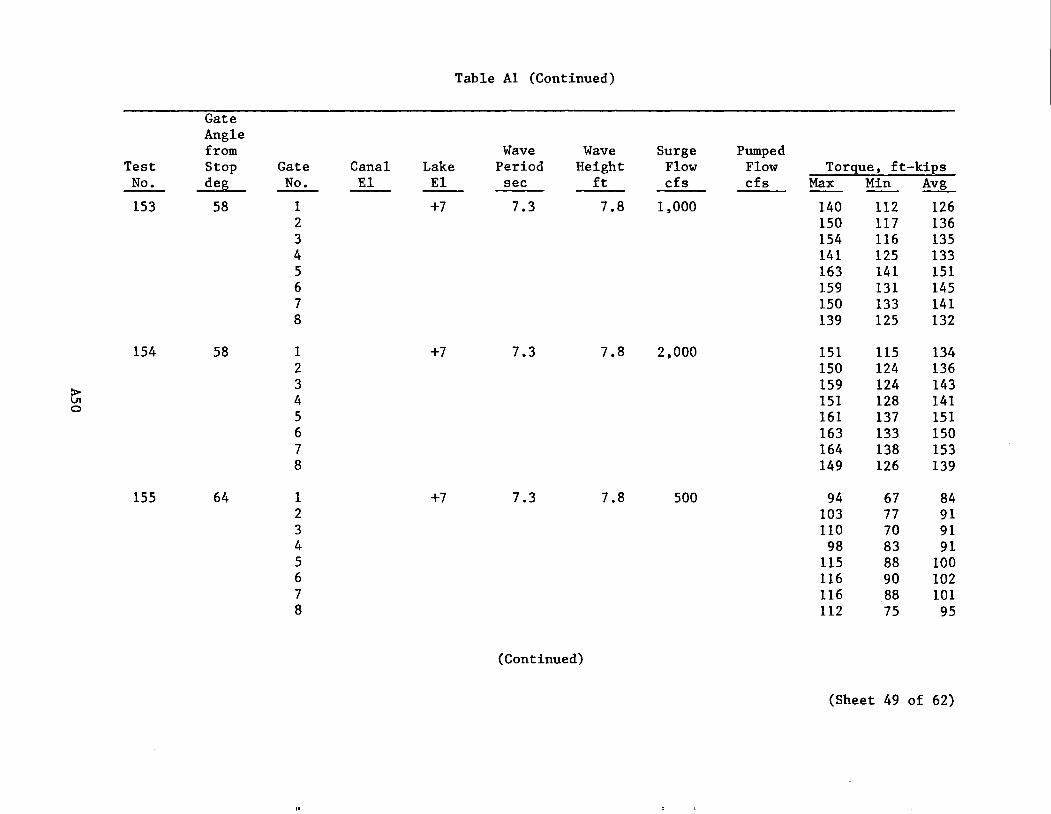
Table Al (Continued)
Gate Angle from Wave Wave Surge Pumped
Test Stop Gate Canal Lake Period Height Flow Flow Torque, ft-kips No. deg No. EI EI sec ft cfs cfs Max Min Avg
153 58 1 +7 7.3 7.8 1,000 140 112 126 2 150 117 136 3 154 116 135 4 141 125 133 5 163 141 151 6 159 131 145 7 150 133 141 8 139 125 132
154 58 1 +7 7.3 7.8 2,000 151 115 134 2 150 124 136
> 3 159 124 143 VI 4 151 128 141 0
5 161 137 151 6 163 133 150 7 164 138 153 8 149 126 139
155 64 1 +7 7.3 7.8 500 94 67 84 2 103 77 91 3 110 70 91 4 98 83 91 5 115 88 100 6 116 90 102 7 116 88 101 8 112 75 95
(Continued)
(Sheet 49 of 62)
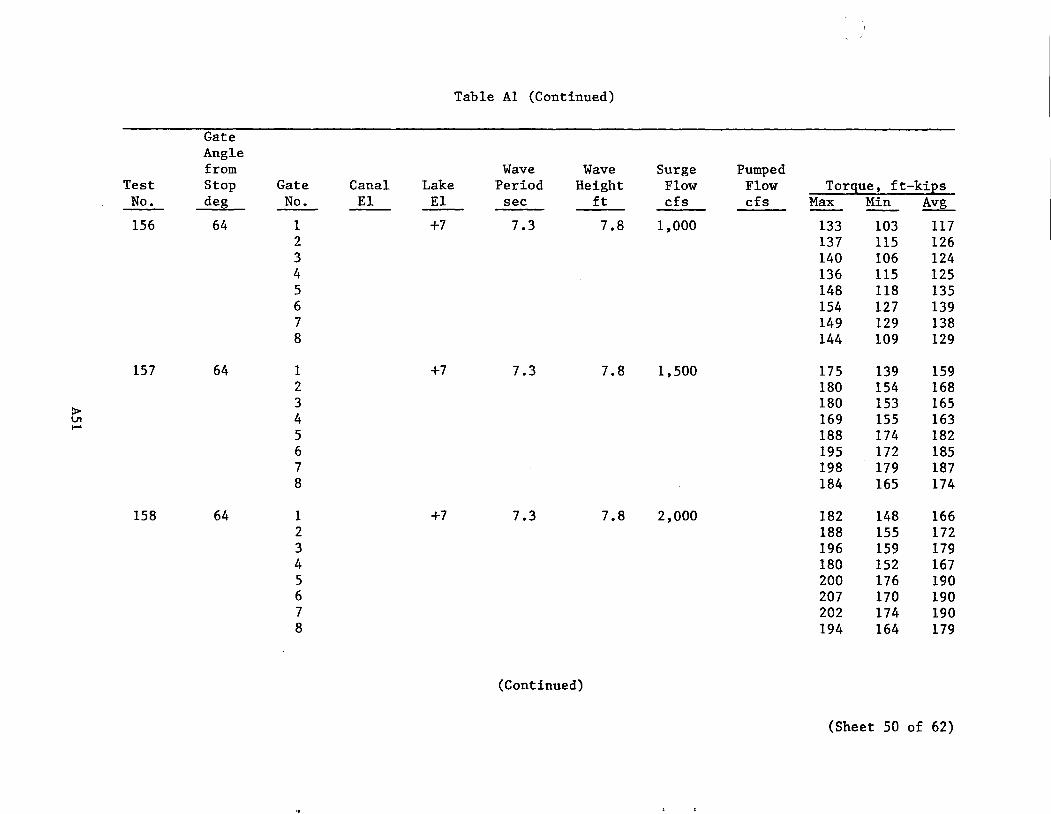
Table Al (Continued)
Gate Angle from Wave Wave Surge Pumped
Test Stop Gate Canal Lake Period Height Flow Flow Torque, ft-kiEs No. deg No. El El sec ft cfs cfs Max Min Avg
156 64 1 +7 7.3 7.8 1,000 133 103 117 2 137 115 126 3 140 106 124 4 136 115 125 5 148 118 135 6 154 127 139 7 149 129 138 8 144 109 129
157 64 1 +7 7.3 7.8 1,500 175 139 159 2 180 154 168 3 180 153 165
:> 4 169 155 163 VI I-'
5 188 174 182 6 195 172 185 7 198 179 187 8 184 165 174
158 64 1 +7 7.3 7.8 2,000 182 148 166 2 188 155 172 3 196 159 179 4 180 152 167 5 200 176 190 6 207 170 190 7 202 174 190 8 194 164 179
(Continued)
(Sheet 50 of 62)
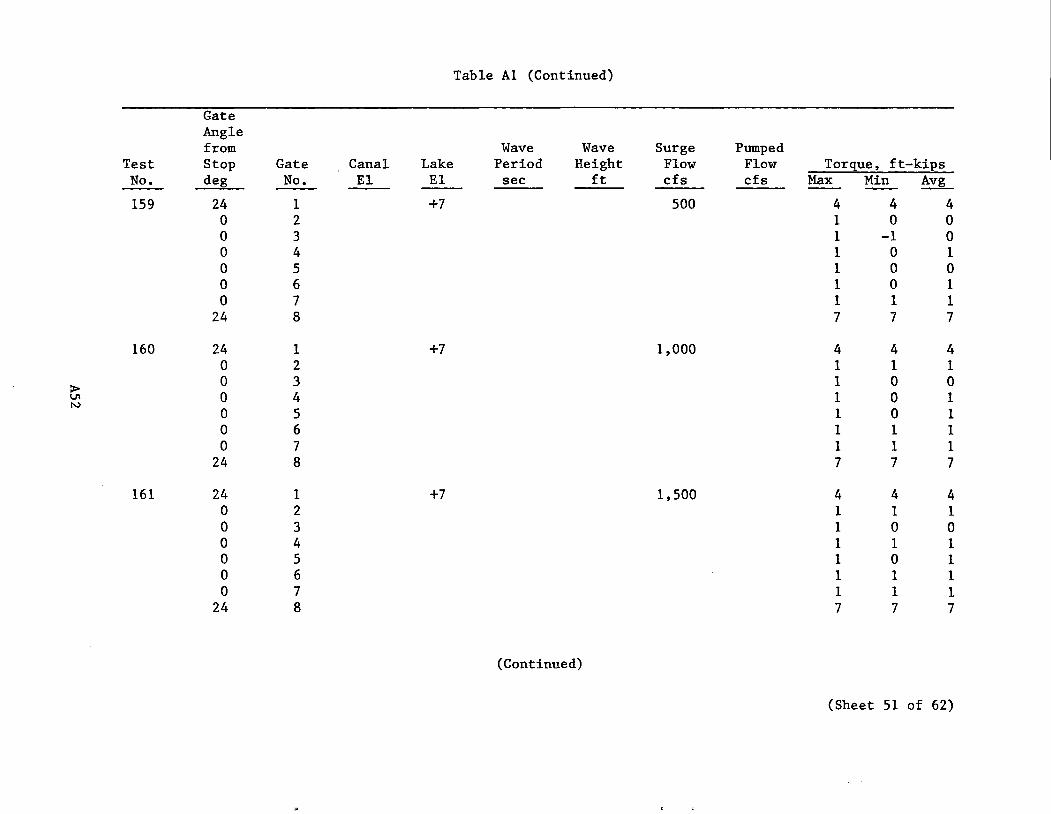
Table Al (Continued)
Gate Angle from Wave Wave Surge Pumped
Test Stop Gate Canal Lake Period Height Flow Flow Torgue, ft-kiEs No. deg No. El El sec ft cfs cfs Max Min Avg
159 24 1 +7 500 4 4 4 0 2 1 0 0 0 3 1 -1 0 0 4 1 0 1 0 5 1 0 0 0 6 1 0 1 0 7 1 1 1
24 8 7 7 7
160 24 1 +7 1,000 4 4 4 0 2 1 1 1
> 0 3 1 0 0 U1 0 4 1 0 1 N
0 5 1 0 1 0 6 1 1 1 0 7 1 1 1
24 8 7 7 7
161 24 1 +7 1,500 4 4 4 0 2 1 1 1 0 3 1 0 0 0 4 1 1 1 0 5 1 0 1 0 6 1 1 1 0 7 1 1 1
24 8 7 7 7
(Continued)
(Sheet 51 of 62)
"
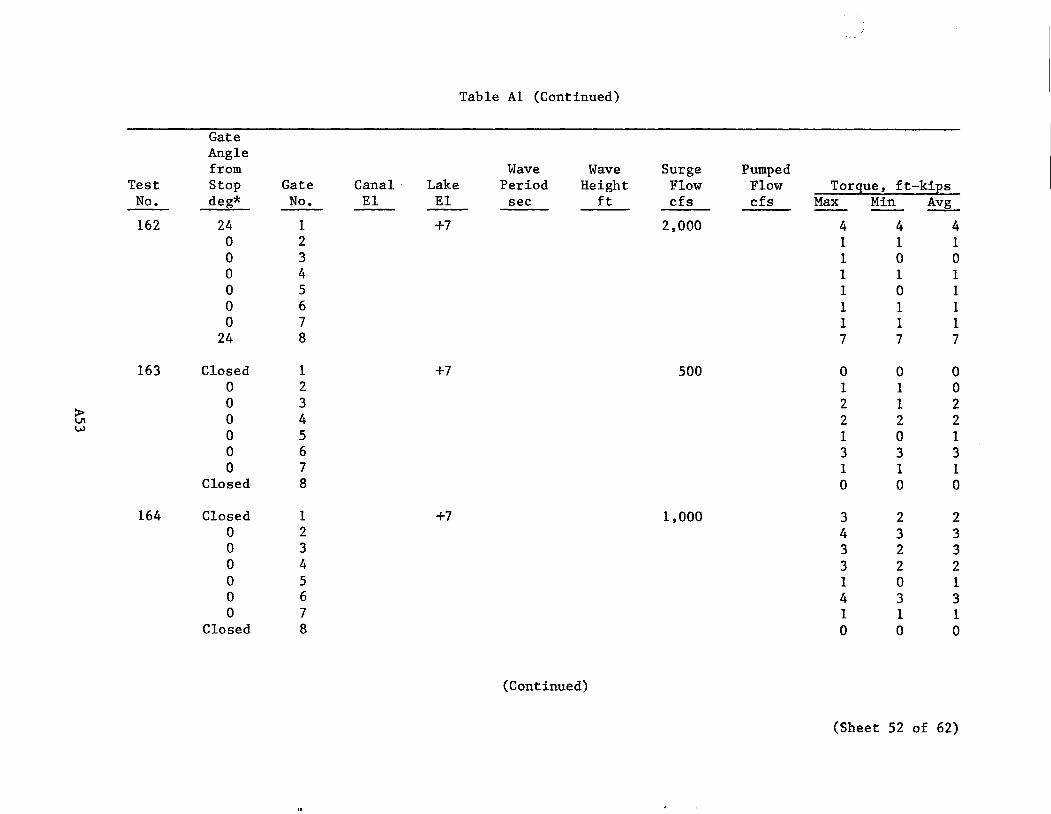
Table Al (Continued)
Gate Angle from Wave Wave Surge Pumped
Test Stop Gate Canal Lake Period Height Flow Flow Torque, ft-kips No. deg* No. El El sec ft cfs cfs Max Min Avg
162 24 1 +7 2,000 4 4 4 0 2 1 1 1 0 3 1 0 0 0 4 1 1 1 0 5 1 0 1 0 6 1 1 1 0 7 1 1 1
24 8 7 7 7
163 Closed 1 +7 500 0 0 0 0 2 1 1 0 0 3 2 1 2
:> 0 4 2 2 2 U1 w
0 5 1 0 1 0 6 3 3 3 0 7 1 1 1
Closed 8 0 0 0
164 Closed 1 +7 1,000 3 2 2 0 2 4 3 3 0 3 3 2 3 0 4 3 2 2 0 5 1 0 1 0 6 4 3 3 0 7 1 1 1
Closed 8 0 0 0
(Continued)
(Sheet 52 of 62)
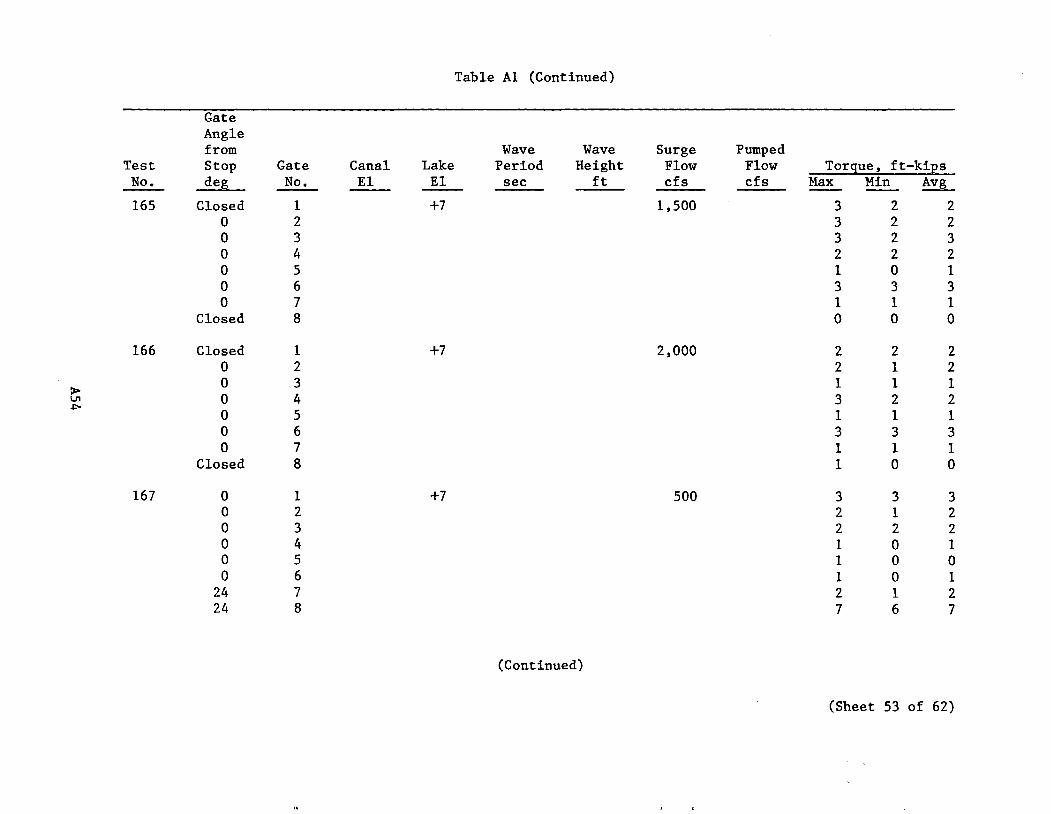
Table Al (Continued)
Gate Angle from Wave Wave Surge Pumped
Test Stop Gate Canal Lake Period Height Flow Flow Torque, ft-kiEs No. deg No. El El sec ft cfs cfs Max Min Avg
165 Closed 1 +7 1,500 3 2 2 0 2 3 2 2 0 3 3 2 3 0 4 2 2 2 0 5 1 0 1 0 6 3 3 3 0 7 1 1 1
Closed 8 0 0 0
166 Closed 1 +7 2,000 2 2 2 0 2 2 1 2
> 0 3 1 1 1 \JI 0 4 3 2 2 .j:>o
0 5 1 1 1 0 6 3 3 3 0 7 1 1 1
Closed 8 1 0 0
167 0 1 +7 500 3 3 3 0 2 2 1 2 0 3 2 2 2 0 4 1 0 1 0 5 1 0 0 0 6 1 0 1
24 7 2 1 2 24 8 7 6 7
(Continued)
(Sheet 53 of 62)
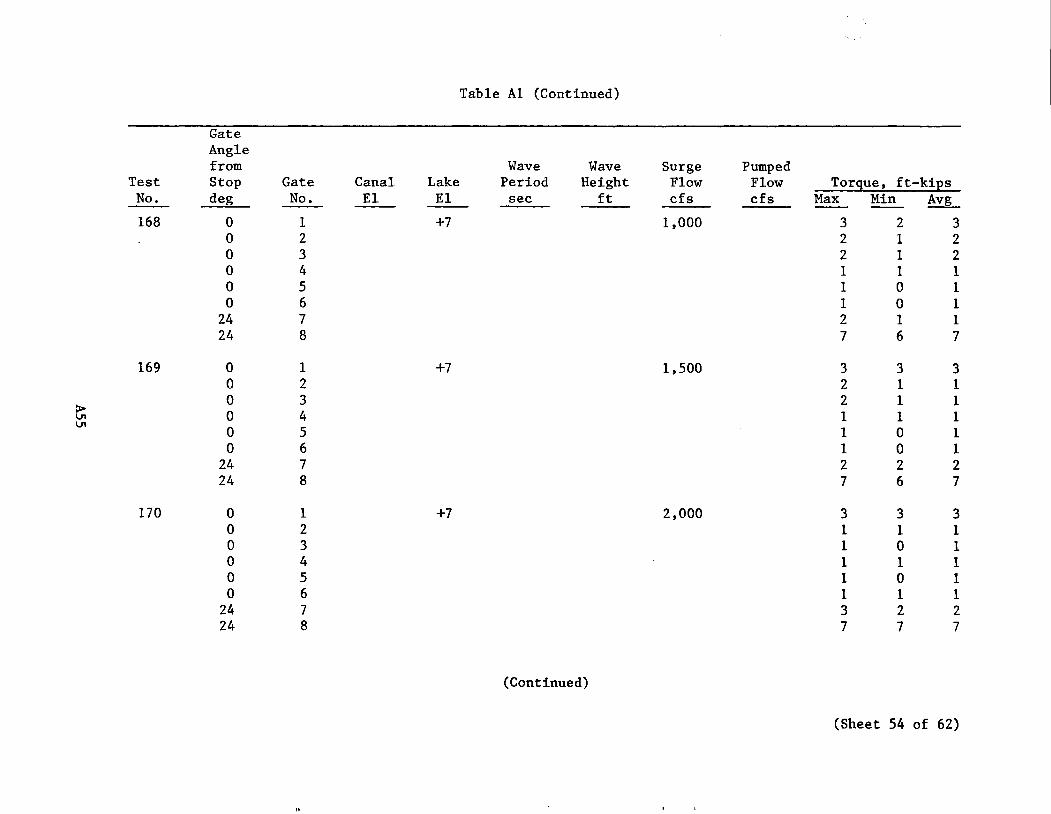
Table Al (Continued)
Gate Angle from Wave Wave Surge Pumped
Test Stop Gate Canal Lake Period Height Flow Flow Torque, ft-kiEs No. deg No. El El sec ft cfs cfs Max Min Avg
168 0 1 +7 1,000 3 2 3 0 2 2 1 2 0 3 2 1 2 0 4 1 1 1 0 5 1 0 1 0 6 1 0 1
24 7 2 1 1 24 8 7 6 7
169 0 1 +7 1,500 3 3 3 0 2 2 1 1
> 0 3 2 1 1
V1 0 4 1 1 1 V1
0 5 0 1 1 0 6 1 0 1
24 7 2 2 2 24 8 7 6 7
170 0 1 +7 2,000 3 3 3 0 2 1 1 1 0 3 1 0 1 0 4 1 1 1 0 5 1 0 1 0 6 1 1 1
24 7 3 2 2 24 8 7 7 7
(Continued)
(Sheet 54 of 62)
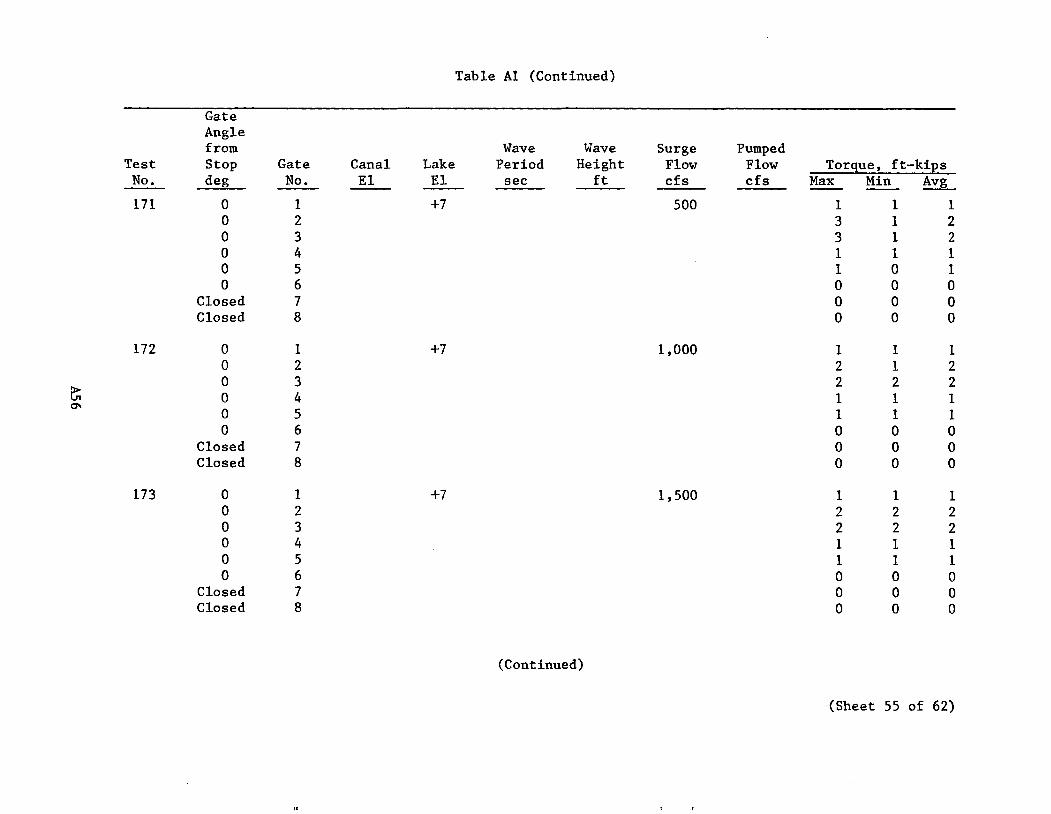
Table Al (Continued)
Gate Angle from Wave Wave Surge Pumped
Test Stop Gate Canal Lake Period Height Flow Flow Torque, ft-kiEs No. deg No. El El sec ft cfs cfs Max Min Avg
171 0 1 +7 500 1 1 1 0 2 3 1 2 0 3 3 1 2 0 4 1 1 1 0 5 1 0 1 0 6 0 0 0
Closed 7 0 0 0 Closed 8 0 0 0
172 0 1 +7 1,000 1 1 1 0 2 2 1 2
e; 0 3 2 2 2 0 4 1 1 1
0\ 0 5 1 1 1 0 6 0 0 0
Closed 7 0 0 0 Closed 8 0 0 0
173 0 1 +7 1,500 1 1 1 0 2 2 2 2 0 3 2 2 2 0 4 1 1 1 0 5 1 1 1 0 6 0 0 0
Closed 7 0 0 0 Closed 8 0 0 0
(Continued)
(Sheet 55 of 62)
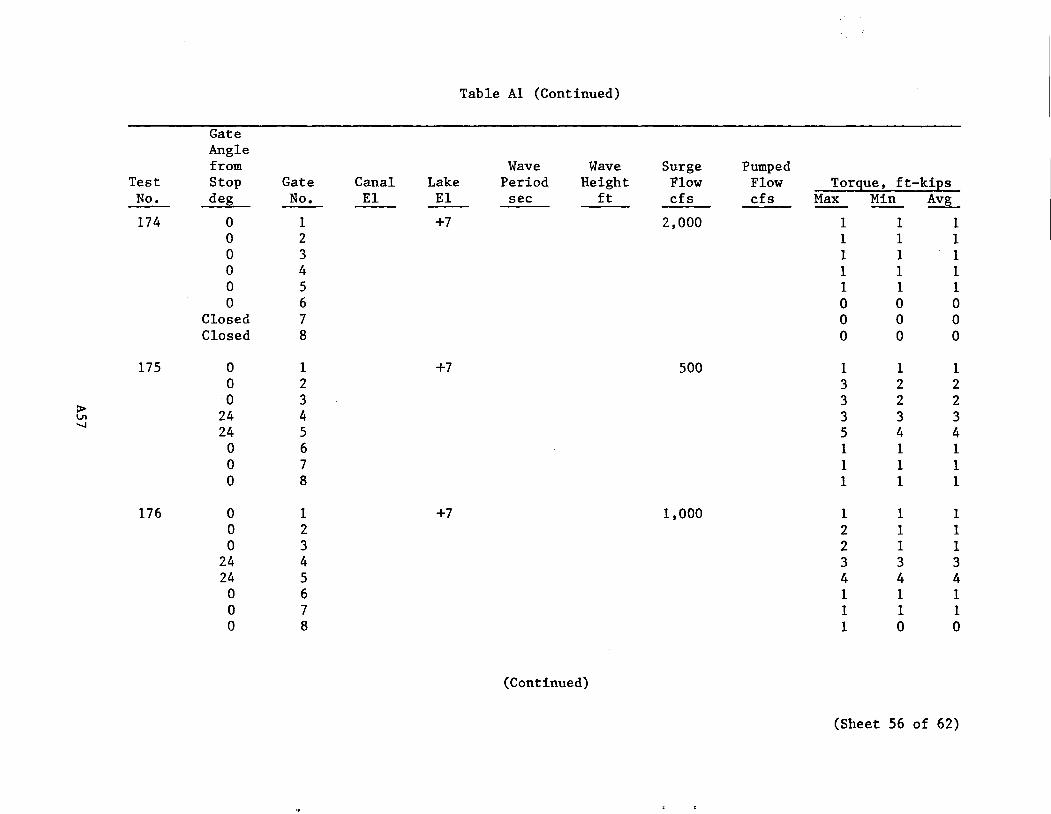
Table Al (Continued)
Gate Angle from Wave Wave Surge Pumped
Test Stop Gate Canal Lake Period. Height Flow Flow Torque, ft-kips No. deg No. El El sec ft cfs cfs Max Min Avg
174 0 1 +7 2,000 1 1 1 0 2 1 1 1 0 3 1 1 1 0 4 1 1 1 0 5 1 1 1 0 6 0 0 0
Closed 7 0 0 0 Closed 8 0 0 0
175 0 1 +7 500 1 1 1 0 2 3 2 2 0 3 3 2 2
> 24 4 3 3 3 VI ...... 24 5 5 4 4
0 6 1 1 1 0 7 1 1 1 0 8 1 1 1
176 0 1 +7 1,000 1 1 1 0 2 2 1 1 0 3 2 1 1
24 4 3 3 3 24 5 4 4 4 0 6 1 1 1 0 7 1 1 1 0 8 1 0 0
(Continued)
(Slleet 56 of 62)
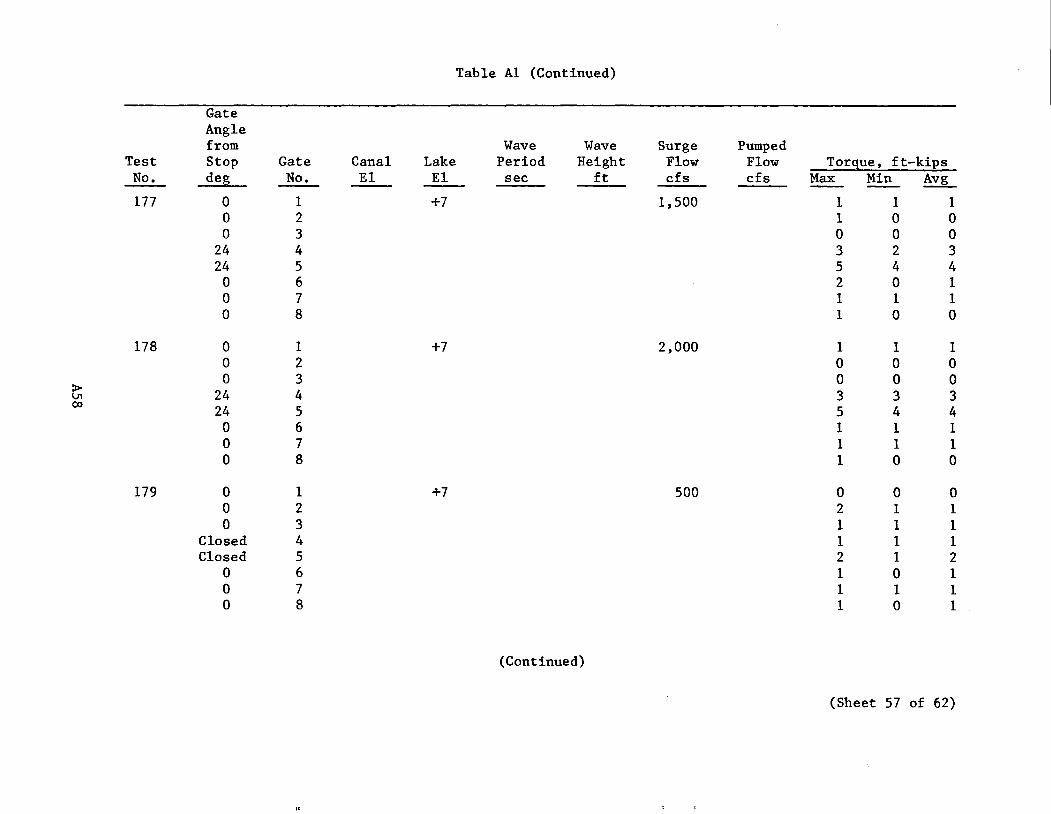
Table Al (Continued)
Gate Angle from Wave Wave Surge Pumped
Test Stop Gate Canal Lake Period Height Flow Flow Torque, ft-kips No. deg No. EI EI sec ft cfs cfs Max Min Avg
177 0 1 +7 1,500 1 1 1 0 2 1 0 0 0 3 0 0 0
24 4 3 2 3 24 5 5 4 4 0 6 2 0 1 0 7 1 1 1 0 8 1 0 0
178 0 1 +7 2,000 1 1 1 0 2 0 0 0 0 3 0 0 0 > 24 4 3 3 3 VI
00 24 5 5 4 4 0 6 1 1 1 0 7 1 1 1 0 8 1 0 0
179 0 1 +7 500 0 0 0 0 2 2 1 1 0 3 1 1 1
Closed 4 1 1 1 Closed 5 2 1 2
0 6 1 0 1 0 7 1 1 1 0 8 1 0 1
(Continued)
(Sheet 57 of 62)
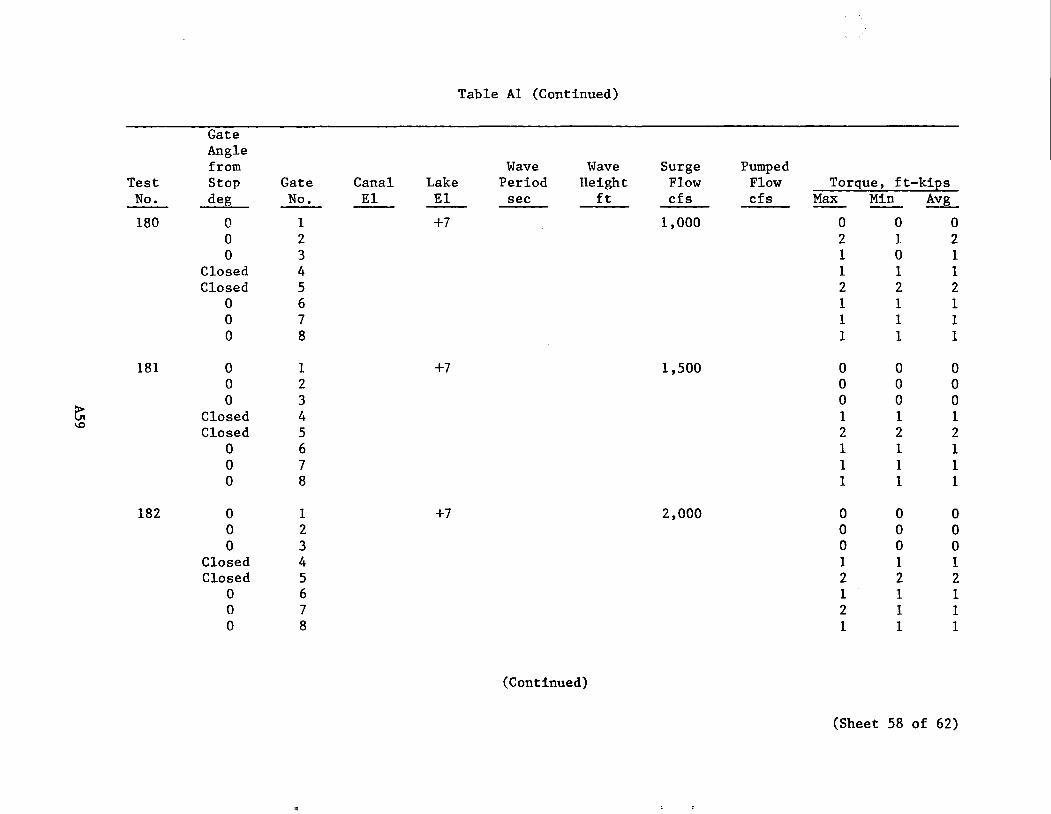
Table Al (Continued)
Gate Angle from Wave Wave Surge Pumped
Test Stop Gate Canal Lake Period Height Flow Flow Torque, ft-kips No. deg No. E1 E1 sec ft cfs cfs Max Min Avg
180 0 1 +7 1,000 0 0 0 0 2 2 1 2 0 3 1 0 1
Closed 4 1 1 1 Closed 5 2 2 2
0 6 1 1 1 0 7 1 1 1 0 8 1 1 1
181 0 1 +7 1,500 0 0 0 0 2 0 0 0 0 3 0 0 0
> Closed 4 1 1 1 VI \0
Closed 5 2 2 2 0 6 1 1 1 0 7 1 1 1 0 8 1 1 1
182 0 1 +7 2,000 0 0 0 0 2 0 0 0 0 3 0 0 0
Closed 4 1 1 1 Closed 5 2 2 2
0 6 1 1 1 0 7 2 1 1 0 8 1 1 1
(Continued)
(Sheet 58 of 62)

Table Al (Continued)
Gate Angle from Wave Wave Surge Pumped
Test Stop Gate Canal Lake Period Height Flow Flow Torque, ft-kiEs No. deg No. El El see ft efs efs Max Min Avg
183 6 1 +1 500 2 1 2 2 1 0 0 3 1 0 0 4 4 4 4 5 2 1 1 6 2 2 2 7 2 1 2 8 6 5 5
184 6 1 +1 1,000 2 2 2 2 1 0 1
> 3 2 0 1 0'1 4 5 4 4 0
5 2 1 2 6 3 2 2 7 2 2 2 8 6 6 6
185 6 1 +1 1,500 2 2 2 2 1 0 1 3 4 0 1 4 5 5 5 5 2 2 2 6 3 2 2 7 2 2 2 8 6 6 6
(Continued)
(Sheet 59 of 62)
.....
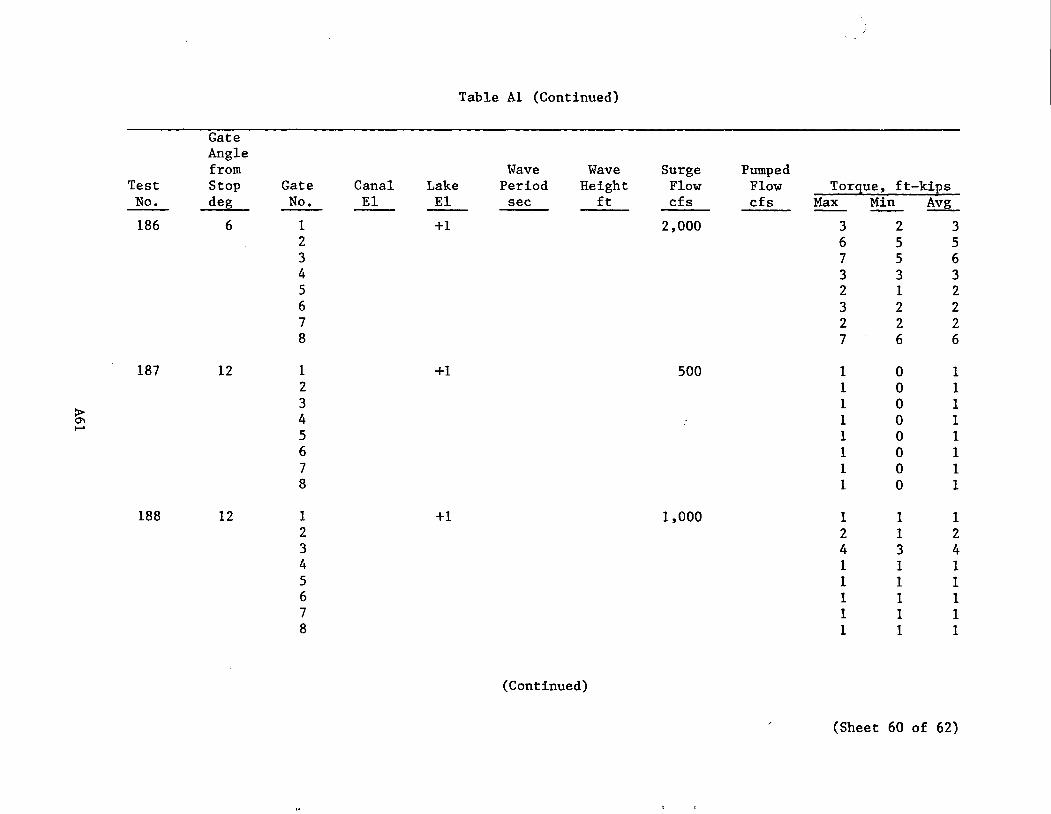
Table Al (Continued)
Gate Angle from Wave Wave Surge Pumped
Test Stop Gate Canal Lake Period Height Flow Flow Torgue, ft-kips No. deg No. EI EI sec ft cfs cfs Max Min Avg
186 6 1 +1 2,000 3 2 3 2 6 5 5 3 7 5 6 4 3 3 3 5 2 1 2 6 3 2 2 7 2 2 2 8 7 6 6
187 12 1 +1 500 1 0 1 2 1 0 1 3 1 0 1
:.> 4 1 0 1 0'1 ...... 5 1 0 1 6 1 ° 1 7 1 0 1 8 1 ° 1
188 12 1 +1 1,000 1 1 1 2 2 1 2 3 4 3 4 4 1 1 1 5 1 1 1 6 1 1 1 7 1 1 1 8 1 1 1
(Continued)
(Sheet 60 of 62)
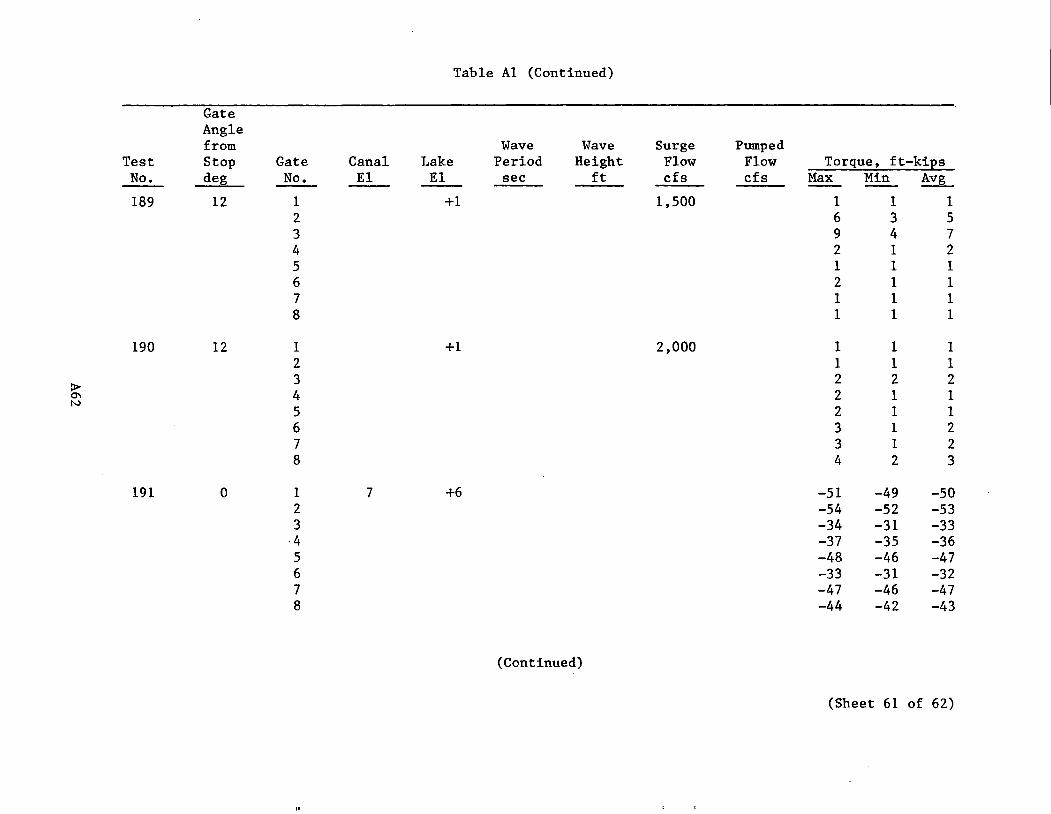
Table Al (Continued)
Gate Angle from Wave Wave Surge Pumped
Test Stop Gate Canal Lake Period Height Flow Flow Torque, ft-kiEs No. deg No. EI EI sec ft cfs cfs Max Min Avg
189 12 1 +1 1,500 1 1 1 2 6 3 5 3 9 4 7 4 2 1 2 5 1 1 1 6 2 1 1 7 1 1 1 8 1 1 1
190 12 1 +1 2,000 1 1 1 2 1 1 1
> 3 2 2 2 0'1 4 2 1 1 N
2 1 5 1 6 3 1 2 7 3 1 2 8 4 2 3
191 0 1 7 +6 -51 -49 -50 2 -54 -52 -53 3 -34 -31 -33 4 -37 -35 -36 5 -48 -46 -47 6 -33 -31 -32 7 -47 -46 -47 8 -44 -42 -43
(Continued)
(Sheet 61 of 62)
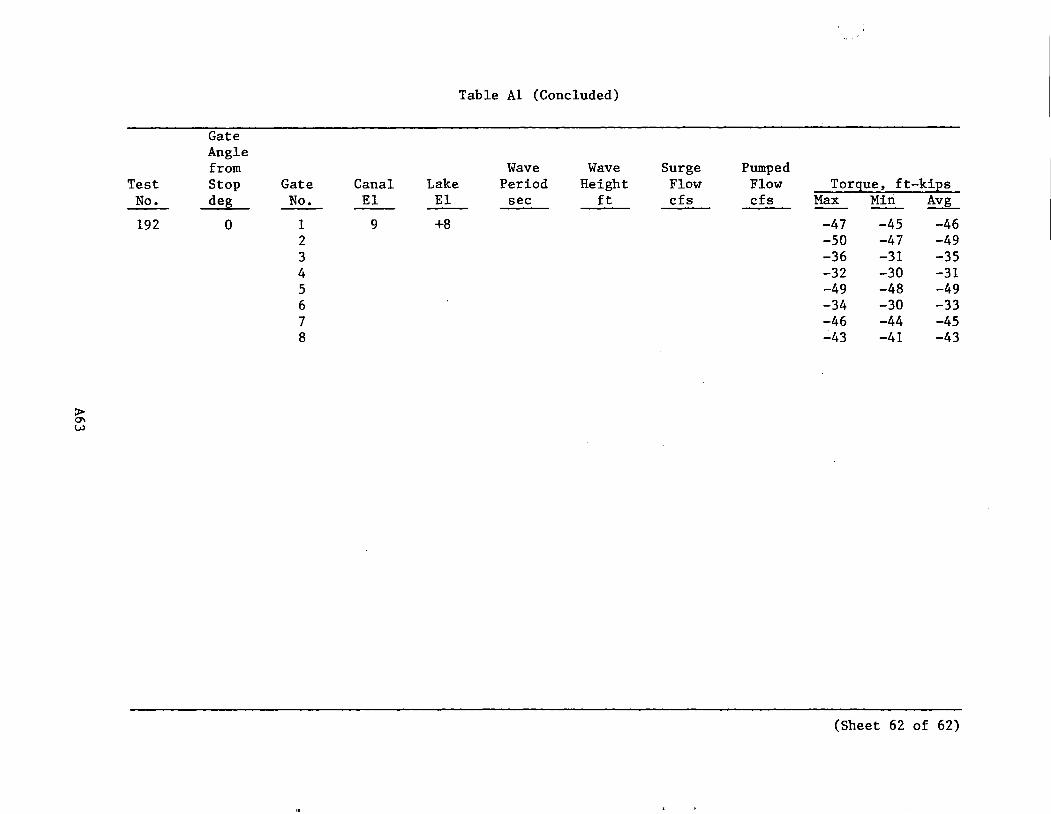
> 0\ W
Test No.
192
Gate Angle from Stop de~
0
Gate No.
1 2 3 4 5 6 7 8
Table Al (Concluded)
Wave Wave Canal Lake Period Height El El sec ft
9 +8
Surge Pumped Flow Flow Torque, ft-kiEs cfs cfs Max Min Avg
-47 -45 -46 -50 -47 -49 -36 -31 -35 -32 -30 -31 -49 -48 -49 -34 -30 -33 -46 -44 -45 -43 -41 -43
(Sheet 62 of 62)