origin operational review and asset visit presentations
TRANSCRIPT
Origin Energy Limited ACN 000 051 696 • Level 45 Australia Square, 264-278 George Street, Sydney NSW 2000 GPO Box 5376, Sydney NSW 2001 • Telephone (02) 8345 5000 • Facsimile (02) 9252 1566 • www.originenergy.com.au
To Company Announcements Office Facsimile 1300 135 638
Company ASX Limited Date 31 October 2013
From Helen Hardy Pages 60
Subject Origin Operational Review and Asset Visit Presentations
Please find attached a release on the above subject. Regards
Helen Hardy Company Secretary 02 8345 5023 – [email protected]
For
per
sona
l use
onl
y

Origin Operational Review and Asset Visit
31 October and 1 November 2013
For
per
sona
l use
onl
y
Important Notice The information and opinions contained in this presentation are intended solely for your personal reference and are strictly confidential. This presentation may not be used or relied upon by any other party, or for any other purpose, and may not be reproduced, disseminated or quoted without the prior written consent of Origin Energy Limited (Origin). This presentation or any materials provided in connection herewith may not be taken away by you. The contents of this presentation may not be reproduced, redistributed or passed on, directly or indirectly, to any other person or published, in whole or in part, for any purpose. This presentation has been prepared by Origin. The information in this presentation is an overview and does not contain all information necessary to make an investment decision. It does not take into account the investment objectives, financial situation or particular needs of any particular investor. Origin make no recommendation to investors regarding the suitability of an investment in its or its subsidiaries’ securities, and the recipient of this presentation must make its own assessment and/or seek independent advice on financial, legal, tax and other matters, including the merits and risks involved. No representation or warranty, express or implied, is made as to the fairness, accuracy, completeness or correctness of the information, opinions and conclusions contained in this presentation. To the maximum extent permitted by law, none of Origin, nor any of their directors, employees or agents, nor any other person accepts any liability, including, without limitation, any liability arising out of fault or negligence for any loss arising from the use of the information contained in this presentation. This presentation does not constitute an offer to sell, or a solicitation of an offer to buy, any securities in the United States or any other jurisdiction. Securities of Origin and its subsidiaries have not been, and will not be, registered under the U.S. Securities Act of 1933 (the "Securities Act") or the securities laws of any state or other jurisdiction of the United States and may not be offered or sold, directly or indirectly, in the United States absent registration except in a transaction exempt from, or not subject to, the registration requirements of the Securities Act and any other applicable U.S. state securities laws. Forward looking statements This presentation contains forward looking statements, including statements of current intention, statements of opinion and predictions as to possible future events. Such statements are not statements of fact and there can be no certainty of outcome in relation to the matters to which the statements relate. These forward looking statements involve known and unknown risks, uncertainties, assumptions and other important factors that could cause the actual outcomes to be materially different from the events or results expressed or implied by such statements. Those risks, uncertainties, assumptions and other important factors are not all within the control of Origin and cannot be predicted by Origin and include changes in circumstances or events that may cause objectives to change as well as risks, circumstances and events specific to the industry, countries and markets in which Origin and its related bodies corporate, joint ventures and associated undertakings operate. They also include general economic conditions, exchange rates, interest rates, the regulatory environment, competitive pressures, selling price, market demand, conditions in the financial markets, operating and asset risks and delays in project development and implementation and/or higher than expected costs, which may cause objectives to change or may cause outcomes not to be realised. None of Origin or any of its respective subsidiaries, affiliates and associated companies (or any of their respective officers, employees or agents) (the Relevant Persons) makes any representation, assurance or guarantee as to the accuracy or likelihood of fulfillment of any forward looking statement or any outcomes expressed or implied in any forward looking statements. The forward looking statements in this presentation reflect views held only at the date of this presentation. You are cautioned not to place undue reliance on forward-looking statements.
2 |
For
per
sona
l use
onl
y
Important Notice Statements about past performance are not necessarily indicative of future performance. Except as required by applicable law or the ASX Listing Rules, the Relevant Persons disclaim any obligation or undertaking to update any forward looking statements, whether as a result of new information or future events. This presentation contains data sourced from and the views of independent third parties. In replicating such data in this document, Origin makes no representation, whether express or implied, as to the accuracy of such data. The replication of any views in this document should not be treated as an indication that Origin agrees with or concurs with such views. Financial information All figures in this presentation relate to businesses of the Origin Energy Group (Origin, or the Company), being Origin Energy Limited and its controlled entities, for the year ended 30 June 2013 (FY2013) compared with the year ended 30 June 2012 (FY2012), except where otherwise stated. Earlier periods are referred to in a similar manner.
Origin’s Financial Statements for the year ended 30 June 2013 are presented in accordance with Australian Accounting Standards and comply with IFRS. The Segment results, which are used to measure segment performance, are disclosed in Note 2 of the Financial Statements and are disclosed on a basis consistent with the information provided internally to Origin’s Managing Director. Origin’s Statutory Profit contains a number of items that when excluded provide a different perspective on the financial and operational performance of the business. Income Statement amounts presented on an underlying basis such as Underlying Consolidated Profit, are non-IFRS financial measures, and exclude the impact of these items consistent with the manner in which the Managing Director reviews the financial and operating performance of the business. Each underlying measure disclosed has been adjusted to remove the impact of these items on a consistent basis. A reconciliation and description of the items that contribute to the difference between Statutory Profit and Underlying Consolidated Profit is provided in Note 2 of the Financial Statements.
A reference to Contact Energy is a reference to Origin’s controlled entity (53.1% ownership) Contact Energy Limited in New Zealand. In accordance with Australian Accounting Standards, Origin consolidates Contact Energy within its result.
A reference to Australia Pacific LNG or APLNG is a reference to Australia Pacific LNG Pty Ltd in which Origin had a 50% shareholding in until 9 August 2011, when completion of a share subscription agreement between Australia Pacific LNG and Sinopec resulted in a dilution in Origin’s shareholding to 42.5%. Origin’s shareholding in Australia Pacific LNG, which is equity accounted in line with Origin’s shareholding, was 42.5% as at 30 June 2012. This shareholding was subsequently diluted to 37.5% upon completion of Sinopec’s increased share subscription in Australia Pacific LNG on 12 July 2012.
A reference to $ is a reference to Australian dollars unless specifically marked otherwise. All references to debt are a reference to interest bearing debt only (which exclude Australia Pacific LNG shareholder loans). Individual items and totals are rounded to the nearest appropriate number or decimal. Some totals may not add down the page due to rounding of individual components. When calculating a percentage change, a positive or negative percentage change denotes the mathematical movement in the underlying metric, rather than a positive or a detrimental impact. Measures for which the underlying numbers change from negative to positive, or vice versa, are labelled as not applicable.
Oil and gas reserves As a company with securities listed on the ASX, Origin is required to follow the SPE/WPC/AAPG/SPEE Petroleum Resources Management System (March 2007) guidelines (PRMS Guidelines) published by the Society of Petroleum Engineers in order to comply with the ASX requirements for Australian publicly listed companies. You should note, however, that different reserves reporting systems employ different definitions and permit or require different assumptions, and that Origin’s methodologies for classifying reserves and our reserves classifications vary in certain respects from the methodologies and classifications used by oil and gas companies subject to the reporting obligations of the U.S. Securities and Exchange Commission. As a result, identical geological and engineering data can produce varying estimates of reserves. 3 |
For
per
sona
l use
onl
y
Australia Pacific LNG – CSG Production
Presented by Ross Evans
Group Manager, Exploration Appraisal & Development, QLD CSG
Origin Operational Review and Asset Visit 31 October 2013
For
per
sona
l use
onl
y

Origin is responsible for the upstream program for Australia Pacific LNG, leveraging over 16 years of CSG production experience …
2 |
APLNG tenure in the Surat and Bowen basins at 30 June 2012
… with Australia Pacific LNG having a dominant position in Queensland's premium CSG acreage
• APLNG is the only company that has prime acreage in both of the Queensland CSG “sweet spots”
• APLNG Phase 1 targets those sweet spots for initial development and ramp up to first LNG
• APLNG has both diversity and scale of resources to better manage risks associated with CSG
For
per
sona
l use
onl
y
0
5,000
10,000
15,000
20,000
25,000
Reserves ContingentResources
EstimatedProject
Requirements
PJe
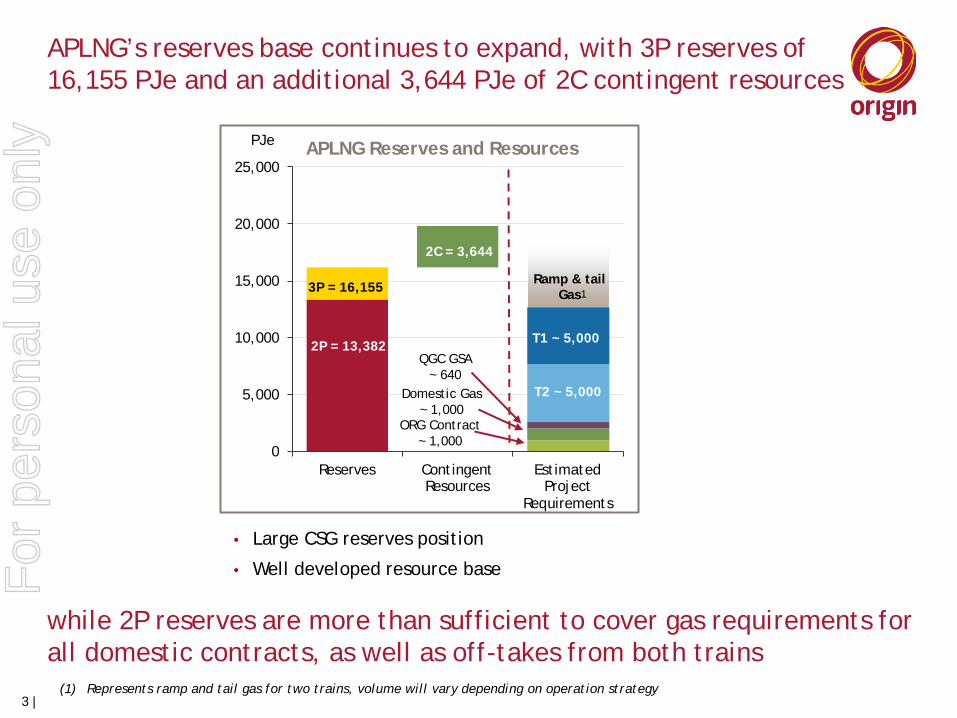
3P = 16,155
2P = 13,382
2C = 3,644
Ramp & tail Gas
T2 ~ 5,000
T1 ~ 5,000
APLNG’s reserves base continues to expand, with 3P reserves of 16,155 PJe and an additional 3,644 PJe of 2C contingent resources
3 |
while 2P reserves are more than sufficient to cover gas requirements for all domestic contracts, as well as off-takes from both trains
• Large CSG reserves position
• Well developed resource base
Domestic Gas ~ 1,000
ORG Contract ~ 1,000
APLNG Reserves and Resources
(1) Represents ramp and tail gas for two trains, volume will vary depending on operation strategy
QGC GSA ~ 640
1
For
per
sona
l use
onl
y
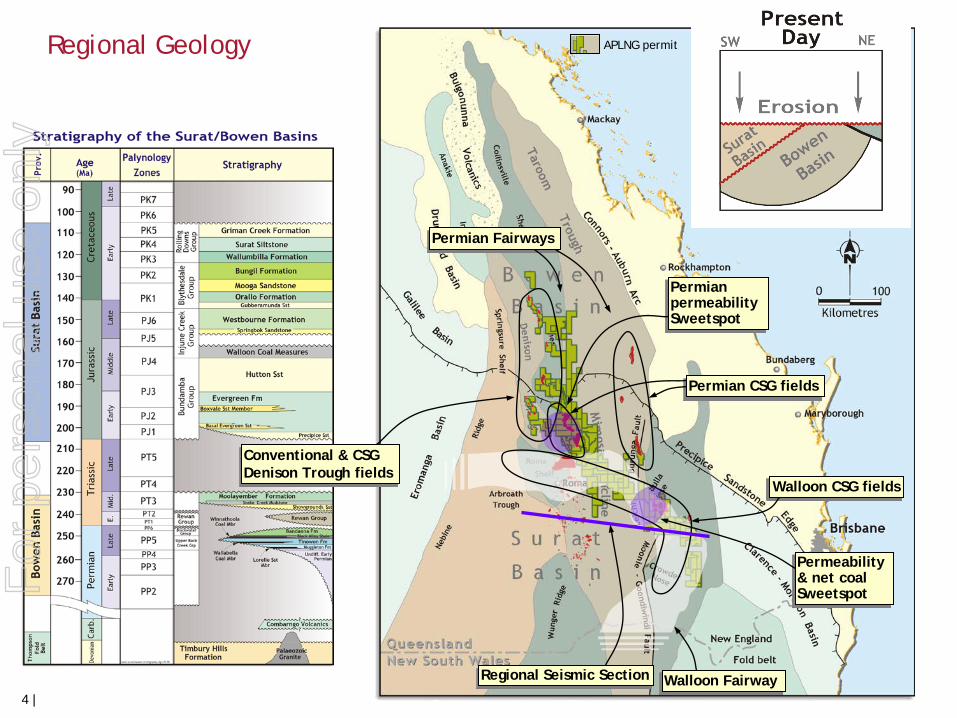
APLNG permit
Conventional & CSG Denison Trough fields
Permian CSG fields
Walloon CSG fields
Walloon Fairway
Permeability & net coal Sweetspot
Permian permeability Sweetspot
Permian Fairways
Regional Geology
Regional Seismic Section
4 |
For
per
sona
l use
onl
y
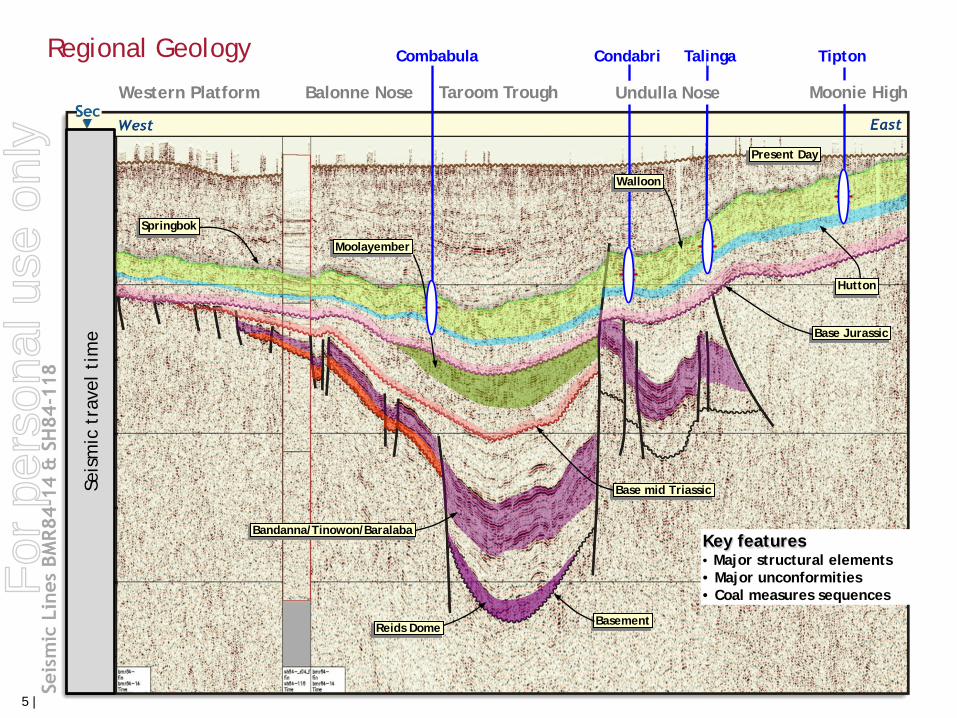
5
Basement
Base mid Triassic
Base Jurassic
Key features • Major structural elements • Major unconformities • Coal measures sequences
Western Platform Moonie High
Bandanna/Tinowon/Baralaba
Reids Dome
Springbok
Present Day
Talinga
Hutton
Seis
mic
tra
vel
tim
e
Combabula Condabri
Undulla Nose Taroom Trough Balonne Nose
Walloon
Moolayember
Regional Geology
5 |
Tipton F
or p
erso
nal u
se o
nly
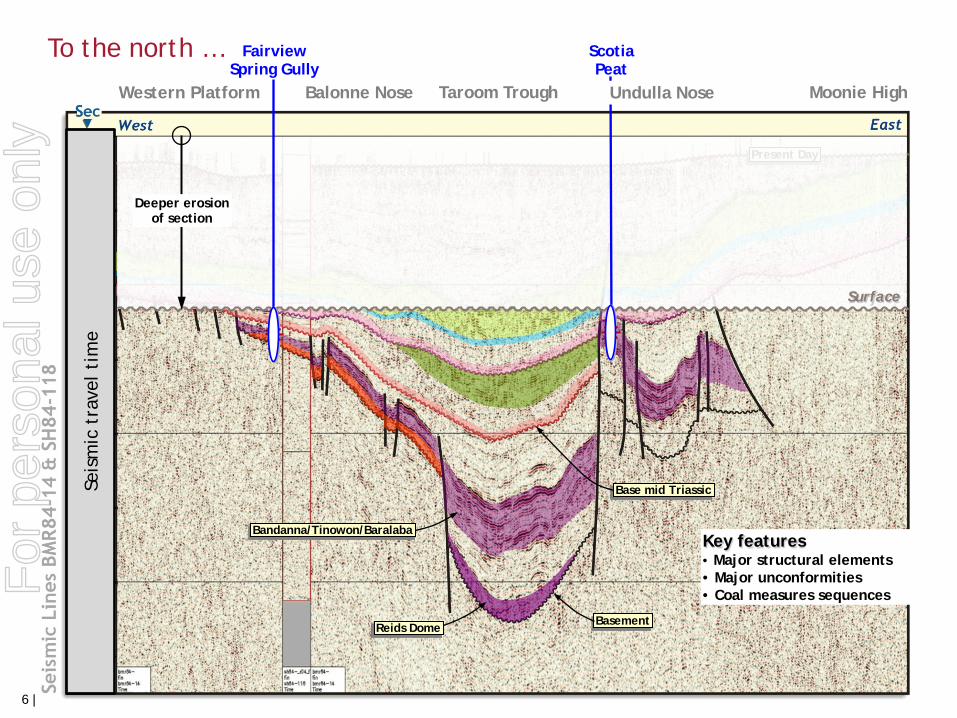
6
Basement
Key features • Major structural elements • Major unconformities • Coal measures sequences
Base mid Triassic
Taroom Trough
Present Day
Fairview Spring Gully
Scotia Peat
Moonie High Western Platform Balonne Nose
Bandanna/Tinowon/Baralaba
To the north …
Surface
Deeper erosion of section
Reids Dome
Undulla Nose Se
ism
ic t
rave
l ti
me
6 |
For
per
sona
l use
onl
y
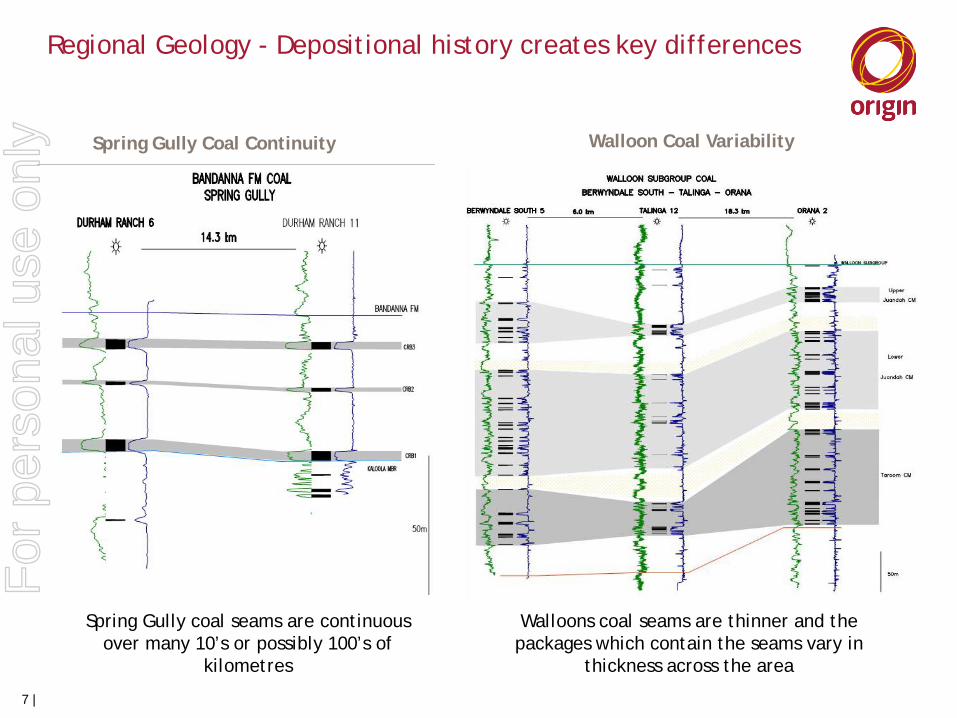
Spring Gully Coal Continuity
Spring Gully coal seams are continuous over many 10’s or possibly 100’s of
kilometres
Walloons coal seams are thinner and the packages which contain the seams vary in
thickness across the area
Walloon Coal Variability
Regional Geology - Depositional history creates key differences
7 |
For
per
sona
l use
onl
y
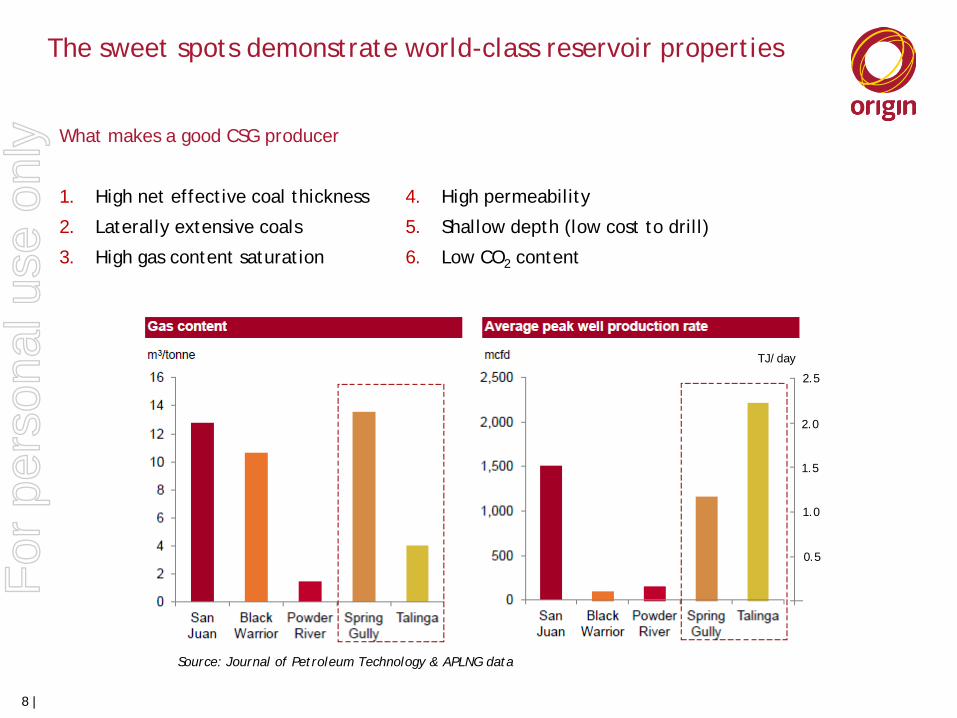
The sweet spots demonstrate world-class reservoir properties
What makes a good CSG producer
1. High net effective coal thickness
2. Laterally extensive coals
3. High gas content saturation
4. High permeability
5. Shallow depth (low cost to drill)
6. Low CO2 content
Source: Journal of Petroleum Technology & APLNG data
8 |
TJ/day
2.5
2.0
1.5
0.5
1.0
For
per
sona
l use
onl
y

APLNG has secured more prime CSG acreage...
• Successful Gazettal bid, May 2013 grant date.
• Bolt-on acreage adjacent to existing Condabri (PL265, 266, 267) development areas.
• 76km2 prime Undulla nose acreage
• High likelihood of reserves booking after initial exploration drilling.
...enabling high-value step-out development 9 |
For
per
sona
l use
onl
y
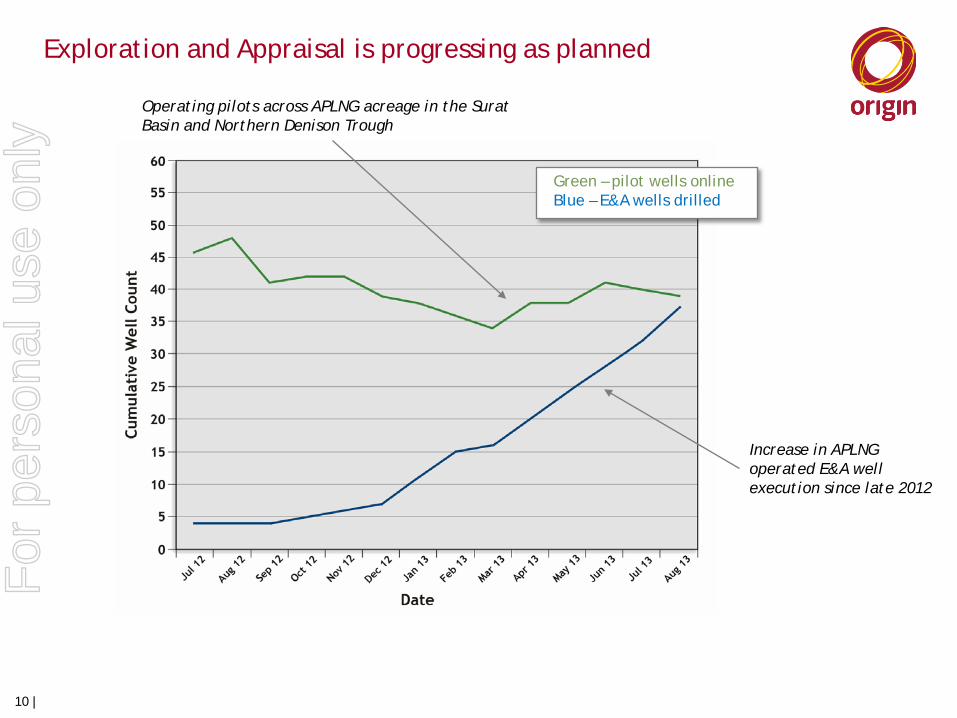
Exploration and Appraisal is progressing as planned
Green – pilot wells online Blue – E&A wells drilled
Operating pilots across APLNG acreage in the Surat Basin and Northern Denison Trough
Increase in APLNG operated E&A well execution since late 2012
10 |
For
per
sona
l use
onl
y
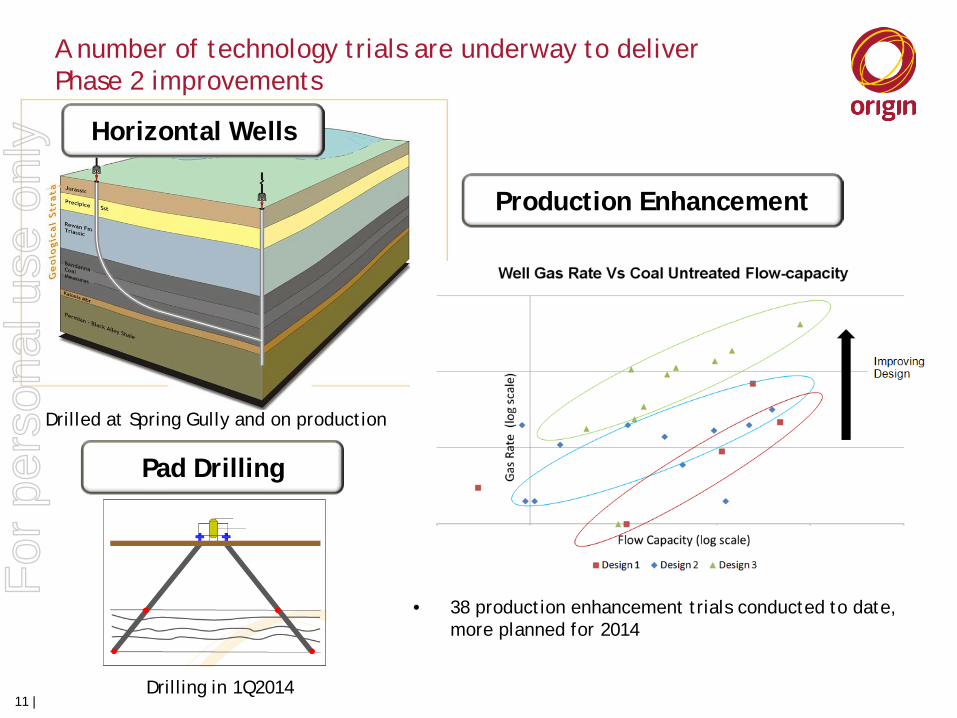
Horizontal Wells
Pad Drilling
Drilled at Spring Gully and on production
Drilling in 1Q2014
Production Enhancement
• 38 production enhancement trials conducted to date, more planned for 2014
A number of technology trials are underway to deliver Phase 2 improvements
11 |
For
per
sona
l use
onl
y
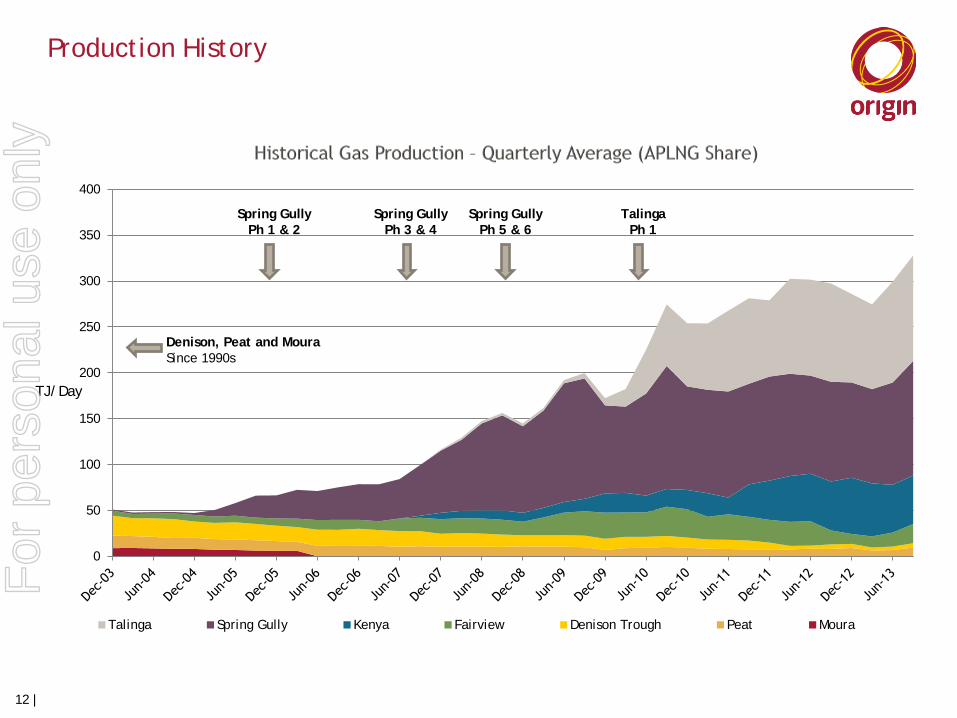
Production History
12 |
Denison, Peat and Moura Since 1990s
Spring Gully Ph 1 & 2
Spring Gully Ph 3 & 4
Spring Gully Ph 5 & 6
Talinga Ph 1
0
50
100
150
200
250
300
350
400
Talinga Spring Gully Kenya Fairview Denison Trough Peat Moura
TJ/Day
For
per
sona
l use
onl
y
13 |
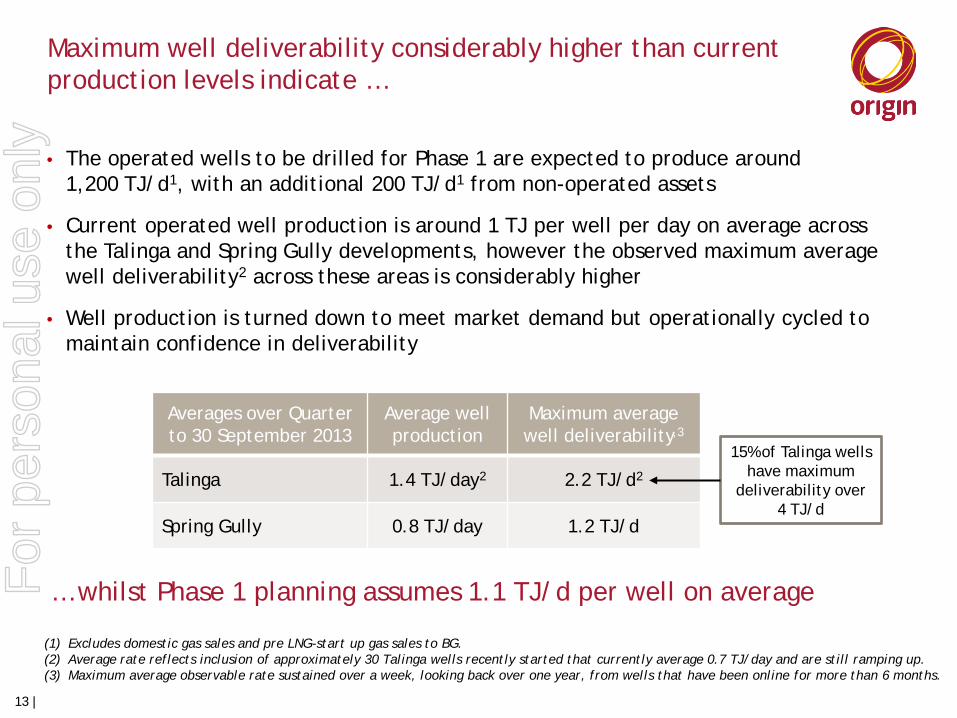
Maximum well deliverability considerably higher than current production levels indicate …
(1) Excludes domestic gas sales and pre LNG-start up gas sales to BG. (2) Average rate reflects inclusion of approximately 30 Talinga wells recently started that currently average 0.7 TJ/day and are still ramping up. (3) Maximum average observable rate sustained over a week, looking back over one year, from wells that have been online for more than 6 months.
• The operated wells to be drilled for Phase 1 are expected to produce around 1,200 TJ/d1, with an additional 200 TJ/d1 from non-operated assets
• Current operated well production is around 1 TJ per well per day on average across the Talinga and Spring Gully developments, however the observed maximum average well deliverability2 across these areas is considerably higher
• Well production is turned down to meet market demand but operationally cycled to maintain confidence in deliverability
Averages over Quarter to 30 September 2013
Average well production
Maximum average well deliverability,3
Talinga 1.4 TJ/day2 2.2 TJ/d2
Spring Gully 0.8 TJ/day 1.2 TJ/d
… whilst Phase 1 planning assumes 1.1 TJ/d per well on average
15% of Talinga wells have maximum
deliverability over 4 TJ/d
For
per
sona
l use
onl
y
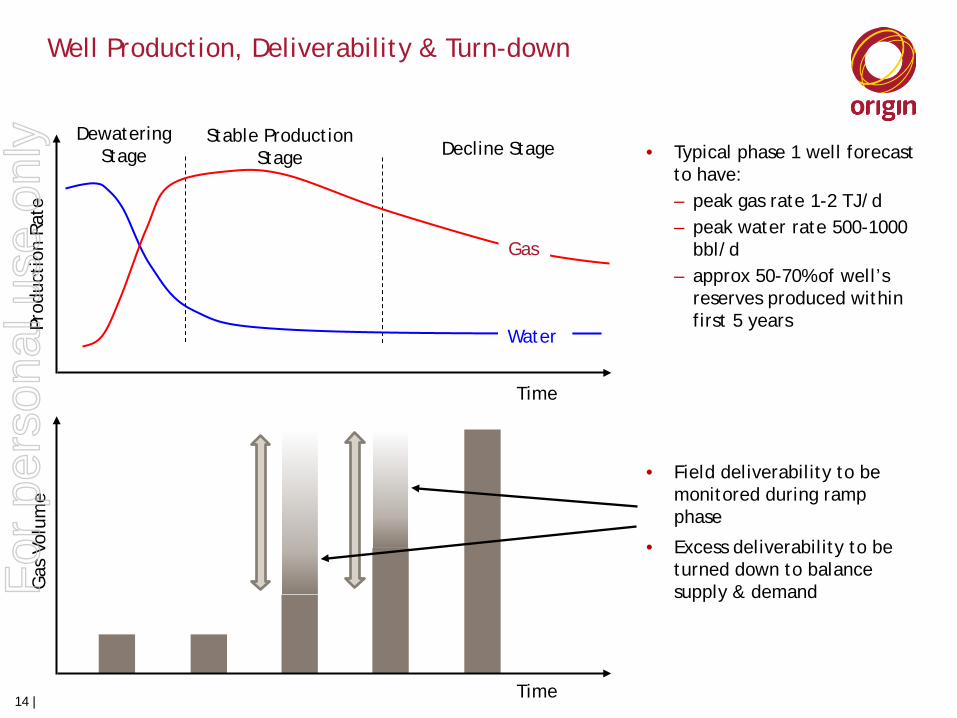
Well Production, Deliverability & Turn-down
• Typical phase 1 well forecast to have: – peak gas rate 1-2 TJ/d – peak water rate 500-1000
bbl/d – approx 50-70% of well’s
reserves produced within first 5 years
• Field deliverability to be monitored during ramp phase
• Excess deliverability to be turned down to balance supply & demand
Prod
ucti
on R
ate
Gas
Dewatering Stage
Water
Stable Production Stage Decline Stage
Time
Time
Gas
Vol
ume
14 |
For
per
sona
l use
onl
y
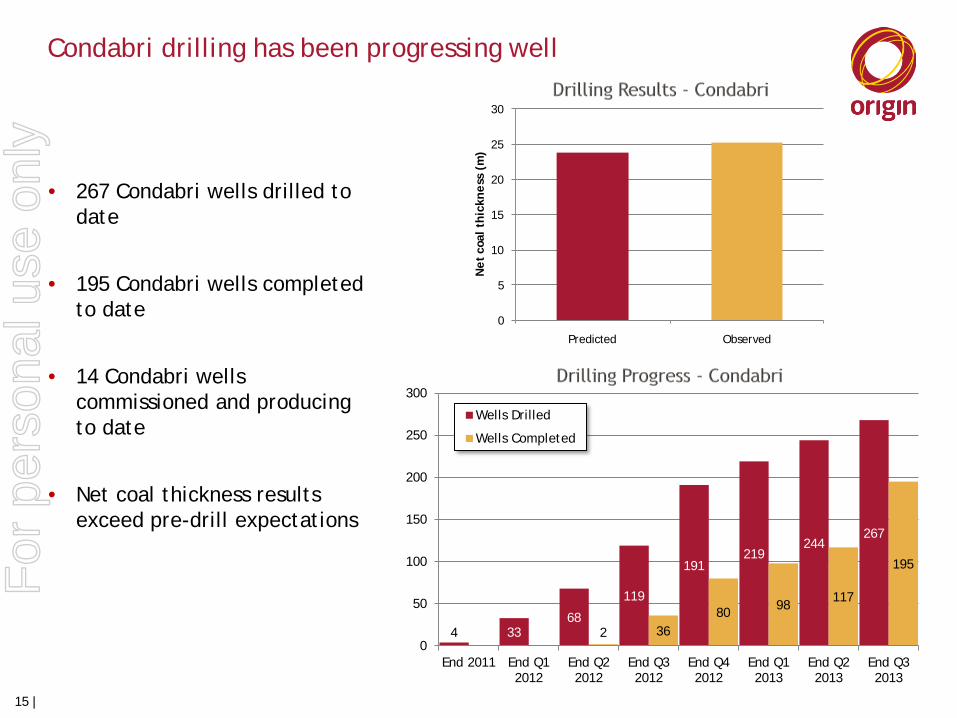
4 33 68
119
191 219
244 267
2 36 80 98
117
195
0
50
100
150
200
250
300
End 2011 End Q1 2012
End Q2 2012
End Q3 2012
End Q4 2012
End Q1 2013
End Q2 2013
End Q3 2013
Wells Drilled
Wells Completed
15 |
Condabri drilling has been progressing well
• 267 Condabri wells drilled to date
• 195 Condabri wells completed to date
• 14 Condabri wells commissioned and producing to date
• Net coal thickness results exceed pre-drill expectations
0
5
10
15
20
25
30
Predicted Observed
Net
coa
l thi
ckne
ss (
m)
For
per
sona
l use
onl
y
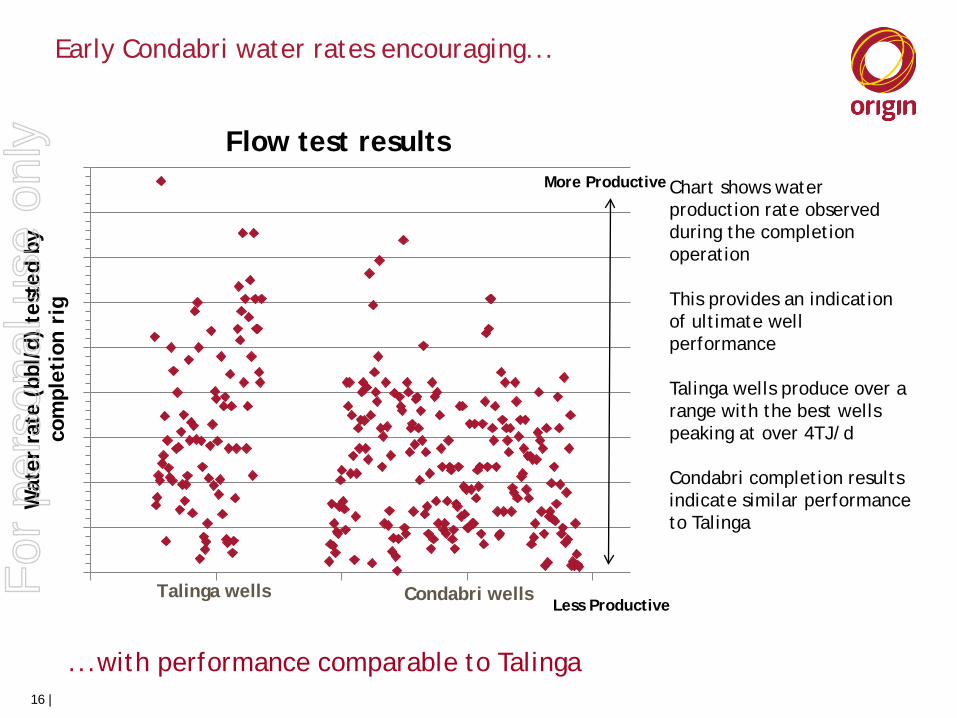
Early Condabri water rates encouraging...
16 |
...with performance comparable to Talinga
Chart shows water production rate observed during the completion operation This provides an indication of ultimate well performance Talinga wells produce over a range with the best wells peaking at over 4TJ/d Condabri completion results indicate similar performance to Talinga
More Productive
0
500
1000
1500
2000
2500
3000
3500
4000
4500
-50 50 150 250 350
Wat
er r
ate
(bbl
/d)
test
ed b
y co
mpl
etio
n ri
g
Flow test results
Talinga wells Condabri wells Less Productive
For
per
sona
l use
onl
y

Thank you
17 |
For
per
sona
l use
onl
y
APLNG Project - Upstream Delivery
Presented by Adrian Lang
Project Director
Origin Operational Review and Asset Visit 31 October 2013
For
per
sona
l use
onl
y
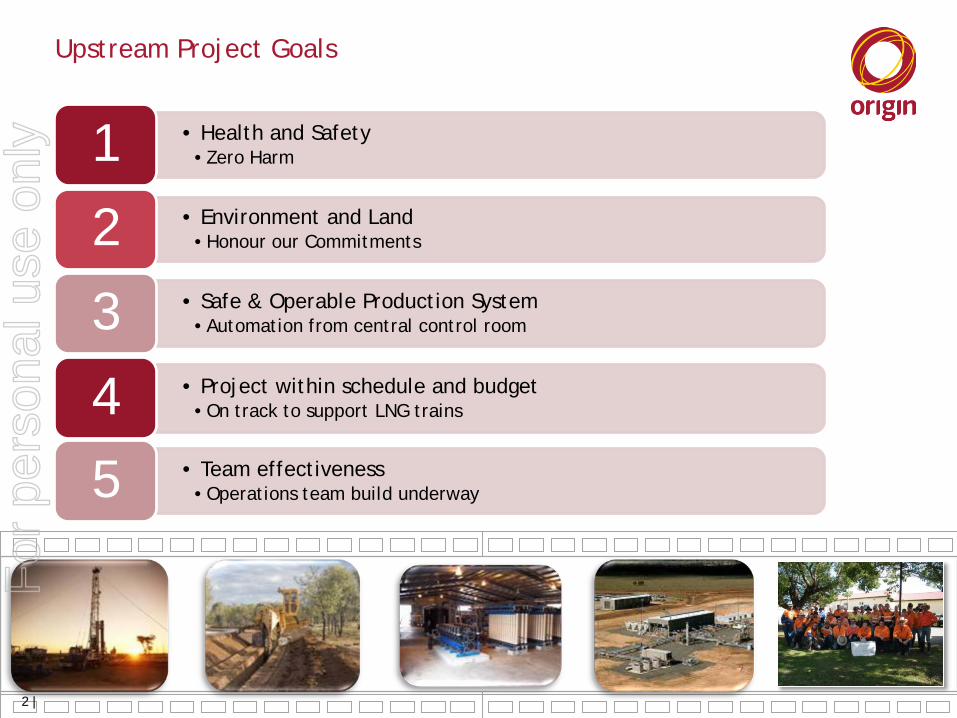
Upstream Project Goals
• Health and Safety •Zero Harm 1
• Environment and Land •Honour our Commitments 2
• Safe & Operable Production System •Automation from central control room 3
2 |
• Project within schedule and budget •On track to support LNG trains 4
• Team effectiveness •Operations team build underway 5
For
per
sona
l use
onl
y

Upstream Operations are like a factory
Optimise
Plan
Land Access
Drill
Complete
Connect
Operate
Produce
Scale & continuous improvement applied to
repeatable processes reduces execution risk and
drives costs lower
PJ /
yr
3 |
For
per
sona
l use
onl
y
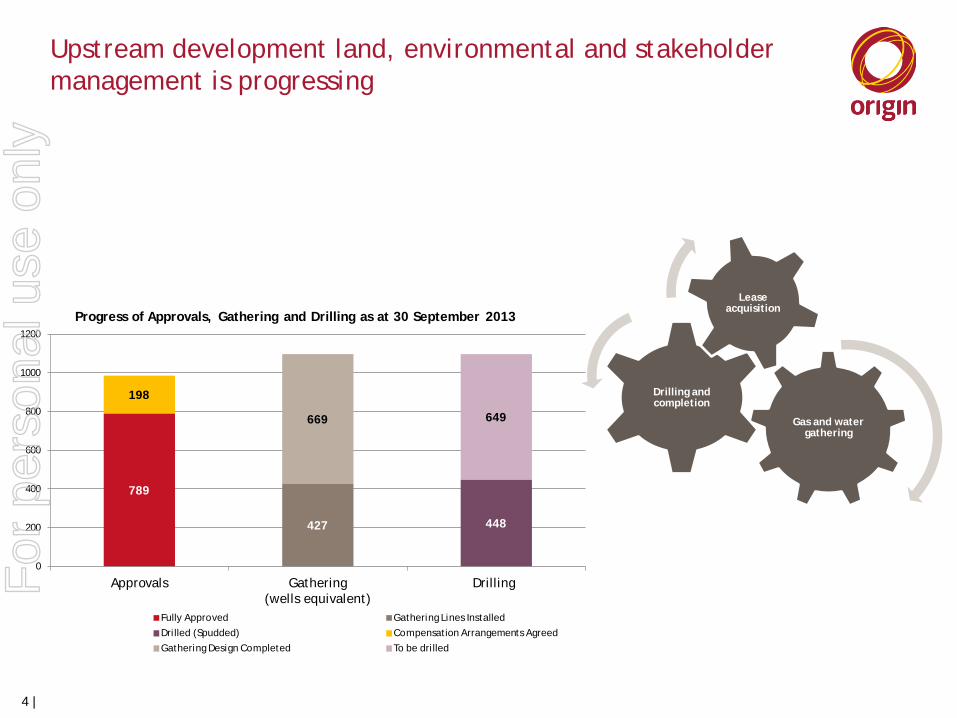
Upstream development land, environmental and stakeholder management is progressing
Gas and water gathering
Drilling and completion
Lease acquisition
4 |
789
427 448
198
669 649
0
200
400
600
800
1000
1200
Approvals Gathering (wells equivalent)
Drilling
Progress of Approvals, Gathering and Drilling as at 30 September 2013
Fully Approved Gathering Lines Installed
Drilled (Spudded) Compensation Arrangements Agreed
Gathering Design Completed To be drilled
For
per
sona
l use
onl
y
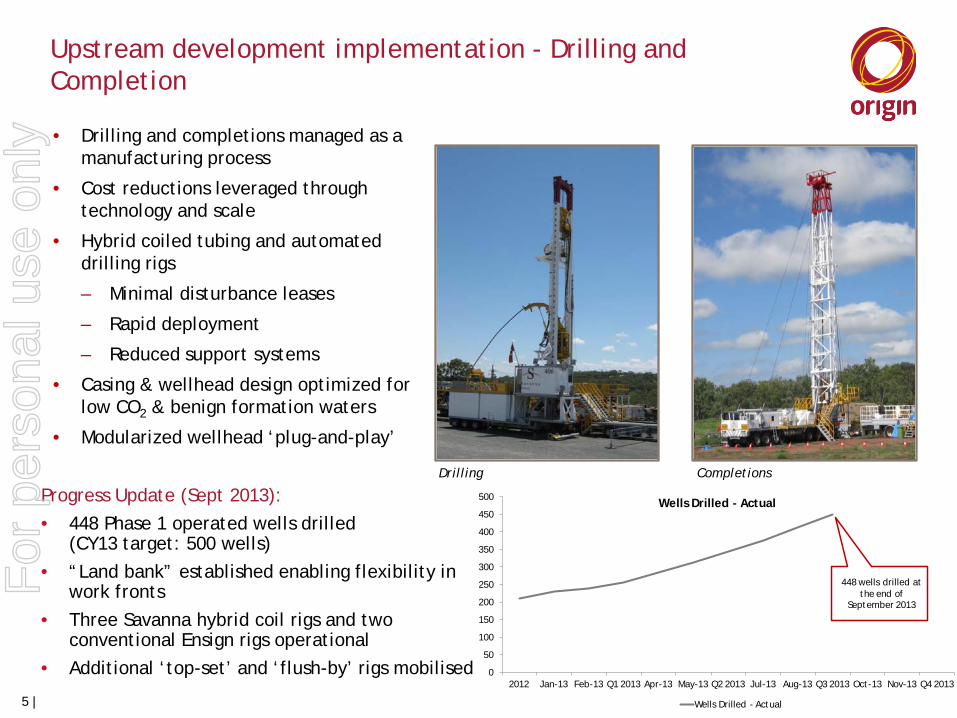
• Drilling and completions managed as a manufacturing process
• Cost reductions leveraged through technology and scale
• Hybrid coiled tubing and automated drilling rigs
– Minimal disturbance leases
– Rapid deployment
– Reduced support systems
• Casing & wellhead design optimized for low CO2 & benign formation waters
• Modularized wellhead ‘plug-and-play’
5 |
Drilling Completions
Upstream development implementation - Drilling and Completion
Progress Update (Sept 2013): • 448 Phase 1 operated wells drilled
(CY13 target: 500 wells) • “Land bank” established enabling flexibility in
work fronts • Three Savanna hybrid coil rigs and two
conventional Ensign rigs operational • Additional ‘top-set’ and ‘flush-by’ rigs mobilised 0
50
100
150
200
250
300
350
400
450
500
2012 Jan-13 Feb-13 Q1 2013 Apr-13 May-13 Q2 2013 Jul-13 Aug-13 Q3 2013 Oct-13 Nov-13 Q4 2013
Wells Drilled - Actual
Wells Drilled - Actual
448 wells drilled at the end of
September 2013
For
per
sona
l use
onl
y

Eastern Gas Fields (Condabri/Talinga) September 2013
Western Gas Fields (Spring Gully/Combabula) September 2013
Upstream development implementation – Phase 1 well progress
Miles
Condamine
Chinchilla
6 |
Combabula
Spring Gully
For
per
sona
l use
onl
y
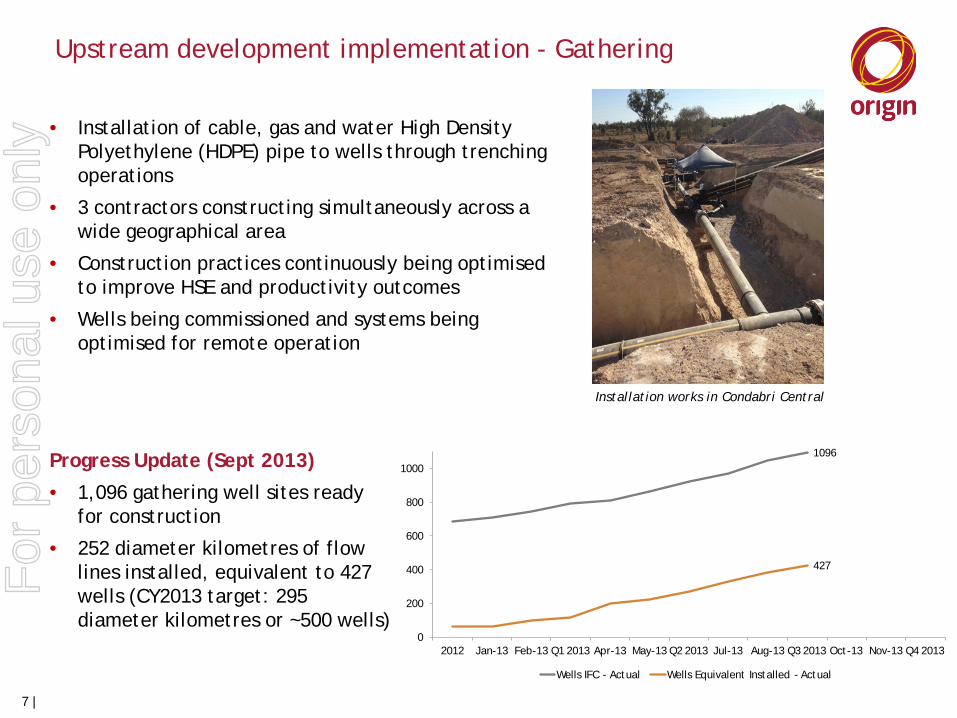
Upstream development implementation - Gathering
• Installation of cable, gas and water High Density Polyethylene (HDPE) pipe to wells through trenching operations
• 3 contractors constructing simultaneously across a wide geographical area
• Construction practices continuously being optimised to improve HSE and productivity outcomes
• Wells being commissioned and systems being optimised for remote operation
7 |
Progress Update (Sept 2013)
• 1,096 gathering well sites ready for construction
• 252 diameter kilometres of flow lines installed, equivalent to 427 wells (CY2013 target: 295 diameter kilometres or ~500 wells)
Installation works in Condabri Central
1096
427
0
200
400
600
800
1000
2012 Jan-13 Feb-13 Q1 2013 Apr-13 May-13 Q2 2013 Jul-13 Aug-13 Q3 2013 Oct-13 Nov-13 Q4 2013
Wells IFC - Actual Wells Equivalent Installed - Actual
For
per
sona
l use
onl
y
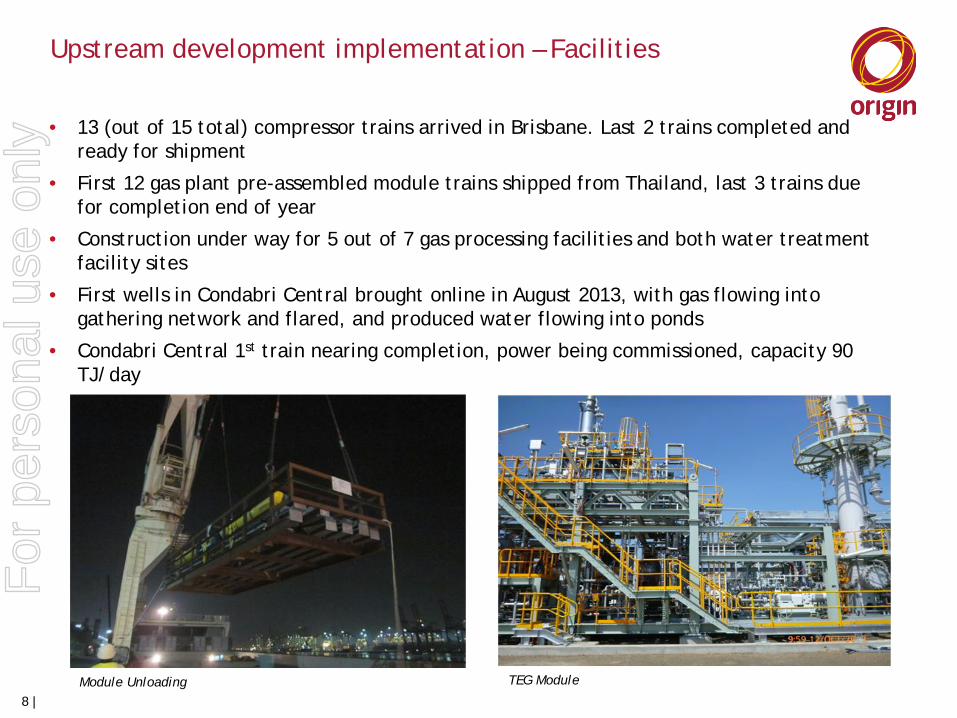
Upstream development implementation – Facilities
• 13 (out of 15 total) compressor trains arrived in Brisbane. Last 2 trains completed and ready for shipment
• First 12 gas plant pre-assembled module trains shipped from Thailand, last 3 trains due for completion end of year
• Construction under way for 5 out of 7 gas processing facilities and both water treatment facility sites
• First wells in Condabri Central brought online in August 2013, with gas flowing into gathering network and flared, and produced water flowing into ponds
• Condabri Central 1st train nearing completion, power being commissioned, capacity 90 TJ/day
8 |
TEG Module Module Unloading
For
per
sona
l use
onl
y
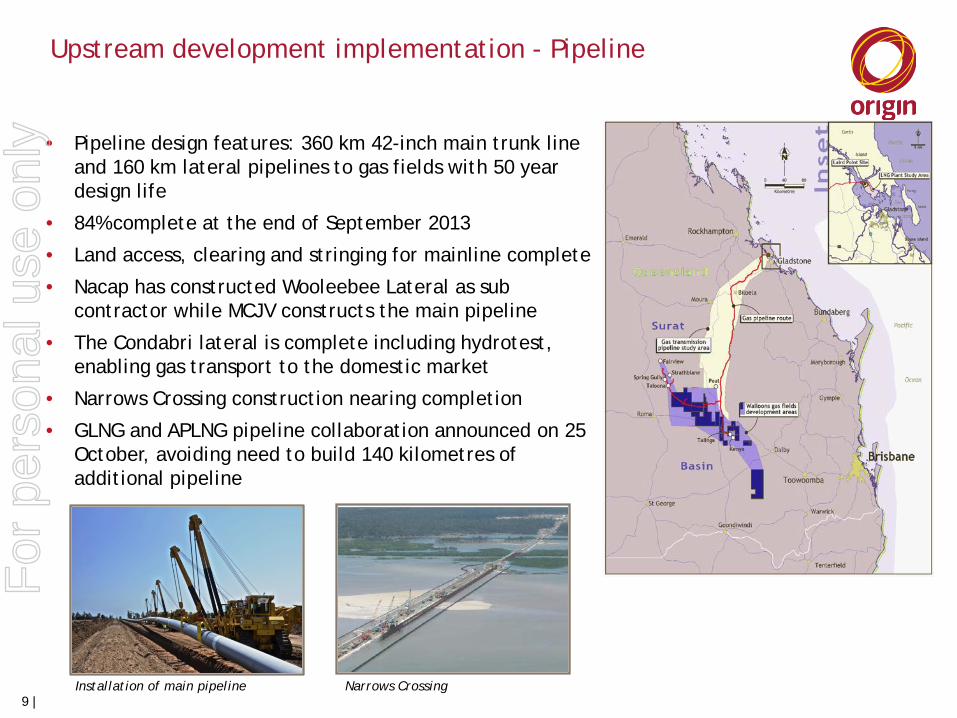
Upstream development implementation - Pipeline
• Pipeline design features: 360 km 42-inch main trunk line and 160 km lateral pipelines to gas fields with 50 year design life
• 84% complete at the end of September 2013
• Land access, clearing and stringing for mainline complete
• Nacap has constructed Wooleebee Lateral as sub contractor while MCJV constructs the main pipeline
• The Condabri lateral is complete including hydrotest, enabling gas transport to the domestic market
• Narrows Crossing construction nearing completion
• GLNG and APLNG pipeline collaboration announced on 25 October, avoiding need to build 140 kilometres of additional pipeline
Installation of main pipeline Narrows Crossing 9 |
For
per
sona
l use
onl
y
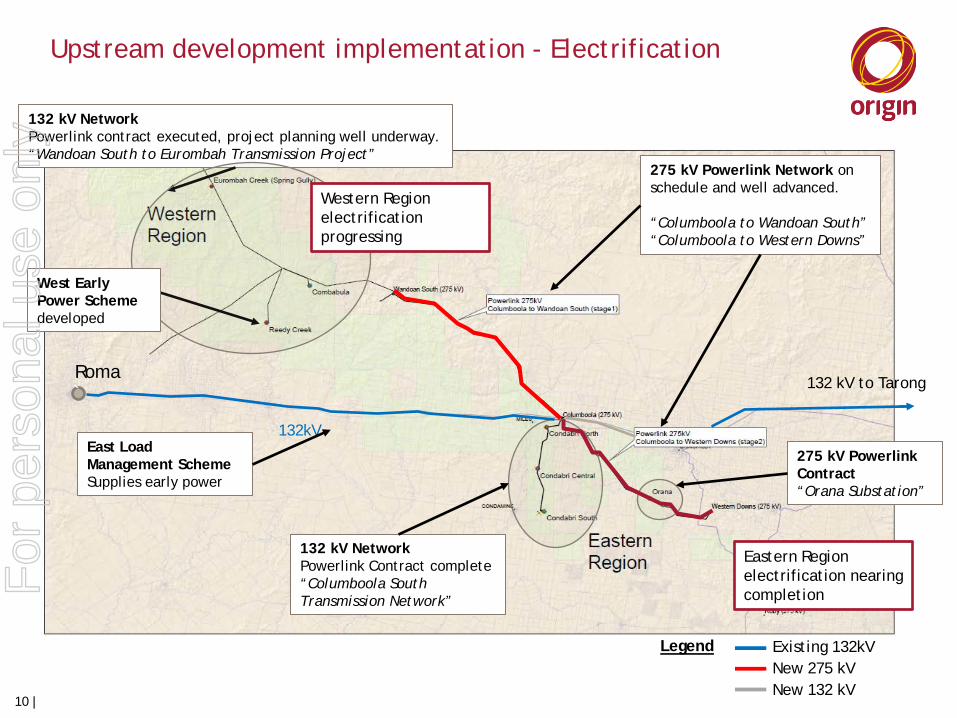
275 kV Powerlink Network on schedule and well advanced. “Columboola to Wandoan South” “Columboola to Western Downs”
132 kV Network Powerlink Contract complete “Columboola South Transmission Network”
` Roma
132kV East Load Management Scheme Supplies early power
132 kV to Tarong
275 kV Powerlink Contract “Orana Substation”
132 kV Network Powerlink contract executed, project planning well underway. “Wandoan South to Eurombah Transmission Project”
West Early Power Scheme developed
Upstream development implementation - Electrification
Existing 132kV New 275 kV New 132 kV
Legend
10 |
Western Region electrification progressing
Eastern Region electrification nearing completion F
or p
erso
nal u
se o
nly
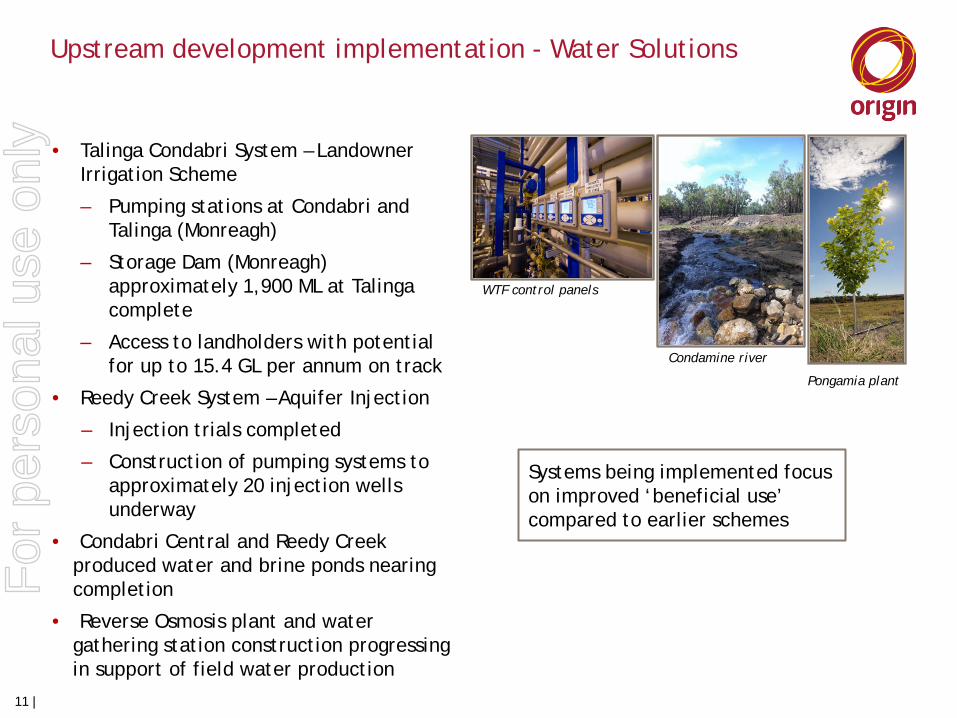
• Talinga Condabri System – Landowner Irrigation Scheme
– Pumping stations at Condabri and Talinga (Monreagh)
– Storage Dam (Monreagh) approximately 1,900 ML at Talinga complete
– Access to landholders with potential for up to 15.4 GL per annum on track
• Reedy Creek System – Aquifer Injection
– Injection trials completed
– Construction of pumping systems to approximately 20 injection wells underway
• Condabri Central and Reedy Creek produced water and brine ponds nearing completion
• Reverse Osmosis plant and water gathering station construction progressing in support of field water production
Upstream development implementation - Water Solutions
WTF control panels
Condamine river
Pongamia plant
11 |
Systems being implemented focus on improved ‘beneficial use’ compared to earlier schemes
For
per
sona
l use
onl
y
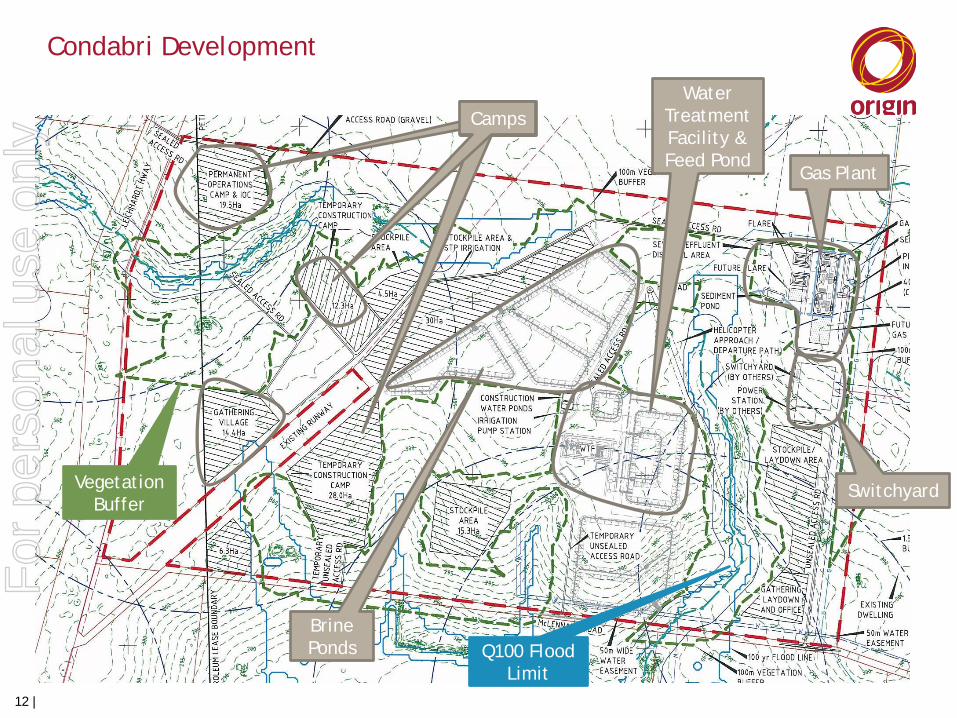
Condabri Development
Camps Camps Water
Treatment Facility & Feed Pond
Brine Ponds
Gas Plant
Vegetation Buffer
Q100 Flood Limit
Switchyard
Camps
12 |
For
per
sona
l use
onl
y

Upstream Project progress - 50% complete and on track at 30 September 2013
Spring Gully – laying of pipe
(1) Calculated by multiplying the diameter of the pipe by the length of the pipe 13 |
Upstream Operated Goals FY2014 Plan Actual Progress to 30 September
First gas and water production from Condabri Central (eastern area) Q1 Accomplished
500 wells drilled Q2 On Track: 448 wells drilled
295 diameter-kilometres1 of gathering line installed (equivalent to 500 wells) Q2 On Track: 252 diameter-kilometres installed (equivalent to
427 wells)
Condabri Central Train 1 commissioned Q3 On Track: Commissioning underway
First gas and water production from Reedy Creek (western area) Q3 On Track: Reedy Creek construction progressing
Main pipelines complete Q3 On Track: 84% complete
Gathering - Pongamia camp Reedy Creek – electrification gas engine
For
per
sona
l use
onl
y

Thank you
For
per
sona
l use
onl
y
APLNG Project – Downstream Delivery
Presented by David Hayter Deputy Project Director, Downstream Project
Origin Operational Review and Asset Visit
1 November 2013
For
per
sona
l use
onl
y
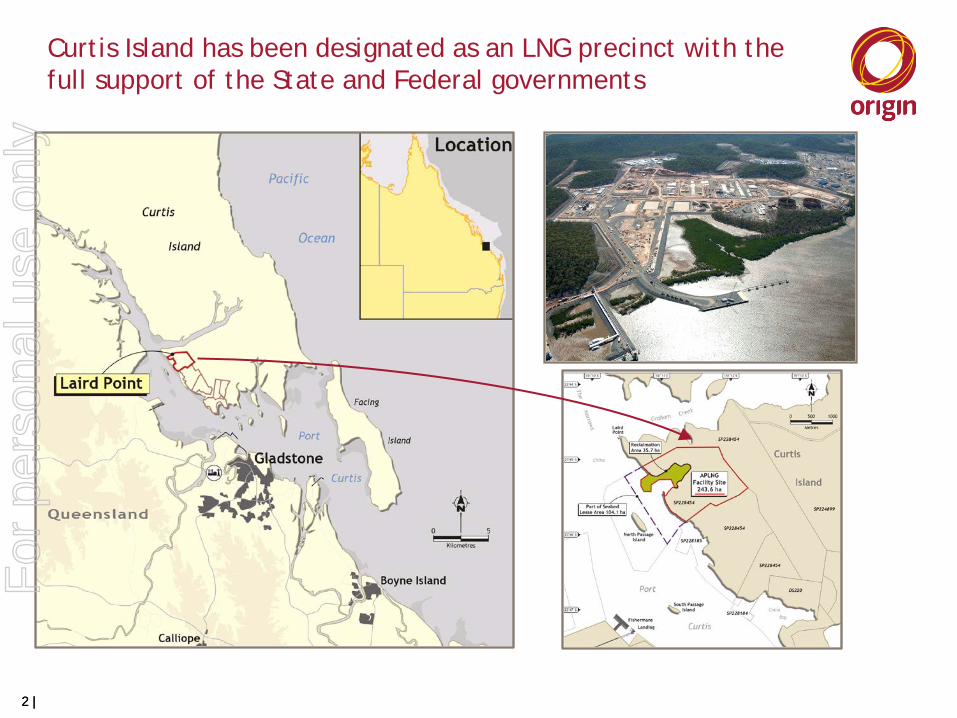
Curtis Island has been designated as an LNG precinct with the full support of the State and Federal governments
2 | 2 |
For
per
sona
l use
onl
y
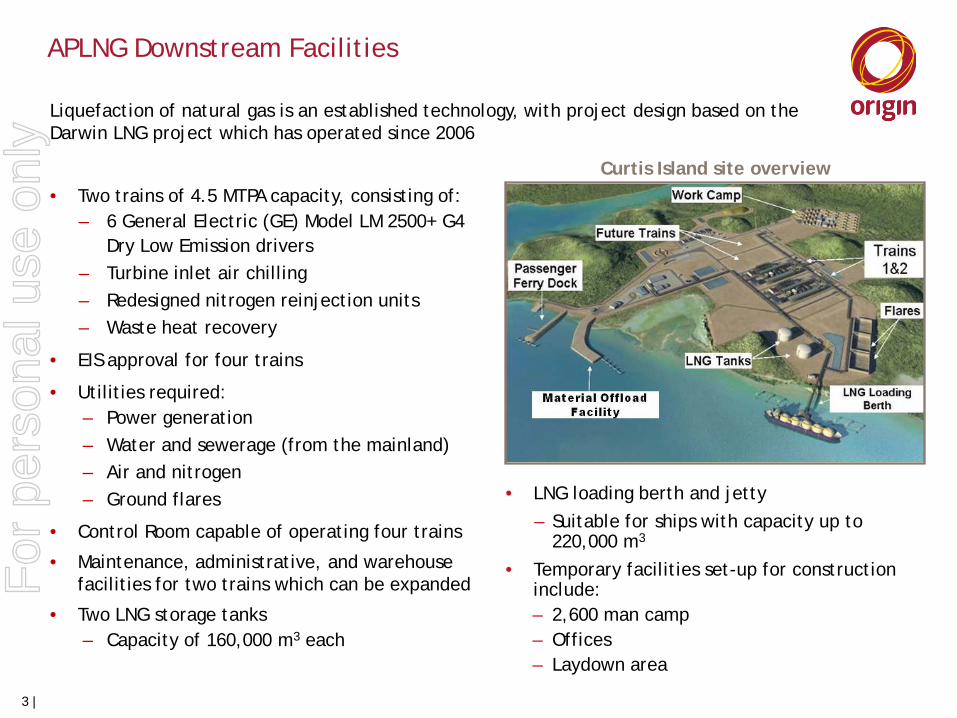
• Two trains of 4.5 MTPA capacity, consisting of: – 6 General Electric (GE) Model LM 2500+ G4
Dry Low Emission drivers – Turbine inlet air chilling – Redesigned nitrogen reinjection units – Waste heat recovery
• EIS approval for four trains
• Utilities required: – Power generation – Water and sewerage (from the mainland) – Air and nitrogen – Ground flares
• Control Room capable of operating four trains
• Maintenance, administrative, and warehouse facilities for two trains which can be expanded
• Two LNG storage tanks – Capacity of 160,000 m3 each
• LNG loading berth and jetty – Suitable for ships with capacity up to
220,000 m3
• Temporary facilities set-up for construction include: – 2,600 man camp – Offices – Laydown area
Curtis Island site overview
APLNG Downstream Facilities
3 |
Liquefaction of natural gas is an established technology, with project design based on the Darwin LNG project which has operated since 2006
For
per
sona
l use
onl
y
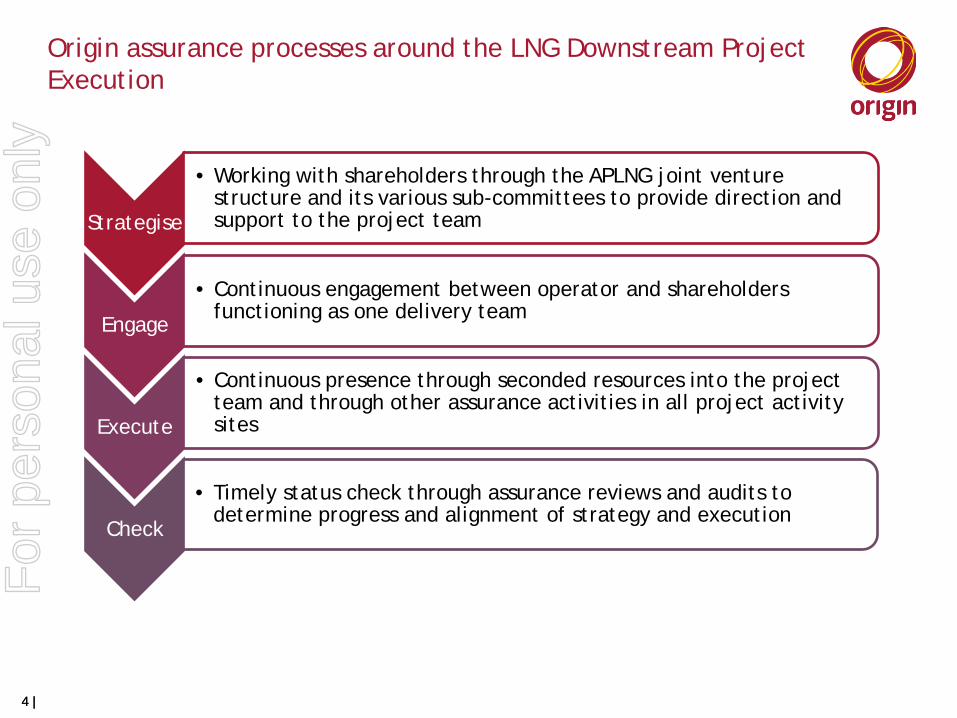
Origin assurance processes around the LNG Downstream Project Execution
Strategise
• Working with shareholders through the APLNG joint venture structure and its various sub-committees to provide direction and support to the project team
Engage
• Continuous engagement between operator and shareholders functioning as one delivery team
Execute
• Continuous presence through seconded resources into the project team and through other assurance activities in all project activity sites
Check
• Timely status check through assurance reviews and audits to determine progress and alignment of strategy and execution
4 | 4 |
For
per
sona
l use
onl
y
Downstream project current status - Engineering
• Overall engineering progress on the Downstream project is ahead of plan and nearing completion
• The final piping isometric drawings were issued in August 2013
• Monitoring of Factory Acceptance Testing remains a major activity, including:
– Remaining Train 2 GE refrigeration compressors
– Honeywell Integrated Control & Safety System (ICSS)
– Ebra cryogenic pumps
5 |
For
per
sona
l use
onl
y

• Procurement is over 80% complete, ahead of plan
• Structural steel and pipe spools continued to be delivered to the Curtis Island construction site and the Batam Module yard
• Major deliveries to Curtis Island since January 2013 have included:
– 4 main pipe rack modules
– 7 (of 7) LNG loading rack modules
– 1 (of 1) sub cooler module
– 3 (of 5) propane condenser module
– First batch of pre-fabricated generation substations
– Train 2 CO2 absorber column
– First Train 2 refrigeration compressors
– Amine storage & liquid nitrogen tanks
Power Generation Substation – Outside Battery Limits (OSBL)
Train 2 CO2 Absorber
Downstream project current status - Procurement
6 |
For
per
sona
l use
onl
y
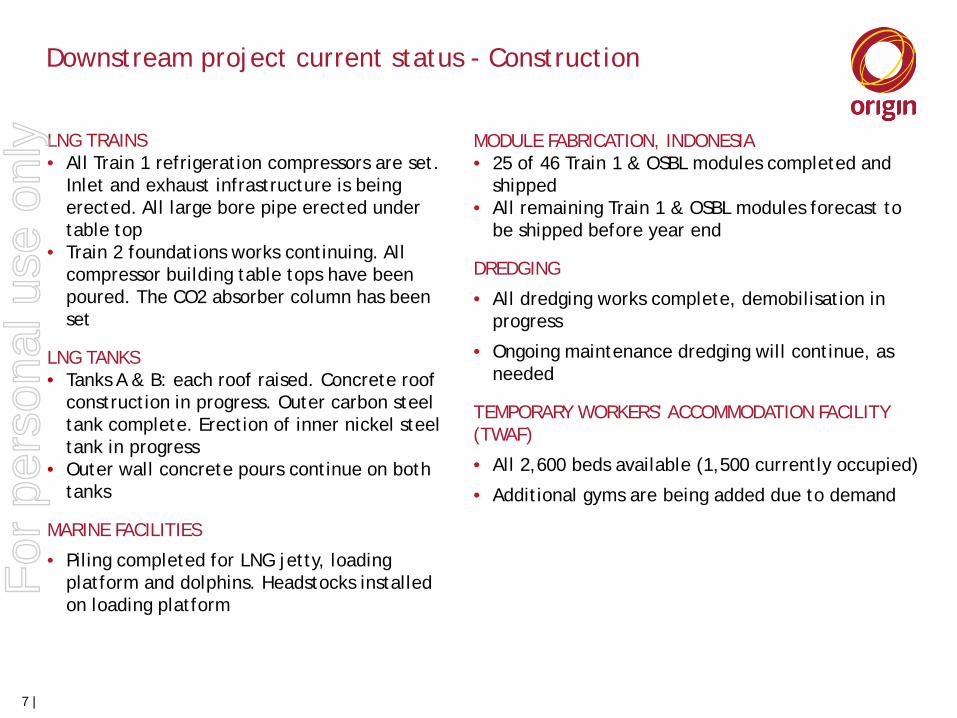
Downstream project current status - Construction
7 |
MODULE FABRICATION, INDONESIA • 25 of 46 Train 1 & OSBL modules completed and
shipped • All remaining Train 1 & OSBL modules forecast to
be shipped before year end
DREDGING
• All dredging works complete, demobilisation in progress
• Ongoing maintenance dredging will continue, as needed
TEMPORARY WORKERS’ ACCOMMODATION FACILITY (TWAF)
• All 2,600 beds available (1,500 currently occupied)
• Additional gyms are being added due to demand
LNG TRAINS • All Train 1 refrigeration compressors are set.
Inlet and exhaust infrastructure is being erected. All large bore pipe erected under table top
• Train 2 foundations works continuing. All compressor building table tops have been poured. The CO2 absorber column has been set
LNG TANKS • Tanks A & B: each roof raised. Concrete roof
construction in progress. Outer carbon steel tank complete. Erection of inner nickel steel tank in progress
• Outer wall concrete pours continue on both tanks
MARINE FACILITIES
• Piling completed for LNG jetty, loading platform and dolphins. Headstocks installed on loading platform
For
per
sona
l use
onl
y
Resourcing
• >2,200 people at Curtis Island – 1,500 people currently staying
• >3,600 people at Batam Module Yard in Indonesia (peak will be sustained until year end, then decline)
• Curtis Island peak workforce expected to exceed 3,500 personnel (two trains) starting 1Q 2014
• Current key focus areas over the next six months are
• Special Class Welders
• Construction Superintendents and Supervisors
• More local personnel resourcing is available than planned
8 |
For
per
sona
l use
onl
y

Downstream Project progress - 54% complete and on track at 30 September 2013
LNG Tanks, September 2013 Curtis Island site, September 2013 Overview of Train 1 Inside Battery Limits (ISBL)
9 |
Downstream Operated Goals FY2014 Plan Actual Progress
Final Train 1 refrigeration compressor set Q1 Accomplished
Accommodation camp complete Q1 Accomplished
Complete Train 2 compressor table tops Q2 Accomplished
Complete loading platform for LNG jetty Q2 On Track
First Train 1 cold boxes (methane and ethylene) delivered to site and set Q2 On Track: Cold Boxes complete, due to be shipped 1st week of
November
Last Train 1 Module set Q3 On Track: All Train 1 Modules are due to be shipped early 2014
For
per
sona
l use
onl
y

Port of Gladstone Overview
Gladstone
Brisbane
FLNE
CELL 3
GOONDOON STREET
BENSTED ROAD
MARINA & RG TANNA
APLNG
10 |
QCLNG (BG)
CURTIS ISLAND
GLNG (SANTOS)
For
per
sona
l use
onl
y
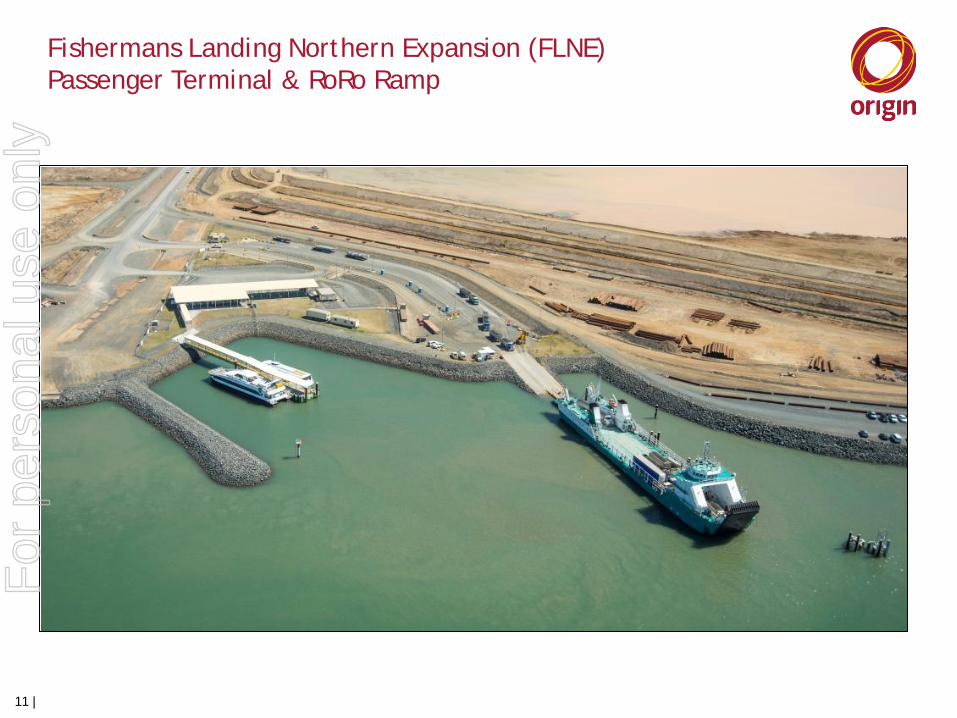
Fishermans Landing Northern Expansion (FLNE) Passenger Terminal & RoRo Ramp
11 |
For
per
sona
l use
onl
y
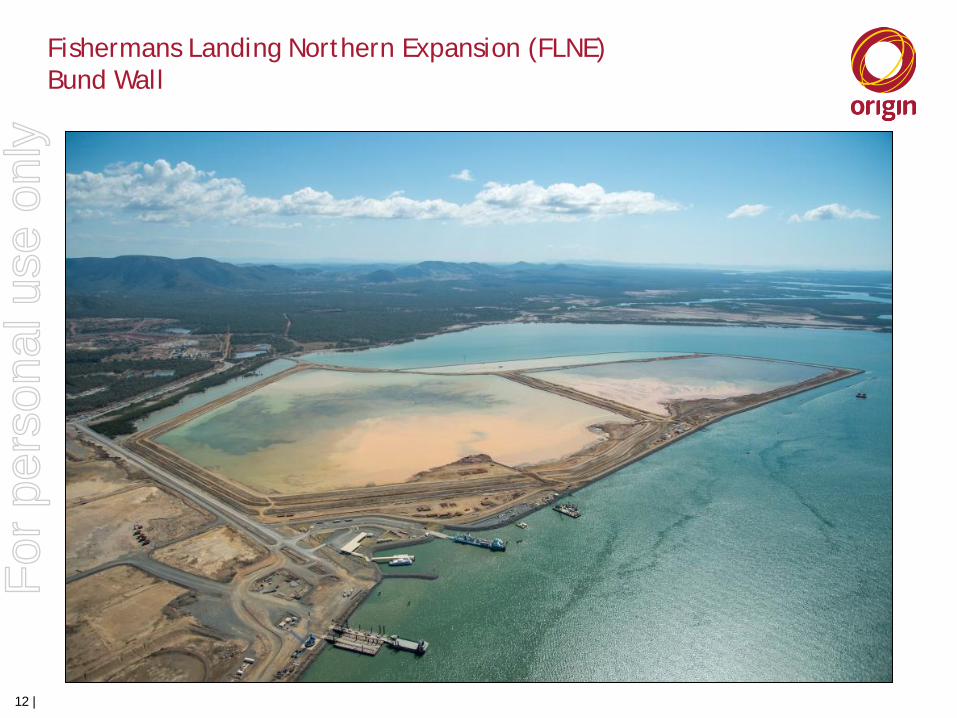
Fishermans Landing Northern Expansion (FLNE) Bund Wall
12 |
For
per
sona
l use
onl
y

Curtis Island Site, September 2013
13 |
For
per
sona
l use
onl
y
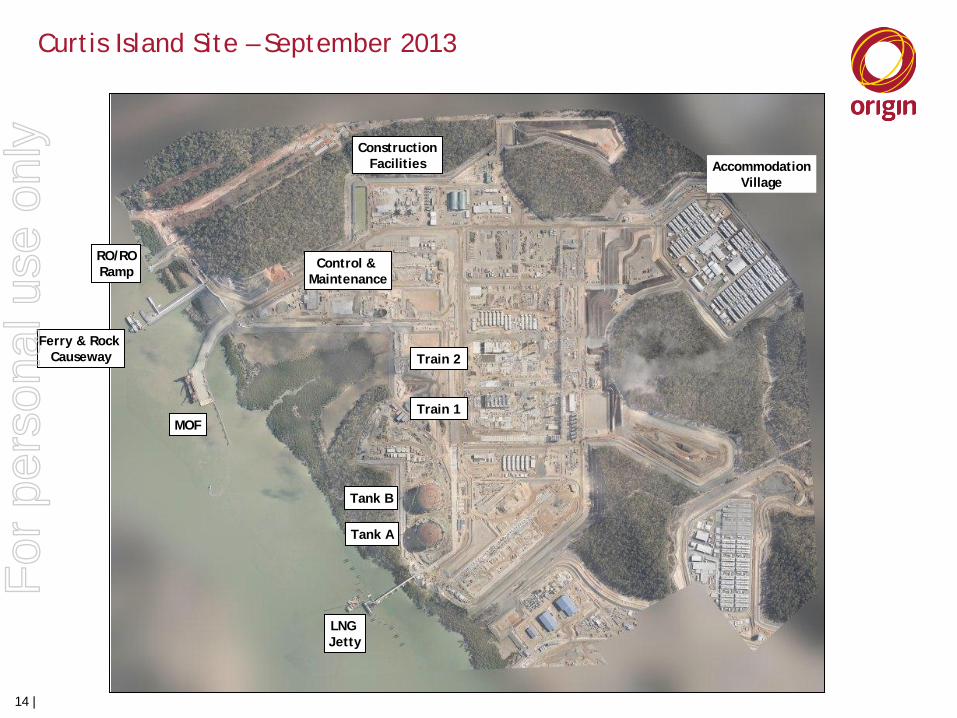
Curtis Island Site – September 2013
14 |
Utilities
Tank B
Tank A
Train 2
Train 1 MOF
Ferry & Rock Causeway
RO/RO Ramp
Construction Facilities
Control & Maintenance
Accommodation Village
LNG Jetty
For
per
sona
l use
onl
y
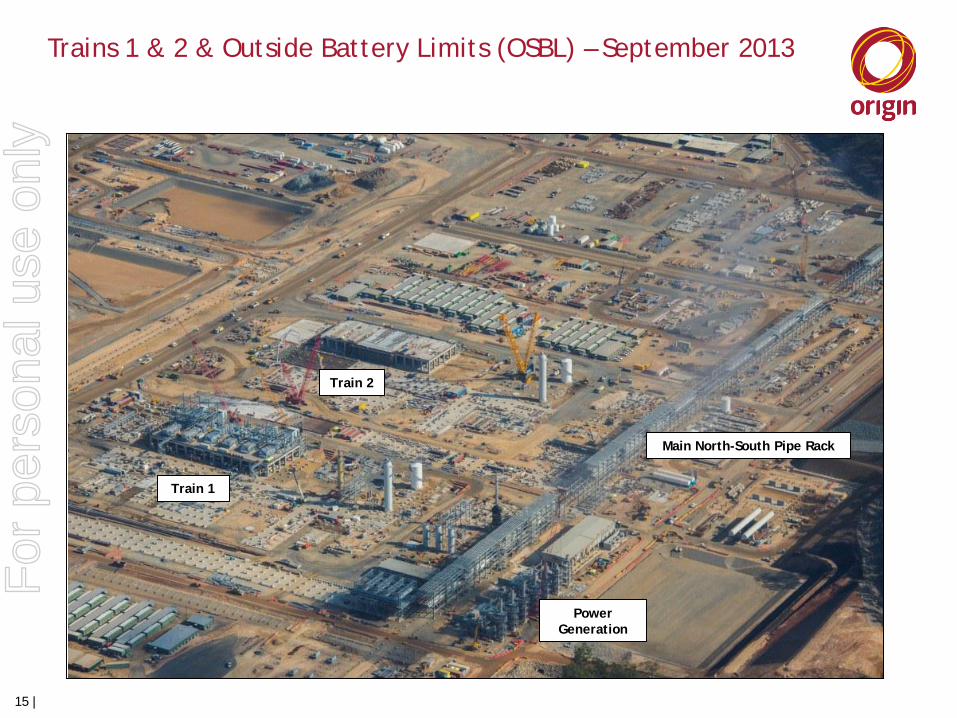
Trains 1 & 2 & Outside Battery Limits (OSBL) – September 2013
15 |
Train 1
Train 2
Main North-South Pipe Rack
Power Generation
For
per
sona
l use
onl
y
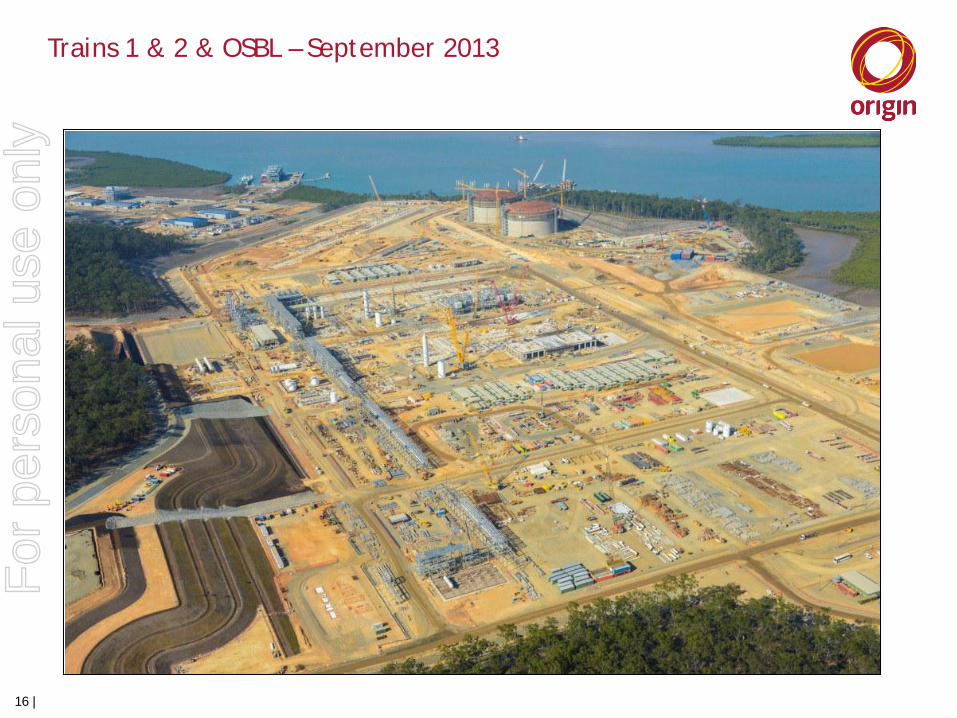
Trains 1 & 2 & OSBL – September 2013
16 |
For
per
sona
l use
onl
y

Trains 1 Compressor Building – September 2013
17 |
For
per
sona
l use
onl
y
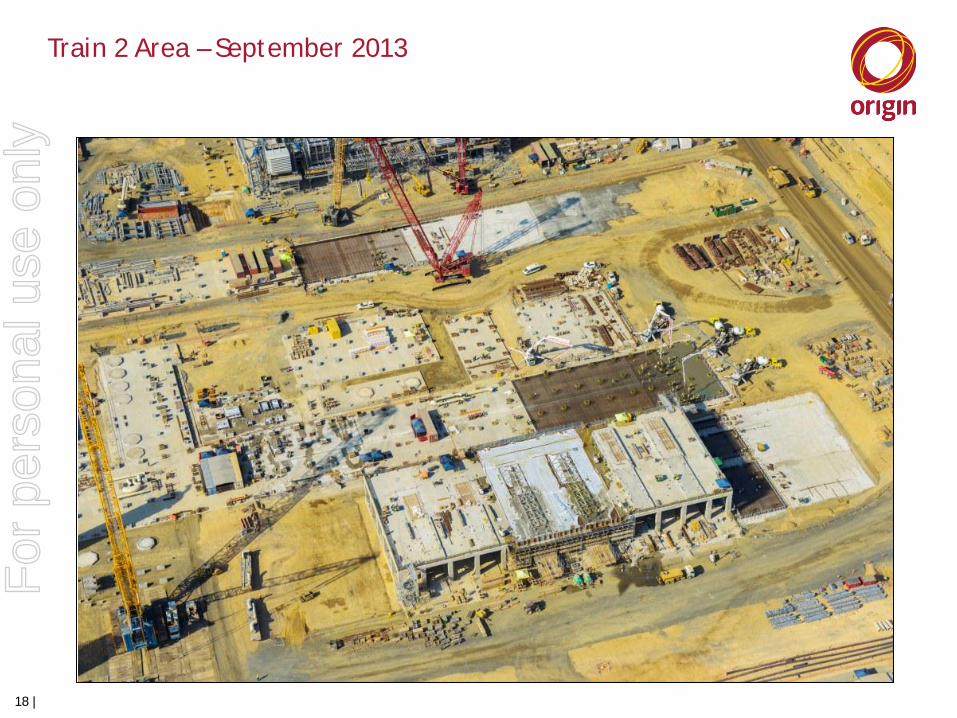
Train 2 Area – September 2013
18 |
For
per
sona
l use
onl
y

LNG Tanks – September 2013
19 |
For
per
sona
l use
onl
y
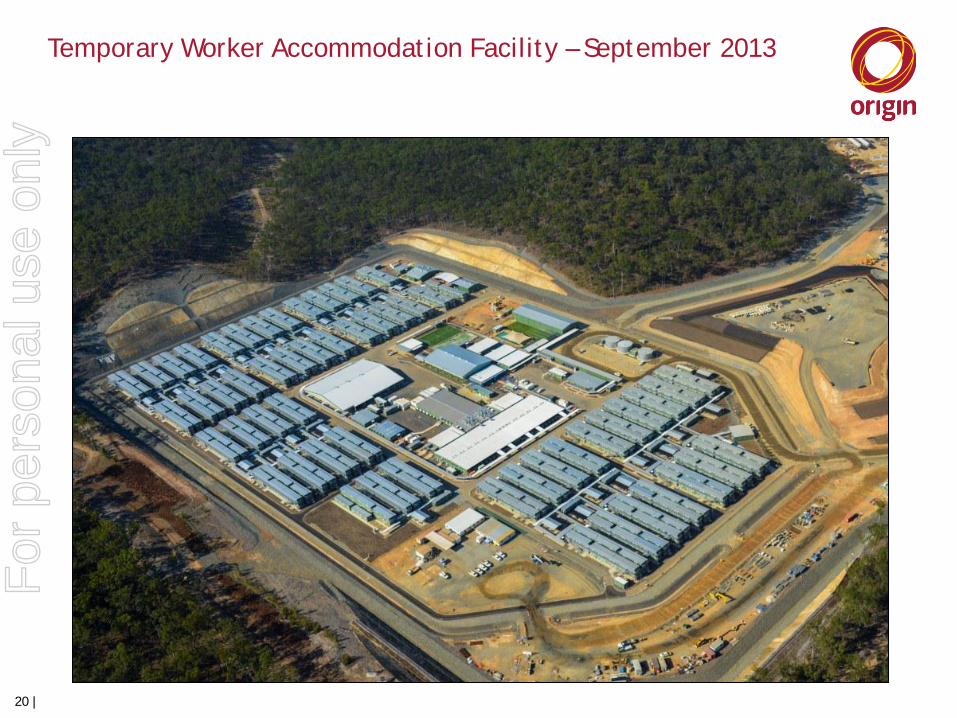
Temporary Worker Accommodation Facility – September 2013
20 |
For
per
sona
l use
onl
y
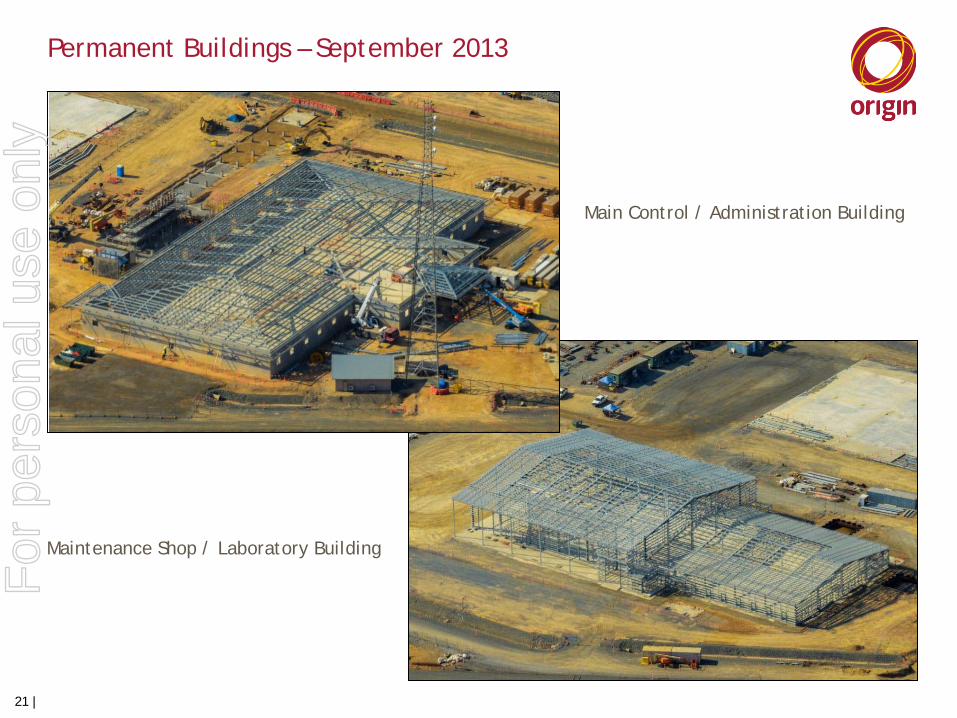
Permanent Buildings – September 2013
21 |
Main Control / Administration Building
Maintenance Shop / Laboratory Building
For
per
sona
l use
onl
y

LNG Jetty – September 2013
22 |
For
per
sona
l use
onl
y
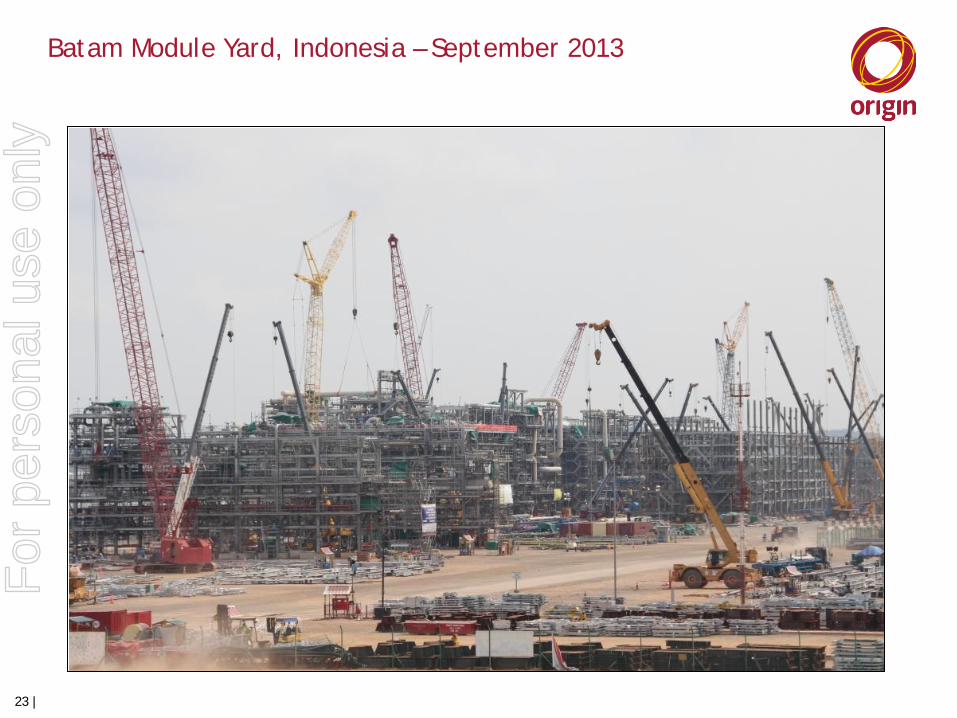
Batam Module Yard, Indonesia – September 2013
23 |
For
per
sona
l use
onl
y
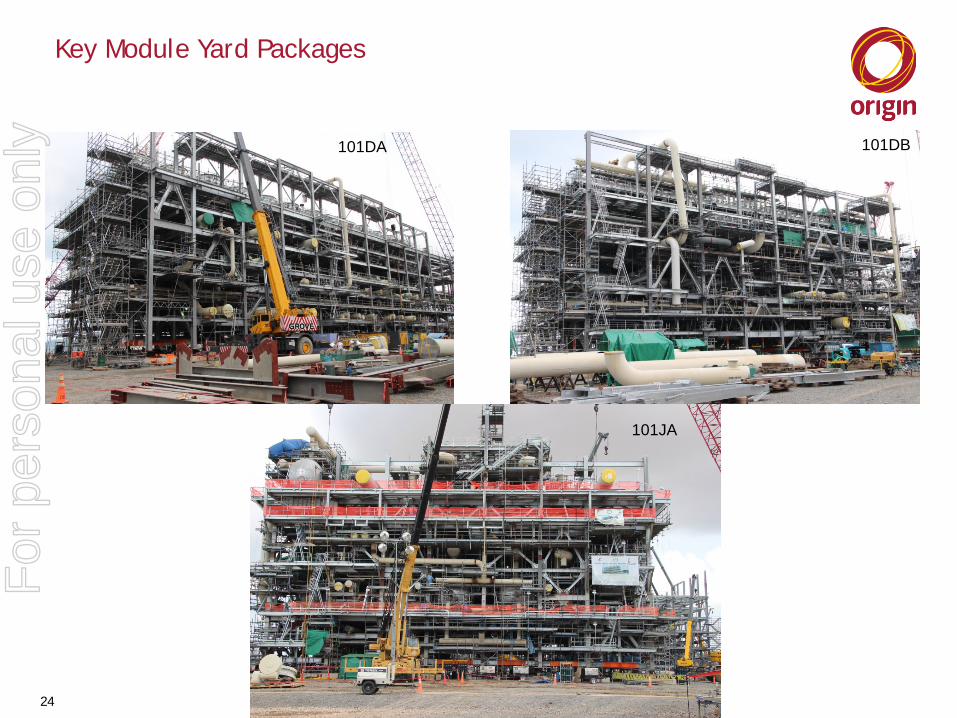
Key Module Yard Packages
24
101DB
101JA
101DA
For
per
sona
l use
onl
y

Thank you
25 |
For
per
sona
l use
onl
y