oriented membrane protein reconstitution into tethered ... · oriented membrane protein...
TRANSCRIPT
Biophysical Journal, Volume 111
Supplemental Information
Oriented Membrane Protein Reconstitution into Tethered Lipid Mem-
branes for AFM Force Spectroscopy
Anna M. Bronder, Adeline Bieker, Shantha Elter, Manuel Etzkorn, DieterHäussinger, and Filipp Oesterhelt
1
Materials
Buffers
1) Tris-buffered saline and Tween 20 (TBT): 20 mM Tris, 150 mM NaCl, 0.1 % Tween 20, pH 7.5
2) Tris-buffered saline (TBS): 20 mM Tris, 150 mM NaCl, pH 7.5 3) phosphate buffer (P1): 46.6 mM Na2HPO4, 3.4 mM NaH2PO4, 150 mM NaCl, pH 8 4) wash buffer (DDM-W1): P1 + 0,4 mM DDM + 20 mM Imidazole 5) protein buffer (DDM-P1): P1 + 0,4 mM DDM 6) elution buffer (DDM-E): DDM-P1 + 250 mM Imidazole 7) refolding buffer (RFB): 23.1 mM Na2HPO4, 16.9 mM NaH2PO4, 1 M NaCl, 5 %
DDM, 100 mM Retinal, pH 7 8) S30 buffer: 10 mM Tris-acetate, pH 8.2, 14 mM Mg(OAc)2, 0.6 mM KCl, 1 mM
DTT and 0.1 mM PMSF
Experimental Design and Methods
Dot Blot A functionalized quartz surface with bound BR was first rinsed with 100 µl DDM-P1 by pipetting up and down several times. The rinsing buffer was collected as the rinsing fraction. The same surface was then rinsed the same way with 100 µl DDM-E, which was again collected as the elution fraction. A Dot blot was prepared of 100 µl DDM-E (buffer control), 100 µl rinsing fraction and 100 µl elution fraction on a membrane. The membrane was swayed in 1 % (w/v) powdered milk solution at 4 °C, overnight. After washing with water the membrane was swayed 3 x 10 min in TBT and 1 x 10 min in TBS at RT. The membrane was shortly washed with water and swayed in histidin-tag (His-tag) antibody solution (1:5000 anti-His-HRP (Miltenyi Biotec, Bergisch Gladbach, Germany) in 1 % (w/v) powdered milk solution) for 1 h, at RT. This was followed by swaying 2 x 10 min in TBT and 1 x 10 min TBS at RT and shortly rinsing with water. The membrane was covered with a 1:1 (v/v) solution of luminol enhancer solution:stable peroxide solution, (both SuperSignal West Pico, Thermo Fisher Scientific, Oberhausen, Germany) and chemoluminescence was measured with a ChemiDoc MP documentation system (Bio-Rad, Hercules, U.S.).
Protein refolding Protein pellet from CFE was washed with S30 buffer and directly refolded or stored at -20 °C. 2 x 50 µl protein pellets were resuspended in 2 x50 µl RFB. The samples were wrapped in aluminum foil to be protected from light and let to incubate for 2 h, at RT. A Micro Bio-Spin(TM) gravity-flow column (Bio-Rad, Hercules, U.S.) was filled with 160 µl Ni-NTA-Agarose (Macherey-Nagel, Germany) for a total column volume (CV) of 80 µl. After letting the agarose settle the column was washed with 5 ml water and equilibrated with 5 ml DDM-P1. The resuspended pellets were combined and loaded onto the column. The agarose and BR sample were pipetted up and down to mix and increase binding. Covering the column from light it was let to incubate for 1 h while mixing every 20 min. The column was then washed with 6 CV DDM-W1 and 2 CV DDM-P1. BR was eluted using 4 CV DDM-E giving elution
2
fractions 1-4. Fractions 2-4 were combined for concentration. A concentrator tube (10.000 MWCO, Vivaspin 4, PES membrane, Sartorius, Göttingen, Germany) was washed with 6 x 10 ml water, 4 x 10 ml P1 and 1 x 10 ml DDM-P1 by centrifugation at 4 °C, 4000 g, 15 min each. 230 µl BR (fractions 2-4) were loaded into the concentrator and centrifuged at 4 °C, 4000 g for 20 min until the sample was concentrated to 50 µl. The sample was washed with DDM-P1 by centrifugation at 4 °C, 4000 g for 20 min until again the total volume was concentrated to 50 µl. 10 µl of the sample were used to measure the concentration in a 1:10 (v/v) dilution in DDM-P1 at the spectrophotometer (V-650, Jasco, Groß-Umstadt, Germany). An absorption spectrum was measured between 260 nm and 750 nm. The peak at 555 nm corresponds to the adsorption of successfully refolded BR and is used to calculate the concentration with an extinction coefficient of ε = 55000 L • cm-1 • mol-1.
Functionalization steps
Plasma activation Quartz Slides (3” x 1” x 1 mm, TED PELLA Inc.) were placed into a plasma cleaner (Plasma, low-pressure system, Femto, Diener electronics) and 500 µl of water were distributed as drops inside the chamber and allowed to evaporate under vacuum to saturate the atmosphere inside the plasma cleaner with H2O. The surfaces were activated for 5 min at 100 %. Further functionalization was done immediately after.
Silanization Adapted from method B of the protocol 2 (1). A desiccator was flooded with nitrogen for 5 min. The plasma activated surfaces were placed into the desiccator together with 100 µl of APTES and 33 µl of triethylamine (Et3N; puriss., p.a. ≥99.5 % GC, Fluka, Seelze, Germany). After 5 min of constant nitrogen flow the desiccator was closed completely and the silanization was allowed to take place for 2 h. APTES and Et3N were removed from the desiccator and it was again flooded with nitrogen for 5 min. After closing the desiccator the surfaces were allowed to cure for at least 48 h.
Functionalization with polyethylene glycol Mmt-NH-PEG12-COO-Tfp (PEG; Iris Biotech, Marktredwitz, Germany), Et3N and dimethylsulfoxide (DMSO; A.C.S, spectrophotometric Grade ≥99.9 %, Sigma-Aldrich, Munich, Germany) were mixed 20:1:200 (v/v/v). The silanized surfaces were taken out of the desiccator and placed into petri dishes. A small space between two silanized slides facing each other, created by clean cover slips, was filled with 10 µl/cm² of the solution followed by incubation for 2 h. After incubation the surfaces were placed into 50 ml centrifuge tubes (TPP, Gamma-sterilized, Sigma-Aldrich, Munich, Germany) and rinsed 10 x with water by filling and emptying the tube completely. After drying with nitrogen the functionalized surfaces were stored at -20 °C in fresh 50 ml falcon tubes. Figure 1 E schematically shows the surface functionalized with PEG.
Binding anchoring lipids and trisNTA to PEG To remove the monomethoxytrityl (Mmt) protection group from PEG the surfaces were covered with 80 % acetic acid (Ultra, ≥99.5 % GC/T, Fluka, Seelze, Germany) for 1 h inside
3
50 ml falcon tubes. Meanwhile a solution was prepared depending on the targeted surface functionalization. trisNTA surface: 10:10:1 (v/v/v) of trisNTA stock:N,N′-Diisopropylcarbodiimide (DIC; 99 %, Sigma-Aldrich, Munich, Germany):N,N-Diisopropylethylamine (DIPEA; Reagent Plus, 99 %, Sigma-Aldrich, Munich, Germany). SuccinylPE surface: 2:10:1 (v/v/v) of SuccinylPE stock:DIC:DIPEA. Mixed surface: 1:5:10:1 (v/v/v/v) of SuccinylPE stock:trisNTA stock:DIC:DIPEA. After deprotection the slides were rinsed again ten times with water by filling and emptying the falcon tubes completely and then dried under nitrogen. A small space between two glass slides facing each other, created by clean cover slips (Microscope Cover Glasses, #1, 22 x 22 mm, Menzel Gläser, Braunschweig, Germany), was filled with 10 µl/cm² of the respective solution followed by incubation for 1 h at 75 °C. Two clean glass beakers were filled with chloroform and the functionalized surfaces were dipped and rinsed inside the beakers subsequently. The surfaces were dried with nitrogen and placed into glass petri dishes with the functionalized side facing upwards. They were covered with trifluoracetic acid (TFA; ≥99.9 % for synthesis, Carl Roth, Karlsruhe, Germany) and a few drops of water for 12 h to remove the OtBu protection groups from irisNTA.
4
Supplementary Figures
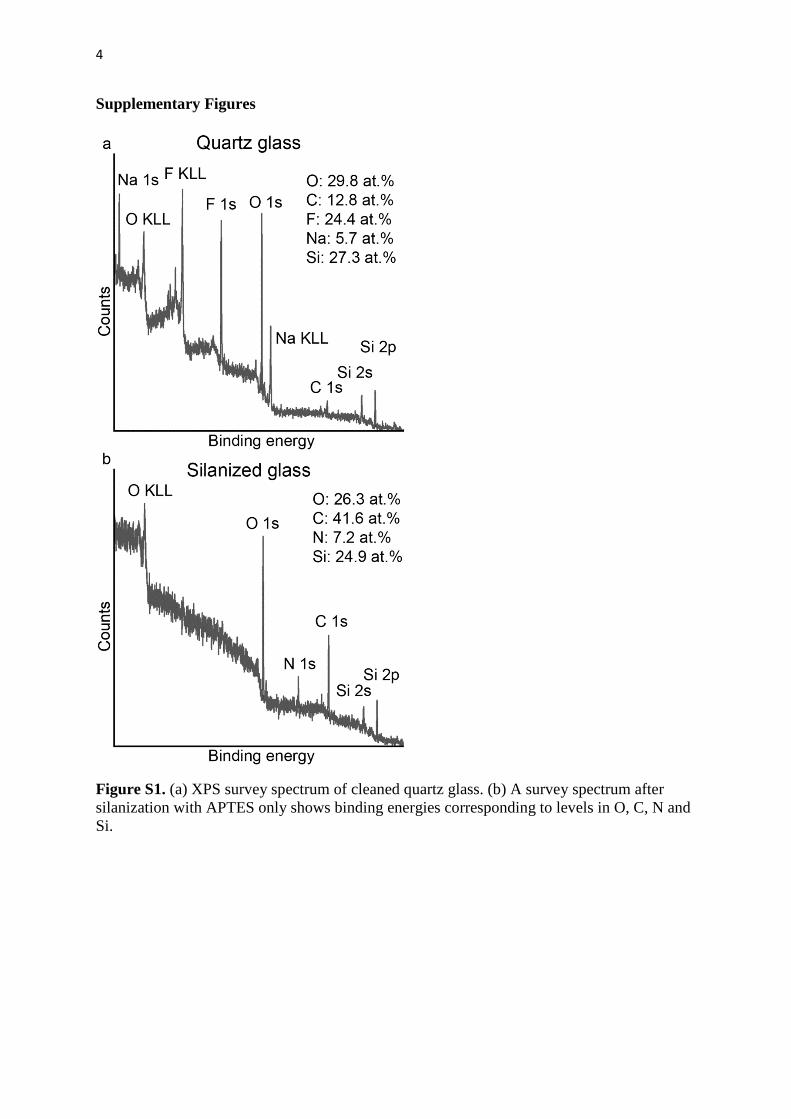
Figure S1. (a) XPS survey spectrum of cleaned quartz glass. (b) A survey spectrum after silanization with APTES only shows binding energies corresponding to levels in O, C, N and Si.
5
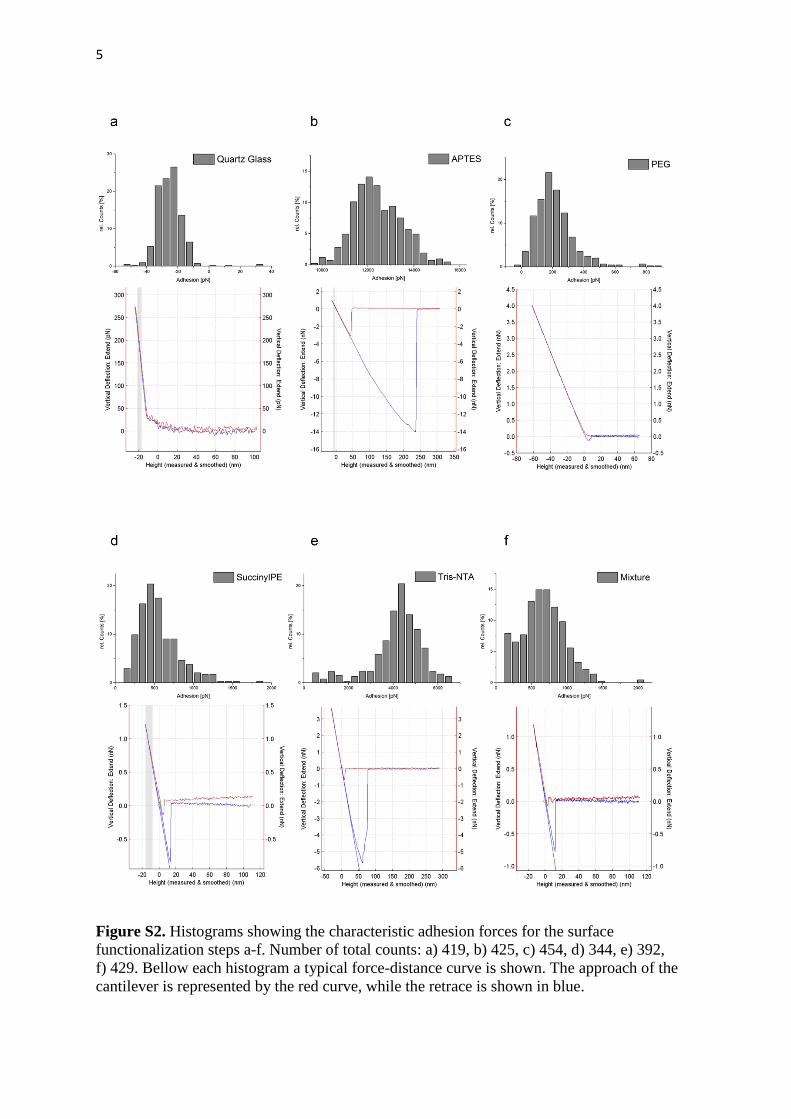
Figure S2. Histograms showing the characteristic adhesion forces for the surface functionalization steps a-f. Number of total counts: a) 419, b) 425, c) 454, d) 344, e) 392, f) 429. Bellow each histogram a typical force-distance curve is shown. The approach of the cantilever is represented by the red curve, while the retrace is shown in blue.
6
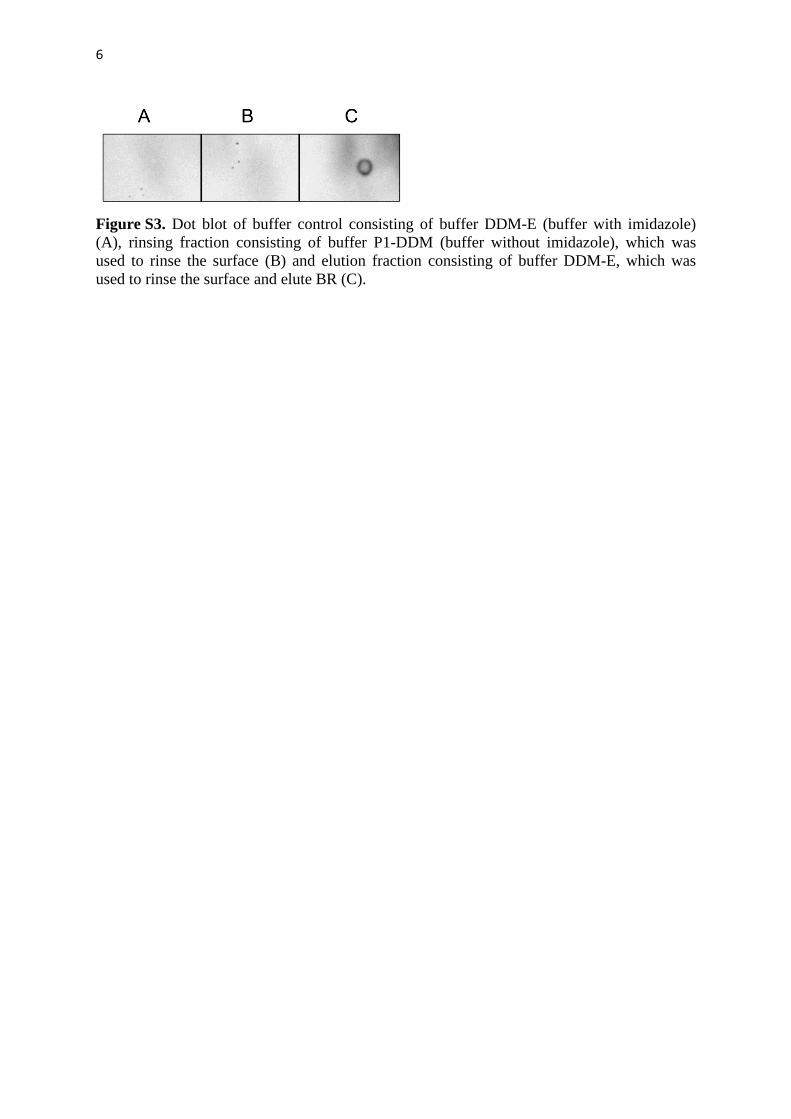
Figure S3. Dot blot of buffer control consisting of buffer DDM-E (buffer with imidazole) (A), rinsing fraction consisting of buffer P1-DDM (buffer without imidazole), which was used to rinse the surface (B) and elution fraction consisting of buffer DDM-E, which was used to rinse the surface and elute BR (C).
7
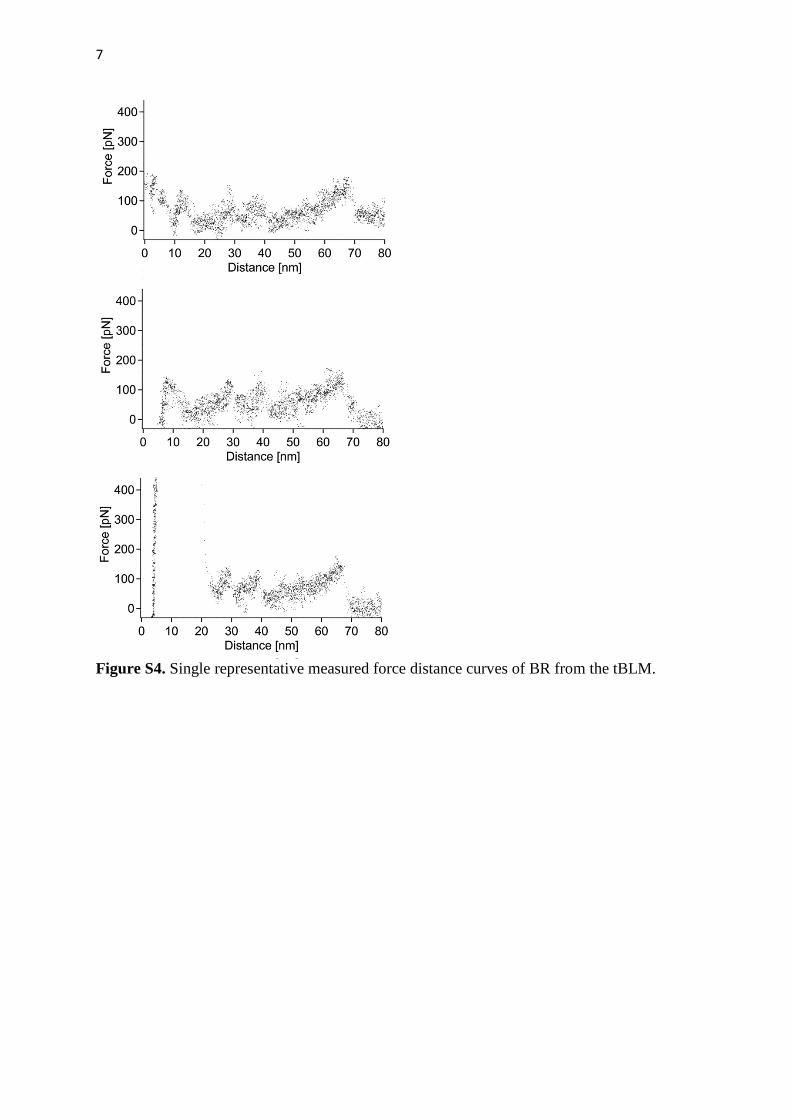
Figure S4. Single representative measured force distance curves of BR from the tBLM.
8
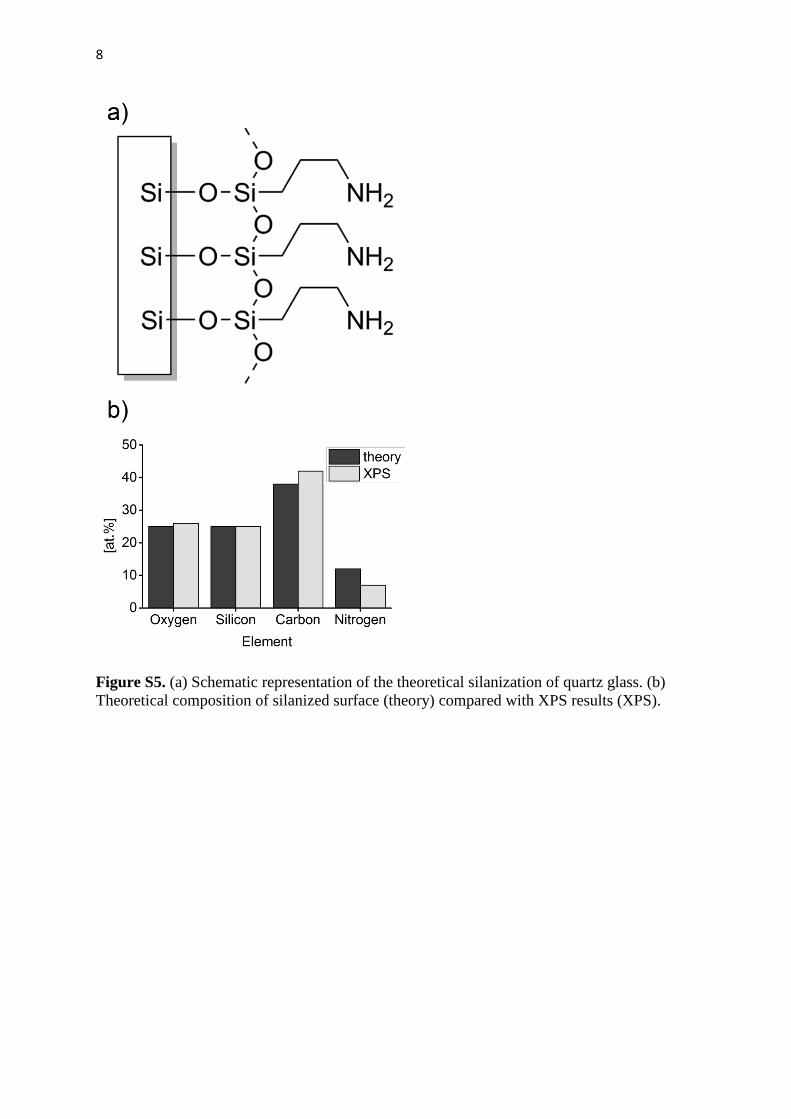
Figure S5. (a) Schematic representation of the theoretical silanization of quartz glass. (b) Theoretical composition of silanized surface (theory) compared with XPS results (XPS).
9
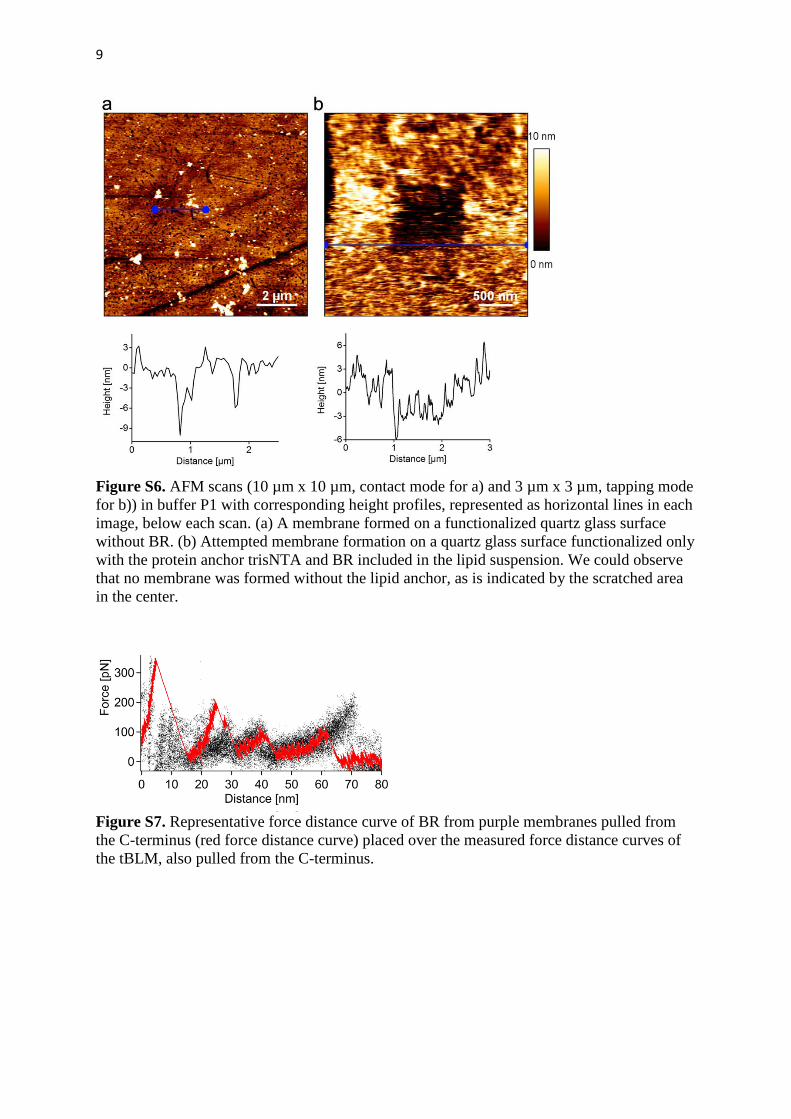
Figure S6. AFM scans (10 µm x 10 µm, contact mode for a) and 3 µm x 3 µm, tapping mode for b)) in buffer P1 with corresponding height profiles, represented as horizontal lines in each image, below each scan. (a) A membrane formed on a functionalized quartz glass surface without BR. (b) Attempted membrane formation on a quartz glass surface functionalized only with the protein anchor trisNTA and BR included in the lipid suspension. We could observe that no membrane was formed without the lipid anchor, as is indicated by the scratched area in the center.
Figure S7. Representative force distance curve of BR from purple membranes pulled from the C-terminus (red force distance curve) placed over the measured force distance curves of the tBLM, also pulled from the C-terminus.
10
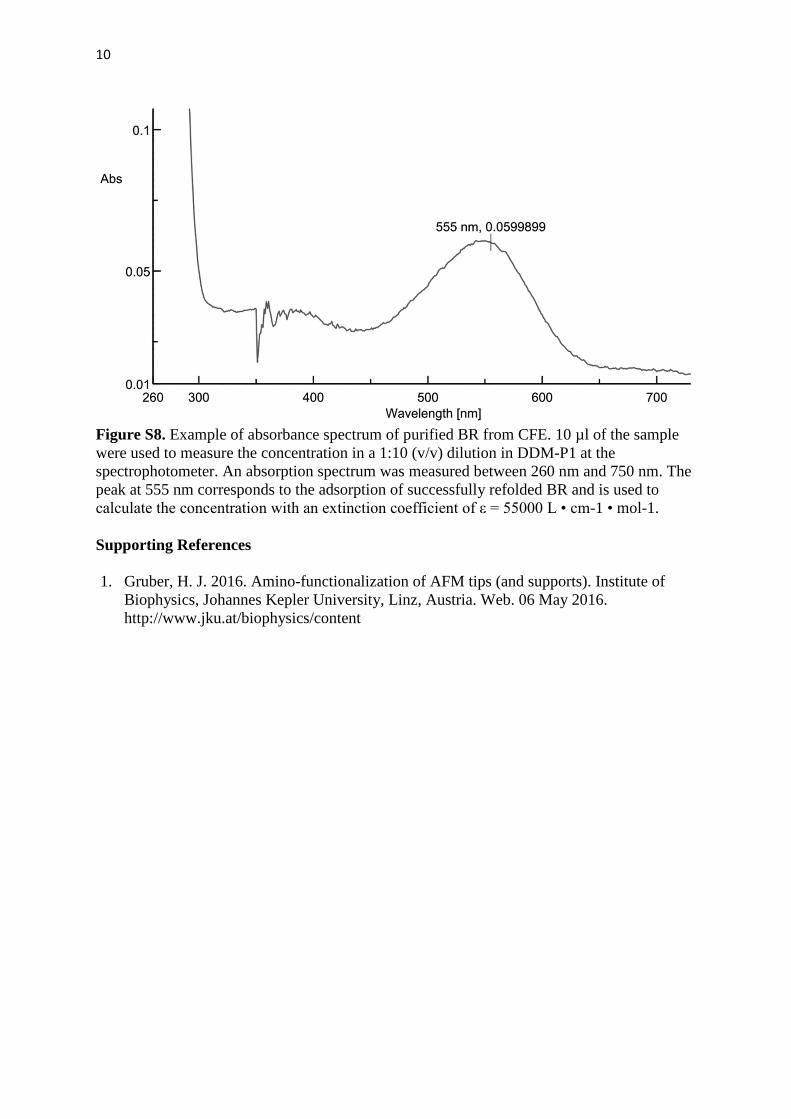
Figure S8. Example of absorbance spectrum of purified BR from CFE. 10 µl of the sample were used to measure the concentration in a 1:10 (v/v) dilution in DDM-P1 at the spectrophotometer. An absorption spectrum was measured between 260 nm and 750 nm. The peak at 555 nm corresponds to the adsorption of successfully refolded BR and is used to calculate the concentration with an extinction coefficient of ε = 55000 L • cm-1 • mol-1. Supporting References 1. Gruber, H. J. 2016. Amino-functionalization of AFM tips (and supports). Institute of
Biophysics, Johannes Kepler University, Linz, Austria. Web. 06 May 2016. http://www.jku.at/biophysics/content