orientation and characteristics of fractures in crystalline bedrock ... - water … · 2002. 2....
TRANSCRIPT

Orientation And Characteristics Of Fractures In Crystalline Bedrock Determined By Surface And Borehole Geophysical
Surveys, Millville And Uxbridge, Massachusetts By Bruce P. Hansen and John W. Lane Jr.’
ABSTRACT
Four geophysical techniques were used to determine bedrock fracture orientation and other site characteristics that can be used to determine ground-water flow and contaminant transport at a study area underlain by fractured crystalline bedrock in Millville and Uxbridge, Massachusetts. In the study area, azimuthal seismic-refraction and azimuthal square-array direct-current resistivity surveys were conducted at three sites, borehole-radar surveys were conducted in a cluster of three wells, and ground-penetrating radar surveys were conducted along roads.
Azimuthal seismic-refraction data indicated a primary fracture strike ranging from 56 to 101 degrees at the three sites. Graphical and analytical analysis of azimuthal square-array resistivity data indicated a primary fracture strike ranging from 45 to 90 degrees at the same three sites, Directional borehole-radar data from three wells indicated 46 fractures or fracture zones located as far as 147 feet from the surveyed wells. Patterns of low radar-wave velocity and high radar-wave attenuation from cross-hole radar surveys of two well pairs were interpreted as a planai fracture zone that strikes 297 degrees and dips 55 degrees south. Ground-penetrating radar surveys with IOO-MHz antennas penetrated 5 to 50 feet of unconsolidated overburden and as much as 60 feet of bedrock where the bedrock surface was at or near land surface. Horizontal and subhorizontal fractures were observed on the ground-penetrating radar records at numerous locations. Comparison of results from the various geophysical techniques indicates good agreement and indicates primary high-angle fracturing striking east-northeast. Square-array resistivity data yielded an average secondary bedrock porosity of 0.0044 and an average aperture of 0.007 1 foot for high-angle fractures.
INTRODUCTION
Contamination of ground water in fractured crystalline bedrock is a problem at many sites. Determining the rate and direction of ground-water flow, contaminant transport, and ultimately, designing site remediation plans requires knowledge about fracture characteristics. The predominant orientation of fractures or fracture zones may result in significant anisotropy in ground-water-flow characteristics in bedrock. Geophysical methods can indicate anisotropy of physical properties of bedrock caused by fractures, and therefore, may also indicate a preferred direction of ground-water flow. Geophysical methods have been successfully used to detect fracture characteristics, including fracture location and orientation. One conclusion of most geophysical studies is that the effect of fracturing on changes in physical properties of bedrock is small (Lieblich and others, 1992). As a result, interference from natural and cultural sources may obscure or degrade geophysical data so that clear responses from fractures are not detected. Integration (cross correlation) of the results from as many independent geophysical survey methods as possible should improve confidence in the orientation and location of fractures and possibly improve resolution (degree to which individual features can be detected) over that from a single method. These multiple method surveys should be conducted at the same location or as near to one another as practically possible, so that the same or approximately similar volume of bedrock is sampled. Few multiple surveys have been conducted in areas underlain by crystalline bedrock.
A site on the border between Millville and Uxbridge, in south-central Massachusetts, where chlorinated hydrocarbons were detected in water from wells completed in fractured crystalline bedrock, provided an opportunity to demonstrate the application of geophysical methods for characterizin, 0 fractures and provided the results ot multiple geophysical surveys at three locations for comparison. The U.S. Geological Survey (USGS), in cooperation with the Massachusetts Department of Environmental Protection (MDEP), conducted azimuthal seismic-refraction. azimuthal square-array direct-current resistivity, borehole radar, and ground-penetratin, 0 radar geophysical surveys in
Millville and Uxbridge, Mass.
‘U.S. Geological Survey
927
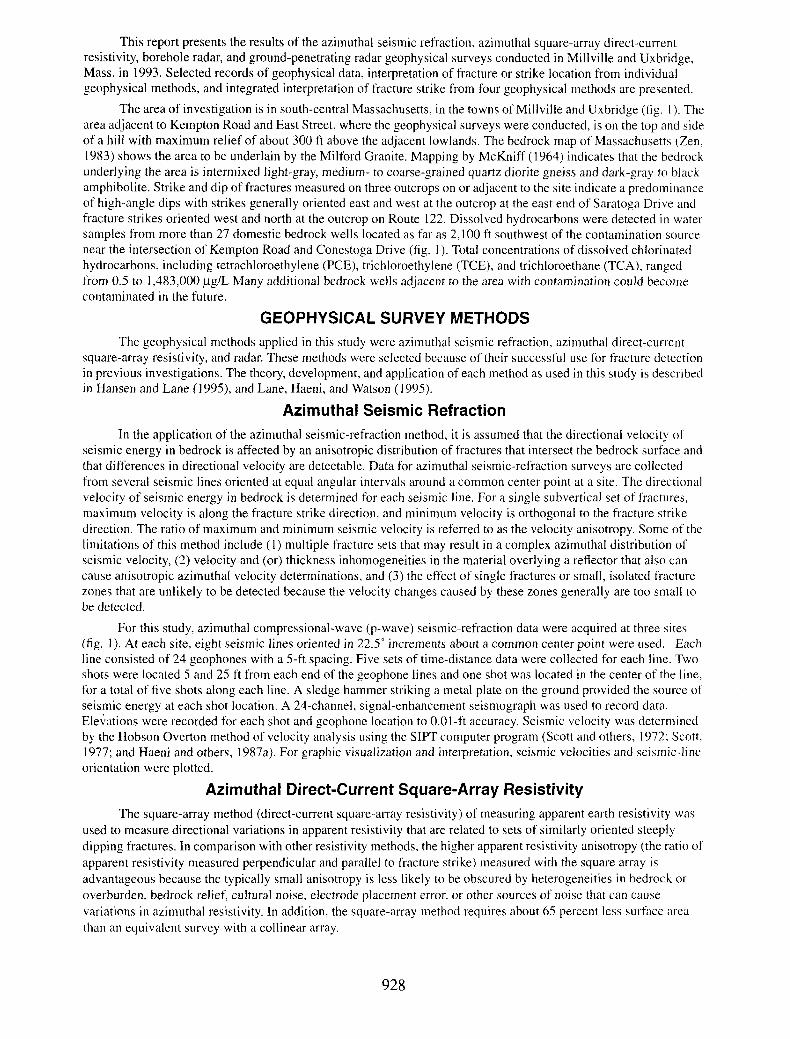
This report presents the results of the azimuthal seismic refraction, azimuthal square-array direct-current resistivity, borehole radar, and ground-penetrating radar geophysical surveys conducted in Millville and Uxbridge, Mass. in 1993. Selected records of geophysical data, interpretation of fracture or strike location from individual geophysical methods, and integrated interpretation of fracture strike from four geophysical methods are presented.
The area of investigation is in south-central Massachusetts, in the towns of Millville and Uxbridge (fig. I). The area adjacent to Kempton Road and East Street, where the geophysical surveys were conducted, is on the top and side of a hill with maximum relief of about 300 ft above the adjacent lowlands, The bedrock map of Massachusetts (Zen, 1983) shows the area to be underlain by the Milford Granite. Mapping by McKniff (1964) indicates that the bedrock underlying the area is intermixed light-gray, medium- to coarse-grained quartz diorite gneiss and dark-gray to black amphibolite. Strike and dip of fractures measured on three outcrops on or adjacent to the site indicate a predominance of high-angle dips with strikes generally oriented east and west at the outcrop at the east end of Saratoga Drive and fracture strikes oriented west and north at the outcrop on Route 122. Dissolved hydrocarbons were detected in water samples from more than 27 domestic bedrock wells located as far as 2,100 ft southwest of the contamination source near the intersection of Kempton Road and Conestoga Drive (fig. 1). Total concentrations of dissolved chlorinated hydrocarbons, including tetrachloroethylene (PCE), trichloroethylene (TCE), and trichloroethane (TCA), ranged from 0.5 to 1,483,OOO pg/L Many additional bedrock wells adjacent to the area with contamination could become contaminated in the future.
GEOPHYSICAL SURVEY METHODS
The geophysical methods applied in this study were azimuthal seismic refraction, azimuthal direct-current square-array resistivity, and radar. These methods were selected because of their successful use for fracture detection in previous investigations. The theory, development, and application of each method as used in this study is described in Hansen and Lane (1995), and Lane, Haeni, and Watson (1995).
Azimuthal Seismic Refraction
In the application of the azimuthal seismic-refraction method, it is assumed that the directional velocity of seismic energy in bedrock is affected by an anisotropic distribution of fractures that intersect the bedrock surface and that differences in directional velocity are detectable. Data for azimuthal seismic-refraction surveys are collected from several seismic lines oriented at equal angular intervals around a common center point at a site. The directional velocity of seismic energy in bedrock is determined for each seismic line. For a single subvertical set of fractures, maximum velocity is along the fracture strike direction, and minimum velocity is orthogonal to the fracture strike direction. The ratio of maximum and minimum seismic velocity is referred to as the velocity anisotropy. Some of the limitations of this method include (1) multiple fracture sets that may result in a complex azimuthal distribution of seismic velocity, (2) velocity and (or) thickness inhomogeneities in the material overlying a reflector that also can cause anisotropic azimuthal velocity determinations, and (3) the effect of single fractures or small, isolated fracture zones that are unlikely to be detected because the velocity changes caused by these zones generally are too small to be detected.
For this study, azimuthal compressional-wave (p-wave) seismic-refraction data were acquired at three sites (iig. 1). At each site, eight seismic lines oriented in 22.5” increments about a common center point were used. Each line consisted of 24 geophones with a 5-ft spacing. Five sets of time-distance data were collected for each line. Two shots were located 5 and 25 ft from each end of the geophone lines and one shot was located in the center of the line, for a total of five shots along each line. A sledge hammer striking a metal plate on the ground provided the source of seismic energy at each shot location. A 24-channel, signal-enhancement seismograph was used to record data. Ele;ations were recorded for each shot and geophone location to O.Ol-ft accuracy. Seismic velocity was determined by the Hobson Overton method of velocity analysis using the SIPT computer program (Scott and others, 1972; Scott. 1977; and Haeni and others, 1987a). For graphic visualization and interpretation, seismic velocities and seismic-line orientation were plotted.
Azimuthal Direct-Current Square-Array Resistivity
The square-array method (direct-current square-array resistivity) of measuring apparent earth resistivity was used to measure directional variations in apparent resistivity that are related to sets of similarly oriented steeply dipping fractures. In comparison with other resistivity methods, the higher apparent resistivity anisotropy (the ratio of apparent resistivity measured perpendicular and parallel to fracture strike) measured with the square array is advantageous because the typically small anisotropy is less likely to be obscured by heterogeneities in bedrock or overburden, bedrock relief, cultural noise, electrode placement error, or other sources of noise that can cause variations in azimuthal resistivity. In addition, the square-array method requires about 65 percent less surface area than an equivalent survey with a collinear array.
928

42’ 0:
42’ 02’ 3(
Base modified from U.S. Gel Blackstone, Massachusetts, 1969 1:24,000 scale
CON KIUH IN I tHVAL 50 FEET NATIONAL GEODETIC VERTICAL DATUM OF 1929
EXPLANATION
KR340 I 0 KR29
I C’
C
b KR26
0 100 290 300 FEI
0 50 METERS
MASSACHUSETTS
GROUND-PENETRATING RADAR SURVEYS ALONG ROADS KR29. BEDROCK WELLS WHERE BOREHOLE RADAR SURVEYS WERE CONDUCTED--Number is local well number assigned
c C’ LINE OF GEOLOGIC CROSS SECTION--Section shown by the Massachusetts Department of Environmental Protection in figure 12
El SEISMIC AND DC-RESISTIVITY SQUARE-ARRAY A A' GROUND-PENETRATING RADAR RECORDS--Sections AZIMUTHAL SURVEYS--Number is site identification number
shown in figures 11 and 13 X OUTCROPS WHERE FRACTURES WERE MAPPED AT
KR170 BEDROCK WELL--Number is local well number assigned by BEDROCK SURFACE the Massachusetts Department of Environmental Protection
a PROBABLE SOURCE OF CONTAMINATION
Figure 1. Location of study area, geophysical surveys, and data-collection sites in Millville and Uxbridge,
Massachusetts.

The transmitter and directional receiver were lowered into the same well with the antenna centerpoints separated by 27.9 ft. Incremental stacked measurements were made every 0.82 ft along the length of each well. Data were processed and interpreted with MALA software. The analysis software allows the interpretation of the strike, dip, and borehole intersection depth of planar discontinuities. The distance and direction to point-like discontinuities also can be interpreted.
CROSS-HOLE TOMOGRAPHY SURVEY
Cross-hole tomography surveys were conducted to identify the presence of large saturated fracture zones and lithologic changes between wells. Data obtained from these surveys include the arrival time and attenuation of the radar pulse as it travels from the transmitter in a well to a receiver in a second well. The velocity data primarily provide information about the distribution of electromagnetic properties that are assumed to indicate electrically conductive fluids and alteration clays associated with fractures in the rock mass, and the attenuation information primarily indicates resistivity variations in the rock mass. However, the radar-velocity and attenuation data can be affected by lithologic changes in the bedrock.
A 22-MHz center-frequency transmitting antenna and a omni-directional receiving antenna were used for these surveys. The transmitter remained stationary in one borehole while the receiver was moved in 6.56-ft increments in a second borehole. Once measurements had been made at all stations in the second well, the transmitter was moved one increment, and the process was repeated until the transmitter and receiver had occupied all possible locations. Well location and borehole deviation data were used to determine the distance between the antennas at each measurement location. For interpretation, the plane between the surveyed boreholes was divided into 6.56- by 6.56-ft cells and tomographic-modeling software (Ivanson, 1984; Niva, 1993) was applied to determine the radar-wave velocity and radar-wave attenuation in each cell.The non-unique modeled radar-wave velocity and radar-wave attenuation are plotted on cross sections for visualization.
Ground Penetrating Radar
The ground-penetrating radar (GPR) survey was conducted with single and dual loo-MHz center-frequency transmitting and receiving antennas. Radar traverses were conducted on most of the roads in the study area (fig. 1). Selected radar records were interpreted on the basis of configuration, amplitude, continuity, and terminations of reflections. Interpretations of lithologies and structure were made by comparing the character of the reflected radar- wave configurations from the radar records to a chart of radar-wave configurations from known unconsolidated deposits (Beres and Haeni, 199 I, p. 379) and interpretations of radar records from investigations of the bedrock terrain. Determination of radar-wave velocity through unconsolidated deposits was made at locations along the radar survey line where the depth to bedrock is known. Radar-wave velocity in bedrock was determined from cross-hole borehole radar time and distance data.
FRACTURE ORIENTATION DETERMINED FROM GEOPHYSICAL SURVEYS
Azimuthal seismic refraction, azimuthal square-array dc-resistivity, borehole radar. and ground-penetrating radar data sets are presented in this section. Sample data records and (or) graphic presentation of data are followed by observations and interpretations for each method.
Azimuthal Seismic Refraction
Graphic azimuthal plots of seismic-refraction data (fig. 2) indicated a primary fracture strike of moderate to high-angle fractures from 56” to 101’ at site 1, 101 0 at site 2, and 67” at site 3. Analysis of the data indicates a secondary fracture strike orientation of 0” at sites 1 and 3.
Azimuthal Direct-Current Square-Array Resistivity
Azimuthal square-array data collected at the three sites (tig. I) indicated variations in apparent resistivity with measurement direction. Resistivity data from the larger array spacings that were considered representative of bedrock characteristics were used to interpret fracture orientation. Azimuthal plots of square-array resistivity data for sites I-3 at array spacings of I 12, 56, and 98 ft. respectively, are shown in tigure 3. The data plots indicate primary high-angle fractures with a 4.5” strike at site I, 90” at site 2, and from 75” to 90” at site 3. Secondary fracturing from 345” to 0” at site I and 45” at site 3 is indicated. Fracture strike also was determined analytically from the resistivity data using the cross-squares method (Habberjam, 1975). Results from this method indicated a primary fracture strike at sites I-3. of 61”. 79”. and 92”. which was consistent with the primary-fracture strike directions determined from azimuthal plots.
930

The square array consists of four electrodes driven into the ground to form a square configuration. The location of all measurements are assigned to the center point of the square. The array size (A) is the length of a side of the
square. Each resistivity measurement consists of measuring current (I) between two current electrodes (A@ and the potential difference between two potential electrodes (MN). Based on these measurements, apparent resistivity is
determined. For each square, three apparent resistivity measurements are taken. Two measurements (alpha and beta)
are perpendicular to each other and parallel to the sides of the square, and a third (gamma) is taken diagonally across the square. The two perpendicular measurements provide information on the directional variations of the subsurface resistivity. The azimuthal orientation of the perpendicular measurements is the line that connects the current electrodes. The diagonal measurement serves as a check on the accuracy of the two perpendicular measurements. ]n an isotropic medium, the apparent resistivity in the alpha and beta directions are equal and gamma is equal to zero. In a homogeneous, anisotropic medium, the gamma resistivity is equal to the difference between the alpha and beta resistivity. TO col!ect a complete set of azimuthal-profiling data, the array is rotated in equal angular increments around a common center point. To detect vertical (depth) variations in apparent resistivity at each azimuthal orientation, the array is usually expanded symmetrically about the center point. These resistivity soundings can be interpreted as a function of depth. Each array samples a cube of earth with dimensions approximately equal to the array A-spacing.
Fracture strike can be determined graphically or analytically. To graphically interpret fracture strike at a site, each apparent resistivity for a given size square and the azimuth of that measurement are plotted. The principal fracture strike direction is perpendicular to the direction of maximum resistivity. Data can be analytically interpreted by using directional resistivity data from two squares separated by 45” (crossed square-array) and applying equations presented by Habberjam (1975) to determine fracture strike.
Secondary porosity resulting from high-angle fracturin, u was estimated from crossed square-array resistivity and ground-water resistivity data based on methods developed by Taylor (1984) for collinear arrays and adapted and applied for the square array by Lane and others (1995). Secondary porosity resulting from horizontal or low-angle fractures is not accounted for with this method. Average fracture aperture of high-angle fractures at survey sites was estimated based on secondary porosity and fracture-spacing data determined by fracture mapping at nearby bedrock outcrops. Fracture aperture is equal to the porosity divided by the number of fractures per unit of length.
For this study, square-array data were collected at the three sites shown in figure I. Azimuthal profiling was accomplished by rotating the array in 15” increments, giving 12 directional apparent-resistivity measurements and six square arrays for each A-spacing. At each azimuthal orientation, sounding (depth) data were collected from 6 to 7 individual arrays with A-spacing ranging from 16 to II 2 ft. Secondary porosity was determined from ground-water resistivity data from borehole fluid-resistivity logs conducted in the area (B.P. Hansen, U.S. Geological Survey, written commun., 1994). Fracture apertures were estimated from fracture-spacing data from outcrop mapping (Paul Ollila, Massachusetts Department of Environmental Protection, written commun., 1994).
Borehole Radar
Single-hole directional and cross-hole tomographic borehole-radar surveys were conducted in three wells near the intersection of Kempton Road and Conestoga Drive (fig. 1). These surveys were conducted with an MALA GeoSience2 RAMAC borehole radar system, Broad-band electric-dipole transmitting antennas with center frequencies of 22 or 60 MHz were used. The frequency used for a given investigation was selected to provide an
acceptable compromise between high resolution (the degree to which individual features can be detected) and deep penetration (distance radar wave travels into rock). Radar velocities were computed using the vertical-radar-profiling (VRP) method.
SINGLE-HOLE DIRECTIONAL SURVEY
Single-hole directional surveys were conducted to detect the location and orientation of fractures or fracture zones. These surveys were conducted with a directional-receivin, 0 antenna consisting of four separate loop antennas oriented orthogonally to each other and operatin, D at a center frequency of60 MHz. Directional information about a reflection is obtained by measuring the phase difference of the incomin, D wave on the different antenna elements.
2Use of tradenames is for identification purposes only and does not constitute endorsement by the U.S. Geo- logical Survey.
931

SITE 1
I .08C
SITE 3
SITE 2
EXPLANATION
0 LINE OF EQUAL SEISMIC VELOCITY, IN KILOFEET PER SECOND
-- INTERPRETED PRIMARY FRACTURE STRIKE
-B-s INTERPRETED SECONDARY FRACTURE STRIKE
DATA POINTS SHOWING INTERPRETED SEISMIC VELOCITY THROUGH BEDROCK AT INDICATED AZIMUTHAL DIRIXTIONS
Figure 2. Azimuthal plots of seismic velocity in bedrock obtained by the Hobson-Ovetion method of velocity analysis for sites l-3 in Oxbridge, Massachusetts.
932

SITE 1 A=112FEET
?’ 15”
SITE 3 A = 98 FEET
D ?45 I 0” 15”
SITE 2 A = 56 FEET
9’ 75’
0 -- s---
A
EXPLANATION
LINE OF EQUAL APPARENT RESISTVITY,
IN OHM-METERS
INTERPRETED PRIMARY FRACTURE STRIKE
INTERPRETED SECONDARY FRACTURE STRIKE
INTERPRETED SEISMIC VELOCITY THROUGH
BEDROCK AT INDICATED AZIMUTHAL
DIRECTIONS
LENGTH OF SIDE OF SQUARE ARRAY
Figure 3. Azimuthal plots of apparent resistivity from square-array surveys at sites l-3 in Uxbridge, Massachusetts.
933
Single-Hole Directional
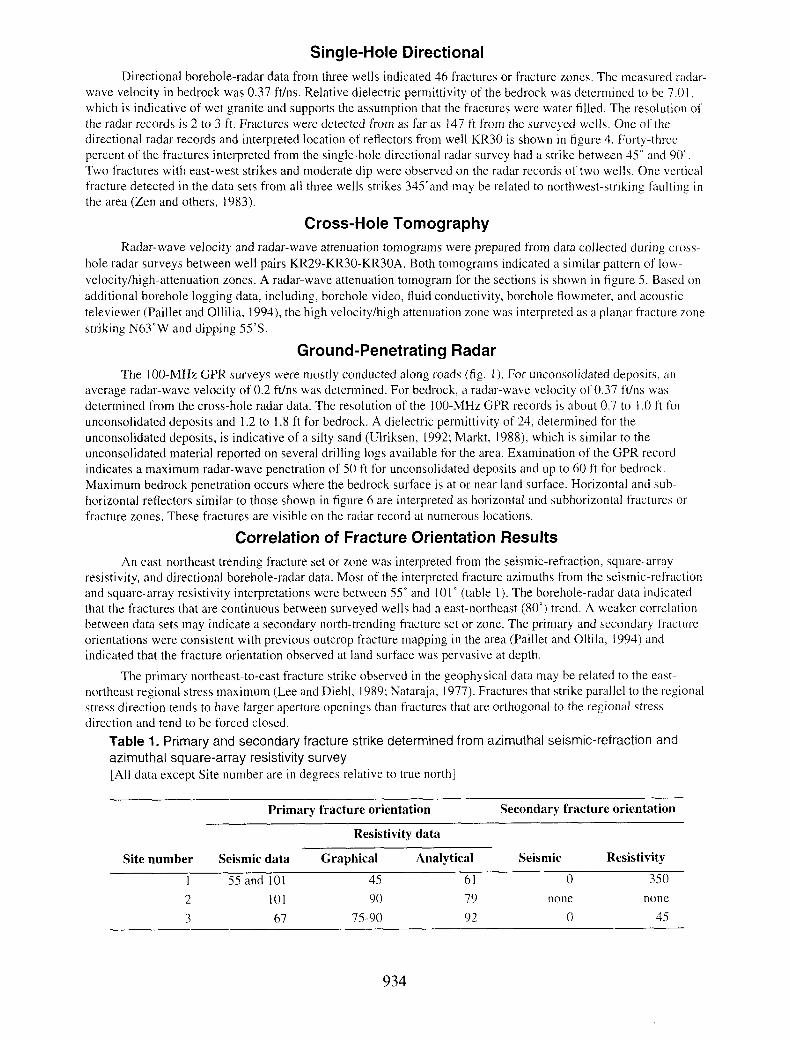
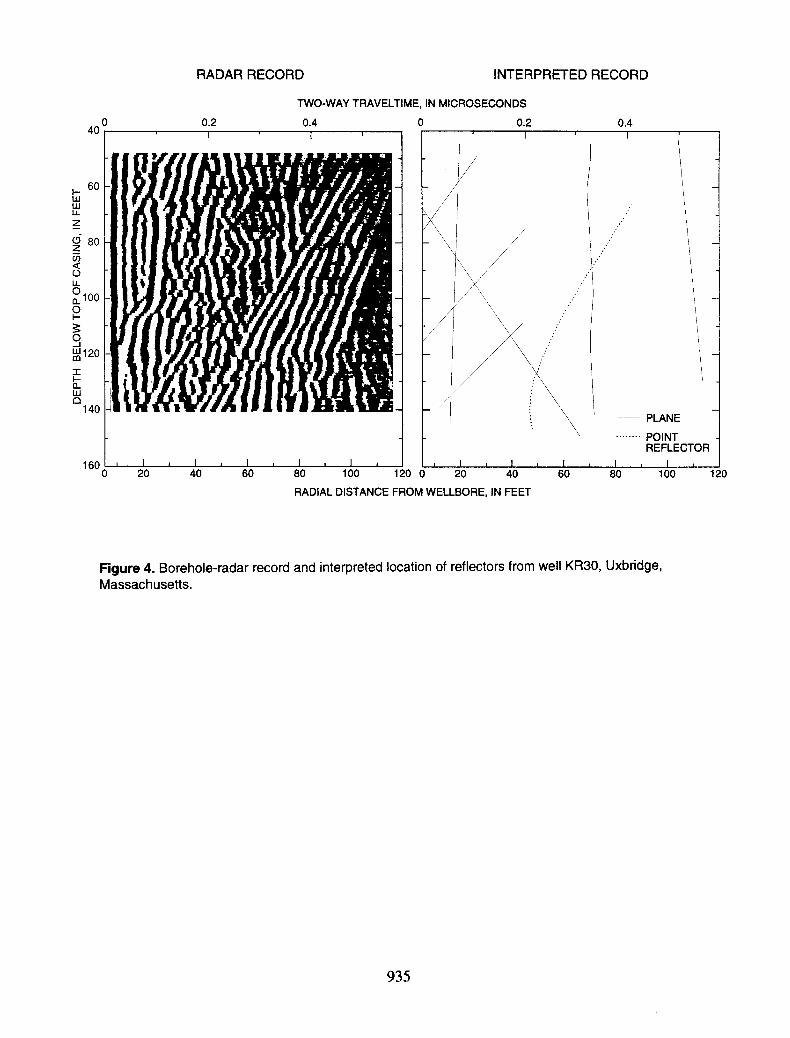
Directional borehole-radar data from three wells indicated 46 fractures or fracture zones, The measured radar- wave velocity in bedrock was 0.37 ft/ns. Relative dielectric permittivity of the bedrock was determined to be 7.01, which is indicative of wet granite and supports the assumption that the fractures were water filled. The resolution of the radar records is 2 to 3 ft. Fractures were detected from as far as 147 ft from the surveyed wells. One of the directional radar records and interpreted location of reflectors from well KR30 is shown in figure 4. Forty-three percent of the fractures interpreted from the single-hole directional radar survey had a strike between 45” and 90”. Two fractures with east-west strikes and moderate dip were observed on the radar records of two wells. One vertical fracture detected in the data sets from all three wells strikes 345”and may be related to northwest-striking faulting in the area (Zen and others, 1983).
Cross-Hole Tomography
Radar-wave velocity and radar-wave attenuation tomograms were prepared from data collected during cross- hole radar surveys between well pairs KR29-KR30-KR30A. Both tomograms indicated a similar pattern of low- velocity/high-attenuation zones. A radar-wave attenuation tomogram for the sections is shown in figure 5. Based on additional borehole logging data, including, borehole video, fluid conductivity, borehole flowmeter, and acoustic televiewer (Paillet and Ollilia, 1994), the high velocity/high attenuation zone was interpreted as a planar fracture zone striking N63”W and dipping 5.5”s.
Ground-Penetrating Radar
The f 00-MHz GPR surveys were mostly conducted along roads (fig. I). For unconsolidated deposits. an average radar-wave velocity of 0.2 ft/ns was determined. For bedrock, a radar-wave velocity of 0.37 ft/ns was determined from the cross-hole radar data. The resolution of the IOO-MHz GPR records is about 0.7 to I .O ft fol unconsolidated deposits and 1.2 to I .8 ft for bedrock. A dielectric permittivity of 24, determined for the unconsolidated deposits, is indicative of a silty sand (Ulriksen, 1992; Markt, I988), which is similar to the unconsolidated material reported on several drilling logs available for the area. Examination of the GPR record indicates a maximum radar-wave penetration of 50 ft for unconsolidated deposits and up to 60 ft for bedrock. Maximum bedrock penetration occurs where the bedrock surface is at or near land surface. Horizontal and sub- horizontal reflectors similar to those shown in figure 6 are interpreted as horizontal and subhorizontal fractures OI fracture zones. These fractures are visible on the radar record at numerous locations.
Correlation of Fracture Orientation Results
An east-northeast trending fracture set or zone was interpreted from the seismic-refraction, square-array resistivity, and directional borehole-radar data. Most of the interpreted fracture azimuths from the seismic-refraction and square-array resistivity interpretations were between 55” and 101’ (table I). The borehole-radar data indicated that the fractures that are continuous between surveyed wells had a east-northeast (80”) trend. A weaker correlation between data sets may indicate a secondary north-trending fracture set or zone. The primary and secondary fracture orientations were consistent with previous outcrop fracture mapping in the area (Paillet and Ollila, 1994) and indicated that the fracture orientation observed at land surface was pervasive at depth.
The primary northeast-to-east fracture strike observed in the geophysical data may be related to the east- northeast regional stress maximum (Lee and Diehl, 1989; Nataraja, 1977). Fractures that strike parallel to the regional stress direction tends to have larger aperture openings than fractures that are orthogonal to the regional stress direction and tend to be forced closed.
Table 1. Primary and secondary fracture strike determined from azimuthal seismic-refraction and azimuthal square-array resistivity survey [All data except Site number are in degrees relative to true north]
Primary fracture orientation
Resistivity data
Secondary fracture orientation
Site number Seismic data Graphical Analytical
I 5.5 and 101 4s 61
2 101 90 79
3 67 75-90 92
Seismic
0
none
0
Resistivity
350
none
4s
934
40
‘_- 20 40 60 80 100 120 160
RADAR RECORD INTERPRETED RECORD
TWO-WAY TRAVELTIME, IN MICROSECONDS
0.2 0.4 0 0.2 0.4 I I , I I I I
PLANE
POINT REFLECTOR
RADIAL DISTANCE FROM WELLBORE, IN FEET
12 0
Figure 4. Borehole-radar record and interpreted location of reflectors from well KR30, Uxbridge, Massachusetts.
935

Well KR29
0
40
60
z ̂ 100
4 3
5 120
ts
140
zt
i 160
E
% 180
Well Well
KRBOA KR30
200
220
240
260 -
-Well Bore Fractures
> WATER-YIELDING ZONES INDKXTED BY FLOWMETER AND BOREHOLE GEOPHYSICAL LOGS
J-
W)
I I I I I I I I I I I I I I I I I I I I I. f I I II% II 1 I II I * ,‘v
0 20 40 60 80 100 120 140 Break in scale 160 180 200 220 240 260 280 300 320 340 36;
Televiewer logs from Paillet and Ollila, 1994. DISTANCE, IN FEET
Figure 5. Tomogram of radar-wave attenuation, televiewer logs, and water-yielding zones in the cross sections between wells KR30A, K.R30, and KR29 in Uxbridge, Massachusetts.
1 38(

RADAR RECORD
200
300
400
INTERPRETED GEOLOGIC CROSS SECTION
El 0 Welt 1 Located approximately 50 feet east of Land Surface Well I
2 KR26 radar line and 5 feet lower in elevation. KR35 n
ai
Reported depth to bedrock is 50 feet Located approximately 50 feet west of radar line. Reported depth to bedrock is IO feet
Unconsolidated
I-
---__----_ ---_ / ---_
---_ ----, - --
FractuYesTor’/- - - -/- - ------ /
/ / -- t-- fracture zones, , ’
/ R
“7 /
2 / /
/ / Bedrock
/ / /
,? / /
/ / / / /
? Interpretation questionable
/ /
/
I Location of section shown in figure 1 0 50 100 FEET
I I I 1 I ! 1 1 I
0 10 20 30 METERS
APPROXIMATE VERTICAL EXAGGERATION x 2.2
Figure 6. loo-Megahertz ground-penetrating radar record and interpreted geologic cross-section A-A’ along Conestoga Drive, Uxbridge, Massachusetts.
937

OTHER SITE CHARACTERISTICS DETERMINED FROM GEOPHYSICAL SURVEYS
Geophysical surveys are commonly conducted to provide information about a particular characteristic of a study area. Frequently, these surveys also provide additional information that can be used for site characterization. Fracture porosity and depth to bedrock information determined from the geophysical data that can be utilized for site characterization.
Fracture Porosity and Aperture
Apparent square-array resistivity data were used to estimate secondary porosity and average fracture aperture of the high-angle fractures that cause the azimuthal variations (anisotropy) in resistivity and are summarized in table 2. Porosity ranged from 0.0042 to 0.0047 and average fracture aperture ranged from 0.0067 to 0.0073 ft. This porosity was not the total secondary porosity of the bedrock but was only associated with the high-angle fractures. Numerical descriptions from table 2 should be considered as maximum possible values of high-angle fractures. The resistivity data used to make the determinations may include the effects of fracture mineralization and bedrock alteration associated with fracturing which, if present, would decrease porosity and effective aperture. Also, the method used to determine porosity of high-angle fractures does not account for the additional porosity associated with horizontal or low-angle fractures that are present.
Table 2. Average high-angle bedrock fracture characteristics determined from square-array resistivity survey data from sites l-3, Uxbridge, Massachusetts [Average fracture aperture: based on fracture spacing of 0.064 fractures per foot, determined by fracture mapping on north-south bedrock outcrops on Route I22 and Conestoga Drive, LJxbridge, Mass. Primary fracture strike given in degrees relative to true north]
Average Site number
Square array Resistivity Primary Fracture size (feet) anisotropy fracture strike porosity
fracture aperture (feet 1
I 112 1.11 61 0.0042 0.0073
2 56 1.12 79 .0043 .0067
3 98 1.10 92 .0047 ,007s
Depth to Bedrock
The bedrock surface also was indicated by radar-wave reflections on the loo-MHz GPR records. In general, a depth to bedrock ranging from 0 to 20 ft below land surface was indicated along most of the surveyed lines with good correlation with well data along the lines. One exception, shown on figure 7 and located along Conestoga Drive neai well KR34 (fig. I ), had a maximum indicated depth to bedrock of 45 to 50 ft below land surface. This interpretation was supported by a reported depth to bedrock of 50 ft on the drilling log of an adjacent well. This depression in the bedrock surface probably is part of a buried bedrock channel that could be a pathway or sink for locally present contamination that could move along the bedrock surface. The configuration, orientation, and extent of this channel presently (I 995) is unknown.
938

RADAR RECORD
INTERPRETED GEOLOGIC CROSS SECTION
Iii 0
k Well KR34 1 Located approximately 50 feet west of Land surface
radar line. Reported depth to bedrock is 50 feet
z
2 5 lo- 0
4 n
::
i z-
Unconsolidated
deposits
Unconsolidated deposits
I
Location of section shown in figure 1 0 100 200 FEET
t ’ I I I I I I I ,
I I d 26 40 60 METERS
APPROXIMATE VERTICAL EXAGGERATION x 3.4
Figure 7. 1 00-Megahertz ground-penetrating radar record and interpreted geologic cross-section B-B’ along Conestoga Drive in Uxbridge, Massachusetts.
939

REFERENCES
Beres, Milan Jr., and Haeni, F.P., 1991, Application of ground-penetrating-radar methods in hydrologic studies: Ground Water, v. 29, no. 3, p. 375386.
Habberjam, G.M., 1972, The effect of anisotropy on square array resistivity measurements: Geophysical Prospecting, v. 20, p. 249-266.
Habberjam, G.M, 1975, Apparent resistivity, anisotropy and strike measurements: Geophysical Prospecting, v. 23, p. 21 l-247.
Haeni, F.P., Grantham, D.G., and Ellefsen, Karl, 1987, Microcomputer-based version of SIPT--A program for the interpretation of seismic-refraction data: U.S. Geological Survey Open-File Report 87-103A (text), 13 p. and 87-103B, 5 l/4-inch disk, MS-DOS compatible.
Hansen, B.P., and Lane, J.W.Jr., 1995, Use of surface and borehole geophysical surveys to determine fracture orientation and other site characteristics in crystalline bedrock terrain, Millville and Uxbridge, Massachusetts: U.S. Geological Survey Water-Resources Investigations Report 95-4121, 25 p.
Ivansson, S., 1984, Crosshole investigations--tomography and its application to crosshole seismic measurements: Stockholm, Sweden, Stripa Project IR-84-08.
Lane, J.W. Jr., Haeni, F.P., and Watson, W.M., 1995, Use of square-array direct-current resistivity method to detect fractures in crystalline bedrock in New Hampshire: Groundwater, v. 33, no. 3, p. 476-485.
Lee. E.T. and Diehl, S.F., 1989, Geomechanical aspects of subsidence in eastern Maine, in Neotectonics of Maine: Maine Geological Survey, Bulletin 40, p. 209-2 18.
Lieblich, D.A., Haeni, F.P., and Cromwell, Rowland E., 1992, Integrated use of surface-geophysical methods to indicate subsurface fractures at Tibbetts Road, Barrington, New Hampshire: U.S. Geological Survey Water- Resources Investigations Report 92-4012, 33 p.
Markt, George, 1988, Subsurface characterization of hazardous waste sites using ground-penetrating radar: in Second International Symposium on Geotechnical Applications of Ground-Penetrating Radar, March 6- 10, 1988, Proceedings: 4 1 p.
McKniff, J.M., 1964, The petrology of the south half of the Blackstone quadrangle, Massachusetts and Rhode Island: Providence, R.I., Master’s thesis, 37 p.
Nataraja, M., 1977, In situ stress measurements, Park River Project, Hartford, Connecticut: U.S. Department of Transportation and U.S. Army Engineer Division, New England, Miscellaneous Paper S-77-22.
Niva, Borge, 1993, Results of borehole radar survey in Kempton Road, Millville, Massachusetts: Sweden, ABEM Geoscience, unpaginated.
Paillet, EL., and Ollila, Paul, 1994, Identification, characterization, and analysis of hydraulically conductive fractures in granitic basement rocks, Millville, Massachusetts: U.S. Geological Survey Water-Resources Investigations Report 94-4 185, 36 p.
Scott, J.H., 1977, SIPT-A seismic inverse refraction modeling program for timeshare terminal computer systems: U.S. Geological Survey Open-File Report 77-365, 35 p.
Scott, J.H., Tibbetts, B.L., and Burdick, R.G., 1972, Computer analysis of seismic refraction data: U.S. Bureau of Mines Report of Investigation 7595, 95 p.
Taylor, R.W., 1984, The determination of joint orientation and porosity from azimuthal resistivity measurements, in Nielsen, D.M., and Curl. Mary (eds.). National Water Well Association/U.S. Environmental Protection Agency Conference on Surface and Borehole Geophysical Methods in Ground Water Investigations, San Antonio, Texas: Dublin, Ohio. National Ground Water Association, Proceedings, p. 37-49.
Ulriksen, P.F., 1982, Application of impulse radar to civil engineering: Lund, Sweden, Lund University of Technology, Ph.D. Thesis, I79 p.
Zen, E-an, [ed.], Goldsmith, Richard, Ratcliff, N.L., Robinson, Peter, and Stanley, R.S.. [compilers],lY83, Bedrock geologic map of Massachusetts: U.S. Geological Survey, Washington. D.C.. 3 sheets, scale I :250,000.
940