organophosphate
DESCRIPTION
OrganophosphateTRANSCRIPT

Organophosphates and phthalates in air and dust from indoor environments
– Method development and applied measurements
Caroline Bergh
Doctoral Thesis Department of Analytical Chemistry
Stockholm University 2011

ii
Academic dissertation for the degree of Doctor of philosophy in
Analytical Chemistry at Stockholm University to be publicly defended
on Thursday 26th of may at 13:00 in Magnélisalen, Kemiska
Övningslaboratoriet, Svante Arrheniusväg 16, Stockholm, Sweden
© Caroline Bergh, Stockholm 2011
ISBN 978-91-7447-256-1
Printed by Universitetsservice US-AB, Stockholm

iii
Till Mamma och Pappa

iv
Abstract Organophosphate and phthalate esters are polymer additives that are
frequently found in air and dust in indoor environments. This thesis
describes the development and application of air sampling and selective
mass spectrometric (MS) determination of these two compound groups.
(Paper I). MS ionization efficiency and overall method performance was
evaluated using different reagent gases in positive chemical ionization
mode (PICI) (Papers I and IV). It also describes the sampling and
screening of these compounds in indoor air and dust from different
environments (Papers II and III) and the development and evaluation of
a method for the extraction and determination of these compounds in
indoor dust (Paper IV). Throughout this work, the separation technique
of choice was gas chromatography (GC) and sampling, clean-up and
analysis of the two target groups of compounds were performed
simultaneously.
An air sampling method previously used for air sampling of only
organophosphate esters, is here demonstrated to be applicable for
simultaneous sampling of both phthalate and organophosphate esters
(Paper I). Isobutane reagent gas was shown to be superior to methane
(Paper I) and further results presented in Paper IV showed ammonia to
be even better. Selective detection using tandem mass spectrometry
(MS/MS) showed good results for simultaneous determination of
organophosphate and phthalate esters in air (Paper I and IV). The high
selectivity of this technique was especially advantageous when analyzing
the comparably more complicated indoor dust matrix.
Comparison of chemical profiles of organophosphate esters between
indoor environments including daycare centers, offices and private
v
homes differed between the types of locations while the phthalate
profiles were rather similar (Paper I). Comparison of concentration
levels of these compounds in multi-storey apartment buildings classified
as either high or low risk “sick” buildings could not differentiate the two
classes of buildings. The differences in levels between apartments
indicated apartment specific sources of these compounds (Paper III). In
general the levels of phthalate esters were consistently higher than the
levels of organophosphate esters both in air and in dust (Paper II–III).
Further, the studies include correlation of air and dust profiles of the two
compounds groups and also points out some potential sources of
organophosphate and phthalate esters in these indoor environments
(Paper II–III).
In Paper I, a pilot study of the standard reference material SRM 2585
“Organic Contaminants in House Dust”, showed that several
organophosphate and phthalate esters was present in this complex matrix.
In Paper IV seventeen phthalate and organophosphate esters were
determined in SRM 2585, out of which ten had not previously been
reported for this reference material.

vi
Populärvetenskaplig sammanfattning Avhandlingen beskriver utveckling och tillämpning av metoder för
provtagning, provupparbetning och kemisk analys av inomhusluft och
damm. Fokus ligger på analys av två grupper av föreningar: ftalater och
organofosfatestrar. Dessa föreningar används framför allt som
mjukgörare och flamskyddsmedel i polymera material, d.v.s. olika typer
av plaster, gummi, ytbehandlingsmaterial och mycket mera. Den
omfattande användningen av dessa produkter medför att organofosfater
och ftalater är vanligt förekommande i både luft och damm i vår
inomhusmiljö.
Arbetet i denna avhandling innefattar utveckling och tillämpning av en
metod där båda dessa föreningsgrupper provtogs respektive upparbetades
simultant. Detta underlättar inte bara under själva provtagningen, utan det
reducerar även antalet analyssteg och minskar mängden lösningsmedel.
Under arbetets gång har en masspektrometrisk∗ detektionsmetod
utvecklats där man genom att välja ur specifika joner i två separata led
(s.k. ”tandemmasspektrometri”) sorterar bort föreningar som kan störa
analysen och får en metod som har hög selektivitet för de utvalda
föreningarna. Metoden visade sig extra fördelaktig för analys av damm
som ur ett analytisk kemiskt perspektiv är en mer komplicerad matris**
än luft då den inte bara innehåller en mängd kemiska ämnen utan också
t.ex. fett och hudavlagringar som kan störa analysen.
∗ Masspektrometer: Ett analysistrument som joniserar och därefter sorterar föreningar
med avseende på massa och laddning för att sedan registrerar dem med hjälp av elektroniska sensorer, används både för identifiering och haltbestämmning av kemiska föreningar i en mängd olika prover.
** Matris: Det material som avses att analyseras så som luft, damm, vatten, förbränningsavgaser m.m.

vii
Flera ftalater misstänks ha hormonstörande effekter. Båda
föreningsgrupperna har även påvisats kunna ha allergena effekter och
organofosfaterna har indikerats vara både cancerogena och neurotoxiska.
Detta föranleder större studier för att få en så god bild av alla källor till
exponering och i detta steg är bra analysmetoder mycket viktiga. I
samarbete med två större projekt, ”Nya gifter – nya verktyg” och
”Hälsomässigt hållbara hus” (3H)*, utfördes provtagning av damm och
luft i olika typer av inomhusmiljöer (kontor, daghem, villor och
lägenheter) i Stockholmsområdet. Den dagliga dosen som kunde
beräknas ur halterna av de föreningar som bestämdes i luft och damm i
inomhusmiljöerna uppnår inte en dos som kan klassas som hälsovådlig ur
ett toxiskt perspektiv. Men, då den dagliga exponeringen inte bara sker
från luft och damm utan dessutom också sker genom konsumtion av mat
som har förpackats och förvarats i material som innehåller dessa
föreningar, genom hygienprodukter, för barn genom leksaker som
innehåller dessa föreningar, för att nämna några, så kan den totala
exponeringen utgöra ett potentiellt problem.
För att kunna bestämma riktigheten i sina analyser och även för att kunna
jämföra resultat mellan olika laboratorier kan man använda sig av s.k.
standardreferensmaterial. En mängd sådana referensmaterial finns
tillgängliga genom National Institute of Standards and Technology
(NIST) i USA. Idealt har ett sådant referensmaterial certifierade halter,
d.v.s. analys kemiskt säkerställda halter, av de föreningar man vill
analysera. Det finns tre referensdamm tillgängliga via NIST dock har
* Mer information om projekten ”Nya gifter – Nya Verktyg” och ”Hälsomässigt Hållbara Hus (3H)” finns på Sockholms Miljöförvaltnings hemsida: http://www.stockholm.se/miljoforvaltningen

viii
inget av dessa certifierade halter av organofosfater och ftalater. Ett av de
tre referensmaterialen (SRM 2585) har i dessa studier undersökts och
föreningarna haltbestämts, vilket öppnar för andra att jämföra halterna i
sin analysmetod och kan så småningom leda till certifiering av halterna
av organofosfater och ftalater i detta damm.
ix
List of papers This thesis is based upon the following publications which are referred to
in the text by corresponding Roman numerals I–IV. Papers I and II are
reproduced with the kind permission of the publishers. Some unpublished
results are also included in this thesis.
I Simultaneous selective detection of organophosphate and phthalate
esters using gas chromatography with positive ion chemical
ionization tandem mass spectrometry and its application to indoor
air and dust
Caroline Bergh, Ralf Torgrip, Conny Östman,
Rapid communications in Mass spectrometry 2010;24(19):2859-2867
The author was responsible for most of the experimental work, all the
data evaluation and the major part of writing the paper.
II Organophosphate and phthalate esters in air and settled dust – a
multi location indoor study
Caroline Bergh, Ralf Torgrip, Gunnel Emenius, Conny Östman,
Indoor Air 2011;21(1):67-76
The author was responsible for a large part of the experimental work,
for a major part of the data evaluation and writing the paper.

x
III Organophosphate and phthalate esters in indoor air: a comparison
between multi-storey buildings with high and low prevalence of
sick building symptoms
Caroline Bergh, K. Magnus Åberg, Magnus Svartengren, Gunnel
Emenius, Conny Östman
Accepted for publication in Journal of Environmental Monitoring
(2011-04-27)
The author was responsible for a major part of the experimental work,
for a large part of the data evaluation and writing the paper.
IV Organophosphate and phthalate esters in Standard Reference
Material 2585 “Organic Contaminants in House Dust”
Caroline Bergh, Giovanna Luongo, Stephen Wise, Conny Östman
Manuscript
The author was responsible for a major part of the experimental work,
for all the data evaluation and the major part of writing the paper.

xi
Abbreviations ANOVA Analysis of variance AGD Anogenital distance CI Chemical ionization CID Collision induced dissociation CSTEE Scientific Committee for Toxicity, Ecotoxicity
and the Environment DC Direct current ECHA European Chemicals Agency ECNI Electron capture negative ionization EI Electron ionization EU European Union FID Flame ionization detector GC Gas chromatography KOA Octanol-air partition coefficient LOQ Limit of quantification MS Mass spectrometry MS/MS Tandem mass spectrometry NIST National Institute of Standards and Technology NPD Nitrogen phosphorous detector OPE Organophosphate esters PBDE Polybrominated diphenyl ethers PBT Persistence, bioaccumulation and toxicity PCA Principal component analysis PICI Positive-ion chemical ionization POM Particulate organic matter PVC Poly vinyl chloride Q, q Quadrupole REACH Registration, Evaluation, Authorisation
and Restriction of Chemicals RF Radio frequency RfD Reference dose RIC Reconstructed ion chromatogram SBS Sick building symptoms SIM Selected ion monitoring SPE Solid phase extraction SRM (1) Selected reaction monitoring SRM (2) Standard reference material SVOC Semi-volatile organic compounds

xii
TDI Tolerable daily intake TDS Testicular dysgenesis USEPA U.S. Environmental Protection Agency WHO World Health Organization VOC Volatile organic compounds VVOC Very volatile organic compounds 3H Helthy sustainable houses
(SWE: Hälsomässigt hållbara hus)

xiii
Table of contents
Abstract .......................................................iv
Populärvetenskaplig sammanfattning ...............vi List of papers................................................ix
Abbreviations................................................xi Table of contents......................................... xiii 1. Introduction .............................................. 1
1.1. Polymeric materials and additives ................2 1.1.1. Plasticizers .................................................2 1.1.2. Flame retardants.........................................3
1.2. Phthalates ....................................................3 1.3. Organophosphate esters...............................5 1.4. Occurrence and health effects ......................7
2. Gas phase, suspended particles and dust .....10
3. Sampling .................................................11 3.1. Air Sampling ...............................................11 3.2. Dust Characterization and Sampling...........12
3.2.1. Dust Standard Reference Materials ..............14 4. Analytical Methods ....................................16
4.1. Gas chromatography ..................................16 4.2. Flame ionization detection..........................16 4.3. Nitrogen phosphorous detection.................17 4.4. Mass spectrometric detection .....................18
4.4.1. Electron ionization.....................................18 4.4.2. Chemical ionization ...................................19 4.4.3. Quadrupole analyzer scan modes ................20
4.5. Discussion — analytical determination .......24

xiv
5. Organophosphates and phthalates in indoor air and dust .....................................................31
5.1. Air samples.................................................31 5.1.1. Phthalates in air........................................31 5.1.2. Organophosphates in air ............................32
5.2. Dust samples ..............................................37 5.2.1. Phthalates in dust .....................................37 5.2.2. Organophosphates in dust ..........................39
5.3. Potential sources ........................................42 5.4. Exposure.....................................................43
6. Conclusions and future perspectives ............47
7. Acknowledgement.....................................50
8. References...............................................53
1
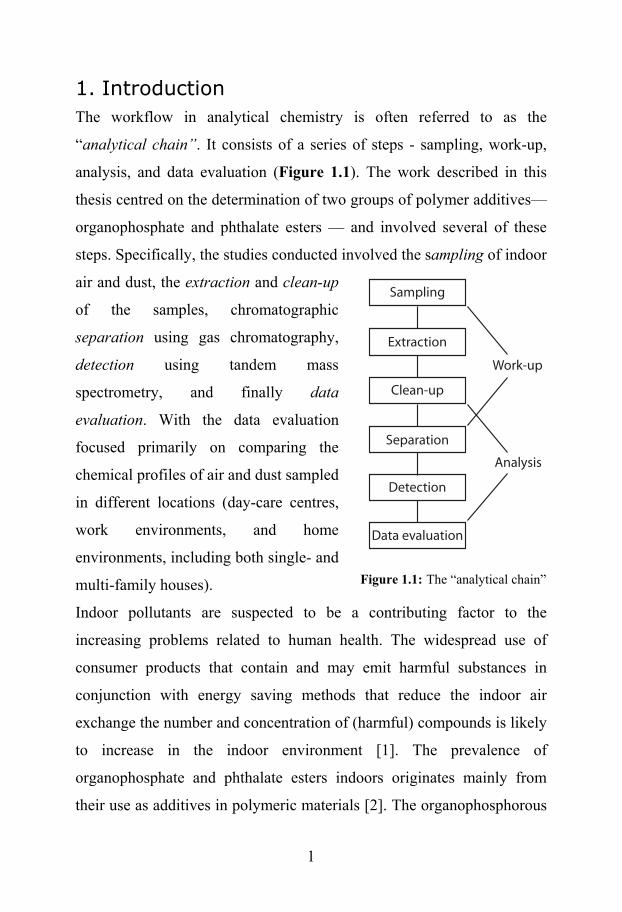
1. Introduction The workflow in analytical chemistry is often referred to as the
“analytical chain”. It consists of a series of steps - sampling, work-up,
analysis, and data evaluation (Figure 1.1). The work described in this
thesis centred on the determination of two groups of polymer additives—
organophosphate and phthalate esters — and involved several of these
steps. Specifically, the studies conducted involved the sampling of indoor
air and dust, the extraction and clean-up
of the samples, chromatographic
separation using gas chromatography,
detection using tandem mass
spectrometry, and finally data
evaluation. With the data evaluation
focused primarily on comparing the
chemical profiles of air and dust sampled
in different locations (day-care centres,
work environments, and home
environments, including both single- and
multi-family houses).
Indoor pollutants are suspected to be a contributing factor to the
increasing problems related to human health. The widespread use of
consumer products that contain and may emit harmful substances in
conjunction with energy saving methods that reduce the indoor air
exchange the number and concentration of (harmful) compounds is likely
to increase in the indoor environment [1]. The prevalence of
organophosphate and phthalate esters indoors originates mainly from
their use as additives in polymeric materials [2]. The organophosphorous
Figure 1.1: The “analytical chain”
Sampling
Extraction
Separation
Data evaluation
Work-up
Clean-up
Analysis
Detection
2
and phthalate ester additives are not covalently bonded to the polymer
and can therefore migrate and escape from the polymer matrix into the
surrounding air [3]. Consequently, these have become ubiquitous
pollutants in the indoor environment [4-10], and are generally more
abundant indoors than outdoors [3, 5, 10, 11]. These compounds are
typically present in indoor air, but can also readily partition to materials
in contact with air (e.g. furniture and surfaces) and they will also be
distributed to airborne particles and dust, both which are important
sources of chemical exposure [3].
1.1. Polymeric materials and additives
Polymeric materials are produced in large quantities and comprise a large
number of materials such as plastics, rubbers, surface coatings, etc.
Polymeric materials are made by forming bonds between a large number
of small molecules (monomers) to produce long chains — a polymer; this
process is referred to as polymerization. Additives are frequently added
to polymers to alter their processing and final properties [12, 13]. Two
important groups of additives are plasticizers and flame retardants [14,
15].
1.1.1. Plasticizers
Plasticizers are incorporated to improve polymers’ processability,
flexibility, elasticity, and durability. Phthalic acid esters (phthalates) and
organophosphate triesters (also known as organophosphate esters or
OPEs) are two groups of compounds that are used for this purpose.
However, OPEs are primarily used to improve polymers’ fire resistance
[12].

3
1.1.2. Flame retardants
Most polymeric materials are organic materials and are thus combustible.
As such, they have to satisfy fire resistance requirements when used in
various applications. Unlike most additives, flame retardants can impair
the properties of polymeric material. Because they have both flame-
retarding and plasticizing properties, OPEs are an important group of
polymer flame retardants on the market [2, 12].
1.2. Phthalates
Phthalates are the most common plasticizing agents, and are used to
increase the desirable flexibility and durability of hard polymeric
materials such as PVC. Phthalate additives are typically used as
plasticizers in polymers such as cellulose esters, PVC and other vinyl
chloride copolymers [16]. The general structure of the phthalates is
shown in Figure 1.2.
O
O
O
O
R1
R2
Figure 1.2: General structure of the phthalate esters.
The phthalates that were examined in this work are listed in Table 1.1.
PVC is used in production of furniture, flooring, wall coating, cables,
building and construction materials, and also in other consumer products
such as shower curtains, footwear, plastic bags, food packing material,
toys, etc. [2].

4
Phthalates are such ubiquitous indoor pollutants that contamination of
blanks is a common problem associated with their determination. This
problem must be considered and accounted for during sampling, sample
work-up, and the subsequent analysis.
Table 1.1: Names, abbreviations CAS numbers, vapour pressures (Vp) and boiling points of the reference compounds.
Name Abbreviation CAS No. Vp [Torr]4 Bp (°C)4 Phthalates Dimethyl1 DMP 131-11-3 3.31·10-3 283 Diethyl1 DEP 84-66-2 1.67·10-3 294 Dibutyl1 DBP 84-74-2 1.08·10-4 295 Diisobutyl1 DiBP 84-69-5 1.54·10-3 337 Benzylbutyl1 BzBP 85-68-7 7.09·10-7 408 Di(2-ethylhexyl)1 DEHP 117-81-7 3.95·10-6 385 Di(n-octyl)1 DnOP 3115-39-7 1.38·10-7 402 Diisononyl2 DiNP 28553-12-0 - - Diisodecyl2 DiDP 26761-40-0 - - d4 -Diethy 3 d4 -DEP (IS) - - - d4 -Benzylbutyl 3 d4 -BzBP (IS) - - - d4 -Di(2ethylhexyl)3 d4 -DEHP (IS) - - -
1Sigma Aldrich, Marbor, USA, 2Fluka Chemie GmbH, Sigma-Aldrich Company, Japan. 3Cambridge Isotope Laboratories Inc, Andover, USA. 4Obtained through SciFinder©; Calculated using Advanced Chemistry Development (ACD/Labs) Software V9.04 (© 1994-2010 ACD/Labs). Temp 25°C, Pressure. 760Torr

5
1.3. Organophosphate esters
Organophosphate triesters (OPEs) are derivates of phosphoric acid; their
general structure is shown in Figure 1.3. The three substituents can be
either aryl, alkyl, haloalkyl or a combination of these.
PO
O
O
O
R1
R2
R3
Figure 1.3: General structure of the organophosphate esters.
The OPEs examined in this work are listed in Table 1.2. OPEs can have
a wide range of physical and chemical properties depending on the nature
of their substituents. This makes OPEs a challenging group of
compounds to analyze; frequently-encountered problems include
minimizing chromatographic column tailing, the identification of suitable
internal standards, and difficulties associated with blanks, among other.
OPEs are used as flame retardants, stabilizers, and plasticizers in
numerous products, including building materials, flooring and wall
coatings, electronic goods, furnishing material and textiles. They are also
used in paper coatings, adhesives, latex paints, lacquers, printed circuit
boards, synthetic leather, etc. [17, 18].
OPEs can be divided into three subclasses, depending on the nature of
their substituents: triaryl-, trialkyl- and tris(haloalkyl). These different
subclasses have slightly different properties and uses. The triaryl
phosphates are mainly used as flame retardants, but are also somewhat

6
effective plasticizers. Alkyl substituents make OPEs more flammable,
and flammability increases with the length of the alkyl chain. As such,
trialkyl phosphates are more flammable, and are primarily used as
plasticizers. Haloalkanes are effective flame retardants; trihaloalkyl
phosphates combine the flame-retarding properties of the haloalkane
substituents and the phosphorous group, and are mainly used in rigid and
flexible polyurethane foam products.[18-20].
Table 1.2: Names, abbreviations CAS numbers, vapour pressures (Vp) and boiling point (Bp) of the reference compounds.
Name Abbreviation CAS No. Vp [Torr]5 Bp (°C)5
Phosphates Triethyl1 TEP 78-40-0 1.77·10-1 219 Triisopropyl 1 TiPrP 513-02-0 1,53·10-1 222 Tripropyl 1 TPrP 513-08-6 2,88·10-2 254 Triisobutyl1 TiBP 126-71-6 1.91·10-2 261 Tributyl1 TBP 126-73-8 4.09·10-3 288 Tris(2-chloroethyl) 1 TCEP 115-96-8 1.08·10-4 347 Tris(2-chloroisopropyl)2 TCiPP 13674-84-5 5.25·10-5 359 Tripentyl 3 TPeP 2528-38-3 5.45·10-4 322 Trihexyl 1 THP 2528-39-4 6,99·10-5 354 Tris(1,3-dichloroisopropyl) 3 TDCPP 13674-87-8 4.07·10-8 457 Tris(2-butoxyethyl)1 TBEP 78-51-3 1.11·10-6 414 Triphenyl1 TPP 115-86-6 1.24·10-6 412 Diphenyl-ethylhexyl 3 DPEHP 1241-94-7 6.49·10-7 421 Tris(2-ethylhexyl)1 TEHP 78-42-2 2.04·10-6 406 Tritolyl 1 TToP 1330-78-5 - 420 d27-Tributyl4 d27-TBP (IS) - - -
1Aldrich Chemicals, Milwaukee, USA, 2Akzo Nobel, The Netherlands, 3TCI, Tokyo, Japan, 4Cambridge Isotope Laboratories Inc, Andover, USA. 5Obtained through SciFinder©; Calculated using Advanced Chemistry Development (ACD/Labs) Software V9.04 (© 1994-2010 ACD/Labs). Temp 25°C, Pressure. 760 Torr, except TToP Vp: "Hazardous Substances Data Bank" data are provided by the National Library of Medicine (US).
7
1.4. Occurrence and health effects
It has been estimated that one million metric tonnes of phthalates were
produced in Western Europe in 2010 [21]. Western European production
of organophosphorous flame-retardants in 2001 was estimated at 83,000
metric tonnes, and has since increased [5, 17, 22]; in 2006, approximately
91,000 metric tonnes of OPEs were produced for use as flame retardants,
corresponding to an increase of approximately 9 % [5, 22]
DBP, DiBP, DEHP, BzBP and TCEP have all been placed on the
“Candidate List of Substances of Very High Concern for authorization”
[23], and DBP, DiBP, BzBP, TCEP and DEHP had been recommended
for inclusion in Annex XIV (List of substances subject to authorization)
of the EU’s REACH (Registration, Evaluation, Authorisation and
Restriction of Chemicals) regulations as of the 1st of June 2009 and the
30th of march 2010. [24]. Specific risk assessments for several phthalates
and OPEs have been published by the European Union (EU). These
assessments can be obtained via ORATS (the Online EUropean Risk
Assessment Tracking System), which contains risk assessment reports on
DBP (which is on the 1st priority list), DEHP, TCEP, DiNP, and DiDP
(which are all on the 2nd priority list), BzBP (3rd priority list), and TCiPP
and TDCPP (4th priority list) [25-30].
In general, the risk profiles of the phthalates DBP, DEHP and BzBP
indicate that there is little concern about exposure to these species from
the air in the indoor environment [26, 29, 30]. However, it is recognized
that exposure to DEHP from multiple sources (e.g. from baby food,
indoor air, indoor dust, toys, and other soft PVC products) is as a
possible cause for concern, especially in infants [26]. The phthalates are
strongly suspected to exhibit reproductive toxicity. Several animal

8
studies have shown that fetal exposure to DBP, DEHP and BzBP
correlates with a reduction in fetal testosterone levels, resulting in male
reproductive organ abnormality syndromes including anogenital distance
(AGD) and testicular dysgenesis (TDS)-like disorders, which are also
referred to as “phthalate syndrome” [31-34]. Recent research indicates
that in humans there is a possible relationship between the presence of
phthalate metabolites in maternal urine and AGD in boys [34-36]. In
humans, TDS is among the most common congenital disorders. The
TDS-like disorders (e.g. cryptorchidism and hypospadias) have been
shown to be related to phthalates (mainly DBP, DEHP and BzBP) in
several animal studies, indicating that increased exposure to these
compounds, individually or in combination, may cause similar effects in
humans [36, 37]. There are also a number of epidemiological studies that
suggest a possible correlation between exposure to phthalates and asthma
and airway diseases in children [1, 38].
In 1998, the chlorinated organophosphorous flame retardant TCEP was
classified as a hazardous compound by the world health organization
(WHO). It has subsequently been replaced by TCiPP [20, 39]. However,
an EU risk assessment report published in July 2009 concluded that there
is little or no need for further studies on the effects of TCEP or for
measures aimed at reducing human exposure to this species. The risk
assessment report also recommends that the trend towards decreased use
of TCEP be monitored and encouraged. The report also recognized the
potential carcinogenicity, high toxicity, and environmental persistence of
TCEP, even though it does not satisfy the PBT (persistence,
bioaccumulation and toxicity) criteria [25]. Both TCiPP and TDCP are
suspected carcinogens; the (in vitro) evidence for the carcinogenicity of

9
TDCP is somewhat stronger than that for TCiPP [27, 28]. OPEs have
also been reported to have other biological effects: TPP may cause
contact dermatitis in humans and has been shown to significantly reduce
cholinesterase activity in red blood cells [40, 41], both TBEP and TBP
have shown possible neurotoxicity in vitro, and TBP and TEHP may
cause skin irritation [42, 43].

10
2. Gas phase, suspended particles and dust With respect to their volatility, compounds can be divided into four
classes; very volatile organic compounds (VVOC), volatile organic
compounds (VOC), semi-volatile organic compounds (SVOC) and
particle-associated organic matter (POM). The WHO criteria used for
this classification are detailed in Table 2.1.
Table 2.1: Classification of indoor organic pollutants [44]
Description Abbrev. Boiling-point range* (°C)
Very volatile (gaseous) organic compounds VVOC < 0 to 50-100
Volatile organic compounds VOC 50-100 to 240-260
Semi-volatile organic compounds SVOC 240-260 to 380-400
Organic compounds associated with particulate matter or particulate organic matter POM >380
* Polar compounds appear at the higher end of the range Most phthalate and phosphate esters are classified as semi-volatile
organic compounds (SVOC) [6]. SVOC substances are known to adsorb
to solids such as airborne particles and settled dust, and are therefore
partitioned between the gaseous and particulate phases [45, 46]. The
dynamic distribution of these species between the air, suspended particles
and dust means that it is important to evaluate SVOC levels in dust as
well as in air in order to assess overall human exposure. Exposure occurs
by inhalation of SVOC in the gas phase and airborne particles and also
via dermal and oral uptake of settled dust [6].
11
3. Sampling 3.1. Air Sampling
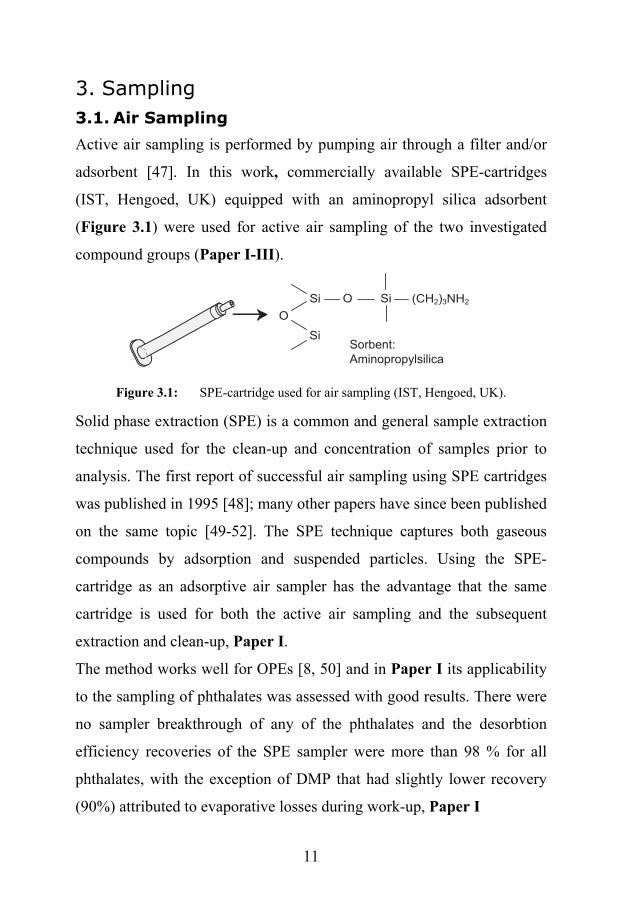
Active air sampling is performed by pumping air through a filter and/or
adsorbent [47]. In this work, commercially available SPE-cartridges
(IST, Hengoed, UK) equipped with an aminopropyl silica adsorbent
(Figure 3.1) were used for active air sampling of the two investigated
compound groups (Paper I-III).
Sorbent:Aminopropylsilica
OSiO
Si
Si (CH2)3NH2
Figure 3.1: SPE-cartridge used for air sampling (IST, Hengoed, UK).
Solid phase extraction (SPE) is a common and general sample extraction
technique used for the clean-up and concentration of samples prior to
analysis. The first report of successful air sampling using SPE cartridges
was published in 1995 [48]; many other papers have since been published
on the same topic [49-52]. The SPE technique captures both gaseous
compounds by adsorption and suspended particles. Using the SPE-
cartridge as an adsorptive air sampler has the advantage that the same
cartridge is used for both the active air sampling and the subsequent
extraction and clean-up, Paper I.
The method works well for OPEs [8, 50] and in Paper I its applicability
to the sampling of phthalates was assessed with good results. There were
no sampler breakthrough of any of the phthalates and the desorbtion
efficiency recoveries of the SPE sampler were more than 98 % for all
phthalates, with the exception of DMP that had slightly lower recovery
(90%) attributed to evaporative losses during work-up, Paper I

12
3.2. Dust Characterization and Sampling
Dust simply means “solid particles formed by crushing or other
mechanical breakage of parent material, larger than about 0.5 µm” [53].
The dust that is usually compared to indoor air samples is called house
dust. According to the US Environmental Protection Agency (US EPA,
1997), house dust is “a complex mixture of biologically derived material
(animal dander, fungal spores etc.), particulate matter deposited from
the indoor aerosol, and soil particles brought in by foot” [54]. Another
frequently used term is indoor settled dust, which is defined by the US
EPA (2008) as “particles in building interiors that have settled onto
objects, surfaces, floors, and carpeting. These particles may include soil
particles that have been tracked into the indoor environment from
outdoors as well as organic matter” [55].
Dust can be sampled in a number of different ways, including dust wipes
of surfaces, analysis of the contents of vacuum cleaner bags, using open
dishes to collect settling dust, and a
technique used in recent
publications involving a filter
mounted in a nozzle (Figure 3.2)
adapted to a vacuum cleaner that is
used to collect settled dust usually
from selected surfaces above the
floor [53, 56, 57]. This sampling
technique was used in Paper II.
The analyzed dust was sampled
from surfaces at least 0.8 m above the floor. This dust could be described
as surface-settled indoor dust or possibly just as surface dust.
Figure 3.2: Polypropylene nozzle with a filter mounted in styrene-acrylonitrile holder (Kriminalteknisk Materiel AB, Bålsta, Sweden).

13
There is a need for common guidelines regarding the sampling
methodology of dust [53, 58]. Furthermore, certified reference materials
would be useful for the development and evaluation of the sample pre-
treatment methods and the overall analytical method performance [58,
59].
Paper II describes the evaluation of OPE and phthalate levels in dust
samples from different indoor environments and presents a comparison
of the concentrations of these compounds observed in the dust samples to
those observed in air, sampled in parallel with the sampling of the dust.
The partitioning of compounds between the gas phase, airborne particles
and dust is complex. In some recent publications, the octanol-air
partitioning coefficient (KOA) has been suggested to be a useful
parameter for describing the partitioning and kinetic behavior of
semivolatile compounds in terms of their distribution between the gas
phase, airborne particles, and dust [3, 60].
In paper II, a weak correlation between air and dust concentrations was
found for five analytes: TBP, TCEP TCiPP DBP and BzBP. It has
previously been shown that there is a correlation between SVOC levels in
settled dust, in airborne particles, and in the gas phase [3, 60]. The weak
correlation found in Paper II is consistent with these results; the
weakness of this study was that the sampled dust was of unknown age
and that the amount of each analyte that originated solely from airborne
particles was unknown.
From an analytical perspective, dust is a complicated matrix. The utility
of highly-selective methods when analyzing such an intricate sample
such as dust is shown in Paper I and IV.

14
3.2.1. Dust Standard Reference Materials
Paper IV focuses on the analysis of the Standard Reference Material
(SRM) 2585 “Organic Contaminants in Indoor Dust,” which is produced
by the National Institute of Standards and Technology (NIST),
Gaithersburg, MD, USA. It originates from material collected from
vacuum cleaner bags from homes, motels, hotels and cleaning services in
Maryland, Montana, New Jersey, North Carolina, Ohio and Wisconsin
during the years 1993 and 1994. After collection, the material was
processed and sieved so as to exclude particles with a diameter in excess
of 100µm [61-64].
A wide range of environmental-matrix SRMs are available from the
NIST, including SRMs originating from air and diesel particulate matter,
mussel tissue, fish oil/tissue, and human serum [59]. Notably, three
different indoor dust SRMs can be obtained from the NIST (SRM 2583,
2584 and 2585). SRMs 2583 and 2584 (both of which are named “Trace
Elements in Indoor Dust”) were originally designed for use when
analyzing inorganic constituents (e.g. lead), while SRM 2585 is used for
organic contaminants in indoor dust (e.g. polycyclic aromatic
hydrocarbons, pesticides, polychlorinated biphenyls and polybrominated
biphenyl ethers); certified values of the levels of these constituents in the
reference material are available [63-66].
However, all three materials have been used for the determination of
organic constituents such as polybrominated biphenyl ethers (PBDE) and
some OPEs (TBP, TCEP, TCiPP, TDCPP, TBEP, TPP and TToP) [63,
67]. In Paper IV, the levels of the targeted OPEs and phthalates in SRM
2585 were quantified. However, none of the values measured for SRM

15
2583 and 2584 have been certified by NIST, and neither have the
concentrations of OPEs and phthalates in SRM 2585 [64-66].

16
4. Analytical Methods 4.1. Gas chromatography
In gas chromatography (GC), compounds are separated on the basis of
their partitioning between a stationary solid phase and a mobile gas
phase. Nowadays, the most widely-used GC column type is the open
tubular column. The inner surface of the column is coated with a thin
film of the stationary phase; in the studies described herein, the stationary
phase was made of the non-polar polymer polydimethylsiloxane in which
5% of the methyl groups had been replaced by phenyl groups.
The main criterion for separation with GC is that the compounds must be
volatile; it is thus suitable for use with substances ranging from very
volatile organic compounds (VVOC) to organic compounds associated
with organic matter (POM), as outlined in Table 2.1. The retention of a
compound on the chromatographic column is mainly dependant on its
vapour pressure and thus on its boiling point (the boiling point is strongly
associated with the vapour pressure of the compound). GC is the most
widely-used separation technique for the analysis of OPEs and phthalates
[58, 68]; it is used in conjunction with various detection techniques.
Some of the most important detection techniques used in the analysis of
phthalates and OPEs are described below.
4.2. Flame ionization detection
Flame ionization detection (FID) is a general and non-selective detection
technique. It is based on the combustion of the sample; this generates
organic ions, resulting in a measurable electric current whose magnitude
is approximately proportional to the compound’s carbon content [69].
Because of their simplicity and ability to detect almost all carbon-

17
containing organic compounds, FID detectors can be found in most
laboratories that use GC.
FID is very useful for method development and it is also good for
monitoring background levels in more complicated sample matrices such
as dust, since the background matrix may affect the response of selective
detection techniques and also increase degradation of the GC column.
However, for quantitative analysis, more selective detectors are
preferred, since FID cannot be used to unambiguously identify the
detected compound.
4.3. Nitrogen phosphorous detection
The nitrogen phosphorus detector (NPD) is a modified FID in which a
ceramic bead containing an alkali metal (usually rubidium or caesium) is
placed into the eluent gas stream. NPD has a specific response for
nitrogen and phosphorus; together with its relatively high sensitivity, this
makes it especially useful for the analysis of many pharmaceuticals and
environmental samples containing nitrogen- or phosphorus containing
compounds.[69, 70]
The main disadvantage of NPD is that the performance of the detector
deteriorates with time and that the rubidium- or caesium-containing bead
needs to be changed regularly [69, 70]. NPD is the most widely-used
detection technique in quantitative OPE analysis[71], but it is not suitable
for combined analyses of OPEs and phthalates. These disadvantages,
together with the need for more secure simultaneous identification of
both compound groups prompted our use of a mass spectrometric
detection system, as described in Papers I -IV.

18
4.4. Mass spectrometric detection
For most GC detectors, compounds are identified solely on the basis of
their retention times – this holds for the FID and the NPD detectors
discussed above. Mass spectrometry (MS) can be used to obtain
structural information on the desired analyte; depending on the ionization
mode used and the monitoring of specific ions, high specificity can be
achieved and information on the chemical structure of the compound can
be obtained.
A mass spectrometer has three primary functional units: the ionization
source, the analyzer, and the detector. In GC/MS the ionization source
converts the gaseous neutral eluted analyte molecules into ions. The
analyzer selects specific ions or allows the passage of a range of ions
within a mass to charge (m/z) window defined by the operator. The last
unit is the detector, which monitors the number of ions that have passed
through the analyzer.
Commonly-used ionization techniques in GC/MS are Electron Ionization
(EI) and Chemical Ionization (CI). The latter can be operated in both
positive (Positive ion chemical ionization, PICI) and negative (mainly
electron capture negative ionization, ECNI) ionization mode. Two
ionization techniques were used in this work, EI and PICI and the
performance of the two methods is compared in Paper I.
4.4.1. Electron ionization
In Electron ionization (EI), the molecules eluting from the GC are
exposed to a beam of 70 eV electrons emitted from a heated filament.
The interaction of these electrons with the molecule results in the ejection
of one of the molecule’s own electrons, turning it into a cation with an
odd number of electrons (i.e. the molecular ion). EI is a “hard” ionization

19
technique; the relatively high energy of the electrons not only ionizes the
molecule but also causes it to fragment. At the standard 70 eV, this
fragmentation generates a characteristic “fingerprint” spectrum for the
molecule in question, making it possible to identify specific analytes by
comparing experimental spectra to spectral libraries. The presence of
specific fragmentation patterns also allows experienced interpreters of EI
mass spectra to obtain useful insights into the structural features and
potential identity of unknown analytes. In many cases, GC/MS in EI
mode is used as a complement to other detection techniques when
confirmation of the identity of a specific analyte is needed.
The limitation of EI is that since it is a hard ionization technique, the
molecular ion seldom survives and so information on the molecular
weight of the compound is lost. To obtain the molecular ion, a “softer”
ionization technique is often required. One such “softer” ionization
technique that is often used to complement EI is Chemical Ionization.
4.4.2. Chemical ionization
Chemical ionization (CI) is achieved by introducing a reagent gas into
the ion source. Upon electron ionization, the reagent gas is ionized and
form positively charged ions, gaseous Brønstedt acids, by H-
abstraction.[72] The most common reagent gas used in CI is methane,
which forms the reactant ions CH5+, C2H5
+ and C3H5+ [72, 73]. These
gaseous ionic acids primarily react by proton transfer with analyte
molecules that have a higher proton affinity than they do; the proton
affinity of methane is 131.6 kcal/mol [72].
The ionization efficiency for phthalates and OPEs when using methane
as reagent gas was evaluated in Paper I. This paper includes a
comparison of methane and isobutane as reagent gases. Isobutane has a
20
proton affinity of 195.9 kcal/mol; its main reagent gas ion is C4H9+ [72,
73]. The higher proton affinity of isobutane means that ionization with
this gas is “softer” than ionization with methane. As a result, the
molecular [M+H]+ ion was observed almost exclusively for all of the
targeted compounds (Paper I). The softer ionization results in more of
the molecular ions reaching the detector which not only facilitates
identification of a compound but also opens the possibility of using
tandem mass spectrometry (MS/MS).
An alternative to isobutane is ammonia (Paper IV), which has a proton
affinity of 204.5 kcal/mol. In this case the main reagent gas ions are
NH4+ and [NH4+NH3]+. In addition to proton transfer, electrophilic
addition [M+NH4]+ often occurs when ammonia is used as reagent gas
[72, 73]. Some electrophilic addition occurred for the OPEs, notably
TCEP, TCiPP, TDCPP, TPP and TToP. In the case of the phthalates,
electrophilic addition could be minimized by increasing the temperature
in the ion source (Paper IV).
4.4.3. Quadrupole analyzer scan modes
An MS quadrupole analyzer system may be equipped with one or three
quadrupoles; such instruments are referred to as single quadrupole and
triple quadrupole instruments, respectively. The quadrupole transmits
ions of a specific m/z (mass to charge ratio) by applying a fixed direct
current (DC) and a radio frequency (RF) voltage to four steel rods
arranged in parallel. The DC polarity of the rods shifts and thus guides
the resonant ion through the analyzer in a tumbling rotating manner. The
ions outside the selected m/z ratio region will not be resonant and will
therefore hit the rods and discharge.

21
The instrument can be set to scan a range of m/z ratios (full scan mode,
FS), or to scan discrete m/z ratios in selected ion monitoring mode (SIM).
When analysing small molecules in GC/MS, the full scan range is usually
limited to 35–600 m/z. A triple quadrupole instrument consists of three
sequential quadrupoles (Q1q2Q3). The first and third quadrupole are used
as analyzers, while q2 is operated in RF-only mode and serves to guide
the ions from the first to the third quadrupole. By introducing a collision
gas (e.g. nitrogen, helium or argon) into the second quadrupole (q2), it
can be used as a collision cell, where ions are further fragmented — a
technique called collision induced dissociation (CID). As shown in
Figure 4.1, the triple quadrupole instrument can be operated in four
different tandem mass spectrometry scan modes: precursor ion scan,
product ion scan, neutral loss, and selected reaction monitoring (SRM).
Ionization Q1 q2 Q3 DetectionEIPICI
FS scan range RF-onlyRF-only
Scan modes
SIM discrete scan RF-onlyRF-only
Product ion scan discrete scan scan rangeCID
Neutral loss scan range scan range - XCID
Precursor ion scan scan range discrete scan CID
Argon
Methane IsobutaneAmmonia
SRM discrete scan discrete scanCID
Figure 4.1: An overview of the scan modes that can be utilized on a triple quadrupole instrument; FS, SIM, precursor ion scan, product ion scan, neutral loss and SRM. The ionization modes, reagent gases, scan modes and collision gas used in this work are marked in bold.

22
Full scan mode (FS) is useful for identifying compounds using spectral
library searches and also for identification on the basis of fragmentation
patterns. Data treatment of the chromatogram that originates from FS,
such as reconstructed ion chromatogram (RIC), where a chromatogram
are reconstructed by viewing the signal of a specific ion or ions, can be
used when the compound is known and decomposed into a specific
fragment (m/z). When operated in SIM mode, the mass spectrometer only
allows the passage of ions falling within an operator-defined m/z window
through the analyzer (Figure 4.1). This has the advantage of increasing
the signal for the selected ions due to the higher duty cycle of those ions.
SIM detection also results in noise reduction and thus increased
selectivity of the analysis. The technique is often sufficient for
identification and generally achieves adequate quantification limits in
quantitative analysis.
Three of the tandem mass spectrometry scan modes (precursor ion scan,
product ion scan, neutral loss) are predominantly used for identification,
for obtaining structural information, and for mass analysis evaluation
purposes. Precursor ion scan (Figure 4.1) can be used when identifying a
compound group with a common specific fragment (e.g. phthalates) and
to obtain structural information by relating primary ions to fragment
formation. Neutral loss (Figure 4.1) scanning provides a means of
identifying, e.g. a group of compounds in a complex mixture that all lose
a common neutral fragment during fragmentation. Product ion scan,
which detects all of the secondary ions formed from a single primary
precursor ion (Figure 4.1) provides structural information and facilitates
the selection of suitable product ions for SRM mode, e.g. m/z 149 for
most phthalates and m/z 99 for most OPEs, as described in Paper I. As

23
for SIM, the duty cycle is almost 100% when using a triple quadrupole
instrument in SRM mode and the noise reduction is even higher.
With the exception of dimethyl phthalate, all of the phthalates examined
yielded a characteristic ion with m/z 149 in EI. This ion arises from the
sequential loss of both the substituent groups by cleavage of the ester
bonds and subsequent formation of a phthalic anhydride ion.[74] The
occurrence of the stable m/z 149 ion in conjunction with suitable
additional confirmation ions makes SIM mode a favourable choice for
phthalates [68, 74].
Analogously to the phthalates, most OPEs in EI undergo a characteristic
fragmentation that generates an ion with m/z 99. This ion is formed by
three consecutive hydrogen rearrangements (“Mcafferty+1”) of the
molecular ions, yielding a protonated phosphoric acid ion [74].
However, the relatively low mass of the m/z 99 ion hampers both
qualitative and quantitative analysis, because matrix constituents
introduce significant noise into the low mass region of the spectrum [58,
75] and less-abundant fragment ions such as those arising from the loss
of one substituent are used in EI-SIM analysis [67, 76]. In Paper I, PICI-
SRM was demonstrated to be a highly specific scan mode whose high
selectivity makes it possible to analyze specific compounds in complex
mixtures without having to completely purify the samples.

24
4.5. Discussion — analytical determination
The determination and analysis of OPEs and phthalates presents a
number of analytical challenges. In particular, blank contamination
problems are common when working with phthalates [77].
The quantity of phthalates in the blanks was reduced in all studies
described in papers I-IV by minimizing surface contact during sample
handing, by cleaning all glassware and by avoiding the use of plastic
materials where possible; the only plastics used were those in the SPE
cartridges, which were used for air sampling in papers I-III and for
clean-up in paper IV. The possibility that the SPE cartridges might be a
source of blank contamination was investigated in detail by analysis of
blank samples and by extraction. Neither provided any evidence that the
SPE cartridges were a significant source of either phthalates or OPEs.
Additional measures were taken to minimize contamination, such as
changing the septa on the sample vials after each injection and always
performing at least three solvent injections prior to the analysis by GC-
MS when the instrument had been idle for a period of time.
In papers I-IV, the analyte concentrations reported for each
experimental sample were corrected by subtracting the amount of the
corresponding compound observed in the blank samples. Furthermore, a
given compound was only considered to have been detected if its
concentration was more than three times the standard deviation of the
concentration observed in the procedural blanks (Paper I-IV).
Blank problems are also encountered when working with OPEs, to at
least some extent, and so for compounds with detectable blank levels the
same approach as with the phthalates was used. The OPEs are a relatively
heterogeneous group of compounds because of the varied properties of

25
their substituents. This presents some analytical problems: their relatively
high polarity and their tendency to interact with glass surfaces make them
very susceptible to decreased instrumental performance and column
degradation that necessitates regular maintenance. Increased tailing with
time is common for the alkyl chain OPEs especially the short chain
OPEs; TCEP, TDCPP and TBEP are particularly strongly affected by
column/injector liner degradation, and exhibit a noticeable decrease in
response with time.
A particular advantage of using mass spectrometry for determination and
detection rather than NPD detection is that one can use deuterated
standards for determination. However, the commercial availability of
such compounds is sparse. The only presently available standard is
deuterated tributyl phosphate (d27-TBP) (used as an internal standard in
papers I-IV) and deuterated triphenyl phosphate (d15-TPP). The
availability of an analogous deuterated reference for TBEP would be
particularly beneficial, as described in Paper IV. Determination with
CG/PICI-SRM was found to yield a clean chromatographic profile with
high selectivity and low limits of detection and quantification (LOD and
LOQ, respectively), as described in Papers I and IV. The high
selectivity of this method is illustrated in Figure 4.2.

26
EI-FS (TIC)
RIC m/z 149
RIC m/z 99
PICI-SRMx50 x30 x50 x10 x50 x5
BzBP
DEHP
DMP
DEP DiBP
DBPTPrP (VS)TiBP TBP
TCEP
TCiPP
THP (VS) TDCPP
TBEP
TPP
BzBP
DEHP
DMP
DEPDiBP
DBP
x5 x10 x5 x5 x2
Figure 4.2: Comparison of chromatograms of Indoor Dust (SRM 2585) acquired
using different MS modes. EI-FS = full scan MS analysis, RIC m/z 149 for phthalate detection, RIC m/z 99 for OPE detection, PICI-SRM (isobutane) selective detection of OPEs and phthalates, Paper I.

27
Three different reagent gases were examined in the course of this work:
methane and isobutane in Papers I-III, and ammonia in Paper IV. All
three gases gave similar results in terms of selectivity and LOQ (defined
as the quantity for which the signal to noise ratio, S/N, was >10) with
isobutane yielding superior performance to methane, as discerned in
Paper I. In the study described in Paper IV, ammonia was shown to
perform better than the other two reagent gases, as shown in Table 4.1
(Papers I and IV).
Table 4.1: LOQs of determinations of the indicated compounds observed using CI-MS/MS with methane, isobutane, or ammonia as the reagent gas.
CI-MS/MS methane*
CI MS/MS isobutane*
CI MS/MS ammonia*
Phosphates TEP 30 8 0.5 TiPrP 10 10 0.1 TPrP 7 7 0.1 TiBP 6 9 4 TBP 4 7 7 TCEP 10 10 6 TCiPP 10 10 10 TPeP 4 4 5 THP 6 7 2 TDCPP 200 200 50 TBEP 100 100 20 TPP 20 8 4 DPEHP 30 30 2 TEHP 20 20 8 TToP 7 5 20
Phthalates DMP 10 3 1 DEP 20 10 2 DiBP 10 10 1 DBP 10 10 20 BzBP 30 20 1 DEHP 20 20 6 DnOP 20 20 4
*All values are in pg

28
When using ammonia as the reagent gas, a reduced LOQ was achieved
for all but a few compounds. Notably, the LOQs for TiPrP and TPrP
were reduced 100- and 70-fold, respectively, while those of TEP, DPEP,
DiBP and BzBP were reduced by factors of 10-20 and those of eleven
other analytes were reduced by at least a factor of two compared to those
achieved when using isobutane as reagent gas.
An exception was TToP, which exhibited a higher LOQ when using
ammonia as reagent gas. This compound undergoes electrophilic
addition, forming two precursor ions, [M+H]+ and [M+NH4]+; of the two,
the latter has a somewhat higher response, which contributes to the
increased LOQ. However, using the [M+NH4]+ as precursor ion did
present an advantage in terms of selectivity for TToP. The quasi-
molecular ions of TToP are not susceptible to collision-induced
dissociation and do not form any suitable fragment regardless of collision
energy (Paper I and IV). However, the [M+NH4]+ ion loses ammonia
and yield the [M+H]+ as a product ion (Paper IV). Thus, by using the
ammonia adduct ion as precursor ion, the selectivity can be increased by
introducing a double criterion: co-eluting compounds must be susceptible
to electrophilic addition and be stable.
The comparison between ammonia and isobutane was performed using
two different GC/MS systems, a TSQ 7000 MS system (Paper I) and a
Varian 320 triple quadrupole MS system (Paper IV), and this may be the
cause of some of the observed differences; in particular, the lower
quantification limits of the phthalates is mainly due to a reduced
instrumental background. There were also indications that isobutane is
more prone to contaminate the ion source and analyzer assembly,
whereas ammonia, due to its corrosive nature, makes the instrument

29
“self-cleaning”— modern MS instruments with stainless steel tubing and
connectors are in general designed to withstand chemical ionization using
ammonia as reagent gas.
In both Papers I and IV the standard calibration curves exhibit a slight
curvature. This is a potential problem if the concentrations of the
compounds in the sample span over a wide range, since it would
necessitate a tedious series of dilutions to bring their concentrations into
a suitable range. In Paper I, it was shown that this curvature can largely
be compensated for by using internal standards, which extended the
linear range from ~2000 pg to 4000 pg. The air samples in Paper III
were quantified by using relative response factors from multiple
calibration levels covering the entire range of concentrations observed in
the samples. As discussed in Paper IV, both polynomial quantification
and linear regression quantification with two adjacent calibration points
gave equivalent results even for compounds present in high
concentrations (e.g. DEHP ~10 ng).
The methods of quantification used in Paper II differed slightly from
those used in Paper I. In Paper II, TPeP and 13C2-DPeP (13C2-dipentyl
phthalate) were used as internal standards, and quantification was
performed using relative response factors using single point calibration
against a standard with a concentration of ~600 pg for the OPEs and
~1300 pg for the phthalates. This could potentially decrease the accuracy
of the determination, but most of the analytes were well within the linear
range.
The only analytes in Paper II that were above ~2000 pg in the analysed
sample were DEP and DBP in the air samples and also DEHP and TBEP
in the dust samples. There is a possibility that these compounds might be

30
slightly overestimated when present at concentrations above ~1000
ng/m3 in air or 600 µg/g in dust. However, the determined median
concentrations of these three phthalates in Paper II are consistent with
current literature, as shown in Table 5.1 and Table 5.4
31
5. Organophosphates and phthalates in indoor air and dust
5.1. Air samples
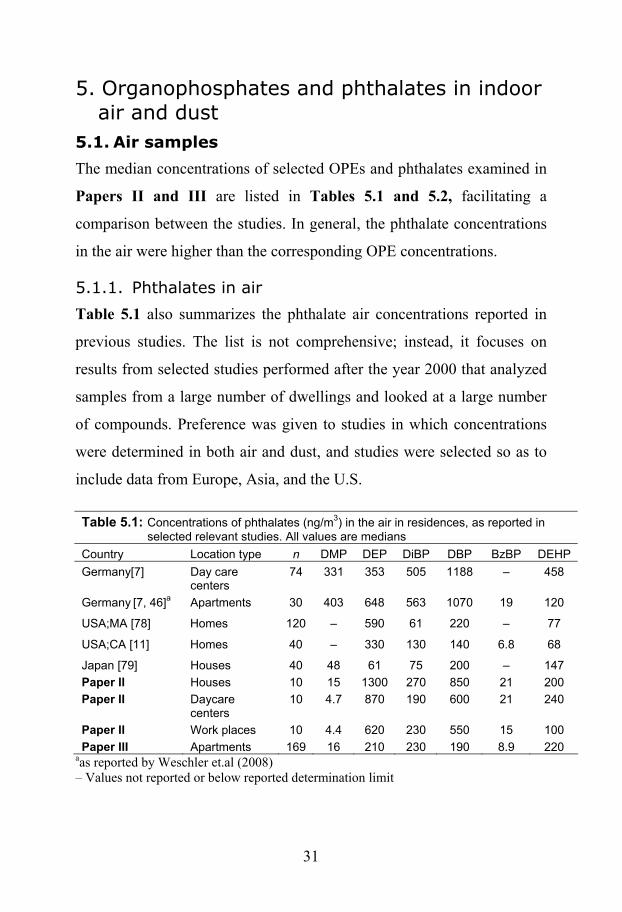
The median concentrations of selected OPEs and phthalates examined in
Papers II and III are listed in Tables 5.1 and 5.2, facilitating a
comparison between the studies. In general, the phthalate concentrations
in the air were higher than the corresponding OPE concentrations.
5.1.1. Phthalates in air
Table 5.1 also summarizes the phthalate air concentrations reported in
previous studies. The list is not comprehensive; instead, it focuses on
results from selected studies performed after the year 2000 that analyzed
samples from a large number of dwellings and looked at a large number
of compounds. Preference was given to studies in which concentrations
were determined in both air and dust, and studies were selected so as to
include data from Europe, Asia, and the U.S.
Table 5.1: Concentrations of phthalates (ng/m3) in the air in residences, as reported in selected relevant studies. All values are medians
Country Location type n DMP DEP DiBP DBP BzBP DEHP Germany[7] Day care
centers 74 331 353 505 1188 – 458
Germany [7, 46]a Apartments 30 403 648 563 1070 19 120
USA;MA [78] Homes 120 – 590 61 220 – 77
USA;CA [11] Homes 40 – 330 130 140 6.8 68
Japan [79] Houses 40 48 61 75 200 – 147 Paper II Houses 10 15 1300 270 850 21 200 Paper II Daycare
centers 10 4.7 870 190 600 21 240
Paper II Work places 10 4.4 620 230 550 15 100 Paper III Apartments 169 16 210 230 190 8.9 220
aas reported by Weschler et.al (2008) – Values not reported or below reported determination limit

32
These studies show that the most abundant compounds are DEP, DiBP
and DBP. This is probably due to with their relatively high volatility and
widespread and large-scale use in a variety of products, (Paper II–III).
5.1.2. Organophosphates in air
Table 5.2 summarizes the OPE concentrations in air reported in previous
studies and the studies in Papers II and III. Again, the list is not
comprehensive and only includes data from larger studies in which
sampling were conducted at multiple locations. Data from screening
studies with only single or double measurements at various locations
were excluded. Several such screening studies have been performed in
Sweden [8-10, 17, 80, 81]; their results and those of similar studies have
been summarized by Reemtsma et al. [5].
Table 5.2: Air concentrations of OPEs (ng/m3) in residences as reported in selected relevant studies. All values are medians
Country Location type n TEP TiBP TBP TCEP TCiPP TBEP Japan [82] Houses 18 2.4 – 4.0 1.3 1.9 1.8 Japan [82] Office building 14 3.2 – 6.6 3.3 6.0 1.0 Japan [79] Houses 41 62 – 27 15 89 23 Paper II Houses 10 7.3 13 9.1 4.8 5.6 – Paper II Day care centers 10 1.7 7.2 18 25 8.4 84 Paper II Work places 10 6.5 7.3 2.3 10 100 5.8 Paper III Apartments 169 4.4 8.6 11 3.7 14 –
– Values not reported or below reported determination limit Table 5.2 does not contain any data on TiPrP, TPrP, DPEHP, TEHP,
TPP and TToP as none of these compounds were frequently detected in
the air samples collected in the studies described in Papers II and III or
in any of the other studies presented. That is to say, these compounds are
not often found in indoor air samples. TDCPP is also excluded although
this compound was detected in workplaces with a median concentration
of 28 ng/m3 in Paper II. The compounds with the highest concentrations

33
in air in the study described in Paper II were TCiPP, with a median
concentration in workplaces of 100 ng/m3, and TBEP, with a median
concentration in daycare centers of 84 ng/m3. The air concentration of
OPEs differs a lot between studies and locations, as shown in Table 5.2.
Paper II describes a screening study in which sampling was conducted at
various types of locations: private homes (n = 10), work places (n = 10),
and daycare centers (n = 10). The selected locations were prone to natural
variation, i.e. the home environments were furnished and designed by the
owners, and the buildings differed in both age and construction. The
work environments ranged from small single-office rooms to landscape-
designed offices and workshop-like environments. The daycare centers
were similar in terms of indoor design and furniture but exhibited a
degree of variation in terms of age and construction that is representative
of day care centers in Stockholm.
The results showed that there were similarities in the OPE concentration-
profiles observed within individual environment types (intra-
environment) but significant differences between environment types
(inter-environment), as can be seen in the principal component analysis
(PCA) plots in Figure 5.1.
No significant differences were found between the environment types
with respect to phthalate concentration. The inter-environment
differences in the OPE profiles were due to the high concentrations of
TCiPP in work places and TBEP in day-care centers (Paper II).

34
0.8
0.6
0.4
0.2
0
-0.2
-0.4
-0.610.80.60.40.20-0.2-0.4
PC
2 (1
8%)
PC 1 (23%)
TEP
TiBP TBP
TCEP
TCiPP
TDCPP
TBEP
TPP DPEHP
0.4
0.3
0.2
0.1
0
-0.1
-0.2
-0.30.40.30.20.10-0.1-0.2-0.3
PC
2 (1
8%)
PC 1 (23%)
W01 W02
W03
W04 W05
W06
W07
W08
W09 W10
D11 D10 D09 D08 D07
D06
D05
D04
D02
D01
H10
H09
H08
H07
H06
H05
H04
H03 H02 H01
Single family houses (B)Day care centres (D)Workplaces (W)
Figure 5.1: PCA scores and loadings of OPEs in air samples from workplace
(W), day-care (D) and private home environments (H). Left panel – scores. Right panel – loadings. The data from each location (sample) were normalized against the highest measured concentration of each analyte to facilitate comparison of the relative amounts of the analytes (profiles) in the samples.
Paper III describes a study conducted in collaboration with the “Healthy
sustainable houses” (3H) project conducted in Stockholm [83, 84]. Air
sampling was performed in a large selection of multi-story apartment
buildings (n = 45). The apartment buildings selected for sampling had
previously been classified as high or low risk with respect to “sick
building” symptoms (SBS) in the course of the 3H project [85]. The term
“sick building syndrome” is commonly used to describe situations where
the occupants of a building experience acute health and comfort
problems that appear to be linked to time spent in a building, but where
no specific illness or cause can be identified [86, 87]. For comparative
purposes, the concentrations of airborne OPEs measured in Paper III
have been projected onto the PCA scores plot for the corresponding data
presented in Paper II (Figure 5.2). The scores plot could be interpreted
to mean that the apartment buildings exhibit characteristics similar to
those of both single family houses and workplaces and/or that the
variation in TCiPP concentration in the apartments is comparatively

35
large. No significant correlation was found between the classification of
the buildings (in terms of the incidence of sick building symptoms) and
the measured concentrations of phthalates or OPEs in the air.
−0.6 −0.4 −0.2 0 0.2 0.4 0.6 0.8
−0.5
0
0.5
TEP
TiBP TBP TCEP
TCiPP
TDCPP
TBEP
TPP DPEHP TToP
PC 1 (23 %)
PC 2
(18
%)
−0.3 −0.2 −0.1 0 0.1 0.2 0.3
−0.3
−0.2
−0.1
0.1
0.2
0.3
0.4
H01 H02 H03
H04
H05
H06
H07 H08
H09
H10
D01
D02
D04
D05
D06
D07
D08
D09 D10
D11
W01
W02
W03
W04 W05
W06 W07
W08
W09 W10
PC 1 (23 %)
PC 2
(18
%)
Single family houses (H)Day care centres (D)Workplaces (W)Low−risk apartmentsHigh−risk apartments
0
Figure 5.2: Concentrations of OPEs measured in apartment buildings, projected onto
the PCA scores of OPEs in air samples reported in Paper II. Left panel – scores. Right panel – loadings. The data from each location (sample) were normalized against the highest measured concentration, as before.
Within each of the 45 buildings, sampling was conducted in 4
apartments, making it possible to compare inter- and intra-building
differences. The previous risk classification had been made on a per-
building basis. Consequently, the identification of significant, significant
differences in airborne compound concentrations between buildings
relative to those observed within the buildings is probably a necessary
prerequisite for identifying correlations between the risk classifications
and the measured airborne compound concentrations. Most of the
variance was associated with differences between apartments, indicating
that a correlation with the risk classification of the buildings is unlikely,
Paper III.

36
The distribution of the variance was investigated using nested analysis of
variance (ANOVA), five compounds whose concentrations might show
significant differences between buildings were identified: TCiPP, DEP,
DBP BzBP and DEHP. For these five compounds, the distribution of the
variance (between buildings, between apartment and between the
duplicate samples) is displayed in Table 5.3 illustrating the high
apartment variance, Paper III.
Table 5.3: Distribution of variance between buildings, apartments and duplicate analyses.
Between buildings (%) Between apartments (%) Duplicates (%)
TCiPP 11.3 84.6 4.1
DEP 17.2 82.4 0.4
DBP 27.5 70.6 1.9
BzBP 25.3 73.1 1.6
DEHP 43.7 44.8 11.5
TBP has previously been found be associated with mucosal sick building
symptoms [79], and epidemiology studies have found correlations
between phthalate concentrations and asthma in children [1, 38]. The
study described in Paper III does not support these results, although the
analysis was limited in that the incidence of symptoms was reported in
terms of single frequencies for occupants in the building as a whole, and
SBS data was not available on a per-apartment basis.
37
5.2. Dust samples
The dust concentrations of selected OPEs and phthalates examined in
Papers II and IV are listed in Tables 5.4 and 5.5. In general, the
phthalate concentrations in the dust were higher than the corresponding
OPE concentrations. One organophosphorus compound, TBEP, can be
found in levels in the same order of magnitude as the phthalates.
5.2.1. Phthalates in dust
Table 5.4 shows the phthalate concentrations measured in previously-
reported studies conducted at various locations around the world, those
determined in indoor dust from the locations described in Paper II, and
those measured in SRM 2585 as reported in Paper IV. The previous
studies whose results are presented in this table were selected using the
same criteria as were used when compiling data on airborne phthalate
concentrations. The samples were taken from vacuum cleaner bags
unless otherwise stated (in some cases, samples were acquired by filter
sampling or with a nylon sock). In general, samples were collected from
the floor with the exception of those labeled “surf,” which were taken
from selected surfaces above the floor. Data on DMP and DnOP
concentrations were excluded from the summary. Because of its high
volatility, the concentrations of DMP in dust were typically below 2 µg/g
[7, 46] (Papers II and IV), and the concentration of DnOP was generally
not reported in the selected studies; the only determination of this
compound in the studies examined is that reported for SRM 2585 in
Paper IV (17µg/g).

38
In general, DEHP is the most abundant of the phthalates examined in the
selected studies (Table 5.4). Interestingly, the concentration of DBP in
the Swedish study was noticeably higher than those measured in studies
conducted elsewhere (including its neighbor, Denmark). Furthermore, the
concentration of DiBP in home environments is around ten times higher
in Western Europe than in Japan and the US; the only exceptions to this
finding were single family detached/terrace houses and the daycare
centers, which had DiBP concentrations similar to those observed in
Japan and the US, Table 5.4 (Paper II).
Table 5.4: Dust concentrations of phthalates (µg/g) in residences as reported in selected relevant studies. All values are medians unless otherwise stated
Country Dust description n DEP DiBP DBP BzBP DEHP
Germany [6, 88] (H) < 63µmc 286 – 34 49 49 740
Germany [6, 89] a (H) < 2mmc 199 – 22 42 15 416
Germany [7, 46] b (H) 30 6 36 47 29 659
USA:MA [78] (H) < 150µmc 120 5.0 1.9 20 45 340
Japan[79] (H) Surf. 41 0.4 2.4 22 2.4 1200
Japan[79] (H) 41 0.3 2.9 20 4.2 880
Denmark; [90] (H) FS 497 1.7 27 15 3.7 210
Denmark; [90] (D) FS 151 2.2 23 38 17 500
Sweden[56] (H) Surf., FS 346 – 45 150 135 770
Paper II: (H), Surf., FS 10 3.7 4.0 130 17 680
Paper II: (D) Surf., FS 10 4.2 2.6 150 31 1600
Paper II: (W) Surf., FS 10 20 37 100 8.8 1100
Paper IV SRM 2585c, d 7 6.7 6.0 31 93 570
– Values not reported or below reported determination limit aas reported by Wensing et. al (2005) bas reported by Weschler et.al (2008) cSamples are sieved, (SRM 2585 <100µm) dMean value of 7 replicates H: home environment; D: daycare centers; W: Workplaces; Surf.: Sampling performed only on surfaces above the floor; FS; A nozzle sampler similar to that shown in Figure 3.2 was used.

39
5.2.2. Organophosphates in dust
The concentrations of OPEs in dust are summarized in Table 5.5. There
are no obvious similarities or differences in terms of concentrations
between the different studies. In general, the analyte with the highest
concentration in dust is TBEP. The levels of TBEP in dust collected from
daycare centers was particularly high, see Table 5.5. In the Japanese
study by Kanazawa et al., the concentration of TBEP in dust samples
collected directly from floors was ten orders of magnitude higher than
that in dust sampled from surfaces above the floor in the same apartments
[79]. This is consistent with the conclusion drawn in Paper II that TBEP
levels are related to flooring, and may originate from floor polishes [42].
Table 5.5: Dust concentrations of OPEs (µg/g) in residences as reported in selected relevant studies. All values are medians unless otherwise stated
Country Dust description n TBP TCEP TCiPP TDCPP TBEP TPP
Japan[79] (H) Surf. 41 1.1 9.8 51 22 164 14 Japan[79] (H) 41 1.4 7.5 19 4.0 1570 5.4 Belgium[67] (H) nylon sock 33 0.1 0.2 1.4 0.4 2.0 0.5 Paper II (H) Surf., FS 10 0.3 2.1 1.6 10 4.0 1.2 Paper II (D) Surf., FS 10 1.2 30 3.1 9.1 1600 1.9 Paper II (W) Surf., FS 10 0.2 6.7 19 17 87 5.3 SRM 2585 Paper IV a 7 0.2 0.8 0.9 2.3 82b 1.1 SRM 2585 Belgium study a 11 0.2 0.7 0.8 2.0 49 1.0
– Values not reported or below reported determination limit a Mean values of 7 and 11 replicates, respectively b Concentration also determined by standard addition in which case the measured value was 73±13µg/g H: home environment; D: daycare centers; W: Workplaces; Surf.: Sampling preformed only on surfaces above the floor; FS; A nozzle sampler similar to that shown in Figure 3.2 was used.
Paper IV presents an analysis of the house dust Standard Reference
Material (SRM) 2585 “Organic Contaminants in House Dust”. This work
further validates the extraction method used in Paper I and its use for the

40
quantification of OPEs and phthalates. The availability of certified
reference materials is very important for estimating the accuracy of the
data obtained using different sample preparation methods. The
concentrations of phthalates in SRM 2585 had not been determined prior
to the work described in Paper IV. Further work on the standardization
of these compounds in this reference material would be beneficial and
would make it possible to use this standard for quality control purposes
in future studies. In Figure 5.3, the concentrations of six OPEs in SRM
2585 determined in Paper IV (TBEP, TBP, TCEP, TCiPP, TDCPP, TPP
and TToP) are compared to the corresponding values measured by Van
den Eede et al. in the same material in a recent study [67]. With the
exceptions of TBEP and TToP, the two studies’ results are in good
agreement.
0102030405060708090
100
TBEP TBP TCEP TCiPP TDCPP TPP TToP
µg/g
dus
t
Van den Eede et. alPaper IV
0
0,5
1
1,5
2
2,5
3
µg/g
dus
t
Figure 5.3: Comparison between quantified amounts in SRM 2585. Bars in light gray
denote data obtained by Van den Eede et. al. Bars in dark grey denote data reported in Paper IV.
The determined concentrations of phthalates and OPEs in SRM 2585
“Organic Contaminants in House Dust” are summarized in Tables 5.4
and 5.5. Some compounds do not feature in these tables because they

41
were not detected or were detected at concentrations below their limit of
determination; TEP, TiPrP, TPrP, TiBP and TPeP also excluded are the
compounds had the quantified levels of; THP 0.25 µg/g, DPEHP 1.3
µg/g, TEHP 0.37 µg/g, TToP 0.74 µg/g, and DOP 17 µg/g, Paper IV.
The most abundant phthalate was DEHP, with a measured concentration
of 570 µg/g, followed by BzBP (93 µg/g) and TBEP (around 80 µg/g).
TBEP was determined using both external standard calibration and
standard addition the concentrations measured using these methods were;
82 ± 6.5 and 73 ± 13 µg/g, respectively. The differences in the
determined concentrations of TBEP indicate that analytical determination
of this compound is more unreliable. As mentioned earlier, the use of
deuterated reference compounds would enhance the accuracy of the
determinations. In the initial analysis of SRM 2585 in Paper II, the two
high molecular weight phthalates DiNP and DiDP were detected.
However, the determination method was never finalized for these two
compounds. By reviewing the data from Paper I, a rough estimate of the
number of dust samples that contained DiNP and DiDP was obtained;
93% of the 30 samples were observed DiNP and 73% contained DiDP.
Figure 5.4 shows PICI-SRM chromatograms for DiNP and DiDP.
Neither of these analytes was observed in the air samples, which is
consistent with their low volatility.

42
14 15 16 17 18
Time (min)
DiDP
DiNP
Figure 5.4: Chromatogram of a dust sample acquired in a workplace location (Paper
II) and analysed by PICI SRM. Top chromatogram: DiNP; bottom chromatogram: DiDP
5.3. Potential sources
Potential sources of the detected phthalates and OPEs were discussed in
Papers II and III:
• TBEP is generally associated with flooring and probably derives from
floor polish [42, 91] (Paper II).
• The chlorinated OPEs (TCiPP, TCEP and TDCPP) were mainly
associated with work environments (Paper II). This is slightly
contradicted by the data on multi-storey apartments where
concentrations up to 1200ng/m3 was determined, Paper III
• TBEP were mainly associated with day care centers in the location
study in Paper II
• The air concentration of BzBP increases significantly (p< 1·10-10)
with the number of PVC floors within an apartment (Paper III), and
indications of correlations between PVC flooring and airborne

43
concentrations were found for DEHP and DBP. This is consistent
with previously-published results of phthalates in dust [56].
• In Paper III, TBP and DBP correlated negatively (p < 1·10-4 and
1·10-6, respectively) with the age of the multi-storey apartment
buildings, indicating that these compounds are associated with
building materials. The data suggest that either the use of building
materials containing these compounds has declined or that their
emission from building materials decreases over time.
• There were indications that leather furniture might be a possible
source of TBP (Paper III).
• DiBP was detected in very high concentrations (11,000 ng/m3) in an
apartment whose inhabitant was manufacturing pillows containing
synthetic fiber material. (Paper III).
• The high variance between apartments within a building indicate that
building materials are not a major source of phthalates and OPEs
For more information and for further discussion of potential sources, the
interested reader is directed to the current literature [6, 17, 56, 82, 92-94].
5.4. Exposure
In Papers II and III, the primary objective was to determine the general
levels of the different compounds and to identify differences and
similarities in the concentrations of phthalates and organophosphates in
the different environments. The most abundant phthalates in the air and
dust samples (Paper II) were DEP, DBP, DiBP and DEHP; the most
abundant OPEs were TCiPP, TCEP, TDCPP and TBEP. The median
concentrations determined in paper II, can be used to estimate the daily

44
human exposure to OPEs and phthalates. The USEPA estimates human
inhalation exposure on the basis of the daily mean air inhalation volume
[55, 95]. For adults, this inhalation volume is 16 m3/day, while for
children between the ages of 2 and 6, it is 9.5 m3/day. The latter age
range is typical for children attending daycare centers in Sweden. The
USEPA has also estimated that children ingest 60 mg of indoor settled
dust/day. There is as yet no data on the ingestion of indoor settled dust by
adults, and so a value of 50 mg/day (corresponding to the general
tendency of soil ingestion), was used. In an English study by Harrad et
al., the percentage of time spent per day at home, at the office, in public
indoor environments, in the car and outdoors was estimated at 63.8, 22.3,
5.1, 4.1, and 4.5%, respectively [96]. Estimates were made on the basis
of two assumptions: that children spend the same amount of time at the
day-care centre as adults do at the office, and the uptake is 100%. The
estimated exposures are shown in Tables 5.6 and 5.7.
Table 5.6: Estimated exposure of adults from median concentrations in Paper II (µg/day)
Adult Home
(63.8%) Work
(22.3%) Exposure [µg/day] Ih (Dh)* IW(DW)* Itot (Dtot)* ∑ Exposure Phosphates
TCEP 0.05 (0.07) 0.07 (0.07) 0.08 (0.14) 0.23 TCiPP 0.06 (0.05) 0.21 (0.21) 0.41 (0.26) 0.68 TDCPP - (0.32) 0.19 (0.19) 0.10 (0.51) 0.61 TBEP 0.01 (0.13) 0.97 (0.97) 0.03 (1.1) 1.1
Phthalates DEP 13 (0.12) 0.22 (0.22) 15 (0.34) 16 DiBP 2.8 (0.13) 0.41 (0.41) 3.6 (0.54) 4.1 DBP 8.7 (4.2) 1.1 (1.1) 11 (5.3) 16 BzBP 0.21 (0.54) 0.1 (0.10) 0.27 (0.64) 0.91 DEHP 2.0 (22) 12 (12) 2.4 (34) 36
*I= inhalation exposure; D=dust ingestion

45
Table 5.7: Estimated exposure of children from median concentrations in Paper II (µg/day)
Child Home
(63.8%) Day-care
22.3% Exposure [µg/day] Ih ( Dh)* Ih ( DDCC)* Itot (Dtot)* ∑ Exposure Phosphates
TCEP 0.03 (0.08) 0.10 (0.40) 0.08 (0.48) 0.61 TCiPP 0.03 (0.06) 0.04 (0.04) 0.41 (0.10) 0.18 TDCPP - (0.38) - (0.12) 0.10 (0.50) 0.50 TBEP 0.003 (0.15) 0.28 (21) 0.03 (22) 22
Phthalates DEP 8.5 (0.14) 1.8 (0.06) 15 (0.20) 11 DiBP 1.8 (0.15) 0.40 (0.03) 3.6 (0.19) 2.4 DBP 5.6 (5.0) 1.3 (2.0) 11 (7.0) 14 BzBP 0.14 (0.54) 0.04 (0.10) 0.27 (0.64) 0.82 DEHP 1.3 (26) 0.51 (21) 2.4 (47) 50
*I= inhalation exposure; D=dust ingestion For some of these compounds, 70–99% of the exposure originates from
dust ingestion. Especially for children the exposure of TBEP and DEHP
through dust is relatively high and the high levels of TBEP in daycare
centers are of potential concern, Paper II. DEHP is known to have
several biological effects and was found to be one of the predominant
compounds in dust. The calculated daily exposure for an adult was
around 36 µg DEHP/day; that for a toddler was 50 µg DEHP/day. Thus,
an adult with a weight of 70 kg will have a daily exposure of 0.5 µg
DEHP/kg bodyweight, while the daily exposure for a toddler of 12 kg
will be around 4.2 µg DEHP/kg bodyweight. These levels should be
compared to the tolerable daily intake (TDI) of 37 μg per kg body weight
per day stated in 1998 by the EU Scientific Committee for Toxicity,
Ecotoxicity and the Environment (CSTEE) and the reference dose (RfD)
of 20 μg/kg body weight and day set by USEPA in 1999 [97, 98]. These

46
values are estimated for adults and do not, for example, take into account
dermal exposure from dust.
There are also interesting indications that exposure can occur via direct
air to skin transport [3]. Exposure to SVOC compounds in the indoor
environment is thus a complex phenomenon. Compounds in the gaseous
phase (Ca) are partitioned between airborne particles and dust, but are
also found on surfaces, furniture, in humans, and elsewhere. An adequate
exposure model cannot be obtained simply by considering partitioning
and assuming that equilibrium obtains. Instead, it is necessary to consider
the material balance (i.e. source and sink processes) and mass transport
kinetics in order to properly understand the prevalence and potential
health risks associated with SVOCs [3]. When discussing the biological
effects associated with daily exposure to compounds in our immediate
environment the topic of combination effects, also known as the “cocktail
effect”, is of great interest. This means that the biological effects of
combinations of toxic or potentially toxic chemicals have to be
considered as well as examining the effects of each compound separately.
Of the two compound groups studied in this work, the phthalates in
particular are suspected to give rise to combination effects [31, 99, 100].

47
6. Conclusions and future perspectives This work provides further support for the position that OPEs and
phthalates are ubiquitous indoor environment pollutants in both air and
dust. Papers I-IV clearly demonstrates the scope for simultaneous
sampling and analysis of both OPEs and phthalates. Phthalates
concentrations are consistently higher than the OPEs in both air and dust,
with the exception of TBEP that occurs in similar concentrations as
phthalates in dust.
The selective detection method using GC/PICI-SRM/MS for the
determination of phthalates and OPEs in air and dust presents a good
alternative to the conventional detection techniques GC/EI-SIM/MS and
NPD. It was demonstrated that both isobutane and ammonia are suitable
reagent gases for analysis of OPEs and phthalates, and that the latter
generates the lowest LOQs. (Papers I and IV).
The approach of sampling in different environments adopted in Paper II
generated interesting results in terms of the differences in the OPE
concentration profiles in the air samples from offices, day-care centers
and home environments. Consequently, the OPEs and phthalates present
in consumer products or building materials used in these different
sampled environments are similar even though the environments are
rather diverse in terms of design, building type and age. Further analysis
of the types of consumer products used in the different locations would
provide valuable context for these findings. The relatively high
concentrations of TBEP observed in day-care centers in Paper II is of
great interest, because they imply that small children in Sweden are
likely to be highly exposed to this compound through ingestion and
dermal uptake of dust.

48
In Paper III, no correlation was found between the measured
concentrations of phthalates and OPEs and the incidence of sick building
symptoms (SBS) in the inhabitants of specific buildings. Some of the
data implied interesting things about the sources of OPEs and phthalates,
among other things the levels of BzBP in air was correlated to the
number of PVC floors within an apartment.
The concentrations of twelve OPEs and seven phthalates in SRM 2585
“Organic Contaminants in House Dust” were determined in Paper IV.
SRMs are useful for validating and comparing the analytical method. The
results obtained in Paper IV were compared to those reported by van den
Eede et al. [67] for seven of the OPEs in the same reference material; the
results for five were in good agreement. The compounds that are in good
agreement can be used as a non-certified reference value of these
compounds in SRM 2585. The concentration of TBEP in SRM 2585
needs to be verified and the concentrations of the OPEs and phthalates
whose concentration in this reference material has not previously been
analysed would benefit from further work by another lab to assess the
accuracy of the determined values.
The study reported in Paper I revealed that two high molecular weight
phthalates, DiNP and DiDP, are present in SRM 2585. As such, further
studies on the incidence and abundance of these compounds would be of
great interest. DiNP and DiDP were not observed in the air samples
analyzed in Paper I but were prevalent in the dust samples; this
difference is probably attributed to their low vapour pressure.
Many of these compounds are potentially harmful for the health and that
some are adopted as candidates for restrictions by ECHA In future
studies alternative compounds for replacement to those included in this

49
thesis are of great interest. Some “non-phthalate” compounds are
entering the market to replace the potentially harmful “old” phthalates.
Two such compounds are diisononyl 1,2-cyclohexanedicarboxylic acid
(DINCH) and di(2-ethylhexyl) terephthalate (DEHT) [101]; levels of
these compounds in air and dust samples should be considered in future
studies.

50
7. Acknowledgement Först och främs skulle jag vilja tacka min handledare Conny Östman för
uppfinningsrika projekt och en aldrig minskande optimism. Min
biträdande handledare Ralf Torgrip trots att du inte är kvar på IAK så
har du alltid varit tillgänglig; både för trevliga PEK öl, givande
diskusioner men också för allmänt ”prat” om allt och ingenting. Min
första andra handledare Jonas B. för god instrument introduktion.
Jag skulle också vilja tacka alla medarbetare: inom projektet “Nya gifter
– Nya verktyg” speciellt Arne Jamtrot f.d. Jonsson (projektledare) och
också alla medarbetarna inom ”3H (Häsomässigt Hållbara Hus)
projektet”; Roger Corner (project manager), Gunnel Emenius, Magnus
Svartengren, Karin Engvall och Marie Hult m.fl. (för givande
samarbete och för möjligheten att delta i de olika projekten). Ett speciellt
tack till Rebecca Thulesson och Maria Zetterstedt (för ovärdelig
logistisk hjälp under lägenhetsprovtagningen).
Alla de som deltagit i provtaningarna Karin S., Ulrika F., Maria och
Thorvald (tidiga mornar, ut och in i hissar med pumpar och
dammsugare, det var tider det). Cindy (för din otroliga
organisationsförmåga och för att jag fick delta i den mycket intressanta
och lärorika ESF workshopen). Justina (för ditt glada humör och härligt
varma personlighet). A big thanks to my coauthor Steven Wise for SRM
dust contribution and more.
Ett extra tack till de som kom med värdefulla kommentarer på manuset:
Conny, Ralf, Magnus, Erik A., Roger, Gunnar T., Christoffer, Ninni,
Ulrika och Anders.

51
Tack till...
alla både de”gamla” och ”nya” på analytisk kemi för trevliga stunder.
Helena H. (You rock!). Johanna (en underbar vän, med goda råd och
mycket uppmuntran). Malin (min garderob har en helt ny dimension)
Leila (för roliga diskussioner, du har en ryggrad som är få förunnat).
Shahram (för att du alltid hade tid med ett vänligt ord på vägen). Nana
(en bättre rumskamrat finns nog inte, för glädje, vänskap och tålamod).
Thuy (for kindness and good, funny and sometimes strange Vietnamese
treats). Giovanna (for sweetness and good laboratory work).
Fredrik (Dr. Alda, vi ses på musslan!). Theres (för goda kakor). Gian
Luca (for good company during late work evenings). Stina C., Bosse,
Jenny, Yvonne, Ragnar, Leo, Christoffer och Yasar (för många glada
stunder). Petter O, Erik A. och Magnus (för supertrevliga afterwork,
keep it up). Axel (för trevliga biobesök och goda drinkar på Judit och
Bertil, ett favorithak nu). Sindra (min första rumskamrat, aldrig ett ont
ord trots tjattriga X-jobbare). Petter T. (TSQ:n har gått i himlen nu....
och tur är väl det!). Stina M. (för många goda skratt). Helena I. (Vi ses i
L-ö centrum!). De ”nya” Erik T, Trifa, Silvia och Liying (Lycka till
med doktorerandet!). Erik A. och Aljona (för trevligt rumssällskap).
...Jonas R. (tur att du kom tillbaka, institutionen var inte densamma utan
dig). Anita (för din otroliga vänlighet och många goda stunder på
kurslabb). Lena (utan dig hade det inte blivit nån tredje publikation, jag
är oändligt tacksam). Anne-Marie (Du fixar allt!). Ulla (för hjälp när det
behövs). Anders (för den här tiden) Ninni (för goda svamptips). Ulrika
(för goda råd om masspektrometri och fosfatestrar). Pol (for english help
and yummy mango) Gunnar (för att de bästa idéerna) Magnus — data
behandling får en ny dimension när man får hjälp av dig.

52
Jag skulle också vilja tacka..
... alla på miljökemi för trevligt bemötande under min instrumentlånetid.
Åke, tack för lånet! Ett litet speciellt tack till Johan (öppnar dörrar som
en kung) och Linda, Jessica och Emmelie (mina träningskompisar) och
sist men inte minst Ioannis för att du lät mig skruva, fixa och köra mina
sista prover och för all annan instrumnet hjälp jag fått av dig genom åren,
ovärdeligt!
...Mina icke kemist vänner som alltid lyssnat men oftast inte förstått ett
skvatt och är lika glada för det: Helene (vad skulle jag gjort utan dig),
Linnea (du lämnar ingen oberörd), Amelie (alltid lika go), Anna P.
(minns du larsbergsvägen) och Micke (för många underbara stunder).
...Goda ”kemist” vänner: Karin (ingen har väl lyssnat, stöttat och
uppmuntrat som du), Simina (för härligt hetsiga diskussioner). Lars (för
god provupparbetning och en härlig person).
..Min familj: Mamma och Pappa (för ert enorma stöd under studietid,
doktorandtid och livet i allmänhet). Mickan (min envisa, härliga alltid
stöttande syster) och Manuel (you know, for that thingamajig). Ove och
Ingrid (för goda middagar i bergshamra) och Marianne (för trevliga
kortspelskvällar, vem är envisast egentligen?).
Last but not least I would like to take the opportunity to thank the
department for a great time and for investing in me. This thesis was
financially supported by faculty funding through Stockholm University
and also through funds from the City of Stockholm Environment and
Health Administration and the Stockholm County Council.

53
8. References
1 Mendell, M.J. (2007). Indoor residential chemical emissions as risk factors for respiratory and allergic effects in children: a review. Indoor Air, 17: 259-277.
2 Werner, B. (2004). Plasicizers in the Indoor Environment, In Handbook of Plasticizers, Wypych, G., Ed.; ChemTec Publishing: Toronto, Canada, pp. 568-589.
3 Weschler, C.J. and Nazaroff, W.W. (2008). Semivolatile organic compounds in indoor environments. Atmos. Environ., 42: 9018-9040.
4 Garcia-Jares, C.; Regueiro, J.; Barro, R.; Dagnac, T.; Llompart, M. (2009). Analysis of industrial contaminants in indoor air. Part 2. Emergent contaminants and pesticides. J. Chromatogr. , A, 1216: 567-597.
5 Reemtsma, T.; Garcia-Lopez, M.; Rodriguez, I.; Quintana, J.B.; Rodil, R. (2008). Organophosphorus flame retardants and plasticizers in water and air I. Occurrence and fate. TrAC, Trends Anal. Chem, 27: 727-737.
6 Wensing, M.; Uhde, E.; Salthammer, T. (2005). Plastics additives in the indoor environment - flame retardants and plasticizers. Sci. Total Environ., 339: 19-40.
7 Fromme, H.; Lahrz, T.; Piloty, M.; Gebhart, H.; Oddoy, A.; Rueden, H. (2004). Occurrence of phthalates and musk fragrances in indoor air and dust from apartments and kindergartens in Berlin (Germany). Indoor Air, 14: 188-195.
8 Staaf, T. and Östman, C. (2005). Organophosphate triesters in indoor environments. J. Environ. Monit., 7: 883-887.
9 Marklund, A.; Andersson, B.; Haglund, P. (2003). Screening of organophosphorus compounds and their distribution in various indoor environments. Chemosphere, 53: 1137-1146.
54
10 Carlsson, H.; Nilsson, U.; Becker, G.; Östman, C. (1997). Organophosphate Ester Flame Retardants and Plasticizers in the Indoor Environment: Analytical Methodology and Occurrence. Environ. Sci. Technol., 31: 2931-2936.
11 Rudel, R.A.; Dodson, R.E.; Perovich, L.J.; Morello-Frosch, R.; Camann, D.E.; Zuniga, M.M.; Yau, A.Y.; Just, A.C.; Brody, J.G. (2010). Semivolatile Endocrine-Disrupting Compounds in Paired Indoor and Outdoor Air in Two Northern California Communities. Environ. Sci. Technol., 44: 6583-6590.
12 Gächter, R. and Müller, H. (1993). Plastic Additives. 4th, Hanser/Gardner Publications Inc.: Cincinatti.
13 Brydson, J.A. (1995). Plastic Materials. 6th ed., Butterworth-Heinemann Ltd: Jordan Hill, Oxford.
14 WHO (1997). Flame retardants: A General Introduction. Environmental Health Criteria 192, World Health Organization, Geneva
15 Wypych, G. (2004). Handbook of Plasicizers. ChemTec Publishing: Toronto, Canada.
16 Meier, L. (1993). Phthalates, In Plastics Additives, 4th ed.; Gächter, R. and Müller, H., Eds.; Hanser/Gardner Publications Inc.: Cincinatti, pp. 369-380.
17 Marklund, A.; Andersson, B.; Haglund, P. (2005). Organophosphorus flame retardants and plasticizers in air from various indoor environments. J. Environ. Monit., 7: 814-819.
18 Wypych, G. (2004). Plasicizers Types, In Handbook of Plasticizers, Wypych, G., Ed.; ChemTec Publishing: Toronto, Canada, pp. 2-71.
19 Green, J. (1996). A review of phosphorus-containing flame retardants. J. Fire Sci., 14: 353-366.

55
20 WHO (1998). Flame retardants: Tris(chloropropyl) Phosphate and Tris(2-chlorethyl) Phosphate. Environmental Health Criteria 209, World Health Organization, Geneva
21 European Council for Plasticisers and Intermediates (ECPI), A sector group of Cefic, European Chemical Industry Council. (2010). Plasticisers, (Accessed 2010/08/16) http://www.ecpi.org
22 European Flame Retardants Association (EFRA), A sector group of Cefic, European Chemical Industry Council:. (2007). (Accessed 2010/08/11) http://www.cefic-efra.com
23 European Chemicals Agency (ECHA). (2010). Candidate List of Substances of Very High Concern for authorisation, (Accessed 2010/05/28) http://echa.europa.eu/chem_data/authorisation_process/candidate_list_table_en.asp
24 European Chemicals Agency (ECHA). (2009). Annex XIV recommendations, (Accessed 2010/05/28) European Chemicals Agency http://echa.europa.eu/chem_data/authorisation_process/annex_xiv_rec_en.asp
25 European Commission (2009). European Union Risk Assessment Report, Tris (2-chloroethyl) phosphate, TCEP. Final report, European Chemicals Bureau (ECB), Avaliable through ORATS (Online EUropean Risk Assessment Tracking System): http://ecb.jrc.ec.europa.eu/esis/index.php?PGM=ora
26 European Commission (2008). European Union Risk Assessment Report, bis(2-ethylhexyl)phthalate (DEHP). EUR 23384 EN, European Chemicals Bureau (ECB), Avaliable through ORATS (Online EUropean Risk Assessment Tracking System): http://ecb.jrc.ec.europa.eu/esis/index.php?PGM=ora
27 European Commission (2008). European Union Risk Assessment Report, tris(2-chloro-1-methylethyl) phosphate (TCPP). Final report, European Chemicals Bureau (ECB), Avaliable through ORATS

56
(Online EUropean Risk Assessment Tracking System): http://ecb.jrc.ec.europa.eu/esis/index.php?PGM=ora
28 European Commission (2008). European Union Risk Assessment Report, tris[2-chloro-1-(chloromethyl)ethyl] phosphate (TDCP). Final report, European Chemicals Bureau (ECB), Avaliable through ORATS (Online EUropean Risk Assessment Tracking System): http://ecb.jrc.ec.europa.eu/esis/index.php?PGM=ora
29 European Commission (2007). European Union Risk Assessment Report, benzyl butyl phthalate (BBP). EUR 22773 EN, European Chemicals Bureau (ECB), Avaliable through ORATS (Online EUropean Risk Assessment Tracking System): http://ecb.jrc.ec.europa.eu/esis/index.php?PGM=ora
30 European Commission (2003). European Union Risk Assessment Report, Dibutyl phthalate (with addendum 2004). EUR 19840 EN, European Chemicals Bureau (ECB), Avaliable through ORATS (Online EUropean Risk Assessment Tracking System): http://ecb.jrc.ec.europa.eu/esis/index.php?PGM=ora
31 Sharpe, R.M. (2008). "Additional" Effects of Phthalate Mixtures on Fetal Testosterone Production. Toxicol. Sci., 105: 1-4.
32 Welsh, M.; Saunders, P.T.K.; Fisken, M.; Scott, H.M.; Hutchison, G.R.; Smith, L.B.; Sharpe, R.M. (2008). Identification in rats of a programming window for reproductive tract masculinization, disruption of which leads to hypospadias and cryptorchidism. J. Clin. Invest., 118: 1479-1490.
33 Foster, P.M.D. (2006). Disruption of reproductive development in male rat offspring following in utero exposure to phthalate esters. Int. J. Androl., 29: 140-147.
34 Swan, S.H. (2008). Environmental phthalate exposure in relation to reproductive outcomes and other health endpoints in humans. Environ. Res., 108: 177-184.
35 Swan, S.H.; Main, K.M.; Liu, F.; Stewart, S.L.; Kruse, R.L.; Calafat, A.M.; Mao, C.S.; Redmon, J.B.; Ternard, C.L.; Sullivan, S.; Teague,
57
J.L.; Drobnis, E.Z.; Carter, B.S.; Kelly, D.; Simmons, T.M.; Wang, C.; Lumbreras, L.; Villanueva, S.; Diaz-Romero, M.; Lomeli, M.B.; Otero-Salazar, E.; Hobel, C.; Brock, B.; Kwong, C.; Muehlen, A.; Sparks, A.; Wolf, A.; Whitham, J.; Hatterman-Zogg, M.; Maifield, M. (2005). Decrease in anogenital distance among male infants with prenatal phthalate exposure. Environ. Health Perspect., 113: 1056-1061.
36 Sharpe, R.M. (2005). Phthalate exposure during pregnancy and lower anogenital index in boys: wider implications for the general population? Environ. Health Perspect., 113: A504-5.
37 Fisher, J.S. (2004). Environmental anti-androgens and male reproductive health: focus on phthalates and testicular dysgenesis syndrome. Reproduction (Bristol, U. K. ), 127: 305-315.
38 Bornehag, C.G. and Nanberg, E. (2010). Phthalate exposure and asthma in children. Int. J. Androl., 33: 333-345.
39 Salthammer, T.; Fuhrmann, F.; Uhde, E. (2003). Flame retardants in the indoor environment - Part II: Release of VOCs (triethylphosphate and halogenated degradation products) from polyurethane. Indoor Air, 13: 49-52.
40 Saboori, A.M.; Lang, D.M.; Newcombe, D.S. (1991). Structural requirements for the inhibition of human monocyte carboxylesterase by organophosphorus compounds. Chem. -Biol. Interact., 80: 327-338.
41 WHO (1991). Triphenyl Phosphate. Environmental Health Criteria 111, World Health Organization, Geneva
42 WHO (2000). Flame Retardants: Tris (2-butoxyethyl) phosphate, Tris (2-ethylhexyl) phosphate and Tetrakis (hydroxymethyl) phosphonium salts. Environmental Health Criteria 218, World Health Organization, Geneva
43 WHO (1991). Tri-n-butyl Phosphate. Environmental Health Criteria 112, World Health Organization, Geneva

58
44 WHO (1989). Indoor Air Quality: Organic pollutants. Euro Report and Studies 111, World Health Oranization, Regional Office for Europe, Copenhagen
45 Ayoko, G.A. and Uhde, E. (2003). Organic Compounds Adsorbed on Particles and Settled House Dust, In Indoor Environment: Airborn Particles and Settled Dust, Morawska, L. and Salthammer, T., Eds.; WILEY-VCH GmbH & Co. KGaA: Weinheim, pp. 143-166.
46 Weschler, C.J.; Salthammer, T.; Fromme, H. (2008). Partitioning of phthalates among the gas phase, airborne particles and settled dust in indoor environments. Atmos. Environ., 42: 1449-1460.
47 Vogel, M. (2005). Sampling of airborne pollutants: strategies and developments. Anal. Bioanal. Chem., 381: 84-86.
48 Kootstra, P.R. and Herbold, H.A. (1995). Automated solid-phase extraction and coupled-column reversed-phase liquid chromatography for the trace-level determination of low-molecular-mass carbonyl compounds in air. J. Chromatogr. , A, 697: 203-211.
49 Jahnke, A.; Huber, S.; Temme, C.; Kylin, H.; Berger, U. (2007). Development and application of a simplified sampling method for volatile polyfluorinated alkyl substances in indoor and environmental air. J. Chromatogr. , A, 1164: 1-9.
50 Staaf, T. and Östman, C. (2005). Indoor air sampling of organophosphate triesters using solid phase extraction (SPE) adsorbents. J. Environ. Monit., 7: 344-348.
51 Chafer-Pericas, C.; Herraez-Hernandez, R.; Campins-Falco, P. (2004). Selective determination of trimethylamine in air by liquid chromatography using solid phase extraction cartridges for sampling. J. Chromatogr. , A, 1042: 219-223.
52 Ramil Criado, M.; Rodriguez Pereiro, I.; Cela Torrijos, R. (2002). Determination of polychlorinated biphenyl compounds in indoor air samples. J. Chromatogr. , A, 963: 65-71.

59
53 Morawska, L. and Salthammer, T. (2003). Indoor Environment: Airborn Particles and Settled Dust. WILEY-VCH GmbH & Co. KGaA: Weinheim.
54 U.S. EPA. (1997). Exposure Factors Handbook (Final Report) 1997. EPA/600/P-95/002F a-c, U.S. Environmental Protection Agency, Washington D.C.
55 U.S. EPA. (2008). Child-Specific Exposure Factors Handbook (Final Report) 2008. EPA/600/R-06/096F, U.S. Environmental protection Agency, Washington D.C.
56 Bornehag, C.; Lundgren, B.; Weschler, C.J.; Sigsgaard, T.; Hagerhed-Engman, L.; Sundell, J. (2005). Phthalates in indoor dust and their association with building characteristics. Environ. Health Perspect., 113: 1399-1404.
57 Schnelle-Kreis, J.; Scherb, H.; Gebefugi, I.; Kettrup, A.; Weigelt, E. (2000). Pentachlorophenol in indoor environments. Correlation of PCP concentrations in air and settled dust from floors. Sci. Total Environ., 256: 125-132.
58 Quintana, J.B.; Rodil, R.; Reemtsma, T.; Garcia-Lopez, M.; Rodriguez, I. (2008). Organophosphorus flame retardants and plasticizers in water and air II. Analytical methodology. TrAC, Trends Anal. Chem, 27: 904-915.
59 Wise, S.A.; Poster, D.L.; Kucklick, J.R.; Keller, J.M.; VanderPol, S.S.; Sander, L.C.; Schantz, M.M. (2006). Standard reference materials (SRMs) for determination of organic contaminants in environmental samples. Anal. Bioanal. Chem., 386: 1153-1190.
60 Weschler, C.J. and Nazaroff, W.W. (2010). SVOC partitioning between the gas phase and settled dust indoors. Atmos. Environ., 44: 3609-3620.
61 Schantz, M.M.; Keller, J.M.; Kucklick, J.R.; Poster, D.L.; Stapleton, H.M.; Vander Pol, S.S.; Wise, S.A. (2007). New standard reference material (SRM) 2585: Organic contaminants in house dust to support exposure assessment measurements. Am. Lab., 39: 22-+.

60
62 Poster, D.L.; Kucklick, J.R.; Schantz, M.M.; Vander Pol, S.S.; Leigh, S.D.; Wise, S.A. (2007). Development of a house dust standard reference material for the determination of organic contaminants. Environ. Sci. Technol., 41: 2861-2867.
63 Stapleton, H.M.; Harner, T.; Shoeib, M.; Keller, J.M.; Schantz, M.M.; Leigh, S.D.; Wise, S.A. (2006). Determination of polybrominated diphenyl ethers in indoor dust standard reference materials. Anal. Bioanal Chem., 384: 791-800.
64 NIST (2010). Certificate of Analysis for SRM 2585 Organic Contaminants in House Dust. Last certificate revision: 06 January 2010; Original certificate date: 20 December 2005, National Institute of Standards & Technology, Gaithersburg, USA,
65 NIST (2010). Certificate of Analysis for SRM 2583 Trace Elements in Indoor Dust. Last certificate revision: 30 November 2010; (Original certification date: 30 December 1996), National Institute of Standards & Technology, Gaithersburg, USA,
66 NIST (2010). Certificate of Analysis for SRM 2584 Trace Elements in Indoor Dust. Last certificate revision: 07 November 2010 ; (Original certification date: 15 December 1999 ), National Institute of Standards & Technology, Gaithersburg, USA,
67 Van den Eede, N.; Dirtu, A.C.; Neels, H.; Covaci, A. (2011). Analytical developments and preliminary assessment of human exposure to organophosphate flame retardants from indoor dust. Environ. Int., 37: 454-461.
68 David, F.; Sandra, P.; Tienpont, B.; Vanwalleghem, F.; Ikonomou, M. (2003). Analytical methods review - Part 2: Analysis of phthalates, In The Handbook of Environmental Chemistry: Phthalate Esters, Vol. 3, Part Q Staples, C.A., Ed.; Springer: Berlin, Heidelberg, pp. 12-26.
69 Robards, K.; Haddad, P.R.; Jackson, P.E. (2004). Principles and Practice of Modern Chromatographic Methods. Elsevier Ldt.: London.

61
70 Scott, R.P.W. (2003). Gas Chromatography Detectors. Libraryforsience, LLC: World Wide Web: http:/www.library4science.com.
71 Quintana, J.B.; Rodil, R.; Lopez-Mahia, P.; Muniategui-Lorenzo, S.; Prada-Rodriguez, D. (2007). Optimization of a selective method for the determination of organophosphorous triesters in outdoor particulate samples by pressurized liquid extraction and large-volume injection gas chromatography-positive chemical ionization-tandem mass spectrometry. Anal. Bioanal. Chem., 388: 1283-1293.
72 Harrison, A.G. (1992). Chemical Ionization Mass Spectrometry. 2:nd Edition, CRC press LLC: Boca Raton, Florida.
73 de Hoffman, E. and Stroobant, V. (2001). Mass Spectrometry - Prniciples and Application. 2:nd edition, John Wiley & Sons, Ldt: Chicester.
74 McLafferty, F.W. and Tureček, F. (1993). Interpretation of Mass Spectra. 4th, University Science Books: Sausalito, CA.
75 Björklund, J.; Isetun, S.; Nilsson, U. (2004). Selective determination of organophosphate flame retardants and plasticizers in indoor air by gas chromatography, positive-ion chemical ionization and collision-induced dissociation mass spectrometry. Rapid Commun. Mass Spec., 18: 3079-3083.
76 Toda, H.; Sako, K.; Yagome, Y.; Nakamura, T. (2004). Simultaneous determination of phosphate esters and phthalate esters in clean room air and indoor air by gas chromatography-mass spectrometry. Anal. Chim. Acta, 519: 213-218.
77 Fankhauser-Noti, A. and Grob, K. (2007). Blank problems in trace analysis of diethylhexyl and dibutyl phthalate: Investigation of the sources, tips and tricks. Anal. Chim. Acta, 582: 353-360.
78 Rudel, R.A.; Camann, D.E.; Spengler, J.D.; Korn, L.R.; Brody, J.G. (2003). Phthalates, Alkylphenols, Pesticides, Polybrominated Diphenyl Ethers, and Other Endocrine-Disrupting Compounds in Indoor Air and Dust. Environ. Sci. Technol., 37: 4543-4553.
62
79 Kanazawa, A.; Saito, I.; Araki, A.; Takeda, M.; Ma, M.; Saijo, Y.; Kishi, R. (2010). Association between indoor exposure to semi-volatile organic compounds and building-related symptoms among the occupants of residential dwellings. Indoor Air, 20: 72-84.
80 Sjödin, A.; Carlsson, H.; Thuresson, K.; Sjölin, S.; Bergman, Å.; Östman, C. (2001). Flame Retardants in Indoor Air at an Electronics Recycling Plant and at Other Work Environments. Environ. Sci. Technol., 35: 448-454.
81 Sanchez, C.; Ericsson, M.; Carlsson, H.; Colmsjö, A. (2003). Determination of organophosphate esters in air samples by dynamic sonication-assisted solvent extraction coupled on-line with large-volume injection gas chromatography utilizing a programmed-temperature vaporizer. J. Chromatogr. A, 993: 103-110.
82 Saito, I.; Onuki, A.; Seto, H. (2007). Indoor organophosphate and polybrominated flame retardants in Tokyo. Indoor Air, 17: 28-36.
83 Corner, R. (2009). Stockholms väg mot Hälsomässigt hållbara hus - 3H. 3H-projektet, http://www.stockholm.se/ByggBo/Inomhusmiljo/Projektet-Halsomassigt-hallbara-hus/
84 Engvall, K.; Corner, R.; Emenius, G.; Hult, M. (2009). "Upplevd inomhusmiljö och hälsa i Stockholms flerbostadshus". Rapport 1, 3H-projektet, http://www.stockholm.se/ByggBo/Inomhusmiljo/Projektet-Halsomassigt-hallbara-hus/
85 Engvall, K.; Norrby, C.; Bandel, J.; Hult, M.; Norback, D. (2000). Development of a multiple regression model to identify multi-family residential buildings with a high prevalence of sick building syndrome (SBS). Indoor Air, 10: 101-110.
86 Burge, P.S. (2004). Sick building syndrome. Occup Environ Med, 61: 185-190.
87 Redlich, C.A.; Sparer, J.; Cullen, M.R. (1997). Sick-building syndrome. Lancet, 349: 1013-1016.

63
88 Butte, W.; Hoffmann, W.; Hostrup, O.; Schmidt, A.; Walker, G. (2001). Endocrine disrupting chemicals in house dust: results of a representative monitoring. Gefahrstoffe - Reinhalt. Luft, 61: 19-23.
89 Becker, K.; Seiwert, M.; Kaus, S.; Krause, C.; Schultz, C.; Seifert, B. (2002). German Environmental Survey 1998 (GerES III): pestecides and other pollutants in house dust. H. Levin. (Ed.), Proceedings of the 9th International Conferens on Indoor Air Quality and Climate, Indoor Air, Montrey, Carlifornia, Santa Cruz, CA, Vol.4, 883-887.
90 Langer, S.; Weschler, C.J.; Fischer, A.; Bekoe, G.; Toftum, J.; Clausen, G. (2010). Phthalate and PAH concentrations in dust collected from Danish homes and daycare centers. Atmos. Environ., 44: 2294-2301.
91 Weschler, C.J. (1980). Characterization of Selected Organics in Size-Fractionated Indoor Aerosols. Environ. Sci. Technol., 14: 428-431.
92 Marklund, A.; Andersson, B.; Haglund, P. (2003). The distribution of organophosphorus compounds in various indoor environments. Organohalogen Compd., 62: 367-370.
93 Wormuth, M.; Scheringer, M.; Vollenweider, M.; Hungerbuhler, K. (2006). What are the sources of exposure to eight frequently used phthalic acid esters in Europeans? Risk Anal, 26: 803-824.
94 Ingerowski, G.; Friedle, A.; Thumulla, J. (2001). Chlorinated ethyl and isopropyl phosphoric acid triesters in the indoor environment - an inter-laboratory exposure study. Indoor Air, 11: 145-149.
95 U.S. EPA. (2009). Exposure Factors Handbook 2009 Update (External review draft). EPA/600/R-09/052A, U.S. Environmental Protection Agency, Washington D.C.
96 Harrad, S.; Hazrati, S.; Ibarra, C. (2006). Concentrations of Polychlorinated Biphenyls in Indoor Air and Polybrominated Diphenyl Ethers in Indoor Air and Dust in Birmingham, United
64
Kingdom: Implications for Human Exposure. Environ. Sci. Technol., 40: 4633-4638.
97 U.S. EPA. (1999). Integrateted Risk Information System (IRIS) on Di(2-ethylhexyl)phthalate. U.S. Environmental Protection Agency, National Center for Environmental Assessment, Office of Research and Development, Washington D.C.
98 CSTEE (1998). Opinion on phthalate migration from soft PVC toys and child care articles - opinion expressed at the 6th CSTEE plenary meeting, Brussels 26/27 November 1998. Scientific Comittee for Toxicity, Ecotoxicity, and the Environment, http://ec.europa.eu/health/scientific_committees/environmental_risks/opinions/sctee/sct_out19_en.htm
99 Kortenkamp, A. (2008). Low dose mixture effects of endocrine disrupters: implications for risk assessment and epidemiology. Int. J. Androl., 31: 233-240.
100 Kortenkamp, A.; Backhaus, T.; Faust, M. (2009). State of the Art Report on Mixture Toxicity. Study contract No. 070307/2007/485103/ETU/D.1, Project on mixture toxicology and ecotoxicology commissioned by the European Commission, http://ec.europa.eu/environment/chemicals/pdf/report_Mixture%20toxicity.pdf
101 Nagorka, R.; Conrad, A.; Scheller, C.; Suessenbach, B.; Moriske, H. (2011). Diisononyl 1,2-cyclohexanedicarboxylic acid (DINCH) and Di(2-ethylhexyl) terephthalate (DEHT) in indoor dust samples: Concentration and analytical problems. Int. J. Hyg. Environ. Health, 214: 26-35.