organohalogen emissions from saline environments – spatial
TRANSCRIPT

Biogeosciences, 9, 1225–1235, 2012www.biogeosciences.net/9/1225/2012/doi:10.5194/bg-9-1225-2012© Author(s) 2012. CC Attribution 3.0 License.
Biogeosciences
Organohalogen emissions from saline environments – spatialextrapolation using remote sensing as most promising tool
K. Kotte 1, F. Low2, S. G. Huber1, T. Krause1, I. Mulder 1, and H. F. Scholer1
1Institute of Earth Sciences, University of Heidelberg, 69120 Heidelberg, Germany2Department of Remote Sensing, Institute of Geography, University of Wurzburg, 97074 Wurzburg, Germany
Correspondence to:K. Kotte ([email protected])
Received: 1 July 2011 – Published in Biogeosciences Discuss.: 28 July 2011Revised: 2 March 2012 – Accepted: 12 March 2012 – Published: 29 March 2012
Abstract. Due to their negative water budget most recentsemi-/arid regions are characterized by vast evaporates (saltlakes and salty soils). We recently identified those hyper-saline environments as additional sources for a multitudeof volatile halogenated organohalogens (VOX). These com-pounds can affect the ozone layer of the stratosphere andplay a key role in the production of aerosols. A remotesensing based analysis was performed in the Southern AralSea basin, providing information of major soil types as wellas their extent and spatial and temporal evolution. VOXproduction has been determined in dry and moist soil sam-ples after 24 h. Several C1- and C2 organohalogens havebeen found in hyper-saline topsoil profiles, including CH3Cl,CH3Br, CHBr3 and CHCl3. The range of organohalogensalso includes trans-1,2-dichloroethene (DCE), which is re-ported here to be produced naturally for the first time. Us-ing MODIS time series and supervised image classificationa daily production rate for DCE has been calculated for the15 000 km2 ranging research area in the southern Aralkum.The applied laboratory setup simulates a short-term changein climatic conditions, starting from dried-out saline soil thatis instantly humidified during rain events or flooding. Itdescribes the general VOX production potential, but allowsonly for a rough estimation of resulting emission loads. VOXemissions are expected to increase in the future since the areaof salt affected soils is expanding due to the regressing AralSea. Opportunities, limits and requirements of satellite basedrapid change detection and salt classification are discussed.
1 Introduction
Organic compounds containing halogens – especially chlo-rine – have been considered for a long time to be of industrialorigin only. Volatile organohalogens (VOX) are effectivelylinked to atmospheric chemistry cycles, leading to potentiallysignificant feedbacks on cloud formation, Earth’s albedo andeventually the regional and global climate.
Since the middle of the 1970’s over 5000 differentorganohalogens have been discovered to be produced bynature, involving biogeochemical, biochemical and micro-bial processes. This includes de-novo producers like fungi,halophilic bacteria and archaea, plants, animals, and insects(e.g. Gribble, 2010).
Relevant data on the quantity and variety of low molecu-lar weight organohalogens in the terrestrial environment arelimited. This compartment receives significant fluxes of in-organic halides via the deposition of sea salt aerosols, com-bustion processes, and from weathering processes of rocks aswell as vertically intruding salt diapirs.
VOX have been found in natural soils as well as sedi-ments of hyper-/saline salt lakes (Scholer and Keppler, 2003;Weissflog et al., 2005). A number of studies is dealing withthe release of organohalogens from coastal marshes and otherwetlands, where halogenation was suggested to depend onfungal and bacterial activity (e.g. von Glasow and Crutzen,2007). There is also increasing evidence of an abiotic forma-tion in soils involving humic substances and iron (Keppler etal., 2000, 2002; Huber et al., 2009). Emission budgets forlonger-lived halocarbons, mainly of interest for stratospheric
Published by Copernicus Publications on behalf of the European Geosciences Union.

1226 K. Kotte et al.: Organohalogen emissions from saline environments
chemistry, have been published for peatlands (e.g. Dimmeret al., 2001), wetlands (Varner et al., 1999), salt marshes(Rhew et al., 2000) as well as terrestrial vegetation (Yokouchiet al., 2000).
The global source strengths of organohalogens from soilsand vegetation are poorly constrained. Keppler et al. (2005)highlighted the need for a better quantification of longer-lived halomethanes such as CH3Cl and CH3Br from recentlydiscovered, additional natural terrestrial sources. For exam-ple, Wishkerman et al. (2008) elucidated the reaction of plantpectin with bromide forming CH3Br. This appears abiot-ically at ambient temperatures and the emissions are dou-bled with every 5◦C rise. The natural production of CH3Brand CHCl3 has been proven by Weissflog et al. (2005) forhyper-saline sediments of Southern Russian and Kalmykiansalt lakes. Huber et al. (2009) found soil pH-levels, Cl−/Br−
content as well as soil organic content and structural featuresof the soil organic matter to be important drivers behind thebiogeochemical formation of trihalomethanes. These resultshave important implications for the VOX release from veg-etation and soils located in regions that are particularly af-fected by climate change (i.e. heat waves and drought). How-ever, the global source strength remains uncertain.
First indications of the predicted climate change will ap-pear within the next few decades. Towards the end of the21st century a clear increase of dry areas is expected forMiddle Asia as well as for Africa, as shown in Fig. 1. Forboth regions the current situation of land degradation anddesertification becomes more problematic due to a constantanthropogenic influence, such as overgrazing, pollution andphysical overstraining. In some regions the proposed climatechange will lead in consequence of higher temperature, morefrequent heat waves, lower rainfall and higher evaporation toan increase in quantity and scale of hyper-saline salt lakes,salty soils and salt-dust storms, as it is now observable e.g. inMiddle Asia. Due to their negative water budget most recentsemi-/arid regions are characterised by vast evaporates (saltlake sediments) and salty soils.
This study aims to combine remote sensing and laboratorydata on VOX production to examine the potential of satelliteproducts for an estimate of regional VOX production rates ofhyper-saline environments.
To extrapolate small-scale experiments to supra-regionaland global scales it is necessary to provide spatial infor-mation on number, size, and seasonal dynamics of salineecosystems. Satellite based remote sensing will enhancethe accuracy of extrapolated small scale VOX emission datato regional scales. It is superior to simply multiplyingthe average production rates with the Aralkum target area,which exhibits a variability of sediments and soil types, eachcharacterized by varying salt composition and Corg content(Dukhovny et al., 2008).
Within this study, hyper-saline ecosystems of different ge-ographical origin, different geochemical character and differ-ent development states have been compared for their VOX
production potential. The Central Asian Aralkum, whosesoils have been tested for VOX production, serves as anexample for a highly dynamic, spreading saline ecosystem,composed of hyper saline crusts and saline soils which ap-peared after desiccation of the Aral Sea (Fig. 2). A re-mote sensing based analysis was performed in the south-ern Aral Sea basin, providing information on main soiltypes as well as their extent and spatial distribution andtemporal evolution.
The remote sensing approach counteracts distortions ofsimplified average production data and considers the fastevolution of soil surface as well as soil salt content and soilhumidity of the Aralkum.
2 Methods
2.1 Study area
The study area (Figs. 2 and 3) is located within the au-tonomous Republic of Karakalpakstan (Uzbekistan), cover-ing an area of approximately 15 000 km2. With the regres-sion of the fourth largest lake of the world, a huge salinedesert emerged on the former seabed, which is called the“Aralkum” (Breckle et al., 2001). Former harbour citieslike Muynak (Uzbekistan) are now located tens of kilome-ters away from the present shoreline. From an ecologicalpoint of view, it is considered as the world’s largest areawhere primary succession is taking place (Wucherer andBreckle, 2001).
Decreasing water flow in the Amu Darya river (the Oxusof ancient times) caused dramatic loss of wetlands and theassociated reed communities in the rich ecosystem of theAmu Darya river delta (Sivanpillai and Latchininsky, 2007).The shrinking Aral Sea exposed about 50 000 km2 of its for-mer seabed (Micklin, 2007), which shows a wide variety ofdifferent landscape and soil types. The major part of thedesiccated seabed is considered as a highly unstable land-scape with a high ecological hazard in terms of desertifica-tion and eolian erosion (Dukhovny et al., 2008). Salt af-fected areas are considered as a major source for salt anddust storms in the region and appeared after regression of theAral Sea (Razakov and Kosnazarov, 1996; Orlovsky et al.,2001; Singer et al., 2003; Mees and Singer, 2006).
2.2 Monitoring land cover dynamics
Classification of Terra MODIS time-series was performedto assess the land cover dynamics in the study area be-tween 2000 and 2008 and to monitor different stages of soilsalinisation. The MOD09 8-day Surface Reflectance Dataof the Terra MODIS satellite (Moderate Resolution Imag-ing Spectroradiometer) was chosen as primary data source.Seven spectral bands, centered at 648 nm, 858 nm, 470 nm,555 nm, 1240 nm, 1640 nm, and 2130 nm respectively, wereprocessed to obtain the full spectral range and improve class
Biogeosciences, 9, 1225–1235, 2012 www.biogeosciences.net/9/1225/2012/

K. Kotte et al.: Organohalogen emissions from saline environments 1227
Fig. 1. Backdrop image: global desertification vulnerability (USDA-NRCS, Soil Survey Division, World Soil Resources, WashingtonD.C. 1996). Gray shading: global distribution of recent salt lakes and salt soils (after Williams, 2002). Pink dots indicate the study ar-eas mentioned in this study: Aralkum desert in Central Asia, Kalmykia in southern Russia, coastal wetlands of Namibia, and inland salt flatsof Botswana.
Fig. 2. Highly dynamic, spreading saline ecosystem: the Aralkum in Central Asia. Terra MODIS images acquired on July 2000, 2009 and2010. Images displayed in false color band combination 7-2-1. Red squares indicate the study area.
separability. The almost daily availability of MODIS satel-lite images since the year 2000 enables recording landscapedynamics in a very high temporal resolution. Ground refer-ence data for classification of satellite images were collectedduring field surveys in the study area in 2007, 2008 and
2009 in accordance to the FAO LCCS (Land Cover Classi-fication System), whereas 650 ground reference points werecollected, including photos of the sampling sides, vegeta-tion mapping and important soil characteristics. A qualityassessment of the input data was performed, using the TiSeG
www.biogeosciences.net/9/1225/2012/ Biogeosciences, 9, 1225–1235, 2012

1228 K. Kotte et al.: Organohalogen emissions from saline environments
Fig. 3. Location of the study area in the southern Aral Sea Basin.The map shows the major land cover transformations that took placewhere the sea surface has desiccated between 2000 and 2008. Theimage backdrop is a Terra MODIS scene acquired on 20 July 2009.Red square indicates the study area.
software (Time Series Generator) (Colditz et al., 2008). Ad-ditional input information for the classification procedurewas provided through the calculation of the NDVI (Normal-ized Differentiated Vegetation Index) and several band ra-tios where tested and evaluated for their potential to improvediscriminating salt affected areas. Besides data noise, timeseries exhibit significant temporal autocorrelation. In orderto reduce the redundancy in feature space, metrics (basicstatistics such as mean, standard deviation, minimum, maxi-mum, and range) were calculated and further used as baselinedataset for the classification. Decision trees (DT) were foundto be the most suitable method for classifying the input data,and have successfully been applied in other studies (DeFrieset al., 1995; Hansen et al., 2000). The classification of thetime series was conducted with the QUEST algorithm (QuickUnbiased Efficient Statistical Tree) (Loh and Shih, 1997),which is implemented in the software add-on “RuleGEN1.02” running in the standard image processing environment“ENVI 4.7” (ITT Visual Information Solutions).
The classification results were used to perform a post-classification change-detection analysis for the time steps2000–2004, 2004–2008 and 2000–2008. The approach usedin this study provides “from-to” change information and the
kind of landscape transformation that have occurred. Theland-cover change areas between the different classes werethen calculated. Validation was performed using an indepen-dent sample of validation points to assess classification ac-curacy. Validation points from 2008 were measured directlyin the field, whereas for 2000 and 2004, validation pointswere randomly generated and evaluated visually using Land-sat TM imagery and NDVI temporal signatures. For furtherdetails of the method see Low et al. (2012).
2.3 Soil chemistry and VOX emission
Soil samples for VOX analysis have been taken in May 2009.After pre-screening certain soil types in the study area usingLandsat 5 TM classification based soil maps (Dukhovny etal., 2008), specific sample sites have been selected along sev-eral transects, focusing on unaffected natural topsoil. Top-soil profiles (0–2 cm) were sampled for each site, whereavailable the soil/salt crusts were additionally sampled be-tween 0–0.5 cm. Sampling sites were positioned by means ofGPS measurements including photos of the sampling sites,soil surface characterization and geo-botanic mapping by astandardized form sheet based on LCCS.
Soil samples were kept cool and shipped to Heidelberg(Germany), frozen at−26◦C, freeze-dried, milled and sieved(mesh<315 µm). XRD analyses were performed applyinga Bragg-Brentano powder diffractometer (Philips PW 3020Goniometer) with secondary beam monochromator. Soil or-ganic carbon content is calculated from total carbon contentand inorganic carbon (carbonate), using a CS analyzer (LecoSC-1444DR), and a carbonate bomb (Muller and Gastner,1971), respectively.
The method to determine the VOX formation in top-soil samples followed the procedure described by Huber etal. (2009). In brief, dried and milled soil samples were trans-ferred to 20 ml headspace glass vials and incubated for 24 h at40◦C in the dark. The VOX production has been determinedusing a custom-made purge & trap system, connected to a gaschromatograph with mass spectrometer (Varian STAR 3400GC and Saturn 2000 ion trap MS). The setup describes thegeneral VOX production potential. It does not enable directcorrelation to emissions, but allows for a rough estimationof resulting emission loads. To discover the effect of soil hu-midity different assays have been performed, adding distilledwater to selected soil samples or directly testing the dried soil(Huber et al., 2009). Detection limits have been determinedto 0.1–0.01 ng g−1 dry soil, depending on species and matrix.
Preconditioning the samples enables to compare the soilproduction potential for different sample depths, locationsand geographical regions and allows for statistical evalua-tion of possible drivers. The applied sample preparation sup-presses the majority of biogenic VOX producers, such asbacteria, algae and archaea. Based on literature (e.g. Mor-ley et al., 1983; Islam et al., 1997) a single freezing periodof more than 24 h with temperatures of less than−20◦C
Biogeosciences, 9, 1225–1235, 2012 www.biogeosciences.net/9/1225/2012/
K. Kotte et al.: Organohalogen emissions from saline environments 1229
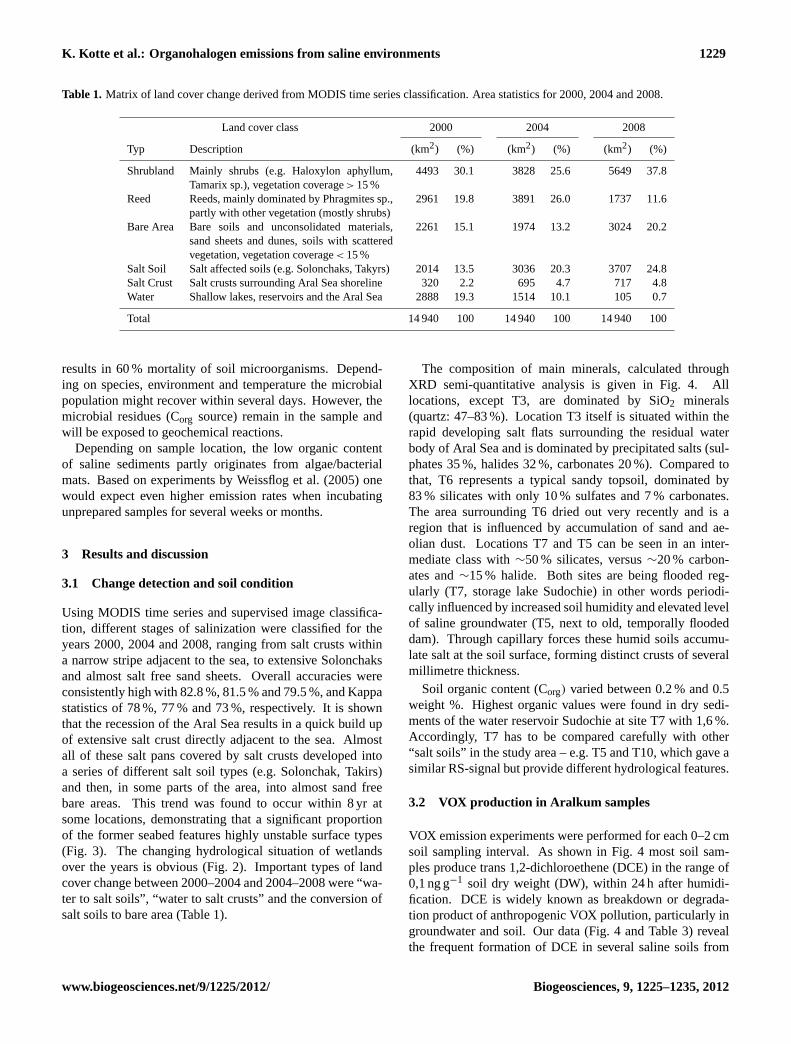
Table 1. Matrix of land cover change derived from MODIS time series classification. Area statistics for 2000, 2004 and 2008.
Land cover class 2000 2004 2008
Typ Description (km2) (%) (km2) (%) (km2) (%)
Shrubland Mainly shrubs (e.g. Haloxylon aphyllum,Tamarix sp.), vegetation coverage> 15 %
4493 30.1 3828 25.6 5649 37.8
Reed Reeds, mainly dominated by Phragmites sp.,partly with other vegetation (mostly shrubs)
2961 19.8 3891 26.0 1737 11.6
Bare Area Bare soils and unconsolidated materials,sand sheets and dunes, soils with scatteredvegetation, vegetation coverage< 15 %
2261 15.1 1974 13.2 3024 20.2
Salt Soil Salt affected soils (e.g. Solonchaks, Takyrs) 2014 13.5 3036 20.3 3707 24.8Salt Crust Salt crusts surrounding Aral Sea shoreline 320 2.2 695 4.7 717 4.8Water Shallow lakes, reservoirs and the Aral Sea 2888 19.3 1514 10.1 105 0.7
Total 14 940 100 14 940 100 14 940 100
results in 60 % mortality of soil microorganisms. Depend-ing on species, environment and temperature the microbialpopulation might recover within several days. However, themicrobial residues (Corg source) remain in the sample andwill be exposed to geochemical reactions.
Depending on sample location, the low organic contentof saline sediments partly originates from algae/bacterialmats. Based on experiments by Weissflog et al. (2005) onewould expect even higher emission rates when incubatingunprepared samples for several weeks or months.
3 Results and discussion
3.1 Change detection and soil condition
Using MODIS time series and supervised image classifica-tion, different stages of salinization were classified for theyears 2000, 2004 and 2008, ranging from salt crusts withina narrow stripe adjacent to the sea, to extensive Solonchaksand almost salt free sand sheets. Overall accuracies wereconsistently high with 82.8 %, 81.5 % and 79.5 %, and Kappastatistics of 78 %, 77 % and 73 %, respectively. It is shownthat the recession of the Aral Sea results in a quick build upof extensive salt crust directly adjacent to the sea. Almostall of these salt pans covered by salt crusts developed intoa series of different salt soil types (e.g. Solonchak, Takirs)and then, in some parts of the area, into almost sand freebare areas. This trend was found to occur within 8 yr atsome locations, demonstrating that a significant proportionof the former seabed features highly unstable surface types(Fig. 3). The changing hydrological situation of wetlandsover the years is obvious (Fig. 2). Important types of landcover change between 2000–2004 and 2004–2008 were “wa-ter to salt soils”, “water to salt crusts” and the conversion ofsalt soils to bare area (Table 1).
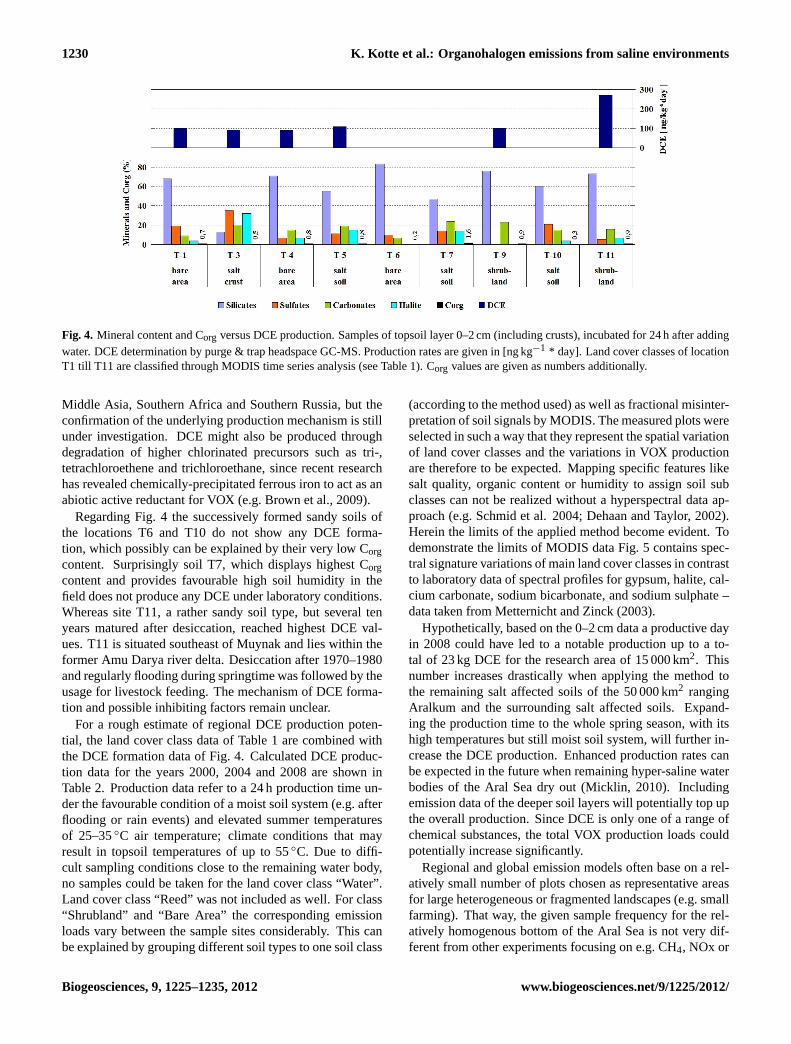
The composition of main minerals, calculated throughXRD semi-quantitative analysis is given in Fig. 4. Alllocations, except T3, are dominated by SiO2 minerals(quartz: 47–83 %). Location T3 itself is situated within therapid developing salt flats surrounding the residual waterbody of Aral Sea and is dominated by precipitated salts (sul-phates 35 %, halides 32 %, carbonates 20 %). Compared tothat, T6 represents a typical sandy topsoil, dominated by83 % silicates with only 10 % sulfates and 7 % carbonates.The area surrounding T6 dried out very recently and is aregion that is influenced by accumulation of sand and ae-olian dust. Locations T7 and T5 can be seen in an inter-mediate class with∼50 % silicates, versus∼20 % carbon-ates and∼15 % halide. Both sites are being flooded reg-ularly (T7, storage lake Sudochie) in other words periodi-cally influenced by increased soil humidity and elevated levelof saline groundwater (T5, next to old, temporally floodeddam). Through capillary forces these humid soils accumu-late salt at the soil surface, forming distinct crusts of severalmillimetre thickness.
Soil organic content (Corg) varied between 0.2 % and 0.5weight %. Highest organic values were found in dry sedi-ments of the water reservoir Sudochie at site T7 with 1,6 %.Accordingly, T7 has to be compared carefully with other“salt soils” in the study area – e.g. T5 and T10, which gave asimilar RS-signal but provide different hydrological features.
3.2 VOX production in Aralkum samples
VOX emission experiments were performed for each 0–2 cmsoil sampling interval. As shown in Fig. 4 most soil sam-ples produce trans 1,2-dichloroethene (DCE) in the range of0,1 ng g−1 soil dry weight (DW), within 24 h after humidi-fication. DCE is widely known as breakdown or degrada-tion product of anthropogenic VOX pollution, particularly ingroundwater and soil. Our data (Fig. 4 and Table 3) revealthe frequent formation of DCE in several saline soils from
www.biogeosciences.net/9/1225/2012/ Biogeosciences, 9, 1225–1235, 2012
1230 K. Kotte et al.: Organohalogen emissions from saline environments
Fig. 4. Mineral content and Corg versus DCE production. Samples of topsoil layer 0–2 cm (including crusts), incubated for 24 h after addingwater. DCE determination by purge & trap headspace GC-MS. Production rates are given in [ng kg−1 * day]. Land cover classes of locationT1 till T11 are classified through MODIS time series analysis (see Table 1). Corg values are given as numbers additionally.
Middle Asia, Southern Africa and Southern Russia, but theconfirmation of the underlying production mechanism is stillunder investigation. DCE might also be produced throughdegradation of higher chlorinated precursors such as tri-,tetrachloroethene and trichloroethane, since recent researchhas revealed chemically-precipitated ferrous iron to act as anabiotic active reductant for VOX (e.g. Brown et al., 2009).
Regarding Fig. 4 the successively formed sandy soils ofthe locations T6 and T10 do not show any DCE forma-tion, which possibly can be explained by their very low Corgcontent. Surprisingly soil T7, which displays highest Corgcontent and provides favourable high soil humidity in thefield does not produce any DCE under laboratory conditions.Whereas site T11, a rather sandy soil type, but several tenyears matured after desiccation, reached highest DCE val-ues. T11 is situated southeast of Muynak and lies within theformer Amu Darya river delta. Desiccation after 1970–1980and regularly flooding during springtime was followed by theusage for livestock feeding. The mechanism of DCE forma-tion and possible inhibiting factors remain unclear.
For a rough estimate of regional DCE production poten-tial, the land cover class data of Table 1 are combined withthe DCE formation data of Fig. 4. Calculated DCE produc-tion data for the years 2000, 2004 and 2008 are shown inTable 2. Production data refer to a 24 h production time un-der the favourable condition of a moist soil system (e.g. afterflooding or rain events) and elevated summer temperaturesof 25–35◦C air temperature; climate conditions that mayresult in topsoil temperatures of up to 55◦C. Due to diffi-cult sampling conditions close to the remaining water body,no samples could be taken for the land cover class “Water”.Land cover class “Reed” was not included as well. For class“Shrubland” and “Bare Area” the corresponding emissionloads vary between the sample sites considerably. This canbe explained by grouping different soil types to one soil class
(according to the method used) as well as fractional misinter-pretation of soil signals by MODIS. The measured plots wereselected in such a way that they represent the spatial variationof land cover classes and the variations in VOX productionare therefore to be expected. Mapping specific features likesalt quality, organic content or humidity to assign soil subclasses can not be realized without a hyperspectral data ap-proach (e.g. Schmid et al. 2004; Dehaan and Taylor, 2002).Herein the limits of the applied method become evident. Todemonstrate the limits of MODIS data Fig. 5 contains spec-tral signature variations of main land cover classes in contrastto laboratory data of spectral profiles for gypsum, halite, cal-cium carbonate, sodium bicarbonate, and sodium sulphate –data taken from Metternicht and Zinck (2003).
Hypothetically, based on the 0–2 cm data a productive dayin 2008 could have led to a notable production up to a to-tal of 23 kg DCE for the research area of 15 000 km2. Thisnumber increases drastically when applying the method tothe remaining salt affected soils of the 50 000 km2 rangingAralkum and the surrounding salt affected soils. Expand-ing the production time to the whole spring season, with itshigh temperatures but still moist soil system, will further in-crease the DCE production. Enhanced production rates canbe expected in the future when remaining hyper-saline waterbodies of the Aral Sea dry out (Micklin, 2010). Includingemission data of the deeper soil layers will potentially top upthe overall production. Since DCE is only one of a range ofchemical substances, the total VOX production loads couldpotentially increase significantly.
Regional and global emission models often base on a rel-atively small number of plots chosen as representative areasfor large heterogeneous or fragmented landscapes (e.g. smallfarming). That way, the given sample frequency for the rel-atively homogenous bottom of the Aral Sea is not very dif-ferent from other experiments focusing on e.g. CH4, NOx or
Biogeosciences, 9, 1225–1235, 2012 www.biogeosciences.net/9/1225/2012/

K. Kotte et al.: Organohalogen emissions from saline environments 1231
Table 2. Estimated production of trans 1,2-DCE for the research area (ca. 15 000 km2) based on 0–2 cm soil profile data. Determined DCEproduction within 24 h after humidification of the soil sample. Production rates are given for each land cover class in g DCE/covered areaand day.
Land cover DCEclass and production Land cover area DCE productioncorresponding site [mg km−2 *d] [km2] [g/cover area * d]
2000 2004 2008 2000 2004 2008
ShrublandT-9 1004 4493 3828 5649 4511 3843 5672
T-11 2703 12 144 10 347 15269Reed no site – 2961 3891 1737 – – –
Bare AreaT-1 991 2261 1974 3024 2241 1956 2997T-4 889 2010 1755 2688T-6 n.d. n.d. n.d. n.d.
Salt SoilT-5 1090 2014 3036 3707 2196 3310 4042T-7 n.d. n.d. n.d. n.d.
T-10 n.d. n.d. n.d. n.d.
Salt Crust T-3 915 320 695 717 293 636 656Water no site – 2888 1514 105 – – –
Sum high 16 873 16 249 22 963Sum mid 9009 9544 13 057Sum low 4803 4479 6327
n.d. = not detectable, “–” = not measured
Table 3. Typical VOX emission characteristic of saline soils and sediments of different origin using purge-and-trap GC/MS analysis; 24 hincubation time under condition of moisten or dry saline sediment [ng m−2].
Uzbekistan South Russia BotswanaSouthern Aral Volgograd Namibia Makgadigkadi
Sea region Walfishbay Pan
Site description endorheic basin, salt pan (from dry river mouth, dry salt pan,partly seasonally diaper), seasonally maritime seasonally covered
flooded covered with water coastline with water/grass
GPS 43◦58′46 N 49◦7′50 N 23◦5′30 S 20◦32′12 S59◦0′24 E 46◦41′35 E 14◦27′35 E 25◦58′31 E
pH soil crust 8.5–10 6.9–8.3 7.8–9.0 9.5–10,3Conc. range Cl− [g kg−1] 6.1–120 22–51 17–81 25–82Conc. range Br− [mg kg−1] n.d. 112–315 43–312 64–204Cl−/Br− (molar ratio) – 260–450 470–990 780–990
Chloromethane CH3Cl n.d. 15 240 * 14 410 * n.d.Bromomethane CH3Br n.d. 1040* 1160* n.d.Tribromomethane CHBr3 n.d. 2570* n.d. n.d.Trichloromethane CHCl3 4640 1480 3620 2190Dibromochloromethane CHBr2Cl n.d. n.d. n.d. 9800Dichlorobromomethane CHBrCl2 n.d. n.d. n.d. n.d.Trans-1,2-Dichloroethene C2H2Cl2 2640 n.d. 20 700 8270Trichloroethene C2HCl3 290 n.d. n.d. 1290Tetrachloroethene C2Cl4 n.d. n.d. 430 360
* Detected under dry condition n.d. = not detectable. All other data points have been detected under moist condition.
www.biogeosciences.net/9/1225/2012/ Biogeosciences, 9, 1225–1235, 2012

1232 K. Kotte et al.: Organohalogen emissions from saline environments
Fig. 5. Spectral signature variations of main land cover classes(bare area, salt soil and salt crust). Data recorded from pixels cov-ering the soil sampling sites respectively pixels selected for train-ing of the image classifier algorithm. Reflectance measurements(blue dots) were interpolated for better visual readability (blue dot-ted lines). For comparison with laboratory data the image back-drop shows spectral profiles of gypsum, halite, calcium carbon-ate, sodium bicarbonate, and sodium sulphate in the visible, near,and mid-infrared (400–2500 nm). Data source: Metternicht andZinck (2003); recorded by the GER 3700 Spectroradiometer.
CO2 production from much more inhomogeneous soil sys-tems. Categorical land cover classes have been used beforeto extrapolate emission rates of certain gases by e.g. Hines etal. (1993), Stow et al. (1998), Zhang et al. (2011), Bubier etal. (2005) and Melack et al. (2004).
3.3 Comparing samples from Aralkum, southernAfrica and southern Russia
VOX production data for saline sediments of southern Africa,as well as southern Russia and the Aralkum are compared inTable 3. Sampling procedure and analytical method for theselocations are similar to the experiments performed in the Ar-
alkum. Saline sediments at the Namibian coastline as wellas the Makgadikgadi salt flats in central Botswana outrangethe DCE production of the former sediments of Aral Sea.CHCl3 occurs consistently, whereas others seem to be spe-cific to one location or special soil conditions. Indicationsfor a pH-dependent production mechanism can be derivedfrom Table 3 as well, which meets the findings of Huber etal. (2009). As expected the production of Br-VOX can becorrelated to soils bromide content. Inland salt lakes that arefed by ancient marine salt deposits (e.g. Southern Russia)often show elevated bromide content and corresponding Br-VOX emissions. Saline environments that are mainly fed byerosion processes often show relatively low bromide content(e.g. Aral sea). No brominated VOX could be found for theAralkum, which correlates to the low concentration of bro-mide in the soil samples. Substantial amounts of brominatedVOX have been found in saline sediments that are influencedby (ancient) sea water, brackish ground water or sea spray(e.g. Namibia, Southern Russia, Botswana).
Interestingly some compounds (CH3Cl, CH3Br) werefound under dry conditions, others exclusively for moist soil(compare Table 3). The underlying formation scheme for athermolysis production might have similarities to the pectinreaction reported by Wishkerman et al. (2008) and offers apossible pathway of degradation of biotic material (e.g. al-gae mats) that remains in the topsoil during dry seasons. Allin all, Table 3 and literature data indicate the main factors forthe VOX production mechanism to be pH-level, soil organiccontent as well as salt content/composition (halide, sulfate,carbonate) and soil humidity (water content) – (e.g. Huber etal., 2009; Weissflog et al., 2005).
Comparison of the VOX species composition, shown inTable 3, discloses a incoherency of possible formation mech-anisms between the sites and per VOX species – causedby different geochemical and microbial conditions. Differ-ent VOX production rates and composition under dry versusmoist conditions do not automatically allow differentiatingbetween a geochemical or a microbial mechanism since bothrely on moist environments. It is not yet clear to which ex-tent microbial and geochemical production mechanisms con-tribute for each sample site, respectively can not be comparedbetween the sites.
Based on our findings an efficient VOX production is nolonger bound to rain events and flooding only, but becomesconceivable throughout the whole year, depending on cli-matic factors and geographical region. The results emphasizethe global relevance of hyper-saline environments as poten-tial source areas for VOX formation.
Consequently, the question emerges whether and how, re-cent and future saline terrestrial ecosystems will have an im-pact on the global VOX budget, including seasonal effectslike dissolution of halite minerals during rain events fol-lowed by recrystallisation, as well as annually shifting soiltemperature and soil humidity.
Biogeosciences, 9, 1225–1235, 2012 www.biogeosciences.net/9/1225/2012/

K. Kotte et al.: Organohalogen emissions from saline environments 1233
Fig. 6. Proposed flow chart for extrapolation of VOX emission from soil measurements to larger scales.
Literature data on soil VOX emission is mainly based onsoils from boreal zones, humid tropics, temperate mid lat-itudes and sub-polar regions. Little or no information isavailable for dry mid latitudes and dry sub-/tropical regions(e.g. Bubier et al., 2005). Albers et al. (2011) and othersdiscuss the spatial variability of VOX production in northernEurope, revealing spatial heterogeneities of the VOX emis-sion as an important issue. In contrast to temperate soils thedried-out Aral Sea exposes sandy-clayey sediments, whichare often covered by salt crusts. Thus the existing knowl-edge from temperate soils can not be transferred easily todry hyper-/saline sediments with usually no O, A and B hori-zon and Corg contents of<2 %. For this reason, existingmodels on the influence of soil type and texture on VOXemission from production data cannot be adapted to (hyper)-saline terrestrial ecosystems to estimate their emission loads.Our scenario describes the special situation of humidificationand slurrying the upper soil layer/crust during rain events,which alters texture and porosity of dry soil. VOX are effec-tively stripped from the resulting hyper-/saline mixture bysalting out effect and temperature effects. The same effectswill take place in salt flats mentioned in Table 3, coveringhundreds of square kilometres with surface temperatures ofup to 55◦C. Thus, the spontaneous emission of VOX fromtopsoil sediments becomes very likely.
4 Conclusions
There is no analytical large-scale method available for deter-mining VOX with appropriate sensitivity. Open Path FT-IRSpectroscopy might work for some chlorinated organic com-pounds, but is limited to mid to high concentration in therange of mg m−3. Airborne measurements often fail due toadministrative obstacles and high expenses. Other methodslead to imbalances of the soil system by sampling or hous-ing, in which chamber experiments are difficult to handle inlandscapes with little or no infrastructure. Therefore, cur-rently the best approach is to recourse to laboratory basedVOX analysis from soil core samples, ideally supported byfield chamber experiments. The question remains, how toextrapolate VOX emissions from small-scale soil measure-ments to landscape scale. Here we have shown that synergis-tic use of VOX emission data and remote sensing productsmay be a suitable approach for estimating the VOX produc-tion in saline ecosystems, as well as extrapolation of fieldmeasurements to larger scales. Our setup reproduces a short-term change in climatic conditions starting from dried-outsaline soil, humidified during rain events or flooding. It de-scribes the general VOX production potential and allows arough estimate of the emission load.
At this stage the applied remote sensing method containsuncertainties regarding the accuracies of land cover classifi-cation with focus on salt composition and soil humidity. Sev-eral salt types show different spectral profiles (Fig. 5), whichcan be measured by means of remote sensing data (Ben-Doret al., 2002; Drake, 1995; Hunt et al., 1972). Highly saline
www.biogeosciences.net/9/1225/2012/ Biogeosciences, 9, 1225–1235, 2012

1234 K. Kotte et al.: Organohalogen emissions from saline environments
soils can be distinguished from low or even non-saline soils(Metternicht and Zinck, 2003, 2009). But comparing fieldand laboratory data much lower reflectance values for realsamples becomes apparent (Fig. 5), which might be causedin the mixed signal problem of the 500× 500 m MODIS pix-els (plant and soil fractions between salt crusts). Furthermoredifferent surface conditions and coarseness affects back radi-ation. Since the emission of VOX is mainly connected tosurface salt composition, a higher level of detail is needed tocalculate the soil classes with sufficient accuracy.
To detect rapid changes in surface composition and landcover of saline environments, with adequate precision andat different temporal and spatial scales is a future challenge(e.g. salt type, dissolving and re-crystallization followingrain events). The application of hyper spectral data (e.g. En-Map) becomes essential to meet the problem of MODIS’ssmall number of spectral bands, which shield pronouncedspectral information, such as curve parameter and attributes(Figs. 5 and 6). In order to enhance understanding of small-scale surface heterogeneities and their influence on regionalVOX emission rates, a multi-scale classification system isneeded, including sensors with different spatial and tem-poral resolution. A possible methodological procedure issummarized in Fig. 6.
Special attention has to be paid, when correlating en-vironmental parameters with VOX emission and when as-signing VOX emission to distinct land cover classes, whichare directly or indirectly influenced by these parameters anddistinguishable by means of remote sensing.
Acknowledgements.This study was carried out within the contextof the HALOPROC project funded by the DFG (German ResearchFoundation, Research Unit 763). We would like to thank theFriedrich-Ebert Foundation for the scholarship to F. Low and theGIZ (German Agency for International Cooperation) for logisticalsupport of the ground surveys in Uzbekistan.
Edited by: D. Fernandez Prieto
References
Albers, C. N., Jacobsen, O. S., Flores,E. M. M., Pereira, J. S. F., andLaier, T.: Spatial variation in natural formation of chloroform inthe soils of four coniferous forests, Biogeochemistry, 103, 317–334, 2011.
Ben-Dor, E.: Quantitative remote sensing of soil properties,Adv. Agro. Academic Press, 75, 173–243,doi:10.1016/S0065-2113(02)75005-0, 2002.
Breckle, S.-W., Wucherer, W., Agachanjanz, O., and Geldyer, B.:The Aral Sea crisis region, in: Sustainable land use in deserts,edited by: Breckle, S. W., Veste, M., and Wucherer, W., Springer,Berlin Heidelberg New York, 27–37, 2001.
Brown, R. A., Mueller, J. G., Seech, A. G., Henderson, J. K., andWilson, J. T.: Interactions between biological and abiotic path-ways in the reduction of chlorinated solvents, Remediation, Win-ter, 2009.
Bubier, J., Moore, T., Savage, K., and Crill, P.: A com-parison of methane flux in a boreal landscape between adry and a wet year, Global Biogeochem. Cy., 19, GB1023,doi:10.1029/2004GB002351, 2005.
Colditz, R. R., Conrad, C., Wehrmann, T., Schmidt, M., and Dech,S.: TiSeG: flexible software tool for time-series generation ofMODIS data utilizing the quality assessment science data set,IEEE T. Geosci. Remote Sens., 46, 3296–3308, 2008.
DeFries, R., Hansen, M., and Townshend, J. R. G.: Global discrim-ination of land cover types from metrics derived from AVHRRpathfinder data, Remote Sens. Environ., 54, 209–222, 1995.
Dehaan, R. and Taylor, G. R.: Image-derived spectral endmemdersas indicators of salinisation, Int. J. Remote Sens., 24, 775–794,2002.
Dimmer, C. H., Simmonds, P. G., Nickless, G., and Bassford, M. R.:Biogenic fluxes of halomethanes from Irish peatland ecosystems,Atmos. Environ., 35, 321–330, 2001.
Drake, N. A.: Reflectance spectra of evaporite minerals (400–2500nm). Applications for remote sensing, Int. J. Remote Sens., 16,2555–2571, 1995.
Dukhovny, V. A., Navratil, P., Rusiev, I., Stulina, G., and Roshenko,Y. E.: Comprehensive remote sensing and ground based studiesof the dried Aral Sea bed, Tashkent: Scientific Information Cen-ter ICWC, 2008.
Gribble, G. W.: Naturally occurring organohalogen compounds – Acomprehensive update, Springer Verlag, Wien New York, 2010.
Hansen, M. C., DeFries, R. S., Townshend, J. R. G., and Sohlberg,R. A.: Global land cover classification at 1 km spatial resolu-tion using a classification tree approach, Int. J. Remote Sens.,21, 1331–1364, 2000.
Hines, M. E., Pelletier, R. E., and Crill, P. M., Emissions of sulfurgases from marine and freshwater wetlands of the Florida Ev-erglades: Rates and extrapolation using remote sensing, J. Geo-phys. Res., 98, 8991–8999, 1993.
Huber, S. G., Kotte, K., Scholer, H. F., and Williams, J.: Natu-ral abiotic formation of trihalomethanes (THM) in soil: Resultsfrom laboratory studies and field samples, Environ. Sci. Technol.,43, 4934–4939, 2009.
Hunt, G. R., Salisbury, J. W., and Lenhoff, C. J.: Visible and near-infrared spectra of minerals and rocks: V. Halides, Phosphates,Arsenates, Vanadates and Borates, Modern Geology, 3, 121–132,1972.
Islam, K. R., Weil, R. R., Mulchi, C. L., and Glenn, S. D.: Freeze-dried soil extraction method for the measurement of microbialbiomass, C. Biol. Fertil. Soils, 24, 205–210, 1997.
Keppler, F., Eiden, R., Niedan, V., Pracht, J., and Scholer, H.F.:Halocarbons produced by natural oxidation processes duringdegradation of organic matter, Nature, 403, 298–301, 2000.
Keppler, F., Borchers, R., Pracht, J., Rheinberger, S., and Scholer,H. F.: Natural formation of vinyl chloride in the terrestrial envi-ronment, Environ. Sci. Technol., 36, 2484–2490, 2002.
Keppler, F., Harper, D. B., Rockmann, T., Moore, R. M., and Hamil-ton, J. T. G.: New insight into the atmospheric chloromethanebudget gained using stable carbon isotope ratios, Atmos. Chem.Phys., 5, 2403–2411,doi:10.5194/acp-5-2403-2005, 2005.
Loh, W. and Shih, Y.: Split selection methods for classificationtrees, Statistica Sinica 7, 815–840, 1997.
Low, F., Navratil, P., and Bubenzer, O.: Landscape dynamics inthe southern Aralkum desert – using MODIS time series for
Biogeosciences, 9, 1225–1235, 2012 www.biogeosciences.net/9/1225/2012/

K. Kotte et al.: Organohalogen emissions from saline environments 1235
land cover change analysis, in: Aralkum – A man-made desert:The desiccated floor of the Aral Sea (Central Asia), edited by:Breckle, S. W., Wucherer, L., Dimeyeva, L., and Ogar, N. P.,Ecological Studies Series, 218, Springer, 83–96, 2012.
Melack, J. M., Hess, L. L., Gastil, M., Forsberg, B. R., Hamilton,S. K., Lima, I. B. T., and Novo, E. M. L. M: Regionalization ofmethane emissions in the Amazon basin with microwave remotesensing, Glob. Change Biol., 10, 530–544, 2004.
Metternicht, G. I. and Zinck, J. A.: Remote sensing of soil salin-ity: Potentials and constraints, Remote Sens. Environ., 85, 1–20,2003.
Metternicht, G. I. and Zinck, J. A.: Remote sensing of soil saliniza-tion, CRC Press, 2009.
Mees, F. and Singer, A.: Surface crusts on soils/sediments of thesouthern Aral Sea basin, Uzbekistan, Geoderma, 136, 152–159,2006.
Morley, C. R., Trofymow, J. A., Coleman, D. C., and Cambardella,C.: Effects of freeze-thaw stress on bacterial populations in soilmicrocosms, Microb. Ecol., 9, 329–340, 1983.
Muller, G. and Gastner, M.: The “Karbonat-Bombe”, a simple de-vice fort he determination of the carbonate content in sediments,soils and other materials, N. Jb. Miner. Mh., 10, 466–469, 1971.
Micklin, P. P.: The Aral Sea Disaster, Annu. Rev. Earth Pl. Sc., 35,47–72, 2007.
Micklin, P. P.: The past, present, and future Aral Sea. Lakes &Reservoirs, Research and Management, 15, 193–213, 2010.
Orlovsky, N., Glantz, M., and Orlovsky, L.: Irrigation and landdegradation in the Aral Sea basin, in: Sustainable land use indeserts, edited by: Breckle, S. W., Veste, M., and Wucherer, W.,Springer, 52–69, 2001.
Razakov, R. and Kosnazarov, K.: Dust and salt transfer from theexposed bed of the Aral Sea and measures to decrease its envi-ronmental impact, in: The Aral Sea basin, edited by: Micklin, P.P. and Williams, W. D., NATO ASI Series, 2., Env., 12, 95–103,1996.
Rhew, R. C., Miller, B. R., and Weiss, R. F.: Natural methyl bro-mide and methyl chloride emissions from coastal salt marshes,Nature, 403, 292–295, 2000.
Schmid, T., Koch, M., Gumuzzio, J., and Mather, P. M.: A spectrallibrary for a semi-arid wetland and its application to studies ofwetland degradation using hyperspectral and multispectral data,Int. J. Remote Sens., 25, 2485–2496, 2004.
Scholer, H. F. and Keppler, F.: Abiotic formation of organohalo-gens during early diagenetic processes, in: The handbook ofEnviron. Chem. The natural production of organohalogen com-pounds, edited by: Hutzinger, O. and Gribble, G. W., SpringerVerlag, Heidelberg, 3(P), 63–84, 2003.
Singer, A., Zobeck, T., Poberrezky, L., and Argaman, E.: The PM10and PM2.5 dust generation potential of soils/sediments in thesouthern Aral Sea basin, Uzbekistan, J. Arid Envir., 54, 705–728,2003.
Sivanpillai, R. and Latchininsky, V.: Mapping locust habitats in theAmudarya river delta, Uzbekistan with multi-temporal MODISimagery, Environ. Manag., 39, 876–886, 2007.
Stow, D., Hope, A., Boynton, W., Phinn, S., Walker, D., and Auer-bach, N.: Satellite-derived vegetation index and cover type mapsfor estimating carbon dioxide flux for arctic tundra regions, Ge-omorphology, 21, 313–327, 1998.
Varner, R. K., Crill, P. M., Talbot, R. W., and Shorter, J. H.: Anestimate of the uptake of atmospheric methyl bromide by agri-cultural soils, Geophys. Res. Lett., 26, 727–730, 1999.
von Glasow, R. and Crutzen, P. J.: Tropospheric halogen chem-istry, in: Treatise on Geochemistry Update 1, (4.02), edited by:Holland, H. D. and Turekian, K. K., Elsevier-Pergamon, Oxford,1–67, 2007.
Weissflog, L., Lange, C. A., Pfennigsdorff, A., Kotte, K., Elan-sky, N., Lisitzyna, L., Putz, E., and Krueger, G.: Sedi-ments of salt lakes as new source of volatile highly chlori-nated C1/C2 hydrocarbons, Geophys. Res. Lett., 32, L01401,doi:10.1029/2004GL020807, 2005.
Williams, W. D.: Environmental threats to salt lakes and the likelystatus of inland saline ecosystems in 2025, Environ. Conserv.,29, 154–167, 2002.
Wishkerman, A., Gebhardt, S., McRoberts, C. W., Hamilton, J. T.G., Williams, J., and Keppler, F.: Abiotic methyl bromide forma-tion from vegetation and its strong dependence on temperature,Environ. Sci. Technol., 42, 6837–6842, 2008.
Wucherer, W. and Breckle, S. W.: Vegetation dynamics on the drysea floor of the Aral Sea, in: Sustainable land use in deserts,edited by: Breckle, S. W., Veste, M., and Wucherer, W., Springer,52–69, 2001.
Yokouchi, Y., Noijiri, Y, Barrie, L. A., Toom-Sauntry, D., Machida,T., Inuzuka, Y., Akimoto, H., Li, H. J., Fujinuma, Y., and Aoki,S.: A strong source of methyl chloride to the atmosphere fromtropical coastal land, Nature, 403, 295–298, 2000.
Zhang, Y., Wang, Y. Y., Su, S. L., and Li, C. S.: Quantify-ing methane emissions from rice paddies in Northeast Chinaby integrating remote sensing mapping with a biogeochemicalmodel, Biogeosciences, 8, 1225–1235,doi:10.5194/bg-8-1225-2011, 2011.
www.biogeosciences.net/9/1225/2012/ Biogeosciences, 9, 1225–1235, 2012