organic substances in water - usgs · pdf filewhy study organic substances in water?, ......
TRANSCRIPT

GEOLOGICAL SURVEY CIRCULAR 848-C
Organic Substances in Water


Organic Substances in Water
Edited by Phillip E. Greeson Briefing Papers on Water Quality
GEOLOGICAL SURVEY CIRCULAR 848-C
1981
United States Department of the Interior JAMES G. WAIT, Secretary
Geological Survey Doyle G. Frederick, Acting Director
Library of Congress catalog-card No. 81-607886
Free on application to Distribution Branch, Text Products Section, U. S. Geological Survey, 604 South Pickett Street, Alexandria, VA 22304

FOREWORD
In August 1974, the Water Resources Division of the U.S. Geological Survey introduced the first of a series of briefing papers that were designed to increase the understanding of its employees of the significance of various aspects of water quality. Numerous briefing papers have been prepared by the Quality of Water Branch. Others will be prepared as the need arises. Each paper addresses a separate topic and is written in a nontechnical, easy-to-understand manner for distribution within the organization.
Because of the favorable reception that the papers have received and their apparent effectiveness in accomplishing the objective stated above, it would appear that their wider distribution would serve a useful purpose. It is hoped that a wide range of persons, including those interested in the quality of our Nation's water resources, but who have little or no technical training, will find value in reading the papers. Furthermore, it is hoped that the papers will be suitable for supplemental reading in secondary education programs and in beginning college-level courses.
The U.S. Geological Survey plans to publish several U.S. Geological Survey Circulars that contain compilations of briefing papers on particular aspects of water quality. This third Circular contains three papers describing selected topics on organic substances in water.
Philip Cohen Chief Hydrologist
III


CONTENTS
Page
Foreword__________________________________________________________________ III Abstract___________________________________________________________________ C1 Why study organic substances in water?, by Ranard J. Pickering--------------------- 3 Taste and odor in water, by Robert A. Baker ------------------------------------- 5 Classification and fractionation of organic solutes in natural waters,
by Jerry A. Leenheer ----------------------------------------------------- 11
ILLUSTRATIONS
Page
FIGURE 1. Solubility classification of organic compounds--------------------------- C12 2. Proposed classification scheme for organic solute characterization__________ 14 3. Fractionation-analysis flow chart for dissolved organic carbon------------- 16
TABLES
Page
TABLE 1. DOC fractionation analysis of Wyoming ground-water samples------------- C18 2. DOC fractionation analysis and selenium fractionation analysis of
Colorado ground-water samples ----------------------------------- 18
v


BRIEFING PAPERS ON WATER QUALITY
Organic Substances in Water
Edited by Phillip E. Greeson
ABSTRACT
This is the third of several compilations of briefing papers on water quality by the U.S. Geological Survey. Each briefing paper is prepared in a simple, nontechnical, easy-to-understand
Cl
manner. This U.S.- Geological Survey Circular contains papers on selected organic substances in water. Briefing papers are included on "Why study organic substances in water?," "Taste and odor in water," and "Classification and fractionation of organic solutes in natural waters."


Why Study Organic Substances in Water?
By Ranard J. Pickering
ABSTRACT
Organic substances are found virtually everywhere in our environment, and their importance in water-quality studies is being realized rapidly. Not only do naturally occurring organic compounds present problems in water utilization, but the myriad of manmade organic compounds have been shown to have many detrimental effects. Because of the tremendous number of these compounds, their identification and quantification is complex and expensive.
INTRODUCTION
Organic substances are those substances containing compounds of carbon and hydrogen; that is, hydrocarbons or compounds derived from them. At one time, it was believed that hydrocarbons could be formed only by living organisms- thus, the term "organic." Now, however, man has learned not only to produce many of these natural compounds synthetically but has created thoasands of new organic compounds in his quest for a better life.
The presence of organic materials in our enviro~ment is so extensive that it could be said that we live in an organic world. The food we eat, the clothes we wear, the homes in which we live all contain large amounts of organic substances. Everyone is aware of the tremendous increase in the use of plastics within the past few years, and the more recent trend toward production of biodegradable organic consumer products. The degradation of such materials, along with the disposal of wastes from their manufacture, constitute an ever-increasing source of organic contamination to our environment. On the other hand, there are manufactured organic substances that do not degrade, and the persistence of some of these compounds has caused great concern among environmentalists.
IMPORTANCE OF ORGANIC SUBSTANCES
Organic substances are important in waterquality studies for many reasons. The bacterial ox-
C3
idation of organic carbon from natural sources and from municipal, industrial, and agricultural wastes is a major factor leading to depletion of oxygen in many streams. Nutrients in organic substances can impart color and odor to water, and can act as carriers of trace metals and other elements by combining with them chemically or inducing their sorption by suspended sediment.
Every day we are adding to the list of manmade organic compounds that are suspected of having detrimental effects on the environment-either aesthetic or toxic. A few years ago, industry initiated an expensive change in formulation of detergents to reduce the unwanted persistence of their foaming properties. An ever-increasing number of pesticides have been banned or severely limited in application because of their documented or suspected adverse effects on valuable living things- both plant and animal; these effects vary from reduction of the probability of survival of newly hatched fish to causing cancer or birth defects in humans. There has been a recent suggestion that some of the substances considered most dangerous to man may be produced from harmless organic compounds by the very processes which we use in our water treatment plants to make the water safe for human consumption.
MEASUREMENT OF ORGANIC SUBSTANCES
Measurement of the unending variety of organic substances can be at many different levels of detail, ranging from the most gross measure, organic carbon, to determination of a specific organic compound or organometallic complex. These measurements can be either qualitative identifications or quantitative determinations. They may be for the purpose of establishing natural background levels of organic substances, or for regulatory detective work, such as identification of the source of polluting crude oil by its relative content of simple organic components.
Instrumentation for identification and quantification of organic substances is becoming more and more complex and expensive. Positive identification of a specific compound commonly requires a series of satisfactory comparisons with standards, using a different identification principle for each comparison, followed by a mass spectrogram for confirmation based on the way in which the compound breaks apart.
Questions about the effects on man or other forms of life of many of the organic substances present in our ground and surface waters will remain unanswered for many years. There is no good way to measure the chronic effect on man of longterm exposure to low concentrations of organic
0 substances, except by waiting for that long term to pass. Even then, probably only a statistical inference can be drawn- one which will be un
. provable to anyone who does not want to believe it.
CONCLUSION
The more information that we have on the occurrence and behavior of the wide variety of organic substances in water, the better will be the basis for the inferences that we must draw. When we conclude that a particular organic compound or group represents a hazard (or a benefit), we will have at least a limited basis for deciding on an appropriate course of action.
C4

Taste and Odor in Water
By Robert A. Baker
ABSTRACT
The cause of the taste and odor of water is the organic substances content. These substance·s often occur at concentrations of a single microgram per liter or less. The sources of the substances are varied; they may be either naturally occurring, or from the introduction of manmade materials into waterways.
INTRODUCTION
One may ask why briefing papers intended to describe organic sustances and their effects on the environment should include a discussion of taste and odor. Nature has endowed most persons with a sensory system much more responsive than many advanced instrumental devices. The senses of odor and taste are olfactory (smell) and gustatory (taste) responses.
Judgment about water supplies is foremost a sensory evaluation. Clarity, sparkle, freedom of color, and absence of objectionable taste and odor are desired properties. Except for certain sulfurous or highly mineralized waters, the cause of taste and odor of water is the organic substances content. The organic constituents that cause taste, odor, color, and toxicity are often at concentrations of micrograms per liter (p. g/L) or less. It is this ability to sense very low levels of contaminants that has afforded protection to man during evolutionary time. Surveillance is required, if water resources are to be protected and consumers are to be provided a high quality supply.
Sensory impairment from water has been chiefly a surface-water problem; ground water has been less affected. Adsorption processes in soils and rock usually remove dissolved and particulate organics. Humic components and other naturally occurring organics always have been present in surface water. Decomposition of vegetative matter is the principal source. However, man has complicated the situation. Not only has he released quantities of municipal and industrial wastewaters with concomitant organic pollution, but many of
C5
the organics are not biodegradable. Such biodegradably resistant organics are termed "refractory." They can originate from landfill leachates, agricultural runoff, and manufacturing wastes.
Waste-treatment technology has accelerated and not improved on natural processes for organic reduction. Even the best of treatment plants release refractory organics. As water reuse intensifies, because of population and industrial growth, so does the risk of exposure to refractory materials. In turn, refractory buildup requires more advanced wa.Ste-treatment processes.
Water-treatment plants generally can cope with low levels of organic wastes. They fail when slug discharges or organics are involved. Even the best of today's ·plants has limited analytical capability for providing early warning of slugs of organic constituents. By the time routine procedures identify a problem, there are already sources of consumer complaints in the distribution system. Seasonal and climatic factors also are involved. During low flow and decreased dilution, constituents normally present in water are more concentrated. Heavy rainfall or other runoff results in flushouts. Flushout dilution is offset by scour of decaying vegetative matter in benthic (bottom) layers. The associated organic materials often impose a severe taste and odor impact.
In the vernacular of the water technology, "taste and odor" are inseparable. Separation of the effect of odor from taste is impossible. There are four basic tastes: salty, sweet, sour, and bitter. Characterization of taste (flavor) by food technologists has been more successful than have attempts at characterization of odor. Flavor is the sum of taste and odor sensations. Odor characterization schemes have been proposed, but none has proven suitable for field use. Individuals engaged in related research often have problems describing odor character and communicating a precise description.

SUBJECTIVE PROPERTIES
Properties such as taste, odor, and appearance are evaluated by humans. These subjective or sensory judgments are made by procedures termed organoleptic testing. In order to understand the meaning of taste and odor measurement results, it is necessary to understand individual differences in acuity, to know the test conditions, and to specify the analytical conditions.
Persons differ in their response to selected stimuli (odor), not only in level of concentration but in characteristics. Thus, selection of a panel for taste and odor testing requires individual "calibration." Training often enhances an individual's sensory ability. Age, smoking and eating habits, state of health, and other factors can influence sensory capability.
A basic question the tester must ask concerns the intended use of sensory results. If the objective is to judge the response of the population as a whole, then the panel should be representative of the general public. However, if the threshold concentration that will minimize complaints is desired, then the most sensitive segment of the population should be tested. It is not unusual for there to be a 10,000-fold range in threshold odor concentratio.n as measured by individuals. For example, phenohc odor thresholds have been measured from 0.016 to 16.7 mg/L.
In research, large numbers of panelists can be justified. However, many small waterplants and field crews must make measurements with only limited staff. At least two persons should be involved in any taste and odor measurement: one to prepare the sample and one to make the measurement. Their roles can be switched to give a second result. The results may differ considerably and still be correct because of the ·aforementioned individual variation in response. This interaction between panelist and odor type is the most important consideration in determining panel constitution and size. A small carefully selected panel can predict effectively the response of the populationas-a-whole. The appended references discuss these factors.
OLFACTION
The physiology and theory of olfaction are subjects of extensive study and debate. Agreement is far from complete, but certain facts are established. There must be a molecular diffusion process that carries the odorant to the reception site of the organ. Volatility and solution in the sensory sur-
C6
face with transmission of a signal to the brain constitute the dynamic physiological process. All the odor stimuli do not affect the same olfactory cells. The odorant must "fit." Thus, the probability of impaction on the proper reception s!te is enhanced ~y the concentration and length of time the odorant 1s present. The olfactory membranes have a high surface to mass ratio and under normal circumstances they do a yeoman task. However, the senses can suffer fatigue. Fatigue, as defined in this discussion, is of a chemical nature as opposed to physical fatigue. It has been shown that presence of background odor, odor type, person involved, and the interaction of these effects influence the acuity of human response to odor.
There a_re practical considerations involved in providing the proper conditions and controls on sensory testing. These, too, will be reviewed. Suffice it to say that the number of sensory judgments that an individual can make over a given time will depend on these complex interrelated factors. Certain chemicals, such as formaldehyde and hydrogen sulfide, paralyze the olfactory nerves. Once this happens, the subject is unaware of higher concentrations. It is the reason operators entering sumps, chemical tanks, excavations, sewers, and so on, must follow safety procedures. They can be overcome before they realize their danger. In measuring threshold odors (air or water media), stimuli may alter reponse- perhaps significantly.
Although water-quality rationale presumes that any perceptible taste or odor is undesirable, this is not entirely valid. Persons adapt to the quality of their water supply. Often travelers cannot abide the taste and odor of supplies that are perfectly acceptable to local populations. The taste of distilled water or beverages prepared with distilled water is considered "flat" by most persons. These observations involve the concentration of stimuli (organic or inorganic) at or near threshold level. Greater concentrations are termed suprathreshold. Because of the emphasis on reducing taste and odor of water, most knowledge in the waterrelated field is at the threshold level. Suprathreshold sensory evaluation has not been investigated as intensely.
SAMPLING
Odor measurements ideally are made on freshly obtained samples. These should be taken in glassstoppered bottles that are completely filled.· Storage should be avoided, prior to sensory testing. If this is not possible, refrigeration is essential; it slows the natural biological processes

that alter the trace organic composition. Chemical and physical processes also are involved. If sensory measurements are made on stored samples, the results should note this fact- including the duration and conditions of storage. Sample temperature at the time of collection should be recorded. Samples that are at a temperature exceeding that specified for the sensory test should be cooled to the proper level.
ODOR MEASUREMENTS
Measurements are made to determine intensity and to characterize (describe) odor. The principle of the measurement is relatively simple. The water sample is diluted with odor-free water until the least definitely perceptible odor is obtained. Increasing concentrations of odorant are tested beginning with levels below the threshold. Odor is reported as threshold odor number, TON, or as odor intensity index, On. These terms are related:
TON =2°II.
The On is the number of times the concentration of the original sample is halved by addition of odorfree water to obtain the least definitely perceptible odor. The index is most convenient with industrial wastewaters. An On of 18 immediately imparts an impression of the strength based on the halving of the orginal sample 18 times. The equivalent TON is 262,000. The TON is the greatest dilution of the sample with odor-free water to yield the least definitely perceptible odor. A treatment-plant rawwater supply with a TON of 8 would have an on of 3. Note that when the TON= 1, the On=O.
The aforementioned methods of testing for odor describe precise controls for assuring odor-free glassware, odor-free dilution water, sample temperature, and environmental and operating conditions. It is imperative that the precautions and controls be observed, if meaningful results are to be obtained.
Research has established a basis for these controls. Ideally, the test area should be temperatureand humidity-controlled, and the air free of background odor. If the samples are colored, the testers will be biased in selecting the flask containing the sample from those containing only odorfree water. This problem can be eliminated by using opaque glassware for the samples or by monochromatic lighting that masks the sample color. Color is a factor in perception of taste. Food technologists have documented many instances when an individual attributed widely varying
flavors to the same substance (such as ice cream) when taste-and-odor-free coloring was added. However, if the individual is blindfolded or monochromatic lighting hides the color change, consistent and objective judgments are made. Samples containing turbidity should be handled in the same manner as colored samples to preclude bias.
Odor tests are made in covered 500-mL, widemouth Erlenmeyer flasks containing 200 mL of solution. The solution may be entirely sample or some dilution of sample. The odor-free dilution water is prepared by passing the best available reagent-grade water, often freshly distilled, through a fresh activated-carbon column. The carbon is contained in an all-glass system. However, the carbon surface can serve as a host for algae or other organisms which produce odorous metabolites. Therefore, the condition of the carbon and the quality of the odor-free water must be monitored carefully.
The specification that sensory measurements be made in an odor-free environment is based on experimental experience. The senses are affected by background odor. Similar background odors inhibit threshold measurements. Dissimilar odors enhance threshold detection. This was demonstrated in studies using n-butural and m-cresol. The former has a pleasant, sweet odor at low concentration. The latter has a "fence post," noxious odor. Unfortunately, field tests are seldom made without some background odor. Most water treatment plants are not equipped with an odor-free laboratory. The odor of chlorine and related compounds prevails. Every effort should be made to conduct sensory tests in areas of minimum background odor.
Temperature is a factor in olfaction. The reason is volatility. As temperature increases, volatility is enhanced. Odor threshold measurements usually are made at 40°C (near body temperature) or 60°C. Research has shown that for selected stimuli in aqueous solution, the TON will not differ significantly over a range of 20° to 60°C. However, these were precisely controlled tests (Baker, 1963), under ideal laboratory conditions. The panelists in the controlled tests noted that at 60°C, a temperature preferred by water utilities because of hot-water domestic implications, the odorant was readily lost and repeat tests required fresh samples. A "steaming" effect on the olfactory system was described. At 20°C, the samples were "dead." The 40°C temperature was preferred. Details of the odor-threshold testing procedure will not be given. These are described in American
C7
Society for Testing and Materials (1979) and American Public Health Association and others (1976).
STANDARDS
Quantitative odor standards can be of two kinds. A limit can be set on odor of the water as a whole, or the concentrations of individual substances can be regulated. The concentrations of substances are specified in terms of a ratio between allowable concentration and the threshold odor or taste concentration. Such standards are difficult to administer. The great variation in sensory response by individuals raises the question of the choice of regulatory limit. However, there is another factor. Many times the sensory causing substances combine in a nonadditive manner.
Two odorants mixed in aqueous solution may create (1) additivity, the resulting odor is the sum of the individual odors, (2) synergism or intensification, the odor produced exceeds that predicted by simple addition, or (3) antagonism or suppression, the odor produced is less than that predicted by simple addition. These effects are described by Rosen and others (1962) and Baker (1963). Synergism is the effect experienced most often and it has practical implications. If an industrial or municipal waste effluent of acceptable threshold is discharged to a receiving body with no appreciable odor, synergism could produce a water of unacceptable odor or synergism could produce a water of unacceptable quality. Obviously, standards based on single components or even the waters treated as seperate entities would fail.
European communities have set recommended taste and odor numbers for surface water supplies at values of 3 to 20. This variation is caused by their definition of classes of water use, ranging from the cleanest to the most polluted class. The World Health Organization states in its 1971 International Standards for drinking water that there should not be objectionable taste and odor in water. The Commission of European Communities has issued a proposed directive stating that a TON of zero is recommended with a maximum TON of 2 at 12°C or 3 at 25°C for drinking water. It is interesting that Russian standards for organic substances in raw waters to be used as domestic (drinking) supplies are based solely on taste or odor threshold concentrations. Generally, sensory threshold values are well below toxicologically dangerous levels. For most of the many organic
C8
substances in water, there is no toxicological information, particularly for defining risk from chronic exposure to low concentrations.
SELECTED REFERENCES
American Public Health Association, American Water Works Association, Water Pollution Control Federation, 1976, Standard methods for the examination of water and wastewater, 14th edition: New York, American Public Health Association, 1193 p.
American Society for Testing and Materials, 1979, Annual book of standards, Part 31: Philadelphia, American Society for Testing and Materials, 1280 p.
Baker, R. A., 1963, Critical evaluation of olfactory measurement: Journal of the Water Pollution Control Federation, v. 35, p. 582-591.
Baker, R. A., 1963, Odor effects of aqueous mixtures of organic chemicals: Journal of the Water Pollution Control Federation, v. 35, p. 728-741.
Baker, R. A., 1963, Odor testing laboratory: Journal of the Water Pollution Control Federation, v. 35, p. 1396-1402.
Baker, R. A., 1963, Threshold odors of organic chemicals: Journal of the American Water Works Association, v. 55, p. 913-916.
Baker, R. A., 1968, Limitation of present objective techniques in sensory characterization, correlation of subjective methods in the study of odors and taste: American Society for Testing and Materials, Special Technical Publication 440, p. 87-107.
Bruvold, W. H., 1968, Scales for rating the taste of water: Journal of Applied Psychology, v. 52, p. 245.
Dougherty, J. D., and Morris, R. 1., 1967, Studies on the removal of Actinomycetes musty taste and odors in water supplies: Journal of the American Water Works Association, v. 59, p. 1320-1326.
Ettinger, M. B., and Ruckhoft, C. C., 1951, Effect of stepwise chlorination on taste and odor producing intensity of some phenolic compounds: Journal of the American Water Works Association, v. 43, p. 561-567.
Gerber, N. N., and Lechavalier, H. A., 1965, Geosmin, an earthy-smelling substance isolated from Actinomycetes: Applied Microbiology, v. 13, p. 935.
Hoak, R. D., 1960, Discussion-Evaluating the taste and odor control problem: Journal of the American Water Works Association,. v. 52, p. 517-519.
Jenkins, D., Medsker, L. L., and Thomas, J. F., 1967, Odorous compounds in natural waters, some sulfer compounds associated with blue-green algae: Environmental Science and Technology, v. 1, p. 731-735.
Maloney, T. E., 1963, Research on algal odor: Journal of the American Water Works Association, v. 55, p. 481-486.
Medsker, L. L., Jenkins, D., and Thomas, J. F., 1968, Odorous compounds in natural water.Anearthy-smelling compound associated with blue-green algae and Actinomycetes: Environmental Science and Technology, v. 2, p. 461-464.
Middleton, F. M., Braus, H., and Ruckholft, C. C., 1952, Fundamental studies of taste in water supplies: Journal of the American Water Works Association, v. 44, p. 538-546.
Middleton, F. M., Grant, W., and Rosen, A. A., 1956, Drinking water taste and odor: Industrial and Engineering Chemistry, v. 48, p. 268-274.

Ogata, M., and Miyake, Y., 1973, Identification of substance in petroleum causing objectionable odor in fish: Water Research, v. 7, p. 1493-1504.
Popalisky, J. R., and Pogge, F. W., 1972, Detecting and treating organic taste and odor compounds in the Missouri river: Journal of the American Water Works Association, v. 64, p. 505-511.
Romano, R. H., and Safferman, R. S., 1963, Studies on Actinomycetes and their odors: Journal of the American Water Works Association, v. 55, p. 169-176.
Rosen, A. A., Baker, R. A., Cherry, A. J., Jenkins, D., Laughlin, H. F., Morris, R. L., Collins, R. P., and Lechevalier, H., 1970, Research on tastes and odors, Committee report: Journal of the American Water Works Association, v. 62, p. 59-62.
Rosen, A. A., Peter, J. B., and Middleton, F. M., 1962, Odor thresholds of mixed organic chemicals: Journal of Water Pollution Control Federation, v. 34, p. 7-14.
Safferman, R. S., Rosen, A. A., Maskni, C. L., and Morris, M. E., 1967, Earthy-smelling substances from a blue-green algae: Environmental Science and Technology, v. 1, p. 429-430.
C9
Sigworth, E. A., 1957, Control of odor and taste in water supplies: Journal of the American Water Works Association, v. 49, p. 1507-1521.
Silvey, J. K. G., 1959, Algae and associated organisms in water supplies-Manual for waterworks operators: Lancaster, Pa., Lancaster Press, 123 p.
Silvey, J. K. G., 1966, Taste and odor: Effect of organisms: Journal of the American Water Works Association, v. 58, p. 706-714.
Silvey, J: K. G., Glaze, W. H., Hendricks, A., Henley, D., and Matlock, J., 1968, Gas chromatographic studies on taste and odor in water: Journal of the American Water Works Association, v. 60, p. 440-450.
Silvey, J. K. G., Henley, D. E., and Wyatt, J. T., 1972, Planktonic blue-green algae: Growth and odor-producing studies: Journal of the American Water Works Association, v. 64, p. 35-39.
Silvey, J. K. G., and .Roach, A. W., 1964, Studies on microbiotic cycles in surface water: Journal of the American Water Works Association, v. 56, p. 60-72.
Zoetman, B. C. J., and Piet, G. J., 1972, On the nature of odors in drinking water resources of the Netherlands: Science of the Total Environment, v. 1, p. 399-410.


Classification and Fractionation of Organic Solutes in Natural Waters
By Jerry A. Leenheer
ABSTRACT
With the increasing interest in organic substances in water, there is an increasing need to characterize and identify the substances. This paper demonstrates how organic solutes can be classified, fractionated, and analyzed ·so that meaningful data are obtained.
INTRODUCTION
With the recent emphasis upon development of the Nation's fossil fuel resources to meet the growing need for energy, those scientists involved with water-quality studies are recognizing an increasing need for more definitive characterization of organic solutes in water so that changes in water quality due to organic residuals inputs can be determined. The need for organic solute characterization has long been recognized, but progress has been slow relative to inorganic solute characterization for the following reasons:
1. The large number of both known and unknown organic compounds which may be found in water make specific compound identification and quantification extremely difficult.
2. Organic solute concentrations in water are usually less than inorganic solute concentrations by two or more orders of magnitude.
3. Many organic solutes are unstable or volatile, which leads to water sampling and preservation problems.
4. Analytical instrumentation needs for organic solute characterization are usually complex, expensive, and often inadequate.
The following brief discussion is intended to present a simplified scheme of organic solute characterization which attempts to minimize these problems.
ORGANIC SOLUTE CLASSIFICATION
Although there is no single generally accepted classification scheme for organic compounds, separation techniques based on solubility and acidbase behavior have been in use for many years (figure 1) (Shriner and Fuson, 1940). These separation-classification schemes are useful, and indeed, are usually a necessary step in the identification of unknown organic compounds. However, they are time consuming, offer no means of concentrating the organic solutes, and do not relate the quantity of various subgroups to the total amount of organic solutes present. The development in recent years of instruments to rapidly determine dissolved organic carbon with precision and accuracy, as well as the development of synthetic resin adsorbents which concentrate and fractionate organic solutes by selective adsorption and desorption, permit greater utulization of these techniques in studies of organic solutes in water.
The present state of organic solute characterization is described graphically in a report by Christman and Hrutfiord (1973). They state that the development of organic waterquality standards have "* * * occurred on a piecemeal basis in response to current crises. At one time or another, scientific teams have deliberated the significance of and have established water-quality standards for specific compounds such as nitrilotriacetate (NTA) and phthalic acid; certain classes of compounds such as pesticides, phenols, polychlorinated biphenyls, phthalate esters, oil, and grease; and poorly defined groups of compounds known primarily by their properties or manner of isolation such as foaming agents, color, taste and odor, as well as the carbon adsorbable organics * * * "
Cll

Ether
s~nsol. sl s2 Water-Soluble Compounds
DETERMINATION OF SOLUBILITY
NaHC03
~L At A2
Acidic Compounds
N 1 N2 I Neutral Inert
neous Compounds Compounds pounds Compounds
M Basic Miscella-Com-
Class S1 : Almost all compounds of low molecular weight except (a) low-molecularweight hydrocarbons and their halogen derivatives and (b) low-molecular-weight compounds which are strongly polar.
Class S2 : Water-soluble salts of all kinds, many polyhydroxy compounds, polybasic acids, hydroxy acids, amino acids, some amides, amines, and sulfur derivatives.
Class A 1 : Acids and a few negatively substituted phenols such as picric acid. Class A2 : Weakly acidic compounds such as oximes, imides, amino acids, sulfonamides or
primary amines, primary and secondary nitro compounds, enols, phenols, and certain mercaptans.
Class B: Amines except diaryl- and triarylamines. Class M: Nitro compounds, amides, negatively substituted amines, nitrites, azo
compounds, hydrazo compounds, sulfones, sulfonyl derivatives of secondary amines, mercaptans, thioethers, and others.
Class N 1 : Alcohols, aldehydes, methyl ketones, alicyclic ketones, and esters with fewer than 9 carbon atoms.
Class N 2 : All aldehydes, alcohols, ketones, and esters with more than 9 carbon atoms, quinones, ethers, and unsaturated hydrocarbons. Anhydrides, lactones, and acetals may be found here as well as in Classes S1 and N 1 •
Class 1: Saturated aliphatic hydrocarbons, aromatic hydrocarbons, and halogen derivatives of these constitute the inert class.
FIGURE 1.-Solubility classification of organic compounds. (Modified from Shriner and Fuson, 1940.)
C12

Characterization schemes based on these standards limit themselves for the following reasons:
1. They are not comprehensive schemes designed to cover all organic solutes in water. Therefore, they apply only to the specifics for which they were designed, and many organic solutes are not detected or even suspected.
2. A materials balance based on organic carbon is not used. Therefore, one has no idea how the specific compounds and compound classes relate to the total organic solute concentration.
3. Many of the parameters such as color, taste and odor, and oils and grease are outdated and nonspecific.
4. Most organic solute characterization schemes are based on methodology which incorporates the liquid-liquid extraction or carbon adsorption to extract and concentrate organic solutes, prior to analysis. Both of these analytical techniques have their limitations and drawbacks.
Liquid-liquid extraction is an efficient method for extracting certain classes of organic solutes from water; particulary those nonpolar solutes which have low-water solubility and high solubility in organic solvents immiscible with water (ASTM Method D-2778, 1975). However, liquid-liquid extraction is relatively ineffecient as a method for extraction of highly polar organic solutes which prefer the aqueous phase. Highly polar organic solutes comprise a significant proportion of organic compounds found in natural waters and include polybasic acids, hydroxy acids, polybasic alcohols, polysaccharides, and amino acids. An examination of the organic solute distribution coefficients listed in the International Critical Tables (Forbes and Anderson, 1928) shows that these types of highly polar compounds are not significantly extractable by organic solvents which are immiscible with water.
Adsorption of organic solutes from aqueous solution upon granular activated carbon currently is the most widely used method of concentrating and fractionating organic solutes (ASTM Method D-2910, 1975). Activated carbon is unsurpassed as an agent which removes organic solutes from water by adsorption; however, its use in quantitative analytical schemes is limited by the fact that many organic solutes are adsorbed irreversibly upon and altered by the activated carbon. The limitations are documented in the literature (Baker and Malo, 1967; Burnham and others, 1973.)
In a comparison of processes which concentrate organic solutes found in natural water, adsorption is inherently superior to liquid-liquid extraction, flash evaporation, freeze concentration, and freeze drying for the following reasons:
L It is a low-energy process which does not involve a phase transition. Adsorption does not remove the organic solute from the aqueous environment as does liquid-liquid extraction and freeze drying, and it takes less energy for a solute to be adsorbed on a surface than to cross a liquid-liquid interface. Extraction into a different solvent also often alters the chemical nature of the solute. The low temperature and high vapor pressure at which adsorption occurs prevents losses of volatile solutes which are lost during flash evaporation or freeze drying.
2. Adsorption is selective. Adsorbents can be selected, such that organic solutes are separated from inorganic solutes, and organic solutes can be fractionated into different groups depending upon which adsorption mechanism is used. Flash evaporation, freeze concentration, and freeze drying indiscriminately concentrate both organic and inorganic solutes, such that reactions between the solutes often occur during concentration.
The main disadvantage of adsorption is that frequently it is irreversible, as often occurs on activated carbon and certain exchange resins. Irreversible adsorption usually is due to the heterogenous nature of the adsorbent's surface which binds the adsorbed solute by multiple adsorption mechanisms. An adsorbent used for analytical concentration and separations should have a homogeneous surface, such that only one adsorption mechanism is operative so that solutes can be quantitatively desorbed for analysis.
A proposed classification scheme for organic solute characterization based on resin adsorbents is given in figure 2. This classification scheme has a logical progression from one level of specificity to the next, and it uses materials balance based on organic carbon to quantify organic solute concentrations and fractionations. The organic load parameter, dissolved organic carbon, is very specific for organic solutes. The meaning and significance of the dissolved organic carbon parameters is discussed in a report by Malcolm and Leenheer (1973).
C13

0 ...... ~
1. Organic load parameter ---- ----- - - ----- - --- - Dissolved organic carbon
2. Solute sorption parameters- - - - - - - (a) Hydrophobic organic carbon (b) Hydrophilic organic carbon
3. Solute acid-base characteristics based on organic carbon - -(a) Acids
"' II\ I I \
I I \ I I \
4. Solute compound classes---- Anionic detergents
5. Specific solute compounds __ _
6. Solute complexes (both organic and inorganic) _____
"' /I' I I \
I \ I
~ II\
I I \ I I \
I I \
(b) Neutrals
"' /I\ I I \
I \ I I
I
Chlorinated hydrocarbon insecticides
-1. II\
I I \ I I \
I I
"' /I\ I I \
I I \
I I \.
(c) Bases
"" II\ I I \
I I \ I I \
Polynuclear a mines
"' II\ I I \
I I \ I \
1\ 'I\
I I \ I \
I : \
(d) Acids
.+._ II \
I I \ I I \
I I \
Polyuronic acids
.f\ 1 I \
I I \ I I \
I \
.f\ I I \
I I \ I \
I : \
FIGURE 2.- Proposed classification scheme for organic solute characterization.
(e) Neutrals
II\ I I \
I I \ I I '
I I \
Polysaccharides
I
I
fl., I I \
I I \ I I \
~ f., \
I I \ I ' I \
(f) Bases
1-. ,,, I I \
I I \ I I \
Amino sugars
.f\ /I \
I I \ I I \
I
A. II\
I. I \ I I \
I
>... ·u '+= ·u Q)
a. Ill
bD c .iii n3 Q) ..... u c
The two solute sorption parameters refer to mechanisms by which organic solutes interact with each other and with sediment. Hydrophobic organic solutes have hydrocarbon portions of their molecular structure which repel water and are attracted to hydrocarbon surfaces on sediment or to hydrocarbon portions of other solute molecules. The attraction mechanism involves physical adsorption which also is referred to as Van de W aal's forces. Hydrophilic organic solutes have waterattracting oxygen, nitrogen, or sulfur-containing functional groups over the entire molecular structure such that no part of the molecule can act in a hydrophobic manner. Hydrophilic solutes interact with each other and with sediments through hydrogen-bonding and ion-exchange mechanisms. Most hydrophobic organic solutes have hydrophilic portions to their molecular structure which render them water soluble. Organic detergents have a hydrophilic functional group for water solubility and a hydrophobic hydrocarbon component to attract hydrocarbon oils and render such substances water soluble. Hydrophobicity and hydrophilicity are opposite properties and organic solute analysis is greatly faciliated, if the solutes are first divided into these two classes.
The third level of classification refers to organic solute acid-base characteristics. Organic acids act as anions and organic bases act as cations. Many organic acids and bases are ionized only at extreme pH values, and act as neutral compounds at nominal pH values. Neutral organic compounds may lack acid or base functional groups, or they may have an equal number of acid and base groups which neutralize each other to give a neutral compound. Amino acids are such compounds. Organic solutes have been classified and separated into six groups which are very similar in their chemical reactivity.
Compound class analysis at the fourth level of classification is greatly facilitated by the previous separations which have removed most of the interfering organic and inorganic solutes. For example, all the chlorinated hydrocarbon insecticides will be found in the neutral hydrophobic groups with many interfering organic solutes and all inorganic solutes separated. Certain compound classes will be found in multiple groups at the third level of classification. For example, most amino acids will fall into both hydrophilic acid and base groups, but the amino acid phenylalanine will fall into the hydrophobic acid group because of the hydrophobic phenyl ring.
The last two levels of classification, specific solute compounds and solute complexes, demand more in the way of analytical requirements than may be necessary for some water-quality studies. However, if a water-quality study needs to get this specific, the proposed classification scheme lays a meaningful groundwork for quantitative organic solute analysis. An important point to realize in this classification scheme is that it serves as a preparative analytical scheme as well. Each classification level serves as the preparative step for the next level.
ORGANIC SOLUTE FRACTIONATION AND ANALYSIS
For a classification scheme to have utility and meaning, it must be based on methodology which separates the individual elements into the various classification groups. The analytical fractionation scheme which separates organic solutes up to the third level of classification (dissolved organic carbon fractionation analysis), is diagrammed on the flow chart of figure 3.
Water samples are collected in a 1-liter glass bottle specially prepared for the collection of pesticide water samples. The samples are preserved during shipment to the laboratory by chilling the samples on ice to 4 °C. Immediately upon receipt of the samples in the laboratory, all suspended particulate matter greater than 0.45 p.m in diameter should be removed. All organic constituents which remain in the water sample after separation arbitrarily are called dissolved, despite the fact that there is no discrete break between the particulate and dissolved states of matter. The arbitrary break at 0.45 p.m between sediment and solute was a widespread concensus among hydrologists involved with water-quality investigations.
Dissolved organic carbon (DOC) is the parameter used to determine organic solute fractionation to the third level of classification. DOC can be determined to a sensitivity limit of 0.1 mg/L with a precision of ± 10 percent (Malcolm and others, 1973). If only dissolved organic carbon fractionation analysis is desired, 1liter of sample is required if the DOC falls between 3 and 30 mg/L. Greater sample volumes are required for DOC concentrations lower than 3 mg/L, and lesser volumes for DOC in excess of 30 mg/L.
Hydrophobic organic solutes are defin!d quantitatively by the amount of DOC which is adsorbed upon XAD hydrophobic macroreticular resins placed in a glass column. This definition is
C15
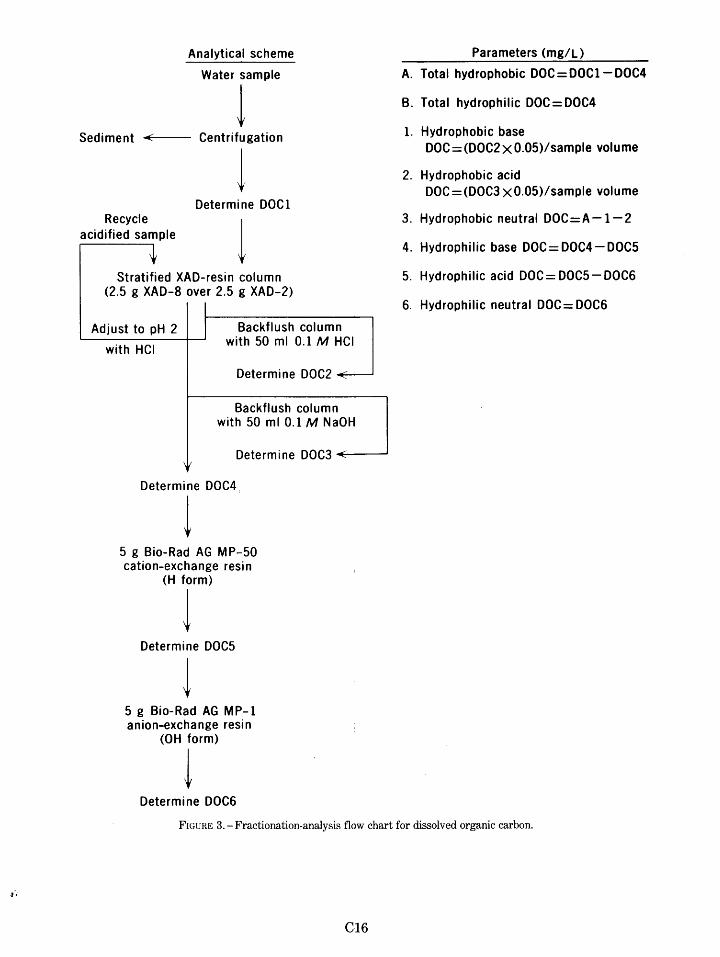
Analytical scheme
Water sample
1 Sediment +---- Centrifugation
Recycle acidified sample
t
1 Determine DOC 1
1 Stratified XAD-resin column
(2.5 g XAD-8 over 2.5 g XAD-2)
I Adjust to pH 2 I Backflush column
with 50 ml 0.1 M HCI with HCI
\I!
Determine DOC2 ~
Backflush column with 50 ml 0.1 M NaOH
Determine DOC3 •::::=---....J
Determine DOC4,
l 5 g Bio-Rad AG MP-50 cation-exchange resin
(H form)
l Determine DOCS
5 g Bio-Rad AG MP-1 anion-exchange resin
(OH form)
l Determine DOC6
Parameters (mg/L)
A. Total hydrophobic DOC=D0Cl-DOC4
B. Total hydrophilic DOC=DOC4
1. Hydrophobic base DOC=(DOC2x0.05)1sample volume
2. Hydrophobic acid DOC=(DOC3 x0.05)/sample volume
3. Hydrophobic neutral DOC=A-1-2
4. Hydrophilic base DOC=DOC4-DOC5
5. Hydrophilic acid DOC= DOC5-DOC6
6. Hydrophilic neutral DOC= DOC6
FIGURE 3.-Fractionation-analysis flow chart for dissolved organic carbon.
C16

admittedly method dependent upon the analytical fractionation scheme given in figure 3. The mechanisms and methodology of hydrophobic organic solute adsorption is discussed by Junk and others (197 4). Hydrophobic organic bases are separated by desorption from the resins with 0.1 M HCl and hydrophobic acids are separated by desorption using 0.1 M NH4 OH as the eluent. Hydrophobic organic neutral solutes remain on the column, and they are quantified by DOC differences. Most hydrophobic neutral solutes are soluble in organic solvents such as ethyl ether and menthanol, which are used as desorption solvents.
The DOC which remains in the eluent from the column packed with the XAD resins quantifies the hydrophilic organic solutes. Hydrophilic organic bases first are separated by passing the water sample through a glass column packed with a hydrogen-saturated cation-exchange resin which adsorbs organic bases which are protonated cations at sample pH 2. Hydrophilic organic acids next are separated in a similar manner by adsorption on a hydroxide-saturated anion-exchange resin. The DOC remaining in solution after the entire resin-adsorption procedure quantifies hydrophilic organic neutral solutes. Hydrophilic organic bases can be desorbed and eluted from the cation-exchange resin by 1 M NaOH and hydrophilic organic acids can be displaced from the anion-exchange resin by 1 M HCl. The many applications of ion-exchange resins for analytical separations are discussed by Khym (1974).
The analytical determination of selected organic compounds at the fourth level of classification can be performed directly on the appropriate fraction derived from the DOC fractionation analysis. Fairly specific colorimetric methods exist for anionic detergents, phenols, polysaccharides, polyuronic acids, amino acids, and others. The DOC fractionation analysis greatly aids the compound class analyses because the resin adsorption precedure serves to concentrate trace organic solutes, and the resultant fractionation removes many organic and inorganic interferents. Only the hydrophilic organic neutral solute fraction is not concentrated by DOC fractionation analysis, and this fraction can be effectively freeze concentrated because most of the inorganic solutes which form precipitates when freeze concentrated, have been removed previously by ion exchange. The methodology and limitations of freeze concentration are discussed by Baker (1969).
The analytical determination of certain compound classes, specific organic solute compounds,
and organic solute complexes usually demands additional fractionation by either liquid or gas chromatograph. Only about 10 percent of organic solute compounds are sufficiently volatile to be fractionated by gas chromatography; the remaining 90 percent must be fractionated by liquid chromatography. An excellent text on gas chromatography is by McNair and Bonelli (1969), and liquid chromatography is discussed by Hadden and others (1971). Most of the volatile organic solutes, such as various pesticides and hydrocarbons, are found in the hydrophobic neutral fraction. The volatility of organic solutes in the other fractions frequently can be enhanced by making nonpolar derivatives which have a greater volatility, thus making gas chromatography of these solutes possible. Gas chromatography still is preferred to liquid chromatography as a means of organic solute fractionation because of its greater versatility due to the absence of solvent during solute separation, and because of the greater number and sensitivity of solute detectors.
Final identification of specific organic solutes and solute complexes usually is accomplished by obtaining spectral information on the pure organic solute. Mass spectra, infrared spectra, nuclear magnetic resonance spectra, and ultraviolet-visible spectra are the most generally used spectra for identification purposes. Gas or liquid chromatography also can be used to identify an organic solute by comparison of its fractionation characteristics with the fractionation characteristics of various organic solute standards.
APPLICATION OF ORGANIC SOLUTE CLASSIFICATION SCHEME
This paper is the first written communication about the proposed organic solute classification scheme; therefore, the data which follow are limited to a few samples which were processed by the DOC fractionation analysis to test levels 1-3 of classification scheme. Hopefully, these data will provide an indicator of how the organic solute classification scheme can be used, applied, and interpreted in water-quality studies.
The first natural water samples to be processed by part of the DOC fractionation analysis were two ground-water samples. The samples were collected to observe changes in organic solute composition which occurred when a coal seam about 90 m below land surface was ignited in a U.S. Bureau of Mines in situ coal gasification experiment. When the burn was extinguished, ground water flooded the
C17
burned zone and became contaminated with organic combustion products. The data are presented in table 1. Sample 1 is uncontaiminated ground water withdrawn from the coal seam outside the burned area. Sample 2 is contaminated ground water withdrawn from a well in the center of the burned area.
TABLE 1.-DOC fractionation analysis of Wyoming groundwater samples
Sample 1 Sample 2 (uncontaminated) (contaminated)
Specific Conductance (p. ho/cm@ 25°C) ------------- 1,050 2,050
pH (Units)--------------------- 8.0 8.4 Initial DOC (mg/L) -------------- 42.0 22.0 Hydrophobic DOC (mg/L) ________ 26.0 11.0 Hydrophilic DOC (mg/L) _________ 16.0 11.0 Hydrophobic acid DOC (mg/L) _____ 10.5 8.6 Hydrophobic neutral DOC (mg/L) __ 15.2 2.3 Hydrophobic base DOC (mg/L) ____ .3 .1 Hydrophobic DOC (percent of initial
DOC) ----------------------- 61 50 Hydrophilic DOC (percent of initial
DOC) ----------------------- 39 50 Acid solutes (percent of
hydrophobic DOC) ------------- 40 78 Neutral solutes (percent of
hydrophobic DOC) ------------- 59 21 Base solutes (percent of
hydrophobic DOC) ---------- __ 1 1
The data in table 1 could be interpreted in the following manner. The greater ratios of hydrophobic:hydrophilic DOC in sample 1 most likely indicate that the DOC of the uncontaminated sample is more hydrocarbon (hydrophobic) in nature, and is at a lower oxidation state as compared to the contaminated sample 2. Most likely, the combustion of coal during gasification gave rise to organic solutes with a higher oxidation state (more acids), and a greater polar functional group content (more hydrophilic) as compared to organic solutes in the uncontaminated ground water. The elemental carbon which resulted from the carbonization of coal during gasification also may have adsorbed some of the hydrophobic solutes in contaminated sample 2, such that the hydrophobic DOC concentration is reduced. In this case, DOC fractionation analysis showed large fraction ratio changes which can be interpreted in terms of organic solute changes.
The last sample processed by DOC fractionation analysis illustrates an application to studies involving organic-inorganic complexes. In a study of ground water of high selenium content near Golden, Colorado, it was noted that several samples contained high concentrations of DOC, as
well as selenium. An experimental procedure based on DOC fractionation analysis was designed to observe also selenium fractionation both in the natural ground water and in a synthesized water sample which contained similar concentrations of selenium and other inorganic solutes with no DOC. Comparison of the data for the two samples should allow certain conclusions about the association between DOC and selenium. The data are presented in table 2.
TABLE 2.-DOC fractionation analysis and selenium fractionation analysis of Colorado ground-water samples
Sample 1 Sample 2 (ground water) (Se standard)
Specific Conductance (p. hos/cm at 25°C) ------------- 4,300 4,800
pH (Units)--------------------- 7.1 7.5 Initial Se (p. g/L) ---------------- 200 240 Initial DOC (mg/L) -------------- 10.0 0 Hydrophobic DOC (mg/L) ________ 5.8 0 Hydrophilic DOC (mg/L) --------- 4.2 0 Hydrophobic acid DOC (mg/L) ____ 3.4 0 Hydrophobic neutral DOC (mg/L) __ 2.4 0 Hydrophobic base DOC (mg/L) ____ 0 0 Hydrophilic acid DOC (mg/L) _____ 3.7 0 Hydrophilic neutral DOC (mg/L) ___ .5 0 Hydrophilic base DOC (mg/L) _____ 0 0 Se after hydrophobic base and
neutral DOC extraction (p. g/L) __ 200 380 Se after hydrophobic acid DOC
extraction (p. g/L) ------------- 240 240 Se after hydrophilic base DOC
extraction (p. g/L) ------------- 260 300 Se after hydrophilic acid DOC
extraction (p. g/L) ------------- 6 12 Se found in hydrophobic acid DOC
extract (p. g/L) ---------------- 1.3 Se found in hydrophobic neutral
DOC extract (p. g/L) ----------- 0
The data clearly show that only minor amounts of selenium were associated with the hydrophobic organic soluted fractions which comprise 58 percent of the total DOC. Almost all of the selenium was adsorbed from both samples as an anion on the anion-exchange resin. Because the fractionation of selenium in sample 2, which contained only inorganic solutes, was identical to the selenium fractionation of sample 1 which was the ground water, it is virtually certain that selenium in the ground water is not directly associated with organic solutes. This is not a surprising conclusion because most organic solutes and selenium solutes have anionic natures which discourage complex formation.
CONCLUSION
This paper has shown how organic solutes can be classified, fractionated, and anlayzed so that mean-
C18

ingful data are obtained without resorting to highly complex organic analyses. DOC fractionation analysis should be useful for indicating relative abundances and changes in composition of organic subgroups, and a "finger-printing'' tool for various waters. DOC fractionation analysis also can be used as a preparative procedure for additional analyses ultimately leading to specific compound and compound-style identification.
REFERENCES CITED
American Society for Testing and Materials,1975, Annual Book of ASTM Standards-Water, Part 31: Philadelphia, American Society for Testing and Materials, 922 p.
Baker, R. A., 1969, Freeze concentration of microorganics in water: American Society for Testing and Materials, Special Technical Publication 448: p. 65-77.
Baker, R. A., and Malo, B. A., 1967, Water quality characterization-Trace organics: Journal of the Sanitary Engineering Division, American Society of Civil Engineering, v. 93, no. 6, p. 41-54.
Burnham, A. K., Calder, G. V., Fritz, J. S., Junk, G. A., Svec, H. J., and Vick, R., 1973, Trace organics in water: Their isolation and identification: Journal of the American Water Works Association, v. 65, no. 11, p. 722-725.
Christman, R. F., and Hrutfiord, B. F., 1973, Water-quality standards for organic contaminants: Analytical limitations and possibilities: American Water Works Association, Proceedings of 15th Water Quality Conference, Urbana, Ill., Dec. 1973, p. 63-72.
Forbes, G. S., and Anderson, G. W., 1928, Phase-equilibrium data for condensed systems containing two liquid phases with a third component in distribution equilibrium between the two liquid phases being practically nonmiscible- Distribution coefficients: International Critical Tables, v. 3, p. 418-435.
Hadden, N., Baumann, F., MacDonald, F., Munk, M., Stevenson, R., Gere, D., Zamoroni, F., and Majors, R., 1971, Basic liquid chromatography: Walnut Creek, Calif., Varian Aerograph Corp., 253 p.
Junk, G. A., Richard, J. J., Grieser, M. D., Witiak, J. L., Arguello, M. D., Vick, R., Svec, H. J., Fritz, J. S., and Calder, G. V., 1974, Use of macroreticular resins in the analysis of water for trace organic contaminants: Journal of Chromatography, v. 99, p. 745-762.
Khym, J. X., 1974, Analytical ion-exchange procedures in chemistry and biology: Englewood Cliffs, N.J., PrenticeHall, Inc., 257 p.
Malcolm, R. L., and Leenheer, J. A., 1973, The usefulness of organic carbon parameters in water quality investigations: Institute for Environmental Sciences, Proceedings, Anaheim, Calif., April1973, p. 336-340.
Malcolm, R. L., Leenheer, J. A., McKinley, P. W., and Eccles, L.A., 1973, Supplement 11-0rganic carbon, in Goerlitz, D. F., and Brown, E., eds., Methods for analysis of organic substances in water: U.S. Geological Survey Techniques of Water-Resources Investigations, Book 5, Chapter A3, 34 p.
McNair, H. M., and Bonelli, E. J., 1969, Basic gas chromatography: Walnut Creek, Calif., Varian Aerograph Corp., 306 p.
Shriner, R. L., and Fuson, R. C., 1940, The systematic identification of organic compounds: New York, John Wiley & Sons, Inc., 458 p.
-k U.S. GOVERNMENT PRINTING OFFICE: 1981-341-614/238
C19


