a comparison of physical soil organic matter fractionation
TRANSCRIPT

Research ArticleA Comparison of Physical Soil Organic Matter FractionationMethods for Amended Soils
Sarah Duddigan ,1 Liz J. Shaw ,1 Paul D. Alexander,2 and Chris D. Collins1
1Department of Geography and Environmental Science, University of Reading, Reading, UK2Royal Horticultural Society, Wisley, UK
Correspondence should be addressed to Sarah Duddigan; [email protected]
Received 12 July 2019; Accepted 5 October 2019; Published 11 November 2019
Academic Editor: Teodoro M. Miano
Copyright © 2019 Sarah Duddigan et al. )is is an open access article distributed under the Creative Commons AttributionLicense, which permits unrestricted use, distribution, and reproduction in any medium, provided the original work isproperly cited.
Selecting a suitable physical fractionation method, to investigate soil organic matter dynamics, from the plethora that are availableis a difficult task. Using five different physical fractionation methods, on soils either nontreated or with a history of amendmentwith a range of exogenous organic matter inputs (Irish moss peat; composted horse manure; garden compost) and a resultingrange of carbon contents (6.8 to 22.2%), we show that method selection had a significant impact on both the total C recovered andthe distribution of the recovered C between unprotected, physically protected, or chemically protected conceptual pools. )esebetween-method differences most likely resulted from the following: (i) variation in the methodological fractions obtained (i.e.,distinguishing between aggregate size classes); (ii) their subsequent designation to conceptual pools (e.g., protected versusunprotected); and (iii) the procedures used in sample pretreatment and subsequent aggregate dispersion and fractionation steps.)e performance of each method also varied depending on the amendment in question. )e findings emphasise the need for anunderstanding of the nature of the soil samples under investigation, and the stabilisation mechanism of interest, both prior tomethod selection and when comparing and interpreting findings from literature studies using different fractionation methods.
1. Introduction
Soil organic carbon (SOC) is one of the most importantindicators of soil quality [1]. Soils contain approximatelythree times more carbon than the atmosphere or terrestrialvegetation [2], accounting for 80% of the terrestrial carbonpool [3]. )erefore, maintenance and enhancement of soilcarbon stocks is of great importance when considering boththe promotion of soil health and the regulation of the globalcarbon cycle, a fact recognised during the 21st Conference ofthe Parties to the United Nations Framework Convention onClimate Change (COP21) in Paris, 2015, where the “4 permille Soils for Food Security and Climate” action agenda wasdeveloped [4].
)e application of organic soil amendments in horti-cultural systems, such as manure and composts (i.e., greenwaste compost and spent mushroom compost), has beenreported to increase SOC [5–7]. However, in order toinform future management strategies that aim to enhance
SOC storage, it is vital that research establishes whichmechanisms are dominant in organic C stabilization insoils [8].
)ere has been a traditional view, regularly reported in theliterature [8–13], that there are three key stabilisation mech-anisms that can protect SOC contained within soil organicmatter (SOM) from being decomposed and mineralised insoils: (i) Biochemical stabilisation, relating to the presence andselective preservation of molecules resistant to decompositionas a result of their chemical structure.)is recalcitrancemay beeither intrinsic to initial structure, or created as a result of theformation of chemically complex structures through con-densation and secondary synthesis reactions. (ii) Physicalstabilisation, relating to the occlusion of SOM within aggre-gates, causing physical disconnection and therefore in-accessibility of SOM to decomposer microorganisms. (iii)Chemical stabilisation, whereby SOM becomes chemicallyinaccessible to decomposers as a result of sorption of SOMontomineral surfaces and complexation with metal ions.
HindawiApplied and Environmental Soil ScienceVolume 2019, Article ID 3831241, 12 pageshttps://doi.org/10.1155/2019/3831241

Historically, it was thought that SOM persistence wasmostly a function of biochemical stabilisation [11]. However,more recent synthesis of evidence questions the importanceof selective preservation of structures traditionally thoughtto be inherently recalcitrant (e.g., lignin) and also the im-portance of structures with acquired biochemical re-calcitrance via secondary synthesis (“humification”) in thecontrol of SOC persistence [2]. Instead, the consensus nowsupports the fact that physical stabilisation through occlu-sion and chemical stabilisation via sorption and complex-ation are the dominant mechanisms controlling the long-term persistence of SOC [2].
Soil physical fractionation methods have been adoptedto quantify the amount of C associated with pools of dif-ferent theoretical stability, and how these C pools are af-fected by various management techniques, including theaddition of organic amendments [7, 12]. )ese fractionationmethods typically quantify SOC that is (i) contained withinaggregates and therefore, in theory, physically protectedthrough occlusion; (ii) complexed within organomineralassociations and therefore chemically protected; or (iii) un-protected (free) and therefore accessible to microorganisms,and their enzymes, for decomposition. )ese methods can beinformative about the stability of SOM in the soil system [10]and the sensitivity of SOM dynamics to change [14]. Inaddition, physical fractionation can increase understandingand prediction of SOC dynamics if procedures can producefractions that are translatable to pools in soil carbon models[15]. However, the plethora of physical fractionation methodsavailable in the literature makes it difficult to select an ap-propriate and informative method. Furthermore, it is likelythat the suitability of a particular method, and thereforeappropriate method selection, will depend on soil manage-ment history. Recent fractionation comparisons [16] havefocussed on arable soils with SOC contents (1-2%) typical ofsuch systems that are ploughed, NPK fertilized, and receive noOM amendment other than crop residues (maize) or noinputs/tillage at all (miscanthus). It is uncertain whetherconclusions from method intercomparisons done in arablesoils are applicable to soils receiving annual exogenous OMamendments, such as those in horticultural systems, andlikely differing in both total SOC content and the distributionof SOC between physical fractions.
)e aim of this study was therefore to trial five publishedphysical fractionationmethods in soil receiving horticulturalOM amendments, with particular interest in comparing thedistribution of C among fractions defined as physicallyprotected, chemically protected, or unprotected as reportedby each method. An additional objective was to evaluate thelogistical ease of conducting each method in the laboratory.To the best of our knowledge, this is the most extensivecomparison of physical fractionation methods to be con-ducted within the same laboratory, by the same operator, forsoils receiving exogenous organic matter inputs.
2. Methods
2.1. Site Description and Soil Sampling. Soil samples (0–15 cm depth) were taken in October 2013 from the Royal
Horticultural Society’s (RHS) Deer Farm in Wisley, UK(51.323428°N, − 0.474392°W), details of which can befound in the study by Alexander and Nevison [17]. )e siteconsisted of a sandy loam soil that had received annualapplications for 6 years of either: Irish moss peat (Pt);composted horse manure (H); or garden compost at fullrate (GCf) and half rate (GCh) from collected pruningsand cuttings from RHS Wisley Garden, UK. Prior tosampling (May 2013), the plots had been sown withPhacelia tanacetifolia Bentham, with above ground ma-terial harvested and removed in September 2013. )eamendments were applied annually in early spring as a5 cm layer on the surface of the soil (with the exception ofthe GCh treatment which received 2.5 cm), and in-corporated into the top 15 cm of soil with the use of arotovator. Soil from an unamended, bare plot control (BP)was also collected. )ese different organic matteramendments resulted in a range of total C contents acrossthe treatments (Table 1).
)e different soil amendment treatments, on a single soiltype, have been selected solely to provide a suite of Ccontents to test the different physical fractionation methodswhilst avoiding the ambiguity of the use of multiple soiltypes with various textures etc.
Bulk soils of each treatment were sampled by auger from0 to 15 cm. A sample splitter was used to obtain 15 repre-sentative subsamples of each soil (3 replicate samples foreach fractionation method). Samples were further prepared(i.e., dried and sieved) according to the requirements of eachindividual method (Table 2).
2.2. Organic Matter Fractionation. Soil subsamples weresubjected to the five fractionation procedures according tothe following published methods: (i) Plaza et al. [18] using amicroaggregate isolator, sonication, and density flotation(PL); (ii) Six et al. [9] using size separation, a micro-aggregate isolator, and density floatation (SD); (iii) Six et al.[9] using size separation, a microaggregate isolator, andsodium hexametaphosphate (NaHMP) for dispersion(SMI); (iv) Sohi et al. [19] using sonication and densityfloatation (SO); and (v) Zimmermann et al. [15] using sizeseparation and density flotation (ZM). Each of the methodswill be referred to by the stated abbreviations from thispoint forward. A brief overview of key features of eachmethod can be found in Table 2. All organic matterfractionation methods were conducted in the same labo-ratory, by the same operator.
)e methods differ in the number and description of thephysical fractions that they obtain. An overview of thesemethods with fractions categorised by conceptual pool as: (i)physically protected (in aggregates, particularly micro-aggregates); (ii) chemically protected (through mineral as-sociation); or (iii) unprotected by chemical or physicalmechanisms (free particulate organic matter), is given inTable 3.
)e categorisation in Table 3 is somewhat subjectivesince some methods (SO and ZM) designate SOM occludedin microaggregates and macroaggregates as physically
2 Applied and Environmental Soil Science

protected but others (SD and SMI) only consider OM oc-cluded in microaggregates as physically protected. )esediffering descriptions between methods have been accom-modated in Table 3 as follows: methods that definemicroaggregates as a fraction have had the OM in thisfraction categorised as physically protected and macroag-gregate OM as unprotected. Methods that do not distinguishbetween microaggregates and macroaggregates, and poolthem as one aggregate fraction, have had the whole aggregatefraction classified as physically protected.
In addition, some of the methods use different sizeclasses during sieving, which may result in overlaps overdifferent conceptual pools. )e ZM method, for example,classes OM that is <63 μm as chemically protected, whereasSD and SMI uses <53 μm sieves. )erefore, the 53–63 μmfraction of OM obtained may contain unprotected OM,chemically protected OM, and physically protected OMdepending on the method used. )us, it is uncertain whichmethod is most efficient at separating physically protectedOM from chemical protection.
It should also be noted that that the nomenclatureassigned to each of the fractions in Table 3 are the namesused in the original publications. )erefore, due to between-publication differences in nomenclature, fractions that areidentical, or very similar, may have different names. Forexample, free particulate OM (that is not protected byphysical or chemical mechanisms) is defined as particulateOM, or POM, in the ZM method, free OM (fOM) in the PLmethod, or the free light fraction (FLF) in the SO method.
Of the methods tested, only two, PL and ZM, definedissolved organic matter (DOM) as a fraction. However, theZM method required such a large volume of water to washout DOM that, in this case, the concentrations were too lowto detect on a Shimadzu TOC analyser. )e low concen-tration of DOM in these samples (mean 3.6mg C g·soil− 1)recovered in the PL method meant that its contribution wasnegligible to total C recovery in this trial. )erefore, in theinterest of simplifying comparisons betweenmethods, DOMwas excluded from analysis.
2.3. Chemical Analyses. All fractions obtained were dried atthe temperature stated in the corresponding publishedmethod. Samples were ground to 0.2mm using a TEMA discmill and analysed for total C content on a )ermo ScientificFlash 2000 CHNS/O analyser.
Resulting data were expressed as the amount of physi-cally protected, chemically protected, and unprotected Cas mg C g·soil− 1. In addition, in order to account for differenttotal C recoveries, the amount of aggregate C and free POMC obtained using each method was also expressed as apercentage of the total C recovered in each method.
Finally, in order to assess the quality of the fractionsobtained (and therefore their suitability for further analysis),the C concentration of the fractions expressed as mg Cg·fraction− 1 was also calculated. )is allows us to review theeffects of mineral components, in particular sand, in thedifferent fractions of each method.
2.4. Statistical Analysis. All statistical analyses were con-ducted using Minitab (18.0). Once tested for normality(Anderson–Darling test) and equal variance (Levene’s test),two-way analysis of variance (ANOVA), with interactions,was conducted using fractionation method (PL, SD, SMI,SO, or ZM) and soil treatment (BP, GCf, GCh, H, or Pt) asfactors. Tukey’s honest significant difference test was usedfor post hoc comparison of means. In the case where data arerepresented as a percentage (e.g., % recovery), all the datawere arcsine transformed before normality and homoge-neity of variance testing, and subsequent two-way ANOVA.
As this is a methods comparison, discussing the effects ofamendment application on C dynamics is not within thescope of this research. )erefore, the results presented anddiscussed here will focus on the effect of fractionationmethod and interactions, rather than the effect of amend-ment treatment alone on different conceptual C pools.
3. Results
3.1. Total C Recovery. )e physical fractionation methodused in this trial had a significant impact on how much C oftotal soil C could be recovered during the fractionationprocess (p< 0.05; Table 4). )e SMI and SO methods re-covered more C in total than the other three methods (PL,SD, and ZM). )e bare plot control treatment, which as theunamended soil has the lowest total C content (Table 1), hada higher recovery than the peat soil, which had the highest Ccontent due to amendment. )ere were no other significantdifferences between treatment; however, there were signif-icant interactions between method and treatment (p< 0.05).For example, total C recovery for horse manure-treated soilwas the lowest for four out of the five methods (PL, SD, SO,and ZM) but was the highest when using the SMI method(Table 4).
3.2. Unprotected C Recovery. Figure 1(a) shows that the PLand SMI recovered more unprotected C (p< 0.05) than theother three methods (SD, SO, and ZM) but the effect ofmethod on recovery depended on OM treatment (p< 0.05).For example, recovery of unprotected C in horse manure-amended soil was particularly high when using the SMImethod and, when using the PL method, unprotected Crecovery in peat-amended soil was high.
Table 1: C content of whole (not sieved) soils used for the frac-tionation trials.
Treatment Abbreviation Whole soil C(mg C·g− 1)
Nonamended bare plot control BP 68.22± 2.23eGarden compost (full rate) GCf 112.28± 5.66cGarden compost (half rate) GCh 81.67± 7.98dComposted horse manure H 145.86± 3.81bPeat Pt 222.40± 1.64a
Data are mean± standard deviation (n� 3). Mean values not sharing asuperscript letter are significantly different (p< 0.05; Tukey’s significantdifference).
Applied and Environmental Soil Science 3

)ree of the five methods (PL, SO, and ZM) involveinitial separation of free POM, not associated with aggre-gates or mineral components, using density flotation. )eSD and SMImethods do not have an initial separation of freePOM before aggregate dispersion; so, it is difficult to dis-tinguish between intra-aggregate OM and free particulateOM of the same aggregate size class (discussed later) anddecipher how they compare to the other methods withregard to the isolation of free POM. Examining thosemethods that did distinguish a free POM fraction revealed asignificant effect of method (p< 0.05) on C recovery in freePOM (Table 5) with the PL method recovering the most freePOM C, followed by ZM and SO. However, free POM Crecovery for a given method depended on OM treatment, asevidenced by a significant method∗ treatment interaction(p< 0.05). For example, PL and ZMmethods recovered more
POM C in the full-rate garden compost treatment than thehalf-rate treatment but the SO method recovered similaramount of POM C for both (Table 5). In addition, POMrecovery in the horsemanure treatment was among the lowestin the SO method, but one of the highest for the PL and ZMmethods (Table 5).
3.3. Physically Protected C Recovery. Fractionation methodhad an overall significant effect on recovery of physicallyprotected C (p< 0.05; Figure 1(b)). )e SMI, SO, and ZMisolated significantly more physically protected C than theSD and PL method, with the PL method isolating the leastphysically protected C. Again, there were significantmethod× treatment interactions (p< 0.05) according totwo-way ANOVA. For example, the SO method isolated the
Table 2: Overview of physical fractionation methods.
Physical fractionation method
Plaza et al. [18](PL)
Six et al. [9] density(SD)
Six et al. [9]microaggregate isolator
(SMI)
Sohi et al. [19](SO)
Zimmermann et al. [15](ZM)
Sample prep Soil air-dried and sieved(<2mm)
Air-dried soilnot sieved
Air-dried soil notsieved
Field freshsoils notsieved
Soil air-dried and sieved(<2mm)
Initial sizefractionation
Wet sieved into four sizeclasses:
Wet sieved into four sizeclasses:
Lightly sonicated at22 J·ml− 1 then wet sievedinto two size classes:
Large macroaggregates(>2000 μm)
Large macroaggregates(>2000 μm)
Intra-aggregate, freePOM, and sand
associated (>63 μm)Small macroaggregates
(250–2000 μm)Small macroaggregates
(250–2000 μm) Dissolved, clay and siltassociated (<63 μm)Microaggregates
(53–250 μm)Microaggregates(53–250 μm)
Silt and clay (<53 μm) Silt and clay (<53 μm)Density fluidused SPT 1.85 g·cm− 3 SPT 1.85 g·cm− 3 None NaI 1.80
g·cm− 3 SPT 1.80 g·cm− 3
Aggregateclasses
Distinguishes betweenmacroaggregates
(250–2000 μm) andmicroaggregates
(<250 μm)
Distinguishes betweenlarge macroaggregates(>2000 μm), smallmacroaggregates
(250–2000 μm), andmicroaggregates(53–250 μm)
Distinguishes betweenlarge macroaggregates(>2000 μm), smallmacroaggregates(250–2000 μm),microaggregates(53–250 μm), andmicroaggregatescontained withinmacroaggregates
All aggregatesin onefraction
All aggregates in onefraction
Aggregatedispersionmethod
Macroaggregates use amicroaggregate isolator
(breaks upmacroaggregates whilstkeeping microaggregatescontained within intact)
Placed under a vacuum(138 kPa)
Macroaggregates use amicroaggregate isolator
(breaks upmacroaggregates whilst
keeping themicroaggregates
contained within intact)
Sonication at1500 J·g− 1 None
Microaggregates:sonication at 1500 J·g− 1
Microaggregates: 0.5%NaHMP to disperse
Mineralfraction Sand, silt, and clay Sand, silt, and clay
Silt and clay (sandmakes up part of theaggregate fractions)
Sand, silt, andclay
Silt and clay (sandmakes up part of theaggregate fractions)
4 Applied and Environmental Soil Science

most physically protected C in the peat and garden compost(both full and half rate) amended soil but did not for the bareplot control or the horse manure amended soil.
3.3.1. Aggregate C. As mentioned previously, somemethods (PL, SD, and SMI) distinguish between micro-aggregate and macroaggregate C, and designate them asphysically protected and unprotected, respectively. )e SOand ZM methods, however, group all aggregate OM to-gether. Examining howmuch total aggregate C was isolatedby each method, regardless of size class (Table 6), revealedthat fractionation method had an overall significant effect(p< 0.05). Post hoc analysis showed that the SD and SMImethods recovered significantly more aggregate C than the
other three methods and the SO method recovered sig-nificantly more aggregate C than the PL method with re-covery for the ZM in between the two (Table 6). However,there were significant method× treatment interactions(p< 0.05). For example, out of the OM treatments, ag-gregate C recovery was amongst the highest for horsemanure for the SD method but the lowest for the SOmethod.
3.4. Chemically Protected C Recovery. Fractionation methodhad an overall significant effect on chemically protected Crecovery (p< 0.05; Figure 1(c)). )e SO method recoveredsignificantly more chemically protected C than all othermethods, and the PL recovered the least. Once again, however,
Table 3: Fractions obtained in each method as categorised by stabilisation mechanism: physically protected, chemically protected, orunprotected OM. Nomeclature provided by the original publications.
Physical fractionation method
Stabilisationmechanism Plaza et al. [18] (PL) Six et al. [9] density (SD)
Six et al. [9]microaggregate isolator
(SMI)
Sohi et al. [19](SO)
Zimmermannet al. [15] (ZM)
Unprotected
(i) Free OM (fOM)(i) Free POM within largeand small macroaggregates(lM fPOM and sM fPOM)
(i) Large POM/Litter>2000 μm (>2000POM)
(i) Free light OM(FLF)
(i) Particulateorganic matter
(POM)(ii) Intramacroaggregate
OM (i-MaOM)(ii) Coarse POM in large
and smallmacroaggregates (lMcPOM and sM cPOM)
(ii) Dissolvedorganic C (DOC)(iii) Dissolved OM
(DOM)
Physical (i) IntramicroaggregateOM (i-miOM)
(i) Free POM withinmicroaggregates (m fPOM)
(i) IntramicroaggregatePOM (imPOM)
(i) Intraaggregatelight OM (iAFLF)
(i) Sand and stableaggregates (S+A)
(ii) Free POM inmicroaggregates within largeand small macroaggregates(mlM fPOM and msM
fPOM)
(ii) IntramicroaggregatePOM within large andsmall macroaggregates(imlM POM and imsM
POM)
Chemical (i) Mineral-associated(MinOM)
(i) Mineral-associated SOCwithin large and small
macroaggregates (lM mSOCand sM mSOC)
(i) Silt and clay (s+ c)
(i) Mineral-associated OM
(MA)
(i) Silt and clay(s+ c)
(ii) Mineral-associated SOCwithin microaggregates (m
mSOC)
(ii) Silt and clay withinlarge and small
macroaggregates (lM s+ cand sM s+ c)
(ii) Resistant soilorganic C (rSOC)
(iii) Silt and clay (s+ c) (iii) Silt and clay withinmicroaggregates (m s+ c)
Table 4: Total C recovery of fractionation method for amended soil.
TreatmentMethod
PL SD SMI SO ZM Mean of treatment (n� 15)BP 60.3± 2.2 67.4± 5.6 101.8± 8.3 75.8± 3.7 53.0± 1.1 71.7 ± 4.9AGCf 69.2± 0.7 65.1± 0.6 70.1± 3.3 85.5± 1.9 66.3± 0.9 71.2 ± 2.1ABGCh 74.6± 1.5 63.9± 1.6 64.5± 1.5 74.3± 10.3 72.2± 5.9 69.9 ± 2.4ABH 54.3± 1.3 44.3± 5.3 127.3± 17.2 63.7± 1.2 47.8± 1.9 67.5 ± 8.7ABPt 70.8± 1.2 51.3± 0.5 51.4± 1.8 77.8± 8.1 61.9± 6.4 62.6 ± 3.3BMean of method (n= 15) 65.8 ± 2.1b 58.41 ± 2.8b 83.01 ± 8.1a 75.4 ± 3.0a 60.24 ± 2.8bValues are expressed as a percentage of whole, unsieved, soil C (shown in Table 1). Mean± standard error (n� 3). Lowercase letters in the bold values signifymethods that are not significantly different, and uppercase letters signify treatments that are not significantly different according to two-way ANOVA withTukey’s post hoc testing (p> 0.05). Method∗ treatment interactions (p< 0.01).
Applied and Environmental Soil Science 5

there were significant method × treatment interactions. Forexample, the SOmethod recovered high amounts of chemicallyprotected C in the horse manure and bare plot controltreatments, compared to other methods (Figure 1(c)).
3.5. C Concentration of Fractions. Examining the quantity ofC in the fraction, relative to the mass of the fraction(Figure 2), reveals that the C concentration of the un-protected fraction obtained using the SMI size separation
BP(D)
GCf(C)
GCh(D)
H(B)
Pt(A)
C in
unp
rote
cted
frac
tion
(mg
C/g
soil)
PL (a)SD (b)SMI (a)
SO (b)ZM (b)
0
50
100
150
200
(a)
BP(B)
GCf(A)
GCh(A)
H(AB)
Pt(A)
PL (c)SD (b)SMI (a)
SO (a)ZM (a)
C in
phy
sical
ly p
rote
cted
fra
ctio
n (m
g C/
g so
il)
01020304050607080
(b)
BP(A)
GCf(B)
GCh(BC)
H(A)
Pt(C)
PL (c)SD (b)SMI (d)
SO (a)ZM (b)
C in
chem
ical
ly p
rote
cted
fra
ctio
n (m
g C/
g so
il)
0
10
20
30
40
50
60
(c)
Figure 1: Recovery of (a) unprotected, (b) physically protected, and (c) chemically protected C using different fractionation methods foramended soils. Error bars for standard error (n� 3). Methods sharing the same lowercase letter and treatments sharing the same uppercaseletter are not significantly different according to two-way ANOVA and Tukey’s post hoc testing (p< 0.05). Methods: PL: Plaza et al. [18]; SD:Six et al. [9] using microaggregate isolator and density flotation; SMI: Six et al. [9] using microaggregate isolator and NaHMP for dispersion;SO: Sohi et al. [19]; ZM: Zimmermann et al. [15]. Samples: BP: bare plot control; GCf: garden compost (full rate); GCh: garden compost (halfrate); H: composted horse manure; Pt: Irish peat moss.
Table 5: C recovered from free particulate organic matter.
TreatmentMethod
PL SO ZM Mean of treatmentBP 33.4± 0.1 21.5± 2.6 22.0± 5.3 25.6 ± 2.6DGCf 73.4± 2.8 41.8± 6.7 65.2± 3.0 60.1 ± 5.2BGCh 50.9± 5.4 40.2± 8.7 49.7± 2.6 46.9 ± 3.5CH 72.6± 3.6 31.9± 4.3 66.0± 1.2 56.8 ± 6.5BCPt 94.2± 1.8 61.5± 5.3 62.8± 10.2 72.8 ± 6.3AMean of method 64.9 ± 5.7a 39.4 ± 4.2c 53.1 ± 4.9bValues are expressed as a percentage of total C recovered. Mean± standard error (n� 3). Lowercase letters in the bold values signify methods that are notsignificantly different, and uppercase letters signify treatments that are not significantly different according to two-way ANOVAwith Tukey’s post hoc testing(p> 0.05. Method∗ treatment interactions p< 0.01).
6 Applied and Environmental Soil Science
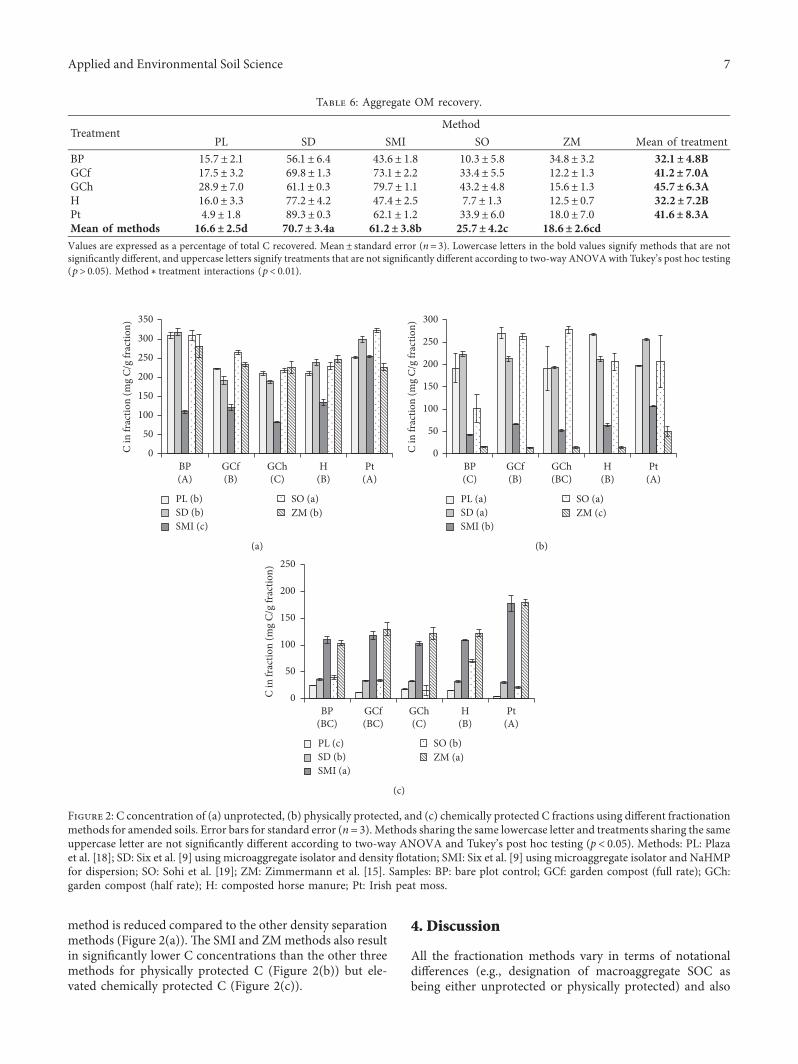
method is reduced compared to the other density separationmethods (Figure 2(a)). )e SMI and ZMmethods also resultin significantly lower C concentrations than the other threemethods for physically protected C (Figure 2(b)) but ele-vated chemically protected C (Figure 2(c)).
4. Discussion
All the fractionation methods vary in terms of notationaldifferences (e.g., designation of macroaggregate SOC asbeing either unprotected or physically protected) and also
Table 6: Aggregate OM recovery.
TreatmentMethod
PL SD SMI SO ZM Mean of treatmentBP 15.7± 2.1 56.1± 6.4 43.6± 1.8 10.3± 5.8 34.8± 3.2 32.1 ± 4.8BGCf 17.5± 3.2 69.8± 1.3 73.1± 2.2 33.4± 5.5 12.2± 1.3 41.2 ± 7.0AGCh 28.9± 7.0 61.1± 0.3 79.7± 1.1 43.2± 4.8 15.6± 1.3 45.7 ± 6.3AH 16.0± 3.3 77.2± 4.2 47.4± 2.5 7.7± 1.3 12.5± 0.7 32.2 ± 7.2BPt 4.9± 1.8 89.3± 0.3 62.1± 1.2 33.9± 6.0 18.0± 7.0 41.6 ± 8.3AMean of methods 16.6 ± 2.5d 70.7 ± 3.4a 61.2 ± 3.8b 25.7 ± 4.2c 18.6 ± 2.6cdValues are expressed as a percentage of total C recovered. Mean± standard error (n� 3). Lowercase letters in the bold values signify methods that are notsignificantly different, and uppercase letters signify treatments that are not significantly different according to two-way ANOVAwith Tukey’s post hoc testing(p> 0.05). Method∗ treatment interactions (p< 0.01).
BP(A)
GCf(B)
GCh(C)
H(B)
Pt(A)
C in
frac
tion
(mg
C/g
fract
ion)
PL (b)SD (b)SMI (c)
SO (a)ZM (b)
0
50
100
150
200
250
300
350
(a)
C in
frac
tion
(mg
C/g
fract
ion)
PL (a)SD (a)SMI (b)
SO (a)ZM (c)
BP(C)
GCf(B)
GCh(BC)
H(B)
Pt(A)
0
50
100
150
200
250
300
(b)
C in
frac
tion
(mg
C/g
fract
ion)
PL (c)SD (b)SMI (a)
SO (b)ZM (a)
BP(BC)
GCf(BC)
GCh(C)
H(B)
Pt(A)
0
50
100
150
200
250
(c)
Figure 2: C concentration of (a) unprotected, (b) physically protected, and (c) chemically protected C fractions using different fractionationmethods for amended soils. Error bars for standard error (n� 3). Methods sharing the same lowercase letter and treatments sharing the sameuppercase letter are not significantly different according to two-way ANOVA and Tukey’s post hoc testing (p< 0.05). Methods: PL: Plazaet al. [18]; SD: Six et al. [9] using microaggregate isolator and density flotation; SMI: Six et al. [9] using microaggregate isolator and NaHMPfor dispersion; SO: Sohi et al. [19]; ZM: Zimmermann et al. [15]. Samples: BP: bare plot control; GCf: garden compost (full rate); GCh:garden compost (half rate); H: composted horse manure; Pt: Irish peat moss.
Applied and Environmental Soil Science 7

practical methodological differences between methods (e.g.,density vs. size seperation). )is has led to significant dif-ferences between methods for total, unprotected, physicallyprotected, and chemically protected C.
4.1. Total C Recovery of Methods. )e two methods thatrecovered the most C in total were the SMI and SOmethods.)ese are the only methods that do not involve densityseparation with SPT at any stage. )e use of SPT vs. NaI isdiscussed later.
Sample preparation before fractionation, in terms ofwhether the method uses 2mm sieved soil or not, may alsoaccount for SMI and SO having higher total C recovery. Alarge proportion (up to 50%) of total C recovered in the SMImethod, for example, was attributed to the large >2000 μmPOM fraction (data not shown). )is material will be re-moved during 2mm sieving in sample preparation for PLand ZM methods before fractionation takes place. Sievingmay also remove larger aggregates containing SOM. )ismay contribute to the lower mean C recovery for the PL andZM methods compared to the SMI and SO methods that donot sieve soil as a pretreatment. )e presence of this coarselitter can make up a large proportion of organic matter-amended soil samples especially in the case of soils amendedwith coarse compost [20, 21]. )erefore, the decision onwhether or not to sieve samples before physical fractionationwill depend on the soil used (i.e., the size of the large POMfraction) and also whether the research interest is in in-vestigating free POM in detail or is focussed on the heavierfractions. )at said, the SD does not sieve the soil as apretreatment but failed to recover more total C than the PLand ZM methods that do sieve.
)e results presented here suggest that the higher the Ccontent of the soil, the lower the total C recovery. Possibly, asa result (i) increased free light fraction POM in these soils,which is more easily lost; and/or (ii) higher C content soilspossibly containing more DOM, which was not isolatedduring this trial for any of the methods. )is has implica-tions for studies looking into amended soils, particularlythose which have had high volumes of exogenous organicmatter inputs. )is may also account for the reduced totalrecoveries in this trial, compared to the study by Poeplauet al. [16]. )e soils used here had at least double the total Ccontent than those used by Poeplau et al. [16].
4.2. Unprotected, Physically, and Chemically Protected CRecovery. Evidence presented here suggests that the amountof C recovered in each of the conceptual pools by a givenmethod depends on both notational differences betweenmethods, and also practical methodological differencesbetween methods, such as aggregate dispersion and densityvs. size separation.
However, it is important to consider that each of the fivemethods have a number of operational differences, whichmakes drawing firm conclusions difficult. For example,when considering density separation, which is applied ini-tially in three methods (PL, SO, and ZM). )ese threemethods use different density fluids (SPT and NaI) and at
different densities (1.80 or 1.85 g·cm− 3). In addition, themethods that use SPT (PL and ZM) also apply sieving beforethe density separation. )erefore, it is possible that thehigher amounts of unprotected free POMobtained by the PLand ZM methods may have more than one explanation.
4.2.1. Notational Differences in Methods. As discussedpreviously, some methods distinguish between macroag-gregates and microaggregates (e.g., PL, SD, and SMI), andsome group all aggregate size fractions together (SO andZM). In the latter case, all intra-aggregate light or particulateOM is classed as physically protected. However, in theformer, the OM contained within macroaggregates is classedas unprotected, and only OM occluded in microaggregates isclassed as physically protected. )e addition of OM frommacroaggregates to the unprotected pool may account forthe significantly (p< 0.05) greater proportion of unprotectedC reported by the PL and SMI methods when compared tothe SO and ZMmethods. )is in turn leads to a reduction inphysically protected C in methods that classify macroag-gregate C as unprotected rather than physically protected.)e PL and SDmethods, for example, have among the lowestsoil concentrations of physically protected C and among thehighest concentrations of unprotected C (Figure 1), and thereverse is true for the SO method and ZM method.
However, despite the SMI and SD methods making thesame distinction between microaggregates and macroag-gregates as the PL method, the SD method did not isolatesignificantly more unprotected C than the SO and ZMmethods, and the SMI method did not isolate significantlyless physically protected C than the SO and ZM methods.)erefore, there are also practical methodological differ-ences between methods that need to be considered, such asaggregate dispersion technique, and whether the methoduses size or density separation (see below).
When all aggregate fractions are grouped together re-gardless of size class, it can be seen that the SD and SMImethods isolate more aggregate C than the other threemethods. Neither of these methods involves an initialdensity separation to isolate free (unoccluded) POM beforedispersing the aggregates. )erefore, the aggregate OM thatis isolated in these methods consists of both the intra-ag-gregate OM and the free POM that is of the same size class asthe aggregates.
4.2.2. Aggregate Dispersion. Of the three methods that in-clude macroaggregate OM in the unprotected C pool (PL,SD, and SMI), the SD method resulted in significantly lessunprotected C being isolated. An explanation for this mightrelate to the technique used to disperse OM contained withinmacroaggregates, which differed between SD (use of avacuum) and SMI and PL (microaggregate isolation via wetsieving) (Table 2). )e vacuum method may not be as ag-gressive in breaking up of macroaggregates compared to themicroaggregate isolator, resulting in less OM being liberatedfrom the macroaggregate fraction. )is potentially less ag-gressive break up of aggregates in the SD method may alsoaccount for the SD recovering more chemically protected C
8 Applied and Environmental Soil Science

than the SMI and PL method to compensate for less intra-aggregate OM being dispersed.
4.2.3. Density Separation. Four of the five methods in thistrial use density separation at some stage in the fractionationprocedure (PL, SD, SO, and ZM). However, as previouslydiscussed, because the SD method has an initial size sepa-ration, it is difficult to distinguish between intra-aggregateOM and free OM of the same size class. )e remaining threemethods (PL, SO, and ZM) involve an initial density sep-aration of free POM (i.e., POM not associated with aggre-gates or mineral components). )e majority of densityfractionation methods use either sodium polytungstate(SPT) or sodium iodide (NaI) as density solutions, becausethey are less toxic than halogenated hydrocarbons previouslyused in fractionation methods [22]. Sequeira et al. [23]reported that they found no difference in C recovery in thefree light fraction when comparing SPT and NaI densityfluids, but here, SPT (PL and ZM) recovered significantlymore free POM than the SO method, which uses NaI. )emethods that use SPT (PL and ZM) also involve sieving as apretreatment, unlike the SO method (discussed above).)erefore, the act of sieving could be releasing free POMfrom large aggregates, leading to elevated unprotected C,and not be related to whether SPTof NaI is used as a densityfluid. In turn, this will result in the reduced aggregate OMreleased in the PL and ZM methods compared to the SOmethod.
)e PL method, which uses a higher density of SPT(1.85 g·cm− 3) than the ZM method (1.80 g·cm− 3), also re-covered significantly more free POM than the ZM method.)is increase in free POM with increasing density of fluid isin concordance with the findings of Sequeira et al. [23].
During physical fractionation, the chemically protectedfraction can be isolated using either density separation (PL,SD, SO, and ZM) or size separation (SMI). )e SMI methodisolates significantly less chemically protected C than theother four methods, suggesting that a density-based ap-proach isolates more chemically protected C than a size-based approach. In the density-based approaches, the re-covery of chemically protected C was significantly higher inthe SOmethod, which uses NaI, rather than SPT, as a densityfluid. Within the methods that use SPTas a density fluid (PL,SD, and ZM), the ZM (1.80 g·cm− 3 SPT) recovers signifi-cantly more than the PL method (1.85 g·cm− 3), reverse of thefree POM (discussed above).
4.3. Fractionation for Amended Soils. Total C recovery wasnegatively affected by application of the high C content peatamendment. )is will have implications for the use ofphysical fractionation techniques in assessing the effects ofhigh C soil amendments on C stabilisation. In addition, forall analysis (total, unprotected, physically, and chemicallyprotected C), there were significant method× treatmentinteractions (p< 0.05), meaning that different methods weremore effective at isolating certain C conceptual pools thanothers, for certain amendments. )is will have implicationsfor studies investigating amendment application on C
stabilisation, as this work suggests that the performance ofeach method varies depending on the amendment inquestion. )is highlights the need for an understanding ofthe nature of experimental samples and the stabilisationmechanism of most interest, both prior to method selectionand when comparing results between studies.
4.4. Practical Considerations for Method Selection. )ephysical fractionation method selection had a significantimpact on the total C recovered (Table 4) and the distri-bution of the recovered C between conceptual pools that aredefined based on current ideas on the importance of ag-gregate occlusion and mineral association in controllingorganic C persistence in soil (Figure 1). )ese between-method differences most likely resulted from variation inboth the methodological fractions obtained (e.g., dis-tinguishing aggregate size classes or not) and their sub-sequent designation to conceptual pools (protected versusunprotected) and the procedures used in sample pre-treatment and subsequent aggregate dispersion and frac-tionation steps. An appreciation of the sensitivity tomethodological variation of the characterization of soil C toconceptual pools is vital to the interpretation of data pro-duced by physical fractionation methods. However, thescientific value of the fractions will not be the only con-sideration for researchers when selecting an appropriatefractionation method. Factors such as the objectives of theindividual study versus logistics, time, and budget will alsoplay a part. )e number of fractions obtained for eachmethod varies greatly (Table 3) and retrieval of each of thesefractions takes time, and indeed could potentially lead togreater losses of C as the methods become more complex(Table 4). )erefore, when selecting a fractionation method,the researcher will need to consider their individual researchneeds, in terms of the information they require from eachfraction, and weigh this against the time it will take to obtainthese fractions.
Dissolved organic matter (DOM) is often overlooked inorganic matter fractionation methods but literature suggeststhat this should not be the case. Despite contributing only asmall proportion of total soil C, DOM is a reactive fraction ofSOM [24] and is an important source of C for soil micro-organisms [25]. In fact, the availability of DOM forbreakdown by the microbial community is considered vitalfor soil C turnover as microbial uptake occurs from thesolution phase [26].
All the methods in this study define a mineral fraction,reflecting the importance in current thinking [2, 16] ofassociation of C with mineral surfaces via sorption andcomplexation for C stabilisation. How the mineral fraction isdefined, particularly in which fraction sand is present, im-pacts on the quality of C obtained in all the fractions. )iswill have implications if analysing soils with a high sandcontent, or comparing multiple sites with different soiltextures. )e presence or absence of sand in the fraction,which is thought to only have weak associations with C [22],could, in essence, dilute the sample by increasing the mass ofthe fraction without contributing much C.
Applied and Environmental Soil Science 9

All methods recognise the importance of occlusion inaggregates as a mechanism for stabilising C in soils. How-ever, not all methods define microaggregate and macroag-gregate occluded C independently. It is thought that organicmatter is protected from decomposition to a greater extentin microaggregates than in macroaggregates, not only as aresult of reduced microbial access to organic C substratesdue to the smaller and less connected soil pores, but also as aresult of slower decomposition in response to greaterprevalence of anoxic conditions due to slower oxygen dif-fusion through small water-filled pores [27]. Micro-aggregates are also tightly held together by stronger internalbinding agents, which results in them being more stable inthe soil system, and providing better long-term protectionfor SOM [25]. Occlusion within microaggregates, containedwithin macroaggregates, has been suggested to be the mostimportant for C stabilisation inmanaged sites [28, 29] as wellas influencing the composition of the microbial community[30].
Aggregate isolation methods, such as SD and SMIproposed by Six et al. [9], allow for significance of their size,in the protection of SOM in soil to be determined [31], butuniquely they also quantify silt and clay contained within theaggregate. )is could be of particular interest as C associatedwith silt and clay, contained within an aggregate, could beboth chemically and physically protected. )is informationwould be valuable in testing hypotheses about the cycling ofC within aggregate formation-stabilisation-destructionprocesses and develop understanding of an overlooked poolof organic matter that is governed by multiple protectionmechanisms. However, as previously discussed, retrieval ofmultiple fractions does not come without costs, and is notalways possible in the case of soils that have a high pro-portion of POM. When the mass of POM constitutes a largeproportion of the mass of the total soil sample, as it did forthe amended soil samples under investigation here, there isoften insufficient residual sample for separation into theremaining fractions. )erefore, in order to ensure thatenough material is left in fractions towards the end of theprocess, larger volumes of soil will need to be processed,increasing analytical time and cost.
A number of factors during size separation processes,such as wet sieving, can affect the results, including sievesize, speed, and duration, which will need to be taken intoaccount [12], particularly when wet sieving by hand as therewill be obvious differences between operators. In addition,sieving to separate aggregate size classes will also separateout POM of different size classes along with sand particles[32], which do not contain occluded OM from the aggregateand may impact on results. It is thought that wet sieving mayalso lead to leaching of DOC to smaller aggregate size classes,along with high energy slaking procedures breaking upweaker aggregates and redistributing fine particles intosmaller aggregate size classes [33].
)e majority of density fractionation methods use eithersodium polytungstate (SPT) or sodium iodide (NaI) asdensity solutions, because they are less toxic than haloge-nated hydrocarbons previously used in fractionationmethods [22]. Although the findings of this study are
inconclusive as to which solution is more appropriate,according to Sequeira et al. [23], the decision of whether touse SPT or NaI as a density solution is dependent on thefollowing factors: (i) Cost (NaI is cheaper than SPT); (ii)health and safety (SPT is less toxic than NaI); and (iii)density range (SPT can produce a wider range of densities,whilst maintaining a lower viscosity at higher concentra-tions) [34].
)ere are also additional considerations if the intentionis to produce fractions that can be further analysed, forexample by nuclear magnetic resonance (NMR) and isotopictracers, to further explore the composition and residencetime within each fraction. For example, problems may arisefor cross-polarization spectra in NMR if the C content of thesample is 100mg C g·fraction− 1 or less [35], as was the case inthe current study for: unprotected C isolated using the SMImethod; physically protected C using the SMI and ZMmethods; and chemically protected C isolated using the PL,SD, and SO methods (Figure 2). Differences in fraction Cconcentrations are determined by the presence or absence ofmineral components (particularly sand in our case), indifferent fractions depending on the fractionation method.For example, using size separation techniques to isolateunprotected C in the SMI method means that mineralcomponents within the same size class, such as sand andgravel, which would sink in a density separation method, areincluded in the POM fraction. )e inclusion of sand in theaggregate fraction in the SMI and ZMmethods (Table 2) alsoresults in a significantly reduced C concentration in thephysically protected fraction compared to the othermethods, but higher chemically protected C. Poor NMRspectra often result from low sample C concentrations due tobackground signal caused by rotor cap and probe compo-nents, in addition to broad peaks and low signal-noise ratios[35]. Samples that are low in organic molecules, therefore,may require pretreatment with hydrofluoric acid (HF), todissolve minerals thereby concentrating organic mattersignals [36]. However, the use of HF has associated healthand safety concerns, and takes time. Treating samples withHF has also been observed to cause problems as it can lead toloss of SOC in some soils [37].
It is also important to note that if it is the intention tocombine physical fractionation techniques with microbialanalyses, it may not be suitable to use density fractionation atall because density solutionsmay be detrimental tomicrobialactivity [38] or isolation and analysis of nucleic acid markersfor microbial community characterization.
5. Conclusions
For the five physical fractionation methods tested here [18];[15, 19]; and two variants of [9], the choice of method had asignificant impact on the distribution of organic C betweenfractions that conceptually are representative of un-protected, chemically protected, and physically protectedpools. )is between-method variation can be interpreted interms of differences in: (i) the methodological fractionsobtained; (ii) the subsequent subjective designation offractions to conceptual pools; and, (iii) procedures used in
10 Applied and Environmental Soil Science

sample pretreatment and subsequent aggregate dispersionand fractionation steps.
Our method comparison highlights the need for anunderstanding of the nature of the samples under in-vestigation, particularly for amended soil. In addition, anappreciation for the stabilisation mechanism(s) under studyand operational differences betweenmethods when selectinga method to address a particular research question is needed.In the case of cross-study comparisons of soil C quality data,there will be implications if data have been obtained usingdiffering physical fractionation methods.
Future work could examine the various steps of frac-tionation methods and whether the fractions from soils withexogenous organic matter inputs isolated do indeed haveturnover times that are consistent with the conceptual poolsthey are intended to represent (as in [16]).
Data Availability
)e data used to support the findings of this study areavailable from the corresponding author upon request.
Conflicts of Interest
)e authors declare that they have no conflicts of interest.
Acknowledgments
)is research was supported by an industrial Co-OperativeAward in Science and Engineering (CASE), jointly fundedby the Biotechnology and Biological Sciences ResearchCouncil (BBSRC), the Royal Horticultural Society (RHS),and the Department for Environment, Food and RuralAffairs (Defra).
References
[1] S. Ghosh, B. Wilson, S. Ghoshal, N. Senapati, and B. Mandal,“Organic amendments influence soil quality and carbon se-questration in the Indo-Gangetic plains of India,” Agriculture,Ecosystems & Environment, vol. 156, pp. 134–141, 2012.
[2] M. W. I. Schmidt, M. S. Torn, S. Abiven et al., “Persistence ofsoil organic matter as an ecosystem property,” Nature,vol. 478, no. 7367, pp. 49–56, 2011.
[3] J. Leifeld and I. Kogel-Knabner, “Soil organic matter fractionsas early indicators for carbon stock changes under differentland-use?,” Geoderma, vol. 124, no. 1-2, pp. 143–155, 2005.
[4] B. Minasny, B. P. Malone, A. B. McBratney et al., “Soil carbon4 per mille,” Geoderma, vol. 292, pp. 59–86, 2017.
[5] D. L. D. Lima, S. M. Santos, H. W. Scherer et al., “Effects oforganic and inorganic amendments on soil organic matterproperties,” Geoderma, vol. 150, no. 1-2, pp. 38–45, 2009.
[6] E. Medina, C. Paredes, M. A. Bustamante, R. Moral, andJ. Moreno-Caselles, “Relationships between soil physico-chemical, chemical and biological properties in a soilamended with spent mushroom substrate,” Geoderma,vol. 173-174, pp. 152–161, 2012.
[7] R. Ryals, M. Kaiser, M. S. Torn, A. A. Berhe, and W. L. Silver,“Impacts of organic matter amendments on carbon and ni-trogen dynamics in grassland soils,” Soil Biology and Bio-chemistry, vol. 68, pp. 52–61, 2014.
[8] D. Courtier-Murias, A. J. Simpson, C. Marzadori et al.,“Unraveling the long-term stabilization mechanisms of or-ganic materials in soils by physical fractionation and NMRspectroscopy,” Agriculture, Ecosystems & Environment,vol. 171, pp. 9–18, 2013.
[9] J. Six, R. T. Conant, E. A. Paul, and K. Paustian, “Stabilizationmechanisms of soil organic matter: implications for C-satu-ration of soils,” Plant and Soil, vol. 241, no. 2, pp. 155–176,2002.
[10] B. John, T. Yamashita, B. Ludwig, and H. Flessa, “Storage oforganic carbon in aggregate and density fractions of silty soilsunder different types of land use,” Geoderma, vol. 128, no. 1-2,pp. 63–79, 2005.
[11] M. V. Lutzow, I. Kogel-Knabner, K. Ekschmitt et al., “Sta-bilization of organic matter in temperate soils: mechanismsand their relevance under different soil conditions—a review,”European Journal of Soil Science, vol. 57, no. 4, pp. 426–445,2006.
[12] D. C. Olk and E. G. Gregorich, “Overview of the symposiumproceedings, “meaningful pools in determining soil carbonand nitrogen dynamics”,” Soil Science Society of AmericaJournal, vol. 70, no. 3, pp. 967–974, 2006.
[13] C. A. Creamer, T. R. Filley, and T. W. Boutton, “Long-termincubations of size and density separated soil fractions toinform soil organic carbon decay dynamics,” Soil Biology andBiochemistry, vol. 57, pp. 496–503, 2013.
[14] R. Jandl, M. Rodeghiero, C. Martinez et al., “Current status,uncertainty and future needs in soil organic carbon moni-toring,” Science of 3e Total Environment, vol. 468-469,pp. 376–383, 2014.
[15] M. Zimmermann, J. Leifeld, M. W. I. Schmidt, P. Smith, andJ. Fuhrer, “Measured soil organic matter fractions can berelated to pools in the RothC model,” European Journal of SoilScience, vol. 58, no. 3, pp. 658–667, 2007.
[16] C. Poeplau, A. Don, J. Six et al., “Isolating organic carbonfractions with varying turnover rates in temperate agriculturalsoils—a comprehensive method comparison,” Soil Biologyand Biochemistry, vol. 125, pp. 10–26, 2018.
[17] P. D. Alexander and I. M. Nevison, “)e long-term effects ofrepeated application of the same organic material to soil in ahorticultural context,” Acta Horticulturae, vol. 1076, no. 1076,pp. 143–150, 2015.
[18] C. Plaza, D. Courtier-Murias, J. M. Fernandez, A. Polo, andA. J. Simpson, “Physical, chemical, and biochemical mecha-nisms of soil organic matter stabilization under conservationtillage systems: a central role for microbes and microbial by-products in C sequestration,” Soil Biology and Biochemistry,vol. 57, pp. 124–134, 2013.
[19] S. P. Sohi, N. Mahieu, J. R. M. Arah, D. S. Powlson, B. Madari,and J. L. Gaunt, “A procedure for isolating soil organic matterfractions suitable for modeling,” Soil Science Society ofAmerica Journal, vol. 65, no. 4, pp. 1121–1128, 2001.
[20] M. Gonzalez, E. Gomez, R. Comese, M. Quesada, andM. Conti, “Influence of organic amendments on soil qualitypotential indicators in an urban horticultural system,” Bio-resource Technology, vol. 101, no. 22, pp. 8897–8901, 2010.
[21] B. L. M. Leroy, H. M. S. K. Herath, S. Sleutel et al., “)e qualityof exogenous organic matter: short-term effects on soilphysical properties and soil organic matter fractions,” Soil Useand Management, vol. 24, no. 2, pp. 139–147, 2008.
[22] M. von Lutzow, I. Kogel-Knabner, K. Ekschmitt et al., “SOMfractionation methods: relevance to functional pools and tostabilization mechanisms,” Soil Biology and Biochemistry,vol. 39, no. 9, pp. 2183–2207, 2007.
Applied and Environmental Soil Science 11

[23] C. H. Sequeira, M. M. Alley, and B. P. Jones, “Evaluation ofpotentially labile soil organic carbon and nitrogen fraction-ation procedures,” Soil Biology and Biochemistry, vol. 43,no. 2, pp. 438–444, 2011.
[24] I. De Troyer, F. Amery, C. VanMoorleghem, E. Smolders, andR. Merckx, “Tracing the source and fate of dissolved organicmatter in soil after incorporation of a 13C labelled residue: abatch incubation study,” Soil Biology and Biochemistry,vol. 43, no. 3, pp. 513–519, 2011.
[25] E. G. Gregorich, M. H. Beare, U. Stoklas, and P. St-Georges,“Biodegradability of soluble organic matter in maize-croppedsoils,” Geoderma, vol. 113, no. 3-4, pp. 237–252, 2003.
[26] B. Marschner and K. Kalbitz, “Controls of bioavailability andbiodegradability of dissolved organic matter in soils,” Geo-derma, vol. 113, no. 3-4, pp. 211–235, 2003.
[27] S. M. F. Rabbi, H. Daniel, P. V. Lockwood et al., “Physical soilarchitectural traits are functionally linked to carbon de-composition and bacterial diversity,” Scientific Reports, vol. 6,no. 1, pp. 1–9, 2016.
[28] A. Y. Y. Kong, J. Six, D. C. Bryant, R. F. Denison, andC. van Kessel, “)e relationship between carbon input, ag-gregation, and soil organic carbon stabilization in sustainablecropping systems,” Soil Science Society of America Journal,vol. 69, no. 4, pp. 1078–1085, 2005.
[29] J. Six and K. Paustian, “Aggregate-associated soil organicmatter as an ecosystem property and a measurement tool,”Soil Biol. Biochem.vol. 68, pp. A4–A9, 2014.
[30] J. Six, H. Bossuyt, S. Degryze, and K. Denef, “A history ofresearch on the link between (micro)aggregates, soil biota,and soil organic matter dynamics,” Soil and Tillage Research,vol. 79, no. 1, pp. 7–31, 2004.
[31] H. Bossuyt, J. Six, and P. F. Hendrix, “Protection of soil carbonby microaggregates within earthworm casts,” Soil Biology andBiochemistry, vol. 37, no. 2, pp. 251–258, 2005.
[32] Y. He, C. Chen, Z. Xu, D. Williams, and J. Xu, “Assessingmanagement impacts on soil organic matter quality in sub-tropical Australian forests using physical and chemicalfractionation as well as 13C NMR spectroscopy,” Soil Biologyand Biochemistry, vol. 41, no. 3, pp. 640–650, 2009.
[33] A. Gunina and Y. Kuzyakov, “Pathways of litter C by for-mation of aggregates and SOM density fractions: implicationsfrom 13C natural abundance,” Soil Biology and Biochemistry,vol. 71, pp. 95–104, 2014.
[34] J. Six, P. A. Schultz, J. D. Jastrow, and R. Merckx, “Recycling ofsodium polytungstate used in soil organic matter studies,” SoilBiology and Biochemistry, vol. 31, no. 8, pp. 1193–1196, 1999.
[35] C. M. Preston, “Carbon-13 solid-state NMR of soil organicmatter - using the technique effectively,” Canadian Journal ofSoil Science, vol. 81, no. 3, pp. 255–270, 2001.
[36] A. J. Simpson, M. J. Simpson, and R. Soong, “Nuclearmagnetic resonance spectroscopy and its key role in envi-ronmental research,” Environmental Science & Technology,vol. 46, no. 21, pp. 11488–11496, 2012.
[37] C. Rumpel, I. Kogel-Knabner, and F. Bruhn, “Vertical dis-tribution, age, and chemical composition of organic carbon intwo forest soils of different pedogenesis,” Organic Geo-chemistry, vol. 33, no. 10, pp. 1131–1142, 2002.
[38] C. W. Mueller, M. Gutsch, K. Kothieringer et al., “Bio-availability and isotopic composition of CO2 released fromincubated soil organic matter fractions,” Soil Biology andBiochemistry, vol. 69, pp. 168–178, 2014.
12 Applied and Environmental Soil Science

Hindawiwww.hindawi.com
Applied &EnvironmentalSoil Science
Volume 2018
Hindawiwww.hindawi.com Volume 2018
Journal of
Chemistry ArchaeaHindawiwww.hindawi.com Volume 2018
Forestry ResearchInternational Journal of
Hindawiwww.hindawi.com Volume 2018
Environmental and Public Health
Journal of
Hindawiwww.hindawi.com Volume 2018
Hindawiwww.hindawi.com Volume 2018
MeteorologyAdvances in
EcologyInternational Journal of
Hindawiwww.hindawi.com Volume 2018
Marine BiologyJournal of
Hindawiwww.hindawi.com Volume 2018
Hindawiwww.hindawi.com Volume 2018
ChemistryAdvances in
Agronomy
Hindawiwww.hindawi.com Volume 2018
International Journal of
Hindawiwww.hindawi.com Volume 2018
Advances in
Virolog y
Hindawiwww.hindawi.com Volume 2018
International Journal of
Geophysics
Hindawiwww.hindawi.com Volume 2018
Geological ResearchJournal of
Hindawiwww.hindawi.com Volume 2018
Public Health Advances in
BiodiversityInternational Journal of
Hindawiwww.hindawi.com Volume 2018
Scienti�caHindawiwww.hindawi.com Volume 2018
BotanyJournal of
Hindawiwww.hindawi.com Volume 2018
Hindawi Publishing Corporation http://www.hindawi.com Volume 2013Hindawiwww.hindawi.com
The Scientific World Journal
Volume 2018
AgricultureAdvances in
Hindawiwww.hindawi.com Volume 2018
Submit your manuscripts atwww.hindawi.com