oregon revenue forecast feb 2012: appendix b
TRANSCRIPT

8/3/2019 Oregon Revenue Forecast Feb 2012: Appendix B
http://slidepdf.com/reader/full/oregon-revenue-forecast-feb-2012-appendix-b 1/1390
APPENDIX B: REVENUE FORECAST DETAIL
Table B.1 General Fund Revenue Statement - 2011-13 September 2011 Forecast .................... 91
Table B.2 General Fund Revenue Forecast by Fiscal Year ........................................................ 92
Table B.3 Summary of 2011 Legislative Session Adjustments .................................................. 93
Table B.4 Oregon Personal Income Tax Revenue Forecast ........................................................ 94
Table B.5 Oregon Corporate Income Tax Revenue Forecast ..................................................... 96
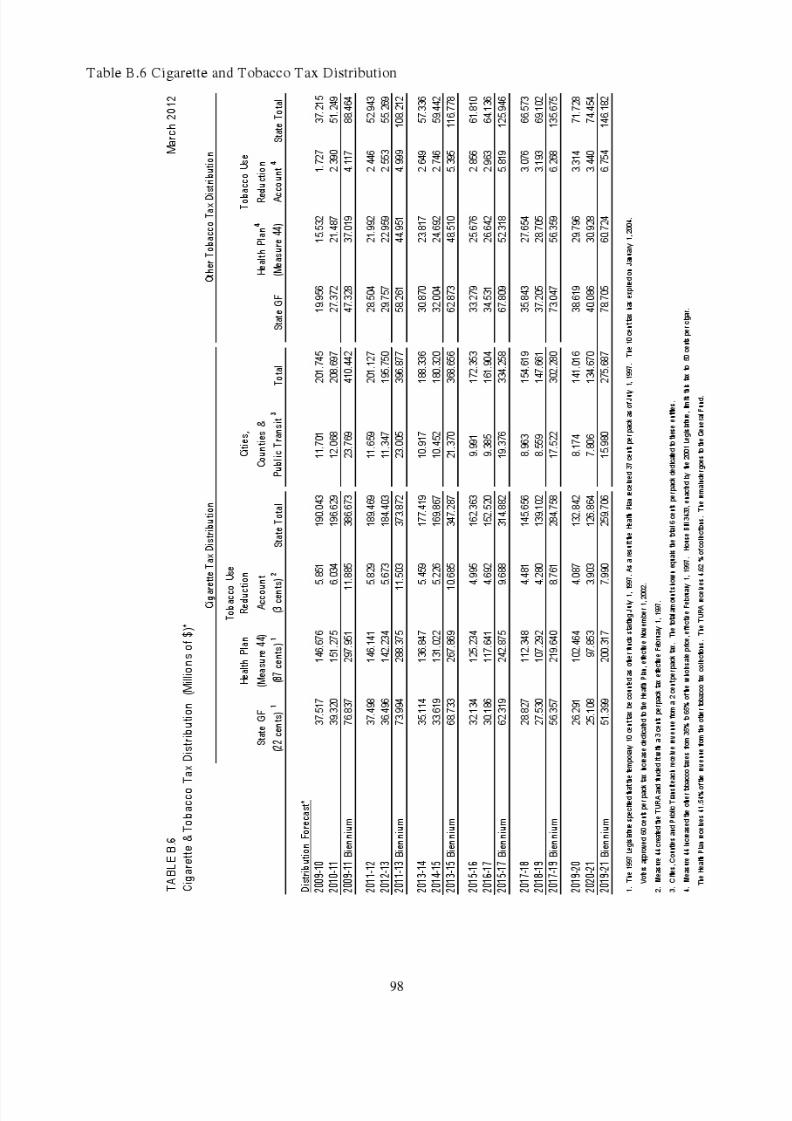
Table B.6 Cigarette and Tobacco Tax Distribution .................................................................... 98
Table B.7 Revenue Distribution to Local Governments ............................................................. 99
Table B.8 Track Record for the May 2011 Forecast ................................................................. 100
Table B.9 Summary of Lottery Resources ................................................................................ 101
Table B.10 Budgetary Reserve Summary and Outlook ............................................................ 102

8/3/2019 Oregon Revenue Forecast Feb 2012: Appendix B
http://slidepdf.com/reader/full/oregon-revenue-forecast-feb-2012-appendix-b 2/13

8/3/2019 Oregon Revenue Forecast Feb 2012: Appendix B
http://slidepdf.com/reader/full/oregon-revenue-forecast-feb-2012-appendix-b 3/13

8/3/2019 Oregon Revenue Forecast Feb 2012: Appendix B
http://slidepdf.com/reader/full/oregon-revenue-forecast-feb-2012-appendix-b 4/13
93
Table B.3 Summary of 2011 Legislative Session Adjustments 1 Biennia Staff
MeasureSummary
RevenueImpact
Statement2011-13 2013-15 2015-17 2017-19 2019-21
Personal Income Tax Impacts (Millions)Tax Law Change
Farmworker Credit - HB 2154 -$0.01 -$0.01 $0.00 $0.00 $0.00 HB 2154 HB 2154BETC Administration - HB 2523 $0.00 $0.00 $0.00 $0.00 $0.00 HB 2523 HB 2523529 College Savings - HB 2728 $0.00 -$0.03 -$0.03 -$0.03 -$0.03 HB 2528 HB 2528
Diesel Engine Tax Credit - HB 3170 $0.22 $0.12 $0.00 $0.00 $0.00 HB 3170 HB 3170Net Operating Loss - HB 3454 $0.80 $0.50 $0.40 $0.26 $0.17 HB 3454 HB 3454BETC Clarification - HB 3606 $0.00 $0.00 $0.00 $0.00 $0.00 HB 3606 HB 3606Tax Credits - HB 3672 HB 3672 HB 3672
BETC $7.90 $6.40 $3.20 $2.00 $1.80Biomass -$3.60 -$7.60 -$8.30 -$4.65 $0.00E-commerce Zone -$0.01 -$0.02 -$0.02 -$0.01 $0.00Film & Video -$6.00 -$12.00 -$12.00 -$7.00 -$0.20Fish Screening -$0.02 -$0.04 -$0.04 -$0.02 $0.00Oregon Investment Advantage $0.00 -$0.10 -$0.05 -$0.02 -$0.01Renewables -$2.00 -$2.25 -$2.25 -$1.13 $0.00Conservation -$2.30 -$6.60 -$8.20 -$7.70 -$3.50Transportation -$1.00 -$1.90 -$1.70 -$0.70 -$0.25RETC -$7.60 -$21.20 -$28.40 -$20.50 $0.00
Federal Reconnect - SB 301 $0.00 $0.00 $0.00 $0.00 $0.00 SB 301 SB 301Community Jobs Initiative - SB 817 $0.00 -$4.60 -$23.30 -$25.50 -$7.60 SB 817 SB 817
Compliance Bills Tax Preparers E-file - HB 2071 $0.00 $0.00 $0.00 $0.00 $0.00 HB 2071 HB 2071DOR Enforcement - HB 5040 $5.50 $5.60 $5.60 $5.60 $5.60 HB 5040
Personal Income Tax Total $-8.13 -$43.73 -$75.09 -$59.40 -$4.02
Corporate Income Tax Impacts (Millions) Tax Law Change
Farmworker Credit - HB 2154 -$0.02 -$0.02 $0.00 $0.00 $0.00 HB 2154 HB 2154BETC Administration - HB 2523 $0.00 $0.00 $0.00 $0.00 $0.00 HB 2523 HB 2523Housing Lender Credit - HB 2527 $0.00 -$2.80 -$5.20 -$7.70 -$6.10 HB 2527 HB 2527Ag CoopMin Tax - HB 3058 -$1.40 -$1.40 -$1.40 -$1.40 -$1.40 HB 3058 HB 3058Diesel Engine Tax Credit - HB 3170 $0.09 $0.08 $0.00 $0.00 $0.00 HB 3170 HB 3170BETC Clarification - HB 3606 $0.00 $0.00 $0.00 $0.00 $0.00 HB 3606 HB 3606Tax Credits - HB 3672 HB 3672 HB 3672
BETC $11.90 $10.00 $4.80 $3.10 $2.50Biomass -$0.30 -$0.60 -$0.70 -$0.50 $0.00Fire Insurance -$0.80 -$1.60 -$1.60 -$1.30 $0.00
E-commerce Zone -$0.04 -$0.08 -$0.08 -$0.06 $0.00Long-Term Rural EZ -$0.10 -$0.20 -$0.20 -$0.10 $0.00R&D -$0.80 -$1.70 -$2.10 -$1.70 $0.00Film & Video -$0.20 -$0.40 -$0.40 -$0.20 $0.00Fish Screening -$0.01 -$0.01 -$0.01 -$0.01 $0.00Oregon Investment Advantage $0.00 -$0.10 -$0.05 -$0.02 $0.00Renewables -$0.50 -$0.75 -$0.75 -$0.38 $0.00Conservation -$3.20 -$9.60 -$12.10 -$10.60 -$3.50Transportation -$1.30 -$2.90 -$2.60 -$0.90 -$0.20
Federal Reconnect - SB 301 $0.00 $0.00 $0.00 $0.00 $0.00 SB 301 SB 301Community Jobs Initiative - SB 817 $0.00 -$0.70 -$5.50 -$6.50 -$2.50 SB 817 SB 817
Compliance Bills Tax Preparers E-file - HB 2071 $0.00 $0.00 $0.00 $0.00 $0.00 HB 2071 HB 2071DOR Enforcement - HB 5040 $9.20 $9.40 $9.40 $9.40 $9.40 HB 5040Other Transfers - SB 939 $18.00 $0.00 $0.00 $0.00 $0.00 SB 939 SB 939
Corporate Income Tax Total $30.52 -$3.38 -$18.49 -$18.86 -$1.80
Other Tax/Revenue Impacts (Millions) Other Transfers - SB 939 $58.10 $0.00 $0.00 $0.00 $0.00 SB 939 SB 939Inheritance Tax - HB 2541 $0.00 $0.00 $0.00 $0.00 $0.00 HB 2541 HB 2541Court Fees - HB 2710 $33.13 $40.43 $42.83 $45.40 $47.50 HB 2710 HB 2710Criminal Fine Account - HB 2712 $22.20 $20.71 $22.05 $23.50 $25.50 HB 2712 HB 2712OUS Interest Earnings - SB 242 -$7.44 -$22.00 -$32.00 -$34.00 -$34.00 SB 242 SB 242OLCC Transfers - SB 5522 $2.20 $0.00 $0.00 $0.00 $0.00 SB 5522
Other Tax Total $108.19 $39.14 $32.88 $34.90 $39.00

8/3/2019 Oregon Revenue Forecast Feb 2012: Appendix B
http://slidepdf.com/reader/full/oregon-revenue-forecast-feb-2012-appendix-b 5/13
94
Table B.4 Oregon Personal Income Tax Revenue Forecast 1 TABLE B.4
2005:3 2005:4 2006:1 2006:2 FY 2006 2006:3 2006:4 2007:1 2007:2 FY 2007
WITHHOLDING 1,064,107 1,087,942 1,177,488 1,075,476 4,405,013 1,118,878 1,172,656 1,182,336 1,088,108 4,561,977
%CHYA 8.4% 6.4% 10.5% 6.0% 7.8% 5.1% 7.8% 0.4% 1.2% 3.6%
EST. PAYMENTS 194,848 186,648 224,403 270,754 876,653 231,720 177,026 267,345 363,055 1,039,146
%CHYA 22.4% 36.4% 11.4% 0.3% 14.2% 18.9% -5.2% 19.1% 34.1% 18.5%
FINAL PAYMENTS 51,797 68,000 88,998 787,622 996,416 55,408 89,432 100,476 779,577 1,024,893
%CHYA 16.8% 27.6% 13.8% 49.4% 41.7% 7.0% 31.5% 12.9% -1.0% 2.9%REFUNDS 62,638 94,755 345,524 358,699 861,617 89,254 126,707 444,768 369,456 1,030,186
%CHYA -9.4% 17.8% 0.7% -1.4% 0.6% 42.5% 33.7% 28.7% 3.0% 19.6%
OTHER (149,733) - - 176,911 27,178 (176,911) - - 177,781 870
TOTAL 1,098,381 1,247,835 1,145,365 1,952,063 5,443,644 1,139,841 1,312,406 1,105,388 2,039,066 5,596,701
%CHYA 10.9% 10.2% 14.3% 22.2% 15.3% 3.8% 5.2% -3.5% 4.5% 2.8%
2007:3 2007:4 2008:1 2008:2 FY 2008 2008:3 2008:4 2009:1 2009:2 FY 2009
WITHHOLDING 1,115,359 1,200,822 1,196,532 1,111,034 4,623,747 1,162,107 1,182,763 1,128,994 1,089,305 4,563,169
%CHYA -0.3% 2.4% 1.2% 2.1% 1.4% 4.2% -1.5% -5.6% -2.0% -1.3%
EST. PAYMENTS 250,749 217,163 281,441 399,475 1,148,828 264,440 174,826 217,305 263,135 919,707
%CHYA 8.2% 22.7% 5.3% 10.0% 10.6% 5.5% -19.5% -22.8% -34.1% -19.9%
FINAL PAYMENTS 57,503 129,817 104,841 971,325 1,263,486 70,306 99,430 104,105 529,995 803,836
%CHYA 3.8% 45.2% 4.3% 24.6% 23.3% 22.3% -23.4% -0.7% -45.4% -36.4%
REFUNDS 71,372 155,912 389,876 365,908 983,068 92,063 180,329 447,706 404,229 1,124,327
%CHYA -20.0% 23.0% -12.3% -1.0% -4.6% 29.0% 15.7% 14.8% 10.5% 14.4%
OTHER (177,781) (1,084,201) - 182,322 (1,079,660) (182,322) - - 138,521 (43,801)
TOTAL 1,174,457 307,689 1,192,938 2,298,247 4,973,332 1,222,469 1,276,690 1,002,698 1,616,726 5,118,583
%CHYA 3.0% -76.6% 7.9% 12.7% -11.1% 4.1% 314.9% -15.9% -29.7% 2.9%
2009:3 2009:4 2010:1 2010:2 FY 2010 2010:3 2010:4 2011:1 2011:2 FY 2011
WITHHOLDING 1,092,795 1,151,673 1,157,857 1,116,552 4,518,878 1,146,189 1,196,214 1,262,781 1,218,439 4,823,622
%CHYA -6.0% -2.6% 2.6% 2.5% -1.0% 4.9% 3.9% 9.1% 9.1% 6.7%
EST. PAYMENTS 176,110 161,759 186,894 265,703 790,467 179,692 148,589 207,036 284,662 819,978
%CHYA -33.4% -7.5% -14.0% 1.0% -14.1% 2.0% -8.1% 10.8% 7.1% 3.7%
FINAL PAYMENTS 63,363 77,013 105,745 515,262 761,383 62,259 81,728 114,877 607,592 866,456
%CHYA -9.9% -22.5% 1.6% -2.8% -5.3% -1.7% 6.1% 8.6% 17.9% 13.8%
REFUNDS 96,477 188,704 459,550 380,459 1,125,190 92,291 151,515 432,478 340,652 1,016,937
%CHYA 4.8% 4.6% 2.6% -5.9% 0.1% -4.3% -19.7% -5.9% -10.5% -9.6%
OTHER (138,521) - - 136,193 (2,328) (136,193) - - 165,933 29,740
TOTAL 1,097,271 1,201,740 990,947 1,653,251 4,943,210 1,159,655 1,275,015 1,152,216 1,935,973 5,522,860
%CHYA -10.2% -5.9% -1.2% 2.3% -3.4% 5.7% 6.1% 16.3% 17.1% 11.7%
2011:3 2011:4 2012:1 2012:2 FY 2012 2012:3 2012:4 2013:1 2013:2 FY 2013
WITHHOLDING 1,235,508 1,287,030 1,324,546 1,224,987 5,072,070 1,257,679 1,314,633 1,378,337 1,292,552 5,243,201
%CHYA 7.8% 7.6% 4.9% 0.5% 5.2% 1.8% 2.1% 4.1% 5.5% 3.4%
EST. PAYMENTS 194,674 185,239 189,409 346,208 915,530 229,569 170,660 286,211 386,449 1,072,890
%CHYA 8.3% 24.7% -8.5% 21.6% 11.7% 17.9% -7.9% 51.1% 11.6% 17.2%
FINAL PAYMENTS1
85,889 87,233 118,248 700,656 992,026 75,661 78,116 81,771 726,001 961,549
%CHYA 38.0% 6.7% 2.9% 15.3% 14.5% -11.9% -10.5% -30.8% 3.6% -3.1%
REFUNDS 64,687 156,272 475,847 441,318 1,138,123 106,267 151,608 465,805 439,962 1,163,643
%CHYA -29.9% 3.1% 10.0% 29.6% 11.9% 64.3% -3.0% -2.1% -0.3% 2.2%
OTHER (165,933) - - 169,387 3,454 (169,387) - - 179,639 10,251
TOTAL 1,285,451 1,403,230 1,156,356 1,999,921 5,844,957 1,287,255 1,411,800 1,280,515 2,144,679 6,124,249
%CHYA 10.8% 10.1% 0.4% 3.3% 5.8% 0.1% 0.6% 10.7% 7.2% 4.8%
March 2012
OREGON PERSONAL INCOME TAX REVENUE FORECAST - QUARTERLY COLLECTIONS
Thousands of Dollars - Not Seasonally Adjusted
Note: "Other" includes kicker and federal pension refunds, as well as July withholding accrued to June.
Tax law impacts are reflected in the collections numbers to produce more meaningful projections.

8/3/2019 Oregon Revenue Forecast Feb 2012: Appendix B
http://slidepdf.com/reader/full/oregon-revenue-forecast-feb-2012-appendix-b 6/13
95
TABLE B.4
2013:3 2013:4 2014:1 2014:2 FY 2014 2014:3 2014:4 2015:1 2015:2 FY 2015
WITHHOLDING 1,322,148 1,382,423 1,450,326 1,359,644 5,514,540 1,398,892 1,462,665 1,544,474 1,449,543 5,855,574
%CHYA 5.1% 5.2% 5.2% 5.2% 5.2% 5.8% 5.8% 6.5% 6.6% 6.2%
EST. PAYMENTS 267,009 182,586 306,368 417,493 1,173,457 288,459 197,254 331,140 455,167 1,272,019
%CHYA 16.3% 7.0% 7.0% 8.0% 9.4% 8.0% 8.0% 8.1% 9.0% 8.4%
FINAL PAYMENTS1
58,160 81,473 87,764 784,398 1,011,795 62,538 87,823 98,875 915,134 1,164,369
%CHYA -23.1% 4.3% 7.3% 8.0% 5.2% 7.5% 7.8% 12.7% 16.7% 15.1%
REFUNDS 106,321 121,599 420,731 495,983 1,144,635 107,889 123,606 449,964 530,962 1,212,422
%CHYA 0.1% -19.8% -9.7% 12.7% -1.6% 1.5% 1.7% 6.9% 7.1% 5.9%
OTHER (179,639) - - 190,372 10,734 (190,372) - - 202,672 12,300
TOTAL 1,361,358 1,524,882 1,423,727 2,255,924 6,565,891 1,451,627 1,624,136 1,524,524 2,491,553 7,091,840
%CHYA 5.8% 8.0% 11.2% 5.2% 7.2% 6.6% 6.5% 7.1% 10.4% 8.0%
2015:3 2015:4 2016:1 2016:2 FY 2016 2016:3 2016:4 2017:1 2017:2 FY 2017
WITHHOLDING 1,491,361 1,559,358 1,628,117 1,525,029 6,203,865 1,569,070 1,640,595 1,701,752 1,592,159 6,503,577
%CHYA 6.6% 6.6% 5.4% 5.2% 5.9% 5.2% 5.2% 4.5% 4.4% 4.8%
EST. PAYMENTS 314,489 215,053 360,573 484,678 1,374,793 334,878 228,996 383,646 508,237 1,455,758
%CHYA 9.0% 9.0% 8.9% 6.5% 8.1% 6.5% 6.5% 6.4% 4.9% 5.9%
FINAL PAYMENTS1
70,889 100,293 108,699 993,834 1,273,714 77,608 109,465 116,918 1,051,626 1,355,616
%CHYA 13.4% 14.2% 9.9% 8.6% 9.4% 9.5% 9.1% 7.6% 5.8% 6.4%
REFUNDS 110,103 131,743 484,312 576,442 1,302,600 128,282 146,844 525,052 619,907 1,420,085
%CHYA 2.1% 6.6% 7.6% 8.6% 7.4% 16.5% 11.5% 8.4% 7.5% 9.0%
OTHER -202,672 0 0 213,029 10,357 -213,029 0 0 222,270 9,241
TOTAL 1,563,964 1,742,961 1,613,076 2,640,127 7,560,129 1,640,246 1,832,212 1,677,264 2,754,384 7,904,107
%CHYA 7.7% 7.3% 5.8% 6.0% 6.6% 4.9% 5.1% 4.0% 4.3% 4.5%
2017:3 2017:4 2018:1 2018:2 FY 2018 2018:3 2018:4 2019:1 2019:2 FY 2019
WITHHOLDING 1,638,167 1,712,832 1,793,785 1,681,109 6,825,893 1,729,644 1,808,493 1,904,254 1,786,330 7,228,721
%CHYA 4.4% 4.4% 5.4% 5.6% 5.0% 5.6% 5.6% 6.2% 6.3% 5.9%
EST. PAYMENTS 351,156 240,128 402,373 534,976 1,528,633 369,631 252,761 423,380 558,930 1,604,702
%CHYA 4.9% 4.9% 4.9% 5.3% 5.0% 5.3% 5.3% 5.2% 4.5% 5.0%
FINAL PAYMENTS1
83,316 117,035 124,308 1,105,216 1,429,875 88,449 123,907 130,740 1,158,370 1,501,465
%CHYA 7.4% 6.9% 6.3% 5.1% 5.5% 6.2% 5.9% 5.2% 4.8% 5.0%
REFUNDS 133,856 153,238 540,138 637,197 1,464,429 138,177 158,261 558,784 662,208 1,517,430
%CHYA 4.3% 4.4% 2.9% 2.8% 3.1% 3.2% 3.3% 3.5% 3.9% 3.6%
OTHER (222,270) - - 234,246 11,976 (234,246) - - 248,652 14,406
TOTAL 1,716,513 1,916,756 1,780,329 2,918,350 8,331,947 1,815,300 2,026,900 1,899,590 3,090,074 8,831,864
%CHYA 4.6% 4.6% 6.1% 6.0% 5.4% 5.8% 5.7% 6.7% 5.9% 6.0%
2019:3 2019:4 2020:1 2020:2 FY 2020 2020:3 2020:4 2021:1 2021:2 FY 2021
WITHHOLDING 1,837,877 1,921,669 2,004,751 1,877,544 7,641,841 1,931,770 2,019,827 2,110,924 1,977,606 8,040,127
%CHYA 6.3% 6.3% 5.3% 5.1% 5.7% 5.1% 5.1% 5.3% 5.3% 5.2%
EST. PAYMENTS 389,182 267,078 445,149 582,106 1,683,515 403,122 276,611 461,558 614,568 1,755,858
%CHYA 5.3% 5.7% 5.1% 4.1% 4.9% 3.6% 3.6% 3.7% 5.6% 4.3%
FINAL PAYMENTS1
96,986 134,069 135,905 1,141,768 1,508,728 97,334 133,852 140,884 1,206,308 1,578,378
%CHYA 9.7% 8.2% 4.0% -1.4% 0.5% 0.4% -0.2% 3.7% 5.7% 4.6%
REFUNDS 141,676 162,922 589,155 698,031 1,591,784 149,325 171,650 605,616 714,723 1,641,314
%CHYA 2.5% 2.9% 5.4% 5.4% 4.9% 5.4% 5.4% 2.8% 2.4% 3.1%
OTHER -248,652 0 0 261,267 12,614 -261,267 0 0 275,086 13,819
TOTAL 1,933,716 2,159,895 1,996,651 3,164,654 9,254,916 2,021,633 2,258,640 2,107,750 3,358,846 9,746,869
%CHYA 6.5% 6.6% 5.1% 2.4% 4.8% 4.5% 4.6% 5.6% 6.1% 5.3%
1Includes reductions related to credits realized under the Business Energy Tax Credit Program, adjustments for connecting with federal tax law, and increases related to the sunset of tax credits associated
with HB2607.
Note: "Other" includes kicker and federal pension refunds, as well as July withholding accrued to June.
March 2012
OREGON PERSONAL INCOME TAX REVENUE FORECAST - QUARTERLY COLLECTIONS
Thousands of Dollars - Not Seasonally Adjusted

8/3/2019 Oregon Revenue Forecast Feb 2012: Appendix B
http://slidepdf.com/reader/full/oregon-revenue-forecast-feb-2012-appendix-b 7/13
96
Table B.5 Oregon Corporate Income Tax Revenue Forecast 1TABLE B.5
FY FY
2005:3 2005:4 2006:1 2006:2 2006 2006:3 2006:4 2007:1 2007:2 2007
ADVANCE PAYMENTS 119,391 183,280 59,091 163,812 525,573 129,737 236,441 59,754 162,465 588,396
%CHYA 29.6% 27.8% 46.0% 12.1% 24.5% 8.7% 29.0% 1.1% -0.8% 12.0%
FINAL PAYMENTS 14,985 17,619 24,327 39,526 96,457 19,718 17,154 25,440 65,628 127,941
%CHYA -9.6% 7.0% 20.9% -14.0% -2.7% 31.6% -2.6% 4.6% 66.0% 32.6%
REFUNDS 16,350 108,723 19,140 39,592 183,805 22,481 199,419 38,715 49,865 310,480 %CHYA -12.2% -16.6% 25.9% 17.4% -7.1% 37.5% 83.4% 102.3% 25.9% 68.9%
TOTAL 118,026 92,177 64,278 163,745 438,225 126,975 54,176 46,478 178,228 405,857
%CHYA 31.1% 212.4% 41.6% 3.4% 35.6% 7.6% -41.2% -27.7% 8.8% -7.4%
FY FY
2007:3 2007:4 2008:1 2008:2 2008 2008:3 2008:4 2009:1 2009:2 2009
ADVANCE PAYMENTS 133,408 205,375 64,256 155,284 558,323 100,589 145,285 63,802 97,368 407,044
%CHYA 2.8% -13.1% 7.5% -4.4% -5.1% -24.6% -29.3% -0.7% -37.3% -27.1%
FINAL PAYMENTS 23,631 45,064 35,076 52,143 155,912 23,501 26,721 22,314 21,822 94,357
%CHYA 19.8% 162.7% 37.9% -20.5% 21.9% -0.6% -40.7% -36.4% -58.1% -39.5%
REFUNDS 39,623 158,106 36,380 39,394 273,503 28,134 124,826 67,471 37,218 257,649
%CHYA 76.3% -20.7% -6.0% -21.0% -11.9% -29.0% -21.0% 85.5% -5.5% -5.8%
TOTAL 117,416 92,333 62,951 168,032 440,732 95,956 47,181 18,645 81,971 243,753
%CHYA -7.5% 70.4% 35.4% -5.7% 8.6% -18.3% -48.9% -70.4% -51.2% -44.7%
FY FY2009:3 2009:4 2010:1 2010:2 2010 2010:3 2010:4 2011:1 2011:2 2011
ADVANCE PAYMENTS 79,579 163,877 66,451 147,313 457,220 115,286 175,561 76,405 165,354 532,606
%CHYA -20.9% 12.8% 4.2% 51.3% 12.3% 44.9% 7.1% 15.0% 12.2% 16.5%
FINAL PAYMENTS 20,404 24,009 38,412 45,714 128,539 21,781 21,206 35,770 40,805 119,562
%CHYA -13.2% -10.2% 72.1% 109.5% 36.2% 6.8% -11.7% -6.9% -10.7% -7.0%
REFUNDS 29,072 137,244 40,080 25,774 232,170 23,130 89,877 39,065 31,489 183,561
%CHYA 3.3% 9.9% -40.6% -30.7% -9.9% -20.4% -34.5% -2.5% 22.2% -20.9%
TOTAL 70,910 50,642 64,784 167,254 353,589 113,936 106,890 73,111 174,670 468,607
%CHYA -26.1% 7.3% 247.5% 104.0% 45.1% 60.7% 111.1% 12.9% 4.4% 32.5%
FY FY
2011:3 2011:4 2012:1 2012:2 2012 2012:3 2012:4 2013:1 2013:2 2013
ADVANCE PAYMENTS1
120,766 154,290 74,344 163,070 512,470 116,171 159,889 75,731 176,422 528,213
%CHYA 4.8% -12.1% -2.7% -1.4% -3.8% -3.8% 3.6% 1.9% 8.2% 3.1%
FINAL PAYMENTS1 19,117 26,841 43,141 43,405 132,503 17,744 24,042 37,216 41,109 120,110 %CHYA -12.2% 26.6% 20.6% 6.4% 10.8% -7.2% -10.4% -13.7% -5.3% -9.4%
REFUNDS 34,927 91,253 61,311 45,019 232,511 47,888 96,038 62,553 41,667 248,145
%CHYA 51.0% 1.5% 56.9% 43.0% 26.7% 37.1% 5.2% 2.0% -7.4% 6.7%
TOTAL1
104,955 89,878 56,174 161,456 412,463 86,028 87,893 50,393 175,863 400,178
%CHYA -7.9% -15.9% -23.2% -7.6% -12.0% -18.0% -2.2% -10.3% 8.9% -3.0%
OREGON CORPORATE INCOME TAX REVENUE FORECAST - QUARTERLY COLLECTIONS
Thousands of Dollars - Not Seasonally Adjusted March 2012

8/3/2019 Oregon Revenue Forecast Feb 2012: Appendix B
http://slidepdf.com/reader/full/oregon-revenue-forecast-feb-2012-appendix-b 8/13
97
TABLE B.5
FY FY
2013:3 2013:4 2014:1 2014:2 2014 2014:3 2014:4 2015:1 2015:2 2015
ADVANCE PAYMENTS1 142,287 192,946 96,555 198,119 629,907 151,714 203,851 102,519 202,259 660,343
%CHYA 22.5% 20.7% 27.5% 12.3% 19.3% 6.6% 5.7% 6.2% 2.1% 4.8%
FINAL PAYMENTS1 15,347 26,964 42,142 47,167 131,620 22,201 31,035 47,278 51,471 151,985
%CHYA -13.5% 12.2% 13.2% 14.7% 9.6% 44.7% 15.1% 12.2% 9.1% 15.5%
REFUNDS 41,153 92,156 58,859 43,092 235,261 41,419 90,847 58,596 50,432 241,293
%CHYA -14.1% -4.0% -5.9% 3.4% -5.2% 0.6% -1.4% -0.4% 17.0% 2.6%
TOTAL1
116,481 127,754 79,838 202,193 526,266 132,497 144,039 91,201 203,298 571,035
%CHYA 35.4% 45.4% 58.4% 15.0% 31.5% 13.8% 12.7% 14.2% 0.5% 8.5%
FY FY
2015:3 2015:4 2016:1 2016:2 2016 2016:3 2016:4 2017:1 2017:2 2017
ADVANCE PAYMENTS1 149,109 202,205 99,377 202,782 653,473 151,511 204,818 100,594 204,541 661,465
%CHYA -1.7% -0.8% -3.1% 0.3% -1.0% 1.6% 1.3% 1.2% 0.9% 1.2%
FINAL PAYMENTS1 26,442 30,013 45,425 49,987 151,867 24,100 28,990 44,633 48,945 146,668
%CHYA 19.1% -3.3% -3.9% -2.9% -0.1% -8.9% -3.4% -1.7% -2.1% -3.4%
REFUNDS 49,871 93,285 61,422 51,458 256,037 49,609 94,656 63,095 52,128 259,488
%CHYA 20.4% 2.7% 4.8% 2.0% 6.1% -0.5% 1.5% 2.7% 1.3% 1.3%
TOTAL1
125,680 138,933 83,380 201,311 549,304 126,002 139,153 82,132 201,358 548,645
%CHYA -5.1% -3.5% -8.6% -1.0% -3.8% 0.3% 0.2% -1.5% 0.0% -0.1%
FY FY2017:3 2017:4 2018:1 2018:2 2018 2018:3 2018:4 2019:1 2019:2 2019
ADVANCE PAYMENTS1 150,879 204,039 99,645 204,378 658,942 150,647 204,582 101,406 205,952 662,587
%CHYA -0.4% -0.4% -0.9% -0.1% -0.4% -0.2% 0.3% 1.8% 0.8% 0.6%
FINAL PAYMENTS1 22,979 28,288 43,759 47,782 142,808 21,937 27,559 43,579 48,376 141,451
%CHYA -4.7% -2.4% -2.0% -2.4% -2.6% -4.5% -2.6% -0.4% 1.2% -1.0%
REFUNDS 50,398 96,262 64,286 52,517 263,463 50,044 95,016 63,128 51,444 259,632
%CHYA 1.6% 1.7% 1.9% 0.7% 1.5% -0.7% -1.3% -1.8% -2.0% -1.5%
TOTAL1
123,460 136,066 79,117 199,644 538,287 122,539 137,125 81,857 202,884 544,405
%CHYA -2.0% -2.2% -3.7% -0.9% -1.9% -0.7% 0.8% 3.5% 1.6% 1.1%
FY FY
2019:3 2019:4 2020:1 2020:2 2020 2020:3 2020:4 2021:1 2021:2 2021
ADVANCE PAYMENTS1 151,451 204,332 102,664 206,910 665,357 154,479 206,923 105,785 210,707 677,894
%CHYA 0.5% -0.1% 1.2% 0.5% 0.4% 2.0% 1.3% 3.0% 1.8% 1.9%
FINAL PAYMENTS1 22,809 28,850 44,795 49,762 146,215 24,377 30,993 47,212 51,985 154,567
%CHYA 4.0% 4.7% 2.8% 2.9% 3.4% 6.9% 7.4% 5.4% 4.5% 5.7%
REFUNDS 49,312 94,390 62,110 49,663 255,474 47,250 93,173 60,739 46,795 247,957
%CHYA -1.5% -0.7% -1.6% -3.5% -1.6% -4.2% -1.3% -2.2% -5.8% -2.9%
TOTAL1
124,948 138,792 85,349 207,009 556,098 131,606 144,743 92,258 215,897 584,504
%CHYA 2.0% 1.2% 4.3% 2.0% 2.1% 5.3% 4.3% 8.1% 4.3% 5.1%
1Includes reductions related to credits realized under the Business Energy Tax Credit Program, adjustments for connecting with federal tax law, and increases related to the sunset of tax credits
associated with HB2607.
March 2012
OREGON CORPORATE INCOME TAX REVENUE FORECAST - QUARTERLY COLLECTIONS
Thousands of Dollars - Not Seasonally Adjusted
8/3/2019 Oregon Revenue Forecast Feb 2012: Appendix B
http://slidepdf.com/reader/full/oregon-revenue-forecast-feb-2012-appendix-b 9/13

8/3/2019 Oregon Revenue Forecast Feb 2012: Appendix B
http://slidepdf.com/reader/full/oregon-revenue-forecast-feb-2012-appendix-b 10/13
99
Table B.7 Revenue Distribution to Local Governments 1
TABLE B.7
Revenue Distribution to Local Governments (Millions of $)
Cigarette Tax
Total Liquor Distribution to
Revenue General Mental Wine and Revenue Cities, Counties &
Available Fund (56%) He alth1
Beer Sharing Regular Total Counties Public Transit2
2009-10 171.945 97.322 8.277 0.267 21.025 30.036 51.061 15.018 11.701
2010-11 178.307 101.248 7.980 0.269 21.895 31.278 53.172 15.639 12.068
2009-11 Biennium 350.252 198.570 16.256 0.536 42.920 61.314 104.233 30.657 23.769
2011-12 194.143 110.209 8.222 0.284 24.000 34.285 58.285 17.143 11.659
2012-13 202.067 114.707 8.558 0.296 24.980 35.685 60.664 17.842 11.347
2011-13 Biennium 396.210 224.916 16.780 0.580 48.980 69.970 118.950 34.985 23.005
2013-14 192.895 102.915 8.814 0.305 25.729 36.755 62.484 18.378 10.917
2014-15 198.682 106.002 9.079 0.314 26.501 37.858 64.359 18.929 10.4522013-15 Biennium 391.578 208.917 17.893 0.619 52.230 74.613 126.843 37.307 21.370
2015-16 204.643 109.182 9.351 0.323 27.296 38.994 66.290 19.497 9.991
2016-17 210.782 112.458 9.632 0.333 28.115 40.163 68.278 20.082 9.385
2015-17 Biennium 415.425 221.640 18.983 0.656 55.411 79.157 134.568 39.579 19.376
2017-18 217.105 115.831 9.920 0.343 28.958 41.368 70.327 20.684 8.963
2018-19 223.618 119.306 10.218 0.353 29.827 42.609 72.436 21.305 8.559
2017-19 Biennium 440.724 235.138 20.138 0.696 58.785 83.978 142.763 41.989 17.522
2019-20 230.327 122.886 10.525 0.364 30.722 43.888 74.609 21.944 8.174
2020-21 237.237 126.572 10.840 0.375 31.643 45.204 76.848 22.602 7.806
2019-21 Biennium 467.564 249.458 21.365 0.739 62.365 89.092 151.457 44.546 15.980
1Mental Health Alcoh olism and Drug Services Account , per ORS 471.810
2For details on cigarette revenues see TABLE B.6 on previous page
March 2012
Liquor Apportionment Distribution
City Re venue

8/3/2019 Oregon Revenue Forecast Feb 2012: Appendix B
http://slidepdf.com/reader/full/oregon-revenue-forecast-feb-2012-appendix-b 11/13
100
Table B.8 Track Record for the May 2011 Forecast 1
(Millions of dollars)
Actual
Revenues
Latest
Forecast
Percent
Difference
Prior
Year
Percent
Change
Withholding $1,287.0 $1,275.9 0.9% $1,196.2 7.6%
Dollar difference $11.1 $90.8
Estimated Payments $185.2 $185.2 0.0% $148.6 24.7%
Dollar difference $0.0 $36.7
Final Payments $87.2 $87.8 -0.6% $81.7 6.7%
Dollar difference -$0.6 $5.5
Refunds -$156.3 -$110.4 41.6% -$151.5 3.1%
Dollar difference -$45.9 -$4.8
Total Personal Income Tax $1,403.2 $1,438.5 -2.5% $1,275.0 10.1%
Dollar difference -$35.3 $128.2
(Millions of dollars)Actual
RevenuesLatest
ForecastPercent
DifferencePrior Year
PercentChange
Advanced Payments $154.3 $182.4 -15.4% $175.6 -12.1%
Dollar difference -$28.1 -$21.3
Final Payments $26.8 $28.3 -5.0% $21.2 26.6%
Dollar difference -$1.4 $5.6
Refunds -$91.3 -$121.7 -25.0% -$89.9 1.5%
Dollar difference $30.5 -$1.4
Total Corporate Income Tax $89.9 $89.0 1.0% $106.9 -15.9%
Dollar difference $0.9 -$17.0
(Millions of dollars)
Actual
Revenues
Latest
Forecast
Percent
Difference
Prior
Year
Percent
ChangeCorporate and Personal Tax $1,493.1 $1,527.5 -2.3% $1,381.9 8.0%
Dollar difference -$34.4 $111.2
Corporate Income Tax Forecast Comparison
Table B.8 Track Record for the March 2012 Forecast(Quarter ending December 31, 2011)
Total Income Tax Forecast Comparison Year/Year Change
Forecast Comparison Year/Year Change
Year/Year Change
Personal Income Tax

8/3/2019 Oregon Revenue Forecast Feb 2012: Appendix B
http://slidepdf.com/reader/full/oregon-revenue-forecast-feb-2012-appendix-b 12/13

8/3/2019 Oregon Revenue Forecast Feb 2012: Appendix B
http://slidepdf.com/reader/full/oregon-revenue-forecast-feb-2012-appendix-b 13/13
Table B.10 Budgetary Reserve Summary and Outlook 1
Rainy Day Fund(Millions) 2007-09 2009-11 2011-13 2013-15 2015-17 2017-19 2019-21
Beginning Balance $0.0 $112.5 $10.4 $46.1 $245.5 $487.8 $781.0
Interest Earnings $18.3 $1.3 $0.4 $1.9 $24.4 $57.4 $87.0
Deposits1
$94.3 -$103.4 $35.2 $197.5 $217.9 $235.8 $257.1
Ending Balance2$112.5 $10.4 $46.1 $245.5 $487.8 $781.0 $1,125.1
Education Stability Fund3
(Millions) 2007-09 2009-11 2011-13 2013-15 2015-17 2017-19 2019-21
Beginning Balance $178.9 $0.0 $5.1 $9.8 $209.1 $425.5 $669.4
Interest Earnings4 $17.2 $1.0 $0.4 $1.4 $21.0 $48.6 $72.3
Deposits5 -$178.9 $101.4 $187.0 $199.3 $216.3 $244.0 $233.2
Distributions -$17.1 -$97.4 -$182.7 -$1.4 -$21.0 -$48.6 -$72.3
Oregon Education Fund -$12.8 -$0.7 -$0.3 -$1.0 -$15.8 -$36.4 -$54.2
State Scholarship Commission -$4.3 -$0.2 -$0.1 -$0.3 -$5.3 -$12.1 -$18.1
Withdrawals $0.0 -$96.4 -$182.2 $0.0 $0.0 $0.0 $0.0
Ending Balance $0.0 $5.1 $9.8 $209.1 $425.5 $669.4 $902.7
Total Reserves(Millions) 2007-09 2009-11 2011-13 2013-15 2015-17 2017-19 2019-21
Ending Balances $112.6 $15.5 $55.9 $454.6 $913.2 $1,450.4 $2,027.7
Percent of GF Revenues 1.0% 0.1% 0.4% 2.9% 5.2% 7.5% 9.5%
Table B.10: Budgetary Reserve Summary and Outlook
Footnotes:
1. Includes transfer of ending General Fund balances, up to 1% of budgeted appropriations, as well as private donations. Assumes future appropriations equal to 98.75 percent
of available resources. Starting with 2013-15, projected corporate income taxes above the rate of 6.6% for the biennium are deposited on or before June 30 of each odd-
numbered year.
2. Available funds in a given biennium equal 2/3rds of the beginning balance under current law.
3. Excludes funds in the Oregon Growth and the Oregon Resource and Technology Development subaccounts.
4. Interest earnings are distributed to the Oregon Education Funds (75%) and the State Scholarship Fund (25%).
5. Contributions to the ESF are capped at 5% of the prior biennium's General Fund revenue total. Quarterly contributions are made until the balance exceeds the cap.
Includes withdrawals of $393.8 million in FY 2008-09 and a future withdrawal of $84.3 million in FY 2010-11 for the State School Fund. For FY 2011-12, includes a
withdrawal of $100 million to the 2011-12 School Year Subaccount.
March 2012