oregon economic forecast presentation
TRANSCRIPT

7/31/2019 Oregon Economic Forecast Presentation
http://slidepdf.com/reader/full/oregon-economic-forecast-presentation 1/25
OregonQuarterly Economic & Revenue
Outlook Mark McMullen & Josh Lehner
Office of Economic Analysis
Bill Conerly
Conerly Consulting August 29, 2012

7/31/2019 Oregon Economic Forecast Presentation
http://slidepdf.com/reader/full/oregon-economic-forecast-presentation 2/25
OregonU.S. Economy
7/31/2019 Oregon Economic Forecast Presentation
http://slidepdf.com/reader/full/oregon-economic-forecast-presentation 3/25
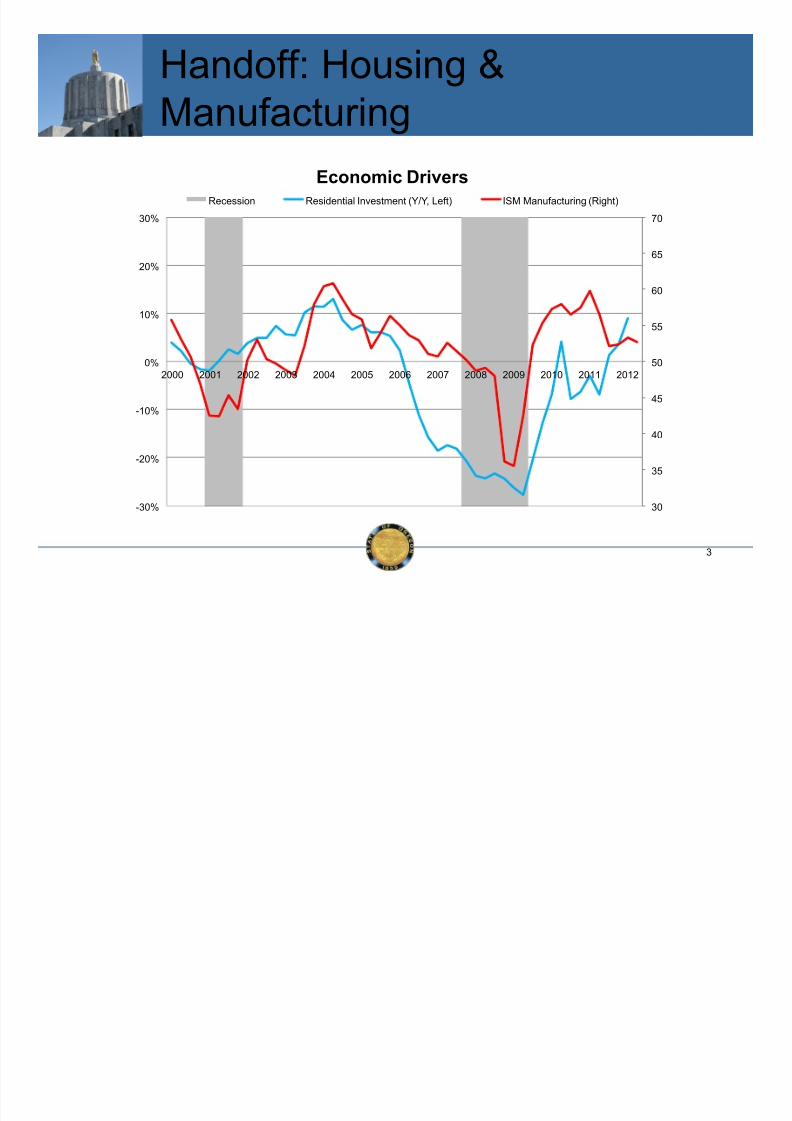
Handoff: Housing &Manufacturing
3
30
35
40
45
50
55
60
65
70
-30%
-20%
-10%
0%
10%
20%
30%
2000 2001 2002 2003 2004 2005 2006 2007 2008 2009 2010 2011 2012
Economic Drivers
Recession Residential Investment (Y/Y, Left) ISM Manufacturing (Right)

7/31/2019 Oregon Economic Forecast Presentation
http://slidepdf.com/reader/full/oregon-economic-forecast-presentation 4/25
Universal Pessimism:Recent economic forecasts, % change
1.0%
1.5%
2.0%
2.5%
3.0%
FOMC GlobalInsight PhillyFed BlueChip WSJSurvey OEA WesternBlue
Chip
U.S.RealGDP OregonEmployment
2012GrowthForecasts
3MonthsAgo Today
1.0%
1.5%
2.0%
2.5%
3.0%
FOMC GlobalInsight PhillyFed BlueChip WSJSurvey OEA WesternBlue
Chip
U.S.RealGDP OregonEmployment
2013GrowthForecasts3MonthsAgo Today
7/31/2019 Oregon Economic Forecast Presentation
http://slidepdf.com/reader/full/oregon-economic-forecast-presentation 5/25
The State of Oregonin an
Uncertain EconomyDr. Bill Conerly
for
Senate Finance & Revenue CommitteeHouse Interim Revenue Committee
August 29, 2012
7/31/2019 Oregon Economic Forecast Presentation
http://slidepdf.com/reader/full/oregon-economic-forecast-presentation 6/25
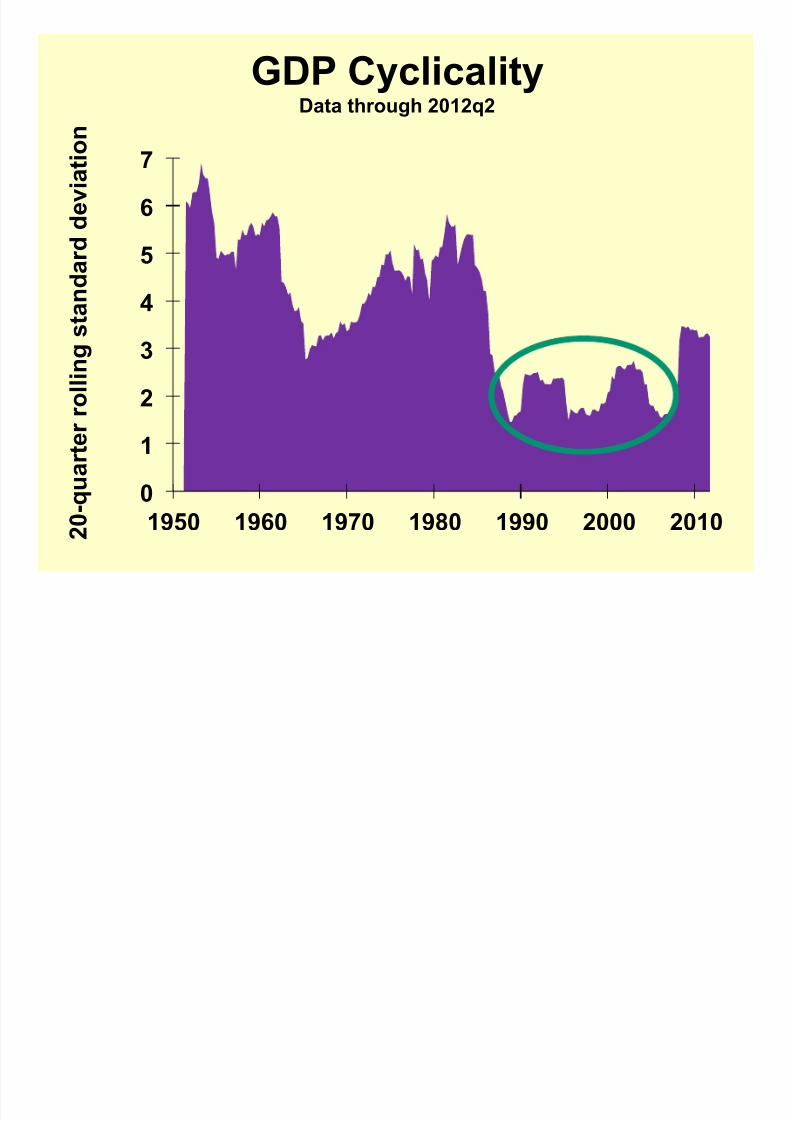
0
1
2
3
4
5
6
7
1950 1960 1970 1980 1990 2000 2010 2 0 - q u a r t e r r
o l l i n g s t a n d a r d d e v i a t i o n
GDP CyclicalityData through 2012q2
7/31/2019 Oregon Economic Forecast Presentation
http://slidepdf.com/reader/full/oregon-economic-forecast-presentation 7/25
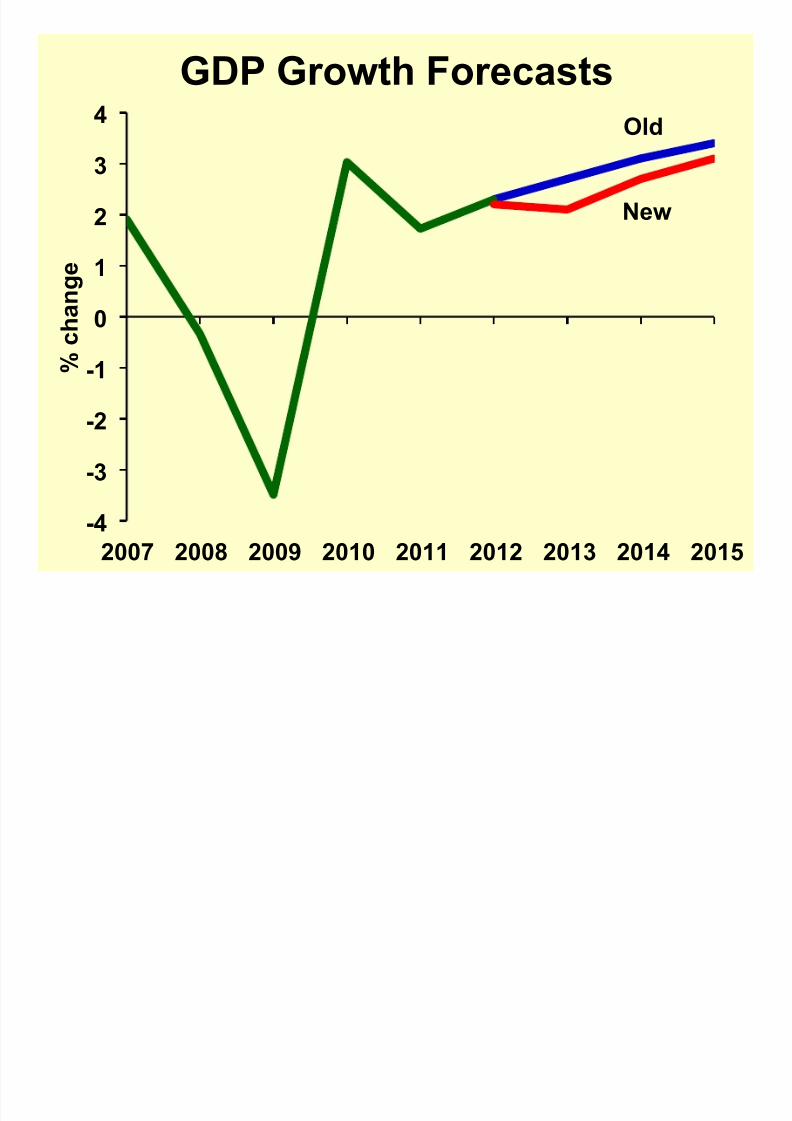
Old
New
-4
-3
-2
-1
0
1
2
3
4
2007 2008 2009 2010 2011 2012 2013 2014 2015
% c
h a n g e
GDP Growth Forecasts

7/31/2019 Oregon Economic Forecast Presentation
http://slidepdf.com/reader/full/oregon-economic-forecast-presentation 8/25
Old
New
-4
-3
-2
-1
0
1
2
3
4
2007 2008 2009 2010 2011 2012 2013 2014 2015
% c
h a n g e
GDP Growth Forecasts
Recession Risks
Europe
China
Fiscal Cliff Uncertainty
7/31/2019 Oregon Economic Forecast Presentation
http://slidepdf.com/reader/full/oregon-economic-forecast-presentation 9/25
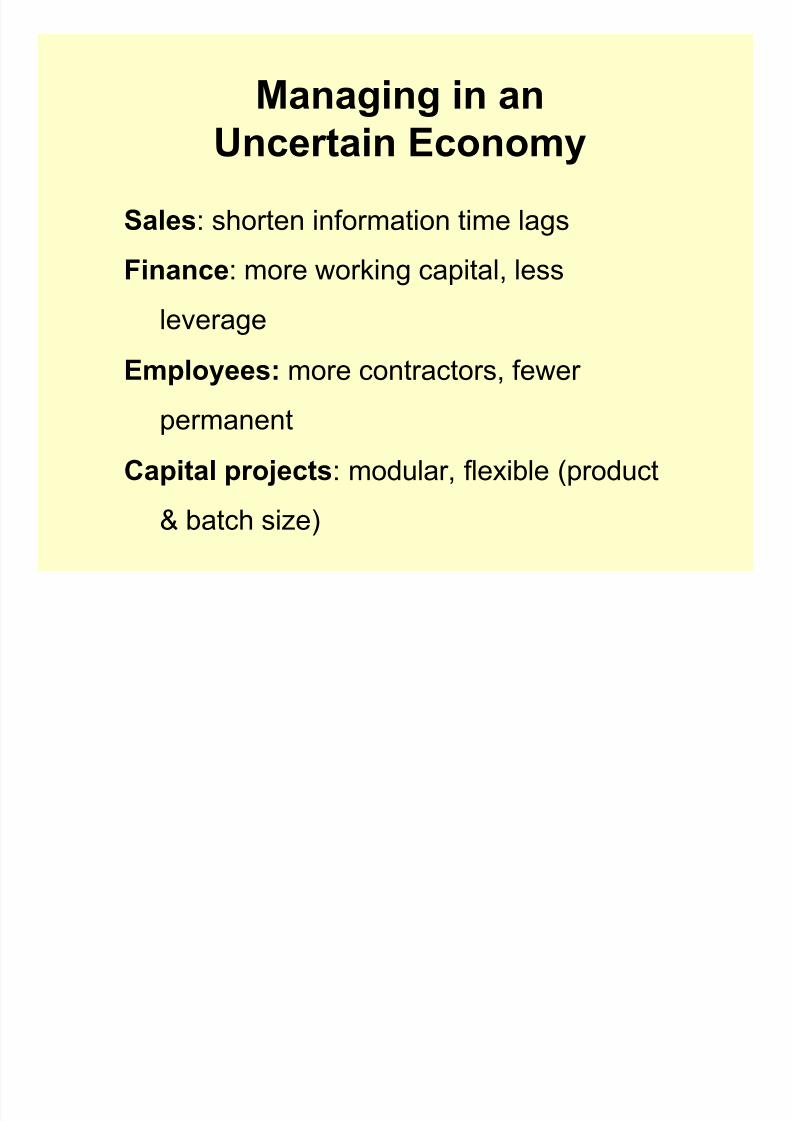
Managing in an
Uncertain Economy
Sales: shorten information time lags
Finance: more working capital, lessleverage
Employees: more contractors, fewer
permanent
Capital projects: modular, flexible (product
& batch size)

7/31/2019 Oregon Economic Forecast Presentation
http://slidepdf.com/reader/full/oregon-economic-forecast-presentation 10/25
OregonOregon Economy
7/31/2019 Oregon Economic Forecast Presentation
http://slidepdf.com/reader/full/oregon-economic-forecast-presentation 11/25
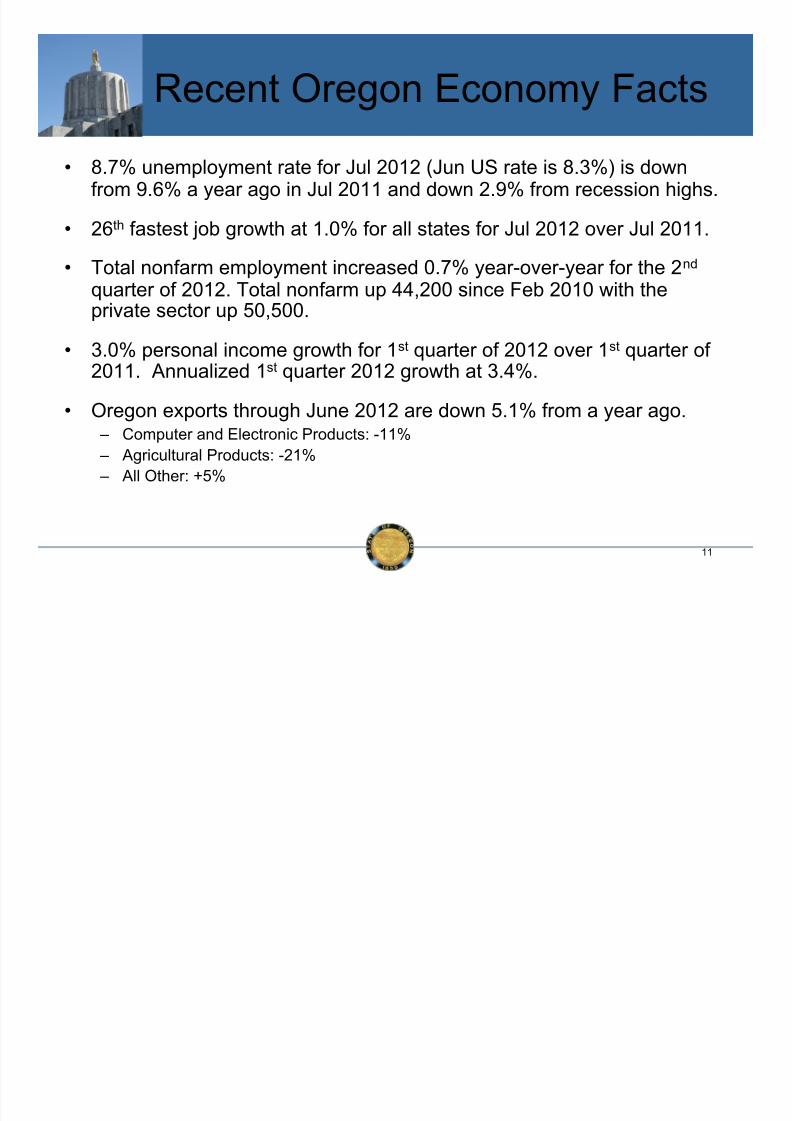
11
• 8.7% unemployment rate for Jul 2012 (Jun US rate is 8.3%) is downfrom 9.6% a year ago in Jul 2011 and down 2.9% from recession highs.
• 26th fastest job growth at 1.0% for all states for Jul 2012 over Jul 2011. •
Total nonfarm employment increased 0.7% year-over-year for the 2nd
quarter of 2012. Total nonfarm up 44,200 since Feb 2010 with theprivate sector up 50,500.
• 3.0% personal income growth for 1st quarter of 2012 over 1st quarter of 2011. Annualized 1st quarter 2012 growth at 3.4%.
• Oregon exports through June 2012 are down 5.1% from a year ago. – Computer and Electronic Products: -11%
– Agricultural Products: -21%
– All Other: +5%
Recent Oregon Economy Facts
7/31/2019 Oregon Economic Forecast Presentation
http://slidepdf.com/reader/full/oregon-economic-forecast-presentation 12/25
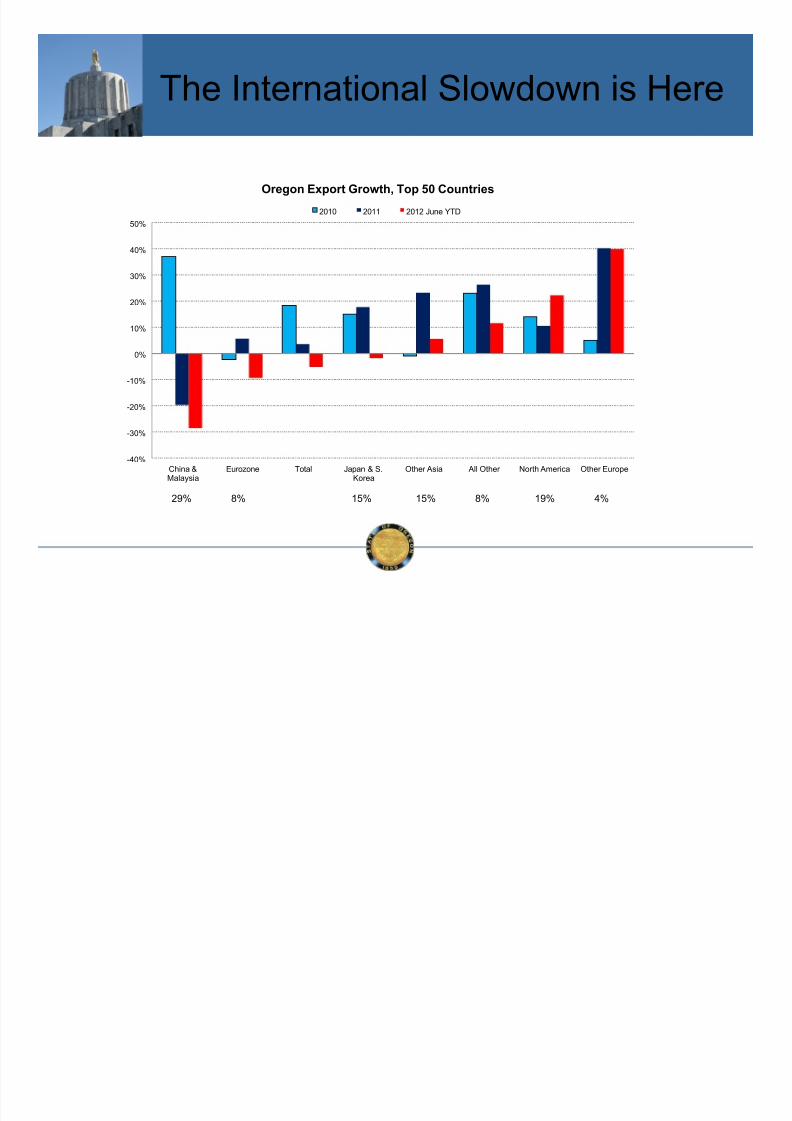
-40%
-30%
-20%
-10%
0%
10%
20%
30%
40%
50%
China &Malaysia
Eurozone Total Japan & S.Korea
Other Asia All Other North America Other Europe
Oregon Export Growth, Top 50 Countries
2010 2011 2012 June YTD
29% 8% 15% 15% 8% 19% 4%
The International Slowdown is Here

7/31/2019 Oregon Economic Forecast Presentation
http://slidepdf.com/reader/full/oregon-economic-forecast-presentation 13/25
Housing No Longer A Drag
-4,000
-3,000
-2,000
-1,000
0
1,000
2,000
3,000
Jan-91 Jan-94 Jan-97 Jan-00 Jan-03 Jan-06 Jan-09 Jan-12
Housing and Related IndustriesRecession Monthly Gain 12 Month Moving Average
7/31/2019 Oregon Economic Forecast Presentation
http://slidepdf.com/reader/full/oregon-economic-forecast-presentation 14/25
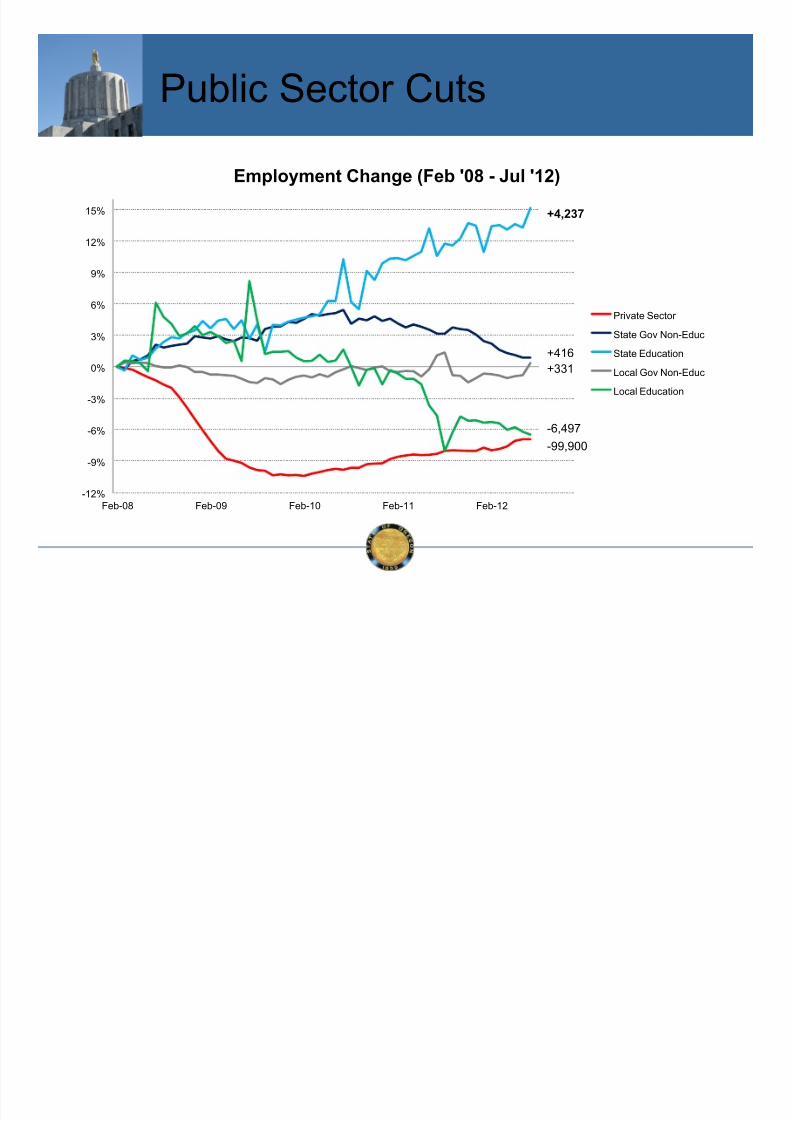
Public Sector Cuts
-12%
-9%
-6%
-3%
0%
3%
6%
9%
12%
15%
Feb-08 Feb-09 Feb-10 Feb-11 Feb-12
Employment Change (Feb '08 - Jul '12)
Private Sector
State Gov Non-Educ
State Education
Local Gov Non-Educ
Local Education
+4,237
+416
+331
-6,497
-99,900
7/31/2019 Oregon Economic Forecast Presentation
http://slidepdf.com/reader/full/oregon-economic-forecast-presentation 15/25
OregonRevenue Outlook
7/31/2019 Oregon Economic Forecast Presentation
http://slidepdf.com/reader/full/oregon-economic-forecast-presentation 16/25
16
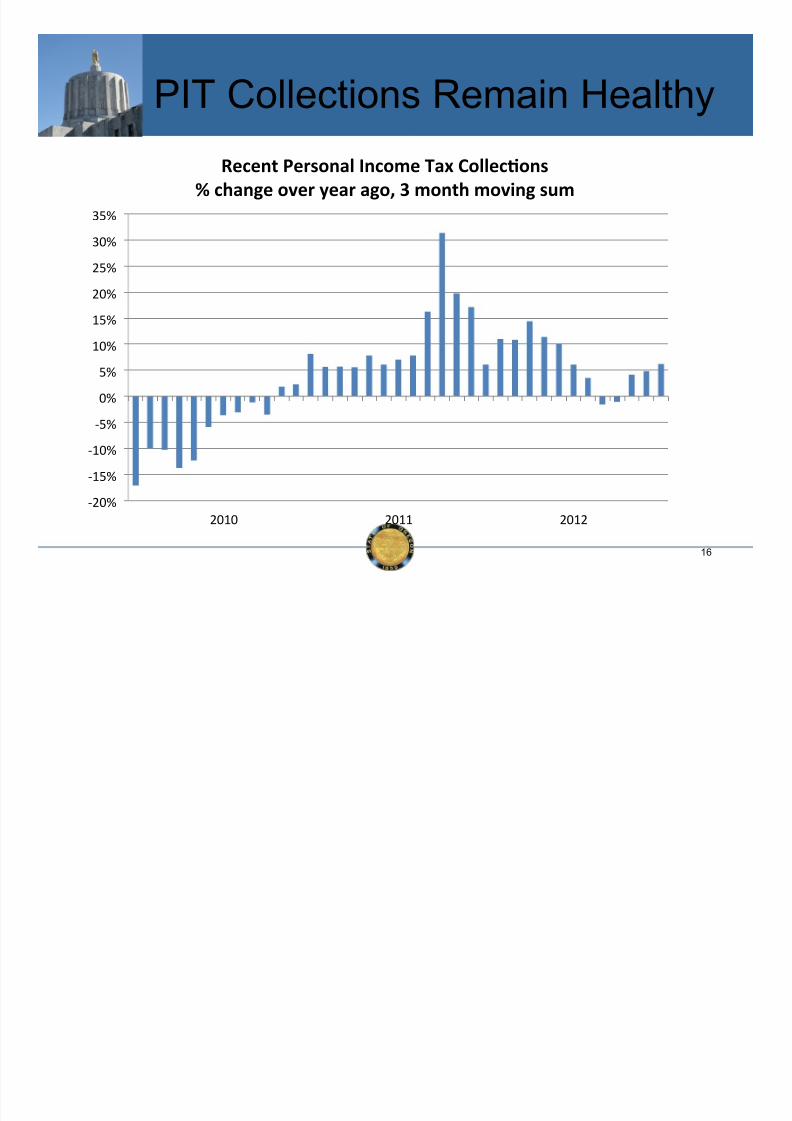
PIT Collections Remain Healthy
-20%
-15%
-10%
-5%
0%
5%
10%
15%
20%
25%
30%
35%
2010 2011 2012
RecentPersonalIncomeTaxCollec:ons
%changeoveryearago,3monthmovingsum

7/31/2019 Oregon Economic Forecast Presentation
http://slidepdf.com/reader/full/oregon-economic-forecast-presentation 17/25
17
Corporate Collections: Has theBleeding Stopped?
-40%
-30%
-20%
-10%
0%
10%
20%
30%
40%
50%
60%
Jan
2011
Feb Mar Apr May Jun Jul Aug Sep Oct Nov Dec Jan
2012
Feb Mar Apr May Jun Jul
CorporateIncomeTaxCollec:ons
%changeoveryearago,3monthmovingsum
7/31/2019 Oregon Economic Forecast Presentation
http://slidepdf.com/reader/full/oregon-economic-forecast-presentation 18/25
1818
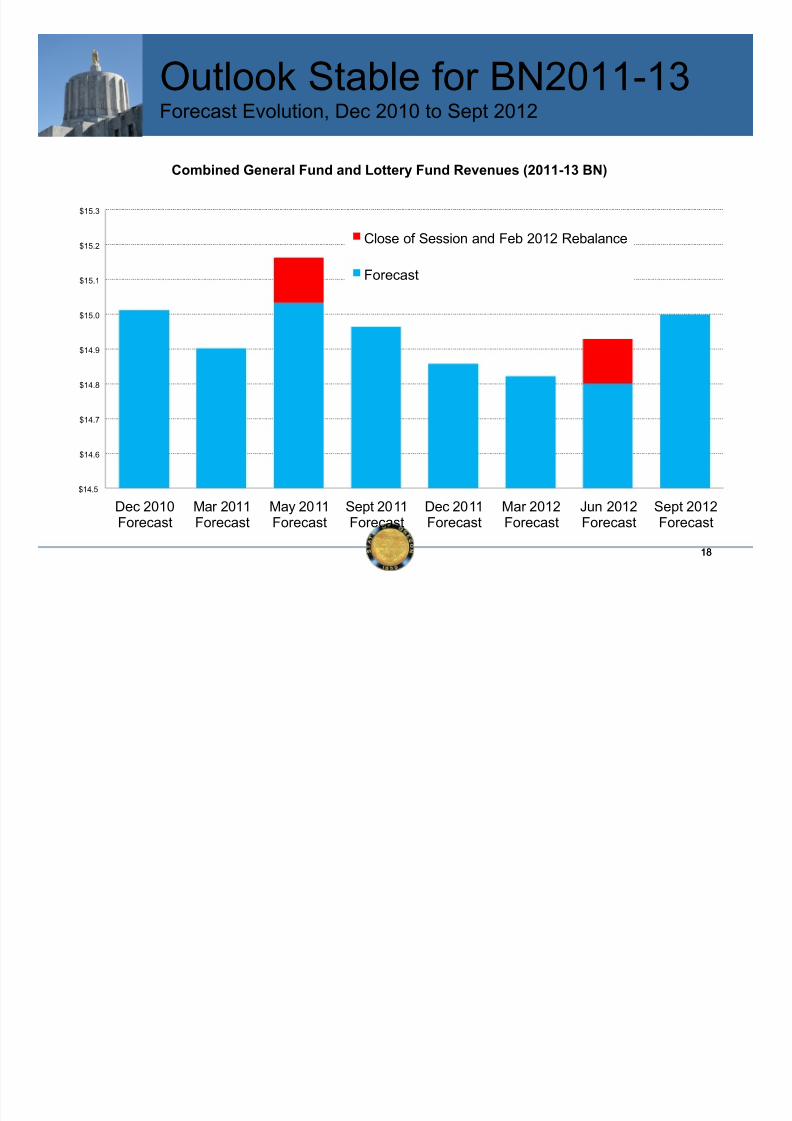
Outlook Stable for BN2011-13Forecast Evolution, Dec 2010 to Sept 2012
$14.5
$14.6
$14.7
$14.8
$14.9
$15.0
$15.1
$15.2
$15.3
Dec 2010Forecast
Mar 2011Forecast
May 2011Forecast
Sept 2011Forecast
Dec 2011Forecast
Mar 2012Forecast
Jun 2012Forecast
Sept 2012Forecast
Combined General Fund and Lottery Fund Revenues (2011-13 BN)
Close of Session and Feb 2012 Rebalance
Forecast

7/31/2019 Oregon Economic Forecast Presentation
http://slidepdf.com/reader/full/oregon-economic-forecast-presentation 19/25
1919
Forecast ChangesDifference from June forecast, $ millions
71
-319
-399
-471
-578
-$700
-$600
-$500
-$400
-$300
-$200
-$100
$0
$100
$200
2011-13 2013-15 2015-17 2017-19 2019-21
Personal Corporate Lottery Other Total

7/31/2019 Oregon Economic Forecast Presentation
http://slidepdf.com/reader/full/oregon-economic-forecast-presentation 20/25
20
2.5
3.5
4.5
5.5
6.5
7.5
8.5
9.5
1996 1998 2000 2002 2004 2006 2008 2010 2012 2014 2016 2018 2020
Personal Income Tax Collections (September 2012 Forecast)
PIT Collections Excluding Kicker
PIT Collections (June 2012 Forecast)
Personal Income Tax Forecast$ billions, 4 quarter moving sum
2011-13+$36.7(million)
2013-15-$219.5
2015-17-$310.1
2017-19-$418.2
2020-21-$479.2

7/31/2019 Oregon Economic Forecast Presentation
http://slidepdf.com/reader/full/oregon-economic-forecast-presentation 21/25
21
150
200
250
300
350
400
450
500
550
600
650
1996 1998 2000 2002 2004 2006 2008 2010 2012 2014 2016 2018 2020
Corporate Income Tax Collections(September 2012 Forecast)
Corporate Income Tax Collections(June 2012 Forecast)
Corporate Income Tax Forecast$ millions, 4 quarter moving sum
2011-13+$28.1(million)
2013-15-$27.2
2015-17-$19.4
2017-19-$29.2
2019-21-$55.7
7/31/2019 Oregon Economic Forecast Presentation
http://slidepdf.com/reader/full/oregon-economic-forecast-presentation 22/25
22
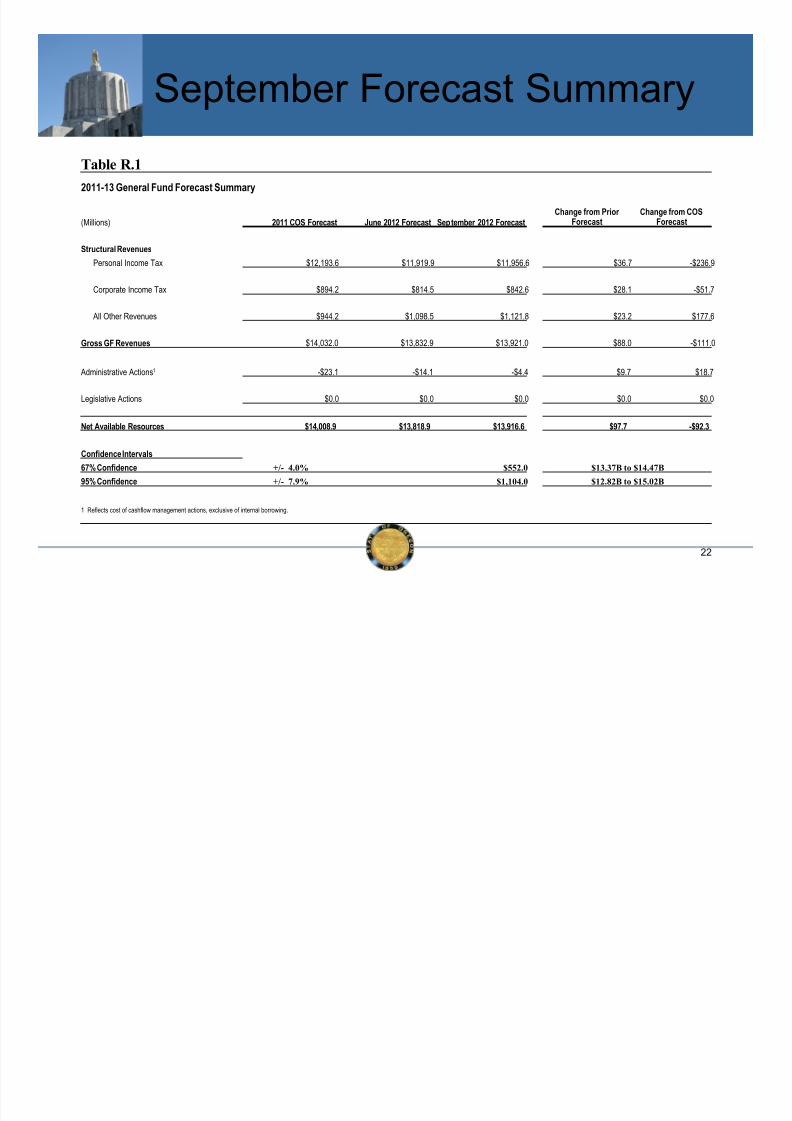
September Forecast Summary
Table R.1
2011-13 General Fund Forecast Summary
(Millions) 2011 COS Forecast June 2012 Forecast September 2012 ForecastChange from Prior
ForecastChange from COS
Forecast
Structural Revenues
Personal Income Tax $12,193.6 $11,919.9 $11,956.6 $36.7 -$236.9
Corporate Income Tax $894.2 $814.5 $842.6 $28.1 -$51.7
All Other Revenues $944.2 $1,098.5 $1,121.8 $23.2 $177.6
Gross GF Revenues $14,032.0 $13,832.9 $13,921.0 $88.0 -$111.0
Administrative Actions1 -$23.1 -$14.1 -$4.4 $9.7 $18.7
Legislative Actions $0.0 $0.0 $0.0 $0.0 $0.0
Net Available Resources $14,008.9 $13,818.9 $13,916.6 $97.7 -$92.3
Confidence Intervals
67% Confidence +/- 4.0% $552.0 $13.37B to $14.47B
95% Confidence +/- 7.9% $1,104.0 $12.82B to $15.02B
1 Reflects cost of cashflow management actions, exclusive of internal borrowing.

7/31/2019 Oregon Economic Forecast Presentation
http://slidepdf.com/reader/full/oregon-economic-forecast-presentation 23/25
23
10-Year Forecast
General Fund Revenue Forecast Summary (Millions of Dollars, Current Law)
Forecast Forecast Forecast Forecast Forecast Forecast
2009-11 % 2011-13 % 2013-15 % 2015-17 % 2017-19 % 2019-21 %
Revenue Source Biennium Chg Biennium Chg Biennium Chg Biennium Chg Biennium Chg Biennium Chg
Personal Income Taxes 10,467.2 3.7% 11,956.6 14.2% 13,416.9 12.2% 15,069.0 12.3% 16,638.4 10.4% 18,405.7 10.6%
Corporate Income Taxes 827.6 20.9% 842.6 1.8% 1,070.8 27.1% 1,083.7 1.2% 1,056.6 -2.5% 1,081.7 2.4%
All Others 1,226.6 29.8% 1,121.8 -8.5% 967.2 -13.8% 1,025.8 6.1% 1,096.6 6.9% 1,184.4 8.0%
Total General Fund 12,521.4 6.8% 13,921.0 11.2% 15,454.8 11.0% 17,178.5 11.2% 18,791.6 9.4% 20,671.8 10.0%
Kick er Distribu tions - - - - - -
Total Revenue 12,521.4 -2.2% 13,921.0 11.2% 15,454.8 11.0% 17,178.5 11.2% 18,791.6 9.4% 20,671.8 10.0%
Other taxes inc lude General Fund portions of the Eastern Oregon Severance Tax , Western Oregon Severance Tax and Amusement Dev ice Tax .
Commercial Fish Licenses & Fees and Pari-mutual Receipts are included in Other Revenues

7/31/2019 Oregon Economic Forecast Presentation
http://slidepdf.com/reader/full/oregon-economic-forecast-presentation 24/25
2424
Biennial Revenue Growth
-12%
-8%
-4%
0%
4%
8%
12%
16%
20%
24%PIT TOTAL

7/31/2019 Oregon Economic Forecast Presentation
http://slidepdf.com/reader/full/oregon-economic-forecast-presentation 25/25
25
For More Information
Standard Contact:
155 Cottage Street NE
Salem, OR 97301
(503) [email protected]
www.oregon.gov/das/oea
Social Media:oregoneconomicanalysis.wordpress.com
@OR_EconAnalysis