oregon investment council...motion: treasurer read moved approval of the proposed changes to the...
TRANSCRIPT

Oregon Investment
Council June 6, 2018 9:00 AM
Oregon State Treasury
16290 SW Upper Boones Ferry Road Tigard, OR 97224
Rukaiyah Adams Chair
John Skjervem
Chief Investment Officer
Tobias Read State Treasurer

Rukaiyah Adams John Russell Rex Kim Rick Miller, Jr. Tobias Read Chair Vice Chair Member Member State Treasurer
OREGON INVESTMENT COUNCIL
Agenda
June 6, 2018
9:00 AM
Oregon State Treasury Investment Division
16290 SW Upper Boones Ferry Road Tigard, OR 97224
Time A. Action Items Presenter Tab 9:00-9:05 1. Review & Approval of Minutes Rukaiyah Adams 1 April 25 & April 27, 2018 OIC Chair 9:05-9:10 2. Committee Reports and CIO Remarks John Skjervem 2 Chief Investment Officer 9:10-10:00 3. TPG Partners VIII, L.P. & TPG Healthcare Partners, L.P. Michael Langdon 3 OPERF Private Equity Portfolio Senior Investment Officer, Private Equity Tom Martin Managing Director, TorreyCove Capital Partners Jim Coulter Founder and Co-CEO, TPG 10:00-10:30 4. Statement of Investment and Management Beliefs Allan Emkin 4 Managing Director, Pension Consulting Alliance 10:30-10:45 -------------------- BREAK --------------------
B. Information Items 10:45-11:05 5. Q1 2018 Performance & Risk Report Karl Cheng 5 OPERF Senior Investment Officer, Portfolio Risk & Research Janet Becker-Wold Senior Vice President, Callan Associates

Rukaiyah Adams John Russell Rex Kim Rick Miller, Jr. Tobias Read Chair Vice Chair Member Member State Treasurer
OIC Meeting Agenda June 6, 2018 Page 2
11:05-11:35 6. OST Investment Operations Update David Randall 6
OPERF & Other OST-managed Accounts Director of Investment Operations Perrin Lim Director of Capital Markets
Debra Day Investment Reporting Manager Ron Allen Managing Director, Blackrock Solutions 11:35-12:05 7. Common School Fund Michael Viteri 7
Annual Review Senior Investment Officer, Public Equity Bill Ryan
Deputy Director for Operations, Department of State Lands Jim Callahan President, Callan Associates 12:05-12:10 8. Asset Allocations & NAV Updates John Skjervem 8 a. Oregon Public Employees Retirement Fund b. SAIF Corporation c. Common School Fund d. Southern Oregon University Endowment Fund 9. Calendar — Future Agenda Items 9 12:10 10. Open Discussion Council Members Staff Consultants C. Public Comment Invited 5 Minutes

TAB 1 – REVIEW & APPROVAL OF MINUTES
April 25, 2018 Regular Meeting
April 27, 2018 Special Meeting

JOHN D. SKJERVEM CHIEF INVESTMENT OFFICER INVESTMENT DIVISION
PHONE 503-431-7900 FAX 503-620-4732
STATE OF OREGON OFFICE OF THE STATE TREASURER
16290 SW UPPER BOONES FERRY ROAD TIGARD, OREGON 97224
OREGON INVESTMENT COUNCIL
APRIL 25, 2018 MEETING MINUTES
Members Present: Rukaiyah Adams, Tobias Read, John Russell, Rex Kim, Rick Miller and Steve
Rodeman Staff Present: John Skjervem, Darren Bond, Perrin Lim, David Randall, John Hershey,
Deena Bothello, Karl Cheng, Tony Breault, May Fanning, Jen Plett, Michael Viteri, Austin Carmichael, Dana Millican, Ben Mahon, Andy Coutu, Angela Schaffers, Eric Messer, Mark Selfridge, Michael Mueller, Tom Lofton, Jennifer Peet, Aliese Jacobsen, Paul Koch, Tim Baumert, Ryan Mann, Dmitri Palmateer, James Sinks, Kelly Cook, Kim Olson, and Amy Wojcicki
Consultants Present: Tom Martin and David Fann, (TorreyCove); Allan Emkin and Brandon Ross
(PCA); Janet Becker-Wold, Uvan Tseng and Jim Callahan (Callan) Legal Counsel Present: Steven Marlowe, Department of Justice The April 25th, 2018 OIC meeting was called to order at 8:58 am by Rukaiyah Adams, OIC Chair. Before the official agenda items were discussed, Treasurer Read led a conversation in which he and the other Council members acknowledged Steve Rodeman’s forthcoming retirement and thanked him for his many years of service at PERS and multiple contributions to the Council and its mission. I. 9: 00am Review and Approval of Minutes
Chair Adams recommended amending some wording in the OIC Policy Updates section to reflect approved changes to the following policies: 1. INV 605: Exercise of Voting Rights Accompanying Equity Securities; and 2. Alternative Assets Investments Committee Series (INV 501 & 701) MOTION: Treasurer Read moved approval of the proposed changes to the March 14th, 2018 OIC meeting minutes, and Mr. Russell seconded the motion which then passed by a 5/0 vote.
II. 09:00 am 2018 and 2019 OIC Meeting Schedules
Chair Adams presented the final 2018 and 2019 OIC meeting dates. Chief Investment Officer, John Skjervem mentioned that the 2019 dates had already been informally approved, but that consensus on a specific date for the August 2018 meeting remained outstanding. Chair Adams announced that despite her planned absence, the Council would convene on August 8th, 2018 and Vice Chair Russell would serve as Chair for that particular meeting. MOTION: Treasurer Read moved approval of the revised 2018 and final 2019 OIC meeting dates. Mr. Kim seconded the motion which then passed by a 5/0 vote.

OREGON INVESTMENT COUNCIL April 25, 2018
Meeting Minutes
2
III. 9:06 am Committee Reports and CIO Update Committee Reports: Mr. Skjervem gave an update on the following committee actions taken since the March 14, 2018 OIC meeting: Private Equity Committee
March 22, 2018 KSL Capital Partners V $200 million Alternatives Portfolio Committee None Opportunity Portfolio Committee
None Real Estate Committee
None Mr. Skjervem then delivered opening remarks which included a summary of proposed policy updates, a brief description of the Alternatives Portfolio and SAIF Annual reviews, and a preview of the planned Strategic Asset Allocation & CMA Update discussion.
IV. 9:15 am OIC Policy Updates
Mr. Skjervem and Jennifer Peet, Corporate Governance Director, recommended Council approval of proposed updates to the following policies: 1. INV 702 & 703: Alternative Investment and Opportunity Portfolio, Standards and Procedures; and 2. A new policy on continuing education for OIC members. Specifically, ORS 293.712 requires the
OIC Chair to consult with the Treasurer and prescribe continuing education requirements for OIC members. The goal of the policy proposed by staff is to provide OIC members with guidance on and opportunities for meeting that statutory requirement.
MOTION: Mr. Miller moved approval of staff’s recommended changes to INV 702 & 703, changes identical to those approved last month for the Private Equity and Real Estate committees, namely 1) increase the committee approval ceiling for new relationships from $150M to $250M, and 2) increase the committee approval ceiling for re‐ups from $250M to $350M. Treasurer Read seconded the motion which then passed by a 5/0 vote. MOTION: Treasurer Read moved approval of staff’s recommended policy for meeting OIC members’ continuing education requirements. Mr. Kim seconded which then passed by a 5/0 vote.
V. 10:17 am Strategic Asset Allocation & Capital Markets Assumptions – OPERF
Karl Cheng, Senior Investment Officer, Portfolio Risk & Research, Janet Becker-Wold, Callan Associates and Allan Emkin, Pension Consulting Alliance, provided updated Capital Market Assumptions, and revised estimates of OPERF’s long-term, forward-looking risk and return. Staff recommended the approval of minor changes to OIC Policies INV 215 (OPERF Asset Allocation and Rebalancing Policy) and INV 1203 (Statement of Investment Objectives and Policy Framework for OPERF).

OREGON INVESTMENT COUNCIL April 25, 2018
Meeting Minutes
3
MOTION: Treasurer Read moved approval of staff’s recommendation, and Mr. Kim seconded the motion which then passed by a 5/0 vote.
VI. 11:05 am Alternatives Portfolio Review – OPERF Ben Mahon, Senior Investment Officer, Alternatives along with Tom Martin, TorreyCove and Jim Callahan, Callan Associates, presented the Alternatives Portfolio 2017 Annual Review and 2018 Plan. This presentation included a discussion of the Alternatives Portfolio’s background/objectives, a 2017 review of portfolio performance and investment activity as well as an update on staff’s portfolio construction and 2018 investment plans.
VII. 11:38 am State Accident Insurance Fund – Annual Review Perrin Lim, Director of Capital Markets introduced the SAIF Annual Update and presenters Kerry Barnett, President & CEO and Gina Manley, Vice President, Finance & CFO of the State Accident Insurance Fund (SAIF). This presentation covered annual investment performance as well as provided an update on SAIF’s business activity and operating trends.
VIII. 11:39 am Asset Allocation & NAV Updates Mr. Skjervem reviewed asset allocations and NAVs across OST-managed accounts for the period ended March 31, 2018.
IX. 11:39 am Calendar — Future Agenda Items A calendar listing of future OIC meetings and scheduled agenda topics was included in the Council’s meeting material.
X. 11:40 am Open Discussion Chair Adams reminded the audience that funds for which the OIC has oversight responsibility include pension, endowment and liability-matching assets. She added that the strategic issues discussion planned for Friday, April 27 was timely given the Council’s broad scope of fiduciary oversight. Chair Adams asked if there were any additional forms of investment management for which the Council had responsibility. Mr. Skjervem responded by noting the Council’s purview over several separate accounts managed on behalf of other state agencies.
11: 44 am Public Comments 1. Diane Freaney of Rooted Investing shared her thoughts on several investment matters including a
suggestion to implement a more simplified approach of informing PERS members regarding the investment of their retirement funds.
Ms. Adams adjourned the meeting at 11:45 am. Respectfully submitted,
May Fanning Executive Support Specialist

JOHN D. SKJERVEM CHIEF INVESTMENT OFFICER INVESTMENT DIVISION
PHONE 503-431-7900 FAX 503-620-4732
STATE OF OREGON OFFICE OF THE STATE TREASURER
16290 SW UPPER BOONES FERRY ROAD TIGARD, OREGON 97224
OREGON INVESTMENT COUNCIL
APRIL 27, 2018 MEETING MINUTES
Members Present: Rukaiyah Adams, Tobias Read, John Russell, Rex Kim, and Rick Miller Staff Present: John Skjervem, Darren Bond, Perrin Lim, David Randall, John Hershey,
Deena Bothello, Karl Cheng, Ricardo Lopez, Garrett Cudahey, Tony Breault, May Fanning, Michael Langdon, Jen Plett, Michael Viteri, Austin Carmichael, Dana Millican, Ben Mahon, Andy Coutu, Angela Schaffers, Eric Messer, Amanda Kingsbury, Mark Selfridge, Michael Mueller, Tom Lofton, Jennifer Peet, Aliese Jacobsen, Paul Koch, Tim Baumert, Ryan Mann, Dmitri Palmateer, James Sinks, Ahman Dirks, William Hiles, and Kim Olson
Consultants Present: Allan Emkin (PCA); Janet Becker-Wold, Uvan Tseng and Jim Callahan
(Callan); David Fann, (TorreyCove) Legal Counsel Present: Steven Marlowe, Department of Justice The April 27th, 2018 Special OIC meeting was called to order at 1:00 pm by Rukaiyah Adams, OIC Chair. I. 1: 00 pm Introduction
Chair Adams encouraged staff, consultants and her Council peers to engage in an open, candid conversation on strategic issues unencumbered by the routine and transactional responsibilities associated with regular Council meetings.
II. 1:01 pm Asset Allocation Discussion
Jim Callahan, Callan Associates, and Allan Emkin, Pension Consulting Alliance (PCA), lead a discussion summarizing the various forms of institutional investment management with particular emphasis on the differences and attributes among these various forms.
III. 2:05 pm Statement of Investment & Management Beliefs Mr. Emkin provided the Council with an update on its Statement of Investment and Management Beliefs (the “Beliefs”). He described the Beliefs as foundational to the OIC/OST investment program, designed primarily to facilitate continuity at both the Council and staff levels. Given this foundational role, Mr. Emkin suggested that revisions to the Beliefs should occur sparingly, and the frequency at (or circumstances under) which revisions occur should be discussed deliberately and judiciously. 3: 21 pm Public Comments
None Ms. Adams adjourned the meeting at 3:21 pm. Respectfully submitted,
May Fanning Executive Support Specialist

TAB 2 – Committee Reports and CIO Remarks

Opening RemarksJohn D. Skjervem, Chief Investment Officer
June 6, 2018
June 6, 2018 OIC Meeting
Opening Remarks2
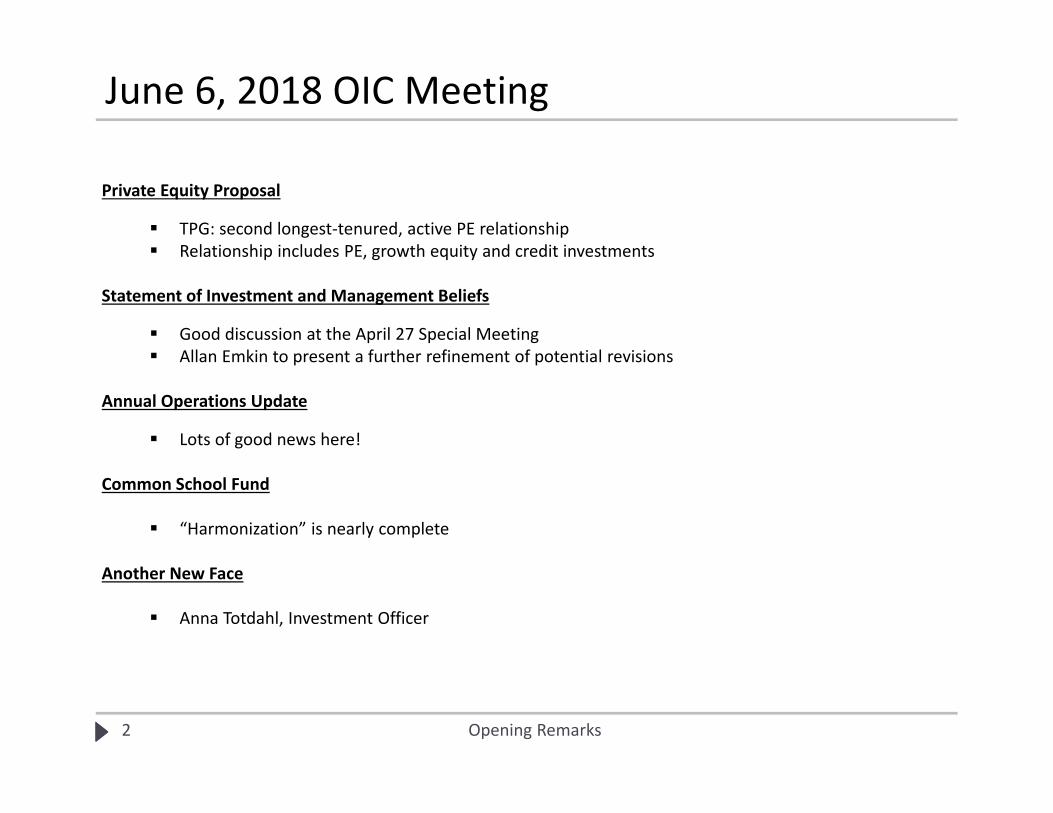
Private Equity Proposal
TPG: second longest‐tenured, active PE relationship Relationship includes PE, growth equity and credit investments
Statement of Investment and Management Beliefs
Good discussion at the April 27 Special Meeting Allan Emkin to present a further refinement of potential revisions
Annual Operations Update
Lots of good news here!
Common School Fund
“Harmonization” is nearly complete
Another New Face
Anna Totdahl, Investment Officer

TAB 3 – Private Equity Manager Recommendation
OPERF Private Equity Portfolio

TPG Partners VIII, L.P. & TPG Healthcare Partners, L.P.
Purpose
Subject to the satisfactory negotiation of all terms and conditions with Staff working in concert with legal counsel, Staff recommends approval of an, up to, $500 million capital commitment split pro rata between TPG Partners VIII, L.P. (“TPG VIII”, “Fund VIII”, or the “Fund”) and TPG Healthcare Partners, L.P. (the “Healthcare Fund”) as part of the OPERF private equity portfolio. Approval of the proposed commitment would represent the continuation of an existing relationship with TPG which dates back more than 20 years and represents approximately $4 billion in cumulative commitments across 15 previous investment vehicles.
Background
TPG (the “Firm” or the “GP”) was founded in 1993 by David Bonderman and James Coulter, who had worked together at the Bass Family Office, and Bill Price who joined from GE Capital. The Firm opened its first office in Mill Valley, California and invested its first fund – Air Partners – in 1993. TPG has since grown substantially across strategy, size, and geography to now oversee $83 billion of assets under management. Today, the GP’s platform consists of Private Equity, Private Credit, Real Estate and Public Equities, and the Firm is led by co‐CEOs Jim Coulter and Jon Winkleried, with David Bonderman continuing to provide strategic direction for the Firm.
The Firm employs a team of over 1,000 employees and advisors, of which 500 are investment and operating professionals in San Francisco (headquarters), Fort Worth, New York, London, Hong Kong, Austin, Boston, Beijing, Dallas, Houston, Luxembourg, Melbourne, Moscow, Mumbai, Seoul and Singapore. The Firm’s current fundraising targets for TPG VIII and the Healthcare Fund are $12 billion and $2.5 billion, respectively, and daily investment efforts supporting both funds will be led by co‐Managing Partners Todd Sisitsky and Jack Weingart.
Strategy
TPG will continue to implement the same strategy in TPG VIII as was used for TPG VII, namely a bias toward upper middle‐market companies in which the Firm believes more value can be unlocked relative to larger companies. TPG looks to uncover value through varying forms of operational intervention by leveraging the strengths and experience of its captive, in‐house bench of operating professionals. Moreover, the GP’s strategic approach will continue to comprise meaningful investments primarily in North American‐based operating companies via acquisitions and financings in Traditional Buyout, Transformational and Off‐the‐Beaten‐Path transaction strategies. Capital deployment in each of these strategies will use a sector‐focused and thematically‐driven approach across six target areas: Healthcare; Technology; Internet Digital Media and Communications (“IDMC”); Consumer; Industrials; and Energy. The Firm will invest TPG Healthcare Partners alongside Fund VIII on healthcare‐related investments where the GP’s track record and deal flow is both robust and differentiated.
Issues to Consider
Attributes:
Re‐Focused Strategy – Historically, TPG’s primary strategic focus was investing in portfolio companies with operating and/or transactional complexity, followed closely by uncovering opportunities utilizing the Firm’s deep sector expertise. This framework has, over the last several years, been modified, and TPG’s sector teams now lead the Firm’s investment activities by developing and pursuing thematic ideas within their respective target areas. The Firm has also changed the way it integrates its operating professionals who are now engaged and embedded within the sector teams as opposed to previously working as a separate, standalone unit. The Firm believes this integration has improved its overall effectiveness in its traditional focus on complex, operationally‐intensive transactions.
Close Existing Relationship – OST and the OIC have partnered with TPG since 1993, and Staff sits on the advisory boards for all TPG funds in which OPERF is invested. Because of this long‐tenured relationship, Staff has had the opportunity to form a more granular understanding of TPG’s inner workings and evolution. This

2
understanding informs Staff’s current view that it puts the Firm on a positive trajectory, and allows for more active monitoring of TPG’s execution against its strategic plans.
Performance – TPG has generated strong overall performance post‐GFC (“Global Financial Crisis”) after deploying a re‐focused strategy that targeted smaller, more idiosyncratic transactions sourced and led by the Firm’s sector teams and predicated on thematic ideas. From 2009 onward, investment performance has improved and the GP’s loss ratio has plummeted relative to the preceding four years. Furthermore, the TPG healthcare team has generated, since inception, especially strong returns. Due to this success, specific sector expertise, and the rich opportunity set TPG observes in the healthcare market, the Firm is now offering (with TPG Healthcare Partners Fund) a conduit through which investors can gain additional healthcare exposure, an opportunity Staff finds both attractive and timely.
Concerns:
Turnover – Turnover at TPG since 2014 has been high with 14 investment team departures at the Principal level and above, including nine Partners. [Mitigant: While elevated, this turnover level is not wholly unexpected at a large platform like TPG and within the context of the Firm’s above‐described strategic repositioning. Staff believes that TPG management has been adept and thoughtful in restructuring the Firm’s sector teams and respective coverage areas, and early results appear to affirm that such efforts have been positive. The current sector teams, while somewhat less experienced, are led by a younger and more empowered generation of investment professionals, and Staff is comfortable with their collective investment acumen and sector‐level expertise. Staff also well appreciates the attendant continuity and succession‐planning benefits this restructuring provides.]
Performance of TPG Partners V and TPG Partners VI – The returns for TPG Partners V (2006 vintage) and TPG Partners VI (2008 vintage) continue to trail the benchmark. [Mitigant: From 2005‐2008 (TPG V and the first half of TPG VII), the GP focused heavily on take‐private transactions involving very large and mature businesses. In that period, TPG saw what was believed to be a cost of capital arbitrage between public and private markets, and the GP hoped that a combination of leverage and operating expertise would lead to compelling results. The Firm deployed considerable capital over a short period of time, and, with the benefit of hindsight, we now know that was an imperfect strategy. As noted already, TPG has re‐focused its strategy since the GFC to instead emphasize sector‐led, thematic investments in primarily upper middle‐market companies. The GP is now looking to invest behind sector trends that are more secular in nature and in specific situations where the Firm’s operating capabilities can be engaged to generate sustainable excess earnings growth. As noted above, the Firm’s post‐GFC results are promising.]
Potential Conflicts – TPG has a large platform with a number of additional business lines (e.g., growth equity, credit, real estate, public equities, etc.) which have the potential to introduce possible conflicts of interest as it relates to any one or more of the following: the allocation of investment professionals’ time to specific products or vehicles; the allocation of investment opportunities to specific products or vehicles; and/or, the continued expansion of additional products or vehicles. [Mitigant: This concern is not unique among large, multi‐product alternative investment firms. In Staff’s view, TPG has been open and transparent with respect to potential conflicts as the demands of LPs like Oregon have increased with time. OST’s long‐term
partnership and regular dialogue with the GP helps manage this concern on a go‐forward basis].
Terms
Legal negotiations are not final, but Staff views the proposed terms as in‐line with the market. Further information on the proposed terms can be found in the TorreyCove materials. Please note that Staff has not had contact with a placement agent regarding this opportunity.
Conclusion
Staff recommends a capital commitment of up to $500 million split pro rata between TPG Partners VIII, L.P. and TPG Healthcare Partners, L.P., which represents, in Staff’s opinion, an attractive and timely core investment opportunity for the buyout segment of the OPERF Private Equity portfolio.

MEMORANDUM
TO: Oregon Public Employees Retirement Fund (“OPERF”)
FROM: TorreyCove Capital Partners (“TorreyCove”)
DATE: May 29, 2018
RE: TPG Partners VIII (the “Fund”)
Strategy:
The Firm targets equity and equity-related investments in mid-market and large-cap businesses. TPG seeks a balanced portfolio, diversified across transaction types, geographies, and sectors. TPG will typically participate in control-oriented opportunities and will leverage a team of in-house operations professionals to help drive earnings growth, cash flow generation, and multiple expansion.
In parallel to the Fund, the Firm is fundraising TPG Healthcare Partners, L.P. (the “Healthcare Side Car”). During the Commitment Period, the Fund and the Healthcare Side Car will generally invest the same dollar amount, both receiving a 50% allocation to each healthcare investment.
Please see attached investment memorandum for further detail on the investment opportunity.
Allocation:
A new commitment to the Fund would be allocated 100% to the Large Corporate Finance investment sub-sector and will further be categorized as a Domestic investment. As of December 31, 2017, OPERF’s allocation to Corporate Finance is listed in the table below. It is important to note that since allocation is based on fair market value, a commitment to the Fund would not have an immediate impact on OPERF’s current portfolio allocation. Commitments to the Fund are complementary to OPERF’s existing fund commitments and provide the overall portfolio with a further degree of diversification.
December 31, 2017 Target FMV FMV + Unfunded Corporate Finance 60-85% 76.1% 76.9%
Conclusion:
The Fund offers OPERF an opportunity to participate in a differentiated portfolio of private equity investments with relatively attractive overall terms. TorreyCove’s review of the General Partner and the proposed Fund indicates that the potential returns available justify the risks associated with an investment in the Fund. TorreyCove recommends that OPERF consider a commitment of $500 million to the Fund.
TorreyCove’s recommendation is contingent upon the following:
(1) Satisfactory negotiation or clarification of certain terms of the investment;
(2) Satisfactory completion of legal documents;
(3) Satisfactory continuation and finalization of due diligence;

(4) No material changes to the investment opportunity as presented; and
(5) Confidentiality maintained regarding the commitment of OPERF to the Partnership until such time as all the preceding conditions are met.

TAB 4 – Statement of Investment and Management Beliefs

M E M O R A N D U M Date: May 25, 2018 To: Oregon Investment Council (“OIC” or “the Council”) From: Pension Consulting Alliance, LLC (“PCA”) CC: John D. Skjervem, Chief Investment Officer, Oregon State Treasury (“OST”) Allan Emkin, Managing Director, PCA
Neil Rue, CFA, Managing Director, PCA RE: Draft Revision of OIC Investment and Management Beliefs Introduction In December 2017, PCA was retained to work with the OIC and senior OST investment staff to review and possibly revise the OIC’s Statement of Investment and Management Beliefs (the “Beliefs”). Over the first quarter of 2018, PCA engaged OIC members and senior OST investment staff in a survey examining the Council’s existing Beliefs statements. Survey questions solicited participants’ updated views and commentary on the Beliefs as well as their proposed revisions thereto. Fourteen participants provided thoughtful and informative survey responses which revealed two primary conclusions: 1) most Beliefs continue to reflect broad agreement and consensus; and 2) Beliefs statements 1 & 4 generated significant discussion and revision suggestions. Based on these results and additional input from survey participants, PCA outlined and presented potential Beliefs revisions at the Council’s special meeting on April 27, 2018. PCA then compiled and consolidated feedback from the Council’s special meeting discussion, which is included in the attached draft document. For comparative purposes (i.e., relative to previous drafts), the most recent deletion edits are highlighted below in red text while the most recent addition edits are highlighted below in green text.

2
OREGON INVESTMENT COUNCIL Statement of Investment and Management Beliefs
1.) THE OIC SETS POLICY AND IS ULTIMATELY RESPONSIBLE FOR THE INVESTMENT PROGRAM
A. Investment management is dichotomous -- part art and part science.
Elements represented as art in the institutional investment management community are overstated or inflated in terms of necessity and efficacy.1
To better calibrate both governance and daily operating activities with a more the appropriate balance between art and science, the Beliefs should will be anchored where and whenever possible to industry best practices as illuminated by academic research and experiential rigor.
B. The OIC is a policy-setting council that largely delegates investment management activities to the OST and qualified external fiduciaries.
The OIC sets strategic policy and tasks both OST staff and external managers with policy implementation
The OIC sets strategic policy which includes, but is not limited to, Asset Allocation, Portfolio Construction, Risk Measurement and Performance Monitoring. The OIC’s purview also includes establishing and defining its philosophy as manifest in this Statement of Investment and Management Beliefs.2
The OIC tasks OST staff, external managers, consultants and other service providers with policy implementation.
C. The OIC is vested with the authority to set and monitor portfolio risk. Both short-term and long-term risks are critical.
The OIC must weigh the short-term risk of principal loss against the long-term risk of failing to meet return expectations.
D. To exploit market inefficiencies, the OIC should be long term, contrarian, innovative, and opportunistic in its investment approach.
The OIC should generally prepare for and accept periods of extreme price/valuation volatility and/or related market dislocations and endeavor to act expeditiously during such periods if and when deemed advantageous.
E. Internal incentive structures should be carefully evaluated to ensure proper alignment with specific investment objectives.3
Evaluation criteria should be based (in large part) on decisions over which staff members have clear authority and control.
Total portfolio results (in addition to individual asset class returns) should be considered, and the evaluation period should be consistent with an appropriate investment horizon or market cycle.
F. The OIC should advocate for the resources required to successfully compete in global capital markets.3
1 Council members indicated that this qualifying statement was unnecessary. 2 The Council indicated that there should be more definition in what is within the scope of “policy-setting”. Additionally, statement 1.B. was broken into two bullet points to highlight and contrast the Council’s role relative to the responsibilities of OST staff and external managers, consultants and other service providers. 3 There was significant discussion on statements 1.E. & 1.F. as Council members expressed discomfort with being tasked with advocating for OST resources while not having any authority over how those resources are utilized. The discussion exposed the fact that this issue is not a “Beliefs” statement but rather a separate, statutory reality.

3
Staffing levels and operating budgets should be determined by capability requirements using benchmark assessments comprised of other well-respected organizations of similar size and portfolio complexity.
The benefits of OIC member and OST staff continuity should also be recognize 2.) ASSET ALLOCATION DRIVES RISK AND RETURN
A. Asset allocation is the OIC’s primary policy tool for managing the investment program’s long-term risk/return profile.
Decisions regarding strategic asset allocation will have the largest impact on the investment program’s realized return and risk and hence should will be made judiciously and receive special emphasis and attention.
The timing and magnitude of projected employer contributions and future benefit payments have significant cash flow implications and thus should will receive explicit consideration during the OIC’s asset allocation decision-making process.
B. Portfolio construction, including diversification and correlation considerations, is essential to maximizing risk-adjusted returns.
Empirical rigor, coupled with sound judgment, is required in the portfolio construction process to effect true diversification, while discipline is required to maintain diversification through and across successive market cycles.
Risk is multi-faceted and may include, but is not limited to, the following types of specific risks: principal loss; opportunity cost; concentration risk; leverage and illiquidity risk; volatility and valuation risk; interest rate and inflation risk; and environmental, social and governance (ESG) risks.4
3.) THE EQUITY RISK PREMIUM WILL BE REWARDED
A. Over the long-term, equity-oriented investments provide reliable return premiums relative to risk-free investments.
Although returns for risk taking are not always monotonic or consistently rewarded over time, bearing equity risk does commands a positive expected return premium provided such risk is reasonably priced.
4.) PRIVATE MARKET INVESTMENTS CAN ADD SIGNIFICANT VALUE AND REPRESENT A CORE
OIC/OST COMPETENCY A. The OIC can capitalize on its status as a true, long-term investor by making meaningful allocations
to illiquid, private market investments.
Inefficiencies exist in private markets that provide skilled managers with excess return opportunities relative to public market analogues.
Private markets may also offer an “illiquidity premium” that can be exploited by patient, long-term investors.
Private markets provide a diversifying risk/return profile relative to public market analogues.
Private markets offer excess return opportunities that may be exploited by patient, long-term investors.5
4 Concepts of risk and associated measurement techniques are evolving. Heretofore underdeveloped, the identification and measurement of ESG risks is improving which will enable new risk management applications in both security selection and portfolio construction processes. Unlike all the others in this draft, this particular footnote is intended to persist in and become part of the final document. 5 Council and staff indicated a preference for a) de-emphasizing the notion of an “illiquidity premium” and b) including a reference to private markets’ diversifying characteristics.

4
B. Dispersion in private market investment returns is wide; accordingly, top-quartile manager selection, diversification across vintage year, strategy type, and geography, and careful attention to costs are paramount.
Private market investment success is predicated on identifying skilled managers and developing long-term investment relationships with those managers that enable the application of skill to manifest in the form of excess returns.
Proper investment pacing, including deliberate vintage year diversification is also an integral element of superior private market investment results.
5.) CAPITAL MARKETS HAVE INEFFICIENCIES THAT CAN BE EXPLOITED A. Inefficiencies that can be exploited by active management may exist in certain segments of the
capital markets.
While largely efficient, select segments of the capital markets can sometimes be successfully exploited by skilled active management.
The nature (i.e., perceived magnitude and likely duration) of such inefficiencies should inform the proposed active management strategy (e.g., discretionary or systematic).
B. Passive investment management in public markets will outperform the median active manager in those markets over time.
Active management should therefore be a deliberate choice and applied only to those public market strategies/managers in which the OIC enjoys a high degree of confidence that such strategies/managers will be sufficiently rewarded on a risk-adjusted basis and net of all fees, factor exposures and related transactions costs.
6.) COSTS DIRECTLY IMPACT INVESTMENT RETURNS AND SHOULD BE MONITORED AND
MANAGED CAREFULLY A. All fees, expenses, commissions, and transaction costs should be diligently monitored and managed
in order to maximize net investment returns.
While all costs should be monitored and controlled, these costs should also be evaluated relative to both expected and realized net returns.
B. External incentive structures should be carefully evaluated to ensure proper alignment with investment program objectives.
Fee and incentive structures drive both individual and organizational behavior.
These structures (particularly in private market strategies) should be carefully evaluated and monitored to ensure that the goals and incentives of individual investment professionals and their respective organizations are well aligned with the specific investment objectives established by the OIC and/or OST staff.
7.) FAIR AND EFFICIENT CAPITAL MARKETS ARE ESSENTIAL FOR THE LONG-TERM SUCCESS
OF OIC/OST INVESTMENT ACTIVITIES A. The OIC recognizes that the quality of regulation and corporate governance can affect the long-
term value of its investments.
The Council promotes competitive and transparent market structures to ensure accurate and timely price discovery/asset valuation.
B. The OIC also recognizes that voting rights have economic value and therefore must be treated as a fund or beneficiary asset. The OIC OST shall vote shares in its capacity as fiduciary and based solely on the economic merits
of specific proxy proposals.

5
DISCLOSURES: This document is provided for informational purposes only. It does not constitute an offer of securities of any of the issuers that may be described herein. Information contained herein may have been provided by third parties, including investment firms providing information on returns and assets under management, and may not have been independently verified. The past performance information contained in this report is not necessarily indicative of future results and there is no assurance that the investment in question will achieve comparable results or that the Firm will be able to implement its investment strategy or achieve its investment objectives. The actual realized value of currently unrealized investments (if any) will depend on a variety of factors, including future operating results, the value of the assets and market conditions at the time of disposition, any related transaction costs and the timing and manner of sale, all of which may differ from the assumptions and circumstances on which any current unrealized valuations are based. Neither PCA nor PCA’s officers, employees or agents, make any representation or warranty, express or implied, in relation to the accuracy or completeness of the information contained in this document or any oral information provided in connection herewith, or any data subsequently generated herefrom, and accept no responsibility, obligation or liability (whether direct or indirect, in contract, tort or otherwise) in relation to any of such information. PCA and PCA’s officers, employees and agents expressly disclaim any and all liability that may be based on this document and any errors therein or omissions therefrom. Neither PCA nor any of PCA’s officers, employees or agents, make any representation of warranty, express or implied, that any transaction has been or may be effected on the terms or in the manner stated in this document, or as to the achievement or reasonableness of future projections, management targets, estimates, prospects or returns, if any. Any views or terms contained herein are preliminary only, and are based on financial, economic, market and other conditions prevailing as of the date of this document and are therefore subject to change. The information contained in this report may include forward-looking statements. Forward-looking statements include a number of risks, uncertainties and other factors beyond the control of the Firm, which may result in material differences in actual results, performance or other expectations. The opinions, estimates and analyses reflect PCA’s current judgment, which may change in the future. Any tables, graphs or charts relating to past performance included in this report are intended only to illustrate investment performance for the historical periods shown. Such tables, graphs and charts are not intended to predict future performance and should not be used as the basis for an investment decision.

TAB 5 – Q1 2018 Performance & Risk Report
OPERF

OPERF Risk Dashboard2018 Q1
June 6, 2018

Allocation & Risk Contribution by Asset Class
2
0
10
20
30
40
50
60
70
80
Mar 30, 2018
Allocation in $B
Equity Fixed Income
Alternatives Portfolio Opportunity Portfolio
Private Equity Real Estate
Cash Overlay
0%
1%
2%
3%
4%
5%
6%
7%
8%
9%
Mar 30, 2018
Risk Contribution
Equity Fixed Income
Alternatives Portfolio Opportunity Portfolio
Private Equity Real Estate
Cash Overlay
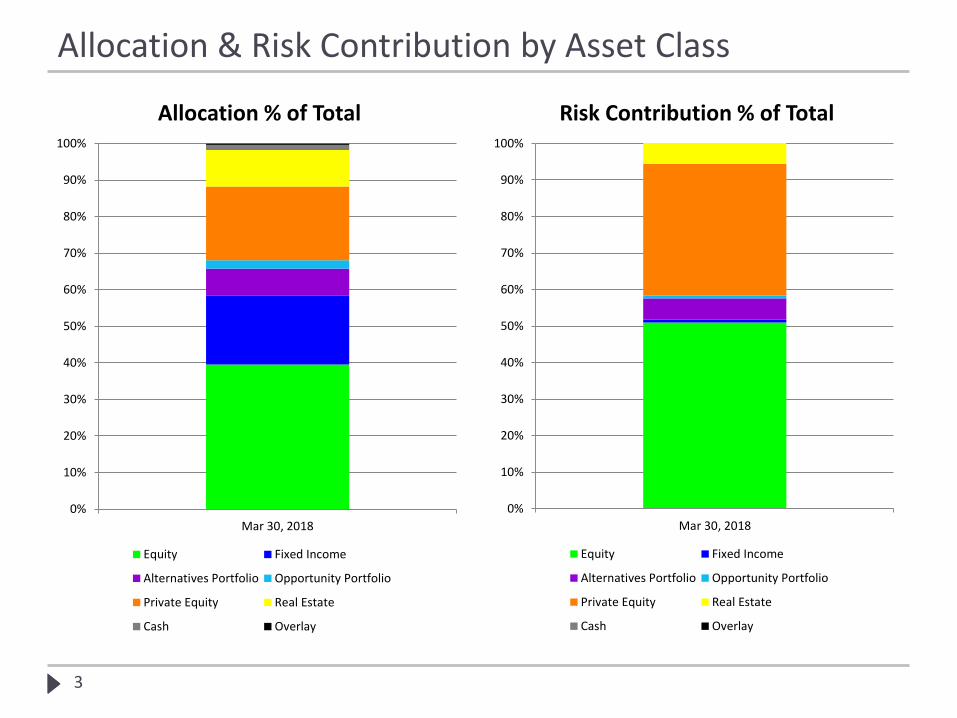
Allocation & Risk Contribution by Asset Class
3
0%
10%
20%
30%
40%
50%
60%
70%
80%
90%
100%
Mar 30, 2018
Allocation % of Total
Equity Fixed Income
Alternatives Portfolio Opportunity Portfolio
Private Equity Real Estate
Cash Overlay
0%
10%
20%
30%
40%
50%
60%
70%
80%
90%
100%
Mar 30, 2018
Risk Contribution % of Total
Equity Fixed Income
Alternatives Portfolio Opportunity Portfolio
Private Equity Real Estate
Cash Overlay

Stand-alone Risk by Asset Class
4
393
50
58 11
282
8613
136
757
0
100
200
300
400
500
600
700
800
900
1,000
Equity Fixed Income AlternativesPortfolio
OpportunityPortfolio
Private Equity Real Estate Other Diversification Total
Stan
dal
on
e R
isk
(Sca
led
by
We
igh
t)

Correlation Matrix by Asset Class
1Ex-Ante, holdings-based correlations between asset classes as estimated by Aladdin
5
Capital Market Assumptions from Callan
Expected Return
Expected Risk
Predicted Risk1 Mar 30, 2018 Equity Fixed Income
Alternatives Portfolio
Opportunity Portfolio
Private Equity Real Estate OPERF
7.1% 19.5% 10.0% Equity 1.00 0.03 0.69 0.59 0.94 0.45 0.98
3.0% 3.8% 2.5% Fixed Income 1.00 0.09 -0.06 -0.04 0.43 0.13
6.8% 10.6% 6.1% Alternatives Portfolio 1.00 0.47 0.69 0.43 0.75
4.8% Opportunity Portfolio 1.00 0.59 0.13 0.58
9.5% 26.3% 14.4% Private Equity 1.00 0.41 0.96
6.6% 15.0% 9.3% Real Estate 1.00 0.57
7.1% 14.1% 7.6% OPERF 1.00

OPERF’s Beta to MSCI ACWI IMI
6
0.81
0.72
-0.10
0.00
0.10
0.20
0.30
0.40
0.50
0.60
0.70
0.80
0.90
3/31/2017 3/31/2018
Co
ntr
ibu
tio
n t
o B
eta
(MSC
I AC
WI I
MI)
Total Alternatives Fixed Income Private Equity Public Equity Real Estate

OPERF Allocations
7
38%
22%
7%
2%
20%
10%
0%
5%
10%
15%
20%
25%
30%
35%
40%
45%
50%
Equity Fixed Income Alternatives Portfolio Opportunity Portfolio Private Equity Real Estate
Pe
rce
nt
We
igh
t o
f O
PER
F
Net Exposure Target

Liquidity Report
Table periods approximate the time required to liquidate different OPERF allocations.
8
Liquidity ($M)
Asset Class 1 Week 1 Month 1 Quarter ∞Uncalled
CommitmentNext 12 Months
Cash & Overlay 997
Public Equity 25,957 2,171 1,418
Fixed Income 11,627 2,443
Private Equity 15,166 -10,693
Real Estate 538 6,959 -2,575
Alternatives 196 634 4,633 -3,215
Opportunity 1,713 -710
Proj PERS Cash Flow -3,600
Total 39,317 5,248 1,418 28,472 -17,192 -3,600
Public Equity - 1 Month = AQR 130/30, Arrowstreet 130/30, & Callan US Micro Cap Value portfolios
Public Equity - 1 Quarter = Lazard Closed-End Fund portfolio
Fixed Income - 1 Month = Below Investment Grade
Real Estate - 1 Week = REIT composite
Alternatives - 1 Week = SailingStoneAlternatives – 1 Month = AQR, JP Morgan

Top 10 Exposures by Investment Firm
9
Rank Asset ManagerMkt Val ($mm)
Mkt Val Weight
Asset Class
1 Internally-Managed 13,269 17.8% Cash, Fixed Income, Public Equity
2 Dimensional Fund Advisors 5,031 6.7% Public Equity
3 AQR 3,597 4.8% Alternatives, Public Equity
4 Arrowstreet Capital 3,286 4.4% Public Equity
5 KKR 3,175 4.3% Fixed Income, Private Equity
6 Lazard 2,453 3.3% Public Equity
7 AllianceBernstein 2,453 3.3% Fixed Income, Public Equity
8 Wellington 2,105 2.8% Fixed Income, Public Equity
9 BlackRock 1,911 2.6% Alternatives, Fixed Income
10 Acadian 1,829 2.5% Public Equity
Oregon Investment Council
First Quarter 2018Performance Review
June 6, 2018
2Knowledge. Experience. Integrity. Oregon Investment Council
Economic CommentaryFirst Quarter 2018
Source: Bureau of Economic Analysis Source: Bureau of Labor Statistics
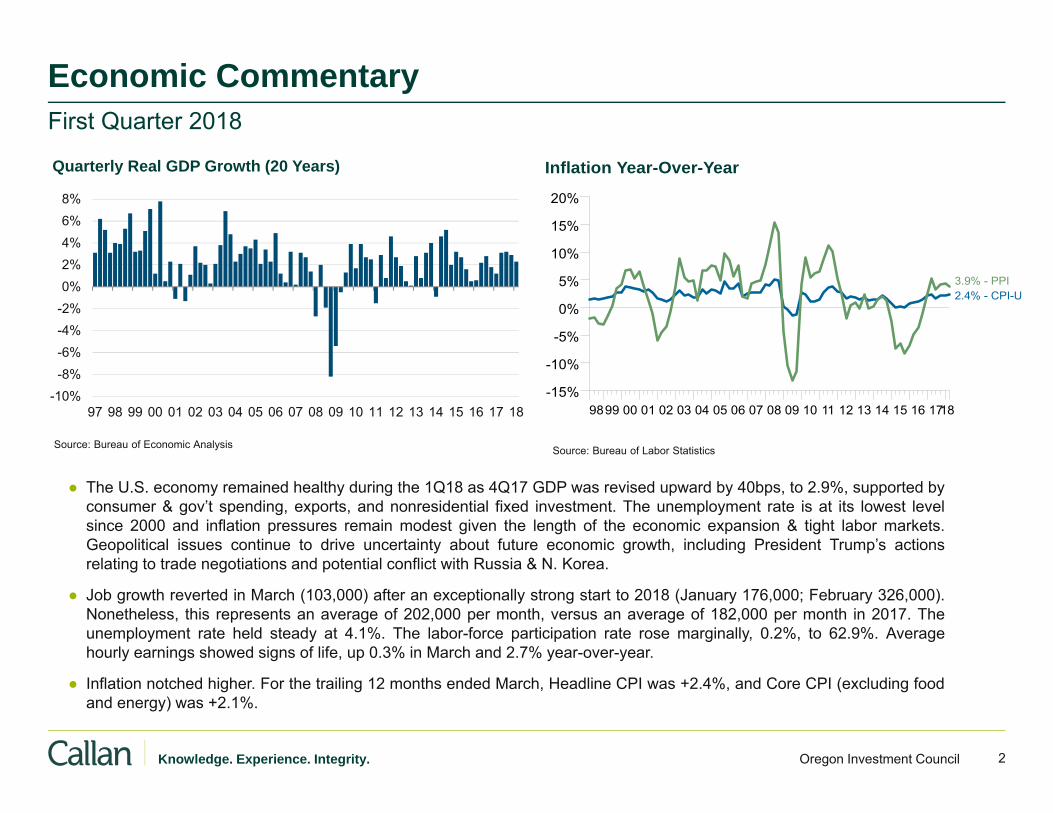
● The U.S. economy remained healthy during the 1Q18 as 4Q17 GDP was revised upward by 40bps, to 2.9%, supported byconsumer & gov’t spending, exports, and nonresidential fixed investment. The unemployment rate is at its lowest levelsince 2000 and inflation pressures remain modest given the length of the economic expansion & tight labor markets.Geopolitical issues continue to drive uncertainty about future economic growth, including President Trump’s actionsrelating to trade negotiations and potential conflict with Russia & N. Korea.
● Job growth reverted in March (103,000) after an exceptionally strong start to 2018 (January 176,000; February 326,000).Nonetheless, this represents an average of 202,000 per month, versus an average of 182,000 per month in 2017. Theunemployment rate held steady at 4.1%. The labor-force participation rate rose marginally, 0.2%, to 62.9%. Averagehourly earnings showed signs of life, up 0.3% in March and 2.7% year-over-year.
● Inflation notched higher. For the trailing 12 months ended March, Headline CPI was +2.4%, and Core CPI (excluding foodand energy) was +2.1%.
-10%-8%-6%-4%-2%0%2%4%6%8%
97 98 99 00 01 02 03 04 05 06 07 08 09 10 11 12 13 14 15 16 17 18
Quarterly Real GDP Growth (20 Years)
9899 00 01 02 03 04 05 06 07 08 09 10 11 12 13 14 15 16 1718-15%
-10%
-5%
0%
5%
10%
15%
20%
Inflation Year-Over-Year
2.4% - CPI-U3.9% - PPI

3Knowledge. Experience. Integrity. Oregon Investment Council
Performance By Asset Class
Russell 3000
(0.6%)
Russell 3000
13.8%
Russell 3000
10.2%
Russell 3000
13.0%
Russell 3000
9.6%
S&P 500
(0.8%)
S&P 500
14.0%
S&P 500
10.8%
S&P 500
13.3%
S&P 500
9.5%Russell 2000
(0.1%)Russell 2000
11.8%
Russell 2000
8.4%
Russell 2000
11.5%
Russell 2000
9.8%
MSCI ACWI ex-US
(1.2%)
MSCI ACWI ex-US
16.5%
MSCI ACWI ex-US
6.2%
MSCI ACWI ex-US
5.9%
MSCI ACWI ex-US
2.7%
MSCI Emerging Markets
1.5%
MSCI Emerging Markets
25.4%
MSCI Emerging Markets
9.2%
MSCI Emerging Markets
5.4%MSCI Emerging Markets
3.4%
Bloomberg Aggregate
(1.5%)
Bloomberg Aggregate
1.2%
Bloomberg Aggregate
1.2%
Bloomberg Aggregate
1.8%
Bloomberg Aggregate
3.6%Merrill Lynch High Yield
(0.9%)
Merrill Lynch High Yield
3.7%
Merrill Lynch High Yield
5.2%
Merrill Lynch High Yield
5.0%
Merrill Lynch High Yield
8.0%
NCREIF ODCE
2.2%
NCREIF ODCE
8.1%
NCREIF ODCE
10.0%NCREIF ODCE
11.4%NCREIF ODCE
5.1%
90 Day T-Bill
0.4%
90 Day T-Bill
1.1%
90 Day T-Bill
0.5%
90 Day T-Bill
0.3%
90 Day T-Bill
0.3%
Last Quarter Last Year Last 3 Years Last 5 Years Last 10 Years

4Oregon Investment CouncilKnowledge. Experience. Integrity.
OPERF Total Regular AccountPerformance Summary for the First Quarter 2018
Total Fund:
In the first quarter of 2018, the Total Regular Account added 0.77% (+0.62% net of fees), underperforming the 1.22% return of the Policy Benchmark, andranked at the 13th percentile of Callan’s $10B+ public fund peer group. For the 12 months ended March 31, 2018, the Total Regular Account increased 12.34%(+11.82% net of fees) versus 12.29% for the Policy Target, and ranked in the 20th percentile of Callan’s $10B+ public fund peer group. Longer term results trailthe Policy Target but rank in the top third of the peer group.
Asset Classes:
Total Fixed Income: The Fixed Income Portfolio decreased 0.80% (-0.86% net of fees) for the quarter versus a decline of 0.96% for the Custom FixedIncome Benchmark, and ranked in the 16th percentile of Callan’s Public Funds $10+B US Fixed income (Gross) peer group. For the trailing year, thePortfolio returned 1.75% (+1.57% net of fees), beating the benchmark return of 1.43%, and ranked in the 67th percentile of the peer group. 10 year resultsremain comfortably ahead of the benchmark and rank in the top quartile of the peer group.
Total Public Equity: Total Public Equity decreased 0.39% (-0.53% net of fees) for the quarter versus a decline of 0.89% for the MSCI ACWI IMI Netbenchmark, and ranked in the 46th percentile of its peer group. For the trailing year, the portfolio grew 16.69% (+16.33% net of fees), easily beating the15.03% return of the benchmark and ranked near the median of the peer group.
● U.S. Equity: The U.S. Equity Portfolio decreased 1.02% (-1.07% net of fees) for the quarter, trailing the 0.64% decline in the Russell 3000 Index, andranked in the 85th percentile of Callan’s Public Fund: $10B+ Domestic Equity (gross) peer group. On a trailing 12 month basis, the Portfolio grew13.89% (+13.75% net of fees) versus a gain of 13.81% for the benchmark and ranked in the 64th percentile of the peer group. 10 year results areslightly behind those of the benchmark (+9.46% net of fees versus +9.62%) and rank slightly below median.
● International Equity: The International Equity Portfolio rose 0.33% (+0.10% net of fees) for the quarter, beating the 1.06% loss in the MSCI ACWIex-U.S. IMI Index, and ranked in the top decile of Callan’s Public Fund: $10B+ International Equity (gross) peer group. For the trailing year, thePortfolio soared 20.92% (+20.29% net of fees) versus 17.10% for the benchmark, and ranked 9th in the peer group. 10 year results remain wellahead of the benchmark (+4.68% net of fees versus 3.12%) and continue to rank in the top quartile of the peer group.
Total Real Estate: The Real Estate Portfolio continues to show competitive absolute results over the last decade with an annualized return of 5.32% net offees.
Opportunity Portfolio: The Opportunity Portfolio’s results over the last ten years continue to be favorable with an annualized return of 7.76% net of fees.
Alternative Portfolio: The Alternative Portfolio has gained an annualized return of 3.91% net of fees over the last five years.
Total Private Equity: The Private Equity Portfolio’s returns remain strong with an annualized return of 9.11% net of fees over the last ten years.

5Oregon Investment CouncilKnowledge. Experience. Integrity.
OPERF Total Regular AccountAsset Allocation as of March 31, 2018
*As of April 1, 2018, the Interim Policy Target was changed to 19% Russell 3000+300 Bps quarter lag, 22% Oregon Custom FI Benchmark, 12.5% Oregon Custom Real Estate Benchmark, 39% MSCI ACWI IMI Net and 7.5% CPI+4%.
Actual Allocation Interim Policy Target Strategic Policy Target
Domestic Equity, 20.0%
International Equity, 20.0%
Fixed Income, 22.5%
Real Estate, 12.5%
Private Equity, 20.0%
Alternatives, 5.0%
Domestic Equity, 18.8%
International Equity, 18.8%
Fixed Income, 20.0%
Real Estate, 12.5%
Private Equity, 17.5%
Alternatives, 12.5%
Domestic Equity, 20.1%
International Equity, 17.9%
Fixed Income, 22.9%
Real Estate, 9.8%
Private Equity, 19.8%
Opportunity, 2.2%
Alternatives, 7.1%
Cash, 0.1%
$000s Weight Percent $000sAsset Class Actual Actual Target Dif f erence Dif f erenceTotal Fixed Income 17,574,440 22.9% 22.5% 0.4% 342,317U.S Equity Portf olio 15,360,691 20.1% 20.0% 0.1% 43,248Non-U.S. Equity Portf olio 13,733,812 17.9% 20.0% (2.1%) (1,583,631)Total Real Estate 7,488,797 9.8% 12.5% (2.7%) (2,084,605)Opportunity Portf olio 1,713,152 2.2% 0.0% 2.2% 1,713,152Alternativ e Portf olio 5,463,211 7.1% 5.0% 2.1% 1,633,851Total Priv ate Equity 15,166,287 19.8% 20.0% (0.2%) (151,156)Cash 86,825 0.1% 0.0% 0.1% 86,825Total 76,587,215 100.0% 100.0%
*
**
**Totals provided by OST Staff and is inclusive of IAP assets

6Oregon Investment CouncilKnowledge. Experience. Integrity.
OPERF Total Regular AccountNet Cumulative Performance by Asset Class as of March 31, 2018
September 30, 2017
*Policy Benchmark = 22.5% OPERF Total Custom FI Benchmark, 20.0% Russell 3000 Index, 20.0% MSCI ACWI ex US IMI, 20.0% Russell 3000 + 300 bps Qtr Lag, 12.5% Oregon Custom Real Estate Benchmark and 5.0% CPI + 400 bps.**Non-US Equity Benchmark performance through May 31, 2008, is MSCI ACWI ex US Gross and is linked thereafter with the MSCI ACWI ex-US IMI Net Index.
Returns for Periods ended March 31, 2018
QuarterLast
Last Year YearsLast 3
YearsLast 5
YearsLast 7
YearsLast 10
Total Regular Account 0.62 11.82 7.42 8.54 8.37 6.59Total Regular Account ex-Overlay 0.68 11.98 7.32 8.48 8.26 6.59OPERF Policy Benchmark* 1.22 12.29 7.95 9.37 8.91 7.04
Total Fixed Income -0.86 1.57 1.62 2.03 3.58 5.09OPERF Total Custom FI Benchmark -0.96 1.43 1.22 1.55 3.05 3.77Callan Public Fund $10bn+ U.S. Fixed -1.17 2.31 2.15 2.48 3.65 4.45
Total Public Equity -0.53 16.33 8.98 10.20 8.80 6.63MSCI ACWI IMI Net -0.89 15.03 8.27 9.34 7.99 5.91
U.S. Equity -1.07 13.75 9.92 12.68 11.82 9.46Rusell 3000 Index -0.64 13.81 10.22 13.03 12.39 9.62Callan Large Public > $10bn U.S. Equity -0.47 13.72 10.21 12.92 12.07 9.68
Non-U.S. Equity 0.10 20.29 8.45 7.94 6.29 4.68MSCI ACWI ex USA IMI** -1.06 17.10 6.75 6.24 4.52 3.12Callan Large Public >$10bn Non-U.S. Equity -0.44 17.78 7.69 7.21 5.48 4.05
Total Real Estate 1.93 7.28 8.15 10.26 10.82 5.32Total Real Estate ex REITs 2.72 8.25 10.34 11.71 11.82 5.07NCREIF Property Index Qtr Lag 1.85 6.66 9.22 10.09 10.74 6.03Callan Public Plan - Real Estate 0.50 6.34 8.07 9.83 10.28 4.54
Opportunity Portfolio 0.26 6.13 5.98 7.64 7.61 7.76Russell 3000 Index -0.64 13.81 10.22 13.03 12.39 9.62CPI + 5% 2.41 7.45 6.76 6.21 6.46 6.54
Total Alternative 1.48 6.84 5.60 3.91 -- --CPI + 4% 2.22 6.45 5.93 5.46 -- --
Total Private Equity 3.74 20.12 11.39 12.76 12.22 9.11OIC - Russell 3000 + 300 BPS Qtr Lag 7.11 24.71 14.43 19.01 16.87 12.27
7Oregon Investment CouncilKnowledge. Experience. Integrity.
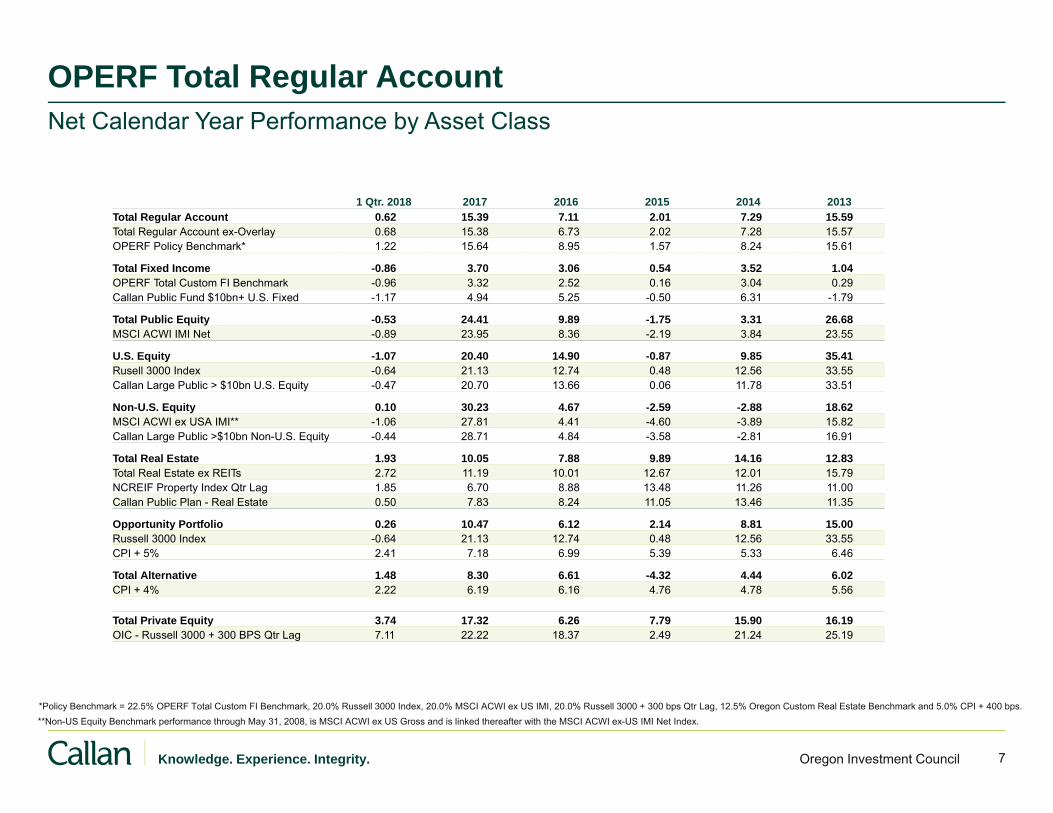
OPERF Total Regular AccountNet Calendar Year Performance by Asset Class
*Policy Benchmark = 22.5% OPERF Total Custom FI Benchmark, 20.0% Russell 3000 Index, 20.0% MSCI ACWI ex US IMI, 20.0% Russell 3000 + 300 bps Qtr Lag, 12.5% Oregon Custom Real Estate Benchmark and 5.0% CPI + 400 bps.**Non-US Equity Benchmark performance through May 31, 2008, is MSCI ACWI ex US Gross and is linked thereafter with the MSCI ACWI ex-US IMI Net Index.
Returns for Calendar Years ended March 31, 2018
1 Qtr. 2018 2017 2016 2015 2014 2013Total Regular Account 0.62 15.39 7.11 2.01 7.29 15.59Total Regular Account ex-Overlay 0.68 15.38 6.73 2.02 7.28 15.57OPERF Policy Benchmark* 1.22 15.64 8.95 1.57 8.24 15.61
Total Fixed Income -0.86 3.70 3.06 0.54 3.52 1.04OPERF Total Custom FI Benchmark -0.96 3.32 2.52 0.16 3.04 0.29Callan Public Fund $10bn+ U.S. Fixed -1.17 4.94 5.25 -0.50 6.31 -1.79
Total Public Equity -0.53 24.41 9.89 -1.75 3.31 26.68MSCI ACWI IMI Net -0.89 23.95 8.36 -2.19 3.84 23.55
U.S. Equity -1.07 20.40 14.90 -0.87 9.85 35.41Rusell 3000 Index -0.64 21.13 12.74 0.48 12.56 33.55Callan Large Public > $10bn U.S. Equity -0.47 20.70 13.66 0.06 11.78 33.51
Non-U.S. Equity 0.10 30.23 4.67 -2.59 -2.88 18.62MSCI ACWI ex USA IMI** -1.06 27.81 4.41 -4.60 -3.89 15.82Callan Large Public >$10bn Non-U.S. Equity -0.44 28.71 4.84 -3.58 -2.81 16.91
Total Real Estate 1.93 10.05 7.88 9.89 14.16 12.83Total Real Estate ex REITs 2.72 11.19 10.01 12.67 12.01 15.79NCREIF Property Index Qtr Lag 1.85 6.70 8.88 13.48 11.26 11.00Callan Public Plan - Real Estate 0.50 7.83 8.24 11.05 13.46 11.35
Opportunity Portfolio 0.26 10.47 6.12 2.14 8.81 15.00Russell 3000 Index -0.64 21.13 12.74 0.48 12.56 33.55CPI + 5% 2.41 7.18 6.99 5.39 5.33 6.46
Total Alternative 1.48 8.30 6.61 -4.32 4.44 6.02CPI + 4% 2.22 6.19 6.16 4.76 4.78 5.56
Total Private Equity 3.74 17.32 6.26 7.79 15.90 16.19OIC - Russell 3000 + 300 BPS Qtr Lag 7.11 22.22 18.37 2.49 21.24 25.19

8Oregon Investment CouncilKnowledge. Experience. Integrity.
OPERF Total Regular AccountGross Performance and Peer Group Rankings* as of March 31, 2018
*Versus Callan’s Very Large Public Funds (> $10 billion) Peer Group
Performance vs Large Public Funds (>10B) (Gross)
(4%)
(2%)
0%
2%
4%
6%
8%
10%
12%
14%
16%
Last Quarter Last Last 3 Years Last 5 Years Last 7 Years Last 10 YearsYear
(13)(11)
(20)(21)
(24)(21)(27)
(7)(19)(9)
(28)(17)
10th Percentile 1.41 12.99 8.32 9.27 8.88 7.3425th Percentile 0.36 12.14 7.76 8.99 8.52 6.95
Median (0.21) 11.11 7.38 8.39 8.13 6.5875th Percentile (0.52) 10.40 7.09 7.99 7.71 6.3790th Percentile (0.58) 8.87 5.93 6.73 7.29 5.57
TotalRegular Account 0.77 12.34 7.79 8.87 8.68 6.89
Total Policy Target 1.22 12.29 7.95 9.37 8.91 7.04

Appendix
10Knowledge. Experience. Integrity. Oregon Investment Council
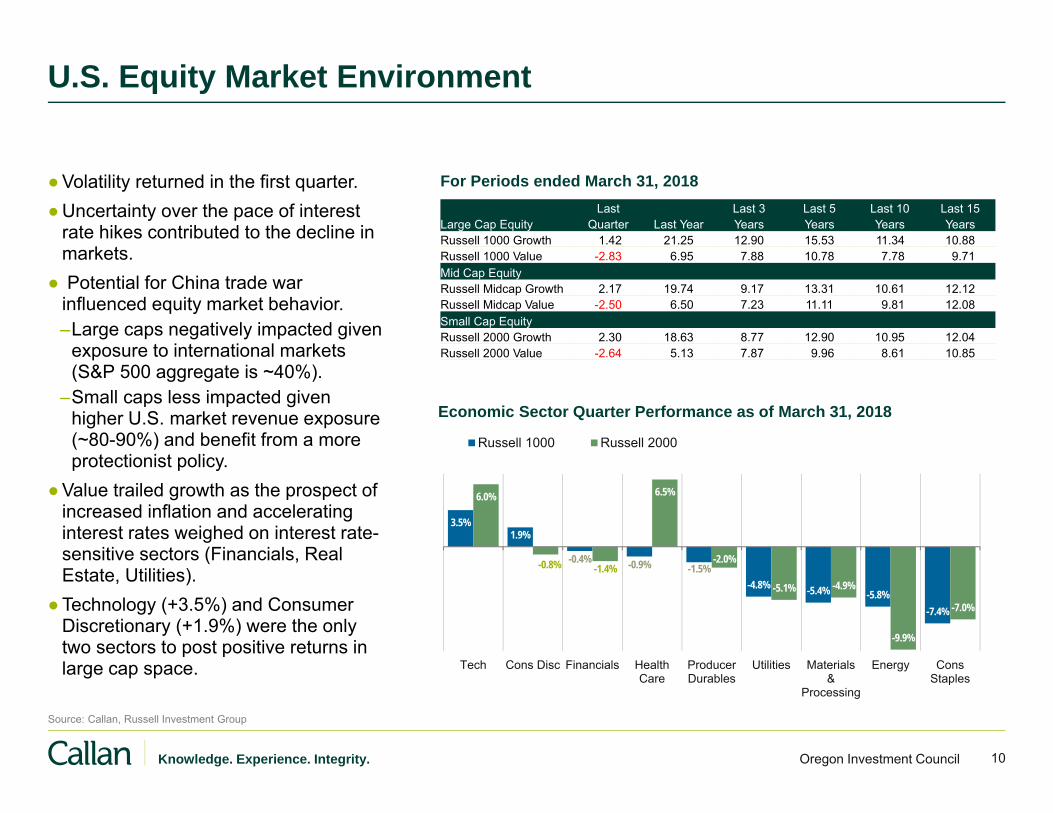
U.S. Equity Market Environment
Source: Callan, Russell Investment Group
Large Cap Equity QuarterLast
Last Year YearsLast 3
YearsLast 5
YearsLast 10
YearsLast 15
Russell 1000 Growth 1.42 21.25 12.90 15.53 11.34 10.88Russell 1000 Value -2.83 6.95 7.88 10.78 7.78 9.71Mid Cap EquityRussell Midcap Growth 2.17 19.74 9.17 13.31 10.61 12.12Russell Midcap Value -2.50 6.50 7.23 11.11 9.81 12.08Small Cap EquityRussell 2000 Growth 2.30 18.63 8.77 12.90 10.95 12.04Russell 2000 Value -2.64 5.13 7.87 9.96 8.61 10.85
For Periods ended March 31, 2018●Volatility returned in the first quarter. ●Uncertainty over the pace of interest
rate hikes contributed to the decline in markets.
● Potential for China trade war influenced equity market behavior.–Large caps negatively impacted given
exposure to international markets (S&P 500 aggregate is ~40%).
–Small caps less impacted given higher U.S. market revenue exposure (~80-90%) and benefit from a more protectionist policy.
●Value trailed growth as the prospect of increased inflation and accelerating interest rates weighed on interest rate-sensitive sectors (Financials, Real Estate, Utilities).
●Technology (+3.5%) and Consumer Discretionary (+1.9%) were the only two sectors to post positive returns in large cap space.
3.5%1.9%
-0.4% -0.9% -1.5%-4.8% -5.4% -5.8%
-7.4%
6.0%
-0.8% -1.4%
6.5%
-2.0%
-5.1% -4.9%
-9.9%
-7.0%
-10.0%
-9.0%
-8.0%
-7.0%
-6.0%
-5.0%
-4.0%
-3.0%
-2.0%
-1.0%
0.0%
1.0%
2.0%
3.0%
4.0%
5.0%
6.0%
7.0%
Tech Cons Disc Financials HealthCare
ProducerDurables
Utilities Materials&
Processing
Energy ConsStaples
Russell 1000 Russell 2000
Economic Sector Quarter Performance as of March 31, 2018

11Knowledge. Experience. Integrity. Oregon Investment Council
Non-U.S. Equity Market Environment
Sources: Callan, MSCI
Non-U.S. Equity QuarterLast
Last Year YearsLast 3
YearsLast 5
YearsLast 10
YearsLast 15
MSCI ACWI ex USA -1.18 16.53 6.18 5.89 2.70 9.22MSCI ACWI ex USA Growth -0.87 19.92 7.28 6.84 3.26 9.14MSCI ACWI ex USA Value -1.50 13.26 5.04 4.88 2.09 9.24MSCI EAFE -1.53 14.80 5.55 6.50 2.74 8.62MSCI EAFE (local) -4.28 5.34 3.36 8.45 4.53 7.79Regional EquityMSCI Europe -1.98 14.49 4.79 6.37 2.06 8.59MSCI Europe (local) -4.35 2.00 2.91 7.67 4.62 8.07MSCI Japan 0.83 19.64 8.36 8.92 4.10 7.61MSCI Japan (local) -4.81 14.19 4.11 11.64 4.79 6.84MSCI Pacific ex Japan -3.73 8.43 5.07 3.25 4.61 11.31MSCI Pacific ex Japan (loc) -2.78 7.58 4.88 7.46 5.63 9.76
For Periods ended March 31, 2018● Geopolitical tension, market volatility,
and fears of rising U.S. interest rates and inflation rattle markets.– Growth outpaced value; earnings
growth and quality factors were in favor given investor fears; conversely high beta cyclical sectors and factors struggled.
● Emerging markets continued to outpace developed fueled by a soft dollar and synchronized global growth.– However, fears of inflation and its
implication on the trajectory of U.S. monetary policy as well as a potential trade war with China weighed on the market.
● Developed non-U.S. small cap outperformed large cap given the risk-on market environment spurred by synchronized global growth.
Emerging/Frontier Markets QuarterLast
Last Year YearsLast 3
YearsLast 5
YearsLast 10
YearsLast 15
MSCI Emerging Markets 1.42 24.93 8.81 4.99 3.02 12.88MSCI Emerging Markets (loc) 0.72 22.01 9.02 8.24 5.44 13.10MSCI Frontier Markets 5.10 27.26 7.90 8.64 -0.68 8.71Non-U.S. Small Cap EquityMSCI EAFE Small Cap 0.24 23.49 12.25 11.10 6.48 12.47MSCI Em Mkts Small Cap 0.17 18.62 7.23 4.58 4.36 13.60

12Knowledge. Experience. Integrity. Oregon Investment Council
Fixed Income Overview
Source: Callan, Bloomberg
●Concerns over rising wage pressures and U.S./China trade war tension
●Volatility picked up as geopolitical uncertainties took center stage
●Market expectations reflect the possibility of four rate hikes, up from three at the end of 2017
–Interest rates rose ~30bps across the U.S. Treasury yield curve; 10-year U.S. Treasury yield rose from 2.41% to 2.74%
● Investment grade corporates underperformed the U.S. Aggregate Index. Investors reassessed healthy balance sheets juxtaposed with fair/rich valuations.
–New issuance was down 13% when compared to a year ago, yet demand remained strong with 2-3x oversubscriptions
●High yield corporates outperformed the U.S. Aggregate Index
–Corporate fundamentals remained healthy as earnings growth supported debt coverage
–Default rates remained benign
Broad Fixed Income QuarterLast
Last Year YearsLast 3
YearsLast 5
YearsLast 10
YearsLast 15
Core Bond Style -1.36 1.65 1.62 2.20 4.32 4.47Core Bond Plus Style -1.20 2.31 2.21 2.69 5.07 5.28BB Barclays Aggregate -1.46 1.20 1.20 1.82 3.63 3.95BB Barclays Gov/Credit -1.58 1.38 1.22 1.84 3.65 3.97BB Barclays Government -1.15 0.44 0.48 1.07 2.70 3.37BB Barclays Credit -2.13 2.59 2.16 2.83 5.15 4.91BB Barclays Corporate High Yld -0.86 3.78 5.17 4.99 8.27 8.39Long-TermBB Barclays Long Gov/Credit -3.58 5.09 2.13 4.09 6.79 6.36BB Barclays Long Government -3.22 3.53 0.45 3.28 5.75 5.90BB Barclays Long Credit -3.83 6.16 3.27 4.67 7.52 6.69Citi Pension Discount Curve -5.63 7.37 2.79 5.82 10.04 7.83Intermediate-TermBB Barclays Interm Aggregate -1.05 0.51 1.02 1.45 3.18 3.60BB Barclays Interm Gov/Credit -0.98 0.35 0.94 1.25 2.92 3.40Short-TermMoney Market Funds (net) 0.26 0.80 0.32 0.19 0.24 1.10ML Treasury 1-3 Year -0.13 0.03 0.40 0.52 1.13 1.9590-Day Treasury Bills 0.35 1.11 0.53 0.34 0.34 1.28
For Periods ended March 31, 2018

13Knowledge. Experience. Integrity. Oregon Investment Council
Real Estate Overview
NCREIF Propertyvs
Real Estate Database
NAREIT Equityvs
REIT Database
DevelopedEPRA/NAREIT
vsGlobal REIT Database
-12%
-8%
-4%
0%
4%
10th Percentile 2.60 -5.26 -1.9925th Percentile 2.14 -5.75 -2.89
Median 1.61 -6.67 -3.5975th Percentile 0.82 -7.40 -4.2190th Percentile -0.57 -7.85 -4.59
Benchmark 1.70 -8.20 -4.30
Callan Style Group Quarterly Returns
Apartments
Hotels
Industrial
Office
Retail
NCREIF All Equity Sector Quarterly Returns by Property Type
1.50%
1.00%
3.25%
1.80%
0.72%
East
Midwest
South
West
Sector Quarterly Returns by Region
1.20%
1.27%
1.83%
2.16%
● Supply and demand fundamentals are balanced but peaking. Supply is in check and aided by strict commercial realestate lending standards. Demand continues on the back of synchronized domestic growth.
● The NCREIF Property Index advanced 1.7% during the 1st quarter (Income: +1.1%; Appreciation: +0.6%). GlobalREITs outperformed U.S. REITs, but still lost 4.3%. U.S. REITs ended the quarter with -8.2%.
● The industrial sector is performing the strongest, benefitting as structural shifts in the economy, property markets,and consumer habits continue to dampen demand for traditional retail space. The Western region continues to leadother regions.

14Knowledge. Experience. Integrity. Oregon Investment Council
Hedge Fund & Multi-Asset Class (MAC): Is Alpha Back?
– An improved opportunity set for many types of hedge fund strategies?– Rising short-term rates
– Higher inflation risks
– More volatility
– During 1Q18, the average hedge fund performed well in a market where stocks and bonds broadly fell
– Even the average Equity Hedge manager, with a long market bias, made enough money from its underlying stock selection to overcome the headwinds of falling stock prices. “Alpha” is back!
– Macro hedge funds suffered from the equity market reversal, giving back some of last year’s gains
– Callan’s Multi-Asset Class (MAC) style groups had a modest report card in 1Q18, reflecting a challenging top-down environment, even for the Risk Premia style group. Value, momentum, and short vol exposures detracted from performance.
– On Feb 5, the VIX’s move from 17% to 38% was a “20 standard deviation” event. Was this early February spike in U.S. equity volatility a prelude to broader market uncertainty? – Likely, given more catalysts ahead from
widely diverging economic and geopolitical agendas around the world.
Source: www.cboe.com/products/vix-index-volatility/vix-options-and-futures/vix-index/vix-historical-data
Returns for Periods ended March 31, 2018
Hedge Fund Universe QuarterLast
Last Year YearsLast 3
YearsLast 5
YearsLast 10
YearsLast 15
Callan Absolute Return FoF 1.23 4.82 2.67 4.18 3.25 4.76Callan Core Diversified FoF 0.87 5.12 1.77 3.94 3.25 5.09Callan Long/Short Equity FoF 1.16 7.76 3.54 5.54 3.78 6.03HFRI Asset Wtd Composite 0.57 5.17 2.21 4.02 3.66 --HFRI Fund Weighted Index 0.14 6.08 3.51 4.22 3.60 6.05.HFRI Equity Hedge 0.59 9.70 5.29 5.70 3.87 6.18.HFRI Event-Driven 0.15 5.18 4.11 4.73 4.54 7.10.HFRI Macro -1.25 1.02 -0.85 0.89 1.42 4.42.HFRI Relative Value 0.30 3.17 3.60 4.11 5.20 5.8890 Day T-Bill + 5% 1.57 6.11 5.53 5.34 5.34 6.28Liquid Alternatives UniverseCallan Absolute Return MAC* 0.21 2.65 1.92 3.12 -- --Callan Risk Premia MAC* -0.74 3.08 1.42 3.02 6.85 --Callan Long Biased MAC* -0.50 9.32 3.84 5.37 5.98 8.87Callan Risk Parity MAC* -1.33 7.81 4.27 4.61 6.93 --S&P 500 -0.76 13.99 10.78 13.31 9.50 10.10Bloomberg Barclays Aggregate -1.46 1.20 1.20 1.82 3.63 3.9560% S&P / 40% BB BC Agg -1.04 8.76 6.95 8.68 7.50 7.92CS NB MARP Index (5%v) -0.70 -1.81 1.27 3.10 6.54 --SG Trend Index -3.88 -0.91 -5.01 1.80 1.91 3.59* Gross of fees
VIX (S&P 1-Month ATM Implied Volatility – Month-End Closing Values)*

TAB 6 – OST Investment Operations Update
OPERF & Other OST-managed Accounts

Investment Operations
June 6, 2018
Dave RandallDirector of Investment Operations
Debra DayInvestment Reporting Manager
Perrin LimDirector of Capital Markets

Executive Summary
Investment Operations Review2
The bottom line: Data accuracy, reporting and business intelligence are critical to
successful investment decision‐making.
Blackrock’s Aladdin tools and services, along with dedicated OST operational staff have
enabled Investment Officers to focus more on informed decision‐making rather than on
trade settlement, compliance, and other non‐investment related activities. We estimate
the impact of enhanced portfolio management capabilities to exceed $225m for the
calendar year 2017.
OST has introduced and applied many operational improvements, including a more
detailed reconciliation process that has identified significant reporting discrepancies
totaling more $1.5B over the last two years.

Background
Investment Operations Review3
A multi‐year business transformation that includes dedicated operational resources and
utilization of the BlackRock Solutions (BRS) Aladdin platform is well underway. The
Investment Operations Unit now comprises 8 FTEs and supports Investment Accounting,
Performance, Reporting, Reconciliation and Data Management for the State’s $100B
investment program.
2014 2015 2016 2017 2018
External reviews and internal audits show
substantial operational risks
Multi-stage program designed to address
antiquated infrastructure and other operating risks
Blackrock (BRS) Aladdin system
implemented on time and on budget
Director of Investment Operations & Data Analyst
hired – staff of 5
Operations reaches staff of
7 specialists
Operations will reach staff of
9 specialists
Increased Internally-Managed Assets:
$5B Treasury and$2B International Equity
Portfolios

Investment Operations Review4
OST Investment Division Org Chart – Current 2018
Director of Capital Markets
Director of Alternative Investments
Chief Investment Officer
Senior Investment Officer
Senior Investment Officer
Investment Officer
Investment Officer
Investment Analyst
Investment Officer
Investment Officer
Senior Investment Officer
Investment Officer
Investment Officer
Senior Investment Officer
Investment Officer
Senior Investment Officer
Investment Officer
Senior Investment Analyst
Executive Support Specialist
Investment Analyst
Investment Reporting Manager
Investment Analyst
Investment Analyst
Data Analyst
Operations Analyst
Operations Analyst
Public Equity Fixed Income Private Equity Real Estate Alternatives
AlternativesCapital Markets
OperationsInvestment Management
Portfolio Risk and Research Senior
Investment Officer
Risk Management
Executive Support Specialist
Executive Support Specialist
Investment Officer (v)
Director of Investment Operations
(v) = vacant
ESG Investment Officer
Investment Analyst
Investment Officer
Investment Analyst
Corporate Governance Director
Operations Analyst
Senior Investment Analyst

Investment Operations Review5
Investment Operations – Core Functions
Investment AccountingCash Management
Portfolio AdministrationFinancial ReportingExpense Review
Performance & Reporting
Public ReportingWeb Updates
Oregon Investment Council ReportingPERS Reporting
Internal Reporting
Data Management/Analysis
Data IntegritySecurity Master
Security CharacteristicsAnalytics
ReconciliationInvestment Book of RecordAccounting Book of RecordInvestment Manager Data
Consultant DataCustodial Data
Investment Operations

Industry Metrics
Source: Cutter Associates Public Funds Resource Allocation Peer Group Study.
Investment Operations Review6

Source: Cutter Associates Public Funds Resource Allocation Peer Group Study.Note: Peer group numbers reflect peer group average.
Operations
Performance Analysis and Reporting
Investment Accounting
Investment Expense Management
Data Management & Governance
Trade Support/Settlement
Operational Risk Management
Oregon
Peer Group
Building Capacity
7 Investment Operations Review
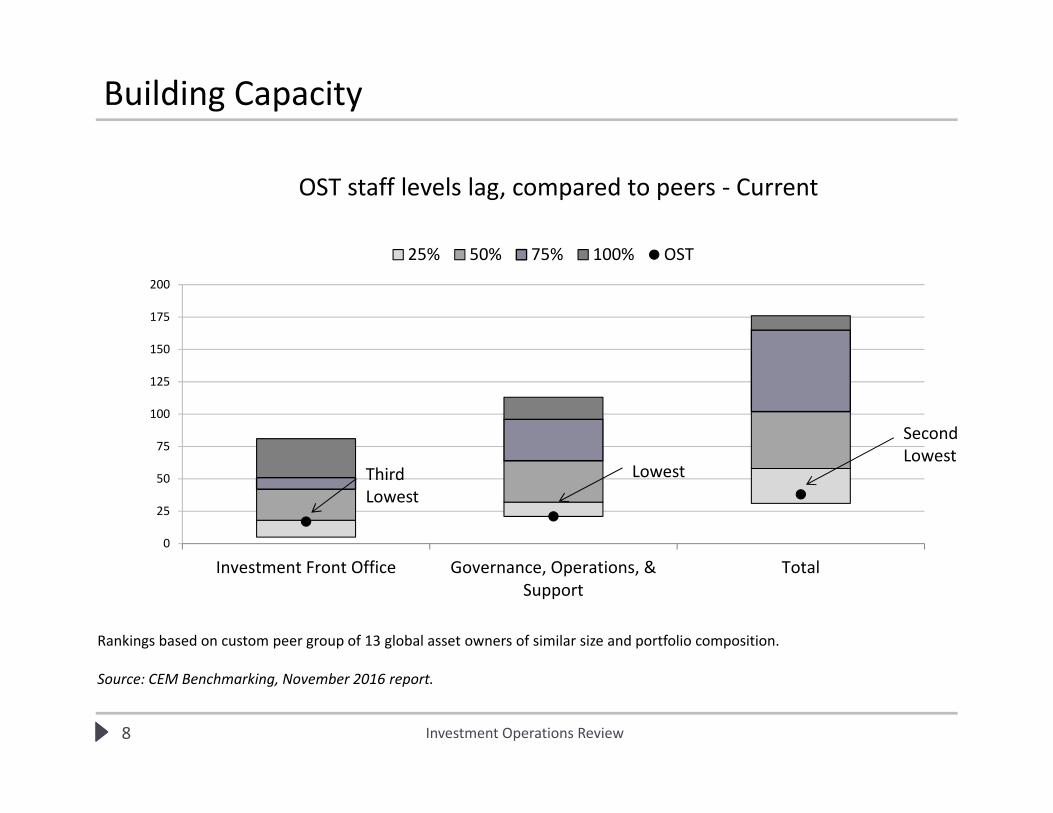
OST staff levels lag, compared to peers ‐ Current
Rankings based on custom peer group of 13 global asset owners of similar size and portfolio composition.
Source: CEM Benchmarking, November 2016 report.
0
25
50
75
100
125
150
175
200
Investment Front Office Governance, Operations, &Support
Total
25% 50% 75% 100% OST
Third Lowest
Lowest
Second Lowest
Building Capacity
Investment Operations Review8

0
25
50
75
100
125
150
175
200
Investment Front Office Governance, Operations, & Support Total
25% 50% 75% 100% OST
*Rankings based on custom peer group of 13 global asset owners of similar size and portfolio composition.
Source: CEM Benchmarking, November 2016 report.
Building Capacity
Staffing Comparison – 2019 Projection
Investment Operations Review9

Internally Managed Assets
10 Investment Operations Review
$0
$20,000
$40,000
$60,000
$80,000
$100,000
$120,000JUN‐2008
SEP‐2008
DEC‐2008
MAR
‐2009
JUN‐2009
SEP‐2009
DEC‐2009
MAR
‐2010
JUN‐2010
SEP‐2010
DEC‐2010
MAR
‐2011
JUN‐2011
SEP‐2011
DEC‐2011
MAR
‐2012
JUN‐2012
SEP‐2012
DEC‐2012
MAR
‐2013
JUN‐2013
SEP‐2013
DEC‐2013
MAR
‐2014
JUN‐2014
SEP‐2014
DEC‐2014
MAR
‐2015
JUN‐2015
SEP‐2015
DEC‐2015
MAR
‐2016
JUN‐2016
SEP‐2016
DEC‐2016
MAR
‐2017
JUN‐2017
SEP‐2017
DEC‐2017
MAR
‐2018
Total OST Assets ($ millions)
Internally Managed Externally Managed

0.0%
5.0%
10.0%
15.0%
20.0%
25.0%
30.0%
35.0%
MAR‐2015 JUN‐2015 SEP‐2015 DEC‐2015 MAR‐2016 JUN‐2016 SEP‐2016 DEC‐2016 MAR‐2017 JUN‐2017 SEP‐2017 DEC‐2017 MAR‐2018
Internally Managed Assets as % of Total Assets
$32B
$20B
Internally Managed Assets
11 Investment Operations Review

Cost Savings
12 Investment Operations Review
$0
$5,000,000
$10,000,000
$15,000,000
$20,000,000
$25,000,000
$30,000,000
Oregon ShortTerm Fund
GovernmentPortfolio ‐ OST
S&P 500 Index ‐OST
S&P 400 Index ‐OST
Russell 2000Index ‐ OST
US Risk Premia ‐OST
International RiskPremia ‐ OST
All InternallyManaged Funds
Estimated 2017 Cost Savings from Managing Funds Internally
$24M

Investment Value Add
13 Investment Operations Review
($50,000,000)
$0
$50,000,000
$100,000,000
$150,000,000
$200,000,000
$250,000,000
2017 Estimated Dollar Contribution to/Subtraction Versus Benchmark
Oregon Short Term Fund Government Portfolio ‐ OST S&P 500 Index ‐ OST
S&P 400 Index ‐ OST Russell 2000 Index ‐ OST US Risk Premia ‐ OST
International Risk Premia ‐ OST
$206M

Combined Value Add
14 Investment Operations Review
$206M
$24M
$0
$50,000,000
$100,000,000
$150,000,000
$200,000,000
$250,000,000
$300,000,000
2017 Estimated Internal Management Value Add
Performance Contribution Fee Savings Contribution
$230M

Improving Data Reliability
15 Investment Operations Review
Source: Cutter Associates Data Management Benchmarking Survey, December 2017

Improving Data Reliability
16 Investment Operations Review
Valuation and Performance Data Flow
Manager Statements & Security Level Detail
TorreyCove(Alternatives Consultant)
State Street(ABOR, PBOR)
Private Edge(Real Estate Consultant)
Aladdin(IBOR)
OST
Callan(General
Consultant)

Issue Reconciliation Log
Improving Data Reliability
17 Investment Operations Review

$367
$154
$26 $6 $(71)
$791
$122
$6
$45
$78
$36
$(200)
$‐
$200
$400
$600
$800
$1,000
2006 2007 2008 2011 2015 2016 2017
$ Millions
Estimated Historical Dollar Impact of Discrepancies
Private Equity Real Estate Opportunity Alternatives Other
Reconciliation Impact
18 Investment Operations Review

2014
Rank 18 of 20
Investment Operations Review19

2017
Rank 4 of 28
Investment Operations Review20
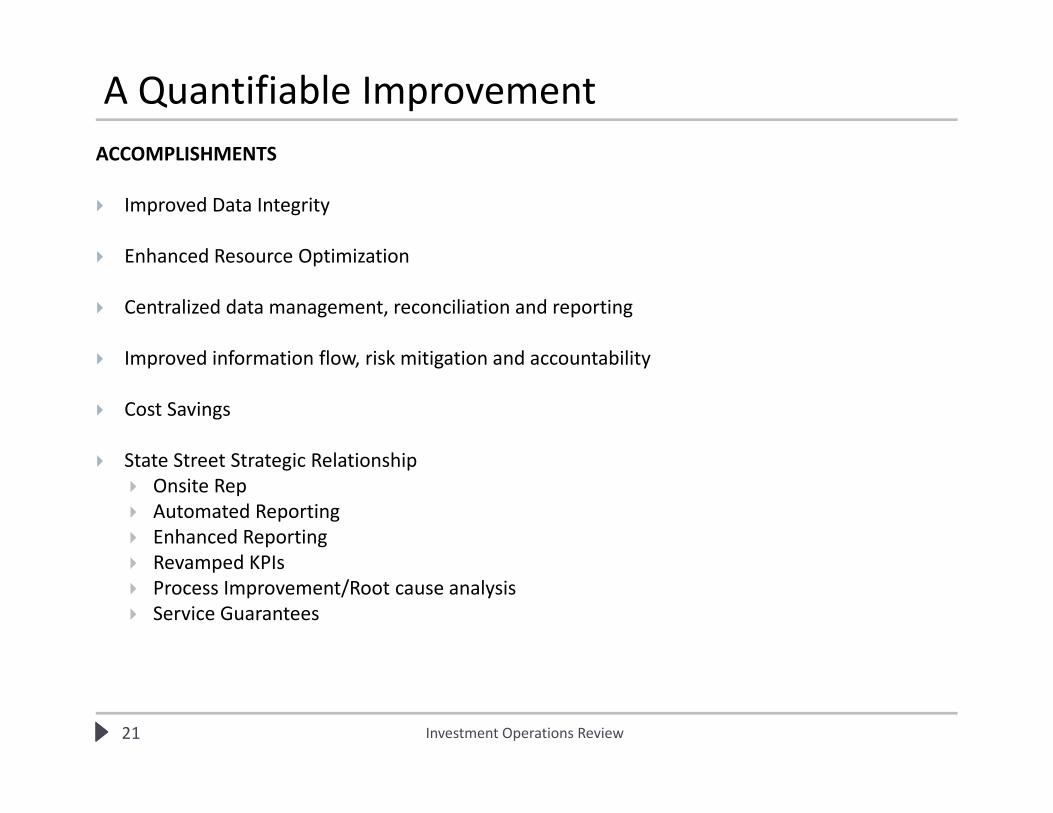
ACCOMPLISHMENTS
Improved Data Integrity
Enhanced Resource Optimization
Centralized data management, reconciliation and reporting
Improved information flow, risk mitigation and accountability
Cost Savings
State Street Strategic Relationship Onsite Rep Automated Reporting Enhanced Reporting Revamped KPIs Process Improvement/Root cause analysis Service Guarantees
A Quantifiable Improvement
21 Investment Operations Review

FUTURE OPPORTUNITES
Expand Aladdin Use and Expertise – Alternative Investments
Specialization and Optimization of Operational Resource Allocation
Reporting
Reconciliation
Data Management & Analytics
Trade Operations
Improve Fee Monitoring and Transparency
Extend Reconciliation Efforts
Enhance Reporting Activities
Custodial RFP
Looking Forward
22 Investment Operations Review

23 Investment Operations Review
Oregon Investment CouncilBlackRock Solutions
FOR PROFESSIONAL CLIENTS / QUALIFIED INVESTORS ONLY
June 6, 2018

Aladdin: Transformative, data-driven technology
2RESTRICTED: NOT FOR FURTHER DISTRIBUTION
• 80+ clients
• End-to-end investment platform
• IBOR across asset classes
• Delivered as a service, not
software
• User-provider model: the same
technology used by BlackRock’s
own investment teams
Aladdin is the common platform at the heart of building a unified firm:
• One source of quality-controlled data and standardized workflows
• Consistent business processes and common language
• Effective controls and robust, integrated compliance process
• Realizes operational leverage across the organization
• Clients can retire systems and interfaces
• Business continuity and “passing the book” across regions
• Support for wide range of asset classes and geographies
• Unique user-provider model means constant innovation and development to maintain a single operating platform
Streamlined processes means more time to focus on your core business and greater efficiencies to support growth
BRS couples our unique perspective on market trends with world-class data and technology into Aladdin, our enterprise investment management system that is also available as standalone risk tools

Aladdin Overview
3
Aladdin combines sophisticated risk, exposure and performance analyses with comprehensive portfolio management, trading, compliance and operations tools on a single platform
Single version of Aladdin used by OST staff, BlackRock Trade Support Teams, and BlackRock Client Solutions Team
• Flexible and configurable to support OST as an organization
Portfolio Analysis and Construction
Portfolio Monitoring and Maintenance
Real-time Workflowand Exception Management
Order Management Pre-Trade Compliance Accessing Liquidity Pools Trade Capture
Position and Risk Reporting
Cash Forecasting Performance and
Attribution Analysis
Trade Confirmation/Notification Reference Data Management Corporate Actions Processing Cash/Position Reconciliations Derivative Operations
Full Information Transparency
Centralized Source of Data Executive Oversight
Integration of people, processes and systems through one centralized platform and database

BRS has significant experience working with pensions
4PROPRIETARY & CONFIDENTIAL
Single platform with real-time views of exposures, cash, and risk across all assets
Integrated functions across investments teams• All speaking a common language • All sharing same data
Simplifies IT and multi-vendor infrastructures that are complicated and expensive to manage
Increases operational efficiency and reduces operational risk
Thought Leadership Events: Aladdin community forums for pension clients
How Aladdin helps pension clients Clients
Alaska Permanent Fund Corporation
CalSTRS
Government Pension Investment Fund
Illinois Teachers Retirement System
NY Common
Oregon State Treasury
PSERS
UC Regents
Virginia Retirement System
Pensions represent a large client segment for the Aladdin Business
Currently provide services to over 35 pensions
Approximately $1.7 trillion in pension assets on Aladdin
Extensive industry knowledge and relationships benefit our team and clients by allowing us to:
Stay attuned to key industry trends and management issues
Better understand the unique constraints and challenges pensions face
“Have a seat at the table” with industry groups
Provide practical advice and solutions informed by experience managing and modeling pension portfolios

Oregon State Treasury’s 3 year internally managed AUM growth
1921 22
31
0
5
10
15
20
25
30
35
Go-Live(Sept 2015)
Q4 2015 Q4 2016 Q4 2017
Pro
cess
ed A
UM
($B
n)
Processed Assets under Management ($Bn)
5
63% increase assets under management processed on Aladdin
between go-live and Q4 2017
RESTRICTED: NOT FOR FURTHER DISTRIBUTION
OST has leveraged Aladdin to increase its Internally Managed Assets Under Management
OST has approximately 38,000 trades processed on Aladdin (Average of about 3,400 trades a quarter)
Over 21,000 Corporate Action Events processed on Aladdin (Mandatory and Voluntary Events)
Approximately 41,000 Position and Cash Reconciliations performed since inception on Aladdin
Over 500 Compliance rules coded for Compliance monitoring

Aladdin Client Usage Metrics – All users peer comparison
6
BRS can compare usage against peers to identify who is utilizing the various tools and assign users into example usage profiles
Q1 2018 data shows 81,137 total Aladdin actions at OST vs. 51,592 actions at peers
• Top Aladdin Actions (modeling orders, retrieving portfolio risk analytics, generating returns and attribution, querying trades, security updates, Green Package reports, ATX queries)
40% of Users at OST fall into the Super or High User category vs. 19.2% at peers
Average of 19 Aladdin features used per user at OST vs. 13 features used at peers
Data shows OST Aladdin Users are highly leveraging Aladdin features and capabilities.
Users in the low and baseline bucket represent an opportunity for BRS to reengage and reintroduce tools that could be utilized in their day-to-day usage of Aladdin
• Increasing Aladdin usage across OST Privates team

2018 OST Aladdin Priorities
7
BlackRock Solutions (BRS) is committed to increasing Aladdin usage across the Oregon State Treasury Privates team by focusing on quick wins and strategic engagement.
Approach
• Influence the alternatives platform roadmap Continually engage on functionality key to OST’s alternative investment process
• Increase Privates Aladdin usage through risk reporting Systematically review private holdings, apply appropriate risk model and review proxies
Risk Reporting Updates
• Accomplishments Provided overview of 2018 modeling objectives
and overview of existing functionality
Updated alternatives reporting to reflect updated alternative holding sectors and industries
Conducted 5 Alternative Risk review meetings
Proxied risk for 42 holdings
• Ongoing Map alternatives to sector and industry relevant
risk factors with semi-annual review frequency
Work with OST as a thought leader to help influence platform development and functionality

Aladdin For Alternatives Vision
8RESTRICTED: NOT FOR FURTHER DISTRIBUTION
Our Alts Technology vision is anchored on 3 goals:
• Deliver a tightly integrated platform to the Aladdin community to manage their Alts business
• Facilitate Portfolio and Enterprise analysis via a robust risk management framework across Alts asset classes
BlackRock Solutions is the market leader for alternatives investment management technology providing transparency and insights throughout the full life cycle of investments
Master Data SetWe need to deliver in-depth capabilities across all components
ClientsPortfolio Manager
OperationsRisk
Manager
Who Benefits?

9RESTRICTED: NOT FOR FURTHER DISTRIBUTION
What is needed in the private deal investment process?

TAB 7 – Common School Fund
Annual Review

Common School Fund Annual Review
Purpose To provide the Oregon Investment Council (OIC or the Council) with an update on the asset allocation, performance, and rebalancing activity within the Common School Fund (CSF) for the period ended December 31, 2017.
About the Common School Fund The act of Congress admitting Oregon to the Union in 1859 granted nearly 3.4 million acres of the new state’s land "for the use of schools." The State Land Board was established to oversee these “school lands” and has been the trustee of the CSF for more than 150 years. School lands and their mineral resources, submerged and submersible lands underlying the state´s tidal and navigable waterways, unclaimed property held in trust, and the proceeds from escheated estates all contribute to the corpus of the fund.
CSF Asset Allocation At its September 20, 2017 meeting, the Oregon Investment Council (OIC or the Council) approved the following asset allocation targets, benchmarks, and ranges (Exhibit 1) for the CSF. The OIC‐approved asset allocation resulted in a 10 percent target allocation to both Real Assets and Diversifying Strategies, which improved ex ante returns without a commensurate increase in expected risk. The objective of the CSF, outlined in OIC INV 901 ‐ Common School Fund: Asset Classes, Asset Allocation, and Reporting Requirements, is to, on behalf of the Department of State Lands, optimize long‐term investment returns and distributions, while enabling the CSF asset base to grow in real terms. The OIC‐approved asset allocation was informed by Callan Associates’ recent CSF Distribution Study, which was presented to the Department of State Lands Board in April 2017. That study concluded that a 4% annual distribution was the maximum rate compatible with future CSF value stability as measured in real (i.e., inflation‐adjusted) terms. Important elements of the CSF asset allocation policy are its expected return and risk statistics. Specifically, minimum return and maximum risk boundaries are necessary to maintain the long‐run feasibility of the CSF distribution policy. Exhibit 1 – Asset Allocation Policy
Common School Fund Benchmark Prior Allocation Approved Allocation Approved Range
Global Equity MSCI ACWI IMI Net 60% 45% 40% ‐ 50%Private Equity Russell 3000 + 300 bps 10% 10% 8% ‐ 12%Fixed Income Bloomberg U.S. Aggregate Bond Index 30% 25% 20% ‐ 30%Real Assets NCREIF ODCE QTR LAG (net) 0% 10% 8% ‐ 12%Diversifying Strategies CPI + 4% 0% 10% 8% ‐ 12%Cash Cash 0% 0% 0% ‐ 3%
10 Yr Expected Return (Geo Mean) 6.5% 6.6%
Projected Standard Deviation 14.5% 13.2%
Source: Callan 2017 Capital Market Assumptions
CSF Performance For the year ended December 31, 2017, the CSF posted a 17.2 percent return, under‐performing its benchmark by a modest 0.2 percent (Exhibit 2). For the three‐, five‐, and ten‐ year periods ended December 31, 2017, net excess returns for the CSF were ‐0.21 percent, 0.25 percent and 0.18 percent, respectively.

CSF Annual Review June 6, 2018
Page 2 of 5
Exhibit 2 – Total Fund Performance
Period Ending 12/31/2017 Market Value 3 Months 1 Year 3 Years 5 Years 10 Years
CSF Returns 1,676,023,000$ 3.82% 17.24% 7.71% 9.46% 5.88%CSF Policy Benchmark 4.04% 17.47% 7.92% 9.21% 5.70%Excess Return ‐0.22% ‐0.23% ‐0.21% 0.25% 0.18%
Source: State Street Although total fund returns for CSF across all trailing periods were not remarkably different from the CSF Policy Benchmark (within a 25 basis point range of the Policy Benchmark), at the asset class level relative returns were mixed. Public Equity and Fixed Income posted strong excess returns across all trailing time periods, while Private Equity suffered headwinds, under‐performing its benchmark across all time periods (Exhibit 3). Private equity has benefited the CSF, delivering double digit returns over short and intermediate‐term time horizons. However, and similar to staff’s experience with private equity investments in the Oregon Public Employees Retirement Fund (OPERF), the CSF’s private equity benchmark (Russell 3000 Index + 3%) has proved formidable during this most recent and extended period of strong public equity markets. Exhibit 3 – Asset Class Performance
Period Ending 12/31/2017 Market Value 3 Months 1 Year 3 Years 5 Years 10 Years
CSF Global Equity Returns 952,075,000$ 5.85% 24.83% 9.85% 12.02% 6.23%MSCI ACWI IMI Net 5.72% 23.95% 9.52% 11.00% 4.97%Excess Return 0.13% 0.88% 0.33% 1.02% 1.26%
Period Ending 12/31/2017 Market Value 3 Months 1 Year 3 Years 5 Years 10 Years
CSF Fixed Income Returns 446,205,000$ 0.50% 4.94% 2.97% 2.84% 5.02%Bloomberg Barclays U.S. Aggregate 0.39% 3.54% 2.32% 2.21% 4.18%Excess Return 0.11% 1.40% 0.65% 0.63% 0.84%
Period Ending 12/31/2017 Market Value 3 Months 1 Year 3 Years 5 Years 10 Years
CSF Private Equity Returns 200,352,000$ 4.11% 15.31% 10.17% 14.04% 7.62%Russell 3000 + 300 Bps Qtr Lag 5.34% 22.22% 14.03% 17.61% 11.23%Excess Return ‐1.23% ‐6.91% ‐3.86% ‐3.57% ‐3.61%
Source: State Street
Rebalancing Activity Update At the April 2017 OIC meeting, staff recommended, and the OIC approved, updated CSF policies for Public Equity, Fixed Income, and Private Equity, which align with asset class policies used for OPERF. In addition to the alignment of asset class policies, the Council also approved staff’s ability to exercise manager/strategy retention, termination and rebalancing discretion. These updated policies also endowed staff with the ability to implement in CSF any private equity manager/strategy previously approved by the Council on behalf of OPERF. Subsequently, at the June 2017 OIC meeting, staff recommended, and the OIC approved, new policies for the CSF, INV 906: Real Estate and INV 907: Alternatives. These new policies further align CSF and OPERF by granting staff discretion to implement in CSF any real estate manager/strategy or alternatives manager/strategy previously approved by the Council on behalf of OPERF.

CSF Annual Review June 6, 2018
Page 3 of 5
Using this authority, the following rebalance actions (Exhibit 4) were implemented: Exhibit 4 ‐ Rebalancing Activity through March 30, 2018
Date(s) Manager Sub‐Asset Class Market Value Purpose
Oct‐17 MFS Institutional U.S. Large Cap Value (114,672,000)$ TerminationOct‐17 Jackson Square Partners U.S. Large Cap Growth (114,038,000)$ TerminationNov‐17 Dimensional Fund Advisors U.S. Large Cap 228,710,000$ Initial FundingDec‐17 BlackRock ACWI IMI Global Equity (50,000,000)$ Rebalance ‐ Cash RaiseJan‐18 JP Morgan Systematic Alternatives 50,000,000$ Initial FundingJan‐18 BlackRock ACWI IMI Global Equity (50,000,000)$ Rebalance ‐ Cash RaiseFeb‐18 BlackRock Style Advantage Alternatives 50,000,000$ Initial FundingMar‐18 RREEF Real Estate 9,000,000$ Initial FundingSource: State Street
Portfolio Construction Update As of March 30, 2018, the CSF’s actual allocation relative to the newly established policy targets still reflects residual exposures from the prior targets (Exhibit 5). As shown in Exhibit 4, staff allocated $100MM to two separate Alternatives mandates and one initial funding in Real Estate in Q1 2018. OST Staff is currently working on two real estate mandates which are expected to fund in Q3 2018. Staff expects to reach the revised, OIC‐approved target allocations by late‐2019. Exhibit 5 ‐ Portfolio Construction as of March 30, 2018
Common School Fund Prior Allocation Target Allocation Range Market Value Actual
Global Equity 60% 45% 40% ‐ 50% 891,720,000$ 52%Private Equity 10% 10% 8% ‐ 12% 212,873,000$ 12%Fixed Income 30% 25% 20% ‐ 30% 451,976,000$ 26%Real Estate 0% 10% 8% ‐ 12% 9,000,000$ 1%Alternatives 0% 10% 8% ‐ 12% 95,869,000$ 6%Cash (Oregon Short Term Fund) 0% 0% 0% ‐ 3% ‐$ 0%
1,661,437,000$
Source: State Street CSF Net Asset Value (NAV) CSF NAV hit a low of $678 million in February 2009 and has since realized a steady and sustained upward trend. Net of contributions and distributions, CSF appreciated from $1.46 billion at the end of December 2016 to $1.67 billion at year‐end 2017.

CSF Annual Review June 6, 2018
Page 4 of 5
Background on the Common School Fund Source: Department of State Lands The act of Congress admitting Oregon to the Union in 1859 granted sections 16 and 36 in every township "for the use of schools." The provision of land for educational purposes was a practical solution for the developing nation that was "land rich, but cash poor." In Oregon, Congress granted roughly six percent of the new state´s land ‐ nearly 3.4 million acres ‐ for the support of schools. Due to various circumstances, about 700,000 acres remain in state ownership today. These lands and their mineral and timber resources, as well as other resources under the State Land Board´s jurisdiction (including the submerged and submersible lands underlying the state´s tidal and navigable waterways) are managed "with the object of obtaining the greatest benefit for the people of this state, consistent with the conservation of this resource under sound techniques of land management."
Rangelands are leased to ranchers for grazing sheep and cattle. Forestlands are managed for timber production. Waterways are leased for uses such as sand and gravel extraction, houseboats, marinas
and log rafts. The rents and royalties received from these activities are deposited in the Common School Fund, a trust fund for the benefit of Oregon´s K‐12 public schools.
Other sources of money contributing to the Common School Fund include:
Escheats ‐‐ property reverting to the state on an individual´s death because no heir or will exists or can be found;
Unclaimed property, while the agency searches for the rightful owner; Gifts to the state not designated for some other purpose; Tax revenues from the production, storage, use, sale or distribution of oil and natural
gas; and 5% of the proceeds from the sale of federal lands.
The State Treasurer and the Oregon Investment Council invest the Common School Fund. In recent years, fund values have ranged from $600 million to $1.4 billion, depending on market conditions. In addition, the Land Board must consider the issue of "intergenerational equity" in its distribution policies. Fund distributions cannot benefit current students at the disadvantage of future students, or vice‐versa. In early 2005, the State Land Board announced a record $45.6 million distribution of earnings from the Common School Fund to all K‐12 public schools and voted to modify the future

CSF Annual Review June 6, 2018
Page 5 of 5
distribution policy for the fund. The turnaround in the stock market during 2004 created a significant increase in the value of the Common School Fund which reached $1 billion in February 2006. Changes to Oregon law and the investment policies of the State Land Board beginning in the late 1980s significantly boosted earnings flowing to schools. Specifically, a 1988 Constitutional Amendment allowed investment of the Common School Fund in the stock market, subject to a legislatively‐established investment cap of 50 percent. The 1997 Legislature increased the cap to 65 percent, a timely shift in strategy that has helped nearly quadruple the fund’s value due to stock market appreciation and revenues generated from land management. In 2009, the State Land Board adopted a distribution policy that distributes 4% of the fund’s preceding 3‐year rolling average balance. If the balance of the fund has increased by 11% or more, the distribution shall be 5% of the preceding 3‐year average balance. Legislation passed in 2005 directed the Oregon Department of Education to send CSF revenues directly to Oregon's 197 K‐12 public school districts. Recent years’ distributions include the following: 2002 $32.3 million 2003 $13.0 million 2004 $21.6 million 2005 $40.8 million 2006 $45.4 million 2007 $48.5 million 2008 $55.4 million 2009 $40.4 million 2010 $50.5 million 2011 $48.8 million 2012 $48.0 million 2013 $53.1 million 2014 $50.8 million 2015 $54.2 million 2016 $66.2 million 2017 $70.3 million

Oregon Department of State Lands — DSL by the Numbers
Fiscal Year 2017 (July 1, 2016–June 30, 2017)The State Land Board was created by the Oregon Constitution in 1859 and has been composed of the Governor, Secretary of State, and State Treasurer since its inception. DSL serves as the administrative arm of the Board, managing land and other resources dedicated to the Common School Fund for K-12 education.
In 1957 the Legislature passed the Uniform Unclaimed Property Act and assigned the Land Board and DSL the responsibility of safeguarding lost financial assets until claimed by rightful owners.
Beginning in 1967, DSL began implementing the state’s removal-fill law which protects natural waterways and wetlands for purposes of navigation, fisheries, commerce and recreation. The agency assumed Oregon’s wetlands conservation program as a result of the 1989 Wetlands Conservation Act.
The agency has two divisions and serves as the state partner for the South Slough National Estuarine Research Reserve in Charleston, the first of 28 reserves throughout the United States.
In the 2015-17 biennium, DSL had 107 employees:
Administration Division: 43 staff (Business Operations and Support Services – 30; Trust Property – 13)
Director’s Office: 4 staff
Operations Division: 46 staff (Aquatic Resource Management – 34; Real Property – 12)
South Slough Reserve: 16 staff
The agency’s 2015-17 Legislatively Approved Budget was $38.7 million. No General Funds are used for operations, only Other Funds and Federal Funds.
DSL by the NumbersOregon Department of State Lands
$1.54 Billion Market Value as of June 30,2017
Operating Expenses
$24,982,351 $133,925,000
Change in Fund Value
Operating Revenues
$14,039,612
Common School Fund
Agency Mission:
To ensure a Common School Fund legacy through sound management of our trust responsibilities and the protection of waters of the state.
$70,334,366
Distribution to Schools

Oregon Department of State Lands
775 Summer St. NESuite 100Salem, OR 97301-1279
(503) 986-5200www.oregon.gov/DSL
Oregon’s Constitution directs the State Land Board to manage state trust lands to generate revenue for Oregon public schools.
Department of State Lands Fiscal Year 2017
Oregon Department of State Lands — DSL by the Numbers
DSL by the NumbersOregon Department of State Lands
Real Property
Estimated total value of Common School Fund land assets: $544 million
Total number of active authorizations on Common School Fund lands: 303
Rangelands/Ag Lands 627,916 acres
Gross revenues $1,482,067
Forestlands 121,151 acres
Gross revenues $3,522,486
Industrial/Commercial/
Residential 6,809 acres
Gross revenues $1,139,925
Special Stewardship
Lands 13,166 acres
Gross revenues $15,954
Mineral and Energy
Resources 767,092 acres
Gross revenues $368,601
Land Sales 497 acres
Gross revenues $2,434,069No. of sales 18
Trust Property
Unclaimed Property
Gross receipts $60,887,947Claims paid $29,573,644No. of claims paid 14,599Estates Escheat Program
No. of estates handled 908Funds pending permanent escheat to Common School Fund $6,549,041
Aquatic Resource Management
Removal-Fill Permits 385
Individual Permits 193General Permits 38General Authorizations 108Emergency Authorizations 46Permit fees $405,818Wetland Delineation Reports 270
Report fees $115,697
Wetland Determinations 177
Wetland Land Use Notices 601
Wetland Mitigation Banks No. of approved banks 28No. of credits available (6-30-17) 431.43No. of credits sold in FY 2017 38.24
Removal-Fill Mitigation Fund
No. of permits using program 21Credits sold 4.47Funds collected $563,084State-Owned Waterways
1,264,558 acres
No. of active authorizations 5,246Gross revenues $4,002,448South Slough National
Estuarine Research Reserve
No. of acres managed 5,927No. of research projects 15No. of education/interp. programs 194No. of training workshops 9No. of program participants 5,303No. of visitors at interp. center 4,611

“Every education advocate should understand the Common School Fund’s role in helping fund K-12
schools.”
Jim Paul, Director Department of State Lands
$70.3 Million Earmarked for State’s 197 K-12 Districts in 2017Since Oregon became a state in 1859, a little-known fund—the Common School
Fund—has provided hundreds of millions of dollars for Oregon public schools.
Common School Fund distributions are considered local revenue in the state
funding formula, and the dollars are not insignificant. In a district such as Corvallis,
their share in 2017 ($1,184,612) supports the equivalent of 14 full-time teaching
positions; in Bend, 24; and in Medford, 19.
State Land Board oversees Common School FundThe act of Congress admitting Oregon to the Union in 1859 granted sections 16 and
36 of every township for the use of schools. Nearly 3.4 million acres—roughly the
size of Connecticut—came under state ownership.
Our “land-rich, cash-poor” state quickly sold many school lands, as state officials
felt private ownership of these lands would yield more for schools through property
taxes and other economic benefits. As a result, less than a fourth of Oregon’s
original acreage—about 750,000 acres—remains in state ownership.
Common School Fund Benefits Oregon Schools
2017 Common School Fund DistributionsA sampling of districts and the impact of their distributions
School District Distribution Equal to*
Astoria $218,904 2.5 full-time teachers
Bend $2,076,263 24
Coos Bay $353,865 4
Corvallis $1,184,612 14
Hood River $470,280 5.5
Medford $1,628,362 19
Ontario $286,730 3
Pendleton $374,504 4
Portland $6,190,520 73
Salem $5,009,361 59
*Based on the 2016 annual statewide average of $85,056 per teacher for salary and benefits;figures are rounded
The State Treasurer
and Oregon Investment
Council invest the
Common School Fund,
which exceeded its
performance benchmark
over the three-year
period ending in 2016,
earning a 4.36 percent
average annual return.
The value of the fund
fluctuates with changing
market conditions, and
is now valued at $1.4
billion. Historically, about
4 percent of the fund
has been distributed to
school districts annually.
Oregon Department of State Lands
775 Summer St. NESuite 100Salem, OR 97301-1279
(503) 986-5200www.oregon.gov/DSL
For more information and copies of this fact sheet, contact: Julie Curtis (503) 986-5298 [email protected]
“Protecting and enhancing the Common School Fund is arguably the most important
thing we do as a state agency,” says Jim Paul, director of the Department of
State Lands, the administrative arm of the Land Board. “Our goal is to have every
education advocate understand its role in funding K-12 schools.”
Inputs into the fund include revenues from state-owned trust lands, and from
estates that transfer to the state from people who die without a will and known
heirs. All unclaimed property (money) the state receives is held in the Common
School Fund until the rightful owner is located.
Goal is to grow the fund significantly over time As the Common School Fund grows,
so do distributions to Oregon school
districts. Since 2000, distributions have
ranged from a low of $13 million in
2004 to a high of $70 million in 2017.
Distributions in the 2015-17 biennium
will total about $136.6 million.
The Department of State Lands is
strategically managing the fund’s real
estate assets to increase revenues
to schools. Divesting of non-producing
lands, investing in high-quality lands,
and ensuring that state land leases
reflect market values are among the
agency’s strategies, says Paul.
“Every dollar helps Oregon schools,”
he says. “Through balancing revenue
enhancement and resource protection,
our goal is to provide sustainable
funding for schools forever.”
Common School Fund
distributions are sent
to school districts twice
a year. By law, fund
distributions cannot
benefit current students
at the disadvantage of
future students, or
vice-versa.
The Land Board’s
Real Estate Asset
Management Plan calls
for a “clear commitment
to creating a consistent
stream of revenue
to increase annual
distributions to schools.”
It also recognizes the
need to strategically
dispose of selected
land assets and acquire
assets with high
performance potential.
3/17

TAB 8 – Asset Allocations & NAV Updates

Asset Allocations at April 30, 2018
Variable Fund Total Fund
OPERF Policy Target1
$ Thousands Pre-Overlay Overlay Net Position Actual $ Thousands $ Thousands
Public Equity 32.5-42.5% 37.5% 29,755,876 38.7% (635,927) 29,119,949 37.9% 583,634 29,703,583
Private Equity 13.5-21.5% 17.5% 15,129,869 19.7% 15,129,869 19.7% 15,129,869
Total Equity 50.0-60.0% 55.0% 44,885,745 58.4% (635,927) 44,249,819 57.5% 44,833,452
Opportunity Portfolio 0-3% 0.0% 1,757,853 2.3% 1,757,853 2.3% 1,757,853
Fixed Income 15-25% 20.0% 15,217,523 19.8% 2,305,256 17,522,778 22.8% 17,522,778
Real Estate 9.5-15.5% 12.5% 7,477,333 9.7% (7,100) 7,470,233 9.7% 7,470,233
Alternative Investments 0-12.5% 12.5% 5,892,856 7.7% 5,892,856 7.7% 5,892,856
Cash2
0-3% 0.0% 1,683,089 2.2% (1,662,229) 20,860 0.0% 2,441 23,301
TOTAL OPERF 100% 76,914,400$ 100.0% -$ 76,914,400$ 100.0% 586,075$ 77,500,474$
1Targets established in June 2015. Interim policy benchmark consists of: 40% MSCI ACWI IMI Net, 22.5% Custom FI Benchmark, 20% Russell 3000+300bps (1 quarter lagged),
12.5% NCREIF ODCE net (1 quarter lagged), & 5% CPI+400bps. 2Includes cash held in the policy implementation overlay program.
SAIF Policy Target $ Thousands Actual
Total Equity 7-13% 10.0% 589,964 12.5%
Fixed Income 80-90% 85.0% 4,109,136 86.7%
Real Estate 0-7% 5.0% 0 0.0%
Cash 0-3% 0% 38,193 0.8%
TOTAL SAIF 4,737,293$ 100.0%
CSF Policy Target $ Thousands Actual
Global Equities 40-50% 45% 883,450 53.1%
Private Equity 8-12% 10% 211,188 12.7%
Total Equity 58-62% 55% 1,094,638 65.8%
Fixed Income 25-35% 25% 448,695 27.0%
Real Estate 8-12% 10% 9,000 0.5%
Diversifying Strategies 8-12% 10% 95,292 5.7%
Cash 0-3% 0% 16,202 1.0%
TOTAL CSF 1,663,826$ 100.0%
Regular Account

29755876
37.5%
17.5%
0.0%
20.0%
12.5% 12.5%
0.0%
37.9%
19.7%
2.3%
22.8%
9.7%
7.7%
0.0%0%
5%
10%
15%
20%
25%
30%
35%
40%
Public Equity Private Equity Opportunity
Portfolio
Fixed Income Real Estate Alternative
Investments
Cash
Target
Actual
OPERF Asset Allocation
10.0%
85.0%
5.0%
0.0%
12.5%
86.7%
0.0% 0.8%
0%
10%
20%
30%
40%
50%
60%
70%
80%
90%
100%
Total Equity Fixed Income Real Estate Cash
Target
Actual
SAIF Asset Allocation
45.0%
10.0%
25.0%
10.0% 10.0%
0.0%
53.1%
12.7%
27.0%
0.5%
5.7%
1.0%
0%
10%
20%
30%
40%
50%
60%
Global Equities Private Equity Fixed Income Real Estate Diversifying
Strategies
Cash
Target
Actual
CSF Asset Allocation

-
10,000
20,000
30,000
40,000
50,000
60,000
70,000
80,000
Ap
r-0
3
Jul-
03
Oct
-03
Jan
-04
Ap
r-0
4
Jul-
04
Oct
-04
Jan
-05
Ap
r-0
5
Jul-
05
Oct
-05
Jan
-06
Ap
r-0
6
Jul-
06
Oct
-06
Jan
-07
Ap
r-0
7
Jul-
07
Oct
-07
Jan
-08
Ap
r-0
8
Jul-
08
Oct
-08
Jan
-09
Ap
r-0
9
Jul-
09
Oct
-09
Jan
-10
Ap
r-1
0
Jul-
10
Oct
-10
Jan
-11
Ap
r-1
1
Jul-
11
Oct
-11
Jan
-12
Ap
r-1
2
Jul-
12
Oct
-12
Jan
-13
Ap
r-1
3
Jul-
13
Oct
-13
Jan
-14
Ap
r-1
4
Jul-
14
Oct
-14
Jan
-15
Ap
r-1
5
Jul-
15
Oct
-15
Jan
-16
Ap
r-1
6
Jul-
16
Oct
-16
Jan
-17
Ap
r-1
7
Jul-
17
Oct
-17
Jan
-18
Ap
r-1
8
OPERF NAV
15 years ending April 2018
($ in Millions)IAP OPERF
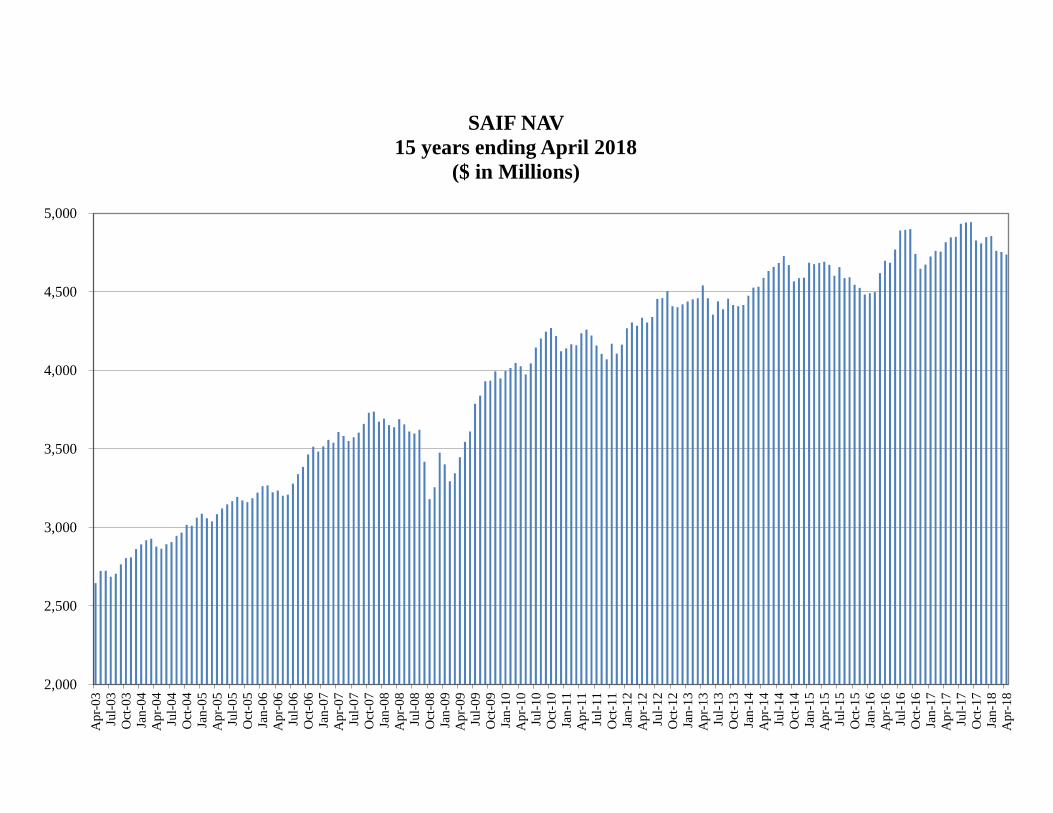
2,000
2,500
3,000
3,500
4,000
4,500
5,000
Ap
r-0
3
Jul-
03
Oct
-03
Jan
-04
Ap
r-0
4
Jul-
04
Oct
-04
Jan
-05
Ap
r-0
5
Jul-
05
Oct
-05
Jan
-06
Ap
r-0
6
Jul-
06
Oct
-06
Jan
-07
Ap
r-0
7
Jul-
07
Oct
-07
Jan
-08
Ap
r-0
8
Jul-
08
Oct
-08
Jan
-09
Ap
r-0
9
Jul-
09
Oct
-09
Jan
-10
Ap
r-1
0
Jul-
10
Oct
-10
Jan
-11
Ap
r-1
1
Jul-
11
Oct
-11
Jan
-12
Ap
r-1
2
Jul-
12
Oct
-12
Jan
-13
Ap
r-1
3
Jul-
13
Oct
-13
Jan
-14
Ap
r-1
4
Jul-
14
Oct
-14
Jan
-15
Ap
r-1
5
Jul-
15
Oct
-15
Jan
-16
Ap
r-1
6
Jul-
16
Oct
-16
Jan
-17
Ap
r-1
7
Jul-
17
Oct
-17
Jan
-18
Ap
r-1
8
SAIF NAV
15 years ending April 2018
($ in Millions)

400
600
800
1,000
1,200
1,400
1,600
1,800
Ap
r-0
3
Jul-
03
Oct
-03
Jan
-04
Ap
r-0
4
Jul-
04
Oct
-04
Jan
-05
Ap
r-0
5
Jul-
05
Oct
-05
Jan
-06
Ap
r-0
6
Jul-
06
Oct
-06
Jan
-07
Ap
r-0
7
Jul-
07
Oct
-07
Jan
-08
Ap
r-0
8
Jul-
08
Oct
-08
Jan
-09
Ap
r-0
9
Jul-
09
Oct
-09
Jan
-10
Ap
r-1
0
Jul-
10
Oct
-10
Jan
-11
Ap
r-1
1
Jul-
11
Oct
-11
Jan
-12
Ap
r-1
2
Jul-
12
Oct
-12
Jan
-13
Ap
r-1
3
Jul-
13
Oct
-13
Jan
-14
Ap
r-1
4
Jul-
14
Oct
-14
Jan
-15
Ap
r-1
5
Jul-
15
Oct
-15
Jan
-16
Ap
r-1
6
Jul-
16
Oct
-16
Jan
-17
Ap
r-1
7
Jul-
17
Oct
-17
Jan
-18
Ap
r-1
8
CSF NAV
15 years ending April 2018
($ in Millions)

TAB 9 – Calendar — Future Agenda Items

2018/19 OIC Forward Calendar and Planned Agenda Topics August 8, 2018: Private Equity Manager Recommendation Opportunity Portfolio Review Corporate Governance Update OIC Member Orientation Manual September 19, 2018: Q2 OPERF Performance & Risk Report CEM Benchmarking Report McKinsey Survey Results Presentation OSGP Annual Review October 31, 2018: Currency Program Review Public Equity Program Review General Consultant Recommendation December 12, 2018: Q3 OPERF Performance & Risk Report Fixed Income Program Review January 31, 2019: Private Equity Program Review Placement Agent Report 2020 OIC Calendar Approval March 13, 2019: Real Estate Program Review Q4 2018 OPERF Performance & Risk Report SAIF Annual Review April 24, 2019: OPERF Asset Allocation & Capital Market Assumptions Update Alternatives Portfolio Review Securities Lending Update OPERF Overlay Review June 5, 2019 Q1 OPERF Performance & Risk Report Operations Update CSF Annual Review