oram v. 5.0 quantitative score calibration last revised: august 15, · pdf file ·...
TRANSCRIPT

State of Ohio Wetland Ecology UnitEnvironmental Protection Agency Division of Surface Water
ORAM v. 5.0 Quantitative Score CalibrationLast Revised: August 15, 2000
John J. Mack
122 South Front Street, P.O. Box 1049 Columbus, Ohio 43216-1049

ii
Table of Contents
1.0 Introduction . . . . . . . . . . . . . . . . . . . . . . . . . . . . . . . . . . . . . . . . . . . . . . . . . . . . . . . . . . . . . . . . . . 3
2.0 VIBI general characteristics and calibration of the ORAM score and wetland categories. . . . . . 6
3.0 Comparison of ORAM v. 4.1 to v. 5.0. . . . . . . . . . . . . . . . . . . . . . . . . . . . . . . . . . . . . . . . . . . . . 11
4.0 Revised Scoring breakpoints for ORAM v. 4.1. . . . . . . . . . . . . . . . . . . . . . . . . . . . . . . . . . . . . . 13
5.0 Cautionary Statement. . . . . . . . . . . . . . . . . . . . . . . . . . . . . . . . . . . . . . . . . . . . . . . . . . . . . . . . . . 14
6.0 References . . . . . . . . . . . . . . . . . . . . . . . . . . . . . . . . . . . . . . . . . . . . . . . . . . . . . . . . . . . . . . . . . . 15
List of Tables
Table 1. Factors associated with wetlands that can be negatively impacted by human activities causingwetland degradation. . . . . . . . . . . . . . . . . . . . . . . . . . . . . . . . . . . . . . . . . . . . . . . . . . . . . . . . . . . . 3
Table 2. Interim scoring breakpoints for wetland regulatory categories for ORAM and VIBI scores. . . 7Table 3. Comparison of wetland categorization results for N=45 wetlands using quantitative score and
scoring breakpoints for ORAM v. 4.1 and 5.0 and the Vegetation IBI.. . . . . . . . . . . . . . . . . . . 12Table 4. A comparison of the categorization results for ORAM v. 4.1, 5.0, and the Vegetation IBI using a
data set the 45 wetlands used to derive the VIBI score.. . . . . . . . . . . . . . . . . . . . . . . . . . . . . . . . 12Table 5. Provisional Breakpoints between Wetland Categories in Ohio Rapid Assessment Method
Version 3.0, 4.0, and 4.1 Scoring Scheme. . . . . . . . . . . . . . . . . . . . . . . . . . . . . . . . . . . . . . . . . . 13Table 6. Breakpoints for Forested and Scrub-Shrub vegetation communities for Ohio Rapid Assessment
Method Version 3.0, 4.0, and 4.1 Scoring Scheme. . . . . . . . . . . . . . . . . . . . . . . . . . . . . . . . . . . 13
List of Figures
Figure 1. Ecoregions of Ohio, Indiana, and neighboring states. From Woods et al. 1998. . . . . . . . . . . 4Figure 2. VIBI scores for emergent (E), forested (F) and scrub-shrub(SS) vegetation communities versus
ORAM v. 5.0 score. Line is fitted line from linear regression of 45 wetland IBI scores. . . . . . . 8Figure 3. Box an whisker plots of emergent (E), forested (F), and scrub-shrub (SS) vegetation
community VIBI scores. A line is drawn across the box at the median. Number on line is meanVIBI score. Means with different letters were significantly different. . . . . . . . . . . . . . . . . . . . 8
Figure 4. Box an whisker plots of all VIBI scores by wetland condition. Dot is the mean score. Allmeans were significantly different from one another except “very poor” versus “poor”, “poor”versus “fair,” and “good” versus “reference” (df=44, F=35.27, p=<0.001). . . . . . . . . . . . . . . . 9
Figure 5. Box an whisker plots of all VIBI scores by wetland type (reference or nonreference condition,i.e. lacking in obvious human cultural influences). Dot is the mean score. Means weresignificantly different from one another (df=44, F=45.3, p=<0.001). . . . . . . . . . . . . . . . . . . . . . 9
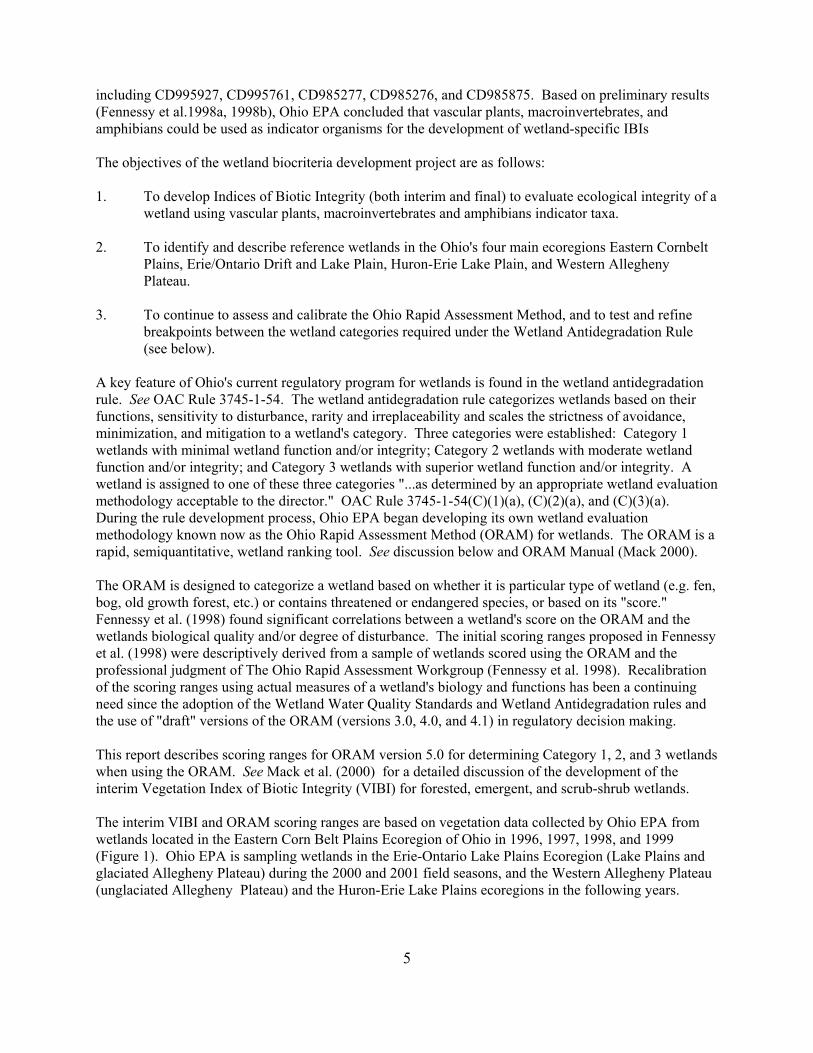
Figure 6. Box an whisker plots of all VIBI scores by wetland category as determined by the wetland'sVIBI score. Dot is the mean score. All means were significantly different from one another(df=44, F=93.78, p=<0.001). . . . . . . . . . . . . . . . . . . . . . . . . . . . . . . . . . . . . . . . . . . . . . . . . . . . 10
Figure 7. Interim VIBI scores and interim wetland categorization breakpoints for emergent, forested, andscrub-shrub wetland vegetation community classes and ORAM score for 45 wetlands in theEastern Corn Belt Plains Ecoregion of the State of Ohio. . . . . . . . . . . . . . . . . . . . . . . . . . . . . . 10
3
1.0 Introduction
A principal goal of the Clean Water Act is to maintain and restore the physical, chemical and biologicalintegrity of the waters of the United States. 33 U.S.C. §1251(a). Biological integrity has been defined as"...the capability of supporting and maintaining a balanced integrated, adaptive community of organismshaving a species composition, diversity, and functional organization comparable to that of natural habitatof the region (Karr and Dudley 1981).
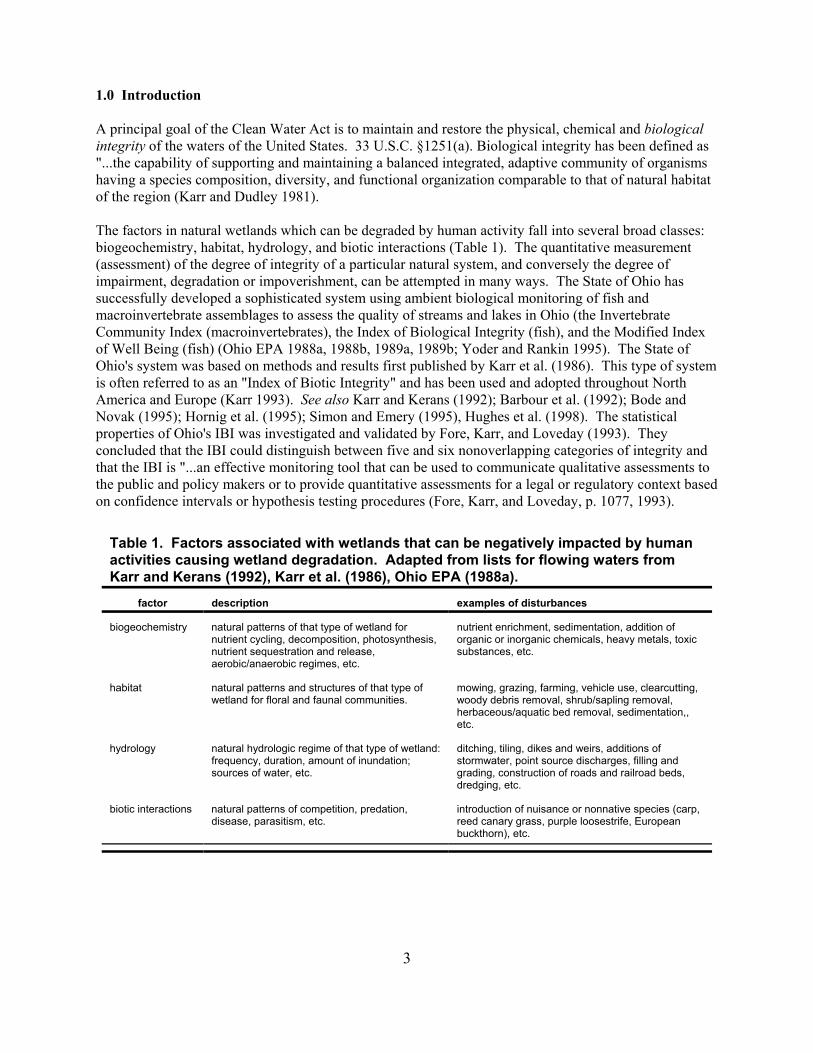
The factors in natural wetlands which can be degraded by human activity fall into several broad classes: biogeochemistry, habitat, hydrology, and biotic interactions (Table 1). The quantitative measurement(assessment) of the degree of integrity of a particular natural system, and conversely the degree ofimpairment, degradation or impoverishment, can be attempted in many ways. The State of Ohio hassuccessfully developed a sophisticated system using ambient biological monitoring of fish andmacroinvertebrate assemblages to assess the quality of streams and lakes in Ohio (the InvertebrateCommunity Index (macroinvertebrates), the Index of Biological Integrity (fish), and the Modified Indexof Well Being (fish) (Ohio EPA 1988a, 1988b, 1989a, 1989b; Yoder and Rankin 1995). The State ofOhio's system was based on methods and results first published by Karr et al. (1986). This type of systemis often referred to as an "Index of Biotic Integrity" and has been used and adopted throughout NorthAmerica and Europe (Karr 1993). See also Karr and Kerans (1992); Barbour et al. (1992); Bode andNovak (1995); Hornig et al. (1995); Simon and Emery (1995), Hughes et al. (1998). The statisticalproperties of Ohio's IBI was investigated and validated by Fore, Karr, and Loveday (1993). Theyconcluded that the IBI could distinguish between five and six nonoverlapping categories of integrity andthat the IBI is "...an effective monitoring tool that can be used to communicate qualitative assessments tothe public and policy makers or to provide quantitative assessments for a legal or regulatory context basedon confidence intervals or hypothesis testing procedures (Fore, Karr, and Loveday, p. 1077, 1993).
Table 1. Factors associated with wetlands that can be negatively impacted by humanactivities causing wetland degradation. Adapted from lists for flowing waters fromKarr and Kerans (1992), Karr et al. (1986), Ohio EPA (1988a).
factor description examples of disturbances
biogeochemistry natural patterns of that type of wetland fornutrient cycling, decomposition, photosynthesis,nutrient sequestration and release,aerobic/anaerobic regimes, etc.
nutrient enrichment, sedimentation, addition oforganic or inorganic chemicals, heavy metals, toxicsubstances, etc.
habitat natural patterns and structures of that type ofwetland for floral and faunal communities.
mowing, grazing, farming, vehicle use, clearcutting,woody debris removal, shrub/sapling removal,herbaceous/aquatic bed removal, sedimentation,,etc.
hydrology natural hydrologic regime of that type of wetland: frequency, duration, amount of inundation;sources of water, etc.
ditching, tiling, dikes and weirs, additions ofstormwater, point source discharges, filling andgrading, construction of roads and railroad beds,dredging, etc.
biotic interactions natural patterns of competition, predation,disease, parasitism, etc.
introduction of nuisance or nonnative species (carp,reed canary grass, purple loosestrife, Europeanbuckthorn), etc.

4
Figure 1. Ecoregions of Ohio, Indiana, and neighboring states. FromWoods et al. 1998.
The State of Ohio's indices are codified in Ohio Administrative Code Chapter 3745-1 and constitutenumeric "biological criteria" which are a part of the state's water quality standards required under theClean Water Act. See 33 U.S.C. §1313. Biological criteria are numerical values or narrative expressionsthat describe the reference biological integrity of natural communities (U.S. EPA 1990). It is important tostress that the overall index score resulting from an IBI, as well as each individual metric representtestable hypotheses as to how a natural system responds to human disturbance (Karr 1993). Attributes ofnatural communities are selected and predictions are made as to how the attribute will respond, e.g.increase or decrease; not change until a particular threshold is reached and then increase quickly; increaselinearly, or curvilinearly, etc. Moreover, the existing biological condition of a natural system is theintegrated result of the chemical, physical, and biological processes that comprise and maintain thesystem, and the biological condition of the system can be conceived as the integration or result of theseprocesses over time (Ohio EPA 1988a). The organisms, individually and as communities, are indicatorsof the actual conditions in that system since they inhabit the system and are subject to the variety ofnatural and human-caused variation (disturbance) to the system (Ohio EPA 1988a). In this regard,biological monitoring and biocriteria take advantage of this inherent integrative characteristic of the biotaof a system, whereas chemical and toxicity monitoring only represents a single point in time unlesscostly, continuous sampling over time is performed. Table 3 lists some of the advantages inherent inbiological monitoring.
"Wetlands" are a type of water of the United States and a water of the State of Ohio under federal andstate law. See e.g. Ohio Revised Code (ORC) §6111.01(H), OAC Rule 3745-1-02(B)(90), 33 CFR323.2(c). Until recently, wetlands in Ohio were only generically protected under state's water qualitystandards. On May 1, 1998, the State of Ohio adopted wetland water quality standards and a wetlandantidegradation rule. OAC Rules 3745-1-50through 3745-1-54. The water quality standardsspecify narrative criteria for wetlands andcreated the "wetland designated use." Alljurisdictional wetlands are assigned to the"wetland designated use." However, numericcriteria were not proposed since they had not yetbeen developed.
Ohio began working on the development ofbiological criteria for wetlands in 1996. To date,Ohio has sampled over 60 different wetlandslocated primarily in the Eastern Cornbelt PlainsEcoregion (Figure 1). These wetlands haveincluded isolated wetlands and wetlands locatedin riparian settings, wetlands dominated bypredominately emergent, forested, and scrubvegetation, wetlands located on the margins ofkettle lakes, and wetlands which can beclassified as fens and bogs. The wetlands beingstudied span the range of condition from?impacted” (i.e., those that have sustained arelatively high level of human disturbance) to?least-impaired” (i.e., the best quality sitesavailable). This work has been funded since1996 by several different U.S. EPA Region 5Wetland Program Development Grants
5
including CD995927, CD995761, CD985277, CD985276, and CD985875. Based on preliminary results(Fennessy et al.1998a, 1998b), Ohio EPA concluded that vascular plants, macroinvertebrates, andamphibians could be used as indicator organisms for the development of wetland-specific IBIs
The objectives of the wetland biocriteria development project are as follows:
1. To develop Indices of Biotic Integrity (both interim and final) to evaluate ecological integrity of awetland using vascular plants, macroinvertebrates and amphibians indicator taxa.
2. To identify and describe reference wetlands in the Ohio's four main ecoregions Eastern CornbeltPlains, Erie/Ontario Drift and Lake Plain, Huron-Erie Lake Plain, and Western AlleghenyPlateau.
3. To continue to assess and calibrate the Ohio Rapid Assessment Method, and to test and refinebreakpoints between the wetland categories required under the Wetland Antidegradation Rule(see below).
A key feature of Ohio's current regulatory program for wetlands is found in the wetland antidegradationrule. See OAC Rule 3745-1-54. The wetland antidegradation rule categorizes wetlands based on theirfunctions, sensitivity to disturbance, rarity and irreplaceability and scales the strictness of avoidance,minimization, and mitigation to a wetland's category. Three categories were established: Category 1wetlands with minimal wetland function and/or integrity; Category 2 wetlands with moderate wetlandfunction and/or integrity; and Category 3 wetlands with superior wetland function and/or integrity. Awetland is assigned to one of these three categories "...as determined by an appropriate wetland evaluationmethodology acceptable to the director." OAC Rule 3745-1-54(C)(1)(a), (C)(2)(a), and (C)(3)(a). During the rule development process, Ohio EPA began developing its own wetland evaluationmethodology known now as the Ohio Rapid Assessment Method (ORAM) for wetlands. The ORAM is arapid, semiquantitative, wetland ranking tool. See discussion below and ORAM Manual (Mack 2000).
The ORAM is designed to categorize a wetland based on whether it is particular type of wetland (e.g. fen,bog, old growth forest, etc.) or contains threatened or endangered species, or based on its "score." Fennessy et al. (1998) found significant correlations between a wetland's score on the ORAM and thewetlands biological quality and/or degree of disturbance. The initial scoring ranges proposed in Fennessyet al. (1998) were descriptively derived from a sample of wetlands scored using the ORAM and theprofessional judgment of The Ohio Rapid Assessment Workgroup (Fennessy et al. 1998). Recalibrationof the scoring ranges using actual measures of a wetland's biology and functions has been a continuingneed since the adoption of the Wetland Water Quality Standards and Wetland Antidegradation rules andthe use of "draft" versions of the ORAM (versions 3.0, 4.0, and 4.1) in regulatory decision making.
This report describes scoring ranges for ORAM version 5.0 for determining Category 1, 2, and 3 wetlandswhen using the ORAM. See Mack et al. (2000) for a detailed discussion of the development of theinterim Vegetation Index of Biotic Integrity (VIBI) for forested, emergent, and scrub-shrub wetlands.
The interim VIBI and ORAM scoring ranges are based on vegetation data collected by Ohio EPA fromwetlands located in the Eastern Corn Belt Plains Ecoregion of Ohio in 1996, 1997, 1998, and 1999(Figure 1). Ohio EPA is sampling wetlands in the Erie-Ontario Lake Plains Ecoregion (Lake Plains andglaciated Allegheny Plateau) during the 2000 and 2001 field seasons, and the Western Allegheny Plateau(unglaciated Allegheny Plateau) and the Huron-Erie Lake Plains ecoregions in the following years.

6
2.0 VIBI general characteristics and calibration of the ORAM score and wetland categories.
Vegetation Indices of Biotic Integrity (VIBIs) were developed for emergent, forested, and scrub-shrubwetland vegetation classes (Mack et al. 2000). The VIBI scores for wetland classes and condition werecompared and evaluated. Very strong linear trends were observed when VIBI scores for all wetlandswere compared to ORAM v. 5.0 score (Figure 2) (R2=84.5%, df=44, F=235.23, p<0.001).
In a comparison of mean VIBI scores among emergent, forested, and scrub-shrub wetlands using analysisof variance followed by Tukey's multiple comparison test, the emergent and forested classes were notsignificantly different from each other, although the scrub-shrub class was significantly different fromboth emergent and forested classes (df=44, F=6.3, p=0.004) (Figure 3). However, this difference wascaused by the lack of low and medium quality scrub-shrub communities in the data set. Thus, VIBI scoreappears to have a standardizing effect on natural variation caused by differences in dominant vegetation.
Significant differences were also observed between qualitatively assigned wetland “condition” categories(very poor, poor, fair, good, reference) as well as between reference and nonreference condition wetlands(Figures 4 and 5). Finally, very significant differences were observed between the VIBI score ofCategory 1, 2, and 3 wetlands (Figure 6) (df=44, F=67.7, p<0.001). Therefore, the VIBI appears to beable to discriminate between at least three to four different categories of wetland quality/disturbance. This finding comports with the results of Fore, Karr, and Loveday (1993) who concluded that the state ofOhio's stream IBI could distinguish between five and six nonoverlapping categories of integrity.
The final step in development of the VIBI was using the biologically-derived index to calibrate the scorefor the Ohio Rapid Assessment Method for Wetlands, which is a qualitative habitat/functional assessmentmethod. Recalibration of the scoring ranges using actual measures of a wetland's biology and functionshas been a continuing need since the adoption of the State of Ohio's Wetland Water Quality Standardsand Wetland Antidegradation rules and the use of "draft" versions of the ORAM (versions 3.0, 4.0, and4.1) in regulatory decision making.
Figure 7 summarizes the results from calibrating the ORAM using the VIBI scores for forested, emergent,and scrub-shrub wetland vegetation community classes. Four wetland integrity categories aredistinguished: Category 1, modified Category 2, Category 2, and Category 3. Because of the very stronglinear, dose-response relationship observed in the VIBI scores, the 95th percentile of the overalldistribution of scores (89.6) was quadrisected resulting in the four IBI categories on the right side of thefigure (Karr and Chu 1999). Quadrisection of the 95th percentile of the ORAM score (78.8) wasevaluated but resulted in category breakpoints in which only one or two wetland s would have beencategorized as Category 1. Because of this breakpoints for the ORAM score were visually assigned basedon the VIBI score distribution and category breakpoints assigned by quadrisection. A 5% “gray zone”was placed below the cutoff for each main regulatory category. Scoring ranges are summarized in Table23.
Comparing the IBI determined category to the ORAM determined category, 1 site was "overscored "bythe ORAM (2.5%), 5 sites were "underscored" by the ORAM (11.1%, two in the category 1-2 (4.9%) and3 in the category 2 to 3 (6.7%)). However, 3 of the underscored sites were scrub-shrub wetlands and thismay be an artifact of the procedure for calculating scrub-shrub IBIs. Five sites (11.1%) were located inthe gray zone.
It should be noted that scoring breakpoints have been developed based on the scoring and study ofwetlands located primarily in the Eastern Corn Belt Plains (ECBP) Ecoregion (Figure 1; Omernik 1987;US EPA 1997). Ohio EPA will be studying wetlands in other ecoregions of Ohio in the coming years,

7
but persons using these scoring ranges and breakpoints should keep in mind that they have beencalibrated based on biological data obtained from predominately depressional wetlands located in theEastern Corn Belt Plains Ecoregion. Thus, they should be applied with caution to wetlands located inother ecoregions of the state and to wetlands of other vegetation types and other landscape settings. OhioEPA has found significant ecoregional differences in streams, and this may also be the case for wetlands(Ohio EPA 1988a, 1988b, 1989). Ohio EPA will be studying wetlands in the Erie-Ontario Lake Plains(including the glaciated Allegheny Plateau) in 2001 and 2002, and in the Huron-Erie Lake Plains andWestern Allegheny Plateau Ecoregions in subsequent years.
Table 2. Interim scoring breakpoints for wetlandregulatory categories for ORAM and VIBI scores.
category ORAM v. 5.0 score VIBI score
1 0 - 29.9 0 - 21
1 or 2 gray zone 30 - 34.9 ----
modified 2 35 - 44.9 22 - 44
2 45 - 59.9 45 - 66
2 or 3 60 - 64.9 ----
3 65 - 100 67 - 100

8
E F SS
0 10 20 30 40 50 60 70 80 90 100
0
1020
30
40
5060
70
8090
100
ORAM v5.0 score
VIB
I sco
re
Regression Plot
Y=-8.44267 + 1.18728X
R-sq=84.5%, df=44, F=235.2, p<0.001
Figure 2. VIBI scores for emergent (E), forested (F) and scrub-shrub(SS) vegetation communities versus ORAM v. 5.0 score. Lineis fitted line from linear regression of 45 wetland IBI scores.
SSFE
100
9080
70
6050
40
30
2010
0
Primary Vegetation Community
VIB
I sco
re
42.2a
53.3a
72.0b
Figure 3. Box an whisker plots of emergent (E), forested (F), and scrub-shrub (SS) vegetation community VIBI scores. A line is drawn across thebox at the median. Number on line is mean VIBI score. Means withdifferent letters were significantly different. The bottom of the box is at thefirst quartile (Q1), and the top is at the third quartile (Q3) value. The whiskers are the lines that extend from the top and bottom of the box to theadjacent values. The adjacent values are the lowest and highestobservations that are still inside the region defined by the following limits:Lower Limit = Q1 - 1.5 (Q3 - Q1); Upper Limit = Q3 + 1.5 (Q3 - Q1). Outliers are points outside of the lower and upper limits and are plotted withasterisks (*).

9
0
10
20
30
40
50
60
70
80
90
100
reference
VIB
I sco
re
nonreference
Figure 4. Box an whisker plots of all VIBI scores by wetland type (reference ornonreference condition, i.e. lacking in obvious human cultural influences). Dot is themean score. Means were significantly different from one another (df=44, F=45.3,p=<0.001). A line is drawn across the box at the median. The bottom of the box isat the first quartile (Q1), and the top is at the third quartile (Q3) value. The whiskersare the lines that extend from the top and bottom of the box to the adjacent values.The adjacent values are the lowest and highest observations that are still inside theregion defined by the following limits: Lower Limit = Q1 - 1.5 (Q3 - Q1); Upper Limit= Q3 + 1.5 (Q3 - Q1).
ver
y p
oor
refe
renc
e
fair
good
poor
100
90
80
70
60
50
40
30
20
10
0
VIB
I sco
re
Figure 5. Box an whisker plots of all VIBI scores by wetland condtion. Dot is themean score. All means were significantly different from one another except “verypoor” versus “poor”, “poor” versus “fair,” and “good” versus “reference” (df=44,F=35.27, p=<0.001). A line is drawn across the box at the median. The bottom ofthe box is at the first quartile (Q1), and the top is at the third quartile (Q3) value. The whiskers are the lines that extend from the top and bottom of the box to the adjacentvalues. The adjacent values are the lowest and highest observations that are stillinside the region defined by the following limits: Lower Limit = Q1 - 1.5 (Q3 - Q1); Upper Limit = Q3 + 1.5 (Q3 - Q1).
10
0
10
20
30
40
50
60
70
80
90
100
Category 1
VIBI
sco
re
Category 2 Category 3
Figure 6. Box an whisker plots of all VIBI scores by wetland category asdetermined by the wetland's VIBI score. Dot is the mean score. All means weresignificantly different from one another (df=44, F=93.78, p=<0.001). Line across thebox is the median. The bottom of the box is at the first quartile (Q1), and the top isat the third quartile (Q3) value. The whiskers are the lines that extend from the topand bottom of the box to the adjacent values. The adjacent values are the lowestand highest observations that are still inside the region defined by the followinglimits: Lower Limit = Q1 - 1.5 (Q3 - Q1); Upper Limit = Q3 + 1.5 (Q3 - Q1).
E FSS
1009080706050403020100
100
90
80
70
60
50
40
30
20
10
0
3rd=67.3
2nd=44.9
1st=22.4
ORAM v5.0 score
VIB
I sco
re
category 1
1 to
2 g
ray
zon
e
2 to
3 g
ray
zon
e
category 3category 2
cat 2modified
cat 2
disturbancelow quality high
disturbancehigh quality low
category 1
category 2
category 3
Act
ual b
iolo
gica
lly d
erive
d C
ateg
ory
Category using biologically calibrated ORAM score
35 45 65
Figure 7. Interim VIBI scores and interim wetland categorization breakpoints for emergent, forested, and scrub-shrub wetlandvegetation community classes and ORAM score for 45 wetlands in the Eastern Corn Belt Plains Ecoregion of the State of Ohio.
11
3.0 Comparison of ORAM v. 4.1 to v. 5.0.
Users familiar with earlier versions of the ORAM should find the approach discussed here to be familiarto that used in the prior versions. It is not intended or expected that wetlands evaluated under earlierversions of the ORAM, and any certification and permitting decisions based on those evaluations,should be rescored or reconsidered using v. 5.0. Version 5.0 should be used for applications pendingas of the effective date of ORAM v. 5.0 and for applications received after that date. A detailedcomparison of versions 4.1 and 5.0 can be found in the Section 1.4 ORAM users manual as well as in thediscussion of many of the individual questions, however, several points will be reemphasized here.
First, the score from the Quantitative Rating now ranges from 0 to 100, whereas, under earlier versions ofthe ORAM the score ranged from 0 to some indeterminable limit (high 50s to low 60s). Ohio EPAbelieves that a 100 point provides several advantage: 1) it has a definite maximum, 2) it is a much moreintuitive base 10 scale, and 3) it provides a greater range of scores, allowing for more visual “spread”when graphing the score versus quantitative biological data.
Second, one of the main shortcomings of earlier versions of the ORAM was a failure to expressly addressthe hydrology (and human modifications thereto) of a wetland and also human alterations to the wetlandsnatural habitat. These two factors account for much, if not most, of the possible disturbances to awetland, and to the wetlands perceived overall “quality.” Earlier versions of the ORAM addressed“human disturbance” in an indirect fashion, if at all, and did not expressly address all aspects of awetland’s hydrology, except qualitatively as in Question 1 of the Qualitative Rating in ORAM v. 4.0.
Finally, one of the other major shortcomings to prior versions of the ORAM was a clear preference forwetlands located near streams and discrimination against groundwater-driven or precipitation-drivendepressional systems. In addition, earlier versions of the ORAM assigned 40-60% of the total points awetland might obtain to an enumeration of the number of vegetation communities >0.25 acres in size andthe number of species in those communities with an areal cover >10%. However, earlier versions of theORAM did not include an express evaluation of the importance or quality of those vegetationcommunities for that wetland, or whether the species present were merely invasive weeds anddisturbance-tolerant native plants. These problems led to both overscoring of low quality, highlydisturbed wetlands that happened to have multiple vegetation classes and/or proximity to surface waters,as well as underscoring of high quality, undisturbed, depressional wetlands with a single vegetation class. The categorization results of ORAM v. 4.1 and 5.0 scores were compared to each other and to thecategory determined by the VIBI score (Tables 3 and 4). Basing categorization solely on the quantitativescore, version 4.1 and version 5.0 reached the same result 55% of the time; 29% of the time version 4.1assigned a lower category and 7% of the time a higher category (Table 3). When version 4.1 wascompared to the VIBI score, similar percentages were found (Table 3).
Version 5.0 increased the number of wetlands in both the lowest and highest categories (1 and 3) andreduced the number of wetlands in the "gray zones" between categories when compared with version 4.1(Table 4). Version 4.1 seriously over- and under-categorized forested and scrub-shrub wetlands. Usingthe version 4.1 score, no forested wetlands were found to be Category 1 or 3, versus 3 Category 1's and 5Category 3's using version 5.0, and 2 Category 1's and 4 Category 3's using the VIBI score. This was dueto version 4.1's emphasis on horizontal vegetation community classes and bias towards wetlands locatedin riparian settings. Forested wetlands usually have only a single vegetation class and are often inisolated landscape positions.
In contrast, emergent wetlands were similarly categorized by all three methods. Overall, ORAM v. 5.0

12
and its biologically defined scoring ranges, better defined the breaks between the regulatory classes andwas more sensitive to differences in wetland quality.
Table 3. Comparison of wetland categorization results for N=45wetlands using quantitative score and scoring breakpoints for ORAMv. 4.1 and 5.0 and the Vegetation IBI. "Same category" means themethods being compared reached the same categorization results. "1st lower than 2nd" means the first method listed assigned thewetland to a lower category than the 2nd method. "1st higher than 2nd"means the first method assigned the method to a higher categorythan the second method.
4.1 versus 5.0 4.1 versus VIBI 5.0 versus VIBI
same category 25 (55%) 22 (49%) 34 (75%)
1st lower category than 2nd 13 (29%) 16 (36%) 8 (18%)
1st higher category than 2nd 7 (15%) 7 (15%) 3 (7%)
Table 4. A comparison of the categorization results for ORAM v. 4.1, 5.0, and theVegetation IBI using a data set the 45 wetlands used to derive the VIBI score. Note thatpercentages should not be considered reflective of percentages of wetlands in Ohiothat would be assigned to these categories but only of this data set.
Category 1 1 or 2 2 2 or 3 3
by All
v. 4.1 4 (9%) 5 (11%) 25 (58%) 5 (11%) 5 (11%)
v. 5.0 8 (18%) 1 (2%) 20 (44%) 2 (4%) 14 (31%)
VIBI 6 (13%) na 22 (49%) na 17 (37%)
by Forested
v. 4.1 0 (0%) 2 (4%) 13 (29%) 1 (2%) 0 (0%)
v. 5.0 3 (7%) 0 (0%) 7 (16%) 1 (2%) 5 (11%)
VIBI 2 (4%) na 10 (22%) na 4 (9%)
by Emergent
v. 4.1 4 (9%) 3 (7%) 8 (18%) 0 (0%) 2 (4%)
v. 5.0 5 (11%) 1 (2%) 8 (18%) 0 (0%) 3 (7%)
VIBI 4 (9%) na 10 (22%) na 3 (7%)
by Scrub-Shrub
v. 4.1 0 (0%) 0 (0%) 5 (11%) 4 (9%) 3 (7%)
v. 5.0 0 (0%) 0 (0%) 5 (11%) 1 (2%) 6 (13%)
VIBI 0 (0%) na 2 (4%) na 10 (22%)
13
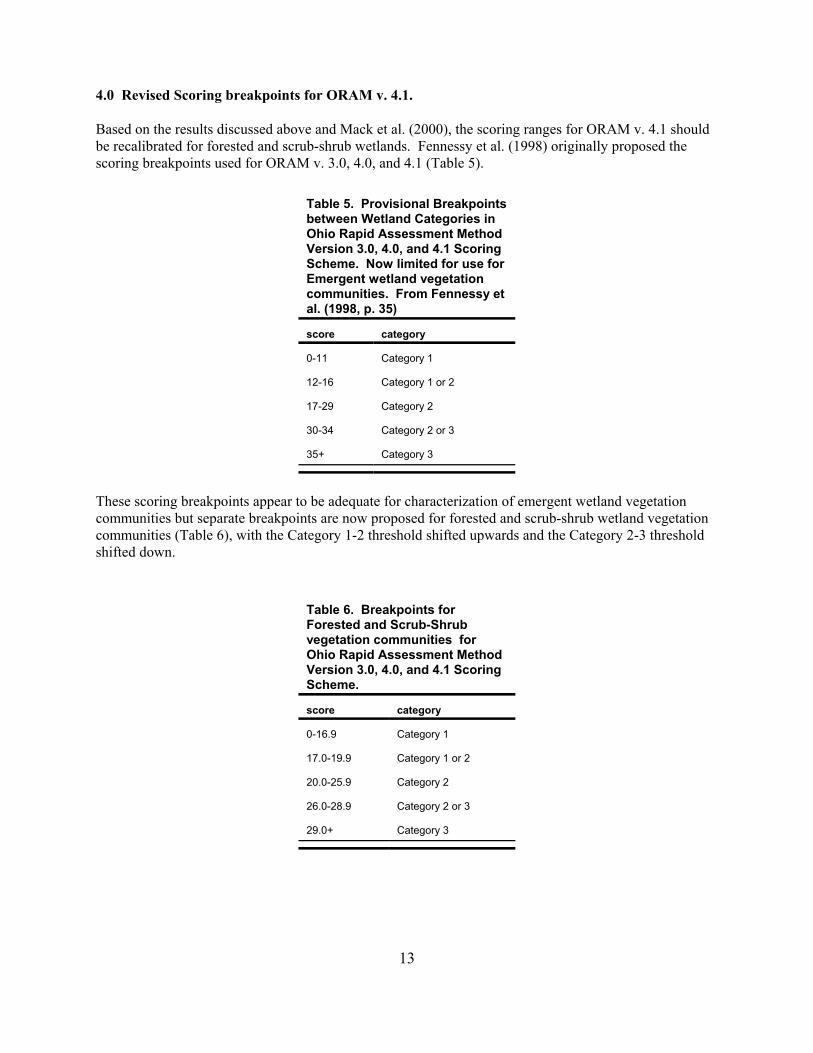
4.0 Revised Scoring breakpoints for ORAM v. 4.1.
Based on the results discussed above and Mack et al. (2000), the scoring ranges for ORAM v. 4.1 shouldbe recalibrated for forested and scrub-shrub wetlands. Fennessy et al. (1998) originally proposed thescoring breakpoints used for ORAM v. 3.0, 4.0, and 4.1 (Table 5).
Table 5. Provisional Breakpointsbetween Wetland Categories inOhio Rapid Assessment MethodVersion 3.0, 4.0, and 4.1 ScoringScheme. Now limited for use forEmergent wetland vegetationcommunities. From Fennessy etal. (1998, p. 35)
score category
0-11 Category 1
12-16 Category 1 or 2
17-29 Category 2
30-34 Category 2 or 3
35+ Category 3
These scoring breakpoints appear to be adequate for characterization of emergent wetland vegetationcommunities but separate breakpoints are now proposed for forested and scrub-shrub wetland vegetationcommunities (Table 6), with the Category 1-2 threshold shifted upwards and the Category 2-3 thresholdshifted down.
Table 6. Breakpoints forForested and Scrub-Shrubvegetation communities for Ohio Rapid Assessment MethodVersion 3.0, 4.0, and 4.1 ScoringScheme.
score category
0-16.9 Category 1
17.0-19.9 Category 1 or 2
20.0-25.9 Category 2
26.0-28.9 Category 2 or 3
29.0+ Category 3

14
5.0 Cautionary Statement.
The Ohio Rapid Assessment Method is designed to aid in the determination of wetland categories asdefined in Ohio's Wetland Antidegradation Rule (OAC Rule 3745-1-54). As such, the method isdesigned to identify the appropriate level of regulatory protection a particular wetland should receive. It isnot designed or intended to be used to determine a particular wetland's ecologic or human value. The useof the Ohio Rapid Assessment Method should not be considered as a substitute, and is not intended to bea substitute, for detailed studies of the functions and biology of a wetland. In addition, while the scoreand conclusions of the ORAM are designed such that they correlate well with more detailed measures ofthe biology of wetland, they are not, and should not, be considered absolutely definitive.
While every effort has been made to reduce the failure rate, and to increase the usability of the method,the Rate should be aware that as a "rapid", "qualitative" procedure, the method, and especially, thequantitative score may incorrectly categorize a wetland. In all instances, the definitions andrequirements found in OAC Rule 3745-1-54 are ultimately controlling, and in the event of a conflictbetween the ORAM and the rule, the definitions and requirements of the rule control.

15
6.0 References
Barbour, Michael T., James B. Stribling, and James R. Karr. 1995. Multimetric approach for establishingand measuring biological condition. In Biological Assessment and Criteria, Tools for Water ResourcePlanning and Decision Making, Eds. Wayne S. Davis and Thomas P. Simon, CRC Press, Inc.
Barbour, Michael T., James L. Plafkin, Brian P. Bradley, Carol G. Graves, and Robert W. Wisseman. 1992. Evaluation of EPA's rapid bioassessment benthic metrics: metric redundancy and variabilityamong reference sites. Environmental Toxicology and Chemistry, 11:437-449.
Bode, Robert W. and Margaret A. Novak. 1995. Development and application of biological impairmentcriteria for rivers and streams in New York state. in Biological Assessment and Criteria, Tools for WaterResource Planning and Decision Making, Eds. Wayne S. Davis and Thomas P. Simon, CRC Press, Inc.
Fennessy, M. Siobhan, Michael A. Gray, and Ricardo D. Lopez (1998). An ecological assessment ofwetlands using reference sites Volume 1: Final Report, Volume 2: Appendices. Final Report to U.S.Environmental Protection Agency. Wetlands Unit, Division of Surface Water. Grant CD995761-01.
Fore, Leska K., James R. Karr, and Loveday L. Conquest. 1994. Statistical properties of an index ofbiological integrity used to evaluate water resources. Canadian Journal of Fisheries and Aquatic Science,51:1077-1087.
Hughes, Robert M., Philip R. Kaufman, Alan T. Herlihy, Thomas M. Kincaid, Lou Reynolds, and DavidP. Larsen. 1998. A process for developing and evaluating indices of fish assemblage integrity. CanadianJournal of Fisheries and Aquatic Sciences, 55:1618-1631.
Hornig, C. Evan, Charles W. Bayer, Steve R. Twidwell, Jack R. Davis, Roy J. Kleinsasser, Gordon W.Linam, and Kevin B. Mayes. 1995. Development of regionally based biological criteria in Texas. inBiological Assessment and Criteria, Tools for Water Resource Planning and Decision Making, Eds.Wayne S. Davis and Thomas P. Simon, CRC Press, Inc.
Karr, James R. 1993. Defining and assessing ecological integrity: beyond water quality. EnvironmentalToxicology and Chemistry, 12:1521-1531.
Karr, James R., and Ellen W. Chu. 1997. Biological monitoring and assessment: Using multimetricindexes effectively. U.S. Environmental Protection Agency, EPA 235-R97-001. University of Washington, Seattle.
Karr, James R., and Ellen W. Chu. 1999. Restoring life in running waters: better biological monitoring. Island Press, Washington, D.C.
Karr, James R., and Daniel R. Dudley. 1981. Ecological perspective on water quality goals. Environmental Management 5(1):55-68.
Karr, James R., and Billie L. Kerans. 1992. Components of biological integrity: their definition and usein development of an invertebrate IBI. In Proceedings of the 1991 Midwest Pollution Control BiologistsMeeting: Environmental Indicators Measurement Endpoints. T.P. Simon and W. S. Davis, Eds. U.S.Environmental Protection Agency, Region V, Environmental Sciences Division, Chicago, Ill. EPA905/R-92/003.

16
Mack, John J., Mick Micacchion, Lauren D. Augusta, and Gregg R. Sablak. 2000. Vegetation Indices ofBiotic Integrity (VIBI) for Wetlands and Calibration of the Ohio Rapid Assessment Method for Wetlandsv. 5.0. Final Report to U.S. EPA Grant No. CD985276, Interim Report to U.S. EPA Grant No.CD985875, Volume 1. Ohio Environmental Protection Agency, Division of Surface Water, WetlandEcology Unit, Columbus, Ohio.
Micacchion, Mick, Michael A. Gray, and John J. Mack. 2000. Amphibian and MacroinvertebrateAttributes for Wetlands. Final Report to U.S. EPA Grant No. CD985276, Interim Report to U.S. EPAGrant No. CD985875, Volume 2. Ohio Environmental Protection Agency, Division of Surface Water,Wetland Ecology and Ecological Assessment Units, Columbus, Ohio.
Ohio EPA. 1988a. Biological Criteria for the Protection of Aquatic Life: Volume I. The role ofbiological data in water quality assessment. Ohio Environmental Protection Agency, EcologicalAssessment Section, Division of Water Quality Planning and Assessment, Columbus, Ohio.
Ohio EPA. 1988b. Biological Criteria for the Protection of Aquatic Life: Volume II. Users Manual for biological field assessment of Ohio surface waters. Ohio Environmental Protection Agency, EcologicalAssessment Section, Division of Water Quality Planning and Assessment, Columbus, Ohio.
Ohio EPA. 1989a. September 30, 1989 Addendum to Biological Criteria for the Protection of AquaticLife: Volume II, 1988. Ohio Environmental Protection Agency, Ecological Assessment Section, Divisionof Water Quality Planning and Assessment, Columbus, Ohio.
Ohio EPA. 1989b. Biological Criteria for the Protection of Aquatic Life: Volume III. StandardizedBiological Field Sampling and Laboratory Methods for Assessing Fish and MacroinvertebrateCommunities. Ohio Environmental Protection Agency, Ecological Assessment Section, Division ofWater Quality Planning and Assessment, Columbus, Ohio.
Omernik, J. M. 1987. Ecoregions of the conterminous United States. Annals of the Association ofAmerican Geographers 77:118-125.
Rankin, Edward T. 1989. The Qualitative Habitat Evaluation Index [QHEI]: Rationale, Methods, andApplication. Ecological Assessment Section, Division of Water Quality Planning and Assessment, OhioEnvironmental Protection Agency, Columbus, Ohio.
Rankin, Edward T. 1995. Habitat indices in water resource quality assessments. In BiologicalAssessment and Criteria, Tools for Water Resource Planning and Decision Making, Eds. Wayne S. Davisand Thomas P. Simon, CRC Press, Inc.
Simon, Thomas P. and Erich B. Emery. 1995. Modification and assessment of an index of bioticintegrity to quantify water resource quality in great rivers. Regulated Rivers: Research & Management11:283-298.
Yoder , Chris O, and Edward T. Rankin. 1995. Biological Criteria Program Development andImplementation In Ohio. In Biological Assessment and Criteria, Tools for Water Resource Planning andDecision Making, Eds. Wayne S. Davis and Thomas P. Simon, CRC Press, Inc.