optoelectronic capillary sensors in microfluidic and point-of
TRANSCRIPT

Sensors 2010, 10, 3771-3797; doi:10.3390/s100403771
sensors ISSN 1424-8220
www.mdpi.com/journal/sensors
Review
Optoelectronic Capillary Sensors in Microfluidic and Point-of-Care Instrumentation
Michał Borecki 1,*, Michael L. Korwin-Pawlowski 2, Maria Beblowska 1, Jan Szmidt 1 and
Andrzej Jakubowski 1
1 Institute of Microelectronics and Optoelectronics, Warsaw University of Technology, Koszykowa
75, 00-662 Warsaw, Poland; E-Mails: [email protected] (M.B.);
[email protected] (J.S.); [email protected] (A.J.) 2 Département d’informatique et d’ingénierie, Université du Québec en Outaouais, 101 rue
Saint-Jean-Bosco, Gatineau, QC J8X 3X7, Canada; E-Mail: [email protected]
* Author to whom correspondence should be addressed; E-Mail: [email protected];
Tel.: +48-22-234-7749; Fax: +48-22-628-8740.
Received: 15 February 2010; in revised form: 10 March 2010 / Accepted: 30 March 2010 /
Published: 14 April 2010
Abstract: This paper presents a review, based on the published literature and on the
authors’ own research, of the current state of the art of fiber-optic capillary sensors and
related instrumentation as well as their applications, with special emphasis on point-of-care
chemical and biochemical sensors, systematizing the various types of sensors from the point
of view of the principles of their construction and operation. Unlike classical fiber-optic
sensors which rely on changes in light propagation inside the fiber as affected by outside
conditions, optical capillary sensors rely on changes of light transmission in capillaries filled
with the analyzed liquid, which opens the possibility of interesting new applications, while
raising specific issues relating to the construction, materials and instrumentation of those
sensors.
Keywords: fiber-optic sensors; photonic sensors; optical capillaries; optical fibers; chemical
sensors; optochemical sensors; capillary sensors; liquid-core sensors; hollow-core sensors;
biochemical sensors
OPEN ACCESS

Sensors 2010, 10
3772
1. Introduction
Chemical and biochemical sensors using optical fibers as sensing elements are the subject of
reviews and books, of which notable are the biennial reviews of Wolfbeis [1-4] and among the recent
book publications, those by Ringhini, Tajani and Cutolo [5] and by Baldini, Chester, Homola and
Martellucci [6]. A distinct sub-class is sensors utilizing fiber optic capillaries and optical waveguides
as sensing heads for chemical and biochemical applications. Among the reviews covering this type of
sensors are [7,8] as well as more recent reviews of Baldini and Giannetti [9].
Perhaps the most ambitious project involving fiber optic capillary sensors was the European Union
IST-FP6 Integrated Project CLINICIP [10]. The project involved in the 2004-2007 period 15 European
institutions and had as its main objective the development of a low-risk monitoring and control system
which would allow maintaining metabolic control of critically ill patients in an intensive care unit. The
system monitored patient blood glucose and also allowed monitoring of O2, pH and CO2 levels. Three
types of sensors were developed and evaluated in the course of the project, based on amperometric,
infrared spectrometric and fluorometric fiber optic principles. Although in the final instance the latter
was terminated in the project due its unsatisfactory performance as glucose sensor, it had been further
developed as a competing technology and back-up system [10].
In this paper we present a review of fiber optic capillary sensors (FOCap), trying to classify them
primarily from the standpoint of construction and instrumentation, rather than from the standpoint of
applications. Capillary sensors can be considered a sub-set of liquid-core sensors or hollow-core
sensors, examples of which are provided [11-20]. Much attention was been drawn to the two latter
sub-classes in their advanced form of photonic bandgap fibers or microstructured optical fibers. Those
devices often are built to perform similar sensing functions and may be used in similar kinds of
applications as the FOCaps. We will be focusing on the simple instruments using short sections of
FOCaps as sensing elements, not merely as conduits of fluids.
There are many advanced optoelectronic and fiber-optic sensors for examining liquids whose
operation is based on precise control of the volumes and movement of liquids within the sensing head.
This control is possible when capillary fibers are being used, as is the case in electrophoresis systems
and liquid capillary waveguide cells. A very important step toward increased use of microfluidic
sensing is reduction of the total sample volume, as distinct from the volume under examination. This
distinction can be better explained if we take the case of a micropump used to introduce a sample into
a sensor head. One can have small sample volume under examination even though relatively large
volumes of the sampled liquid have to be drawn, and are wasted. When the liquid wets the capillary
walls, the volume of the sample can be reduced because the capillary can perform multiple functions:
it can serve as a micropump, as a sample holder and as the head of the optoelectronic sensor. Another
problem encountered in many biological applications, especially in point-of-care applications, is the
need for one-time utilization of the sensing capillary. The cost of single-use sensors can be reduced by
dividing the sensor head into a disposable capillary optrode and a durable head base–but this
introduces the problem of repeated coupling of the capillary with the optoelectronic leads of the
system. The last important problem in microfluidic sampling is identification. This can be done by
using single- or multi-parametric processing. Single-parameter processing employs selective sensing
layers of chemical or biological transducers. Layers that are chemically sensitive may have many

Sensors 2010, 10
3773
components which often include pH optical indicator dyes, while biologically sensitive layers consist
of antibody or microorganisms immobilized in the film material. Multi-parameter processing uses the
information obtained from a sample as it is subjected to external stimulus such as local heating during
the measuring cycle. Application of heating can cause many reactions, for example: a phase change
from liquid to gas and back again to liquid, or a change of measurable sample parameters such as the
index of refraction or light-scattering properties. The information collected during the measuring cycle
has an indirect relation with the investigated sample parameters and can be used for sample
classification by an artificial neural network (ANN).
The best known capillary sensors use the principle of indirect measurement, with the liquid acting
as a transducer of temperature or pressure into visible information [8]. For example, an alcohol
thermometer has two important elements: the sensor head and the elements that enable conversion of
the information from the thermal expansion of a liquid into a temperature reading. The sensor head is a
bulb connected with a capillary. The converting elements can consist of optoelectronic circuits. When
the temperature can be independently measured and controlled, the changes induced in the liquid by a
change of temperature can be used to sense thermal expansion of the liquid. This thermal expansion is
affected by the atmospheric pressure outside the liquid and by the capillary action. When at least one
of the capillary ends is open, the liquid flow can be examined. The flow of liquid through the capillary
is affected by its viscosity [21]. When the temperature of the sample filling the capillary crosses the
boiling point of that particular liquid, the flow is non-uniform because a bubble is formed inside the
capillary. If the capillary is illuminated, this bubble can induce light switching (LS). Temperature
changes can also induce changes in light scattering in the examined sample and in the sample’s index
of light refraction that can be detected by optoelectronic circuits [22]. The sensitivity to refractive
index changes as found by measuring the wavelength shift of whispering-gallery-mode resonance is
greater than in other microcavities [23]. The information collected can be converted into a liquid
finger-print that can then be used in classifying samples of liquids examined by means of fiber-optic
capillary (FOCap) sensors.
Figure 1. Examples of optical signal path in capillary heads.
nnn n
c
tl t
=1.441=1.458
<
n
n n
n
n n
n >n
c
c c
t
t t
l t
=
= =
1
1 1
.
. .
4
4 4
4
4 4
1
1 1
=
=
1
1
.
.459
29CladdingWall (glass)Hole with liquid
TIR
Light source TIR
CladdingWall (Teflon AF)Hole with liquid
Cladding (window)Wall (glass)Hole with liquid
Light source
Light source
Light source
TIR
Cladding (window)WallHole with liquid and bubble Switch
from holeto wall
FOCap: LCW:
CE: LS:
The index of refraction and the light-scattering properties of a liquid sample depend on its
composition. Information about sample composition can be processed with high accuracy in liquid

Sensors 2010, 10
3774
capillary waveguide (LCW) cells connected to an optical spectroscope. Capillaries can be also used for
liquid composition separation which is the principle of capillary electrophoresis (CE). Examples of
possible optical configurations of capillary heads and variant light paths are presented in Figure 1.
Other constructions of optical capillary sensors are also possible, for example, using liquid-core optical
ring resonators [24].
2. Laboratory Microfluidic Systems
Microfluidic systems in such forms as labs-on-chips (LoCs), micro-total-analysis systems (Tas),
and liquid chromatography (LC) or capillary electrophoresis (CE) and optical coherence tomography
systems (OCT) are currently used in the laboratory environment. Such systems are both complex and
costly [25]. Work is underway to develop a fully integrated chip-scale optical sensing system. One of
the first steps in this direction was the active thin-film compound semiconductor optical device
integrated with a digital microfluidic platform presented in [26].
2.1. Precise control of Fluid Volumes and Movement in the Sensing Heads
Small fluid volumes of micro- and nano-liters must be precisely controlled in any microfluidic
system or sensor. The setup commonly used for liquid volume and movement control is presented in
Figure 2. LoCs and Tas may have integrated pumps [27].
Figure 2. The setup for control of the volume and movement of liquid.
Pump; Vp
Intakevalve; Viv
Microfluidichead; Vmfh
Outletvalve; Vov
Polymertubing; Vt
Container with sample; Vsc
Container with
; waste Vsc
Such a setup requires samples with a relatively large volume Vs which is the sum of the volumes
contained in the various components as illustrated in Figure 2:
tovmfhivps VVVVVV (1)
Since the examined sample volume Ves is part of the volume in the microfluidic head, it follows
that:
mfhes VV (2)
This type of setup can be used during the analysis or design of microfluidic devices or when the
volume to be sampled is extensive, for example, when river, lake or sea water is being monitored.
Systems like this can be assembled relatively quickly in laboratory conditions since their major
components–micropumps [28], microvalves [29] with integrated capillaries for connecting purposes,
connectors and polymer microtubing [30]–are commercially available at reasonable prices. For
example, a micropump without driver currently costs about €20.

Sensors 2010, 10
3775
2.2. Microfluidic Systems with LCW Cells
The microfluidic system presented in Figure 3 uses an LCW cell as the test head and tee connectors
as the valves connecting the optical fibers and the tubing. LCW cells are commercially available at
World Precision Instruments, Inc. Typical capillaries used in such cells have optical path lengths from
2 to 500 cm, inner diameters of 550 μm and internal volumes from 5 to 1,250 μL. Both continuous and
discrete introduction of samples into the LCW cell are possible.
Figure 3. Microfluidic system with an LCW cell.
Pump; Vp
Intaketee; Vit
Optical capillary; Vmfh Outlet
tee; Vot
Polymertubing; Vt
Light source(halogen)
Spectrometer
Input optical fiber
Output optical fiber
LCW cell
Container with sample; Vsc
Container with
; waste Vsc
When a syringe is used to introduce a sample, the discrete sample volume Vs should be [31]:
esotmfhitts VVVVVV 3)(3 (3)
The optical capillary in the LCW can be made of Teflon AF2400 or of fused silica tubing coated
inside with a low-refractive-index polymer. The refractive index of the tubing must be lower than that
of the examined liquid. For example: water at 20 °C has an index of refraction of 1.33; acetone, 1.36;
and ethyl alcohol, 1.36; while Teflon AF2400 for wavelengths greater than 380 nm has a refractive
index below 1.29 [32]. This ensures that light from the input optical fiber will be guided through the
liquid in the capillary to the output fiber connected with the spectrometer. LCW systems can be used to
extend the sensitivity of conventional absorbance spectroscopy by two or more orders of magnitude.
They can also eliminate the need for sample preconcentration in some analyses. For example, the iron
Fe(II) concentration above 0.2 nmol·dm-3 in natural waters can be directly examined by monitoring
with light at a wavelength of 562 nm [33].
Hollow waveguides were proposed for detection of gases and liquids [34-41]. Sections of small
bore (i.d. of 530 µm, 700 µm and 1,000 µm) silica capillaries of 20-25 cm length coated on the inside
walls with silver and silver halide were used as sensors of CO2 in N2 in the range from 200 ppm to
10,000 ppm, showing linear response to the CO2 concentration [34].
Silica capillaries of four meter length and 700 µm i.d. with the inner wall surface coated with a
reflecting layer of Ag/AgI showed excellent light transmission in mid-infrared range with an
attenuation of 0.1 dB/m at 10.6 µm and functioned both as optical waveguides and gas cells. They
were used for gas detection in conjunction with SiC globar light sources and FTIR spectrometers down
to ranges of ppb for chlorinated hydrocarbons and ppm for 1,4 dioxane [35]. In conjunction with a
supported capillary membrane those capillaries were used to detect the concentration of volatile
organic compounds in water down to ppm level [36]. The same kind of hollow waveguides detecting
the attenuation of room-temperature quantum cascade lasers InGaAs/AlInAs/InP at 971 cm-1 sensed
ethyl chloride in air down to concentrations of 0.5 ppm (v/v) [37]. Hollow waveguides were used with

Sensors 2010, 10
3776
quantum cascade laser spectrometer as an online microliter sensor for gas chromatography [38].
Another version of hollow waveguides used polyethylene capillaries with silver reflective layers
additionally covered with hydrophobic films to attract and detect organic compounds dissolved in
water with sensitivity down to 50 ppm v/v using conventional FTIR spectrometry [39]. Further
improvements allowed reducing the volumes of the samples to 50 µL and sensitivities to 10 to 100
ppm, depending on the compound [40,41].
A distinct advantage of the waveguiding properties of the capillary is the capability to integrate the
signal over an increased surface area without simultaneously increasing the background noise from the
detector. A biosensor was demonstrated to achieve limits of two orders of magnitude greater
sensitivity than was achieved using the same immunoassay reagents in a fiber optic biosensor or a
planar array biosensor [42].
Some proposed sensing applications of hollow capillaries are removed from the classical sensing of
gas and liquids. Branzalov et al. proposed a fiberoptic displacement sensor with a short hollow metal
optical waveguide [43]. Filling silica/Ag/AgI coated hollow waveguides with silver nanoparticles, thus
combining capillary sensing with nanotechnology, Shi et al. have developed a molecular sensor based
on double substrate surface enhanced Raman scattering with greatly improved sensitivity for molecular
detection. In tests of detecting R6M molecules in water at 10-6 M concentrations those sensors showed
sensitivities 100 times better than in direct sampling [44].
2.3. CE Systems
Capillary electrophoresis is used for precise analysis of liquids containing ions that can be separated
in an applied electric field. A large body of literature exists on this topic, but its review is beyond the
scope of this paper. However, since CE represents a major application of capillaries in what can be
considered a form of sensing, it is mentioned here, with references to recent specialized review articles
[45-49].
Figure 4. CE system using fiber optics.
Window in optical capillary;
Glass capillary with sample; V = V = Vs t mfh
Light source(laser)
Photo - detector
Input optical fiber
Output optical fiber
1-st containerwith e
; Veb
lectrolytebuffer
ElectrodeHigh voltage
supply
Sample underexamination; Ves
Briefly, in CE the electrically charged ions of the analyte move from one container to another under
the influence of an electric field. The high voltage supply acts as a pump and causes separation of ions
by their charge, frictional forces and mass. The time-dependent concentration of separated ions can
then be measured by optical detection devices [50]. The most common systems are based on detection
of optical absorbance or on fluorescence analysis across the capillary, as shown in Figure 4. Most often

Sensors 2010, 10
3777
CE capillaries are made of fused silica, but polymer capillaries have also been proposed to take
advantage of their lower index of refraction [51]. The separation of ions improves when the capillary’s
inner diameter is small, but for the purposes of optical detection, a larger inner diameter gives better
sensitivity. Both effects have technical limits, so in practice the capillary inner diameters in CE range
from 25 m to 75 m. The focusing of light on the capillary is thus an important design consideration.
The sample volume under examination in CE is very small and can be approximated as the width of
the light beam crossing the capillary multiplied by the area of the capillary’s cross-section. Decreasing
the sample volume Vs can be achieved by the on-line pre-concentration method, in which the examined
sample is injected directly into the capillary [52]. The volume of the CE sample is then comparable to
that of an LCW sample. The combination of CE and laser-induced fluorescence (LIF) represents the
current state of the art in terms of sensitivity for microcolumn separation techniques. In particular, LIF
detection coupled with capillary electrophoresis (CE) has achieved detection limits approaching the
single molecule level, but only for molecules that have fluorescent properties [53]. The disadvantages
of CE are the need for conditioning of new capillaries and the requirement to regenerate the inner walls
of the capillaries between the measurements [54].
2.4. OCT Systems
Optical coherence tomography is an interferometric imaging technique performed using fiber-optic
Michelson interferometer with low-coherence-length light source. The fiber-optic implementation
provides a compact system that can be interfaced to a variety of clinical imaging instruments. One
interferometer arm contains a probe that focuses, scans the light onto the sample, and collects the
backscattered light. The second interferometer arm is a reference path with a translating mirror or a
scanning delay line. The interference fingers are detected and demodulated to produce the
measurement of the magnitude and echo delay time of light backscattered from the samples [55]. The
outputs of OCT systems are three-dimensional images which resolutions that depend on the properties
of the light source - superluminescent diodes and ultrashort pulsed lasers [56].
OCT systems use near-infrared light for acquisition and processing of optical signals from optically
scattering media. The relatively long wavelength light penetrates into the scattering medium [57,58].
Commercially available OCT systems have found diverse applications, including art conservation and
diagnostic medicine, notably in ophthalmology where they can be used to obtain detailed images from
within the retina. The tomography image can be acquired from a capillary that is used as a liquid
vessel in the setup presented in Figure 5.
Figure 5. OCT system using optical capillary as a vessel.
Glass capillary vessel
with sample
Light source
Photo - detector
Optical fiber
Optical fiber
Beamsplitter
Scanning optical delay
Lens
DemodulatorComputer
image generatorand processor

Sensors 2010, 10
3778
Work [59] presents a method of determination of optical parameters of blood such as the index of
refraction, the attenuation coefficient, and the scattering anisotropy factor, measured at 1,300 nm. The
estimations of the attenuation coefficient and of the anisotropy factor are based on a numerical
algorithm fit to an experimentally acquired optical coherence tomography (OCT) heterodyne
efficiency curve.
3. Microfluidic Sensors
Even more than for laboratory situations, microfluidic sensors for industrial and field applications
have to be inexpensive to purchase and operate as well as simple to use, and the choice of components
must take these requirements into account. As a light source, light emitting diodes (LEDs) are
preferable to laboratory laser light sources. However, with LEDs, the optical signal to the detection
unit is one or two orders of magnitude lower, which means that background light has to be eliminated
from the measured signal. This can be done with light modulation on the source side and signal
filtering in the photoreceiver. The receiver can be built with an integrated amplifier-photodetector with
a filter, such as the monolithic photodiode and single-supply transimpedance amplifier OPT101 in
conjunction with the universal active filter UAF42, all available from Texas Instruments [60,61]. The
use of LEDs also limits the optical sensor detection system to the measurement of light intensity.
Halogen or deuterium spectrometer lamp sources, even in original equipment manufacturer (OEM)
versions, are too costly for most sensors. In their place, a few selected and switched LEDs can be used [62].
The components of a microfluidics sensor also have to be replaceable or at least easily renewable by a
non-professional user.
In addition to simple, inexpensive components, microfluidic sensors must have appropriate
sampling arrangements. Precision microsyringes have been proposed for filling capillaries with
bio-reactive mixtures [63], but they can only be used by a trained technician. Liquids can be sampled
directly using optical capillaries, but the reproducibility and effectiveness of coupling light into and
out of the capillary have to be assured [64].
3.1. Capillary Absorbance Sensors with Sensitive Layers
The basic setup for a capillary absorbance sensor with a sensitive layer intended for monitoring
transfluent samples is shown in Figure 6.
Figure 6. Optical capillary sensor with optical fibers for absorption measurements intended
for monitoring transfluent samples.
Window in optical capillary cover
Glass capillary with sample; Vmfh
Light sourceLED
Photo - detector
Optical fiber large core >120 m Optical
fiber
Sample underexamination; Ves
Holder offiber and capillary -ST modified coupler
Sensitivelayer

Sensors 2010, 10
3779
This device was proposed and evaluated as a carbon dioxide sensor by Weigl and Wolfbeis [8]. As
a light source, an LED with a wavelength of 590 nm was used. The intensity signal was monitored on
a Hewlett-Packard 8153A lightwave multimeter. To facilitate light coupling, optical fibers with 125
m diameter cores were selected. The fibers were positioned in an ST coupler with a hole for the
capillary drilled in the center. The capillary was permanently mounted and its inner walls were coated
with chemically sensitive layers. In the microfluidic channel, the capillary was connected by
polyethylene tubing to a container holding the sample solution–a mixture of buffer liquid and carbon
dioxide gas. This capillary sensor performed better than a membrane sensor.
Several attractive features were listed for capillary waveguide optrodes [64]: (a) they can serve as
sample cavities or flow cells for gases and liquids; (b) they are suitable for direct sampling; (c) their
relative signal change can be optimized by adjusting the optical pathlength; (d) the optical pathlength
is much longer compared to other optrode designs based on absorption or reflection, therefore the
coatings can be made thinner, and less loaded with chemically active components; (e) the sensors are
hardly cross-sensitive to color and turbidity of the sample; (f) cheap light sources and detectors can be
used in connection with these novel capillary waveguide optrodes.
3.2. Optical Evanescent Field Sensors with Capillary Optrodes
One of the first designs for an optical capillary evanescent field sensor, where the capillary
functioned as an optrode, was proposed by Weigl and Wolfbeis in [8]. The sensor head used the same
sensitive layer as the head shown in Figure 5 and was also intended for monitoring transfluent
samples, but it was constructed differently. Light was coupled into the walls of the glass capillary with
a grating made on the wall. The light then propagated in the capillary’s walls. The capillary was placed
on a holder plate where the light source and photodetector positions were set at right angles to the
capillary axis, for example, by means of an optical fiber. This construction was more suitable for
integration because it allowed for an optical coupling that was not permanently fixed. To improve the
coupling efficiency, a He-Ne laser was used as a source (Figure 7).
Figure 7. Optical capillary evanescent field sensor with sensitive layer intended for
monitoring transfluent samples.
Glass capillary optrodewith sample; Vmfh
Light sourceLaser He-Ne
Photo-detector
Optical fiber large core > 120 m
Optical fiber
Head basis
Sensitivelayer
Gratingcoupler
In a different design proposed by Paprocki et al. [65], the propagating light has an evanescent field
component. This penetrates the sensitive layer, which is about 2 m thick, changing the real and
complex part of the coefficient of light refraction in the presence of carbon dioxide. The result is a
longer optical path and greater sensitivity than for the sensor in Figure 5. The main drawback of this
Sensors 2010, 10
3780
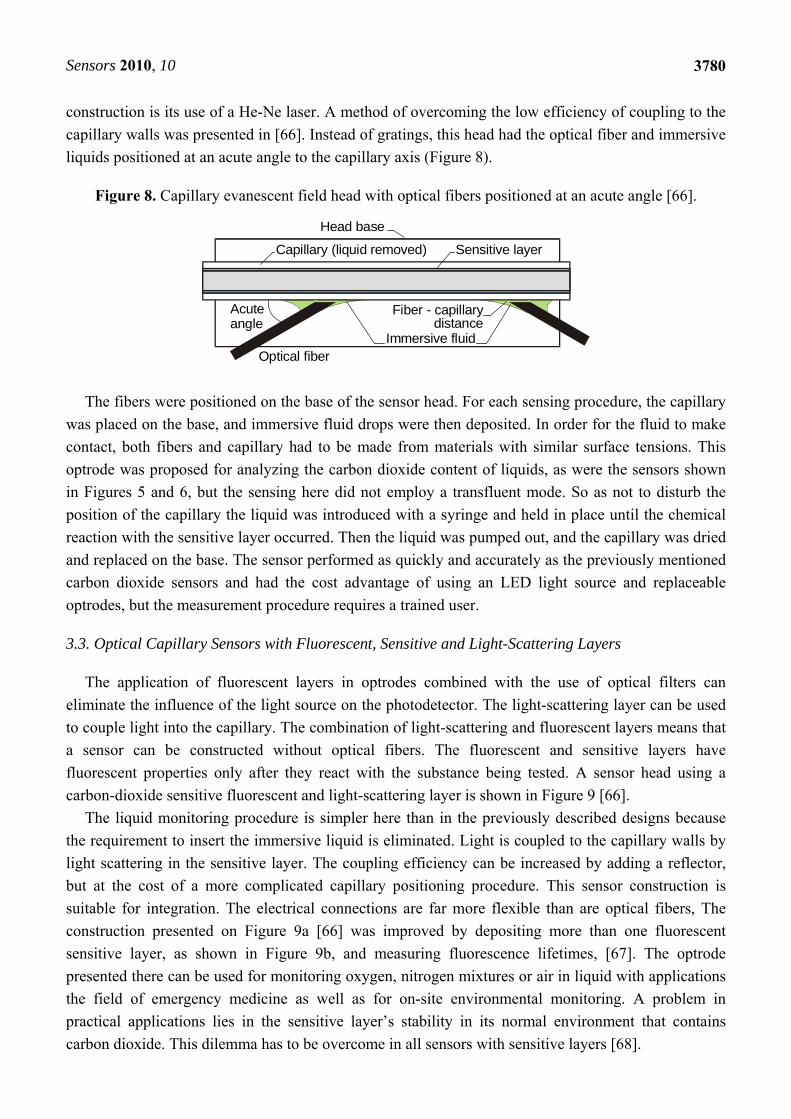
construction is its use of a He-Ne laser. A method of overcoming the low efficiency of coupling to the
capillary walls was presented in [66]. Instead of gratings, this head had the optical fiber and immersive
liquids positioned at an acute angle to the capillary axis (Figure 8).
Figure 8. Capillary evanescent field head with optical fibers positioned at an acute angle [66].
Optical fiberImmersive fluid
Sensitive layerCapillary (liquid removed)
Acuteangle
Head base
Fiber - capillary distance
The fibers were positioned on the base of the sensor head. For each sensing procedure, the capillary
was placed on the base, and immersive fluid drops were then deposited. In order for the fluid to make
contact, both fibers and capillary had to be made from materials with similar surface tensions. This
optrode was proposed for analyzing the carbon dioxide content of liquids, as were the sensors shown
in Figures 5 and 6, but the sensing here did not employ a transfluent mode. So as not to disturb the
position of the capillary the liquid was introduced with a syringe and held in place until the chemical
reaction with the sensitive layer occurred. Then the liquid was pumped out, and the capillary was dried
and replaced on the base. The sensor performed as quickly and accurately as the previously mentioned
carbon dioxide sensors and had the cost advantage of using an LED light source and replaceable
optrodes, but the measurement procedure requires a trained user.
3.3. Optical Capillary Sensors with Fluorescent, Sensitive and Light-Scattering Layers
The application of fluorescent layers in optrodes combined with the use of optical filters can
eliminate the influence of the light source on the photodetector. The light-scattering layer can be used
to couple light into the capillary. The combination of light-scattering and fluorescent layers means that
a sensor can be constructed without optical fibers. The fluorescent and sensitive layers have
fluorescent properties only after they react with the substance being tested. A sensor head using a
carbon-dioxide sensitive fluorescent and light-scattering layer is shown in Figure 9 [66].
The liquid monitoring procedure is simpler here than in the previously described designs because
the requirement to insert the immersive liquid is eliminated. Light is coupled to the capillary walls by
light scattering in the sensitive layer. The coupling efficiency can be increased by adding a reflector,
but at the cost of a more complicated capillary positioning procedure. This sensor construction is
suitable for integration. The electrical connections are far more flexible than are optical fibers, The
construction presented on Figure 9a [66] was improved by depositing more than one fluorescent
sensitive layer, as shown in Figure 9b, and measuring fluorescence lifetimes, [67]. The optrode
presented there can be used for monitoring oxygen, nitrogen mixtures or air in liquid with applications
the field of emergency medicine as well as for on-site environmental monitoring. A problem in
practical applications lies in the sensitive layer’s stability in its normal environment that contains
carbon dioxide. This dilemma has to be overcome in all sensors with sensitive layers [68].

Sensors 2010, 10
3781
Figure 9. a) Head with capillary optrode using a fluorescent, sensitive and light-scattering
layer [66]; b) Head with capillary optrode using 2 fluorescent, sensitive and
light-scattering layers [67].
a
Fluorescent, sensitive and light scattering layer
Optional reflector
LED UV light source
FilterUV
Photo-detector
Capillary optrode (liquid removed)
Head base
Electrical connector
b
1-st fluorescentsensitive and light scattering layer
Optional reflector
1-st LED light source
1 2-nd LED light source
2
Filter, 1 2
Photo-detector
Capillary optrode (liquid removed)
Head base
Electrical connector
2-nd fluorescentsensitive and light scattering layer
A four-band capillary optical immunosensor for the simultaneous determination of mesotrione,
hexaconazole, paraquat and diquat was developed by Mastichiadis et al. Four distinct bands (each
corresponding to a different analyte) were created in the internal walls of a plastic capillary by
immobilizing protein conjugates of the analytes. To perform the assay, the capillary was filled with a
mixture of anti-analyte-specific antibodies together with a standard or sample containing the
analyte(s). After a short incubation, a mixture of the appropriate second antibodies labeled with
fluorescein was introduced into the capillary. To measure the fluorescence intensity bound onto each
band, the capillary was scanned, perpendicularly to its axis, by a laser light beam. Part of the emitted
photons were trapped into the capillary walls and waveguided to aphotomultiplier placed at the one
end of the capillary. The analytical characteristics of the assays were comparable with those of the
corresponding single-analyte fluoroimmunoassays performed in microtitration wells, proving the
ability of the proposed immunosensor for reliable multianalyte determinations. The combination of
low-cost disposable plastic capillary tubes with the low consumption of reagents, the short assay time,
and the multianalyte feature of the proposed immunosensor indicated its potential for environmental
analysis [69].
With the support of the EU-funded CLINICIP consortium mentioned in Section 1, capillary based
carbon dioxide sensors were developed and tested, with the final aim of pCO2 monitoring in adipose
tissue of critically ill patients [70]. The sensors were based on the measuring principle of phase
fluorometry using a dual luminophore referencing scheme (DLR) to convert the CO2 dependent
intensity signal into phase domain. The CO2 sensors were prepared by incorporating two appropriate

Sensors 2010, 10
3782
luminophores and a phase transfer agent in a same hydrophobic polymer as matrix. A short-lifetime
luminophore was used as pH indicator while the second inert luminophore was the long-lifetime dye.
The capillary sensor and the planar sensor developed alongside were characterized and their
construction and choice of materials optimized to achieve the best sensitivity and mechanical stability.
The two glass capillary sections used in the measurement unit were each 2.8 cm long, 0.45 mm i.d and
1 mm o.d. The capillary preparation process included cleaning in acid solutions and thermal drying
steps. Several polymers were examined as appropriate matrix for incorporation of two indicators. The
largest phase shift up to 13° and 15° was observed for the best combination which was in detail
examined in terms of sensitivity and stability. The sensors enabled the measurement of pCO2 in the
range from 5 to 150 mmHg, with a resolution of 0.5 mmHg over the whole range and an accuracy of
±1 mmHg absolute or less than 7% of the read-out value. The planar sensors were characterized in dry
gas and in solutions, while the capillary sensors were characterized in solutions.
Within the same CLINICIP consortium project an optical fiber sensor for measuring the pH in
interstitial fluid was developed, based on microdialysis for extracting the sample from the
subcutaneous adipose tissue. The interstitial fluid was drawn through a microfluidic circuit formed by a
microdialysis catheter in series with a pH glass capillary. The pH indicator (phenol red) was covalently
immobilized on the internal wall of the glass capillary. An optoelectronic unit that made use of LEDs
and photodetectors was connected to the sensing capillary by means of optical fibers. A resolution of
0.03 pH units and an accuracy of 0.07 pH units were obtained [71]. Further investigations of
researchers from the University of Technology of Graz and other members of the CLINICIP consortium,
went in the direction of integrated fiber-optic hybrid sensors not based on FOCaps [72,73].
3.4. Optical Fiber Sensors Using Capillary Probes
Optical fiber sensors with sensitive layers deposited on the fiber tip are well developed [74]. These
sensors can operate in the reflection configuration where the fiber tip is in contact with the investigated
medium [75]. This design may use single-mode fibers with circulators [76], multimode fibers with
couplers, or large-core fibers (with core radius greater than 100 m) with either custom-made
directional couplers [77] or dividers that meet the TOSlink standard. Nanostructured sensitive layers
are often deposited on the fiber tip [78], so the tip can be mechanically sensitive. The tip can then be
inserted into the capillary or the glass part of a Pasteur pipette. One example of this design is an optical
sensor of lead ions [79], in which the fiber and the capillary are positioned in the outer tube. The
indicator is deposited on the tube walls where the introduced sample can dissolve it. Such construction
enables relatively easy and repeated insertion of a bare fiber into the Pasteur pipette with the brackets
fixed on the wider part of the pipette and on the outer tube. Keeping both ends of the capillary open
enables pumping of the sample through capillary action, but assumes that the fiber tip is straight for a
distance of a few centimeters, which is not always the case, as is known from fiber vibration sensors.
A more precise insertion of the fiber into a capillary with the same geometry can be automated using
an optical fiber splicer equipped with a monitoring camera. The fiber can also be positioned inside the
capillary by means of a culvert created by a pair of capillaries whose outside diameters are smaller
than the inner diameter of the sampling capillary, as illustrated in Figure 10.

Sensors 2010, 10
3783
In a device with this design, the distance between the sensitive layer and the fiber position can be of
the order of a few millimeters. When a bare glass optical fiber is inserted into the glass capillary, the
capillary action is forced right around the fiber, so this area fills even when basic capillary action of
probe is not sufficient.
Figure 10. Optical fiber sensor using a capillary probe.
Glass capillary probewith sample; Vmfh
Light sourceLED UV
Photo-detector
Optical fiber
SensitivelayerUV
filter
Coupler
Fiber connector
Fiber held in place by small capillaries
The capillary probe acts as a shield against outside light, because the capillary has a higher index of
refraction than the examined liquid [80]. In that case the light reflection from the outer liquid meniscus
is directed to the capillary walls. Both the inner diameter and the material of the small capillary
sections used as culverts can be selected with a view to preventing the liquid from moving outside of
the probe. The fiber connector makes it easy to disconnect the head for cleaning or replacement.
Components recommended for this device are probe capillaries with an inner diameter of 700 m
(TSP700850), fibers with an outer diameter of about 300 m (FVP300330370 with removed buffer in
the optrode area) and small capillaries with an outer diameter of 150 m (TSP050150 with thin layer
of PMMA deposited on the inner walls), and SMA fiber connectors. Due to its simple operation and
the fact that its head can be quickly replaced, the sensor in Figure 10 has good potential for use in
point-of-care applications. This is investigated in [79] and [81].
3.5. Sensors with Chemically Preprocessed Samples
Sensors that work with chemically preprocessed samples often use fluorescence detection as it can
be very selective. A capillary sensor scheme for monitoring transfluent fluorescent samples is shown
in Figure 11.
Figure 11. Capillary sensor scheme to monitor transfluent samples using fluorescence detection.
Teflon AF2400 capillary probe
with sample; Vmfh
Photo-detector
Optical fiber
UVfilter
Samplepreprocessing
Linear UVlight source
Tube with reflective inner surface
Pump
Container for waste
TeeTee
Tubing

Sensors 2010, 10
3784
A Teflon AF2400 tube is used here as the capillary probe. Teflon has an index of refraction slightly
below 1.29 and a smooth surface which scatters light. These features enable it to side-couple light into
the liquid in the tube where it can propagate. Miniaturized UV LEDs can be used as the light source
for fluorescence investigation. The main drawback with this scheme lies in production of the necessary
selective fluorescence in the presence of the investigated component, which must be a chemical
reactant. To give two examples of research in this area: fluorescent sensors for saccharides have been
developed based on the interaction between a boronic acid and a diol [82], and saccharide-selective
systems have been developed for D-glucosamine, which is an amino sugar that stimulates collagen and
cartilage production in the human body [83]. The problem is that some of the chemical reactions
needed for fluorescence detection also produce gases, and this output complicates the optical detection
of light propagated in the liquid waveguide. This was the experience of researchers working on sensors
for the selective detection of NH3 ions in the range 35 nM–60 M as presented in [84].
3.6. Capillary Sensors of Transparent Liquids with Light Switching by Local Sample Heating
In this section, we review research carried out by the authors on capillary sensors using local
heating of the transparent liquids. The selectivity of sensors can be achieved by physical processing of
the sample in the capillary head, for example by heating [85-86]. In one sensor using that principle, the
set of parameters from which the fingerprint of a liquid is selected was indirectly monitored by
measurements of light propagation. To collect this information, the sample was subjected at specified
times to local heating with a defined power level. Under certain conditions, such heating can result in
the formation of a bubble of liquid vapor. After the heating stops, the bubble either becomes smaller or
is completely absorbed by the liquid. The bubble itself forms a lens and by its presence and shape
switches the light in the capillary, as illustrated in Figure 1. A fiber-optic capillary sensor using the
described principle was proposed in [87]. The head of that sensor, with the optical fibers fixed in position
inside the capillary head and flexible glass tubing used for sample injection, is presented in Figure 12.
Figure 12. Fiber-optic capillary sensor of transparent liquids with local heating [87].
Syringewith rubberconnector
Intelligent detectionand control P unit
- Power for heater- Temperature signal
Heater
Glass capillary head; VmfhArea of vapor phase creation
USBStorage, data analysis,programming PC
Photo-detector
Light sourceLED with
SMA connector
Flexible glasstubing
Container with sample
Temperature-stabilized box
Opticalfiber
In the setup shown in Figure 12, the optical fibers were positioned symmetrically in relation to the
heater. The distance between the fibers was 15 mm; the distance between the glass tubes was 40 mm.

Sensors 2010, 10
3785
Both the TSP 700850 capillaries used for the capillary head and the TSP 250350 used as the flexible
glass tubes came from Polymicro Inc. The BFL22–200 optical fibers were from Thorlab. The inner
diameter of TSP 700850 is 700 µm +/−10 m and its outer diameter is 850µm +/− 20 m, while for
the BFL22–200 the silica core is 200 m and the silica clad is 240 µm. The key to the repeatable
operation of the sensor is the precise positioning in one plane of the BFL22–200 fibers and the TSP
250350 tubes. The heater, made by thick-film technology, had a width of 1.5 mm, and its heating power
was 3 W. The temperature in the box where the head was placed was stabilized at 22 °C. This box was
also used for removing vaporized liquid from the capillary as suggested in [86].
The signal received during and after sample heating depends on the geometry of the head, on the
characteristics of the fibers and on the indexes of refraction of the capillaries as well as on the set of
liquid parameters presented in Table 1 which includes data published in [88]. When the temperature of
the liquid decreases, the vapor pressure also decreases and the bubble gets smaller. When the vapor
pressure in the bubble is lower than the sum of the atmospheric pressure plus the pressure from surface
tension, the bubble is absorbed. The atmospheric pressure is 1.013·105 Pa, so it is expected that when
heated rapidly to 200 °C, the isopropyl alcohol will shoot out from the capillary, while the ethylene
glycol gas will expand more slowly. Calculating the amounts of vapor flashed from the components of
a liquid requires a trial-and-error iterative solution. Such a calculation is commonly referred to as the
equilibrium flash calculation. It involves solving the Rachford-Rice equation [89].
Table 1. Parameters of liquids: Water–DIW, Isopropyl alcohol –IPA, Ethylene glycol–EG.
Parameter Liquid
DIW IPA (77.5%) + DIW (22.5%)
EG
Index of refraction 1.333 1.376 1.432 Boiling point [°C] 100 82.3 197.3
Vapor pressure of liquid at 20 °C [Pa] 2.4·103 4.4·103 8 Vapor pressure of liquid at 100 °C [Pa] 1.0·105 2.0·105 1.4·103 Vapor pressure of liquid at 200 °C [Pa] 1.8·106 2.3·106 1.1·105
Viscosity [Pas] 0.89·103 2.07·103 16·103 Surface tension [N/m] 0.0731 0.0228 0.0477
The constructed system was verified by using it to distinguish between two liquids: a 77.5%
isopropyl alcohol-water solution and pure ethylene glycol. The optical signal transient characteristics
for both samples are presented in Figure 13.
In the first 150 seconds of the experiment, a difference in light transmission between the capillaries
filled with ethylene glycol and those filled with isopropyl alcohol was observed. The transmitted
optical power was greater with ethylene glycol than with isopropyl alcohol because the refractive
index of ethylene glycol is higher than that of isopropyl alcohol (Table 1). During the next 150–200
seconds, differences were seen in the threshold temperature for the formation of vapor bubbles. Longer
times and higher temperatures were needed for ethylene glycol than for isopropyl alcohol, which is
consistent with the difference in their boiling points as given in Table 1. With ethylene glycol, which
has a high viscosity, the vapor bubbles are rimmed with thin layers of the liquid left on the inner

Sensors 2010, 10
3786
capillary walls after the bubbles form. In effect, the transmission of light does not drop to zero, as it
does in isopropyl alcohol whose viscosity is lower. On Figure 13, at the end of the measuring cycle,
i.e., after 250 seconds, the difference of signal levels due to different thermodynamic properties of
vapor and the atmosphere is clearly visible.
Figure 13. Signals registered from isopropyl alcohol and ethylene glycol liquid-to-vapor transition. O
ptic
al s
igna
l [a.
u.]
- eth
ylen
e gl
ycol
- is
opr
opyl
alc
oho
l
Time [s]
- H
eat
er cu
rren
t [m
A]
Index of refraction
Liquid to vaportransition- temp. threshold- type of transition
Viscosity
Turbiditycaused byvapor phasein liquid
Differences in -
pressure consequent to surface tension force and atmospheric pressure
vapor pressure -
1000
750
500
250
0
400
300
200
100
00 50 100 150 200 250 300
It is worth noting that irrespective of the analyzed liquid, the signal waveforms of the consecutive
measuring cycles have good reproducibility [87]. Thus, the characteristic features of the particular
signal collected and analyzed using an ANN can serve to identify the type of liquid examined. In the
ANN experiments, the characteristic points were taken to be: (a) the signal level at the beginning, (b)
the signal magnitude just before boiling, (c) the time when the rate of the signal decrease begins to
exceed 200 a.u./s, (d) the magnitude of the signal at its minimum value and (e) the magnitude of the
signal at the cycle end. The neural network used was a multilayer perceptron with 5 inputs, 1 output
and 2 hidden layers with the sigmoid transfer function in each neuron. The structure of the outputs was
designed to make it simple to interpret the results. The output signal representation was 1-EG, 0-IPA.
The ANN was taught on 26 cases. The learning error of the ANN for 1,000 iterations of the back
propagation algorithm was 1.5% and the correlation of the training set was 0.9996. This means that the
network parameters were well selected and confirms that the process of learning the desired features
took place. The learning error value should be used as the criterion for accepting the accuracy of liquid
classification. The liquid samples that give signals beyond the ranges defined as 0÷0.15 and 0.85÷1
may be considered to differ from the postulated kind. The percent of contribution from the inputs to
the ANN output were: (a) 2%, (b) 2%, (c) 2%, (d) 35%, and (e) 59%. This proves that information on
the index of refraction is of little importance when only one criterion is used.
The bubbles in boiling liquid arise first on the surfaces of the container and the surfaces of
impurities in the liquid. During heating, because the capillary is smooth inside, impurities can cause
the formation of very small bubbles of vapor just before the boiling point is reached. This effect can be
used to monitor liquid purity, which is an important goal in fuel quality assessment, and was therefore
evaluated on two mixtures of Petrol 95 and combustible oil (95%–5% and 50%–50%). The signals
received are presented in Figure 14. Fuels with similar refractive indexes were used, so the initial level
of signal x(t0) is also similar. The speed of the liquid-to-gas transition can be defined by angle 1
(Figure 13). A higher value of 1 indicates a purer liquid. The time of boiling t(2) can be found at the

Sensors 2010, 10
3787
point where the optical signal rapidly decreases (2 trend to 90°). In Figure 14 one can see that the 1
transition angle is equal to 2 in the case of pure petrol and that 1decreases when there is more
combustible oil in the mixture. The temperature of the boiling point also increases when the mixture
contains higher levels of combustible oil. So, one can deduce that Petrol 95 is purer than combustible
oil, a conclusion that reflects the fact that it is less refined and filtered during its production process.
Figure 14. The vapor phase creation in selected fuel mixtures.
t(
x t( )2
x t( )0
t1
Opt
ical s
igna
l [a.
u.]
Time [s]
- H
eate
r cu
rren
t [m
A]
Right axis: Petrol - 95 [100%] Petrol - 95 [95%]+Combustible oil [5%]
Petrol - 95 [50%]+Combustible oil [50%] Combustible oil [100%]
1000
750
500
250
0
300
200
100
00 50 100 150 200
4. Capillary Sensors for Point-of-Care Applications
Weigl et al. have presented a review of non- and minimally instrumented microfluidics-based
diagnostic devices, making a case for disposable-only diagnostics and for micro total analysis systems
(µTAS) [90]. The sensor market for point-of-care applications is expanding rapidly because it targets
low-cost, fast self-diagnostics. The user population is growing, and self-diagnostics is becoming
increasingly attractive as health-care costs continue to rise. Some of the best known diagnostic sensors
were developed to examine organic secretions such as milk, vaginal fluids, sperm, lymph, saliva and
blood. Organic secretions must be examined by disposable single-use microfluidic drawing devices
with a permanent, reusable head, since it is difficult to wash or clean devices containing infected
secretions. Minimizing the total sample volume needed for precise examination is one of the critical
objectives in such applications. This can be achieved by using a capillary optrode to draw the sample
into the microfluidic head.
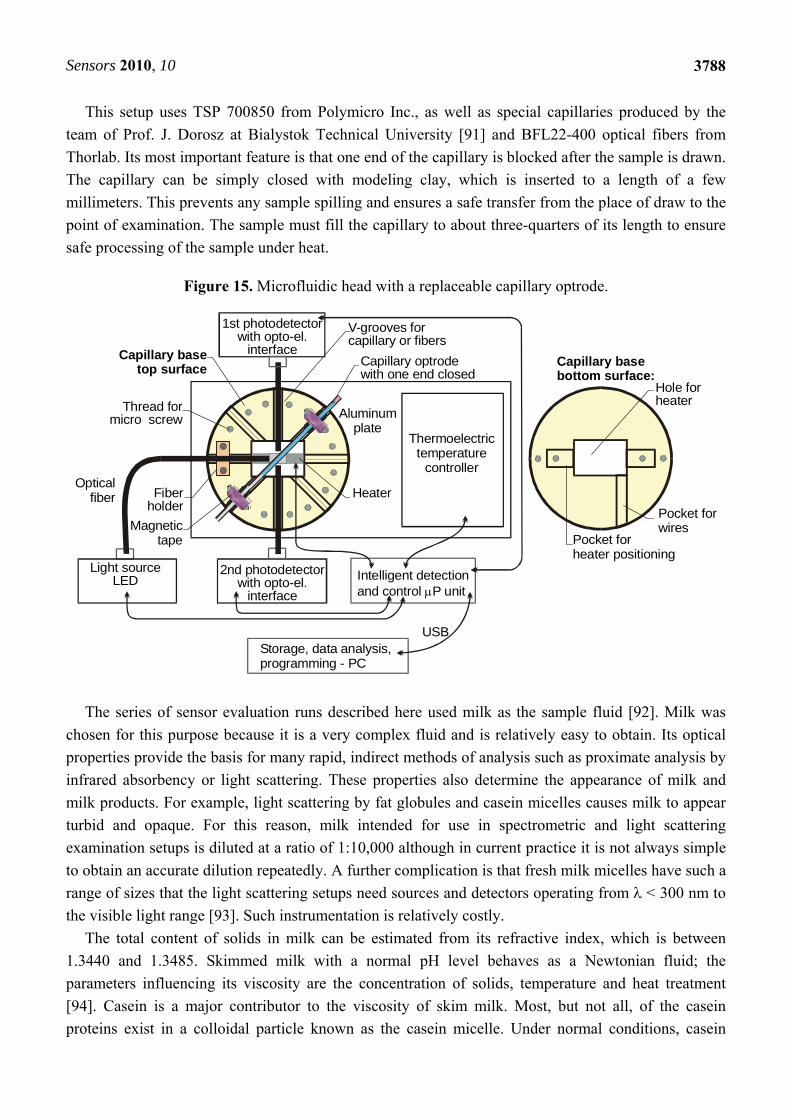
The construction of a prototype testing head built with a replaceable capillary optrode built by the
authors is shown in Figure 15. The base of this capillary was designed so that different size capillaries
and fibers could be precisely positioned to test a wide range of organic secretions. The presented
configuration uses two photodetectors. The position of the capillary in the base is controlled by the
first photodetector and the measured signals presented on the following charts were registered from the
second photodetector. The replaceable capillary optrode in this design is held in position by magnetic
tape, the capillary base being made of magnetic steel. An aluminum plate serves to stabilize heat
convection in the heated area, while the thermo-electric temperature controller sets a stabilized
temperature for the experiments.
Sensors 2010, 10
3788
This setup uses TSP 700850 from Polymicro Inc., as well as special capillaries produced by the
team of Prof. J. Dorosz at Bialystok Technical University [91] and BFL22-400 optical fibers from
Thorlab. Its most important feature is that one end of the capillary is blocked after the sample is drawn.
The capillary can be simply closed with modeling clay, which is inserted to a length of a few
millimeters. This prevents any sample spilling and ensures a safe transfer from the place of draw to the
point of examination. The sample must fill the capillary to about three-quarters of its length to ensure
safe processing of the sample under heat.
Figure 15. Microfluidic head with a replaceable capillary optrode.
Intelligent detectionand control P unit
USBStorage, data analysis,programming - PC
2nd photodetectorwith opto-el.
interface
Light sourceLED
Opticalfiber
V-grooves for fiberscapillary or
Hole forheater
Pocket for heater positioning
Thread formicro screw
Capillary base bottom surface:
Capillary base top surface
Pocket forwires
Fiberholder
Heater
Thermoelectrictemperature
controller
Aluminumplate
Capillary optrode with one end closed
Magnetictape
1st photodetectorwith opto-el.
interface
The series of sensor evaluation runs described here used milk as the sample fluid [92]. Milk was
chosen for this purpose because it is a very complex fluid and is relatively easy to obtain. Its optical
properties provide the basis for many rapid, indirect methods of analysis such as proximate analysis by
infrared absorbency or light scattering. These properties also determine the appearance of milk and
milk products. For example, light scattering by fat globules and casein micelles causes milk to appear
turbid and opaque. For this reason, milk intended for use in spectrometric and light scattering
examination setups is diluted at a ratio of 1:10,000 although in current practice it is not always simple
to obtain an accurate dilution repeatedly. A further complication is that fresh milk micelles have such a
range of sizes that the light scattering setups need sources and detectors operating from < 300 nm to
the visible light range [93]. Such instrumentation is relatively costly.
The total content of solids in milk can be estimated from its refractive index, which is between
1.3440 and 1.3485. Skimmed milk with a normal pH level behaves as a Newtonian fluid; the
parameters influencing its viscosity are the concentration of solids, temperature and heat treatment
[94]. Casein is a major contributor to the viscosity of skim milk. Most, but not all, of the casein
proteins exist in a colloidal particle known as the casein micelle. Under normal conditions, casein

Sensors 2010, 10
3789
micelles have a spherical shape, with diameters from 40 to 300 nm. The number of such particles in a
milliliter of milk is in the range from 1014 to 1016, enough to cover a total surface of 5 ×104 cm2/mL
[95]. Changes in the physicochemical properties of the casein micelles can be induced by changes in
pH, salt concentration, or temperature. Of interest are the time effects on these factors.
Non-pasteurized and non-sterilized milk ferments at room temperature. Lactic acid bacteria such
Lactobacillus, Lactococcus or Leuconostoc convert milk monosaccharides (simple sugars, such as
fructose) into lactic acid and energy, according to the following formula:
C6H12O6 + lactic acid bacteria → 2CH3CHOHCOOH + 22.5 kcal (4)
The presence of lactic acid significantly lowers the pH level of milk. Low pH (pH of 4.6 at 20 °C)
leads to casein coagulation, resulting in milk clot formation. The milk quality is determined by the
level of bacteria present in it, but the exact limits vary from country to country. For our study we
defined high quality milk as containing less than 50,000 bacteria per 1 cm3, the medium quality as
containing up to 300,000 bacteria per 1 cm3 and beyond that level as low quality. The quantities of
bacteria are not uniform in milk samples and can change over time at different rates, the milk quality
remaining constant only during the first 24 hours of storage at 10 °C, as set forth in Figure 16.
Figure 16. Total bacteria count of raw milk samples stored under different conditions.
25 30 35 40 45 50
Sample storage tIme [hrs]
hIgh hIgh
medIum low low
Tota
l bact
eria
cou
nt [
10
/cm
]3
3
25 30 35 40 45 50
Sample storage tIme [hrs]
Tota
l bac
teri
a co
unt [
10
/cm
]3
3
Storage at const temp = ° 21 C500
450
400
350
300
250
200
150
100
50
0
600
500
400
300
200
100
0
Storage at const temp = 10°C in the first 24hrs, next 21°C
Initial sample quality:
To explore the influence of temperature on the structure of milk, we examined samples prepared
from commercial milk powder and bottled water, stirred with a magnetic stirrer. The sample was
stored at 20 °C until there were visible differences in the measured characteristics, which relate to the
action of airborne bacteria. The samples were examined at temperatures up to a maximum of 90 °C, or
until bubbles appeared. The appearance of a bubble is accompanied by a significant depression in the
strength of the optical signal, which is not scattered. This happens when the milk is fresh. When the
milk is spoiled by bacteria growth, a clot will form in the capillary upon local heating, and the signal
depression will look different as illustrated by signals from samples stored for a time ranging from 31
to 44 minutes (Figure 17), for 6 hours (Figure 18) and for 15 hours (Figure 19). The differences of the
signals are due to the increasing number of bacteria and can be calibrated in terms of the bacteria count
[92]. The classification of samples by storage time was investigated with ANN. To create the sample
model, we measured optical signal magnitude at time points of 0, 5, 12.5, and 30 seconds from the

Sensors 2010, 10
3790
start of the measuring procedure. These points are labeled respectively as: S1(= 0 s), S2(= 5 s),
S3(= 12.5 s), S4(= 30 s). Two other symbols used here are: hoff–time when the heater was turned
off, and Sstdmin – standard deviation of the signal amplitude at its minimum. The ANN output
configuration was {1,0} for samples stored for less than 44 minutes and {0,1} for storage times greater
than 6 hours. The correlation coefficient of learned ANN outputs with assumed outputs was 0.94 and
the root mean square (RMS) error was 0.049 which means that the network can clearly distinguish the
samples. The signals S2(= 5 s), S3(= 12.5 s) and hoff contain 70% of the information. The possibility
of classification to reveal the presence of bacteria in the tested milk samples stored for times of up to
14 hours is not obvious from Figures 17 and 18, but with ANN can be done. When the storage time
was extended to 15 hours, the correlation coefficient for the same model between the learned and the
measured outputs was 0.98. As expected, this is a higher value than for the previous case, indicating
that a longer time of sample storing simplifies the test conditions.
Figure 17. Signals from milk samples after storage of 31 to 44 minutes.
0 5 10 15 20 25 300
0.05
0.1
0.15
0.2
0.25
0.3
Local time of measuring [s]
0:310:340:370:390:44
Sample storage time [hour:min]:t
Opt
ical
sig
nal [
a.u.
]
Figure 18. Signals from milk samples stored for about 6 hours.
5 10 15 20 25 3000
0.05
0.1
0.15
0.2
0.25
0.36:096:116:126:146:16
Local time of measuring [s]
Sample storage time [hour:min]:t
Opt
ical
sig
nal [
a.u.
]

Sensors 2010, 10
3791
Figure 19. Signals from milk samples stored for about 15 hours.
0 5 10 15 20 25 300
0.05
0.1
0.15
0.2
0.25
0.3 14:5314:5715:0115:0415:08
Local time of measuring [s]
Sample storage time [hour:min]:t
Opt
ica
l sig
nal [
a.u.
]
The interesting point here is that in this case the information is spread almost uniformly over the
signal model with the exception of Sstdmin, which means that parameter does not contribute significantly
to the characterization. From the above experiments, it is clear that a replaceable capillary optrode
works well and is capable of classifying milk with accuracy comparable to that of the fixed
construction sensor shown in Figure 12.
5. Conclusions
Capillary sensors are highly promising for microfluidics applications that require a very low total
sample volume. The chemically sensitive layers enable selective monitoring of liquids but have a
limited lifetime. Equipped with local sample heating and information processing capability, capillary
sensors merit further development work. They need no chemical reagents. The selectivity of tests
incorporating the use of an ANN reaches far beyond what could be obtained with classical photonic
sensors and confirms the potential of the proposed devices as useful tools for analyzing the
composition of liquids, with the possibility of important practical applications in rapid diagnostics. The
operation of capillary sensors is relatively simple, particularly when replaceable optrodes are used,
making them well suited for applications in point-of-care systems. However, to be accepted for
widespread consumer and industrial applications, they will need much more system integration, ideally
leading to hand-held devices. This step will require embedding of light sources and detectors in a
single plane, but in separated areas, which should be achievable using hybrid technologies.
Acknowledgements
This work was supported in part by grants from the Discovery Program of the Natural Sciences and
Engineering Research Council of Canada and from the Canada Foundation for Innovation, and by the
European Union structural funds grant MNS-DIAG task 2A.
References
1. Wolfbeis, O.S. Fiber-Optic Chemical Sensors and Biosensors. Anal. Chem. 2008, 80, 4269-4283.
2. Wolfbeis, O.S. Fiber-Optic Chemical Sensors and Biosensors. Anal. Chem. 2006, 78, 3859-3874.
Sensors 2010, 10
3792
3. Wolfbeis, O.S. Fiber-Optic Chemical Sensors and Biosensors. Anal. Chem. 2004, 76, 3269-3284.
4. Wolfbeis, O.S. Fiber-Optic Chemical Sensors and Biosensors. Anal. Chem. 2000, 72, 81-90.
5. Baldini, F.; Chester, A.N.; Homola, J.; Martellucci, S. Optical Chemical Sensors (NATO Science
Series II: Mathematics, Physics and Chemistry v. 224); Springer Science + Business Media:
Berlin, Germany, 2006. 6. Righini, G.C.; Tajani, A.; Cutolo, A. An Introduction to Optoelectronic Sensors; World Scientific
Publishers: Singapore, 2009.
7. Weigl, B.H.; Wolfbeis, O.S. Capillary Optical Sensors. Anal. Chem. 1994, 66, 3323-3327.
8. Wolfbeis, O.S. Capillary Waveguide Sensors. Trac. Trend Anal Chem. 1996, 15, 225-232.
9. Baldini,F.; Giannetti, A. Optical Chemical and Biochemical Sensors: New Trends. Proc. SPIE
2005, 5826, 485-499.
10. Integrated Project CLINICIP IST-FP6-506965. Publishable Final Activity Report. Available online:
http://www.clinicip.org/fileadmin/clinicip/CLINICIP-Final-Report.pdf/ (accessed on 29 March 2010).
11. Dress P.; Franke, H. A Cylindrical Liquid-Core Waveguide. Appl. Phys. B: Lasers Opt. 1996, 63,
12-19.
12. Dallas, T.; Dasgupta, P.K. Light at the End of the Tunnel: Recent Analytical Applications of
Liquid-core Waveguides. Trends Anal. Chem. 2004, 23, 385-392.
13. Altkorn, R.; Koev, I.; Van Duyne, R.P.; Litorja, M. Low-loss Liquid-core Optical Fiber for
Low-refractive-index Liquids: fabrication. Appl. Opt. 1997, 36, 8992-8998.
14. Campopiano, S.; Bernini, R.; Zeni, L.; Sarro, P.M. Microfluidic Sensor Based on Integrated
Optical Hollow Waveguides. Optics Letters 2004, 29, 1896-1896.
15. Bravo, J.; Matias, I.R.; Del Villar, I.; Corres, J.M.; Arregui, F.J. Nanofilms on Hollow Core
Fiber-based Structures: An Optical Study. J. Lightwave Technol. 2006, 24, 2100-2107.
16. Baldini, F.; Giannetti, A.; Mencaglia, A.A. Optical sensor for interstitial pH measurements. J.
Biomed. Opt. 2007, 12, 024024; doi:10.1117/1.2714807.
17. Del Bianco, A.; Baldini, F.; Bacci, M.; Wolfbeis, O.S.; Klimant, I. Oxygen Detection via Optical
Fibers Using Bis(Histidinato) Cobalt(II) as Indicator. Mol. Cryst. Liq. Cryst. 1993, 229, 241-245.
18. Dasgupta, P.K.; Genfa, Z.; Poruthoor, S.K.; Caldwell, S.; Dong, S.; Liu, S.Y. High-Sensitivity
Gas Sensors Based on Gas-Permeable Liquid Core Waveguides and Long-Path Absorbance
Detection. Anal. Chem. 1998, 70, 4661-4669.
19. Bizzarri, A.; Koehler, H.; Cajlakovic, M.; Pasic, A.; Schaupp, L.; Klimant, I.; Ribitsch, V.
Continuous Oxygen Monitoring in Subcutaneous Adipose Tissue Using Microdialysis. Anal.
Chim. Acta 2006, 573-574, 48-56.
20. Cox, F.M.; Argyros, A.; Large, M.C.J. Liquid-filled Hollow core Microstructured Polymer
Optical Fiber. Optics Express 2006, 14, 4135-4140.
21. Caron, S.; Pare, C.; Proulx. A.; Grenier, P.; Matejec, V. Velocity Measurements Comparison of
Water and Pentane Travelling in Capillary Optical Fibers Coated Respectively With Xerogel and
a Poly(Dimethylsiloxane) Absorbing Layer. Proc. SPIE 2009, 7386, 73861E.
22. Miluski, P.; Dorosz, D. Measurement of Refractive Index Using Capillary Waveguide. Proc. SPIE
2006, 6347, 634742.
23. Zamora, V.; Díez, A.; Andrés, M.V.; Gimeno, B. Refractometric Sensor Based on
Whispering-Gallery Modes of Thin Capillarie. Opt. Exp. 2007, 15, 12011-12016.

Sensors 2010, 10
3793
24. Zhu, H.; White, I.M.; Suter, J.D.; Dale, P.S.; Fan, X. Analysis of Biomolecule Detection With
Optofluidic Ring Resonator Sensors. Opt. Exp. 2007, 15, 9139-9146.
25. Abgrall, P.; Gue, A.M. Lab-on-Chip Technologies: Making a Microfluidic Network and Coupling
It into a Complete Microsystem–A Review. J. Micromech. Microeng. 2007, 17, R15-R49.
26. Luan, L.; Evans, R.D.; Jokerst, N.M.; Fair, R.B., Integrated Optical Sensor in a Digital
Microfluidic Platform. IEEE Sensor. J. 2008, 8, 628-635
27. Woias, P. Micropumps-Past Progress and Future Prospects. Sens. Actuator. B 2005, 105, 28-38.
28. Bartels Mikrotechnik. Available online: http://www.bartels-mikrotechnik.de/index.php/Micro-
pumps.html/ (accessed on 29 March 2010).
29. Bartels Mikrotechnik. Available online: http://www.bartels-mikrotechnik.de/index.php/Micro-
valves./html/ (accessed on 29 March 2010).
30. Polymer Capillary Tubing (microtubing). Available online: http://www.paradigmoptics.com/
capillary/capillary.html/ (accessed on 30 March 2010).
31. Liquid Waveguide Capillary Cell. Available online: http://www.wpiinc.com/pdf/lwcc-im-040208
.pdf/ (accessed on 30 March 2010).
32. Yang, M.K.; French, R.H.; Tokarsky, E.W. Optical Properties of Teflon® AF Amorphous
Fluoropolymers. J. Micro/Nanolith. MEMS MOEMS 2008, 7, 033010.
33. Waterbury, R.D.; Yao, W.; Byrne, R.H. Long Pathlength Absorbance Spectroscopy: Trace
Analysis of Fe(II) Using a 4.5 M Liquid Core Waveguide. Anal. Chem. Acta 1997, 357, 99-102.
34. Kozodoy, R.L.; Micheels, R.H.; Harrington, J.A. Small-Bore Hollow Waveguide Infrared
Absorption Cells for Gas Sensing. Appl. Spectrosc. 1996, 50, 415-41.
35. De Melas, F.; Pustogov, V.V.; Croitoru, N.; Mizaikoff, B.; Development and Optimization of a
Mid-Infrared Hollow Waveguide Gas Sensor Combined with a Supported Capillary Membrane
Sampler. Appl. Spectrosc, 2003, 57, 600-606.
36. De Melas, F.; Pustogov V.V.; Wolcott, D.K.; Olson, D.C.; Inberg, A.; Croitoru, N.; Mizaikoff, B.
Combination of a Mid-infrared Hollow Waveguide Gas Sensor With a Supported Capillary
membrane sampler for the detection of organic compounds in water. Intern. J. Environ. Anal.
Chem. 2003, 83, 573-583.
37. Charlton, C.; de Melas, F.; Inberg, A.; Croitoru, N.; Mizaikoff, B. Hollow-waveguide Gas
Sensing With Room-temperature Quantum Cascade Lasers. IEE Proc.-Optoelectron. 2003, 150,
306-309.
38. Wu, S.; Deev, A.; Haught, M.; Tang, Y. Hollow Waveguide Quantum Cascade Laser
Spectrometer as an Online Microliter Sensor for Gas Chromatography. J. Chromat. A. 2008,
1188, 327-330.
39. Yang, J.; Her, J.W.; Chen, S.H. Development of an Infrared Hollow Waveguide as a Sensing
Device for Detection of Organic Compounds in Aqueous Solutions. Anal. Chem. 1999, 71,
3740-3746.
40. Yang, J.; Lee, C.J. Development of the Infrared Hollow Waveguide Sampler for the Detection of
Chlorophenols in Aqueous Solutions. J. AOAC Int. 2002, 85, 163-172.
41. Yang, J.; Chen, P.Y. Development of an Infrared Hollow Waveguide Sampler for the Detection of
Organic Compounds in Aqueous Solutions with Limited Sample Volumes. Anal. Sci. 2002, 18,
555-560.
Sensors 2010, 10
3794
42. Ligler, F.S.; Breimer, M.; Golden, J.P.; Nivens, D.A.; Dodson, J.P.; Green, T.M.; Haders, D.P.;
Sadik, O.A. Integrating Waveguide Biosensor, Anal. Chem. 2002, 74, 713-719.
43. Branzalov, P.P.; Ivanov, L.M.; Pavlov, L.I. Fiberoptic Displacement Sensor with a Short Hollow
Metal Optical Waveguide. Rev. Sci. Instr. 1999, 70, 2166-2168.
44. Shi, C.; Lu, C.; Gu, C.; Tian, L.; Newhouse, R.; Chen, S.; Zhang, J.Z. Inner Wall Coated Hollow
Core Waveguide Sensor Based on Double Substrate Surface Enhanced Raman Scattering. App.
Phys. Lett. 2008, 93, 153101-1–153101-3.
45. Zhang, J.; Hoogmartens, J.; Van Schepdael, A. Advances in Capillary Electrophoretically
Mediated Microanalysis: An Update. Electrophoresis 2008, 29, 56-65.
46. Dabek-Zlotorzynska, E.; Celo, V.; Yassine, M.M. Recent Advances in CE and CEC of Pollutants.
Electrophoresis 2008, 29, 310-323.
47. Herrero, M.; Garcia-Caňas, V.; Simo, C.; Cifuentes, A. Recent Advances in the Application of
Capillary Electromigration Methods for Food Analysis and Foodonomics. Electrophoresis 2010,
31, 205-228.
48. El Rassi, Z. Electrophoretic and Electrochromatographic Separation of Proteins in Capillaries: An
Update Covering 2007-2009. Electrophoresis 2010, 31, 174-191.
49. Breadmore, M.C.; Thabano, J.R.E.; Dawod, M.; Kazarian, A.A.; Quirino, J.P.; Guijt, R.M. Recent
Advances in Enhancing the Sensitivity of Electrophoresis and Electrochromatography in
Capillaries and Microchips (2006-2008). Electrophoresis 2009, 30, 230-248.
50. Escarpa, A.; González, M.C.; Gil, M.A.L.; Crevillén, A.G.; Hervás M.; García, M., Microchips
for CE: Breakthroughs in Real-World Food Analysis. Electrophoresis 2009, 29, 4852-4861.
51. Macka, M.; Yang, W.C.; Zakaria, P.; Shitangkoon, A.; Hilder, E.F.; Andersson, P.; Nesterenko,
P.; Haddad, P.R. Poly (terafluoroethylene) Separation Capillaries for Capillary Electrophoresis.
Properties and Applications, J. Chromatogr. A 2004, 1039, 193-199.
52. Osbourn, D.M.; Weiss, D.J.; Lunte, C.E. On-Line Preconcentration Methods for Capillary
Electrophoresis. Electrophoresis 2000, 21, 2768-2779.
53. Melanson, J.E.; Lucy, C.A. Violet (405 nm) Diode Laser for Laser Induced Fluorescence
Detection in Capillary Electrophoresis. Analyst 2000, 125, 1049-1052.
54. Gomez, J.E.; Sandoval, J.E. The Effect of Conditioning of Fused-Silica Capillaries on Their
Electrophoretic Performance. Electrophoresis 2008, 29, 381-392.
55. Fujimoto, J.G. Optical Coherence Tomography for Ultrahigh Resolution in Vivo Imaging. Nat.
Biotechnol. 2003, 21, 1361-1366.
56. Huang, D.; Swanson, E.A.; Lin, C.P.; Schuman, J.S.; Stinson, W.G.; Chang, W.; Hee, M.R.;
Flotte, T. Gregory, K. Puliafito, C.A.; Fujimoto, J.G. Optical Coherence Tomography. Science
1991, 254, 1178-81.
57. Zysk, A.M.; Nguyen, F.T.; Oldenburg, A.L.; Marks, D.L.; Boppart S.A. Optical Coherence
Tomography: A Review of Clinical Development from Bench to Bedside. J. Biomed. Opt. 2007,
12, 051403.
58. Fercher, A.F.; Hitzenberger, C.K.; Drexler, W.; Kamp, G.; Sattmann H. In Vivo Optical
Coherence Tomography. Am. J. Ophthalmol. 1993, 116, 113-114.
Sensors 2010, 10
3795
59. Popescu, D.P.; Sowa, M.G. In Vitro Assessment of Optical Properties of Blood by Applying the
Extended Huygens-Fresnel Principle to Time-Domain Optical Coherence Tomography Signal at
1300nm. Int. J. Biomed. Imaging 2008, 591618, 6.
60. Texas Instruments. Available online: http://focus.ti.com/docs/prod/folders/print/opt101.html
(accessed on 29 March 2010).
61. Texas Instruments. Available online: http://focus.ti.com/docs/prod/folders/print/uaf42.html/
(accessed on 29 March 2010).
62. Mignani, A.G.; Mencaglia, A.A.; Ciaccheri, L. Fiber-Optic System for Colorimetry and Scattered
Colorimetry. Proc. SPIE 2005, 5952, 59520D.
63. Mastichiadis, C.; Niotis, A.E.; Petrou, P.S.; Kakabakos, S.E.; Misiakos, K. Capillary-Based
Immunoassays, Immunosensors and DNA Sensors–Steps Towards Integration and
Multi-Analysis. Trend Anal. Chem. 2008, 27, 771-784.
64. Weigl, B.H.; Lehmann, H.; Lippitsch, M.E. Optical Sensors Based on Inhomogeneous
Waveguiding in the Walls of Capillaries (‘Capillary Waveguide Optrodes’). Sens. Actuator. B
1996, 32, 175-179.
65. Paprocki, E.D.; Keller, B.K.; Palmer, C.P.; Laws, W.R.; DeGrandpre, M.D. Characterization of
Long Pathlength Capillary Waveguides for Evanescent Fluorescent Sensing Applications. Sens.
Actuator. B 2008, 135, 145-151.
66. Lippitsch, M.E.; Draxler, S.; Kieslinger, D.; Lehmann, H.; Weigl, B.H. Capillary Waveguide
Optrodes-A Novel Approach to Optical Sensing in Medical Diagnostics. Appl. Opt. 1996, 35,
3426-3431.
67. Kieslinger, D.; Draxler, S.; Trznadel,K.; Lippitsch, M.E. Lifetime-based Capillary Waveguide
Sensor Instrumentation. Sens. Actuator. B 1997, 38-39, 300-304
68. Draxler, S. Lifetime Based Sensors/Sensing, Topics in Fluorescence. Spectroscopy 2005, 10,
241-274.
69. Mastichiadis, C.; Kakabakos, S.E.; Christofidis, I.; Koupparis, M.A.; Willetts, C.; Misiako, K.
Simultaneous Determination of Pesticides Using a Four-Band Disposable Optical Capillary
Immunosensor. Anal Chem. 2002, 74, 6064-6072.
70. Čajlaković, M.; Bizzarri A.; Ribitsch V. Luminescence Lifetime-Based Carbon Dioxide Optical
Sensor for Clinical Applications Anal. Chim. Acta 2006, 573-574, 57-64.
71. Baldini, F.; Giannetti, A.; Mencaglia, A.A. Optical Sensor for Interstitial pH Measurements. J.
Biomedical. Optics 2007, 12, 024024.
72. Pasic, A.; Koehler, H.; Schaupp, L.; Pieber, T.R.; Klimant, I. Fiber-optic Flow-through Sensor for
Online Monitoring of Glucose. Anal. Bioanal. Chem. 2006, 386, 1293-1302.
73. Pasic A.; Koehler H.; Klimant I.; Schaupp L. Miniaturized Fiber-optic Hybrid Sensor for
Continuous Glucose Monitoring in Subcutaneous Tissue. Sens. Actuator. B 2007, 122, 60-68.
74. Corres, J.M.; Matias, I.R.; Hernaez, M.; Bravo, J.; Arregui, F.J. Optical Fiber Humidity Sensors
Using Nanostructured Coatings of SiO2 Nanoparticles, IEEE Sensors J. 2008, 8, 281-286.
75. Cusano, A.; Giordano, M.; Cutolo, A.; Pisco, M.; Consales, M. Integrated Development of
Chemoptical Fiber Nanosensors. Curr. Anal. Chem. 2008, 4, 296-315.

Sensors 2010, 10
3796
76. Buosciolo, A.; Consales, M.; Pisco, M.; Cusano, A.; Giordano, M. Fiber-Optic Near-Field
Chemical Sensors Based on Wavelength Scale Tin Dioxide Particle Layers. J. Lightwave Techno.
2008, 26, 3468-3475.
77. Borecki, M. Intelligent Fiber Optic Sensor for Estimating the Concentration of a Mixture-Design
and Working Principle. Sensors 2007, 7, 384-399.
78. Consales, M.; Crescitelli, A.; Penza, M.; Aversa, P.; Delli Veneri, P.; Giordano, M.; Cusano, A.
SWCNT Nano-Composite Optical Sensors for VOC and Gas Trace Detection. Sens. Actuator. B
2009, 13, 351-361.
79. Guillemain, H.; Rajarajan, M.; Sun, T.; Grattan, K.T.V.; Lin, Y.C.; Chen, C.T. A Disposable
Optical Fiber-Based Capillary Probe for Sensing Lead Ions. IEEE Sensors J. 2008, 8, 1656-1662.
80. Borecki, M.; Korwin-Pawlowski, M.L.; Bebłowska, M. A Method of Examination of Liquids by
Neural Network Analysis of Reflectometric and Transmission Time Domain Data from Optical
Capillaries and Fibers. IEEE Sensors J. 2008, 8, 1208-1213.
81. Sohn, Y.S.; Goodey, A.; Anslyn, E.V.; McDevitt, J.T.; Shear, J.B.; Neikirk, D.P. A Microbead
Array Chemical Sensor Using Capillary-Based Sample Introduction: Toward the Development of
an “Electronic Tongue”. Biosens. Bioelectron. 2005, 21, 303-312.
82. Zhao, J.; Fyles, T.M.; James T.D. Chiral Binol-Bisboronic Acid as Fluorescence Sensor for Sugar
Acids. Angew. Chem. Int. Ed. Engl. 2004, 43, 3461-3464.
83. Zhao, J.; Davidson, M.G.; Mahon, M.F.; Kociok-Köhn, G.; James, T.D. An Enantioselective
Fluorescent Sensor for Sugar Acids. J. Am. Chem. Soc. 2004, 126, 16179-16186.
84. Li, J.; Dasgupta, P.K.; Genfa, Z. Transversely Illuminated Liquid Core Waveguide Based
Fluorescence Detection Fluorometric Flow Injection Determination of Aqueous
Ammonium/Ammonia. Talanta 1999, 50, 617-623.
85. Valentino, J.P.; Troian, S.M.; Wagner, S. Microfluidic Detection and Analysis by Integration of
Thermocapillary Actuation with a Thin-Film Optical Waveguide. Appl. Phys. Lett. 2005, 86,
184101.
86. Pogodina, O.A.; Pustogov, V.V.; de Melas, F.; Haberhauer-Troyer, C.; Rosenberg, E.; Puxbaum,
H.; Inberg, A.; Croitoru, N.; Mizaikoff, B. Combination of Sorption Tube Sampling and Thermal
Desorption with Hollow Waveguide FT-IR Spectroscopy for Atmospheric Trace Gas Analysis:
Determination of Atmospheric Ethene at Lower ppb Level. Anal. Chem. 2004, 76, 464-468.
87. Borecki, M.; Korwin-Pawlowski, M.L.; Wrzosek, P.; Szmidt, J. Capillaries as the Components of
Photonic Sensor Micro-Systems. Meas. Sci. Technol. 2008, 19, 065202.
88. Pure Component Properties. Available online: http://www.cheric.org/research/kdb/hcprop/
cmpsrch.php/ (accessed on 30 March 2010).
89. Warrant, J.H.; Adewumi, M.A. Polynomial Objective Functions for Flash Calculations. Ind. Eng.
Chem. Res. 1993, 32, 1528-1530.
90. Weigl, B.; Domingo, G.; LaBarre, P.; Gerlach, J. Towards non- and Minimally Instrumented,
Microfluidics-Based Diagnostic Devices. Lab Chip 2008, 8, 1999-2014.
91. Romaniuk, R.; Dorosz, J. Technology of Soft-Glass Optical Fiber Capillaries. Proc. SPIE 2006,
6347, 634710.

Sensors 2010, 10
3797
92. Borecki, M.; Szmidt, M.; Korwin-Pawlowski, M.L.; Beblowska, M.; Niemiec, T.; Wrzosek, P. A
Method of Testing the Quality of Milk Using Optical Capillaries. Photon. Let. Pol. 2009, 1,
37-39.
93. Dress, P.; Belz, M.; Klein, K.F.; Grattan, K.T.V.; Franke, H. Water-Core-Waveguide for Pollution
Measurements in the Deep Ultra-Violet. Applied Optics 1998, 37, 4991-4997.
94. Karlsson, A.O.; Ipsen, R.; Ardo, Y. Relationship Between Physical Properties of Casein Micelles
and Rheology of Skim Milk Concentrate. J. Dairy Sci. 2005, 80, 3784-3797.
95. McMahon, D.J.; Brown, R.J. Composition, Structure and Integrity of Casein Micelles: A Review.
J. Dairy Sci. 1984, 67, 499-512.
© 2010 by the authors; licensee Molecular Diversity Preservation International, Basel, Switzerland.
This article is an open-access article distributed under the terms and conditions of the Creative
Commons Attribution license (http://creativecommons.org/licenses/by/3.0/).