options for project emission baselines - organisation for economic
TRANSCRIPT

Organisation for Economic Co-operation and Development 2000International Energy AgencyOrganisation de Coopération et de Développement EconomiquesAgence internationale de l'énergie
COM/ENV/EPOC/IEA/SLT(2000)8
OECD ENVIRONMENT DIRECTORATEAND
INTERNATIONAL ENERGY AGENCY
OPTIONS FOR PROJECT EMISSION BASELINES
INFORMATION PAPER
COM/ENV/EPOC/IEA/SLT(2000)8
2
FOREWORD
This document was prepared by the OECD and IEA Secretariats in October 1999 at the request ofthe Annex I Expert Group on the United Nations Framework Convention on Climate Change.The Annex I Expert Group oversees development of analytical papers for the purpose ofproviding useful and timely input to the climate change negotiations. These papers may also beuseful to national policy makers and other decision-makers. In a collaborative effort, authorswork with the Annex I Expert Group to develop these papers. However, the papers do notnecessarily represent the views of the OECD or the IEA, nor are they intended to prejudge theviews of countries participating in the Annex I Expert Group. Rather, they are Secretariatinformation papers intended to inform Member countries, as well as the UNFCCC audience.
The Annex I Parties or countries referred to in this document refer to those listed in Annex I tothe UNFCCC (as amended at the 3rd Conference of the Parties in December 1997): Australia,Austria, Belarus, Belgium, Bulgaria, Canada, Croatia, Czech Republic, Denmark, the EuropeanCommunity, Estonia, Finland, France, Germany, Greece, Hungary, Iceland, Ireland, Italy, Japan,Latvia, Liechtenstein, Lithuania, Luxembourg, Monaco, Netherlands, New Zealand, Norway,Poland, Portugal, Romania, Russian Federation, Slovakia, Slovenia, Spain, Sweden, Switzerland,Turkey, Ukraine, United Kingdom of Great Britain and Northern Ireland, and United States ofAmerica. Where this document refers to “countries” or “governments” it is also intended toinclude “regional economic organisations”, if appropriate.
ACKNOWLEDGEMENTS
This paper was prepared by Jane Ellis (OECD) and Martina Bosi (IEA) under the guidance of JanCorfee-Morlot (OECD) and Jonathan Pershing (IEA). The authors thank Mark Stevens(Australia), Satender Singh (Canada), Mette Nedergaard (Denmark), Jean-Jacques Becker(France), Tiit Kallaste (Estonia), Murray Ward (New Zealand), Anne Johanne Enger (Norway),Anne Arquit-Niederburger and José Romero (Switzerland) and Maurice LeFranc and ShariFriedman (US) for the information, comments and ideas they provided. The authors are alsograteful to Debbie Stowell and Axel Michaelowa for their suggestions. Jean Cinq-Mars,Stéphane Willems, Gene McGlynn and Thomas Martinsen (OECD), and Kristi Varangu, RichardBaron, John Paffenbarger, Jeffery Piper and Maria Argiri (IEA) also provided advice andcomments.
Questions and comments should be sent to:
Jane EllisAdministratorEnvironment DirectorateOrganisation for Economic Co-operation and Development2 rue André Pascal75016 Paris, FRANCETel: +33 1 4524 9697Fax: +33 1 4524 7876E-mail: [email protected]

COM/ENV/EPOC/IEA/SLT(2000)8
3
TABLE OF CONTENTS
EXECUTIVE SUMMARY .......................................................................................................................... 5
1. INTRODUCTION................................................................................................................................ 9
1.1 OBJECTIVES AND APPROACH................................................................................................. 91.2 CONTEXT.................................................................................................................................... 10
2. BASELINE APPROACHES DESCRIBED..................................................................................... 12
2.1 PROJECT-SPECIFIC BASELINES............................................................................................. 152.2 MULTI-PROJECT BASELINES ................................................................................................. 162.3 HYBRID PROJECT BASELINES............................................................................................... 17
3 CROSS-CUTTING THEMES .......................................................................................................... 20
3.1 DYNAMIC VS STATIC BASELINES........................................................................................ 203.2 EMISSIONS TIMELINE ............................................................................................................. 213.3 DATA SOURCES ........................................................................................................................ 22
4 QUANTITATIVE COMPARISON OF BASELINE APPROACHES.......................................... 23
4.1 SURVEY OF EXPERIENCE WITH DIFFERENT BASELINE APPROACHES ...................... 234.1.1 Conversion of heat plants in the Czech Republic.................................................................. 234.1.2 Boiler conversions in Estonia ............................................................................................... 244.1.3 Other projects ....................................................................................................................... 25
4.2 SURVEY OF EXPERIENCE WITH DIFFERENT BASELINE ASSUMPTIONS .................... 274.3 CASE STUDY SIMULATIONS WITH MULTI-PROJECT BASELINES................................. 28
4.3.1 Electricity Generation in Brazil............................................................................................ 294.3.2 Electricity Generation in India ............................................................................................. 314.3.3 Simulation Results ................................................................................................................ 33
5 QUALITATIVE COMPARISON OF DIFFERENT BASELINE APPROACHES..................... 34
5.1 DATA, MONITORING AND REPORTING REQUIREMENTS ............................................... 345.2 BASELINE DEVELOPMENT COST ......................................................................................... 355.3 TRANSPARENCY AND EASE OF THIRD PARTY VERIFICATION .................................... 365.4 ENVIRONMENTAL EFFECTIVENESS .................................................................................... 37
5.4.1 Project-level environmental additionality ............................................................................ 375.4.2 Overall environmental effectiveness of JI/CDM ................................................................... 39
6 CONCLUSIONS ................................................................................................................................ 42
ANNEX A: POSSIBLE REPORTING REQUIREMENTS FOR BASELINES.................................. 45
ANNEX B: DATA USED TO ASSESS DIFFERENT POSSIBLE BASELINE ASSUMPTIONS ININDIA AND BRAZIL................................................................................................................................. 50
REFERENCES ........................................................................................................................................... 54
GLOSSARY ................................................................................................................................................ 57

COM/ENV/EPOC/IEA/SLT(2000)8
4
LIST OF TABLES
Table 1: TERMINOLOGY OF DIFFERENT BASELINE APPROACHES..................................................... 14Table 2: POTENTIAL FOR STANDARDISING DIFFERENT COMPONENTS OF EMISSION
BASELINES........................................................................................................................................ 18Table 3: REPLACING OLD POWER PLANT WITH NEW PLANT USING RENEWABLE
ENERGIES – EXAMPLES OF SUGGESTED BASELINES AND TIMELINES ............................. 19Table 4: VARIATION IN CALCULATED CARBON OFFSETS UNDER DIFFERENT
BASELINES: SIMULATED SWISS/CZECH PROJECTS ............................................................... 24Table 5: COMPARING FOUR ESTIMATES OF THE EMISSION BENEFITS FROM
VILJANDI BOILER CONVERSION AIJ PROJECT......................................................................... 26Table 6: SUMMARY AND COMPARISON OF DIFFERENT BASELINE APPROACHES......................... 41
Table A1: Estimated Energy Use and Carbon Emissions in Baseline [at time of projectregistration].......................................................................................................................................... 47
Table A2: Estimated Gross Changes in Energy Use and Carbon Emissions from Project [at timeof project registration].......................................................................................................................... 48
Table A3: Estimated Net Changes in Energy Use and Carbon Emissions from Project [at time ofproject registration].............................................................................................................................. 49
Table B1: C02 Emissions from Electricity Generation, Brazil ............................................................................. 50Table B2: Cost of Electricity Generation, Brazil.................................................................................................. 51Table B3: C02 Emissions from Electricity Generation, India ............................................................................... 52Table B4: Cost of Electricity Generation, India ................................................................................................... 54
LIST OF FIGURES
Figure 1: REPRESENTATION OF DIFFERENT BASELINE APPROACHES ............................................... 13Figure 2: COMPARISON OF DECIN PROJECT BASELINES........................................................................ 27Figure 3: EFFECT OF DIFFERENT BASELINE ASSUMPTIONS ON BASELINE LEVELS,
BRAZIL............................................................................................................................................... 30Figure 4: EFFECT OF DIFFERENT ASSUMPTIONS ON BASELINE LEVELS, INDIA.............................. 32Figure 5: POSSIBLE EFFECT OF BASELINE STRINGENCY AND COMPLEXITY ON
PROJECT NUMBERS AND PROJECT’S ENVIRONMENTAL ADDITIONALITY...................... 40
COM/ENV/EPOC/IEA/SLT(2000)8
5
Executive Summary
The Kyoto Protocol establishes two project-based mechanisms: the clean developmentmechanism (CDM) and Joint Implementation (JI). Emission baselines for JI and CDM projectsaim to quantify “what would have happened” in terms of greenhouse gas emissions in the absenceof those projects. Actual emissions from JI or CDM projects are measured against baselineemissions, and, if lower, can generate emission credits. Baselines are, by definition, hypotheticalreference cases and are subject to a number of uncertainties.
There are differing views about whether or not CDM and JI require the same framework forsetting baselines. This paper does not attempt to prejudge the outcome or potential implicationsof political negotiations on this issue. The paper focuses on the technical aspects of baselines.
Once established, rules and/or guidance for JI and CDM under the Kyoto Protocol are expected tocover many aspects of the mechanisms and not just the baseline. The linkages between theemissions baseline and other aspects of project-based mechanisms, such as eligibility criteria andmonitoring and reporting requirements means that the rules for one may influence others.
There are different ways to set up an emissions baseline. Ideally, baselines should be credible,transparent, simple and inexpensive to set up. In practice, drawing up baselines is likely toinvolve tradeoffs among these criteria. Moreover, the level of baseline aggregation andstandardisation can vary widely. Baselines can be established so they apply to one project only(“project-specific”), aggregated to a sub-sector or sector level (“multi-project”), or be in a greyarea somewhere between these two levels of aggregation (“hybrid”). The literature also mentionsthe possibility of aggregated nationwide baselines (“top-down”), but this paper focuses on thethree other approaches.
Project-specific baselines are the least aggregate type of emission baselines, and evaluateemission reductions generated from one particular project (rather than a group of similarprojects). These baselines are established by using project-specific assumptions, measurements,or simulations for all key parameters: they tend to take output levels into account implicitly ratherthan explicitly. Most AIJ projects to date have used project-specific baselines when calculatingthe emission benefits of those projects.
Multi-project baselines seek to standardise emission levels or rates, and are designed to beapplicable to multiple projects of a similar type. Individual projects would be measured againstthese baselines to see whether or not they were eligible for emissions credits, and, if so, howmany credits they would generate. Multi-project baselines may be calculated based onassumptions about the emissions rate (e.g. g CO2/kWh) as well as on an absolute emissions level.Multi-project baselines can be highly aggregate and be applied to many projects, or fairlydisaggregated and applied to a smaller range or number of projects.
Hybrid baselines would be designed for projects that do not quite “fit the mould” for a multi-project baseline, or would simplify the process of collecting and monitoring data for projectswhich are unique and thus require individually tailored baselines. Hybrid baselines would bemore aggregate and standardised than project-specific baselines and less aggregate andstandardised than multi-project baselines. Hybrid emission baselines would, like project-specificbaselines, be made up of various components. But the parameter values, or the methodology usedto determine one or more of the baseline’s underlying data points, would be standardised. This

COM/ENV/EPOC/IEA/SLT(2000)8
6
would mean that establishing a hybrid baseline would be a more streamlined process thanestablishing a project-specific baseline.
Some cross-cutting issues are relevant to all baseline approaches. These include the length of timeemission credits can accrue, and whether or not the baseline is fixed at the start of the project(static) or revised during the project operation (dynamic). Static baselines are predictable andreduce the uncertainty surrounding the level of credits generated from a project. Dynamicbaselines may better reflect actual trends, but would need to be re-estimated and re-reported atcertain intervals. A number of analyses suggest that dynamic baselines may be more appropriatefor some project types.
The total number of credits generated by a project is very sensitive to the length of time overwhich they can accrue (the emissions timeline). If a standard methodology to calculate anemissions timeline could be agreed, it would increase the comparability between projects, andalso offers a potentially simple way of limiting the effects of free riders and gaming.
The approach used to determine an emissions baseline for a JI or CDM project has consequencesfor the project’s transaction cost, transparency and administrative feasibility (including data,monitoring and reporting requirements) as well as for its environmental additionality. This studyconsiders each of the main baseline approaches against these performance “criteria”.
Data, monitoring and reporting requirements are important because they affect the costs andadministrative feasibility of project preparation and review. These requirements vary acrossdifferent baseline approaches. Project-specific baselines have relatively heavy data requirementsand may require some monitoring of current activities before the actual JI/CDM project oractivity starts. Using multi-project baselines requires less or no monitoring of the pre-JI/CDMproject situation for project participants. However, data are required to establish these baselines.
Different baseline approaches also have different cost implications1. Using a baseline approachthat incorporates either standardised methodologies or assumptions will be cheaper and easierthan developing a project-specific approach. While there are costs involved in developing allbaselines, who pays for their development may differ depending on the approach. By loweringthe costs of project preparation, an agreement on standardised approaches could increase thenumber of JI and CDM projects. In turn, this could help increase the effectiveness of JI andCDM by increasing their contribution to cost-effective emission abatement.
The transparency of a baseline also varies with different baseline approaches. In general, themore assumptions related to an individual project or to a system that are included in a baseline,the more documentation is needed with that baseline to make it transparent. Increasedtransparency may help to increase participation, and may also facilitate any verification andcertification.
The environmental additionality of a JI/CDM project can be affected by the baseline approach asthis can influence the potential level of gaming, free riders and leakage. Increased levels ofgaming, free riders and leakage would artificially inflate the number of credits resulting from aproject. For the CDM, this would mean that not all credits accruing from CDM projects wouldrepresent actual emission reductions and may lead to higher total Annex I emissions. Artificially
1 The cost of establishing an emissions baseline is one component of the transaction costsassociated with JI and CDM projects, but should ideally be kept as low as possible to encourageinvestment through these mechanisms.

COM/ENV/EPOC/IEA/SLT(2000)8
7
high credit levels for JI projects will not affect the overall Annex I assigned amount2, although itcould make it more difficult for some host countries to meet their individual Kyoto commitments.The potential for gaming may be particularly high for CDM project-specific baselines. Multi-project baselines may be more vulnerable to potential free riders in some cases, although the levelat which the baseline is set – and this is true for all baseline approaches- is crucial in this regard.
The environmental additionality of individual projects is clearly correlated to the level orstringency of the baseline. The stringency of an emissions baseline varies depending on theassumptions used in setting it up. This paper presents a preliminary survey of analyses done onthe effect that different baseline approaches and/or assumptions have on the level of creditsgenerated by a particular project. This paper also presents case studies that illustrate the influenceof national circumstances on the absolute level of the baseline and the relative level (compared toother technologies/processes). For example, if both India and Brazil use the same multi-projectbaseline approach to set a baseline for new electricity projects at the level of their current averageemissions, gas-fired electricity projects could generate certified emission reductions (CERs) ifthey were undertaken in India, but not in Brazil.
The assessments presented in this paper indicate that assumptions used to develop baselinesand baseline approaches (e.g. project-specific, multi-project) are independent variables.Both can influence the level of credits for a particular project. In the examples examinedhere, the range in different possible assumptions within one baseline approach can be as large asthe range in assumptions between different baseline approaches. However, not all approachesmay be equally appropriate in all circumstances, and different approaches may be viewed more orless suitable for different types of projects (e.g. forestry, electricity or landfill).
Both baseline assumptions and approaches will have an impact on the overallenvironmental effectiveness of the mechanisms3. The baseline approach will influence theeffectiveness of the mechanism through its impact on the complexity of setting up an emissionsbaseline. All other things being equal, more complex methods are likely to limit the number ofprojects initiated by adding to the transaction costs associated with developing a CDM or JIproject. Within each approach, baseline assumptions are also likely to have an impact on theeffectiveness of the project-based mechanisms through their impact on the baseline stringency,which affects the level of credits, and through this the number of projects initiated. Regardless ofthe approach used, stringent baselines could limit the number of projects initiated due to theireffect on the cost of credits while lax baselines could obviously have a negative environmentaleffect.
In circumstances where different baseline approaches are plausible, the independence of baselinestringency and approaches suggests that maximum environmental effectiveness across theproject-based mechanisms (as opposed to individual projects) is likely to be achieved byoptimising baseline stringency and reducing baseline complexity. In practice, this means: (i)seeking to minimise baseline complexity, as long as the ability to determine "what would havehappened otherwise" is not compromised; and (ii) optimising the baseline stringency so that it
2 As long as each Annex I country meets its emissions commitment.
3 Unlike the CDM, JI is a zero-sum game in which transfers and acquisitions of emission creditswill not affect the total Annex I emissions, as allowed by the Kyoto Protocol. The implicationson environmental effectiveness are thus different.
COM/ENV/EPOC/IEA/SLT(2000)8
8
maximises the overall global environmental effectiveness from the project-based mechanisms.The optimal strategy takes into account that a high volume of projects will be needed to deliverstrong environmental effectiveness from the mechanisms: a greater number of good projects willbe more beneficial for the environment (in terms of total GHG reductions) than a lower numberof individually better projects.
Progress on technical issues would be greatly facilitated if policy makers decided which baselineapproach(es) are to be used for each JI and CDM project/project type. Such an agreement wouldallow analysis to focus on how such approach(es) could be applied in a comparable manner or, inthe terminology of this paper, on finding assumptions that provide the balance between theenvironmental effectiveness and encouraging participation given different circumstances. Anagreement would also facilitate the resolution of other outstanding questions (e.g. reportingformats) which could also help in the development of the mechanisms. In addition,understanding of the issue would be improved if common definitions and a common vocabularyfor key baseline-related parameters could be reached.
A decision on baseline approach(es) would open the door for assessment and eventual agreementon other credit-related aspects of JI and CDM projects, such as:
• how to determine the value of key assumptions;• how long any project should be allowed to generate emission credits for (the emissions
timeline);• whether or not emissions baselines should be static or dynamic;• maximising the environmental effectiveness of the project-based mechanisms by minimising
the level of leakage, free riders and gaming; and• assessing how to determine the environmental additionality of a climate-friendly project in a
country that has low emission levels.

COM/ENV/EPOC/IEA/SLT(2000)8
9
1. Introduction
The Kyoto Protocol (KP) establishes two project-based mechanisms: the Clean DevelopmentMechanism (CDM) and Article 6 projects (usually referred to as Joint Implementation, JI).Article 12.5(c) of the KP states that CDM project activities should result in “reductions inemissions that are additional to any that would occur in the absence of the certified projectactivity”. Article 6.1(b) of the KP states that JI projects should provide “a reduction in emissionsby sources, or an enhancement of removals by sinks, that is additional to any that wouldotherwise occur”.
Estimating business-as-usual reference scenarios (i.e. what would happen otherwise) is thusnecessary to evaluate the environmental “additionality” (in terms of emission reductions) of JIand CDM projects. These reference scenarios are defined as “baselines”.
The international community has not yet decided how these baselines should be established,reported and verified. However, baselines are an important issue within the ongoing negotiationson the Kyoto Protocol to the UNFCCC.
Activities Implemented Jointly (AIJ) was established in 1995 at the first Conference of the Parties(COP1) as a pilot phase of Joint Implementation. Some experience with emission baselines hasbeen gained during the AIJ pilot phase. This experience is mainly with emission baselines thathave been established on a project-specific (case-by-case) basis. However, these emissionbaselines have been relatively expensive and time-consuming to draw up. Lack of internationalguidance on how exactly to draw up these emission baselines has also meant that they are oftenneither transparent nor consistent.
There are other possible options by which to develop emission baselines, and many countrieshave expressed an interest in examining in more detail how such options would function and whatwould be their implications. This paper seeks to define and explain the different baselineapproaches and to examine how the various approaches can impact the assessment of projectenvironmental additionality and the overall environmental effectiveness of the project-basedmechanisms. A survey of experiences with baseline approaches under AIJ, as well as quantitativecase studies, are included to illustrate the potential use and implications of different baselineapproaches.
1.1 Objectives and approach
The objectives of this paper are:
• to define and assess how different baseline approaches could function for JI and/or for CDMprojects;
• to determine whether the use of a particular baseline approach (over another approach) couldinfluence the evaluation of environmental additionality of a particular project; and,
• to determine whether and how the use of a particular baseline approach could influence theincentive to participate in CDM and JI projects (i.e. the potential effect on the number ofprojects).

COM/ENV/EPOC/IEA/SLT(2000)8
10
This assessment is then used to examine the potential effect of baseline approaches on the overalleffectiveness of the project-based mechanisms4 in helping meet the objectives of the KyotoProtocol, i.e. contributing to sustainable development5 and helping Parties achieve their Kyotocommitments most cost-effectively. In addition, this paper outlines the potential data, monitoringand reporting requirements for each baseline approach, the likely cost implications of theserequirements, and assesses the applicability of each approach to different project types.Implications of using different baseline approaches in the verification process of emissionreductions from CDM and JI projects are also examined.
This paper assesses6 different baseline approaches under a number of criteria including:
• the environmental credibility of the baseline (which is related to the potential levels ofgaming, free riders and leakage);
• the relative costs of developing and using the baseline;• the data, monitoring and reporting requirements of the different baseline approaches; and• transparency.
The variation in these criteria is likely to influence the transaction costs associated with a project,the number of projects initiated under the project-based mechanisms, each project’senvironmental additionality, and therefore, the environmental effectiveness of JI and CDM as awhole7.
The paper also looks at the potential implications of the assumptions used to develop baselines(using different baseline approaches) on the level and stringency of the baseline. In addition, thepaper provides an initial assessment of the relationship between the assumptions and the differentbaseline approaches as well as between the stringency and the complexity of baselines.
1.2 Context
Emission baselines for project-based activities aim to quantify “what would have happened” inthe absence of those activities. Baselines are estimated reference cases for likely future emissionpathways, and are therefore hypothetical8. If actual emissions from JI or CDM projects are lowerthan the baseline, they are viewed as additional9 and can be used to generate emission credits.
4 As explained later in section 1.2, there are different views on whether or not baseline-settingframework should be the same for JI and CDM.
5 Article 12.2 of the Kyoto Protocol explicitly states that one of the purposes of the CDM is toassist non-Annex I Parties (i.e. the developing countries) “in achieving sustainabledevelopment”.
6 This assessment is in section 5.7 The implications on environmental effectiveness may be different for JI and CDM.8 Even an emission baseline based on factual data is hypothetical because it is based on the
hypothesis that future and past performance will be the same – which may or may not be thecase.
9 In this paper, “additional” is defined solely based on the impact of the project on GHGemissions. No financial criteria are taken into account though this is another important area ofconsideration.
COM/ENV/EPOC/IEA/SLT(2000)8
11
It is important to note that there are different views on whether or not rules and guidelines forsetting emissions baselines for JI and CDM projects should be the same. Whereas JI can beviewed as a “zero-sum” exercise where the total assigned amount for Annex I countries does notchange as a result of the transfer and acquisition of ERUs, the CDM can be viewed as a “plus-sum” exercise.
Global emissions remain unaffected by ERUs from JI projects (as long as the JI host countrymeets its Kyoto commitments), regardless of the uncertainty surrounding estimatedenvironmental additionality. On the other hand, CERs generated from CDM projects are addedto the Annex I assigned amount. The inherent uncertainty associated with the estimation of CERsresulting from CDM projects can lead to positive or negative impacts on the level of globalgreenhouse gas emissions. For these reasons some Parties are of the view that CDM projects andJI projects should be treated differently. In this view, rules about baseline-setting would beappropriate for CDM projects, while only guidance about baseline-setting would be necessary forJI projects. Other Parties, however, do not support such a distinction between the two project-based mechanisms. As the Kyoto Protocol (Articles 6 and 12) states that emission reductionsresulting from a CDM or JI project must be “additional to any that would” occur in the absence ofthat project, these Parties are of the view that both mechanisms should have a consistent treatmentof environmental “additionality.” Emissions baselines are important to this debate because theyare used to assess environmental additionality.
While this paper notes these differing views and their potential implications, no attempt is madeto prejudge the outcome of political negotiations on this issue. Instead, the paper focuses ontechnical aspects of baselines, their relationship with environmental additionality, participation inthe mechanisms (i.e. potential number of projects), and more broadly with environmentaleffectiveness. Environmental effectiveness, while recognising that implications may be differentfor JI and the CDM, is defined in the paper by the environmental additionality of each individualJI and CDM project, (compared to what would have happened without such projects), and thelikely number of projects undertaken.
Leaving aside the debate on whether or not setting CDM and JI baselines require the sameframework, an ideal emissions baseline should:
• be environmentally credible (to ensure long-term benefits greater than what would happenotherwise);
• be transparent and verifiable by a third Party;• be simple and inexpensive to draw up (low transaction costs); and• provide a reasonable level of crediting certainty for investors.
In practice, any baseline approach is likely to involve tradeoffs among the criteria above.
If the baseline level is higher than the emission level that would “happen otherwise”, anartificially high number of emission credits would be generated per project. A high baseline levelwould also result in more projects being eligible for JI/CDM status and could increase the numberof free riders as well as lower the cost of emissions credits. On the other hand, if the projectbaseline is very stringent and set at a level lower than the emission level that would “happenotherwise”, the amount of emission credits per project would be artificially small. A low baselinewill by definition limit the number of eligible projects, and may even disqualify some potentially
COM/ENV/EPOC/IEA/SLT(2000)8
12
climate-friendly projects. A low baseline is also likely to reduce the number of profitable projectsand to increase the cost of emissions credits from those projects that do qualify10.
Uncertainties in emission baselines cannot be eliminated as it is not possible to prove what would“happen otherwise” in these hypothetical reference cases. However, there are concerns about thepotential incentives to create greater inaccuracies in the baselines, e.g. by biasing them upward inorder to generate a greater number of credits for the CDM/JI project participants (i.e. “gaming”).
Apart from the impact of the baseline level, this paper considers the impact of different baselineapproaches and assumptions on the environmental effectiveness, as defined above, of the CDMand JI. The analysis recognises the need to strike a balance between maximising theenvironmental credibility of the baseline and minimising the costs of developing the baseline inorder to encourage participation and a high level of investment in emission-reducing projects.)
2. Baseline approaches described
There are many different ways by which emission baselines could be set up for JI and CDMprojects. This paper assesses three main types of options:
• project-specific: baseline determined on a case-by-case basis, with project-specificmeasurements or assumptions for all key parameters;
• “multi-project” (which can be at many levels of aggregation such as by technology orsector): baseline is equivalent to an “activity standard11” or policy target that is aggregated ata certain level; and
• hybrid: baseline determined in a hybrid fashion, with some key parameters project-specific,and others standardised (the number and level of the standardised parameters will vary foreach different project category).
These baseline approaches are outlined in Table 1.
The literature also mentions baselines drawn up at the national level, referred to as “top-down”baselines (e.g. Puhl 1998). These top-down baselines are highly aggregated, reflect nationalgovernment objectives/targets and policies and have therefore been most often referred to in thecontext of JI or AIJ projects. These baselines could be used to assess emission reductionsresulting from policy initiatives (e.g. Puhl et al.1998) and not only concrete project activities, asis the case for the other baseline approaches. Because of this fundamental difference with theother baseline approaches considered in this paper, top-down baselines12 are not treated further inthis paper.
There are many possible variations to the three baseline groups assessed in this paper. Forexample, the time over which emission credits can accrue (the “emissions timeline”) can vary.
10 Estimating whether or not a hypothetical baseline was overestimated (lax) or underestimated(stringent) is likely to be difficult, uncertain and best carried out only several years after the startof the project (e.g. if the assessment is to be based on data regarding comparable, but non-JI/CDM, projects).
11 This type of baseline includes those variously referred to as “benchmarks”, “activity standards”,“project-category”, “technology matrix” and “sectoral”.
12 In some cases, top-down baselines refer to sectoral baselines based on national data. In thispaper, such baselines would fit under the “multi-project” typology.
COM/ENV/EPOC/IEA/SLT(2000)8
13
These, and other cross-cutting issues, such as whether or not baselines should be static ordynamic, are discussed in section 3 of this paper.
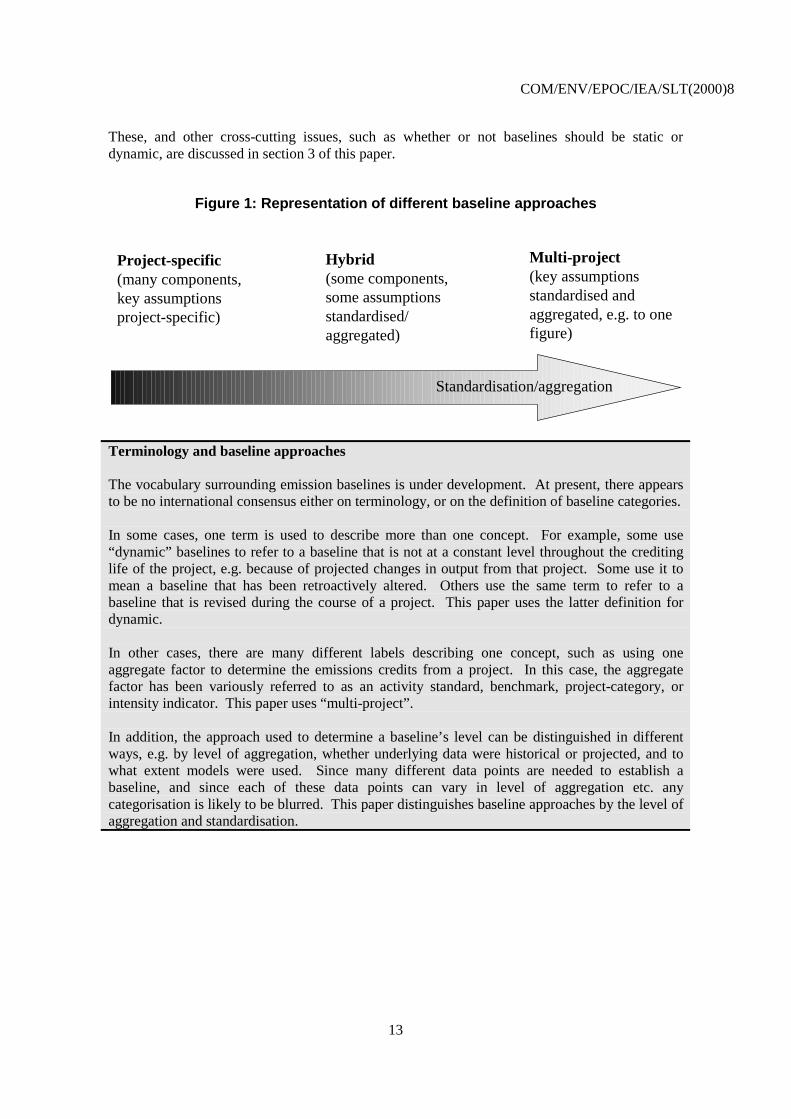
Figure 1: Representation of different baseline approaches
Hybrid(some components,some assumptionsstandardised/aggregated)
Multi-project(key assumptionsstandardised andaggregated, e.g. to onefigure)
Project-specific(many components,key assumptionsproject-specific)
Standardisation/aggregation
Terminology and baseline approaches
The vocabulary surrounding emission baselines is under development. At present, there appearsto be no international consensus either on terminology, or on the definition of baseline categories.
In some cases, one term is used to describe more than one concept. For example, some use“dynamic” baselines to refer to a baseline that is not at a constant level throughout the creditinglife of the project, e.g. because of projected changes in output from that project. Some use it tomean a baseline that has been retroactively altered. Others use the same term to refer to abaseline that is revised during the course of a project. This paper uses the latter definition fordynamic.
In other cases, there are many different labels describing one concept, such as using oneaggregate factor to determine the emissions credits from a project. In this case, the aggregatefactor has been variously referred to as an activity standard, benchmark, project-category, orintensity indicator. This paper uses “multi-project”.
In addition, the approach used to determine a baseline’s level can be distinguished in differentways, e.g. by level of aggregation, whether underlying data were historical or projected, and towhat extent models were used. Since many different data points are needed to establish abaseline, and since each of these data points can vary in level of aggregation etc. anycategorisation is likely to be blurred. This paper distinguishes baseline approaches by the level ofaggregation and standardisation.
COM/ENV/EPOC/IEA/SLT(2000)8
14
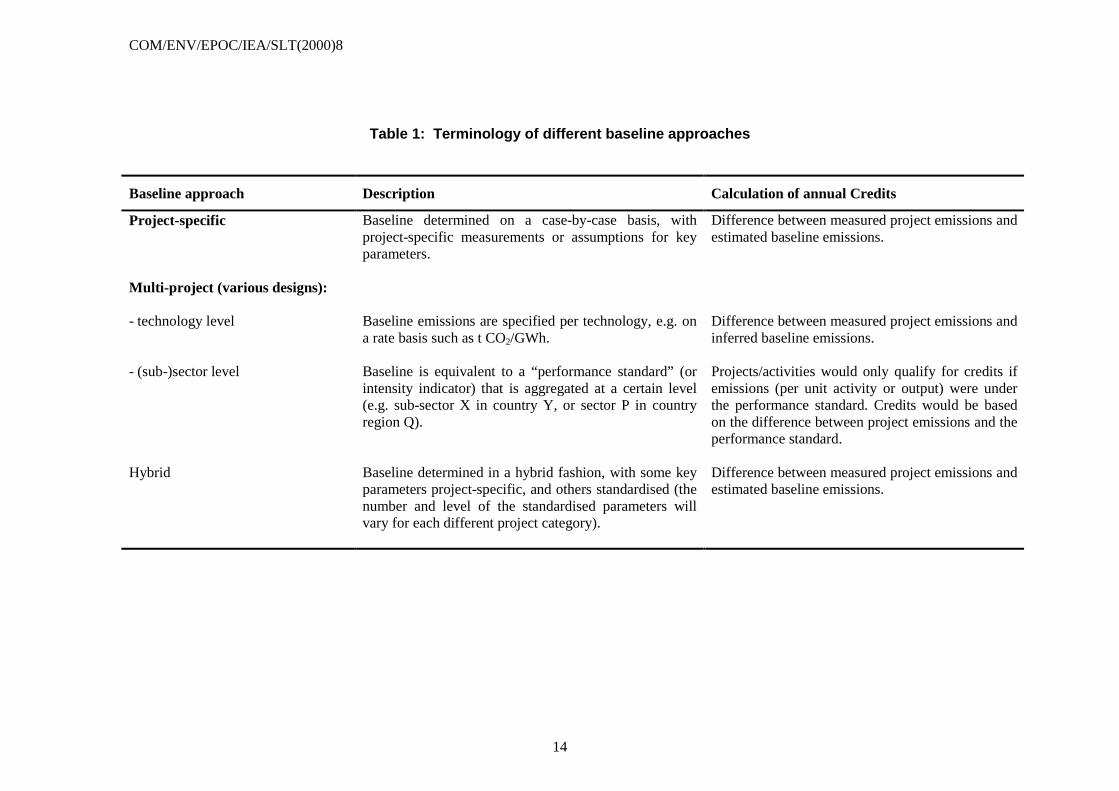
Table 1: Terminology of different baseline approaches
Baseline approach Description Calculation of annual Credits
Project-specific Baseline determined on a case-by-case basis, withproject-specific measurements or assumptions for keyparameters.
Difference between measured project emissions andestimated baseline emissions.
Multi-project (various designs):
- technology level
- (sub-)sector level
Baseline emissions are specified per technology, e.g. ona rate basis such as t CO2/GWh.
Baseline is equivalent to a “performance standard” (orintensity indicator) that is aggregated at a certain level(e.g. sub-sector X in country Y, or sector P in countryregion Q).
Difference between measured project emissions andinferred baseline emissions.
Projects/activities would only qualify for credits ifemissions (per unit activity or output) were underthe performance standard. Credits would be basedon the difference between project emissions and theperformance standard.
Hybrid Baseline determined in a hybrid fashion, with some keyparameters project-specific, and others standardised (thenumber and level of the standardised parameters willvary for each different project category).
Difference between measured project emissions andestimated baseline emissions.

COM/ENV/EPOC/IEA/SLT(2000)8
15
2.1 Project-specific baselines
Project-specific baselines are the most disaggregate type of emission baselines. They aredeveloped to evaluate emission reductions generated from one particular project (as opposedto a group of similar projects). These baselines are established by using project-specificassumptions, measurements, or simulations for all key parameters, such as fuel andtechnology characteristics and changes in output/fuel/technology over the life of the project.
The project-specific baseline approach was the most commonly used in AIJ pilot phaseprojects, and is therefore the baseline approach for which there is most experience. Thesebaselines were drawn up on a case-by-case basis for a particular project. For project-specificbaselines, each key component used to establish the emissions baseline is individuallyassessed to determine what would have happened in lieu of that particular project. Thesedifferent data components of a project-specific baseline may be measurements, estimations,simulations or assumptions, and may be unique to a particular project (e.g. distance fromcurrent electricity or gas grids) or applicable to a group of projects (e.g. the technical lifetimeof the equipment installed).
Despite the project-specific nature of this baseline approach, it may still be subject toconsiderable uncertainty and thus lead to uncertain estimates of the “environmentaladditionality” of JI or CDM projects. One analysis (Begg et. al. 1999) indicates that using aproject-specific baseline to estimate emission reductions from refurbishment-type energysector projects results in uncertainties of the order of + 80% - and these type of projects arethose usually thought of as the “easiest” projects for which to draw up emission baselines!The same analysis indicates that the largest component of this uncertainty is the hypotheticalnature of the baseline, i.e. the choice and timing of baseline fuel and technology options.
Most project-specific baselines in AIJ projects were established using measurement andexpert judgement for key parameters, though model simulations or comparisons were alsoused to a lesser extent. These baselines were often drawn up by a consultant acting on behalfof the investor, before being reviewed by a team in the investor’s country and agreed to by thehost country. Because of the lack of rules or guidance governing what needed to be measuredand/or reported in order to set up an emissions baseline, AIJ project reports did not include aconsistent set of data in their elaboration of the emissions baseline (Ellis 1999). Moreover,the detail of data and underlying assumptions presented in the project reports submitted to theUNFCCC varied significantly between different AIJ projects. The costs of establishingtailored emission baselines for some JI-type projects have been estimated at 1-8% of totalproject costs (Puhl 1998).
Project-specific baselines could be made more consistent and transparent than those used todate. This would be achieved if each project type had a uniform reporting format in which toreport specific information (such as fuel and technology characteristics) from that projecttype. This could encourage an agreement on methods on how to calculate emissionsbaselines. Such a baseline could then be classified as hybrid or multi-project in some cases13.
Data requirements for determining tailored emission baselines vary by project type. Initialreporting requirements for selected project types have already been suggested by someanalysts (e.g. MacDicken 1997, Vine and Sathaye 1999, Ellis 1999) and are listed in AnnexA. These suggested reporting requirements are quite data intensive, and may in some cases
13 The current Uniform Reporting Format for AIJ projects does not request the reporting ofspecific data, but “estimated emissions without the activity (project baseline)” and“estimated emissions with the activity”. Consistent methods would result in greatertransparency irrespective of baseline type, and are discussed further in section 2.5.

COM/ENV/EPOC/IEA/SLT(2000)8
16
necessitate monitoring and reporting fuel and/or technology use over an extended period oftime before the project is in place, as well as during the life of the project. For example, thecurrent Dutch approach to establishing a baseline requires information “for twelve successivemonths prior to the start of the project” (JIRC 1997). The tables in the UNFCCC’s currentUniform Reporting Format imply that annual monitoring and reporting of project emissions isrequired for AIJ projects.
Project-specific emission baselines are elaborated on a case-by-case basis and could, bydefinition, be used for all project types in all sectors.
2.2 Multi-project baselines
Multi-project baselines14 indicate the emissions level associated with certain activities, oftenat a sectoral or sub-sectoral level. Potential CDM or JI projects would be measured againstthese aggregate baselines to see whether or not they were eligible for emissions credits, and, ifso, how many. In the energy and industry sectors15, these baselines would probably be basedon an emissions rate (e.g. t CO2/GWh) rather than on an emissions level16. In comparison,project-specific baselines are usually, but not always, based on an emissions level.
Multi-project baselines are an extremely broad category of baseline. They could encompassbaselines drawn up at differing levels of geographical or sectoral aggregation, and baselinesusing each level of aggregation could be based on historical data, trends or projected data. Ata disaggregate level, e.g. specific to a particular technology, sub-sector and country, multi-project baselines can approach the level of detail of a hybrid project baseline17. Alternatively,highly aggregate project categories could be drawn up, e.g. sectoral level. The AIJ pilotphase includes at least one project (cement manufacture in the Czech republic18) where theemission benefit was calculated by using a sectoral baseline.
Multi-project baselines are potentially simple, transparent, predictable and low-cost. Theymay also reduce “micro” gaming (gaming at the project level) compared to other baselines, ifthey were developed by a (neutral) third party.
Opinions differ on whether multi-project or other baseline approaches give a more plausibleestimate of the hypothetical emission level that would occur without the JI or CDM project.Multi-project baselines are defined and applied to a group of projects. This means that theenvironmental additionality of each project credited under a multi-project baseline has notbeen assessed on what would have happened in lieu of that particular project, although multi-project baselines can nevertheless represent a plausible estimate of the overall situation thatwould have happened otherwise. Ultimately, projects assessed against multi-project baselinescan generate the same number, greater or fewer emission credits than if they were assessed
14 Many different alternative labels for this type of approach have been used, including“benchmarks”, “intensity indicators”, “activity standards”.
15 Little work has been done to date on the possibility of using benchmarks for biotic projects.However, some initial thinking on the issue (see Trexler 1999a) indicates that a binary(yes/no) determination of additionality may be more appropriate than a rate-baseddetermination, at least for some LUCF sub-sectors.
16 Using a baseline based on an emissions rate allows changes in output to be taken intoaccount.
17 Further disaggregation is possible, e.g. for multi-project electricity sector baselines whichcould separate fossil/non-fossil sources, peak/off-peak etc.
18 See http://www.unfccc.de/program/aij under the Cze/Fra project
COM/ENV/EPOC/IEA/SLT(2000)8
17
under project-specific baselines, depending on the assumptions used for the two baselineapproaches.
Multi-project baselines could be set up at a fairly disaggregate level, such as by technologyin a particular country (or part of a country). In this case, emissions from e.g. a gas-firedplant installed as a JI/CDM project would obtain emissions credits if the per kWh emissionswere lower than that designated for that project category.
Of course, the key issue would be where to set the baseline level. Should this level reflect thehost country average; the regional average; the country or regional average for recentlyinstalled technology; the marginal technology; or the best equivalent system already installedin the host country? Alternatively, should the baseline level be determined by the besteconomically attractive system? These different choices in assumptions underlying theemissions baseline have a significant effect on the number of credits that could be generatedfor a project, and are illustrated in section 4.3.
However, once the exact technology characteristics that will form the baseline have beenchosen, the baseline could be relatively simple to establish, for example if it was determinedrelative to the emissions performance of best available technology (BAT), e.g. 10% greateremissions than BAT.
Alternatively, aggregate multi-project baselines could also be drawn up, e.g. at a sector level.As for more disaggregate multi-project baselines, they could be based on historical data or onprojected performance of the sector.
2.3 Hybrid project baselines
Project-specific emission baselines are made up of many different components. Standardisingthe value of one or more of these components, or the method by which they are elaborated,would increase the transparency and comparability between the emission baselines ofdifferent projects and would also reduce the time and cost of establishing an emissionsbaseline19.
“Hybrid” project baselines could therefore be designed to be applicable to a small number ofprojects. These baselines would therefore include a greater degree of standardisation for oneor more of the key baseline components than project-specific baselines, but would be lessaggregated and less standardised than e.g. multi-project baselines designed for particular sub-sectors. The local and regional variability of the different baseline components will determinethe extent to which standardisation is feasible. For example, a JI/CDM project that reducesleaks of methane from a natural gas distribution system is likely to need to use a project-specific value for leakage rate as this rate likely to be specific to the system concerned.
Whether or not a component used to calculate emission baselines can be easily standardiseddepends on the component itself. These are examined in Table 2. The components that arebolded are those likely to have the greatest impact on a baseline’s level.
19 A hybrid baseline would not necessarily result in similar projects generating identicalemission credits because of project-specific variations in certain parameters and countries’different circumstances. Nevertheless, it could reduce the wide divergence of emissionreductions for similar projects undertaken in different circumstances that was notable for AIJprojects.

COM/ENV/EPOC/IEA/SLT(2000)8
18
Table 2: Potential for standardising different components of emissionbaselines
Baselinecomponent
Project types forwhich assumptionis important
Potential forstandardisation
Comment
All High Standardised methodologies could be agreed on howto determine the timeline (standardising the actualtimeline length would be more difficult, althoughpossible at a disaggregate project category level).These methodologies could be further subdivided byproject category, and by project type (e.g.greenfield/replacement). It may also be possible toobtain political agreement on the absolute timeline,such as 10 years for power plants.
Baseline fuelused
“Greenfield” andrefurbishmentenergy/industryprojects
Medium-high(short-term).Low (longerterm).
Some standardisation may be possible for somecountries (e.g. those with a predominant fuel use in aparticular sector and limited changes in fuel trends).Longer-term fuel use more difficult to determinebecause of the possibility of autonomous fuelswitching (e.g. coal/oil to gas).
Autonomousenergyefficiencymeasures
D/S-side energyefficiencyprojects. Fueltransportation
Medium Arbitrary efficiency improvements could easily befactored into baseline/credits, although differentfactors may need to be elaborated for differentcountries/sectors.
Accountingfor energy-efficiencymeasures
S/D-side projectsthat reducedemand for fossilfuels, or thatreducedemand/displacefossil electricity
Medium/High Standardisation could be easy in principle (e.g. byusing average C/kWh values for displacedelectricity)20, but difficult to determine at the start ofa project because of the influence of a changing fuelmix. Lack of data may also prove to be a barrier todetermining average values. Values may need to be“deflated” in order to take any rebound effect intoaccount. The actual effects of energy efficiencymeasures may, however, deviate significantly from“average”.
Fuel emissionfactors
Energy/industryprojects
High (for CO2),Low/Medium(other gases)
Default emission factors (e.g. as in the IPCCguidelines) could be used for CO2 from fuelcombustion. Standardisation more difficult for othergases/sectors, often being site or region specific (e.g.CH4 from mining, landfills or rice production).
Carboncontent
Biotic projects Medium Site-specific differences and natural variabilitiesresult in variations in the order of + 25% (WBGU1998).
Sequestrationrates
Forestry projects High Best used in local or regional areas.
Host countrypolicies
All N/A (except at acountry level)
May be a critical component for baselines in somesectors.
Development of standardised components for hybrid or multi-project emission baselinesmight best be carried out by experts working within the framework of an accepted process(such as the process used by the IPCC/OECD/IEA inventory programme to elaborate methodsfor calculating national emission inventories).
20 Average national values for this could be calculated by using national or internationalstatistics on electricity productions and associated carbon emissions (see e.g. IEA 1998c and1998d).
COM/ENV/EPOC/IEA/SLT(2000)8
19
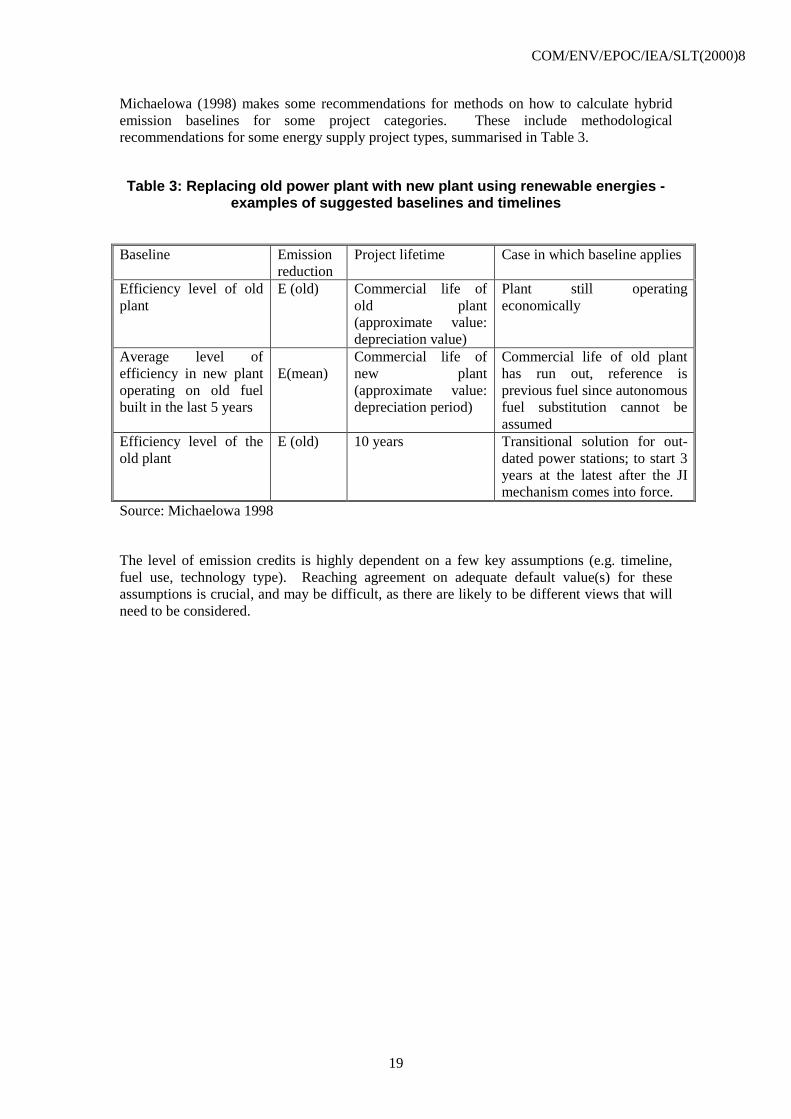
Michaelowa (1998) makes some recommendations for methods on how to calculate hybridemission baselines for some project categories. These include methodologicalrecommendations for some energy supply project types, summarised in Table 3.
Table 3: Replacing old power plant with new plant using renewable energies -examples of suggested baselines and timelines
Baseline Emissionreduction
Project lifetime Case in which baseline applies
Efficiency level of oldplant
E (old) Commercial life ofold plant(approximate value:depreciation value)
Plant still operatingeconomically
Average level ofefficiency in new plantoperating on old fuelbuilt in the last 5 years
E(mean)Commercial life ofnew plant(approximate value:depreciation period)
Commercial life of old planthas run out, reference isprevious fuel since autonomousfuel substitution cannot beassumed
Efficiency level of theold plant
E (old) 10 years Transitional solution for out-dated power stations; to start 3years at the latest after the JImechanism comes into force.
Source: Michaelowa 1998
The level of emission credits is highly dependent on a few key assumptions (e.g. timeline,fuel use, technology type). Reaching agreement on adequate default value(s) for theseassumptions is crucial, and may be difficult, as there are likely to be different views that willneed to be considered.

COM/ENV/EPOC/IEA/SLT(2000)8
20
3. Cross-cutting themes
There are certain issues of relevance to many different baseline options. These include:
• whether or not the baseline should be re-estimated over the life of the project (i.e. whetherthe baseline is “static” or “dynamic”);
• the emissions timeline (the length of time over which a project can generate emissionscredits); and
• how data are used to calculate the emissions baseline are generated (i.e. whether data arehistorical, observed by comparing against a control group, or simulated/projected e.g. viamodels).
These cross-cutting issues are discussed in this section. Other cross-cutting issues, such aswhether or not a distinction should be made between refurbishment and “greenfield” projects,the importance of the renewal rate of technology, implications of inclusion/exclusion of non-CO2 greenhouse gases in emissions baselines and pre-combustion emissions, are notdiscussed here.
3.1 Dynamic vs Static baselines
Emission baselines can either be fixed at the start of the project for the lifetime of the project(“static”) or revised during the project operation (“dynamic”). Static baselines arepredictable, and therefore reduce the uncertainty surrounding the level of credits generatedfrom a project. They therefore give investors a greater level of certainty than dynamicbaselines. Static baselines are also less of an administrative, monitoring and reporting burdenthan dynamic baselines because they require only one estimate of a baseline. They thus resultin lower transaction costs. Some Parties explicitly favour static baselines, at least for certainproject types (e.g. DISR 1999).
Dynamic baselines will need to be re-estimated (and therefore re-reported, and the amount offuture expected emission credits revised) at certain intervals during the project’s life. This re-estimation will allow the baseline to reflect more closely changing “best estimates” for thekey parameters used in drawing it up. Dynamic baselines may therefore reflect moreaccurately than a static baseline what would have happened in the absence of the project.Dynamic baselines may therefore ensure the continuing environmental additionality of aproject more consistently than static baselines, as they would enable a baseline to be adjusteddownwards if the environmental performance of the sector/process improves. Dynamicbaselines result in a greater level of investor uncertainty in the number of credits for aparticular project than static baselines. However, this uncertainty can be reduced if investorsknow exactly when, after what time interval, and upon what factors the baseline is to be re-calculated21.
Both policy and technology factors could lead to the need for baseline changes. For example,Costa Rica has announced that they would phase out non-renewable sources of electricitysupply by 200122. If this policy is successfully implemented, average per kWh emissions willdecrease to zero (within the lifetime of any proposed AIJ/CDM electricity supply project).An electricity project proposed before the policy announcement may have assumed a
21 For example, if investors know that a baseline is fixed for eight years, and subsequentlyrecalculated, this dynamic baseline may nevertheless provide sufficient certainty toencourage investments. However, if a baseline may be recalculated at any point during theproject’s lifetime, uncertainty will be much greater, and investment likely to be less.
22 It is unclear, however, if this objective will be achieved even without CDM projects.

COM/ENV/EPOC/IEA/SLT(2000)8
21
continued proportion of fossil fuels in electricity supply. Such a baseline would besignificantly higher than one taking the policy into account.
Technological improvements or process changes can also be relatively sudden andunpredictable. Such changes could make even relatively recent emission baselines outdated.For example, recent process changes in adipic acid production have resulted in a ten-fold dropin the N2O emission factor (although some allowances might need to be made for a lag-timefor existing plants to be retrofitted). In both cases, a dynamic baseline would help maintainthe environmental effectiveness of projects that had previously been initiated in these sectorsby adjusting the baseline during the course of the project to one that is a more realisticprojection of what would have otherwise occurred.
Most experience to date with emission baselines for project-based activities is with staticbaselines, which were used in the majority of AIJ projects. However, at least one AIJ projecthas a dynamic baseline: the project on cement production in Cizkovice (see the France/Czechproject under http:/www.unfccc.de/program/aij) has a baseline that will be re-estimated afterthe first five years of project operation. In addition, many of the Swedish AIJ projects revisedtheir (static) emission baselines between the first and subsequent reports to the UNFCCC.Some AIJ projects, such as the Romania/Swiss one, used a combination of (static) baselines23.
A number of analyses have suggested that dynamic baselines may be appropriate for someproject types. Begg et. al. (1999) suggest that the best way of dealing with baselineuncertainty is to check and revise the baseline every 8-12 years. They clarify that anyrevisions should apply to the remainder of a project’s lifetime only, and should not be appliedretroactively. Ernst Basler & Partners suggest that either a dynamic baseline, withreassessment after approximately 8 years or a short timeline is needed in projects that requirelong-term assumptions about a system’s electricity production. No analysis of the costimplications arising from the use of dynamic versus static baselines has been undertaken – butclearly, the responsibility for reassessing credits during the life of a project will add to thetransaction costs.
Both static and dynamic baselines can be set up in such a manner as to make themenvironmentally effective. The effectiveness of a baseline is not only determined by the levelat which it is set (which in turn is influenced by which baseline option is used), but the lengthof time over which it allows credits to accrue to the investor. The emissions timeline isassessed in the following sub-section.
3.2 Emissions timeline
The total number of emissions credits generated by a JI or CDM project will be extremelysensitive to the time during which emissions credits are allowed to accrue. The investingparty in both JI and CDM projects will therefore have an interest in obtaining the longestpossible “emissions timeline” in order to maximise the emission reduction units (ERUs) orcertified emission reductions (CERs) from their investment. Given the absence of emissioncommitments for CDM host countries, many potential CDM hosts may wish to accept atimeline proposed by the investing party, particularly as a longer timeline may increase thelikelihood of CDM investments occurring in their country. However, JI host parties mayfavour shorter timelines that would limit the number of ERUs transferred.
The AIJ projects examined in a previous paper (Ellis 1999) had widely differing emissiontimelines, even for projects of a similar nature. Creating a standard methodology to calculate
23 Available at http://www.admin.ch/swissaij/in_meth_baselinestep.html.
COM/ENV/EPOC/IEA/SLT(2000)8
22
an emissions timeline would have many advantages. It would increase both the transparencyof emission baselines and the comparability between projects. A standardised methodologywould also reduce the time and costs of setting up an emissions baseline, as the method wouldbe one factor that the developer would not have to develop themselves. If this standardisedmethodology was conservative (stringent), it could also help to ensure the environmentalintegrity of the projects by aiming to err on the side of caution.
However, there are many different views on how an emissions timeline could be set. Theseinclude:
• numerical limits, e.g. 5 years for energy-sector JI-type projects (NEFCO, quoted in Puhl1998) and 99 years for biotic projects (the Dutch FACE foundation);
• project-category formulae, e.g. 10 years for replacing an old power plant with one basedon renewable energies, or the commercial life (depreciation period) of a new power plant(Michelowa 1998); or
• the technical or economic lifetime of the project.
Because the effect of the timeline on total credits from a project is so important, standardisinga methodology to assess a project’s emissions timeline offers perhaps the easiest way oflimiting the negative effects of free riders and gaming. A standardised timeline methodologywould therefore offer a simple way of working to ensure environmental effectiveness whencalculating emission baselines and emission credits from a possible project. Moreover, allemission baselines will need an emissions timeline, so a standardised methodology could beused to affect all projects. Nevertheless, applying one standard methodology to all projects isunlikely to be appropriate. At a minimum, the methodology would need to vary betweenprojects that reduce emissions and those that increase sinks.
3.3 Data sources
Different data sources could be used when drawing up an emissions baseline. For allapproaches, data could either be based on past performance (historical trends), a snapshot ofcurrent performance (e.g. by comparing the project to current investment trends in a particularsector or to a control group), or a simulation/projection of future performance. The use ofthese different data types will influence the perceived credibility of the baseline, as well as itsdata, monitoring and reporting needs, transparency, and the levels of free riders and gamingassociated with a particular baseline.
There are advantages and disadvantages associated with using the different types and sourcesof data. For example, projections may be viewed as a more plausible reflection of whatwould happen under a future business-as-usual scenario than baselines based on historicaldata. On the other hand, the inherent speculative nature of some of the information needed toestablish baselines based on projections means that these baselines may not be not betransparent unless extensively documented. They may also be more open to gaming and basicerror than baselines constructed using other data sources.
The availability (or not) of the data sets needed may in turn influence the approach used tocalculate an emissions baseline24, as the baseline approaches assessed in section 2 could bebased on any of these data types.
24 For example, if data are available for a comparable project a comparison-based project-specific baseline could be used. If sectoral data are not available, it would be difficult to usea multi-project baseline at the sectoral level.

COM/ENV/EPOC/IEA/SLT(2000)8
23
4. Quantitative comparison of baseline approaches
This section examines whether and how different baseline approaches could affect the level ofemissions baselines for JI and CDM projects. Sections 4.1 and 4.2 are based on an analysis ofavailable literature. This literature is mainly on electricity and heating plants in EITcountries. Section 4.1 examines the effect of different baseline approaches on projected creditlevels from AIJ or AIJ-type projects. Section 4.2 examines the effect of different baselineassumptions on crediting levels.
Section 4.3 simulates case studies that examine the impact of different assumptions on theamount and potential value of emission credits under a multi-project baseline in the electricpower generation sector in Brazil and India. By examining the implication of varying baselineassumptions on the cost of CDM credits, it is possible to understand better the significance ofthese decisions on the potential volume of CDM project activity.
Variation among countries’ industry structure, fuel mix, land-use, investment patterns,policies, evolution of supply and demand all affect the assumptions underlying any emissionbaseline. This means that the relative levels of emission baselines established by a commonapproach may be different depending on the country and region. The resulting emissioncredits would also vary between regions and sectors. This supports the need to establishbaselines at a level where circumstances are similar, which may be at the “sub-country”,country or regional level, depending on the country/sector examined. Thus, while somebaseline approaches are found to result in more or less generous crediting levels in certaincases than other baseline approaches, this does not necessarily hold for all project types in allcountries. Different baseline approaches may be appropriate in different circumstances.
4.1 Survey of experience with different baseline approaches
Some analysis has been done on how the level of emissions baselines would vary underdifferent baseline approaches. This section summarises relevant results.
4.1.1 Conversion of heat plants in the Czech Republic
The following assessment is based on an analysis of Swiss-Czech co-operation in theconversion of heating plants in the Czech republic (Ernst Basler & Partners 199925). Theanalysis assesses what potential credits could be for two different project types and fourdifferent emission baselines. The projects examined were fuel switching (mainly from coal orcoke to natural gas) in 70 existing heating plants, and cogeneration. The results for the fourdifferent baselines examined are shown in Table 4.
The relative credit levels from the different baseline approaches are due to the differentunderlying assumptions. Technology-standards (a disaggregate form of multi-projectbaselines) gave relatively high levels of offsets for both project types because the referencetechnologies used were coal26. However, other assumptions could have also been valid that
25 The projects analysed were not designed as AIJ projects; official acceptance, endorsement orapproval of them as AIJ projects was not sought; and the Swiss government is seeking noemission credits for these projects as potential JI projects. Nevertheless, these projects fulfillthe AIJ criteria specified internationally (UNFCCC 1995) as well as the development criteriaspecified by the Czech government, and illustrate issues relating to emission baselines aswell as an officially endorsed AIJ project.
26 Coal was chosen as the reference technology as the majority of Czech heating plants arecoal-fired.

COM/ENV/EPOC/IEA/SLT(2000)8
24
would result in a lower baseline (and crediting levels). The most extreme example in this casewould be if the reference technology were the marginal unit. Since the Czech Republic hasrecently approved construction of a nuclear power station, and since nuclear power emits noCO2, the marginal unit would in this case give a baseline of zero emissions.
Table 4: Variation in calculated carbon offsets under different baselines:simulated Swiss/Czech projects
Offsets under different baselines (t CO2)* - see text for baseline descriptionsProject TypesProject-specific Technology-
based standards#Sectoralstandards#
Top-down##
Fuel switch 175000 430000 180000 195000Cogeneration 41000 43000 21000 22000Source: adapted from Ernst Basler & Partners, 1999* The figures represent calculated offsets for the entire project life.
# Both these baselines would be included under the “multi-project” category described in this paper.
## This baseline is based both on current sectoral performance and future emission targets.
The size of the difference in offsets under different the baselines in this Swiss-Czech analysisis due to the difference in per kWh emissions between gas and coal-fired technologies (whichis in turn a factor of the differing carbon contents of gas and coal, and the relative efficienciesof gas and coal technologies). The highest number of offsets will occur if comparing against100% coal, and the least if comparing against 100% gas. Any baseline that mixes the two,e.g. by comparing to the relative importance of gas and coal, will give offsets somewhere inbetween the two extremes.
The top-down and sectoral baselines gave lower potential credit levels because they assumedthat the starting point was a mixture of coal and other fuels, and that per unit emissions wouldgradually decrease between the start and end of the project. The project-specific baselinegave a relatively low number for the fuel switch projects because the baseline assumed that allunits would become gas-fired within 15 years. However, the project-specific baseline gave arelatively high level of potential credits for the cogeneration project because it assumed thatthe electricity displaced by the CHP plant was generated by coal. The differences in the creditlevel are thus a result of the underlying reference case more than the baseline approach per se.
4.1.2 Boiler conversions in Estonia
Some recent (June 1999) AIJ project reports for Swedish-funded projects in Estoniacalculated emission reductions using both a project-specific and a multi-project approach(http://www.unfccc.de/program/aij). The project reports examined in this section involvedconverting a heating boiler from fossil fuels to biomass. The multi-project approachexamined the whole country by sector and compared competing energy production options(taking into account government policy such as targets for increased renewable energysupply, and the emission commitments agreed to at Kyoto). The project-specific approachexamined the likely scenario in production and emissions from a particular heating plant withand without the AIJ project. Earlier reports for the same projects had also drawn up baselineson a project-specific basis, although they were slightly different from those presented in theJune 1999 baselines.

COM/ENV/EPOC/IEA/SLT(2000)8
25
The results of the four separate baseline studies for one project (e.g. Viljandi boilerconversion) are outlined in Table 5. The projected emission benefits of the same project withthe four different baselines vary by 23% over the lifetime of the project when comparing thebenefits calculated with one timeline27. (One of the suggested baselines had a shorter timeline,which resulted in significantly lower expected emissions reductions from the project whencompared to longer timelines).
4.1.3 Other projects
One Dutch AIJ project report (installation of a micro-hydro plant in Bhutan) states that it willuse two different forms of project-specific approaches to calculate the project’s baseline(using both a project-specific approach as well as a baseline based on the evolvingperformance of a comparable situation). However, because the comparison-based approachwas dynamic in its nature, it was not presented in the report submitted to the UNFCCC, andquantitative comparison between the two is not currently possible.
27 Because of the different relative shapes of the different baselines, the variation in projectedannual emission benefits varied by less than this amount at the beginning of the project, andby more at the end of the project’s emissions timeline.

COM/ENV/EPOC/IEA/SLT(2000)8
26
Table 5: Comparing four estimates of the emission benefits from Viljandi boiler conversion AIJ project
Annual emissions (t CO2)Report Baseline Timeline(y) y1 y2 y3 y4 … Final
year
Cumulativeemissionreductions*
1997 Project-specific: status quo 10 9800 9800 9800 9800 9800 9800 980001998 Project-specific: status quo energy
production but mazout replaced bynatural gas after 2 years
- projected reductions- actual reductions
15
98003245
98008500
98008100
9800n/a
… 9800n/a
147000(137445)
1999p Project-specific: status quo- projected reductions- actual reductions
1541463379
102808899
1028010598
1028010512
… 10280n/a
158345(159531)
1999t Multi-project, including consideration ofgovernment policy, such as increased useof renewables:
- projected reductions- actual reductions
15
36293022
86707790
85838776
84968776
… 7317n/a
122516
* Emission reductions = baseline emissions – project emissions
Source: http://www.unfccc.de/program/aij/

COM/ENV/EPOC/IEA/SLT(2000)8
27
4.2 Survey of experience with different baseline assumptions
Other studies have also compared the effect of different assumptions on baseline level (andtherefore on the level of emission benefits) from selected AIJ projects.
For example, the Centre for Clean Air Policy (CCAP) has undertaken a qualitative estimationof different baselines possible for the AIJ project situated in Decin, Czech Republic, Figure 2,(CCAP 1999). This AIJ project converted a coal-fired district heating plant to one fired onnatural gas. The project also included building a new co-generation unit that would supplyelectricity locally and feed surplus into the grid.
The CCAP exercise demonstrates that, as also illustrated above, different valid assumptionsfor baselines can significantly alter the level of credits generated by a project. The exerciseanalysed two forms of “benchmark” (multi-project) approaches. The “historical benchmark”baseline was based on emissions from average heat and electricity production facilities, andcontinuing energy efficiency improvements. The “forward looking benchmark” assumedfurther improvements in energy efficiency and a greater penetration of natural gas in heatingand electricity sectors as well as some new nuclear generation. The “forward lookingbenchmark” baseline also sought to take the country’s Kyoto commitment into account, aswell as sectoral development plans, when assuming gradual improvements in emissions perunit from heating and electricity production. (The actual emissions baseline used for theDecin project is in fact none of those below, although it follows a similar pattern to thehistorical benchmark line).
Figure 2: Comparison of Decin Project Baselines
Source: CCAP 1999
Some AIJ projects presented multiple baselines in their report to the UNFCCC (e.g. aDutch/Russian horticultural project in Tyumen). The Dutch/Russian analysis in the Tyumenproject report includes five different baselines, all calculated using a project-specific baselineapproach but with different assumptions for fuel use, technologies and project boundaries.The emission benefits of the project (presented on a per unit basis) vary by more than a factorof two between the different baselines, and the lowest baseline was used to calculate theemission benefits of the project.
Comparison of Decin Project Baselines
0
5,000
10,000
15,000
20,000
25,000
30,000
35,000
40,000
1996
1997
1998
1999
2000
2001
2002
2003
2004
2005
2006
2007
2008
2009
2010
2011
2012
Year
tCO
2/yr
Hist Bnchmk
Top-Down
Frwd Bnchmk
Proj Emssns
COM/ENV/EPOC/IEA/SLT(2000)8
28
Other AIJ projects have had more than one baseline drawn up for them, with one chosen asthe most likely scenario by the project participants and then submitted to the UNFCCC.Some of these alternative baselines are public (e.g. for the Norway/Slovakia project - seeYager et. al. 1998), and others are not (e.g. for the US/Russia Rusafor project - seeMichaelowa 1998). The three project-specific baseline scenarios with different underlyingassumptions drawn up for the Norway/Slovakia project (converting a coke-fired heatingboiler at Jochy to biomass) result in emission benefits that vary by a factor of nine from thesame project28. Even discounting the baseline scenario judged unrealistic (a 100% switch tobiomass in the absence of the AIJ project), the other two baselines vary by almost a factor oftwo (estimating emission benefits from the 2 * 300 kW boiler project as 20 or 35.6 kt CO2).
4.3 Case study simulations with multi-project baselines
This section examines examples of hypothetical multi-project baselines for new electricitygeneration29 projects in two potential CDM host countries: Brazil and India. The simulationsare developed to illustrate the implications of some alternative multi-project baselineassumptions on the potential amount of emission credits that could be generated by suchprojects. The section also considers the differences in investment and operation cost estimatesof different power generation alternatives, and how the relative economic feasibility of thesealternatives could be affected by the potential value and amount of emission credits underdifferent multi-project baseline assumptions30.
Assumptions and Caveats
Various sources were used to obtain emission and cost data and estimates for these case studies althoughmost data were obtained from publications of the IEA and NEA (NEA/IEA 1998 and IEA 1997b).Consequently, the data presented may not always be fully comparable.
Cost estimates, types of energy sources, technology and resulting emissions vary according to eachcountry’s specific national circumstances. In particular, cost estimates are highly dependent on assumptionsfor discount rates and future prices of energy. In this section, the discount rate used is 10 percent. It is alsoimportant to note that costs may be underestimated in some cases, as they were estimated based on a stablepolitical and socio-economic context, which may not reflect the real investment conditions. Cost estimatesfor renewable energy sources are difficult to compare as some, such as wind and solar, are intermittent andare thus not comparable to sources used for baseload generation; while others, such as hydro and biomass,are very site-specific making cost comparisons between sites quite imperfect.
For the purpose of these case studies, CERs are calculated based on projects generating emissions lowerthan a set baseline standard, i.e. using a range of multi-project approaches, as described in section 2, at thesectoral level. No judgements are made to determine whether such CERs would meet an environmental“additionality” test or whether they would meet the host country’s sustainable development priorities,although both are of course critical aspects of the CDM.
28 However, the lowest baseline - corresponding to an autonomous fuel switch to biomass - wasnot considered as a viable alternative because of investment constraints.
29 Electricity generation was chosen for this case study for several reasons. It is a large andgrowing source of GHG emissions in many countries; it is a sector with a homogenousoutput; and relevant data (e.g. on emission characteristics of current technologies and BAT,and demand projections) were relatively easy to obtain.
30 The assessment of economic feasibility is based on the amount of emission reductions (undera particular multi-project baseline assumption) divided by the difference in investment andoperation costs between two potential electricity generation options.
COM/ENV/EPOC/IEA/SLT(2000)8
29
The different multi-project baseline assumptions simulated in this section include: weightedaverage emissions from all sources, average emissions from each fuel, 25% improvement onaverage emission performance, planned new technology emission performance and BATemission performance (see tables in Annex B). Alternative sectoral multi-project baselinesare possible, e.g. using the emission performance of marginal units constructed, and differentsectoral aggregations, which may be viewed as a closer representation of business-as-usual.However, these are not examined here because of current lack of data.
These case studies are intended to provide an illustration of the potential practicalimplications of different simple multi-project baseline assumptions in different countries.They should not be taken as a model for the development of baselines for CDM projects inIndia and Brazil.
4.3.1 Electricity Generation in Brazil
According to the projected energy market scenarios of the Brazilian National Electric EnergyPlan 1993/2015 published in 1994 (NEA/IEA 1998), Brazil’s consumption of electricity isexpected to grow to 534.1 TWh by 2015 (i.e. an increase of 95% from 1993) under the lowestscenario. Under the highest scenario, it is projected to grow to 743.3 TWh (i.e. a 171%increase from 1993). It is important to note that scenarios31 on Brazil’s electricity generationindicate a decrease in its reliance on hydropower, which represented about 92% of its totalelectricity generation in 1996 (see tables in Annex B), and an increase in thermoelectricsources (including oil and coal, but mostly natural gas). Although there is still significanthydro potential remaining in Brazil, most economic sites are already exploited. Furthermore,about 50% of the remaining potential is located in the Amazon area, which may not beconsidered as appropriate for reservoir development. This area is also a significant distancefrom the most developed region of the country (i.e. Rio de Janeiro and São Paulo), where themain source of growth in electricity demand is expected to occur.
The predominance of hydro in Brazil’s electricity generation mix has important implicationsfor the construction of an emissions baseline. For example, if a single multi-project emissionbaseline for Brazil’s power sector were set at the level of the weighted average of emissionsfrom all sources (i.e. 43.9 t CO2/GWh), this emissions baseline would preclude all fossil fuelsources generating CERs from CDM projects. In addition, under a weighted averageemissions baseline, the amount of CERs generated from even non-GHG emitting projectswould be quite low compared to similar projects in other countries (see below) that have amore fossil-fuel intensive electricity sector. Under a multi-project baseline set at the weightedaverage emissions level, new hydro capacity could qualify32 as a CDM project and couldtherefore generate some CERs. However, hydro is not expected to be the cheapest option forfuture new electricity generating systems as most economical sites are being exploited andlarge up-front investment capital is required. Moreover, further development of hydropowermay be subject to other constraints such as those related to transmission infrastructure or areluctance to developments in particular areas.
Thus, under a weighted average emissions baseline in Brazil, even the most efficient new gas-fired plants would not generate any CERs. However, a multi-project baseline set at this levelwould mean that a new wind project could generate around 44 CERs/GWh (assuming that 1CER = 1 t CO2).
31 Information from the Electrobras website:www.embratel.net.br/infoserve/electrobr/evindice.html
32 Such projects would also need to meet Brazil’s sustainable development objectives.
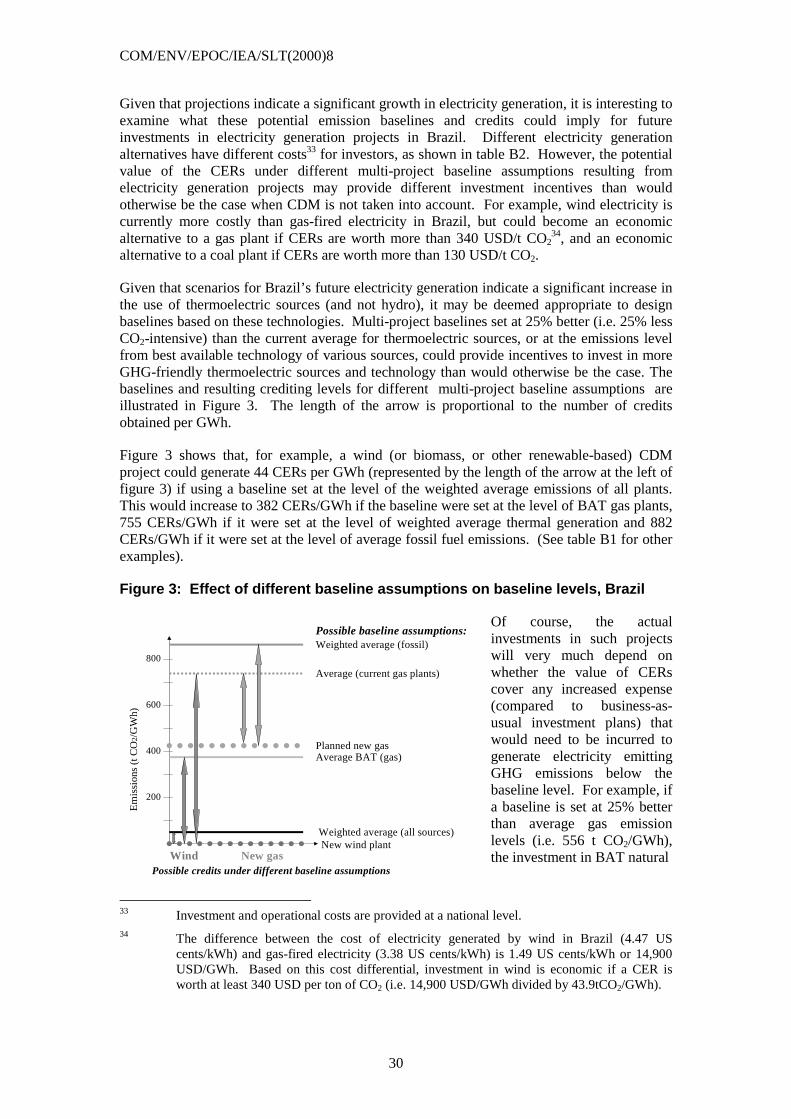
COM/ENV/EPOC/IEA/SLT(2000)8
30
Given that projections indicate a significant growth in electricity generation, it is interesting toexamine what these potential emission baselines and credits could imply for futureinvestments in electricity generation projects in Brazil. Different electricity generationalternatives have different costs33 for investors, as shown in table B2. However, the potentialvalue of the CERs under different multi-project baseline assumptions resulting fromelectricity generation projects may provide different investment incentives than wouldotherwise be the case when CDM is not taken into account. For example, wind electricity iscurrently more costly than gas-fired electricity in Brazil, but could become an economicalternative to a gas plant if CERs are worth more than 340 USD/t CO2
34, and an economicalternative to a coal plant if CERs are worth more than 130 USD/t CO2.
Given that scenarios for Brazil’s future electricity generation indicate a significant increase inthe use of thermoelectric sources (and not hydro), it may be deemed appropriate to designbaselines based on these technologies. Multi-project baselines set at 25% better (i.e. 25% lessCO2-intensive) than the current average for thermoelectric sources, or at the emissions levelfrom best available technology of various sources, could provide incentives to invest in moreGHG-friendly thermoelectric sources and technology than would otherwise be the case. Thebaselines and resulting crediting levels for different multi-project baseline assumptions areillustrated in Figure 3. The length of the arrow is proportional to the number of creditsobtained per GWh.
Figure 3 shows that, for example, a wind (or biomass, or other renewable-based) CDMproject could generate 44 CERs per GWh (represented by the length of the arrow at the left offigure 3) if using a baseline set at the level of the weighted average emissions of all plants.This would increase to 382 CERs/GWh if the baseline were set at the level of BAT gas plants,755 CERs/GWh if it were set at the level of weighted average thermal generation and 882CERs/GWh if it were set at the level of average fossil fuel emissions. (See table B1 for otherexamples).
Figure 3: Effect of different baseline assumptions on baseline levels, Brazil
Of course, the actualinvestments in such projectswill very much depend onwhether the value of CERscover any increased expense(compared to business-as-usual investment plans) thatwould need to be incurred togenerate electricity emittingGHG emissions below thebaseline level. For example, ifa baseline is set at 25% betterthan average gas emissionlevels (i.e. 556 t CO2/GWh),the investment in BAT natural
33 Investment and operational costs are provided at a national level.34 The difference between the cost of electricity generated by wind in Brazil (4.47 US
cents/kWh) and gas-fired electricity (3.38 US cents/kWh) is 1.49 US cents/kWh or 14,900USD/GWh. Based on this cost differential, investment in wind is economic if a CER isworth at least 340 USD per ton of CO2 (i.e. 14,900 USD/GWh divided by 43.9tCO2/GWh).
Em
issi
ons
(tC
O2/
GW
h)
200
400
600
Weighted average (all sources)
800Weighted average (fossil)
Average BAT (gas)Planned new gas
Average (current gas plants)
New wind plant
Possible credits under different baseline assumptionsWind New gas
Possible baseline assumptions:
COM/ENV/EPOC/IEA/SLT(2000)8
31
gas plants (i.e. more efficient CCGT) may become an economic alternative to the gas plantscurrently planned if CERs are worth more than 79 USD/t CO2. Under this same emissionbaseline (i.e. 556 t CO2/GWh), wind generation would become an economic alternative ifCERs were worth more than 27 USD/ t CO2.
It is important to note that while these examples examine the potential implications ofalternative unique multi-project baseline assumptions for new projects in Brazil’ s electricitysector, another possibility may be to consider developing more than one multi-projectbaseline for the electricity sector. For example, one for thermoelectric sources and a separateone for non-GHG emitting sources. However, this possibility is not examined further in thispaper.
4.3.2 Electricity Generation in India
India is the world’s largest coal producer. Coal is used in the generation of more than 70% ofIndian electricity, and is expected to remain the main fuel source for power generation to atleast the year 2020. Coal is also the most economical electricity generation option, as shownin table B4 (see Annex B), and benefits from the most developed infrastructure, includingmine-mouth electricity stations. However, the current average efficiency of coal plants isquite low relative to other countries, particularly OECD countries: average generationefficiency was 27% in 1996 (IEA 1998), although this masks significant variations in averageefficiency at the state level. The low efficiencies are due to various factors, such as the age ofpower plants, poor maintenance and lack of appropriate quality of coal.
India’s power sector has been experiencing significant peak and supply shortages. Shortfallsin the investment and construction of new power plants, poor-quality transmission lines andtheft are the main reasons for the supply shortages. These are exacerbated by the lack of aninter-connected grid across the nation, as states with surplus power do not transfer that surplusto states facing power shortages. Plans to bridge the gap between increasing electricitydemand and supply include, in addition to greater use of coal, increasing India’s nuclearpower generation capacity, as well as (on a smaller scale) increasing the use of renewableenergy. India’s Ninth five-year plan (1997-2002) includes a target for non-hydro renewablecapacity of 3000 MW.
Figure 4 shows various multi-project baseline assumptions for India’s electricity sector, alongwith their associated crediting levels.. For example, based on 1996 data provided in TableB3, if a sectoral multi-project baseline was set at the weighted average of current generationin India, it would equal 945 t CO2/GWh. In effect, this would mean that electricity generatedby all sources other than coal (using current Indian technology) would be below this emissionbaseline, including coal plants using the best available technology (i.e. clean coal). Undersuch a scenario, new wind (or other renewable) plants would generate 945 t CO2/GWh. Thiswould decrease to 786 t CO2/GWh if the sectoral multi-project baseline were based on BATcoal emissions, and decrease further to 382 t CO2/GWh if the baseline was based on BAT gasplants. Planned new coal plants would not be eligible for any credits at all if the multi-projectbaseline assumption chosen was the weighted average emission for all generation sources,BAT coal, or of course, BAT gas.

COM/ENV/EPOC/IEA/SLT(2000)8
32
Figure 4: Effect of different assumptions on baseline levels, India
However, the loweremission level of coal BATplants is associated not onlywith the better technology,but also with higher levelsof maintenance thancurrently observed in India.This results in theinvestment and operationalcost of these plants beinghigher than that of actualplanned coal plants in Indiaby about 0.92 UScents/kWh (Table B4).Although various factors aretaken into account ininvestment decisions, theincremental cost associated
with investing in BAT coal plants means that the investment attractiveness, from a stricteconomic perspective, of BAT coal plants is less than that of currently planned coal plants. Tocreate the incentive to switch from planned plants to the best available technology for coalplants, under a baseline set at 945 t CO2/GWh, the revenues from 159 CERs would have to atleast match the difference between the cost difference between the two types of plants. Thismeans that each CER would need to be worth a minimum of 58 USD/t CO2 to make BATcoal plants an economic option, compared to planned coal plants, under this multi-projectbaseline assumption.
However, setting a sectoral multi-project baseline at the level of the weighted average for allsources in India would mean that all planned gas plants35 would be able to generate CERs ifthey were initiated as a CDM project. According to the cost estimates in Table B4, installinga new BAT gas-fired plant 36 would cost about 5,400 USD more per GWh than the cost ofinstalling a “planned” coal plant in India. In terms of emission reductions, the BAT-type gasplant would generate emissions reductions totalling about 563 CERs. In this example, theadditional investment cost of a BAT natural gas plant would be economical, compared to thecost of a planned coal plant, as long as a CER was worth more than 9.6 USD per tonne ofCO2. A wind electricity plant would be economic compared to a new coal plant if CERs wereworth 23 USD (assuming that a unique sectoral multi-project baseline was based on theweighted average emissions of all sources).
As mentioned previously, only scenarios involving a unique multi-project baseline for India’selectricity sector are examined here. However, scenarios with more than one sectoral multi-project baseline could also be envisioned.
35 Emissions associated with natural gas electricity generation may be underestimated as onlyCO2 emissions are taken into account in this study.
36 BAT figures in this study are derived from data on planned plants in OECD countries(NEA/IEA, 1998). In the case of natural gas, there is not a large difference between plannedCCGT plants in India (at 50% efficiency) and OECD planned CCGT plants (at 52.9efficiency).
Em
issi
ons
(tC
O2/
GW
h)
200
400
800
Weighted average (all sources)1000
Weighted average (fossil)
Average BAT (coal)
Planned new gas
Average (current coal plants)
New wind plant
Possible credits under different baseline assumptionsWind New gas
Possible baseline assumptions:
600
1200
Planned new coal
New coal

COM/ENV/EPOC/IEA/SLT(2000)8
33
4.3.3 Simulation Results
This case study only takes a very preliminary look at the potential implications of usingdifferent sectoral multiple-project baselines in the electricity sector. More work in this areamay be desirable in order to understand better the effects associated with different multi-project baseline assumptions.
This analysis shows that a key issue in determining the emissions credits associated with aproject is the stringency of the baseline level. Multiple-project baselines can be designed tobe more or less stringent within one country. However, if different countries choose to usethe same multi-project baseline assumption, it could result in different baseline levels anddifferent implications for potential CDM projects.
For example, a multi-project baseline in the electricity sector set at weighted averageemissions would equal 945 t CO2/GWh in India, and 44 t CO2/GWh in Brazil. This wouldmean that if a unique multi-project baseline based on weighted average emissions was chosenfor the power sector in both Brazil and India, all clean coal-fired projects would be below thebaseline in India, whereas no thermoelectric plants would be in Brazil. The implications forCERs, in such a scenario, would consequently be different in both countries: new gas plantscould generate 542 CERs/GWh if they were installed in India, but none in Brazil. The currentdiversity in conditions in the electricity sector among different countries (and sometimes,between different regions within a country) is expected to continue. It may therefore beuseful to consider the applicability of different multi-project assumptions for differentcountries, as well as perhaps more than one sectoral multi-project baseline within the samecountry.
In all cases, a less stringent multi-project baseline level results in a greater amount of creditsbeing generated by each project, as well as potentially leading to a greater total number ofprojects by increasing the range of “eligible” projects. The tradeoff for lax baselines is thateligible projects may not be, on their own, strictly environmentally “additional.”.
With a less stringent multi-project baseline the value of each emissions credit can berelatively low while still making the additional CDM investment feasible. With a morestringent baseline (where the level of the emission baseline is lower) fewer credits will begenerated from a particular project, so the value of each emission credit will need to be higherto recoup the same incremental investment costs.

COM/ENV/EPOC/IEA/SLT(2000)8
34
5. Qualitative comparison of different baseline approaches
The different baseline approaches and their application outlined above may differ in:
• data, monitoring and reporting requirements;• baseline development or transaction cost;• transparency; and• environmental effectiveness, including a project’s environmental additionality (related to
the potential for gaming, free riders and leakage).
Using these criteria, this section compares and assesses each of the different baselineapproaches.
5.1 Data, monitoring and reporting requirements
The data needed to establish a baseline for a JI/CDM project will vary by project type, butwill also vary depending on the approach used to establish the baseline. Higher datarequirements are also likely to increase the cost of setting up an emissions baseline. Thissection assesses the data requirements and monitoring and reporting needed to establish anemission baseline under different baseline approaches37.
Project-specific baselines
Project-specific baselines are relatively data intensive. Experience from the AIJ pilot phaseshows that establishing these project-specific baselines, in the absence of any centralisedguidance on what needs to be monitored and how, is often costly and time-consuming.
Project-specific baselines may require some monitoring of current activities before theJI/CDM project or activity starts in order to be set up. This type of information would varyby project type, and would also depend on whether the proposed project is a refurbishmentproject or at a greenfield site. For example, some of these data, such as the age of the currentinstallation (in the case of a refurbishment project), are likely to be readily available.However, other data, such as a plant’s thermal efficiency, may need measuring specifically inorder to set up the emissions baseline. Examples of information that may need to be gatheredand reported for selected project types are shown in Annex A. Project-specific baselines canin theory be applied to all JI and CDM project types.
Multi-project baselines
Using a multi-project baseline does not require monitoring if it has already been developed.As with all approaches, of course, a certain amount of project-specific data will need to bereported (such as project size and output) during the project operation.
Multi-project baselines can be based on the performance of current installations or theprojected performance of future installations. To establish such a baseline requiresinformation on:
• current technology characteristics of sector (i.e. the current distribution of technologiesused in that sector); and
• the emission characteristics of each technology type.
37 This section does not explore the data, monitoring and reporting requirements needed tomonitor the actual performance of a project.

COM/ENV/EPOC/IEA/SLT(2000)8
35
Multi-project baselines at the technology level could also be used where there is not enoughdata on a sectoral level to construct a sectoral baseline. For example, a technology-levelbaseline could be set at an emissions level 10% higher than the best available technology ofthat type.
The development of multi-project baselines would require some resources and agreement at alevel other than that of the participants (e.g. governments, international organisations). Thedevelopment of these baselines may require balancing competing interests, e.g. betweeninvestors and hosts for JI projects.
Constructing multi-project baselines may not be appropriate or possible for all sectors in allcountries. For example, not all countries may have complete data coverage for particularsectors. However, there are a number of straightforward possibilities, as demonstrated insection 4.3.
Hybrid baselines
Hybrid baselines are between project-specific and multi-project baselines on the continuum ofpossible baseline approaches (Figure 1). They are therefore likely to need more data,monitoring and reporting than multi-project baselines, and less data, monitoring and reportingthan project-specific baselines. However, how much more or less would depend on howmany of the baseline components were standardised (which is in turn dependent on projecttype).
5.2 Baseline development cost
The cost of developing an emissions baseline is related not only to the data requirements,outlined above, but to the number of projects it, or some of its components, could be used for.In the case of multi-project baselines, or hybrids of this approach, the cost in time to achieveinternational consensus on the basic approach and rules for its application must also beconsidered. There is a trade-off here with the ease of implementation once agreement isreached. The cost of using a baseline will therefore not be the same for each baselineapproach. If the international process can be assumed to move quickly to reach consensus onbasic starting points, using a standardised methodology, or an off-the-shelf multi-projectbaseline will be cheaper than developing a project-specific baseline from scratch.
The cost of an emissions baseline is also related to its complexity. For example, a simulationbaseline that needs a system model will be expensive and time-consuming to set up and run.The cost of developing such a model may mean that this approach is only used in future foreither very large-scale projects, such as forestry, or where many similar projects are likely tooccur, such as in fast-growing sectors such as electricity or cement production.
Limiting the time needed to establish and approve the baseline will also help to limit the costof the baseline. This can be done if agreement is reached on:
• what data to monitor and report;
• how to monitor/report this data;
• calculation methods; and
• value(s) of the baseline (e.g. for multi-project baselines).

COM/ENV/EPOC/IEA/SLT(2000)8
36
Many potential emission mitigation projects are small scale, e.g. increased household use ofrenewable energy and energy efficiency technologies. In order to maintain small-scaleprojects as an attractive JI and/or CDM opportunity, the up-front costs for these projects needto be low relative to the cost of the project. Having a simple emissions baseline or creditingformula for small-scale projects would be one way of keeping the costs related to constructionof the baseline low. Of course, for both large and small-scale projects, the proportion of totalproject costs used to establish the baseline will also need to be kept low in order not to createbarriers to investment under JI and CDM.
The level at which baselines are aggregated (e.g. sub-sectoral or sectoral level) will influencethe number of projects for which the baseline could be used, and ultimately the cost perproject. The degree of standardisation between different baseline approaches also has costimplications. More standardised methods and reporting formats, irrespective of the level ofaggregation, would mean that each project developer would not have to spend time andmoney developing methodologies or reporting formats but would instead apply those alreadydeveloped. However, reaching agreement on standardised calculation methods, parameters,and/or reporting requirements could have significant up-front time and cost implications.
However, setting up an emissions baseline does not represent the only costs involved inestablishing a JI or CDM project. Other costs include the costs of identifying the potentialproject, administrative costs (for both the host and investor), ongoing costs related tomonitoring, reporting and verification, and, for the CDM, contributions to funding adaptation.
5.3 Transparency and ease of third party verification
A transparent baseline is one where the construction is clearly explained, where theparameters and methods used in the baseline are referenced and traceable, and where thebaseline can be reconstructed by a third party. Use of transparent baselines for JI and CDMprojects would help to “demystify” emission baselines; would help potential projectdevelopers better assess CDM or JI projects, and associated emission credits; and wouldfacilitate any verification of a project’s emission baseline. They would therefore increaseconfidence in the effectiveness of the project-based mechanisms.
The transparency of a baseline will vary with the baseline approach used, and will alsodepend on how baseline assumptions were arrived at (e.g. model simulations, expertjudgement) and how these assumptions and supporting information were reported to theUNFCCC.
Many baselines used for AIJ projects were not transparent. This is partly because which datahad to be reported, how, and in what detail was not established38. Thus, many project reportsdo not reference or explain key assumptions, and do also not report all relevant underlyingdata and information. Transparency could be improved for future reports of project-basedactivities if guidance was available on the assumptions to be reported.
Another reason behind the lack of transparency of AIJ baselines is due to the project-specificnature of many of those baselines. Since project-specific baselines are made up of manycomponents, listing each of these components and explaining why they (rather thanalternatives) were chosen would be a time-consuming exercise. Given the uncertaintiessurrounding the underlying components of emission baselines, and the importance of expertjudgement in drawing up project-specific baselines, a degree of subjectivity is inevitable.
38 A draft revised version of the Uniform Reporting Format has been prepared and is availablein document FCCC/SB/1999/5/Add.1

COM/ENV/EPOC/IEA/SLT(2000)8
37
While emission baselines based on projections may be viewed as a closer representation ofwhat would happen otherwise, basing emission baselines on projected data (simulations) isalso likely to result in baselines that are not as transparent because of the inherent uncertaintyassociated with projections. Lack of transparency is due to the importance of expertjudgement in projections, and also because any simulation would need to be explained fully inorder to enable a reconstruction.
Baseline transparency is likely to increase if there are fewer components to an emissionsbaseline (e.g. in the case of multi-project baselines), or if the components and/or methodologyused to set up the baseline are standardised to some extent. In addition, standardisation couldhelp to group similar projects together39 and thus facilitate centralised, and presumably morestreamlined, verification (e.g. by governments, by the UNFCCC, the CDM’s Executive Boardor another body) of emissions credits by allowing easy identification of “outliers”.
5.4 Environmental effectiveness
There are at least two components to environmental effectiveness. The first is at the projectlevel, i.e. the environmental additionality of the project. The second is the performance of JIor the CDM as a whole with respect to whether they contribute to achieving the objectives ofthe Protocol by limiting global emissions in a manner that is least cost.
5.4.1 Project-level environmental additionality
The difference between a project’s actual emissions and emissions baseline is a measure ofthe environmental additionality of that project. Of course, the emission baseline needs toreflect a credible business-as-usual scenario in order to assess emissions “additionality”. Thisadditionality is also affected by the extent of free-riders, gaming and leakage (see glossaryand below) associated with a project and its baseline40. This section assesses how and if theapproach used to establish an emissions baseline can affect these different factors.
Project-specific baselines enable an individualised assessment of environmental additionalitybased on what could have happened in the absence of that particular project. In contrast,hybrid and multi-project (both aggregate and disaggregate) baselines are not developedexpressly for one particular project and therefore represent an average approximation of“what would have happened otherwise”.
Gaming can have a substantial effect on the level of baselines for individual projects, andtherefore the level of credits associated with a single project. For project-specific baselines,gaming could take place for each of the many components that make up the emissionsbaseline. This is because the assumptions used to develop a project-specific baseline mightbe expected to vary significantly from project to project even for those that appear to besimilar (sometimes referred to as “micro” gaming). Gaming would have the effect ofweakening the stringency of the baseline, and therefore increasing the level of creditsassociated with that project. The relatively high potential for gaming was a significantdrawback noted to the project-specific baselines used in AIJ pilot projects.
Gaming might also extend across whole project categories (sometimes referred to as “macro”gaming), e.g. if gaming was prevalent in establishing agreement on the levels of multi-project
39 This is not necessarily the case in the AIJ pilot phase, where the different categories are sowide that there not all projects within each category are comparable.
40 As mentioned previously, the implications for global GHG emissions may be different forCDM and JI.

COM/ENV/EPOC/IEA/SLT(2000)8
38
baselines. However, the potential for gaming can be expected to be lower in the case ofstandard assumptions being developed by bodies not having specific economic interests in theprojects.
As the examples in sections 4.1 and 4.2, and in other sensitivity analyses (e.g. Ellis 1999),demonstrate, baseline levels are more sensitive to some assumptions than others. Forexample, for energy projects emission benefits are highly dependent on e.g. the emissionstimeline and the baseline fuel/technology. Gaming is possible when assessing and decidingboth of these assumptions.
In the case of a coal-fired power plant, emissions per kWh are approximately double those ofgas-fired electricity (due to gas’ lower carbon content and the higher combustion efficiency ofgas-fired stations). Therefore, comparing a proposed JI or CDM project against a coal-firedbaseline could double the ERUs or CERs compared to a gas-fired baseline. It may beappropriately argued that a coal-fired baseline is a valid assumption for a new plant if coal-fired generation makes up a substantial proportion of baseload generation in the proposed hostcountry. However, coal may not be the type of plant that is presently being used for newbaseload facilities in that country. Nevertheless, assuming that a plant currently fired by coalwould continue to be so could be considered a valid assumption for a baseline in a proposedrefurbishment-type JI or CDM project, even in a country where policies aim for adecarbonisation of electricity supply.
Gaming could significantly alter the credits associated with a particular project, especiallywith respect to fuel input assumptions. This in turn could limit or cancel the environmentaleffectiveness of the project. Clear rules on how to choose specific baseline assumptions indifferent situations could limit the amount of possible gaming.
Free riders would obtain emission credits for whole projects that would have gone ahead inthe absence of the project-based mechanisms. Without clear rules on baseline selection andthus project eligibility, free riders could inflate the number of projects obtaining credits. Freeriders could therefore artificially inflate the estimated “environmental benefits” or creditsarising from JI and CDM projects.
“Free-riding” is essentially a matter not of the baseline approach, but of baseline stringency.For example, if projects are deemed automatically eligible for credits by fulfilling certaincriteria (e.g. by having per unit emissions below a certain level), a lax baseline couldsystematically result in free riders41. Project-specific baselines may also give rise to freeriders. This could occur as a result of the potential for gaming in developing project-specificbaselines (e.g. in the case that a project developer falsely stated that the project would nothave gone ahead in the absence of JI/CDM), or because of uncertainty in the emissionbaseline (e.g. if a developer estimates a baseline in good faith but is proved wrong at a laterdate).
Some have suggested that multi-project baselines could also be set in such a way to allowcrediting only for low-emitting project types or categories (Friedman 1999b). This has beenreferred to as “forcing”, and could reduce the risk of free riders. However, if “forcing” led tolow baseline levels, it may inhibit some projects that may nevertheless be environmentallybeneficial (e.g. a gas-fired plant where coal is being widely used).
41 However, assessing that some technologies are a priori additional may result in lower orhigher numbers of “free rider” credits depend on which technologies were assessed asautomatically additional. For example, allowing all non-hydro renewable projects to obtaincredit is still likely to result in only a small number of “free rider” credits if only a limitednumber of projects that are small-scale are initiated.

COM/ENV/EPOC/IEA/SLT(2000)8
39
Free riders and gaming may pose more of a problem for CDM projects than for JI projects:CDM hosts potentially gain investment in CDM projects and do not lose anything if a CDMproject is demonstrated to be a free rider. However, the global atmosphere may lose fromfree-riding in the CDM. Similarly, free rider projects in a JI host country could make it moredifficult for that country to meet its emission commitment.
Leakage occurs if the actual emission reduction or increase in sinks from a JI or CDM projectresults in emissions increasing elsewhere. Leakage could occur because system boundariesmay be drawn in such a way as to ignore emission increases from the proposed JI or CDMproject.
Potential sources of leakage vary according to project type, and which emission sourcesand/or effects are taken into account (or not) in a project’s baseline. This may be influencedby the type of baseline used. Multi-project baselines could result in relatively low levels ofleakage if the baselines account for all emissions in a sector/country. Project-specificbaselines could result in higher or lower levels of leakage, depending on where the boundaryfor assessing the emissions baseline is drawn.
5.4.2 Overall environmental effectiveness of JI/CDM
The foregoing discussion points out that different baseline approaches result in differentpotentials for gaming, free riders and leakage. However, it is difficult to assess the aggregateeffect of these three factors without knowing the number and mix of projects that would beeligible and initiated under each of the different approaches.
The overall environmental effectiveness of JI/CDM42 will be a factor of both theenvironmental additionality of projects and the total number of projects undertaken under themechanisms. Environmental performance will be greatest if the mechanism is set up so that ahigh number of clearly additional projects are established. Performance will be lowest ifmany projects, none of which are additional, are established. It will be positive, but notoptimal, if a few projects with a high additionality are undertaken, or if many projects withlow additionality are undertaken. The challenge is to balance the number of projects with theenvironmental additionality of individual projects in order to maximise overall environmentaleffectiveness of the mechanism.
Figure 5 illustrates the possible effect of baseline complexity and baseline stringency (a proxyfor the environmental additionality of a project) on the number of projects undertaken. Oneof the reasons suggested for the relative paucity of AIJ projects was that setting baselines wastoo complex and costly. Reducing the complexity and cost of setting baselines will thereforereduce one of the barriers to implementing project-based mechanisms (IEA 1997), and istherefore likely to increase the numbers of projects initiated. This is represented in Figure 5by the left-hand side assuming a greater number of projects than those on the right hand sideat the same level.
Figure 5 also illustrates the hypothesis that project numbers are related to baseline stringency.A stringent baseline is one using assumptions that result in a lower, rather than higher,baseline level. A stringent baseline will therefore lead to fewer credits per project, but -despite the uncertainties surrounding baselines - is more likely to result in a project that isenvironmentally additional. If investors in project-based mechanisms are rational actors, theywould prefer having a less stringent (or a lax) baseline as this would result in more credits for
42 The implications of different levels of effectiveness may be different for JI and for CDMbecause of the differences already noted between these mechanisms (see section 1.2).

COM/ENV/EPOC/IEA/SLT(2000)8
40
the same project. This is shown in Figure 5 by the assumption that project numbers will belarger with a lax baseline than with a stringent one.
The third hypothesis implicit in Figure 5 is that the baseline complexity is not related to thebaseline stringency. Thus, complex baselines could be either stringent or lax, and thereforegenerate credits for projects that may be additional or not. Equally, simple baselines couldlead to greater or lesser stringencies – therefore leading to projects where the additionality ismore or less certain. Clearly, some degree of complexity may be warranted. For example, wewould not choose to set a random level for a baseline in the forest sector – but rather wouldneed to know something about expected business-as-usual lifetimes of existing trees and newtrees planted; developing such a baseline could be a data intensive, and relatively complexoperation.
Figure 5: Possible effect of baseline stringency and complexity on project
numbers and project’s environmental additionality
If these three hypotheses are correct, the maximum environmental effectiveness of theproject-based mechanisms (as opposed to individual projects) is unlikely to be achieved eitherwith highly complex baselines, or with overly stringent baselines. As a general rule,minimising the degree of complexity for emission baselines is desirable as long as we do notcompromise our ability to determine “what would have happened otherwise”. Similarly,maximising the environmental stringency of the baseline must be traded off against thedesirability of maximising the overall global environmental benefits from the project-basedmechanisms – a greater number of good projects will be more beneficial for the environmentthan a smaller number of individually better projects. However, neither the relationshipbetween project numbers and baseline stringency or between project numbers and baselinecomplexity is known. It is therefore not yet possible to determine at which baseline level(s)the number of projects are likely to be so low that the mechanisms would no longer be aneffective means of reducing global GHG emissions.
Table 6 summarises the different criteria for, and consequences of, different emission baselineapproaches.
Baselinecomplexity
Bas
eli n
est
r ing
ency
Lower transaction costs
Additionality
Many projects
Higher transaction costs
Additionality
Some projects
Lower transaction costs
Additionality
Some projects
Higher transaction costs
Additionality
Few projects
Lower transaction costs
No additionality
Many projects
Higher transaction costs
No additionality
Some projects
simple complex
stringent
lax
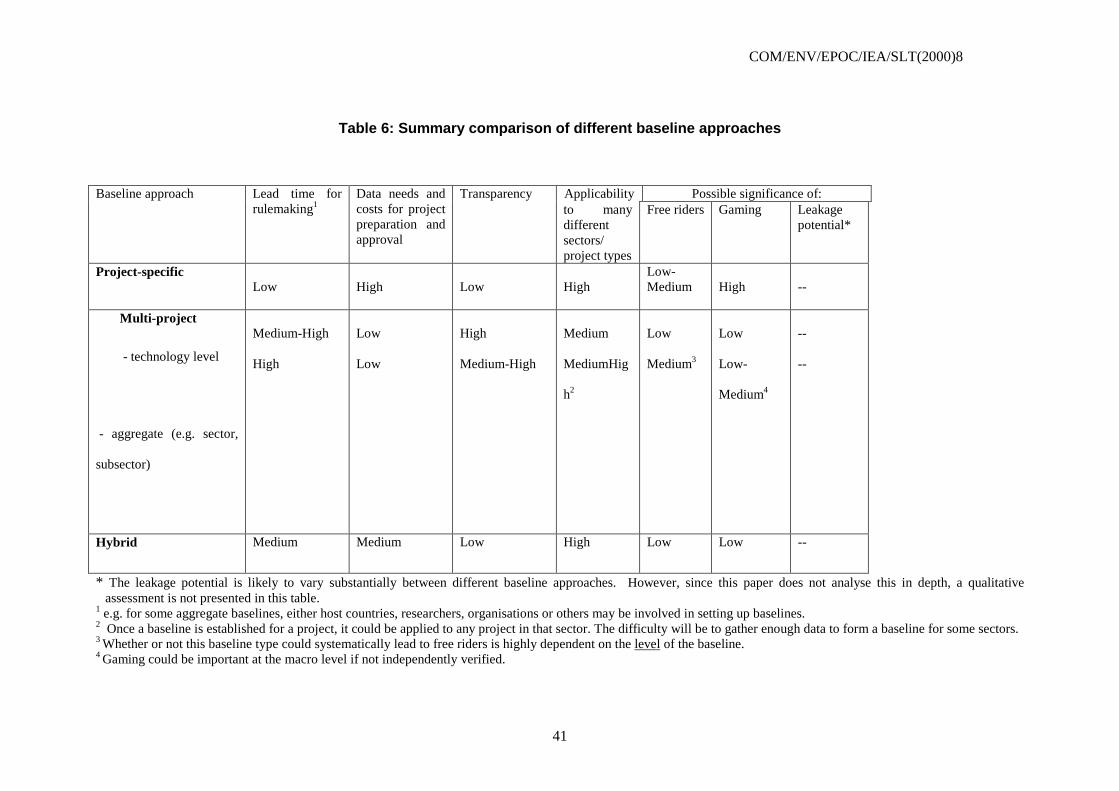
COM/ENV/EPOC/IEA/SLT(2000)8
41
Table 6: Summary comparison of different baseline approaches
Applicability Possible significance of:Baseline approach Lead time forrulemaking1
Data needs andcosts for projectpreparation andapproval
Transparencyto manydifferentsectors/project types
Free riders Gaming Leakagepotential*
Project-specificLow High Low High
Low-Medium High --
Multi-project
- technology level
- aggregate (e.g. sector,
subsector)
Medium-High
High
Low
Low
High
Medium-High
Medium
MediumHig
h2
Low
Medium3
Low
Low-
Medium4
--
--
Hybrid Medium Medium Low High Low Low --
* The leakage potential is likely to vary substantially between different baseline approaches. However, since this paper does not analyse this in depth, a qualitativeassessment is not presented in this table.
1 e.g. for some aggregate baselines, either host countries, researchers, organisations or others may be involved in setting up baselines.2 Once a baseline is established for a project, it could be applied to any project in that sector. The difficulty will be to gather enough data to form a baseline for some sectors.3 Whether or not this baseline type could systematically lead to free riders is highly dependent on the level of the baseline.4 Gaming could be important at the macro level if not independently verified.

COM/ENV/EPOC/IEA/SLT(2000)8
42
6. Conclusions
There are many technical issues that still need to be resolved for both JI and the CDM43.These include questions related to baselines as well as to additionality, eligibility, monitoring,reporting and verification. Many of these issues are interlinked; defining one will influenceothers. Determining how to set emission baselines for project-based mechanisms may need tobe advanced in parallel with these other rules, in order to take these other rules into account.
Determining emission baselines is critical for the assessment of a project’s environmentaladditionality, but it can be a complex process. Moreover, baselines estimate what wouldhappen in future, and are therefore hypothetical and subject to uncertainty. If “perfection isthe enemy of the good” a balance needs to be drawn between striving for a perfect baselineand what is practical from an environmental, institutional and investor’s point of view.
There are different approaches that could be used to establish emission baselines for project-based mechanisms. “Project-specific” approaches evaluate emission reductions generatedfrom a particular project. “Multi-project” approaches can be applied to many differentprojects of a similar type or types. “Hybrid” baselines could also be designed, and would aimto maximise the benefits from the other approaches. Distinguishing between differentapproaches may be difficult in some cases.
Some cross-cutting issues are relevant to all baseline approaches. These include the length oftime emission credits can accrue and whether or not the baseline is fixed at the start of theproject (static) or revised during the project operation (dynamic). Static baselines arepredictable, less of an administrative, monitoring and reporting burden, and cheaper.Dynamic baselines may better reflect actual trends, but would result in greater uncertainty asto how many credits a particular project would generate. A number of analyses suggest thatdynamic baselines may be more appropriate for some project types.
There are many different views on how an emissions timeline could be set, but given theimportance of the timeline on total credits from a project, applying standardisedmethodologies to assess a project’s emissions timeline could offer a simple way of limitingthe effects of free riders and gaming. Any such methodologies would need to vary betweenprojects that reduce emissions, where short timelines help to ensure the environmentaladditionality of any credits, and those that increase sinks, where longer timelines would havethe same effect. A distinction may also be needed between the timelines for JI and CDMprojects, given the potential emission leakage associated with the latter.
Baseline approaches differ in their costs, transparency, data requirements and monitoring,reporting and verification needs. They may also, in some cases, have different environmentaladditionality implications. Different baseline approaches may also be most appropriatelyapplied for different project types. For example, projects with homogeneous output (e.g. inthe electricity sector) may be more suitable for multi-project baselines than highly site-specific projects.
High baseline development costs will discourage potential investment in JI and CDMprojects. The relatively high cost of establishing project-specific baselines for AIJ pilot phaseprojects has stimulated interest in less costly, more standardised approaches. Moreover,although baselines that could be applied to more than one project may be costly to develop atthe outset, they could lead to economies of scale and facilitate project preparation once initialguidance is established.
43 There are different views on whether or not the baseline-setting framework should be thesame for JI and CDM.

COM/ENV/EPOC/IEA/SLT(2000)8
43
The environmental additionality of different emission projects is based on the differencebetween the baseline and actual emissions. Different baseline approaches can influence theenvironmental additionality of a project by influencing the level of gaming, free riders andleakage associated with it. Assumptions used to develop the baseline and what is included inthat baseline can also have significant effects on these factors.
Gaming affects the level of a project baseline, and thus the resulting amount of emissioncredits generated by a JI or CDM project. Gaming is likely to be more prevalent in project-specific baselines where a large variation in underlying assumptions is expected. Free ridersaffect the number of projects credited, allowing projects that would have happened without JIor CDM credit to get credit anyway. The level of free riders could be significant if certainproject types are deemed a priori eligible to obtain credits (e.g. by having per unit outputemissions below a certain level). Leakage is a measure of how accurately the projectboundary reflects the overall environmental effects of a project. The importance of leakage islikely to vary significantly by project type and may be lower in more aggregated baselines(e.g. multi-project baselines) where project boundaries are wider.
Increased levels of gaming, free riders and leakage would artificially inflate acquisitions ofERUs and CERs by investors. If not all CERs accruing from CDM projects were “real” theenvironmental effectiveness of the CDM would be lessened because the environmentalbenefits of CDM investment is not assured. Higher levels of gaming, free riders and leakagein JI projects will not affect the environmental effectiveness per se, (because the overallAnnex I assigned amount would remain unaffected by acquisitions and transfers of JI credits).However, it could increase the difficulties for host countries in meeting their individual Kyotocommitments. Determining the relative importance of these different factors is difficult in theabsence of information on emission baseline levels and on the number and type of projectslikely to be undertaken under each approach.
This paper presents a preliminary survey of analyses done on the effect that different baselineapproaches and/or assumptions have on the level of credits generated by a particular project.This paper also illustrates the influence that different national circumstances can have on theabsolute level of the baseline and the resulting emission credits. For example, if both Indiaand Brazil set a multi-project baseline for electricity projects at the level of current weightedaverage emissions, potential gas-fired projects could generate certified emission reductions ifthey were undertaken in India, but not in Brazil. Because of variable conditions in theelectricity sector among different countries it may not be appropriate to use a common multi-project baseline assumption (e.g. average fossil fuel) across different countries
The review of empirical data presented in this paper, and the theoretical case study ofelectricity in Brazil and India, indicate that the assumptions and approaches used to developbaselines are independent variables. Both can influence the level of credits for a particularproject. In the examples examined here, the range in different possible assumptions withinone baseline approach can be as large as the range in assumptions between different baselineapproaches. However, not all approaches may be equally appropriate in all circumstances,and different approaches may be viewed as more or less suitable for different types of projects(e.g. forestry, electricity or landfill).
Both baseline assumptions and approaches will have an impact on the environmentaladditionality of individual projects. They will also influence the overall environmentaleffectiveness of the mechanisms, i.e. the contribution of JI or the CDM as a whole toachieving the objectives of the Protocol.
The baseline approach will influence the environmental effectiveness of the mechanisms inpart through its impact on the complexity of setting up an emissions baseline. More complexmethods are likely to limit the number of projects initiated because of high transaction costs.

COM/ENV/EPOC/IEA/SLT(2000)8
44
Baseline assumptions are also likely to have an impact on the effectiveness of the mechanismsthrough their impact on the baseline stringency, which affects the level of credits, and throughthis the number of projects initiated. Both stringent and lax baselines are possible under thedifferent baseline approaches. Overly stringent baselines are likely to limit the number ofprojects initiated (and thus the amount of emission reductions achieved through themechanisms). Overly lax baselines may encourage greater overall participation in the project-based mechanisms by raising project eligibility and the number of emission credits, but couldhave a negative environmental effect.
In circumstances where different baseline approaches are plausible, the independence ofbaseline stringency and approaches suggests that maximum environmental effectivenessacross the project-based mechanisms (as opposed to individual projects) is likely to beachieved by optimising baseline stringency and reducing baseline complexity. In practice,this means: (i) seeking to minimise baseline complexity, as long as the ability to determine"what would have happened otherwise" is not compromised; and (ii) optimising the baselinestringency so that it maximises the overall global environmental effectiveness from theproject-based mechanisms.
An optimal strategy takes into account that a high volume of projects will be needed to deliverstrong environmental effectiveness from the mechanisms: a higher number of good projectswill be more beneficial for the environment (in terms of total GHG reductions) than a lowernumber of individually better projects. However, since the relationship between projectnumbers/baseline stringency and between project numbers/baseline complexity are bothunknown, it is not yet possible to determine the levels at which baseline stringency or baselinecomplexity will limit the number of projects initiated.
There may be differences in the most desirable baseline approach for different project types indifferent sectors. This would need to be examined further, as would how to minimisecomplexity within the different approaches. Any future decisions on baseline approaches andassumptions may therefore aim to reduce the complexity of baseline-setting procedures and toset the baseline stringency so that it properly balances environmental benefit, cost, andparticipation.
A decision on baseline approach(es) would open the door for assessment and eventualagreement on other credit-related aspects of JI and CDM projects, such as:
• how to determine the value of key assumptions;• how long any project should be allowed to generate emission credits for (the emissions
timeline),• whether or not emissions baselines should be static or dynamic;• maximising the environmental effectiveness of the project-based mechanisms by
minimising the level of leakage, free riders and gaming, and• assessing how to determine the additionality of a climate-friendly project in a country that
has low emission levels.

COM/ENV/EPOC/IEA/SLT(2000)8
45
Annex A: Possible reporting requirements for baselines
The current reporting requirements for emission baselines for AIJ projects are laid out in theUNFCCC’s Uniform Reporting Format (URF)44. These reporting requirements cover allaspects of an AIJ project (including e.g. contact points, financial aspects etc.) as well as anestimation of emissions “with the project activity” (section E2) and “without the activity(project baseline)” (section E1). However, the guidance in the current URF of what should bereported in these sections is limited to a request for a “description of the baseline or referencescenario, including methodologies applied” and a “description of the scenario, includingmethodologies applied”. The current URF does not, for example, request that underlying data(such as fuel use, fuel emission factors, technology efficiencies etc.) be reported, althoughsome AIJ project reports do in fact include some or all of this information.
Emission baselines may need to be reported to the UNFCCC both for CDM and for JIprojects. It may be decided that the URF for these project reports may need to be moredetailed, and/or that more specific guidance is included, such as examples of whatcould/should be reported for different project types. More detailed reporting formats couldhelp to reduce the time and cost of developing a reporting format for individual projectdevelopers, and could also help to reduce data-related costs by indicating which data areneeded for which project type. This is a matter which will need to be decided in thenegotiating fora. Nevertheless, possible more detailed reports for project-based baselinereports in selected sectors could include the following outlined overleaf.
Forestry: Re/afforestation projects (from MacDicken, 1997)
General information: Local name of project siteAddress, State, CountryLatitudeLongitudeElevation (m)Species (before and after project)
Site history since last inventory: (description of significant changes in management, pest anddisease problems, harvesting or other mortality).
Month of inventory determination
Carbon pool Area (ha) Mean carbondensity (Mg/ha)
Total carbon(Mg)
Confidenceinterval (Mg)
Reference caseAbove-groundBelow-groundForest floorSoil to depth of 30cm
Total- reference case
NA
Project caseAbove-groundBelow-groundForest floorSoil to depth of 30cm
Total- project case
ha
NET CARBON STORED
44 Draft revisions to this URF are outlined in FCCC/SB/1999/5/Add.1.

COM/ENV/EPOC/IEA/SLT(2000)8
46
Energy supply: replacement or refurbishment of isolated electricity/heat production facilities(from Ellis 1999)45
General information• name of project site;• address, countryWhat is the distance of the proposed plant from:
• the nearest gas grid;• the nearest district heating system?
Is the plant currently connected to the electricity grid?
Old plant Retrofit/converted plantFuel(s) used* > Fuel(s) used* >Emission factor(s) (t C/TJ) > Emission factor(s) (t C/TJ) >Average annual quantity offuel used in old plant(TJ or toe**)
> Projected annual fuel use inretrofitted plant (TJ or toe**)
>
Average annual energyproduction at old plant: > (electricity)
> (heat)
Projected annual energyproduction at modified plant: > (electricity)
> (heat)Age of plant (years) > Size and/or type of new
equipment> (size, MW)> (type, e.g. boiler)
Expected life of plant atconstruction (years)
> Is this new equipment addedor is it replacing other eqpt.?
>
Description of planttechnology.
- Expected life of retrofit plant >
* If more than one fuel used, state approximate proportion of each** It is important that this figure is expressed in terms of energy units in order to be consistent
with the expression of the emission factor, and for comparison (transparency) purposes.
45 Reporting the information in the table would help to determine if emissions with the projectwere lower than emissions prior to implementing the project. However, it would notdetermine whether, for example, an existing plant would have been retrofitted anyway, orwhether emissions would have been expected to decrease anyway because of decreasingdemand. Such information could be requested either in this part of a new URF, or in the partof the URF indicating why the particular project fits with national economic developmentand socio-economic and environment priorities and strategies. The type of informationreported for a new plant, and for a grid-connected plant may be different (because of itsinteraction with other plants in the same system).

COM/ENV/EPOC/IEA/SLT(2000)8
47
Energy efficiency (from Vine and Sathaye, 1999a)
ENERGY USE AND CARBON EMISSIONS
Table A1: Estimated Energy Use and Carbon Emissions in Baseline [At Time ofProject Registration]
Estimate annual energy use and carbon emissions (1) for the unadjusted baseline (without free riders), (2) freeriders, and (3) for the baseline (adjusted for free riders). Indicate the level of precision for each value.
Estimated UnadjustedBaseline (1)
Level ofPrecision a
FreeRiders (2)
Level ofPrecision a
Without -ProjectBaseline(3=1-2)
Level ofPrecision a
On-site fuel use(Terajoules =1012 joules/yr.)Carbon emissionsfactor b
Type of fuel:Carbon emissions(tC/yr.)
-
On-site electricityuse (MWh/yr.)
Carbon emissionsfactor b
Type of fuel:Carbon emissions(tC/yr.)
Off-site fuel use(Terajoules =1012 joules/yr.)Carbon emissionsfactor b
Type of fuel:Carbon emissions(tC/yr.) c
Off-siteelectricityuse(MWh/yr.)Carbon emissionsfactor b
Type of fuel:Carbon emissions(tC/yr.) c
TOTALCarbon emissions(tC/yr.)
a Indicate the level of precision used for project values: use either (1) standard deviation around the mean value,or (2) general level of precision (e.g., low, medium, high) Ñ if more information is available, additional levels ofprecision can be used.b Specify type of fuel used for calculating carbon emissions factor.c Indicate carbon reductions from off-site electric utility plant(s).

COM/ENV/EPOC/IEA/SLT(2000)8
48
Table A2: Estimated Gross Changes in Energy Use and Carbon Emissionsfrom Project [At Time of Project Registration]
Estimate annual energy use and carbon emissions (1) for the unadjusted project, (2) frompositive project spillover, (3) from market transformation, and (4) for the “with-project”scenario. Indicate the level of precision for each value.
Estimated UnadjustedBaseline (1)
Level ofPrecision a
FreeRiders (2)
Level ofPrecision a
Without -Project Baseline(3=1-2)
Level ofPrecision a
On-site fuel use(Terajoules =1012 joules/yr.)Carbonemissions factor b
Type of fuel:Carbonemissions (tC/yr.)
-
On-siteelectricity use(MWh/yr.)Carbonemissions factor b
Type of fuel:Carbonemissions (tC/yr.)
Off-site fuel use(Terajoules =1012 joules/yr.)Carbonemissions factor b
Type of fuel:Carbonemissions(tC/yr.) c
Off-siteelectricityuse(MWh/yr.)Carbonemissions factor b
Type of fuel:Carbonemissions(tC/yr.) c
TOTALCarbonemissions (tC/yr.)
a Indicate the level of precision used for project values: use either (1) standard deviation around the mean value,or (2) general level of precision (e.g., low, medium, high) Ñ if more information is available, additional levels ofprecision can be used.b Specify type of fuel used for calculating carbon emissions factor.c Indicate carbon reductions from off-site electric utility plant(s).

COM/ENV/EPOC/IEA/SLT(2000)8
49
Table A3: Estimated Net Changes in Energy Use and Carbon Emissions fromProject [At Time of Project Registration]
Calculate the net change in annual energy use and carbon emissions by subtracting “with-project” values (takenfrom Table A2) from “without-project baseline” values (taken from Table A1). Indicate the level of precision foreach value.
Estimated UnadjustedBaseline (1)
Level ofPrecisiona
FreeRiders (2)
Level ofPrecision a
Without - ProjectBaseline (3=1-2)
Level ofPrecision a
On-site fuel use(Terajoules =1012 joules/yr.)Carbonemissionsfactor b
Type of fuel:Carbonemissions(tC/yr.)
-
On-siteelectricity use(MWh/yr.)Carbonemissionsfactor b
Type of fuel:Carbonemissions(tC/yr.)Off-site fuel use(Terajoules =1012 joules/yr.)Carbonemissionsfactor b
Type of fuel:Carbonemissions(tC/yr.) c
Off-siteelectricityuse(MWh/yr.)Carbonemissionsfactor b
Type of fuel:Carbonemissions(tC/yr.) c
TOTALCarbonemissions(tC/yr.)a Indicate the level of precision used for project values: use either (1) standard deviation around the mean value,or (2) general level of precision (e.g., low, medium, high) Ñ if more information is available, additional levels ofprecision can be used.b Specify type of fuel used for calculating carbon emissions factor.c Indicate carbon reductions from off-site electric utility plant(s).

COM/ENV/EPOC/IEA/SLT(2000)8
50
Annex B: Data used to assess different possible baseline assumptions in India and Brazil
Table B 1 : CO2 emissions from electricity generation, Brazil
1996 electricityoutput (GWh)
1996 Sourcespecific average
(t CO2/GWh)
25% less CO2
intensive thanaverage
(t CO2/GWh)
diff b/w sourceaverage and 25%
more efficient(t CO2/GWh)
planned new tech.In Brazil
(t CO2/GWh)
diff. b/w source averageand planned tech.
(t CO2/GWh)
average best availabletechnology
(t CO2/GWh)
diff. B/w sourceaverage and BAT
(t CO2/GWh)Nuclear(i) 2429 (0.8%) 0,00 0.00 0.00 0 0.00 0.00 0.00
Coal (ii) 4764 (1.6%) 1102 827 275 1042 60.2 781 320
Oil (iii) 8929(3.1%) 776 582 194 n.a. n.a. n.a. n.a.
Gas(iv) 714 (0.2%) 742 557 186 404 338 382 361
Bio & sugar cane** 7208 (2.5%) 0.0 0.0 0.0 n.a. 0.00 n.a. 0.00
Hydro** 265773 (92%) 0.0 0.0 0.0 n.a. 0.00 n.a. 0.00
TOTAL 289817 437 328 -
Average (foss.fuel) 873 654 219
Weighted average (all sources) 43.9 32.9 10.97
Weighted average (thermal only) 755 566 189
Weighted average (fossil only) 882 662 221

COM/ENV/EPOC/IEA/SLT(2000)8
51
Table B 2: Cost of electricity generation, Brazil
Investment cost of newplant ('96Uscents/KWh)
Total cost (incl. O&M +fuel)of new plant
(1996UScents/KWh)
total cost of average BAT('96US cents/KWh)
approx. incremental cost of BAT (UScents/KWh)
Nuclear (i) 3.58* 5.15* 5.35* 0.2Coal (ii) 2.41* 4.3 * 5.15* 0.85Oil (iii) n.a. 5.18* n.a. n.a.Gas (iv) 1.41* 3.38* 4.77 * 1.39
Wind n.a. 4.87* 6.4 ** 1.53Biomass/sugarcane residues* 3.27-6.54 n.a. (site-specific) n.a.
Hydro* 33% below 3.2739% b/w 3.27-5.7528% above 5.75
n.a. (site-specific) n.a.
Output and CO2 (fossil fuel combustion) data from 1998 IEA Statistics, IEA 1998b, IEA 1998c* Most cost data based on NEA/IEA (1998)(i) nuclear assumptions : new plant is pressurised heavy water reactor; BAT includes reactors in several OECD countries, e.g. boiling water reactor, pressurised water reactor, advanced boilingwater reactor.(ii) Coal assumptions: planned new tech (pulverised coal comb. @ 33% efficiency); BAT (clean coal, i.e. pulverised coal comb. (supercritical) @ 44% efficiency, based on average of several OECDcountries; mix of sub-bituminous(60%) & bituminous(40%)(iii) Oil: no new oil-fired plants are planned in OECD (except Turkey)(iv) Nat. Gas assumptions: planned new tech(CCGT@50% efficiency); BAT([email protected]% efficiency, based on average of several OECD countries)** Renewables : zero value given to emissions, as per IPCC recommendations (however, lifecycle emissions estimates available in IEA 1998b; cost estimates from IEA 1997b

COM/ENV/EPOC/IEA/SLT(2000)8
52
Table B 3: CO2 emissions from electricity generation, India
1996 electricityoutput (GWh)*
1996 Sourcespecific average
(tC02/GWh)
25% less CO2-intensive than
average
(t CO2/GWh)
diff b/w sourceaverage and25% moreefficient
(t CO2/GWh)
planned newtech.
In India
(t CO2/GWh)
diff. b/w sourceaverage andplanned new
tech.(t CO2/GWh)
Average bestavailable
technology
(t CO2/GWh)
diff.b/w sourceaverage and BAT
(t CO2/GWh)
Nuclear (i) 8400 (1.9%) 0,00 0,00 0,00 0 0.00 0.00 0.00Coal (ii) 318357 (73%) 1222 917 306 1017 205 786 436
Oil (iii) 12000(2.8%) 670 503 168 n.a. - n.a. -Gas (iv) 27189(6.2%) 515 386 129 403 111 382 133
Renew.(wind..)** 57 (0.01%) 0.0 0.0 0.0 n.a. - n.a. -Hydro** 69072(15.9%) 0.0 0.0 0.0 n.a. - n.a. -TOTAL 435075 401 301 101
Average (fossil fuels) 802 602 201
Weighted average (all sources) 945 709 236
Weighted average (thermal only) 1123 843 281
Weighted average (fossil only) 1150 862 288

COM/ENV/EPOC/IEA/SLT(2000)8
53
Table B 4: Cost of electricity generation, India
Investment cost of new plant('96UScents/KWh)
Total cost (incl. O&M +fuel) ofnew plant (' 96UScents/KWh)
average total cost of BAT(UScents/KWh)
Approx. Incremental costof BAT (US cent/KWh)
Nuclear (i) 3.73 5.19 5.35 0.16Coal (ii) 1.59 4.23 5.15 0.92Oil (iii) n.a. n.a. n.a. n.a.Gas (iv) 2.18 4.50 4.77 0.27Wind n.a. 6.44** -Hydro (almost all cost is capital inv.) 5.51* n.a. -- Output and (fossil fuel) CO2 data from the 1998 IEA Statistics, IEA 1998c, IEA 1998d- Most cost estimates based on NEA/IEA (1998)* Based on the IEA, World Energy Outlook assumptions(i) nuclear assumptions : new plant is pressurised heavy water reactor; BAT includes reactors in several OECD countries, e.g. boiling water reactor, pressurised water reactor, advanced boilingwater reactor.(ii)coal assumptions : planned new technology is pulverised coal combustion @ 35%efficiency; BAT is clean coal, i.e. pulverised coal comb, (supercritical) @ 44% efficiency, based on average ofseveral OECD countries; mix of lignite (6%), sub-bituminous(70%) & bituminous(24%), (NEA/IEA, 1998)(iii) oil : no new oil-fired plants planned in OECD (except Turkey)(iv) gas assumptions: As no India-specific data was available, costs estimated to be similar to those of Korea (in NEA/IEA, 1998) : planned new technology is CCGT @ 50% efficiency; BAT [email protected]% efficiency, based on average of several OECD countries (NEA/IEA, 1998)Renewables (**) : zero value given to emissions, as per IPCC recommendations (however, lifecycle emissions estimates available in IEA 1998b; cost estimates from IEA 1997b

COM/ENV/EPOC/IEA/SLT(2000)8
54
References
Begg, Katie, Stuart Parkinson, Tim Jackson, Poul-Erik Morthorst, Peter Bailey, 1999, Overall Issues forAccounting for the Emissions Reductions of JI Projects, presented at Workshop on Baselines forCDM, Tokyo, February 25 and 26, 1999, http://www.gispri.or.jp/
Carter, Lisa, 1997, Modalities for the Operationalization of Additionality, prepared for presentation atUNEP/German Federal Ministry of Environment workshop on AIJ (Leipzig, March 1997)
Centre for Clean Air Policy (CCAP), 1999, Options for Determining Baselines and Additionality underArticle 6 JI, presentation at SBSTA 10
Chomitz, K. M., 1998, Baselines for Greenhouse Gas Reductions: Problems, Precedents and Solutions,World Bank
Department of Industry, Science and Resources (DISR), 1999, Workbook for Calculating Greenhouse GasReductions from Projects Using Renewable Energy, Canberra,http://www.dpie.gov.au/resources.energy/environment/greenhouse/igp/index.html
Ellis, Jane, 1999, Experience with Emission Baselines under the AIJ Pilot Phase, OECD/IEA InformationPaper, OECD, http://www.oecd.org/env/cc/freedocs.htm
Emmer, Ignio, J.A. Verweij and J.M. de Ligt, 1999, Reforestation and flexible instruments – from projectimplementation to certification presented at Project types for Flexible Instruments – the situationafter Buenos Aires (January 28-29, 1999)
Ernst Basler + Partners, 1999, Swiss-Czech Cooperation Project “Conversion of Heating Centers”:Activities Implemented Jointly (AIJ) Study (prepared for the Swiss Federal Office for ForeignEconomic Affairs), Zurich
Fearnside, Philip M., 1999, Forests and global warming mitigation in Brazil: opportunities in the Brazilianforest sector for responses to global warming under the “clean development mechanism” inBiomass & Bioenergy, 16 (1999) 171-189
Friedman, Shari, 1999, Benchmarking for Project-Level GHG Emission Reductions, presentation atUNFCCC Technical workshop on Mechanisms, April 9-15 1999
Friedman, Shari, 1999b, The Use of Benchmarks to Determine Emissions Additionality in the CleanDevelopment Mechanism, presented at Workshop on Baselines for CDM, Tokyo, February 25 and26, 1999, http://www.gispri.or.jp/
Hassing, Paul and Matthew S. Mendis, 1999, An International Market Framework for CDM Transactions,paper prepared for the UNFCCC Technical workshop on Mechanisms, April 9-15 1999
IEA, 1997, Activities Implemented Jointly: Partnerships for Climate and Development, Paris
IEA, 1997b, Renewable Energy Policy in IEA Countries- Volume I : Overview, Paris
IEA, 1998, World Energy Outlook, Paris
IEA, 1998b, Benign Energy? The Environmental Implications of Renewables, Paris
COM/ENV/EPOC/IEA/SLT(2000)8
55
IEA, 1998c, Energy Statistics & Balances of Non-OECD Countries: 1995-1996, Paris
IEA, 1998d, CO2 Emissions from Fuel Combustion, Paris
Jackson, T and Begg, K, 1999, Accounting and Accreditation of Activities Implemented Jointly: FinalReport, Prepared for DGXII of the European Commission under the Environment and ClimateProgramme 1994-1998, March 1999
JIRC (Joint Implementation Registration Centre), 1997, Joint Implementation Registration andCertification Procedure, The Netherlands
Lile, Ronald, Mark Powell and Michael Toman, November 1998, Implementing the Clean DevelopmentMechanism: Lessons from US Private-Sector Participation in Activities Implemented Jointly,Resources for the Future discussion paper, available at http://www.rff.org/discpapers/abstracts/9908.htm
MacDicken, K. G., 1997, A Guide to Monitoring Carbon Storage in Forestry and Agroforestry Projects,Winrock International Institute for Agricultural Development, available athttp://www.winrock.org/REEP/forest_carbon_monitoring_program.htm
Michelowa, Axel, 1998, Joint Implementation - the baseline issue: economic and political aspects, GlobalEnvironmental Change, Vol 8, No. 1
Michaelowa, Axel, 1999, Project-specific, benchmark, top-down approaches for baselines andadditionality: a comparison, paper prepared for the UNFCCC Technical workshop on Mechanisms,April 9-15 1999
Nuclear Energy Agency (NEA) and the International Energy Agency (IEA), Projected Costs of GeneratingElectricity – Update 1998, OECD France, 1998
Nordic Environment Finance Corporation (NEFCO): Joint Implementation Study of Nordic MultilateralPilot Projects; Helsinki/Stockholm, 1996
Puhl, Ingo, 1998, Status of Research on Project Baselines Under the UNFCCC and the Kyoto Protocol,OECD/IEA Information Paper, OECD, available at http://www.oecd.org/env/cc/freedocs.htm
Puhl, Ingo, Tim Hargrave and Ned Helme, 1998, Options for Simplifying Baseline Setting for CleanDevelopment Mechanism Projects, Center for Clean Air Policy, Washington DC
Trexler and Associates, 1999a, Benchmarking the Additionality of Land Use Change and ForestryMitigation Projects: Identifying Issues and Potential Priorities
Trexler, Mark and Rebecca Gibbons, 1999b, Advancing the development of forestry and land-use basedproject baseline methodologies for the developing CDM Regime, presented at Workshop onBaselines for CDM, Tokyo, February 25 and 26, 1999, http://www.gispri.or.jp/
UNDP and WRI, 1999, Promoting development while limiting greenhouse gas emissions: Trends &Baselines, New York
UNFCCC, 1995, Report of the Conference of the Parties on its First Session, Held at Berlin from 28March to 7 April 1995, FCCC/CP/1995/7/Add.1
COM/ENV/EPOC/IEA/SLT(2000)8
56
UNFCCC, 1998a, COP4 Decisions and Resolutions, FCCC/CP/1998/16/Add.1
UNFCCC, 1998b, Review of the Implementation of Commitments and of other Provisions of theConvention. Activities Implemented Jointly: Review of Progress under the Pilot Phase (Decision5/CP.1), Second synthesis report on activities implemented jointly, FCCC/CP/1998/2
UNFCCC, 1999, Principles, Modalities, Rules and Guidelines for the Mechanisms under Articles 6, 12 and17 of the Kyoto Protocol: Submissions from Parties, FCCC/SB/1999/MISC.3 and Add.5
UNFCCC, 1999b, Activities Implemented Jointly under the Pilot Phase: Issues to be addressed in thereview of the pilot phase, including the third synthesis report on activities implemented jointly,FCCC/SB/1999/5 and Add.1
Venezuela, 1999, Principios que deben guiar el diseño y aplicacion del mecanismo de desarrollo limpio(MDL) contemplade en el protocolo de Kioto, submission to UNFCCC
Vine, Edward and Jayant Sathaye, March 1999, Guidelines for the Monitoring, Evaluation, Reporting,Verification, and Certification of Energy-Efficiency Projects for Climate Change Mitigation, Reportnumber LBNL-41543, Lawrence Berkeley Laboratory, USA, http://eetd.lbl.gov/ea/ccm/ccPubs.htm
Vine, Edward, Jayant Sathaye and Willy Makundi, March 1999, Guidelines for the Monitoring,Evaluation, Reporting, Verification, and Certification of Forestry Projects for Climate ChangeMitigation, Report number LBNL-41877, Lawrence Berkeley Laboratory, USA
available at http://eetd.lbl.gov/ea/ccm/ccPubs.htm
WBGU (German Advisory Council on Global Change), 1998, The Accounting of Biological Sinks andSources under the Kyoto Protocol: a step forwards or backwards for global environmentalprotection?, Special Report 1998, at http://www.awi-bremerhaven.de/WBGU/wbgu_sn1998_engl.html
Yager, Andrew J and Hans J Mydske, 1998, Fuel Switch in Boilers in the Slovak Republic: report to theNorwegian Pollution Control Authority, Institute for Energy Technology, Norway
Selected AIJ project reports submitted by Parties to the UNFCCC, http://www.unfccc.de/program/aij/
- Dutch micro-Hydel (Bhu/Nld)
- Tyumen (Nld/Rus)
- Cizkovice (Cze/Fra)
- Viljandi boiler conversion (Est/Swe) - 1997, 1998, top-down 1999, bottom-up 1999
- Jochy (Slv/Nor)

COM/ENV/EPOC/IEA/SLT(2000)8
57
Glossary
AIJ Activities Implemented JointlyBAT Best available technologyCDM Clean Development Mechanism (defined in Article 12 of the Kyoto Protocol)CER Certified Emission Reductions (generated from CDM projects)CH4 MethaneCO2 Carbon dioxideCOP Conference of the Parties to the United Nations Framework Convention
on Climate Change (UNFCCC)EIT Countries with Economies in TransitionERU Emission Reduction Unit (generated from Article 6 JI projects)FCCC United Nations’ Framework Convention on Climate ChangeGHG Greenhouse gasesIPCC Intergovernmental Panel on Climate ChangeJI Joint Implementation (outlined in Article 6 of the Kyoto Protocol)KP Kyoto Protocolkt thousand tonsLUCF Land Use Change and ForestryN2O Nitrous oxideOECD Organisation for Economic Co-operation and DevelopmentURF Uniform Reporting Format (form on which countries submit AIJ
project-specific information to the UNFCCC)

COM/ENV/EPOC/IEA/SLT(2000)8
58
Approach The general methodology used to calculate an emissions baseline (e.g. project-specific,hybrid, or multi-project).
Assumption The underlying component(s) used to develop an emissions baseline. For a project-specific baseline assumptions could include the technology type that would havebeen used and the efficiency that would have been achieved in the absence of theJI/CDM project. For a multi-project baseline, the potential assumption could be , forexample,. Average performance, marginal performance, best available technologyetc.
Baseline An emissions baseline is a hypothetical emission reference case representing theestimated level of GHG emissions that would have been emitted in the absence ofthe JI or CDM project.
Complexity The complexity of a baseline is a measure of how difficult it is to set up.Complexity will increase with the number of parameters in a baseline). A morecomplex baseline is likely to be more costly to set up than a simple baseline. A lesscomplex baseline could also facilitate the verification process.
Credits Unit used for the measurement, (e.g. in tonnes of CO2-equivalent), transfer andacquisition of emission reductions associated with JI and CDM projects.
Dynamic baseline A baseline that is revised during the lifetime of the JI/CDM project, withoutspecifications at the outset on how the revision(s) will be made.
Emissions timeline Time (number of years) over which emission credits resulting from a JI or CDMproject accrue.
Environmental additionality Difference between baseline emissions and actual emissions for a JI/CDM project.Environmental additionality of JI and CDM projects is required by the KyotoProtocol
Environmental credibility Quality of a baseline with respect to reflecting the emission level that would occurwithout the JI or CDM project(s). Given the hypothetical nature of emissionbaselines, environmental credibility is difficult to assess (even on an ex post basis).
Environmental effectiveness Extent to which the JI and CDM regimes, under different baseline approaches andassumptions, result in maximum emissions reductions and maximum participation,thereby contributing to achieving the objectives of the Kyoto Protocol.
Free riding A situation whereby a project generates emission credits from JI or CDM projectseven if the project would have gone ahead in the absence of JI or CDM, i.e. is not“additional”. Free riding therefore affects the numbers of projects obtaining credits.
Gaming Actions or assumptions taken by the project developer and/or project host that wouldartificially inflate the baseline (and therefore the credits from the project). Gaminggenerally leads to lax baselines.
Greenfield projects New projects, e.g. those taking place at a new site and increasing the host country’scapacity for heat output, electricity generation etc. (as opposed to refurbishmentprojects that build on existing projects)
Hybrid baseline A baseline made up of different components that could be applied to a number ofprojects. A hybrid baseline could combine some aspects of project-specific

COM/ENV/EPOC/IEA/SLT(2000)8
59
baselines (e.g. incorporating some site-specific analysis) and some aspects of multi-project baselines (e.g. to include some standardised emission values for differenttechnologies).
Leakage Leakage occurs if actual emission reductions (or increase in sinks) from a projectresults in emissions increasing (or sinks decreasing) elsewhere. Leakage occurs ifthe system boundaries do not capture all emission effects of a project.
Multi-project baselines Emission baselines (also defined as “benchmarks”, “activity standards”, “intensityindicators” in the literature) that can be applied to a number of similar projects, forexample within the same sector of a country or region. These emission baselinesmay be drawn up using an engineering approach to set standard baseline values for aparticular technology or industrial sector.
Project-specific baseline Project-specific emission baselines are those that have been drawn up for individualprojects by examining them on a case-by-case basis. Each project-specific baselineis used only for the project for which it was developed. The project-specificapproach is based on some combination of engineering judgement and site-specificanalysis.
Refurbishment projects Projects in which existing equipment/processes is upgraded or replaced.
Standardised assumptions Assumptions, e.g. on emission performance of a technology, that are standardised(generalised). These standardised assumptions may be used in the emissionbaselines for a number of projects.
Static baseline A baseline that is fixed at the start of the JI/CDM project andremains fixed for the duration of the project. It is possible to have a static baselinefor which the level changes over time, as long as this is specified at the outset of theproject.
Static baseline A baseline that is fixed at the start of the JI/CDM project and remains fixed for theduration of the project. It is possible to have a static baseline for which the levelchanges over time, as long as this is specified at the outset of the project.
Stringency (of a baseline) The stringency of a baseline is a measure of how difficult it is for projects togenerate emissions below the baseline level. Given the uncertainty andmeasurement errors inherent in establishing a baseline, there is a range of plausibleemission levels for any particular baseline. A stringent baseline will be at the lowend of that range, and a lax baseline will be at the high end of that range. Thedetermination of whether a particular baseline is stringent or not depends on theproject types and national/regional circumstances.
Transaction costs The costs associated with the process of obtaining JI or CDM recognition for aproject and obtaining the resulting emissions credits. Transaction costs wouldinclude, for example, costs of developing a baseline and assessing the“additionality” of a project, costs of obtaining host country approval, monitoring andreporting, etc. Transaction costs would not include the direct investment,maintenance and operational costs of the project.
Transparency A transparent baseline is one where the construction is clearly explained, where theparameters and methods used in the baseline are referenced and traceable, and wherethe baseline can be reconstructed by a third party. Transparency is also a qualitythat can reduce investors’ uncertainty associated with JI and CDM projects and thecredits that they can generate.

COM/ENV/EPOC/IEA/SLT(2000)8
60
Value of Credits The monetary value resulting from the supply and demand of emission creditsresulting from JI and CDM projects.