option-writing, vix, crypto, & blockchain: considerations ...€¦ · option-writing, vix,...
TRANSCRIPT

Prepared for QWAFAFEW New YorkEvent on Tuesday, April 24, 2018
Matt MoranHead of Global Benchmark Indexes Advancement
Option-writing, VIX, Crypto, & Blockchain:Considerations for institutional investors
1
THIS PRESENTATION IS ONLY FOR FINANCIAL PROFESSIONALS
The information in these materials is provided solely for general education and information purposes. No statement within this material should be construed as a recommendation to buy or sell a security or to provide investment advice. Please read closely the disclosures on the last slide.

Cboe Global Markets
Cboe Global Markets offers a range of products in multiple asset classes and geographies
Four U.S. Options Exchanges
Four U.S. Equities Exchanges
Futures Exchange
European Equities Global FX
Select Products offered on Cboe ExchangesContract Multiplier Avg. Daily Volume in
Jan. - Feb. 2018 S&P 500 (SPX) options $100 1,680,645 VIX Options $100 1,264,422 VIX Futures $1,000 405,866 Russell 2000 (RUT) Options $100 61,593 Bitcoin (XBT) Futures 1 bitcoin 6,994 MSCI EAFE (MXEA) Options $100 479 MSCI Emerging Markets (MXEF) Options $100 357 Source: Cboe

Warren Buffett's Comments on Option Investing The Oracle of Omaha has been writing puts.“In his 2008 letter, Buffett discusses his derivatives positions and the mark-to-market losses on those positions last year. … Buffett says in his letter,
"Our put contracts total $37.1 billion (at current exchange rates) and are spread among four major indexes: the S&P 500 in the U.S., the FTSE 100 in the U.K., the Euro Stoxx 50 in Europe, and the Nikkei 225 in Japan. Our first contract comes due on Sept. 9, 2019, and our last on Jan., 24, 2028. We have received premiums of $4.9 billion, money we have invested." As such, his strategy is twofold. First, he sells overvalued options by writing puts with very long horizons of more than 15 years, which are systematically overpriced. Second, he is making a classic Warren Buffett move, using the "float," or premium, from the options to invest. Because the options he has written are "European," which means they can only be exercised at expiration, he won't need to worry about having to pay out the notional value before expiration. All in all, this is just the type of elegant option-investing strategy to expect from a brilliant investor with a giant pool of capital. Buffett's strategy has collected a $4.9 billion option premium so far on his $37.1 billion notional index options, but the Black-Scholes model currently estimates a $10 billion liability, so currently he has a $5.1 billion loss on a generally accepted accounting principles basis. However, on a fundamental basis, as he says, "It's only the price on the final day that counts." …. “
http://news.morningstar.com/articlenet/article.aspx?id=285699
His firm received $4.9 billion from sale of Long-Dated O-T-C Index Put Options
Warren Buffett – Investments That Generate Cash Flow
3
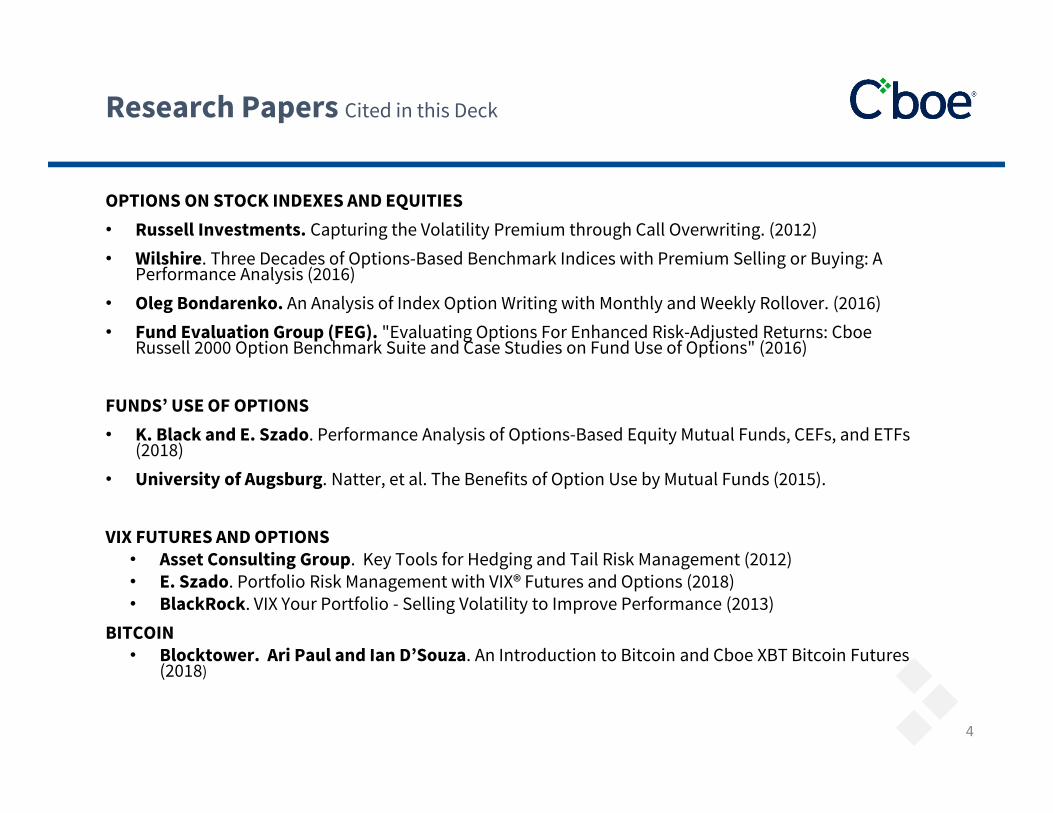
OPTIONS ON STOCK INDEXES AND EQUITIES• Russell Investments. Capturing the Volatility Premium through Call Overwriting. (2012) • Wilshire. Three Decades of Options-Based Benchmark Indices with Premium Selling or Buying: A
Performance Analysis (2016)• Oleg Bondarenko. An Analysis of Index Option Writing with Monthly and Weekly Rollover. (2016)• Fund Evaluation Group (FEG). "Evaluating Options For Enhanced Risk-Adjusted Returns: Cboe
Russell 2000 Option Benchmark Suite and Case Studies on Fund Use of Options" (2016)
FUNDS’ USE OF OPTIONS• K. Black and E. Szado. Performance Analysis of Options-Based Equity Mutual Funds, CEFs, and ETFs
(2018)• University of Augsburg. Natter, et al. The Benefits of Option Use by Mutual Funds (2015).
VIX FUTURES AND OPTIONS• Asset Consulting Group. Key Tools for Hedging and Tail Risk Management (2012)• E. Szado. Portfolio Risk Management with VIX® Futures and Options (2018) • BlackRock. VIX Your Portfolio - Selling Volatility to Improve Performance (2013)
BITCOIN• Blocktower. Ari Paul and Ian D’Souza. An Introduction to Bitcoin and Cboe XBT Bitcoin Futures
(2018)
Research Papers Cited in this Deck
4
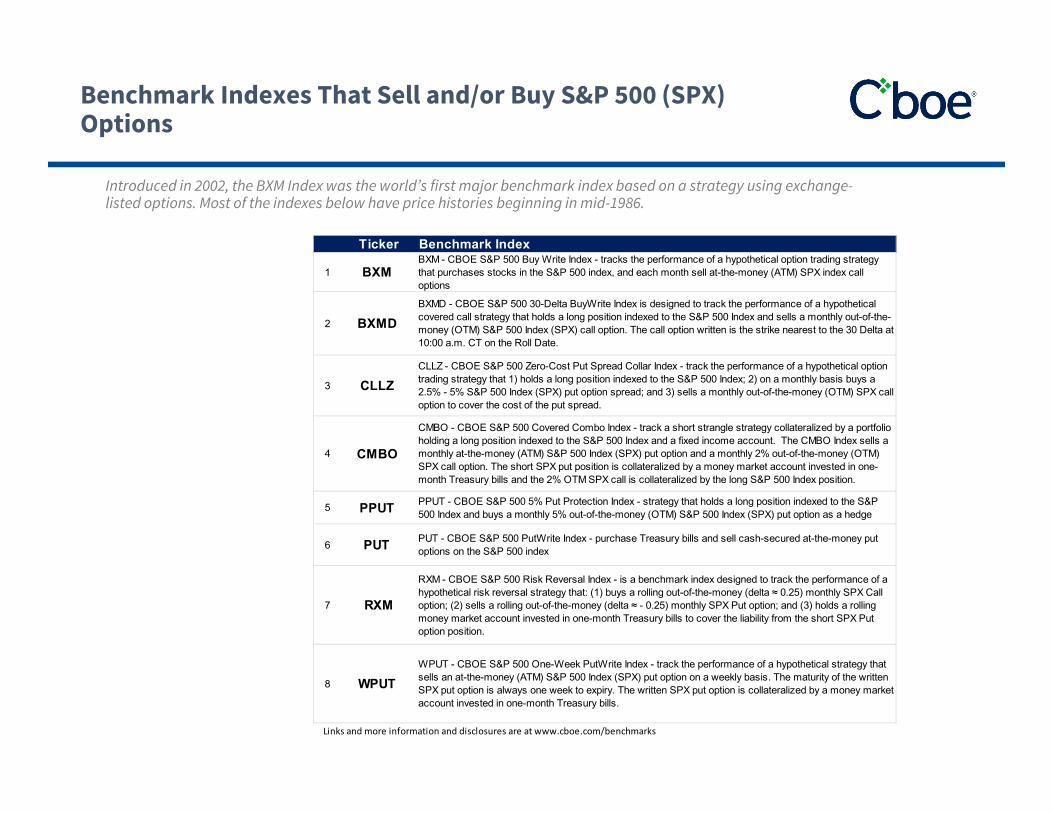
Introduced in 2002, the BXM Index was the world’s first major benchmark index based on a strategy using exchange-listed options. Most of the indexes below have price histories beginning in mid-1986.
Benchmark Indexes That Sell and/or Buy S&P 500 (SPX) Options
Ticker Benchmark Index
1 BXM BXM - CBOE S&P 500 Buy Write Index - tracks the performance of a hypothetical option trading strategy that purchases stocks in the S&P 500 index, and each month sell at-the-money (ATM) SPX index call options
2 BXMD BXMD - CBOE S&P 500 30-Delta BuyWrite Index is designed to track the performance of a hypothetical covered call strategy that holds a long position indexed to the S&P 500 Index and sells a monthly out-of-the-money (OTM) S&P 500 Index (SPX) call option. The call option written is the strike nearest to the 30 Delta at 10:00 a.m. CT on the Roll Date.
3 CLLZ CLLZ - CBOE S&P 500 Zero-Cost Put Spread Collar Index - track the performance of a hypothetical option trading strategy that 1) holds a long position indexed to the S&P 500 Index; 2) on a monthly basis buys a 2.5% - 5% S&P 500 Index (SPX) put option spread; and 3) sells a monthly out-of-the-money (OTM) SPX call option to cover the cost of the put spread.
4 CMBO
CMBO - CBOE S&P 500 Covered Combo Index - track a short strangle strategy collateralized by a portfolio holding a long position indexed to the S&P 500 Index and a fixed income account. The CMBO Index sells a monthly at-the-money (ATM) S&P 500 Index (SPX) put option and a monthly 2% out-of-the-money (OTM) SPX call option. The short SPX put position is collateralized by a money market account invested in one-month Treasury bills and the 2% OTM SPX call is collateralized by the long S&P 500 Index position.
5 PPUT PPUT - CBOE S&P 500 5% Put Protection Index - strategy that holds a long position indexed to the S&P 500 Index and buys a monthly 5% out-of-the-money (OTM) S&P 500 Index (SPX) put option as a hedge
6 PUT PUT - CBOE S&P 500 PutWrite Index - purchase Treasury bills and sell cash-secured at-the-money put options on the S&P 500 index
7 RXM
RXM - CBOE S&P 500 Risk Reversal Index - is a benchmark index designed to track the performance of a hypothetical risk reversal strategy that: (1) buys a rolling out-of-the-money (delta ≈ 0.25) monthly SPX Call option; (2) sells a rolling out-of-the-money (delta ≈ - 0.25) monthly SPX Put option; and (3) holds a rolling money market account invested in one-month Treasury bills to cover the liability from the short SPX Put option position.
8 WPUT WPUT - CBOE S&P 500 One-Week PutWrite Index - track the performance of a hypothetical strategy that sells an at-the-money (ATM) S&P 500 Index (SPX) put option on a weekly basis. The maturity of the written SPX put option is always one week to expiry. The written SPX put option is collateralized by a money market account invested in one-month Treasury bills.
Links and more information and disclosures are at www.cboe.com/benchmarks

Benchmarks Since Mid-1986
The 3 option-selling indexes (BXMD, PUT, and BXM) had higher returns than the PPUT option-buying index
6
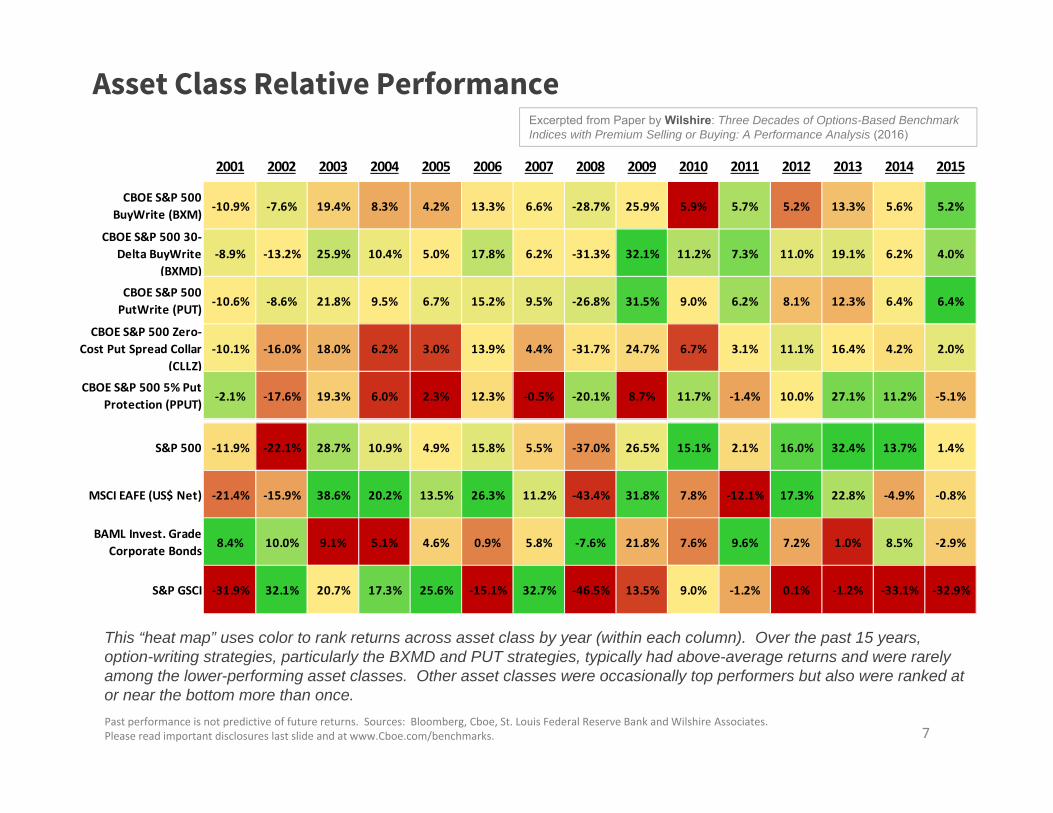
Asset Class Relative Performance
This “heat map” uses color to rank returns across asset class by year (within each column). Over the past 15 years, option-writing strategies, particularly the BXMD and PUT strategies, typically had above-average returns and were rarely among the lower-performing asset classes. Other asset classes were occasionally top performers but also were ranked at or near the bottom more than once.Past performance is not predictive of future returns. Sources: Bloomberg, Cboe, St. Louis Federal Reserve Bank and Wilshire Associates. Please read important disclosures last slide and at www.Cboe.com/benchmarks.
2001 2002 2003 2004 2005 2006 2007 2008 2009 2010 2011 2012 2013 2014 2015
CBOE S&P 500 BuyWrite (BXM) ‐10.9% ‐7.6% 19.4% 8.3% 4.2% 13.3% 6.6% ‐28.7% 25.9% 5.9% 5.7% 5.2% 13.3% 5.6% 5.2%
CBOE S&P 500 30‐Delta BuyWrite
(BXMD)‐8.9% ‐13.2% 25.9% 10.4% 5.0% 17.8% 6.2% ‐31.3% 32.1% 11.2% 7.3% 11.0% 19.1% 6.2% 4.0%
CBOE S&P 500 PutWrite (PUT) ‐10.6% ‐8.6% 21.8% 9.5% 6.7% 15.2% 9.5% ‐26.8% 31.5% 9.0% 6.2% 8.1% 12.3% 6.4% 6.4%
CBOE S&P 500 Zero‐Cost Put Spread Collar
(CLLZ)‐10.1% ‐16.0% 18.0% 6.2% 3.0% 13.9% 4.4% ‐31.7% 24.7% 6.7% 3.1% 11.1% 16.4% 4.2% 2.0%
CBOE S&P 500 5% Put Protection (PPUT) ‐2.1% ‐17.6% 19.3% 6.0% 2.3% 12.3% ‐0.5% ‐20.1% 8.7% 11.7% ‐1.4% 10.0% 27.1% 11.2% ‐5.1%
S&P 500 ‐11.9% ‐22.1% 28.7% 10.9% 4.9% 15.8% 5.5% ‐37.0% 26.5% 15.1% 2.1% 16.0% 32.4% 13.7% 1.4%
MSCI EAFE (US$ Net) ‐21.4% ‐15.9% 38.6% 20.2% 13.5% 26.3% 11.2% ‐43.4% 31.8% 7.8% ‐12.1% 17.3% 22.8% ‐4.9% ‐0.8%
BAML Invest. Grade Corporate Bonds 8.4% 10.0% 9.1% 5.1% 4.6% 0.9% 5.8% ‐7.6% 21.8% 7.6% 9.6% 7.2% 1.0% 8.5% ‐2.9%
S&P GSCI ‐31.9% 32.1% 20.7% 17.3% 25.6% ‐15.1% 32.7% ‐46.5% 13.5% 9.0% ‐1.2% 0.1% ‐1.2% ‐33.1% ‐32.9%
Excerpted from Paper by Wilshire: Three Decades of Options-Based Benchmark Indices with Premium Selling or Buying: A Performance Analysis (2016)
7

Less Severe Drawdowns for Indexes That Do Put Writing
Excerpted from 2016 paper by Prof. Oleg Bondarenko
The S&P 500 had more severe drawdowns than the PUT & WPUT indices(which engage incash-securedput-writing)
Past performance is not predictive of future returns. Please read disclosures in the last slide. 8

Returns and Volatility Since Mid-1986 10 benchmark indexes
PUT Index is in the top 3 on both charts
Past results are not predictive of future performance. See the last slide for important disclosures.9
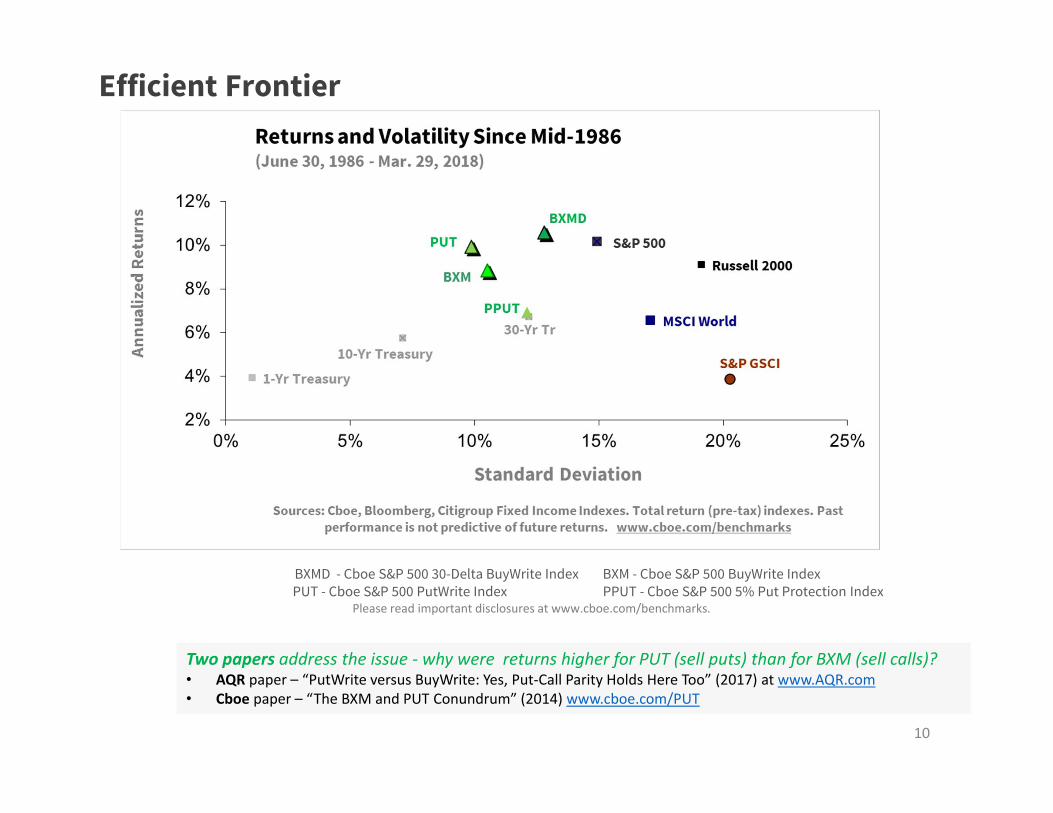
Efficient Frontier
BXMD - Cboe S&P 500 30-Delta BuyWrite Index BXM - Cboe S&P 500 BuyWrite Index PUT - Cboe S&P 500 PutWrite Index PPUT - Cboe S&P 500 5% Put Protection Index
Please read important disclosures at www.cboe.com/benchmarks.
10
Two papers address the issue ‐ why were returns higher for PUT (sell puts) than for BXM (sell calls)?• AQR paper – “PutWrite versus BuyWrite: Yes, Put‐Call Parity Holds Here Too” (2017) at www.AQR.com• Cboe paper – “The BXM and PUT Conundrum” (2014) www.cboe.com/PUT
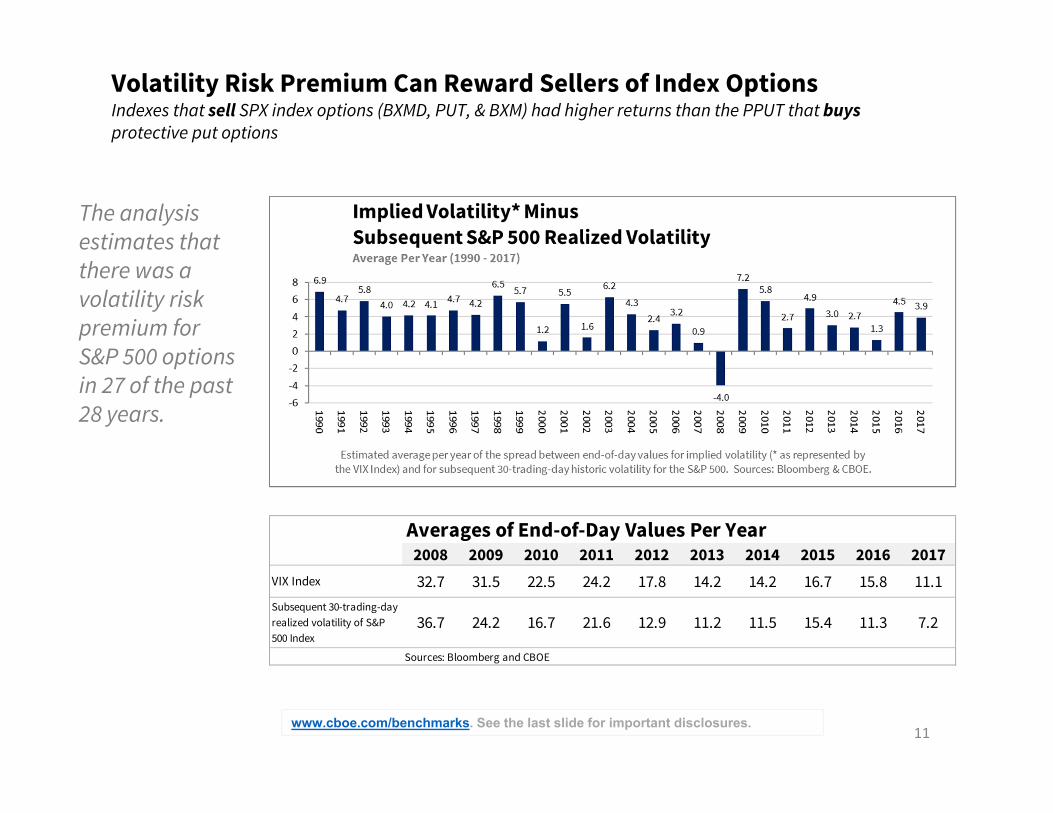
Volatility Risk Premium Can Reward Sellers of Index OptionsIndexes that sell SPX index options (BXMD, PUT, & BXM) had higher returns than the PPUT that buysprotective put options
www.cboe.com/benchmarks. See the last slide for important disclosures. 11
Averages of End-of-Day Values Per Year2008 2009 2010 2011 2012 2013 2014 2015 2016 2017
VIX Index 32.7 31.5 22.5 24.2 17.8 14.2 14.2 16.7 15.8 11.1Subsequent 30-trading-day realized volatility of S&P 500 Index
36.7 24.2 16.7 21.6 12.9 11.2 11.5 15.4 11.3 7.2
Sources: Bloomberg and CBOE
The analysis estimates that there was a volatility risk premium for S&P 500 options in 27 of the past 28 years.

BXM Gross Premiums and VIX Index
Avg. monthly gross premium generated was 1.7% for BXM Index
BXM Index fell in 2001, 2002, and 2008
Note the relationship between gross premiums (top chart) and VIX Index level

Aggregate Gross Premiums
Past performance is not predictive of future returns. Please read the last slide for disclosures.
Excerpted from 2016 paper by Prof. Oleg Bondarenko
13
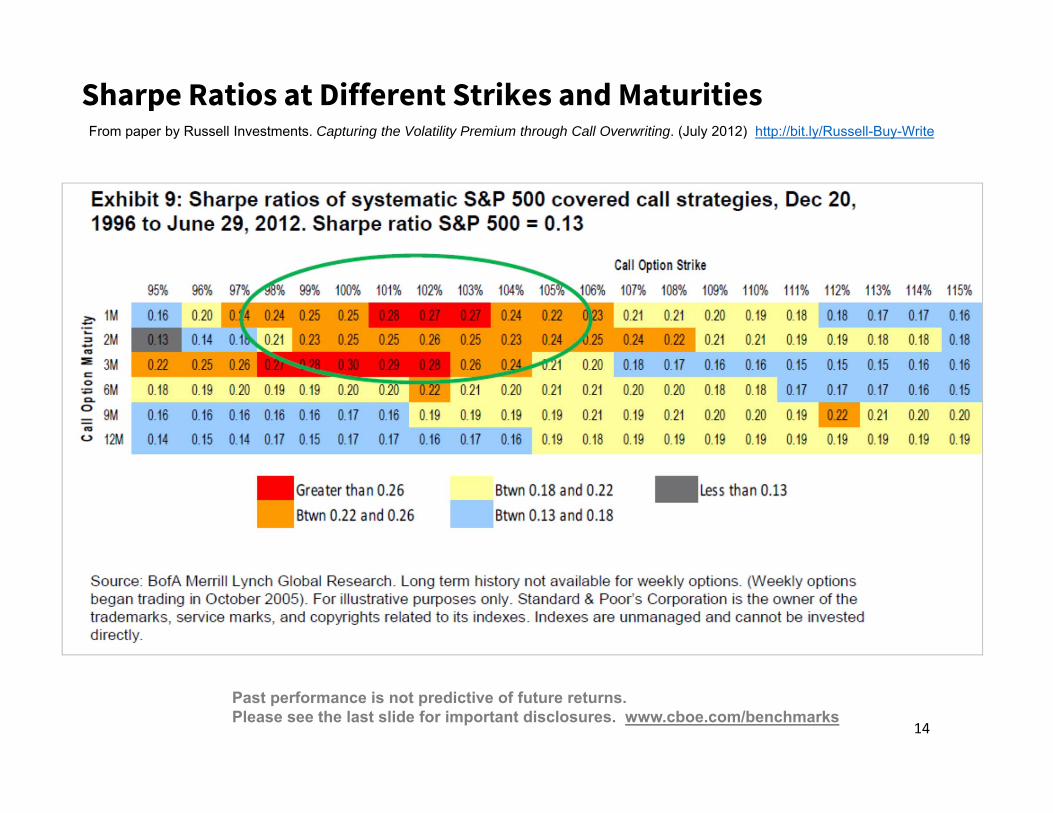
Sharpe Ratios at Different Strikes and MaturitiesFrom paper by Russell Investments. Capturing the Volatility Premium through Call Overwriting. (July 2012) http://bit.ly/Russell-Buy-Write
Past performance is not predictive of future returns. Please see the last slide for important disclosures. www.cboe.com/benchmarks
14
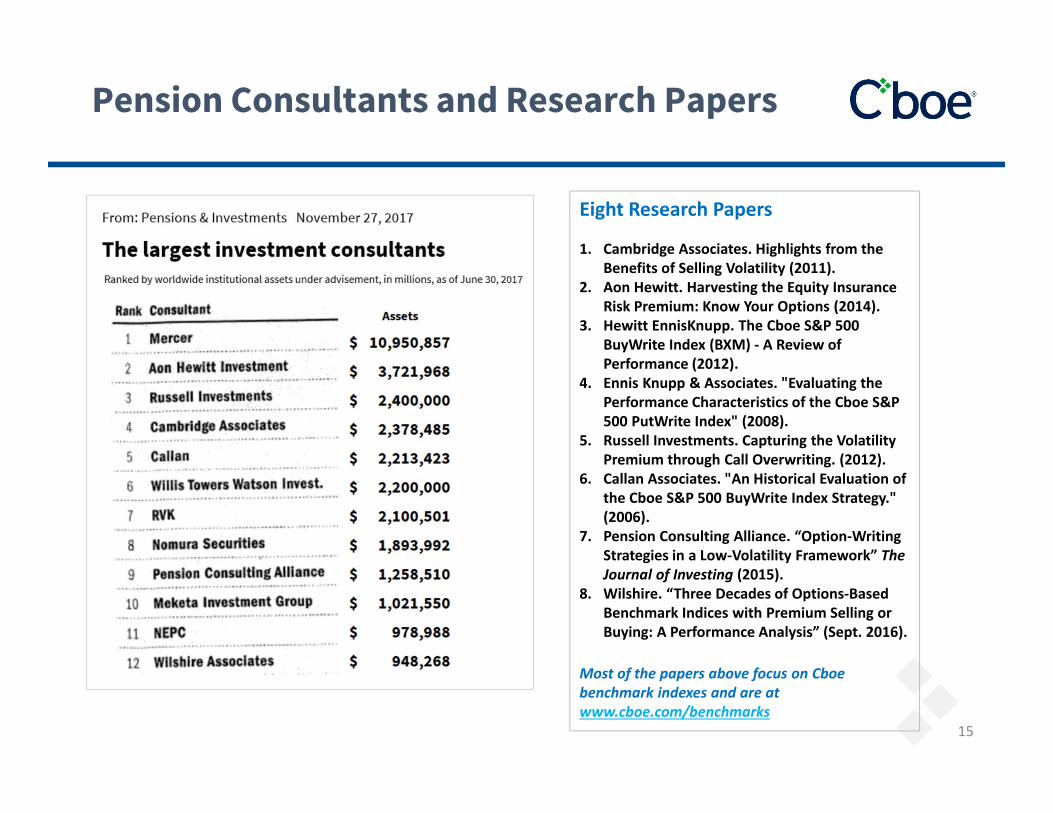
Pension Consultants and Research Papers
15
Eight Research Papers
1. Cambridge Associates. Highlights from the Benefits of Selling Volatility (2011).
2. Aon Hewitt. Harvesting the Equity Insurance Risk Premium: Know Your Options (2014).
3. Hewitt EnnisKnupp. The Cboe S&P 500 BuyWrite Index (BXM) ‐ A Review of Performance (2012).
4. Ennis Knupp & Associates. "Evaluating the Performance Characteristics of the Cboe S&P 500 PutWrite Index" (2008).
5. Russell Investments. Capturing the Volatility Premium through Call Overwriting. (2012).
6. Callan Associates. "An Historical Evaluation of the Cboe S&P 500 BuyWrite Index Strategy." (2006).
7. Pension Consulting Alliance. “Option‐Writing Strategies in a Low‐Volatility Framework” The Journal of Investing (2015).
8. Wilshire. “Three Decades of Options‐Based Benchmark Indices with Premium Selling or Buying: A Performance Analysis” (Sept. 2016).
Most of the papers above focus on Cboe benchmark indexes and are at www.cboe.com/benchmarks

In July 2013 CalSTRS (California State Teachers Retirement System, with $140 billion in AUM) issued a request to investment managers for -- "Risk-Managed Equity - Low Volatility Equity and Covered Call Strategies. … CalSTRS will consider both active and passive covered call strategies benchmarked to the Cboe S&P 500 BuyWrite Index (BXM).”
“CalSTRS Putting in Place Low Vol Covered Call Program”, EQ Deriv., March 25, 2015.
In addition, The Santa Barbara County Employees Retirement System, the Hawaii Employees Retirement System, the Los Angeles Department of Water and Power Employees Retirement Plan, the Seattle City Employee Retirement System and the Alaska Retirement Management Board are all in various stages of adopting buy-write strategies benchmarked against [Cboe's] BXM index. In 2016 Hawaii Employees Retirement System made another allocation to option writing.
Large public pension funds in Texas, Wisconsin and Canada also are reported to use options-based strategies.
North American Pension Funds and Use of Options
16

Univ. of Augsburg – Paper on The Benefits of Option Use by Mutual Funds (2015)
• Use of options by mutual funds yields higher risk‐adjusted performance compared with nonuser funds.
• Option user funds show significantly lower systematic risk because they use options mainly for hedging strategies and not for speculation.
• We base our analysis on a large, comprehensive and previously unused sample of the SEC’s mandatory N‐SAR filings.
• Consistent with covered call strategies for income generation, we show that mutual funds’ short positions are the main drivers of the performance‐enhancing effect.
• On the other hand, consistent with protective put strategies for hedging, long option positions are the predominant contributors to the risk‐reducing effect of options.
• Authors ‐ Markus Natter, Martin Rohleder, Dominik Schulte, and Marco Wilkens
http://bit.ly/Augs‐MutFd‐Opt Past performance is not predictive of future returns. Please see the last slide for important disclosures.
17

Options‐Based FundsFrom: 2018 paper by Keith Black and Ed Szado
10 12 15 1624
4857
7077 76
8698
109
126136
142149
157
0
50
100
150
200
250
Dec‐00 Dec‐01 Dec‐02 Dec‐03 Dec‐04 Dec‐05 Dec‐06 Dec‐07 Dec‐08 Dec‐09 Dec‐10 Dec‐11 Dec‐12 Dec‐13 Dec‐14 Dec‐15 Dec‐16 Dec‐17
Num
ber o
f Option‐Ba
sed Eq
uity Fun
ds
US Equity Mutual Funds US Equity Closed‐End Funds US Equity Exchange‐Traded Funds Other Options‐Based Funds
From: 2018 paper by Keith Black and Ed Szado. www.cboe.com/funds
Growth in the number of option‐based equity funds in sample
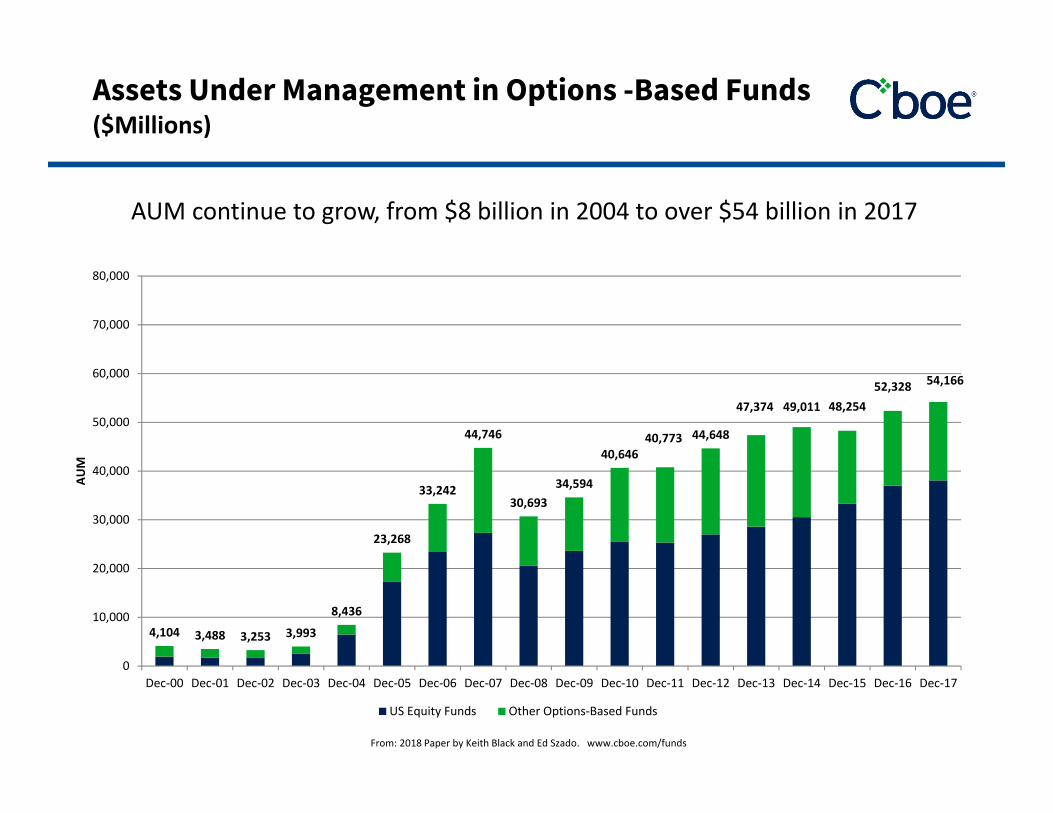
Assets Under Management in Options -Based Funds ($Millions)
4,104 3,488 3,253 3,993
8,436
23,268
33,242
44,746
30,69334,594
40,64640,773 44,648
47,374 49,011 48,25452,328 54,166
0
10,000
20,000
30,000
40,000
50,000
60,000
70,000
80,000
Dec‐00 Dec‐01 Dec‐02 Dec‐03 Dec‐04 Dec‐05 Dec‐06 Dec‐07 Dec‐08 Dec‐09 Dec‐10 Dec‐11 Dec‐12 Dec‐13 Dec‐14 Dec‐15 Dec‐16 Dec‐17
AUM
US Equity Funds Other Options‐Based Funds
From: 2018 Paper by Keith Black and Ed Szado. www.cboe.com/funds
AUM continue to grow, from $8 billion in 2004 to over $54 billion in 2017

Maximum Drawdowns – Option-Based Funds and Benchmark Indices (Dec. 31, 1999 - Dec. 29, 2017)
From: Black and Szado "Performance Analysis of Option-Based Equity Mutual Funds, CEFs, and ETFs: An Update” (January 2018) Please see the last slide for important disclosures.

Annualized Standard Deviation – Option-Based Funds and Benchmark Indices (Dec. 31, 1999-Dec. 29, 2017)
From: Black and Szado "Performance Analysis of Option-Based Equity Mutual Funds, CEFs, and ETFs: An Update” (January 2018) Please see the last slide for important disclosures.
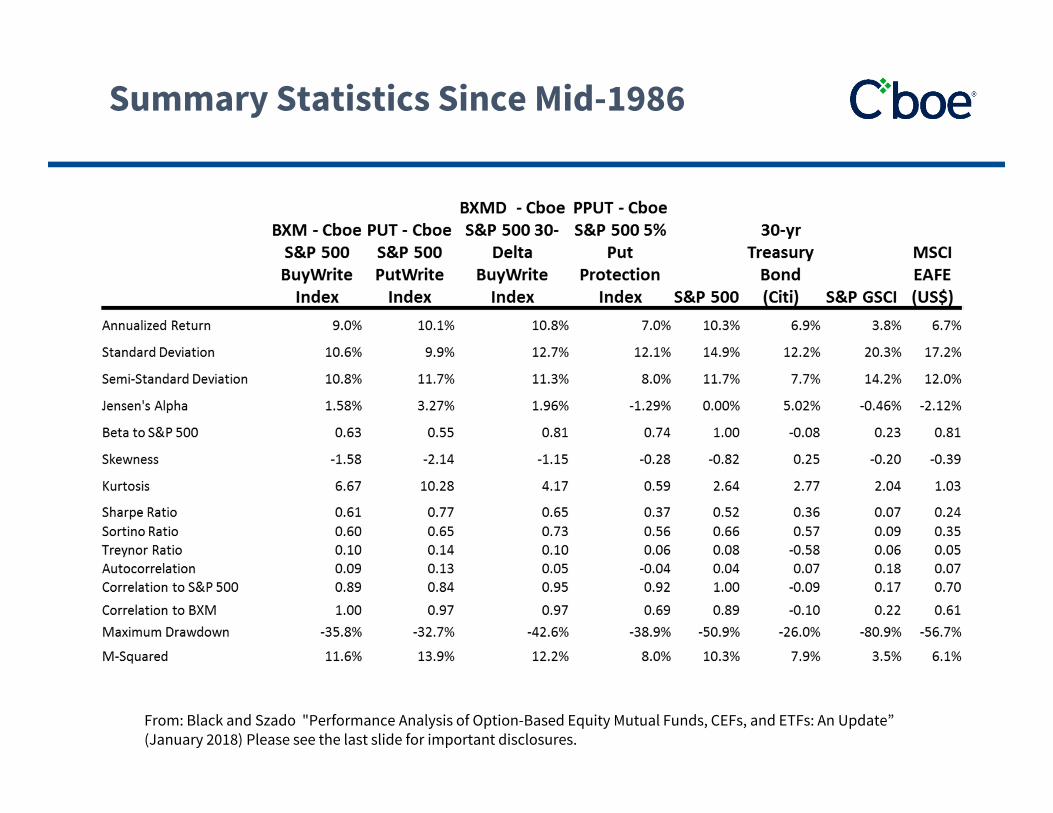
Summary Statistics Since Mid-1986
From: Black and Szado "Performance Analysis of Option-Based Equity Mutual Funds, CEFs, and ETFs: An Update” (January 2018) Please see the last slide for important disclosures.

Notional Value and Capacity
$13 $12 $12 $14 $22 $34
$54
$93 $86 $58
$79 $99 $96
$135
$172 $190
$215
$287
2000 2001 2002 2003 2004 2005 2006 2007 2008 2009 2010 2011 2012 2013 2014 2015 2016 2017
Notional Value of Avg. Daily Volumefor SPX Options at Cboe (in $billions)
Grew to more than $280 billion in 2017
From: 2018 paper Keith Black and Ed Szado. www.cboe.com/funds
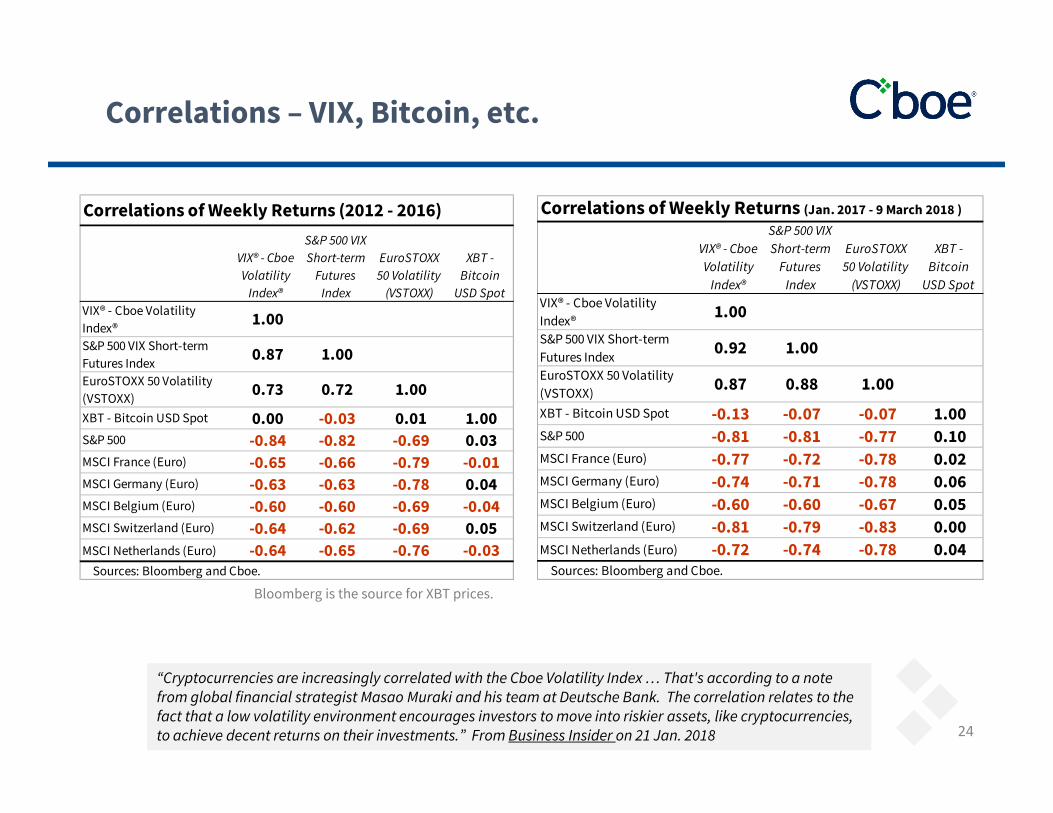
Correlations – VIX, Bitcoin, etc.
24
Correlations of Weekly Returns (2012 - 2016)
VIX® - Cboe Volatility
Index®
S&P 500 VIX Short-term
Futures Index
EuroSTOXX 50 Volatility
(VSTOXX)
XBT - Bitcoin
USD SpotVIX® - Cboe Volatility Index® 1.00S&P 500 VIX Short-term Futures Index 0.87 1.00EuroSTOXX 50 Volatility (VSTOXX) 0.73 0.72 1.00XBT - Bitcoin USD Spot 0.00 -0.03 0.01 1.00S&P 500 -0.84 -0.82 -0.69 0.03MSCI France (Euro) -0.65 -0.66 -0.79 -0.01MSCI Germany (Euro) -0.63 -0.63 -0.78 0.04MSCI Belgium (Euro) -0.60 -0.60 -0.69 -0.04MSCI Switzerland (Euro) -0.64 -0.62 -0.69 0.05MSCI Netherlands (Euro) -0.64 -0.65 -0.76 -0.03 Sources: Bloomberg and Cboe.
Correlations of Weekly Returns (Jan. 2017 - 9 March 2018 )
VIX® - Cboe Volatility
Index®
S&P 500 VIX Short-term
Futures Index
EuroSTOXX 50 Volatility
(VSTOXX)
XBT - Bitcoin
USD SpotVIX® - Cboe Volatility Index® 1.00S&P 500 VIX Short-term Futures Index 0.92 1.00EuroSTOXX 50 Volatility (VSTOXX) 0.87 0.88 1.00XBT - Bitcoin USD Spot -0.13 -0.07 -0.07 1.00S&P 500 -0.81 -0.81 -0.77 0.10MSCI France (Euro) -0.77 -0.72 -0.78 0.02MSCI Germany (Euro) -0.74 -0.71 -0.78 0.06MSCI Belgium (Euro) -0.60 -0.60 -0.67 0.05MSCI Switzerland (Euro) -0.81 -0.79 -0.83 0.00MSCI Netherlands (Euro) -0.72 -0.74 -0.78 0.04 Sources: Bloomberg and Cboe.
“Cryptocurrencies are increasingly correlated with the Cboe Volatility Index … That's according to a note from global financial strategist Masao Muraki and his team at Deutsche Bank. The correlation relates to the fact that a low volatility environment encourages investors to move into riskier assets, like cryptocurrencies, to achieve decent returns on their investments.” From Business Insider on 21 Jan. 2018
Bloomberg is the source for XBT prices.

Volatility Over the Past 27 Months
25
The avg. historic volatility for the S&P 500 Index in 2017 was a very low 6.7.
At May 2017 CFA Annual Conference, Richard Thaler –low level of VIX is a big mystery
The BPVIX Index rose to 29.1 just before Brexit.
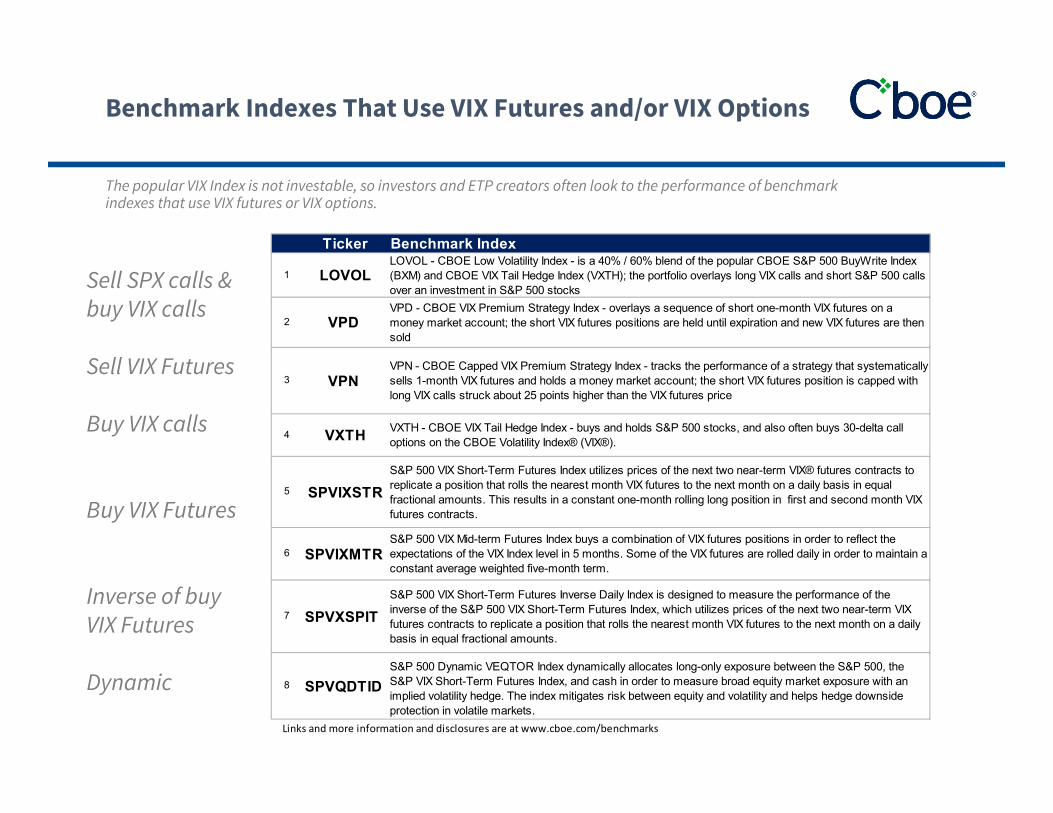
The popular VIX Index is not investable, so investors and ETP creators often look to the performance of benchmark indexes that use VIX futures or VIX options.
Benchmark Indexes That Use VIX Futures and/or VIX Options
Ticker Benchmark Index
1 LOVOLLOVOL - CBOE Low Volatility Index - is a 40% / 60% blend of the popular CBOE S&P 500 BuyWrite Index (BXM) and CBOE VIX Tail Hedge Index (VXTH); the portfolio overlays long VIX calls and short S&P 500 calls over an investment in S&P 500 stocks
2 VPD VPD - CBOE VIX Premium Strategy Index - overlays a sequence of short one-month VIX futures on a money market account; the short VIX futures positions are held until expiration and new VIX futures are then sold
3 VPN VPN - CBOE Capped VIX Premium Strategy Index - tracks the performance of a strategy that systematically sells 1-month VIX futures and holds a money market account; the short VIX futures position is capped with long VIX calls struck about 25 points higher than the VIX futures price
4 VXTH VXTH - CBOE VIX Tail Hedge Index - buys and holds S&P 500 stocks, and also often buys 30-delta call options on the CBOE Volatility Index® (VIX®).
5 SPVIXSTRS&P 500 VIX Short-Term Futures Index utilizes prices of the next two near-term VIX® futures contracts to replicate a position that rolls the nearest month VIX futures to the next month on a daily basis in equal fractional amounts. This results in a constant one-month rolling long position in first and second month VIX futures contracts.
6 SPVIXMTR S&P 500 VIX Mid-term Futures Index buys a combination of VIX futures positions in order to reflect the expectations of the VIX Index level in 5 months. Some of the VIX futures are rolled daily in order to maintain a constant average weighted five-month term.
7 SPVXSPITS&P 500 VIX Short-Term Futures Inverse Daily Index is designed to measure the performance of the inverse of the S&P 500 VIX Short-Term Futures Index, which utilizes prices of the next two near-term VIX futures contracts to replicate a position that rolls the nearest month VIX futures to the next month on a daily basis in equal fractional amounts.
8 SPVQDTIDS&P 500 Dynamic VEQTOR Index dynamically allocates long-only exposure between the S&P 500, the S&P VIX Short-Term Futures Index, and cash in order to measure broad equity market exposure with an implied volatility hedge. The index mitigates risk between equity and volatility and helps hedge downside protection in volatile markets.
Links and more information and disclosures are at www.cboe.com/benchmarks
Sell SPX calls & buy VIX calls
Sell VIX Futures
Buy VIX calls
Buy VIX Futures
Inverse of buy VIX Futures
Dynamic
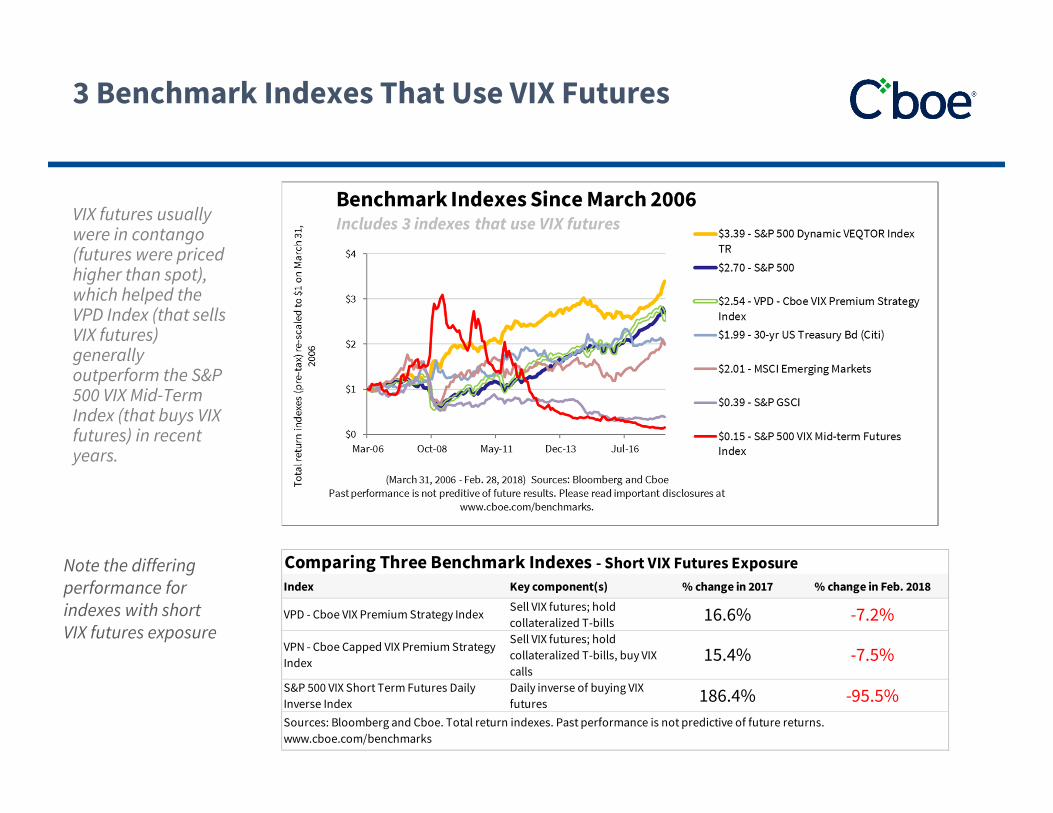
VIX futures usually were in contango (futures were priced higher than spot), which helped the VPD Index (that sells VIX futures) generally outperform the S&P 500 VIX Mid-Term Index (that buys VIX futures) in recent years.
3 Benchmark Indexes That Use VIX Futures
Note the differing performance for indexes with short VIX futures exposure
Comparing Three Benchmark Indexes - Short VIX Futures ExposureIndex Key component(s) % change in 2017 % change in Feb. 2018
VPD - Cboe VIX Premium Strategy Index Sell VIX futures; hold collateralized T-bills 16.6% -7.2%
VPN - Cboe Capped VIX Premium Strategy Index
Sell VIX futures; hold collateralized T-bills, buy VIX calls
15.4% -7.5%
S&P 500 VIX Short Term Futures Daily Inverse Index
Daily inverse of buying VIX futures 186.4% -95.5%
Sources: Bloomberg and Cboe. Total return indexes. Past performance is not predictive of future returns. www.cboe.com/benchmarks

The VXTH, VPN and LOVOL indexes all buy VIX call options that may be used with the goal of lessening downside volatility.
Investors should be aware that the costs for buying options premiums can add up.
3 Benchmark Indexes That Buy VIX Call Options
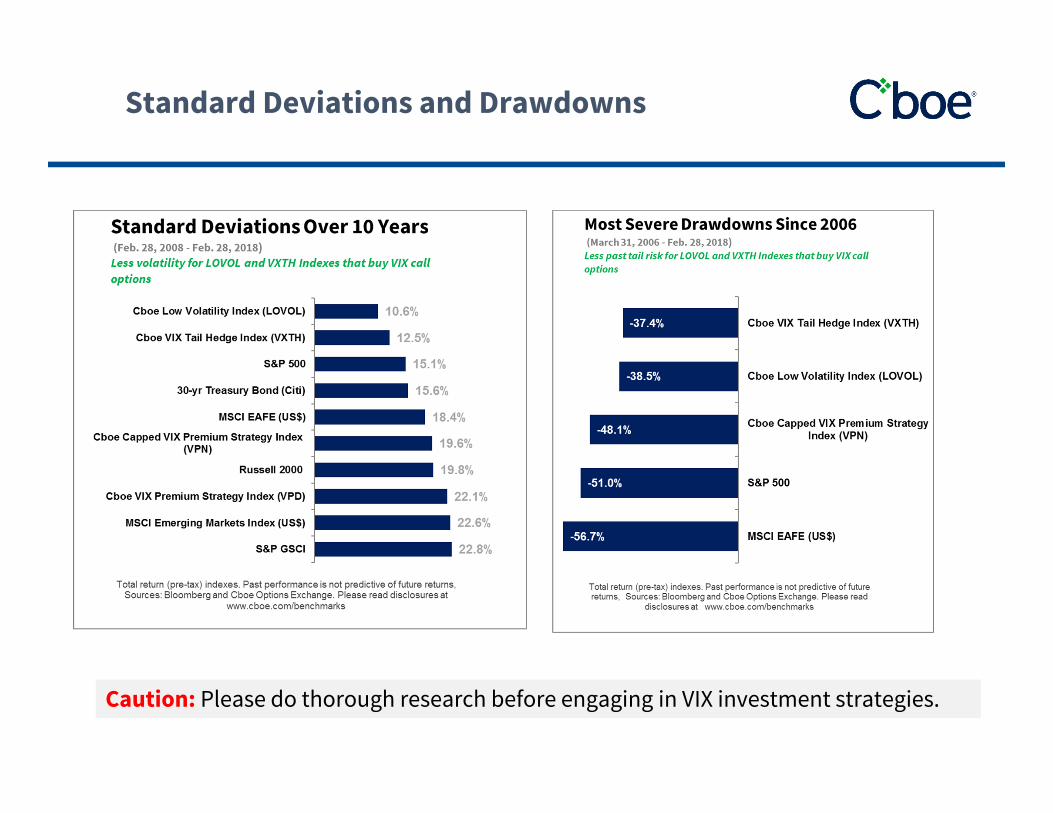
Standard Deviations and Drawdowns
Caution: Please do thorough research before engaging in VIX investment strategies.

Study on VXTH Index
From paper by Asset Consulting Group. Key Tools for Hedging and Tail Risk Management (2012)
The VXTH Index (which buys VIX calls) had strong relative performance during the period studied.
Past performance is not predictive of future returns. Please see the last slide for important disclosures.

60/40 Portfolio in 2016 with Inverse VIX® Futures and Written VIX CallsFrom: 2018 paper by Ed Szado
31
Exhibit 11: This exhibit illustrates the 2016 performance of a traditional 60/40 portfolio with and without a small allocation to inverse VIX futures or written VIX call options. In this period of low volatility and generally positive market returns, a small allocation to VIX call writing can significantly increase returns with a moderate increase in volatility. A 5% allocation to inverse VIX futures has a smaller impact but also provides a meaningful increase in return with a small increase in volatility and drawdowns.
201660/40 Stock/Bond
Portfolio60/40 Plus 5% 1 Mo. Inverse VIX Futures
60/40 Plus 5% 3 Mo. Inverse VIX Futures
Held 1 Mo.
60/40 Plus 1% Written 25% OTM
VIX Calls
60/40 Plus 1% Written ATM VIX
CallsAnnual Return 8.4% 14.3% 10.4% 18.9% 14.7%Ann Std Dev 7.6% 11.0% 9.1% 11.0% 11.3%Sharpe Ratio 1.11 1.30 1.14 1.72 1.30
MaxDD ‐5.4% ‐6.9% ‐6.1% ‐6.0% ‐7.8%Skew ‐0.29 ‐0.96 ‐0.51 ‐0.59 ‐0.70Kurt 2.23 5.22 3.52 3.89 3.71
Source: Bloomberg, CFE, Cboe Options Exchange, Optionmetrics
Past performance is not predictive of future returns. Please see the last slide for important disclosures.

Short Volatility Strategies
From paper by BlackRock. VIX Your Portfolio - Selling Volatility to Improve Performance (2013). The fact that certain short volatility strategies are collateralized with T-bills can help lessen tail risk. Please see last slide for important disclaimers.
Past performance is not predictive of future returns. Please see the last slide for important disclosures.

NY Times on Oct. 1, 2017 - What Is Bitcoin, and How Does It Work? A Bitcoin is a digital token — with no physical backing — that can be sent electronically from one user to another, anywhere in the world. Unlike traditional payment networks like Visa, the Bitcoin network is not run by a single company or person. The system is run by a decentralized network of computers around the world that keep track of all Bitcoin transactions, similar to the way Wikipedia ismaintained by a decentralized network of writers and editors.
Bloomberg on Jan. 24, 2018 - A Look at Who Owns Bitcoin (Young Men), and Why (Lack of Trust) Nearly 60 percent of Americans have heard or read about the world’s largest cryptocurrency, according to a joint SurveyMonkey and Global Blockchain Business Council poll of more than 5,700 adults conducted in January. But only 5 percent of people actually own the digital coin. Those few Bitcoin investors are of a fairly consistent demographic. An overwhelming 71 percent of them are male. The majority -- 58 percent -- are young, between the ages of 18 and 34 years old. And unlike the broader U.S. population, nearly half of them are minorities. When asked why they bought the crypto asset, investors answered that a combination of a lack of trust and an opportunity for return are at play. About one-third of Bitcoin owners said it was a means to avoid government regulation -- 24 percent also said they trust Bitcoin more than the U.S. government in a separate question -- and about two in 10 saw it as a hedge against crashes in traditional assets. More than 60 percent also said that buying the digital coin was seen as a growth investment.
What is Bitcoin, Who Owns It and Why?
33
2018 Paper with Comparisons
Past performance is not predictive of future returns. Please see the last slide for important disclosures.

From: https://annual.cfainstitute.org/2018/01/29/cryptocurrency-derivatives-and-the-future-of-bitcoin/
“Last year saw a major change in the way that news outlets covered bitcoin and other cryptocurrencies. Though cryptocurrencies have generated outrageous headlines in the years since their initial introduction, 2017 marked a milestone in their transition from fringe investment to alternative asset. Bitcoin derivatives, which would make the investment accessible to a broader pool of potential investors, have been under discussion since 2013. But regulatory approval has been difficult to obtain.
Two exchanges in the United States, Cboe Global Markets and CME Group, received authorization and began listing bitcoin futures in December, and news outlets have been watching the settlements of those contracts closely to see what it could mean for bitcoin derivatives and for cryptocurrencies in general. Previously, government regulators paid little attention to cryptocurrencies. A 2014 survey conducted by the US Law Library of Congress found that “only a very few” countries had specific regulations that applied to bitcoin. Regulatory scrutiny has triggered volatile moves in cryptocurrency prices, which were already renowned for their extreme fluctuations.
The broader family of cryptoassets, which includes cryptocurrencies like bitcoin, has been developing in new and unexpected ways. An analysis of cryptoassets in 2017 found that bitcoin was outperformed by 13 other entries, among them Ethereum, a currency on a blockchain-based platform for applications, and Ripple, which is intended as a new payment system for banks.
Join us this May at the 71st CFA Institute Annual Conference in Hong Kong to learn more about cryptocurrencies and participate in the conversations that will guide and shape the future of global investing.”
CFA Institute –Cryptocurrency Derivatives and the Future of Bitcoin
34
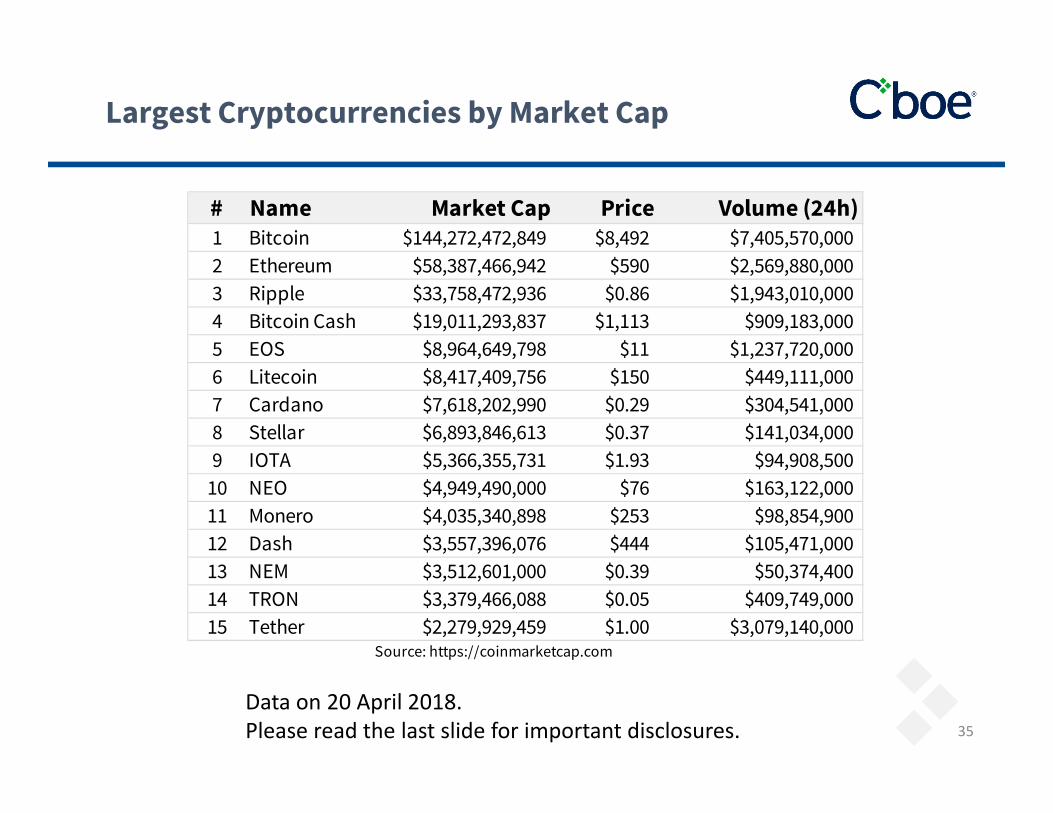
Largest Cryptocurrencies by Market Cap
35
Data on 20 April 2018.Please read the last slide for important disclosures.
# Name Market Cap Price Volume (24h)1 Bitcoin $144,272,472,849 $8,492 $7,405,570,0002 Ethereum $58,387,466,942 $590 $2,569,880,0003 Ripple $33,758,472,936 $0.86 $1,943,010,0004 Bitcoin Cash $19,011,293,837 $1,113 $909,183,0005 EOS $8,964,649,798 $11 $1,237,720,0006 Litecoin $8,417,409,756 $150 $449,111,0007 Cardano $7,618,202,990 $0.29 $304,541,0008 Stellar $6,893,846,613 $0.37 $141,034,0009 IOTA $5,366,355,731 $1.93 $94,908,500
10 NEO $4,949,490,000 $76 $163,122,00011 Monero $4,035,340,898 $253 $98,854,90012 Dash $3,557,396,076 $444 $105,471,00013 NEM $3,512,601,000 $0.39 $50,374,40014 TRON $3,379,466,088 $0.05 $409,749,00015 Tether $2,279,929,459 $1.00 $3,079,140,000
Source: https://coinmarketcap.com

Bitcoin and Other Assets Over 87 Months
36
Caution: Bitcoin experienced a significant drawdown in early 2018. Please read disclosures on last slide.
Past performance is not predictive of future returns. Please see the last slide for important disclosures.

Bitcoin Volatility
30 Day Realized Volatility: Bitcoin v VIX • Average 30 day realized volatility by year
Year Bitcoin VIX
Jan. 2018 126% 85%
2017 80% 106%
2016 40% 124%
2015 55% 136%
2014 87% 113%
2013 124% 109%
Source: Bloomberg Past performance is not predictive of future returns. Please see the last slide for important disclosures.
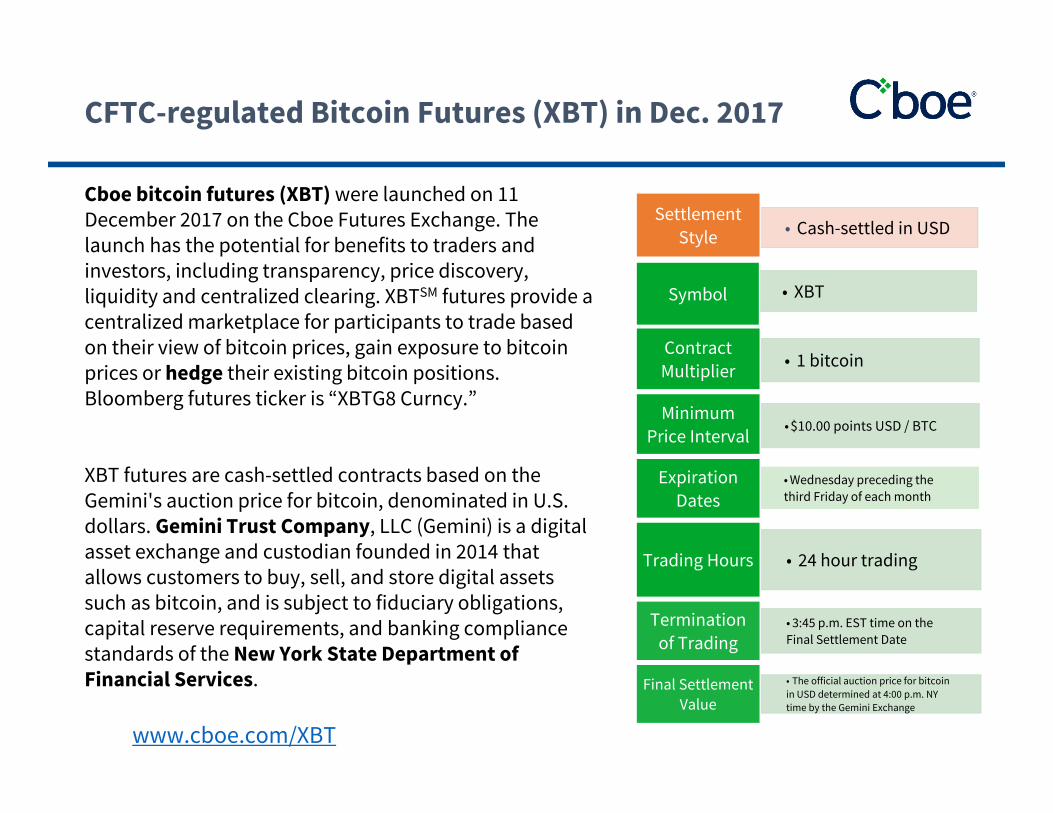
CFTC-regulated Bitcoin Futures (XBT) in Dec. 2017
• Cash-settled in USDSettlement
Style
• XBTSymbol
• 1 bitcoin Contract Multiplier
• $10.00 points USD / BTCMinimum
Price Interval
• Wednesday preceding the third Friday of each month
Expiration Dates
• 24 hour tradingTrading Hours
• 3:45 p.m. EST time on the Final Settlement Date
Termination of Trading
• The official auction price for bitcoin in USD determined at 4:00 p.m. NY time by the Gemini Exchange
Final Settlement Value
Cboe bitcoin futures (XBT) were launched on 11 December 2017 on the Cboe Futures Exchange. The launch has the potential for benefits to traders and investors, including transparency, price discovery, liquidity and centralized clearing. XBTSM futures provide a centralized marketplace for participants to trade based on their view of bitcoin prices, gain exposure to bitcoin prices or hedge their existing bitcoin positions. Bloomberg futures ticker is “XBTG8 Curncy.”
XBT futures are cash-settled contracts based on the Gemini's auction price for bitcoin, denominated in U.S. dollars. Gemini Trust Company, LLC (Gemini) is a digital asset exchange and custodian founded in 2014 that allows customers to buy, sell, and store digital assets such as bitcoin, and is subject to fiduciary obligations, capital reserve requirements, and banking compliance standards of the New York State Department of Financial Services.
www.cboe.com/XBT
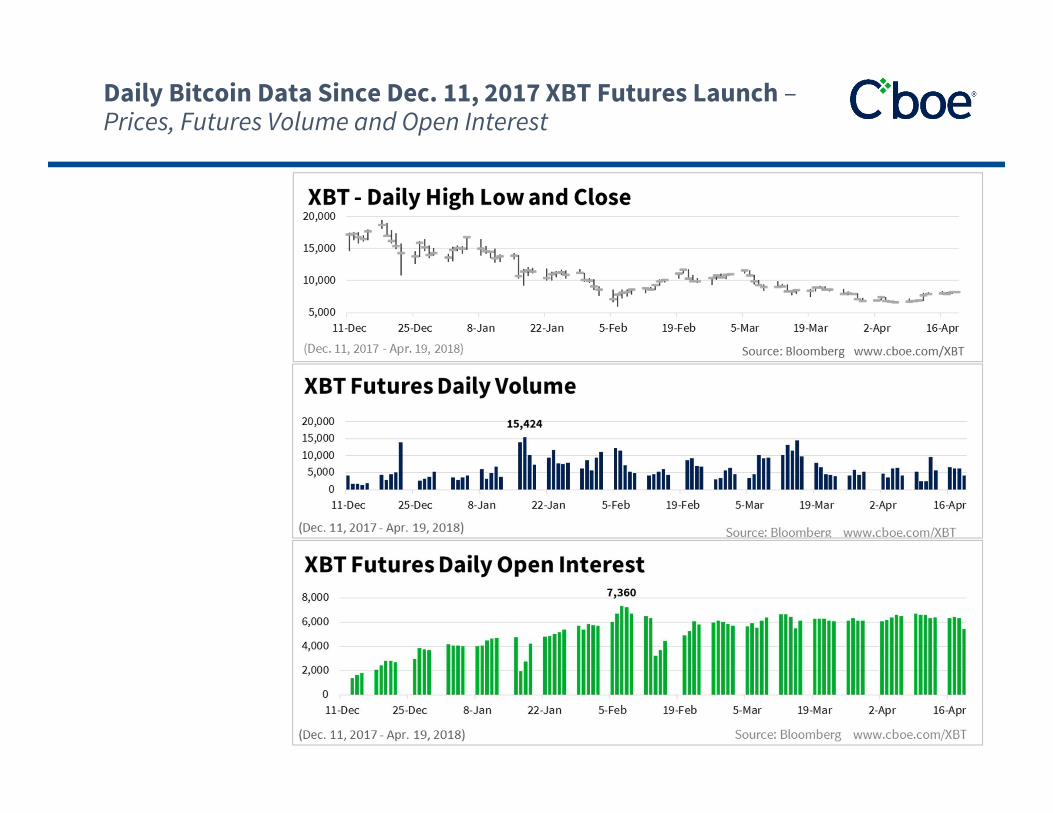
Daily Bitcoin Data Since Dec. 11, 2017 XBT Futures Launch –Prices, Futures Volume and Open Interest

Bitcoin – Spot and Futures

Blockchain and Institutional Investors
Lombard Odier Investment Managers (LOIM) has completed a bond deal using blockchain technology, in a transaction it claims is among the first of its kind.The manager participated in a $15m (€12.6m) issue of catastrophe bonds by a Guernsey-based subsidiary of insurance specialist Solidum Partners in August. Details of the transaction were recorded and communicated to deal participants via blockchain, a digital ledger technology that has risen to prominence in finance as the backbone of Bitcoin. The system allows participants near-instant access to secure, encrypted records of transactions that would otherwise be handled manually and take several days to complete. These records can be shared with regulators if needed. Simon Vuille, a portfolio manager in LOIM’s insurance-linked strategies team, said the technology had “markedly lowered the transaction costs relative to other settlement methods where costs are prohibitive for transactions of this size”. (From IPE on 9 January 2018).
Fund manager Vanguard plans to use a platform based on blockchain technology to automate delivery of certain index data. It was encouraged to do so after successfully testing the data sharing process, a collaboration with the Center for Research in Security Prices (CRSP) and Symbiont, a provider of platforms for institutional applications of blockchain technology. Under the pilot, CRSP had over the last several months distributed daily index data to Vanguard through Symbiont’s blockchain platform, Vanguard said in a statement.Delivering the data via a blockchain and automating workflows with smart contracts had expedited data delivery, eliminated the need for manual updates, and reduced risks, it added. A key component of blockchain technology, a smart contract is a self-executing set of instructions. The partnership between the three organisations will enable index data to move instantly between index providers and market participants over one decentralised database, Vanguard said. “Using this platform, investment managers will be able to instantly distribute, receive, and process index data, resulting in better benchmark tracking and significant cost savings that potentially results in better returns for our clients,” said Warren Pennington, a principal in Vanguard’s investment management group. (From IPE on 12 December 2017).

42
More Information
Please visit -• www.cboe.com/Funds Testimonials and white paper on funds• www.cboe.com/benchmarks Links to 30 benchmark indexes and research
papers• www.cboe.com/volatility 30 volatility indexes
Cboe Risk Management Conferences
• RMC Europe: September 12 - 14 in Ireland
• RMC Asia: December 4 - 5, 2018 in Hong Kong
• RMC US: March 25 - 27, 2019 in California
www.cboermc.com

43
Options involve risk and are not suitable for all investors. Prior to buying or selling an option, a person mustreceive a copy of Characteristics and Risks of Standardized Options (the “ODD”). The ODD and supportingdocumentation for any claims, comparisons, recommendations, statistics or other technical data in thesematerials are available by calling 1-888-OPTIONS, or contacting Cboe at www.Cboe.com/Contact. Futures tradingis not suitable for all investors, and involves the risk of loss. The risk of loss in futures can be substantial. Youshould, therefore, carefully consider whether such trading is suitable for you in light of your circumstances andfinancial resources. For additional information regarding futures trading risks, see the Risk Disclosure Statementset forth in CFTC Regulation §1.55(b). The information in these materials is provided solely for general education andinformation purposes and therefore should not be considered complete, precise, or current. Many of the matters discussed aresubject to detailed rules, regulations, and statutory provisions which should be referred to for additional detail and are subject tochanges that may not be reflected in these materials. No statement within this material should be construed as a recommendationto buy or sell a security or to provide investment advice. The Cboe S&P 500 BuyWrite Index (BXMSM), Cboe S&P 500 2% OTM BuyWriteIndex (BXYSM), Cboe DJIA BuyWrite Index (BXDSM) and Cboe Russell 2000 BuyWrite Index (BXRSM) (the “Indexes”) are designed torepresent proposed hypothetical buy-write strategies. Like many passive benchmarks, the Indexes do not take into accountsignificant factors such as transaction costs and taxes. Transaction costs and taxes for a buy-write strategy could be significantlyhigher than transaction costs for a passive strategy of buying-and-holding stocks. Investors attempting to replicate the Indexesshould discuss with their brokers possible timing and liquidity issues. Past performance does not guarantee future results. Thesematerials contain comparisons, assertions, and conclusions regarding the performance of indexes based on backtesting, i.e.,calculations of how the indexes might have performed in the past if they had existed. Backtested performance information is purelyhypothetical and is provided in this document solely for informational purposes. The methodology of the Indexes is owned by Cboe,Incorporated (Cboe) may be covered by one or more patents or pending patent applications. S&P®, and S&P 500® are registeredtrademarks of Standard & Poor's Financial Services, LLC and are licensed for use by Cboe, Incorporated (Cboe) and Cboe FuturesExchange, LLC (CFE). Cboe's financial products based on S&P indices are not sponsored, endorsed, sold or promoted by S&P andS&P makes no representation regarding the advisability of investing in such products. Cboe Volatility Index®, VIX®, Cboe® andChicago Board Options Exchange® are registered trademarks and BXM, BXD, BXN and BXY are servicemarks of CboeCboe® andChicago Board Options Exchange® are registered trademarks and Cboe Options Institute is a service mark of Chicago Board OptionsExchange, Incorporated (Cboe). All other trademarks and service marks are the property of their respective owners. © 2018 CboeExchange, Inc. All rights reserved.
Important Disclosures