optimizing the duration of the construction projects in
TRANSCRIPT

Ain Shams University - Faculty of Engineering
Department of Structural Engineering
Optimizing the Duration of the Construction
Projects in Egypt by Using Goal Programming
Thesis Submitted in Partial Fulfilment of the Requirements of the Degree of
“Master of Science in Civil Engineering – Structural Engineering”
Submitted by:
Eng. Mahmoud Adel Mahmoud Belal B.Sc. Structural Engineering
Faculty of Engineering
Ain Shams University
Cairo, Egypt
Supervised by:
Prof. Ibrahim Abdulrashed Nusair
Professor of Construction Management
Faculty of Engineering
Ain Shams University
Cairo, Egypt
Prof. Niveen Mohammed Khalil Badra
Professor of Mathematics
Faculty of Engineering
Ain Shams University
Cairo, Egypt
March 2017

Ain Shams University - Faculty of Engineering
Department of Structural Engineering
Optimizing the Duration of the Construction
Projects in Egypt by Using Goal Programming
Thesis Submitted in Partial Fulfilment of the Requirements of the Degree of
“Master of Science in Civil Engineering – Structural Engineering”
Submitted by:
Eng. Mahmoud Adel Mahmoud Belal B.Sc. Structural Engineering
Faculty of Engineering
Ain Shams University
Cairo, Egypt
Supervised by:
Prof. Ibrahim Abdulrashed Nusair Prof. Niveen Mohammed Khalil Badra
__________________________________________ __________________________________________
Examined by:
Prof. Ahmed Sherif Essawy Prof. Mohammed Mahdy Marzouk
__________________________________________ __________________________________________
March 2017

I
ACKNOWLEDGMENT
First, thanks to ALLAH, God of all, for everything happened in my life, who gave
me the knowledge, courage and patience to accomplish this research. May the
peace and blessings of Allah be upon Prophet Muhammad (PBUH).
It is my great pleasure and honor to have “Prof. Ibrahim Abdulrashed Nusair” and
“Prof. Niveen Mohammed Khalil Badra” as my thesis supervisors, who supported
and guided me throughout my research and offered their precious time, experience
and advice.
All the credit to my father ‘’ Prof. Adel Belal ‘’ for his supervision and providing
me the strength to continue and sharing his experience to ensure the quality of the
content.
Special thanks to my mother, wife, and family for their support and encouragement
to achieve my target in this thesis.
Moreover, I would like to thank “Dr. Mohammed Hassan” (PhD holder in Syria)
for his care and valuable support during my research.
Special thanks go to “Eng. Khaled Mahmoud’ who supported me with the real-life
experience in the Construction field, and provided me with all data required during
my research.
II
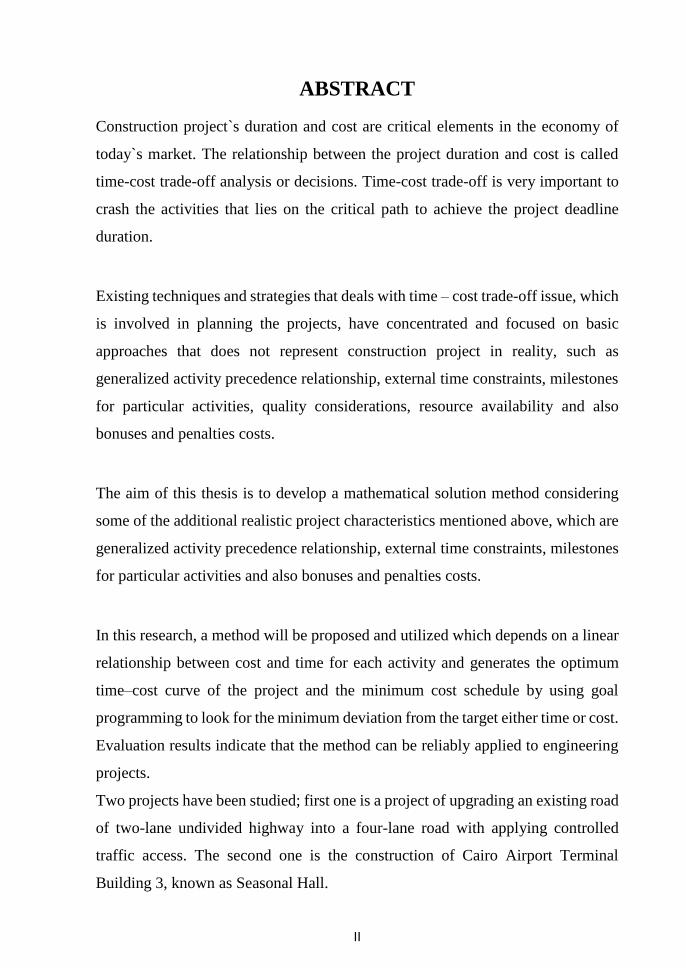
ABSTRACT
Construction project`s duration and cost are critical elements in the economy of
today`s market. The relationship between the project duration and cost is called
time-cost trade-off analysis or decisions. Time-cost trade-off is very important to
crash the activities that lies on the critical path to achieve the project deadline
duration.
Existing techniques and strategies that deals with time – cost trade-off issue, which
is involved in planning the projects, have concentrated and focused on basic
approaches that does not represent construction project in reality, such as
generalized activity precedence relationship, external time constraints, milestones
for particular activities, quality considerations, resource availability and also
bonuses and penalties costs.
The aim of this thesis is to develop a mathematical solution method considering
some of the additional realistic project characteristics mentioned above, which are
generalized activity precedence relationship, external time constraints, milestones
for particular activities and also bonuses and penalties costs.
In this research, a method will be proposed and utilized which depends on a linear
relationship between cost and time for each activity and generates the optimum
time–cost curve of the project and the minimum cost schedule by using goal
programming to look for the minimum deviation from the target either time or cost.
Evaluation results indicate that the method can be reliably applied to engineering
projects.
Two projects have been studied; first one is a project of upgrading an existing road
of two-lane undivided highway into a four-lane road with applying controlled
traffic access. The second one is the construction of Cairo Airport Terminal
Building 3, known as Seasonal Hall.

III
The construction management team for both projects already performed crashing
analysis to reach optimum cost corresponding to the desired time. The construction
team did not take into their consideration all the factors mentioned above.
The proposed model proofed that it can be very useful in construction projects to
find better solutions for crashing the activities. Solution curves also have been
generated to help the decision makers for taking the right decision and see how
flexible they are in extending and reducing the time of the project and its
corresponding cost.
All decision makers will be able to see how each solution deviates from the target
of the client in both time and cost. In the proposed model any positive deviation
means more time or cost than the target. Hence, the proposed model is targeting
the minimum deviations, any negative deviation means less time or cost than the
client even requests.
For the first project, the model solution could meet the desired project duration and
budget, and even finds better solutions which found to be 3 days earlier which
represents 4% of the project duration, while saving is about $700 which represents
about 1.57 % of what the project team proposed for the completion cost.
For the second project, the model solution could meet the desired project duration
and saves about L.E 53000 which represent about 1.32 % of what the project team
proposed for the completion cost.
Keywords: Time-Cost Trade-off analysis, Goal Programming, Parametric
Mathematical Modelling, Crashing, Optimization.

IV
DECLARATION
This dissertation is submitted to the Structural Department, Faculty of Engineering,
Ain Shams University, for the degree of Master of Science in Structural
Engineering.
The work included in this dissertation was carried out by the author in the
Structural Department, Faculty of Engineering, Ain Shams University from
January 2013 to March 2017.
No part of this dissertation has been submitted to any other university or institute
for the award of a degree or a qualification.
Author’s Name: Mahmoud Adel Belal
Signature:
Date:

V
TABLE OF CONTENTS
ACKNOWLEDGMENT ..................................................................................................... I
ABSTRACT ...................................................................................................................... II
DECLARATION ............................................................................................................. IV
TABLE OF CONTENTS .................................................................................................. V
LIST OF FIGURES ........................................................................................................VII
LIST OF TABLES ........................................................................................................... IX
LIST OF SYMBOLS AND ABBREVIATIONS ............................................................. X
CHAPTER (1) INTRODUCTION.................................................................................... 1
1.1 Overview ................................................................................................................. 1
1.2 Problem Statement .................................................................................................. 2
1.3 Objectives & Scope ................................................................................................. 4
1.4 Methodology ........................................................................................................... 4
1.5 Thesis Organization ................................................................................................ 5
CHAPTER (2) LITERATURE REVIEW ......................................................................... 7
2.1 General .................................................................................................................... 7
2.2 Time-Cost trade-off analysis and techniques .......................................................... 7
2.3 Project Time-Cost Relationship ............................................................................ 10
2.4 Shortening Project Duration .................................................................................. 11
2.5 Modelling of multi-objective optimization problems ........................................... 12
2.6 Studies related to time-cost trade-off analysis ...................................................... 18
CHAPTER (3) PROPOSED MODEL DEVELOPMENT .............................................. 25
3.1 General .................................................................................................................. 25
3.2 Assumptions for the model ................................................................................... 25
3.3 Development of the proposed model .................................................................... 26
3.4 Model Functions ................................................................................................... 27
3.5 Model Constraints ................................................................................................. 33
3.6 Model Solution Method ........................................................................................ 36
3.7 Model Limitations ................................................................................................. 38
CHAPTER (4) MODEL VALIDATION USING ACTUAL PROJECTS ...................... 40

VI
4.1 General .................................................................................................................. 40
4.2 First project ........................................................................................................... 40
4.3 Second project ....................................................................................................... 65
CHAPTER (5) GENERAL CONCLUSIONS AND RECOMMENDATIONS ........... 113
5.1 General ................................................................................................................ 113
5.2 Main Conclusions ............................................................................................... 113
5.3 Recommendations for Future Work .................................................................... 115
LIST OF REFERENCES ............................................................................................... 116
APPENDIX (A) - DETAILED OUTPUT DATA FOR PROJECT NO.1 ..................... A2
APPENDIX (B) - DETAILED OUTPUT DATA FOR PROJECT NO.2 ..................... B1
C2 ........................................................................................................ ملخص البحث باللغة العربية

VII
LIST OF FIGURES
Figure 2-1 Illustration of linear time-cost trade-off for an activity [Chris Hendrickson, 1998] ..... 8
Figure 2-2 Illustration of non-linear time/cost trade-off for an activity [Chris Hendrickson,
1998] .................................................................................................................. 8
Figure 2-3 Illustration of discrete time-cost trade-off for an activity [Chung-Wei Feng, 2000]. .... 9
Figure 2-4 General Time-Cost Trade-off Relationship [Marco, 2011] ................................... 10
Figure 2-5 Example of Dominance and Pareto Optimality [S. Bandyopadhyay, S. Saha, 2013] .. 13
Figure 3-1 Graphical representation of Z_dc and Z_c ........................................................ 30
Figure 3-2 Graphical representation of costs included in equation (3-11)............................... 33
Figure 3-3 Use of piecewise-linear segments to approximate a nonlinear time-cost curve [Yang,
2001] ................................................................................................................ 39
Figure 4-1 Sample of output data from Microsoft Project before Crashing for Project No.1 ...... 45
Figure 4-2 Relation Diagram between Direct Cost and Duration for Project No.1 ................... 52
Figure 4-3 Relation Diagram between Indirect Cost and Time for Project No.1 ...................... 53
Figure 4-4 Relation Diagram between Total Cost and Time without Penalty and Bonuses ........ 54
Figure 4-5 Relation Diagram between Total Cost and Time (Considering Penalty and Bonuses)
for Project No.1 .................................................................................................. 55
Figure 4-6 Relation Diagram between all Types of Costs and Time with Penalties and Bonuses
for Project No.1 .................................................................................................. 56
Figure 4-7 Relation Diagram between all Types of Costs and Time w/o Penalties and Bonuses for
Project No.1 ....................................................................................................... 56
Figure 4-8 Relation Diagram between Deviation of Costs with Time for Project No.1 ............. 57
Figure 4-9 Relation Diagram between Deviation of Time D1 with Time for Project No.1 ......... 58
Figure 4-10 Relation Diagram between Deviation of Time D1 and Cost Deviation D2 with Time
for Project No.1 .................................................................................................. 59
Figure 4-11 Sample of Output Data for Microsoft Project after Crashing for Project No.1. ....... 63
Figure 4-12 General Layout for Project No.2 ................................................................... 65
Figure 4-13 Sample of Microsoft Project Output before Crashing for Project No.2 ................. 92
Figure 4-14 Relation Diagram between Direct Cost and Time for Project No.2 .................... 102
VIII
Figure 4-15 Relation Diagram between Indirect Cost and Time for Project No.2 .................. 103
Figure 4-16 Relation Diagram between Total Cost and Time for Project No.2 ...................... 104
Figure 4-17 Relation Diagram between All Types of Costs and Time for Project No.2 .......... 105
Figure 4-18 Relation Diagram between Deviation of Costs D2 with Time for Project No.2..... 105
Figure 4-19 Relation Diagram between Deviation of Time D1 with Time for Project No.2 ..... 106
Figure 4-20 Relation Diagram between Deviation of Time D1 and Cost Deviation D2 with Time
for Project No.2 ................................................................................................ 107
Figure 4-21 Sample of Microsoft Project Output after Crashing for Project No.2 .................. 108
Figure A.1 Gantt chart for Activities before Crashing by Using Microsoft Project for Project
No.1 ................................................................................................................ A3
Figure A.2 Gantt chart For Activities after Crashing by Using Microsoft Project ................... A9
Figure B.1 Gantt chart for Activities before Crashing by Using Microsoft Project for Project
No.2 ................................................................................................................ B2
Figure B.2 Gantt chart For Activities after Crashing by Using Microsoft Project No.2 .......... B14

IX
LIST OF TABLES
Table 3-1 Model Analysis Philosophy ............................................................................ 38
Table 4-1 Activities Data for Project No.1 ...................................................................... 41
Table 4-2 Input Data for Activities before Crashing in Microsoft Project for Project No.1 ........ 43
Table 4-3 Activities Input Data Table in The Premium Solver Model for Project No.1 ............ 46
Table 4-4 Activities Output Data Table from The Premium Solver Model before Crashing for
Project No.1 ....................................................................................................... 47
Table 4-5 Optimizing and Crashing Activities Results for Project No.1 ................................ 51
Table 4-6 Number of Crashed Days per Activity for each Solution for Project No.1 ................ 60
Table 4-7 Verification Results for Project Duration (Z1) for Project No.1 ............................. 61
Table 4-8 Summary Cost for Verification ....................................................................... 63
Table 4-9 Activity Data for Project No.2 ........................................................................ 68
Table 4-10 Project Team Decision Output for Project No.2 ................................................ 82
Table 4-11 Input Data for Activities before Crashing in Microsoft Project for Project No.2 ...... 83
Table 4-12 Normal and Crashing Data for Cost and Time in Project No.2 ............................ 93
Table 4-13 Optimizing and Crashing Activities Results for Project No.2 ............................. 101
Table 4-14 Sample of Output Results from Mathematical Model for Project No.2 ................ 108
Table 4-15 Number of Crashed Days and Cost for each Activity for Project No.2 ................. 109
Table 4-16 Cost Summary for Project No.2 ................................................................... 111
Table 4-17 Output Cost from Mathematical Model for Project No.2 ................................... 112
Table A.1 Analysis Report & Constraints Satisfactory Report before Crashing ..................... A6
Table A.2 Analysis Report & Constraints Satisfactory Report after Crashing ..................... A12

X
LIST OF SYMBOLS AND ABBREVIATIONS
𝐵𝐶 Total bonus cost
𝐵𝐶𝑓 Fixed bonus cost
𝐵𝐶𝑣 Variable bonus cost
bj Goals specified for function𝑓𝑗(𝒙)
BOP Bi-criteria optimization problem
BT Certain time that BC take place before reaching it.
𝐶𝑐𝑚𝑎𝑥𝑖 The maximum crashed cost for activity i
𝐶𝑛𝑖 Normal direct cost for activity i
𝐶𝑖 Direct cost for activity i without crashing
CPM Critical path method
𝐶𝑠𝑙𝑖 The linear cost slope for an activity i
di Crashed duration
Di Normal duration
𝐷𝑖𝑗 Normal duration for the activity
dj is the deviation from the goal bj for the jth objective

XI
𝑑𝑗− underachievement deviational variables
𝑑𝑗+ overachievement deviational variables
𝑑1+ overachievement deviation for time function
𝑑1− underachievement deviation for time function
𝑑2+ overachievement deviation for Cost function
𝑑2− underachievement deviation for Cost function
FF Finish to finish activity relationship
𝑓𝑖 Function i in weighting method problem
𝑓𝑛(�̅�) General definition for any function
FS Finish to start activity relationship
𝑔𝑖(�̅�) First function of the formal definition of MOOPs
ℎ𝑖(�̅�) Second function of the formal definition of MOOPs
𝑑𝑖𝑛𝑑𝐶 Daily Indirect Cost
𝑖𝑛𝑑𝐶 Total Indirect Cost
𝑖𝑛𝑑𝐶𝑓 Fixed Indirect Cost
𝑖𝑛𝑑𝐶𝑣 Variable Indirect Cost
XII
L1 The lower bounds for the objective function 𝑓1(𝒙) in bounded objective
function
L2 The lower bounds for the objective function 𝑓2(𝒙) in bounded objective
function
m Number of inequality constraints for the first function of the formal
definition of MOOPs
Min Z Function to be minimized
MOOPs Multi-objective optimization problems
P Number of inequality constraints for the second function of the formal
definition of MOOPs
𝑃𝐶 Total penalty cost
𝑃𝐶𝑓 Fixed penalty cost
𝑃𝐶𝑣 Variable penalty cost
PT Certain time that PC take place after reaching it.
P(w) Weighting method problem
P() -constraint method problem
P(ɛ-w) Hybrid method between -constraint and weighting methods
P(Bɛ-w) Bi objective hybrid method between -constraint and weighting methods
P(GP) Goal programming method problem
P(FP) Fuzzy programming method
SF Start to finish activity relationship

XIII
SS Start to start activity relationship
TCT Time-cost trade-off analysis
𝑇𝑐𝑚𝑎𝑥𝑖 The maximum crashed time for activity i
𝑇𝑓𝑛 Finish time of the project
𝑻𝒔𝒄𝒊 Number of crashed days
𝑇𝑠1 Start time of the project
𝑇𝑠𝑖 The start time of activity i (processor)
𝑇𝑠𝑗 The start time of activity j (successor)
𝑇𝑓𝑖 The finish time of activity i (processor)
𝑇𝑓𝑗 The finish time of activity j (successor)
U2 The upper bounds for the objective function 𝑓2(𝒙) in bounded objective
function
𝑤𝑖 weighting factor for the objective function i
𝒙𝟎 Start time for the project
𝒙𝒊 Start time for activity x
𝒙𝒋 Finish time for activity x
𝑥𝑛 The project duration