optimization of water dewpoint of natural gas in gas
TRANSCRIPT

Petroleum and Natural Gas Institute
Faculty of Earth Science Engineering
University of Miskolc
Optimization of Water dewpoint of Natural Gas in Gas Processing Plant
using Aspen HYSYS
Author: Ayeni Oluwaseyi
Neptun Code: TLO381
Faculty Supervisor: László Kis, Assistant lecturer
Field Supervisor: Ábel Papp, Production Engineer
30th June 2020


i
ACKNOWLEDGEMENT
Firstly, I give the glory and honor to God Almighty for the opportunity to be a beneficiary of the
Stipendium Hungaricum Scholarship; it is only by His grace that I have made it this far in life.
Secondly, I want to thank the wonderful faculty at the Petroleum and Natural Gas Institute, University
of Miskolc for the educational instruction delivered to me and my classmates in a very professional
manner; your efforts are well appreciated. I especially acknowledge Mr. László Kis, my faculty
supervisor with whom I worked on this Thesis; your input was invaluable to the completion of this
work most especially the modelling aspect. I also want to acknowledge Mr. Ábel Papp, my industry
supervisor and friend; without you I will not have gained so much knowledge on the operations of a
gas processing plant. Thank you for all the times when I called on you for data and information, and
you gave all without complaining even once.
I would like to acknowledge my class mates; the last two years have been amazing with you all.
Although we come from different nationalities, our close bond is a reflection that the world is much
better when we are united with purpose.
To my wonderful brothers, Isaac Enang and Stephen Asuquo; thank you for the support and for always
keeping me on my toes.
Lastly and by no means the least, I am immensely grateful to my wife, Vivian and children, Korede
and Kiitan. Your support, prayers, criticisms and huge sacrifice over the last two years has been
phenomenal. Thank you for all the love, understanding and care.
Oluwaseyi Ayeni (June, 2020)

ii
Contents 1 Introduction .................................................................................................................................. 1
1.1 Research Aims ....................................................................................................................... 1
1.2 Overview of the Dewpoint control Module ........................................................................... 2
1.3 Benefits of the research work ................................................................................................ 2
1.4 Research Outline .................................................................................................................... 3
1.5 Executive Summary ............................................................................................................... 3
2 Literature Review of Natural Gas Processing .............................................................................. 5
2.1 Components of Natural Gas ................................................................................................... 5
2.2 Function of Gas Plants ........................................................................................................... 7
Field operations .............................................................................................................. 7
Receiving the Inlet Stream at the processing plant ........................................................ 7
Gas treating ..................................................................................................................... 8
Dehydration .................................................................................................................... 9
Optional Processes .......................................................................................................... 9
2.3 Uses of Natural Gas ............................................................................................................. 12
2.4 Sales Gas Specifications ...................................................................................................... 12
Heating value (HV) ...................................................................................................... 12
Dew Point ..................................................................................................................... 14
Specification for non-hydrocarbons ............................................................................. 15
Delivery temperature and pressure ............................................................................... 15
3 Water Content of Natural Gas Mixtures- Theorectical Background .......................................... 16
3.1 Literature Review ................................................................................................................ 16
3.2 Water Content of Natural Gas ............................................................................................. 17
Vapor-Liquid Equilibrium ............................................................................................ 19
Predicting Water content from Charts .......................................................................... 19
iii
Using Semi-empirical Correlations in Determination of Water Content ..................... 23
Use of Thermodynamic Models ................................................................................... 25
3.3 Application of the Knowledge of Water Content in Gas Dehydration ................................ 25
3.4 Introduction to Gas Hydrates ............................................................................................... 25
Hydrate Prediction Methods ......................................................................................... 26
Methods of Preventing Hydrates .................................................................................. 31
Effects of Salts and other contaminants on the Glycol performance ........................... 40
Comparison of Glycols ................................................................................................. 41
Effect of Freezing Point and Concentration on Glycols ............................................... 43
Dew point depression ................................................................................................... 43
4 Design Calculations and Process Optimization .......................................................................... 45
4.1 Description of Process Plant and Simulation ....................................................................... 45
Simulation results without utilizing inhibitor ............................................................... 47
4.2 Predicting the water content of the inlet gas stream using correlations in literature ........... 48
4.3 Predicting the hydrate temperature for the inlet gas stream. ............................................... 49
5 Results and Discussions ............................................................................................................. 51
5.1 Effect of MEG concentration on mass fraction of water in market gas .............................. 51
5.2 Relative inhibition strength of Glycols based on Concentration at Constant Flow Rate .... 52
5.3 Hydrate Formation Temperature of Chilled Gas as a function of Flow Rate at Constant
Glycol concentration ...................................................................................................................... 53
5.4 Effect of the cooling temperature in the chiller on the water fraction in the market gas .... 54
5.5 Investigating the relative hydrate depression strengths of the glycols ................................ 55
6 Summary and Conclusions ......................................................................................................... 56
6.1 Glycol Selection ................................................................................................................... 56
6.2 Selection of Concentration of Glycol .................................................................................. 56
6.3 Selection of Flow Rate ......................................................................................................... 56
iv
6.4 Chiller Operating Conditions ............................................................................................... 56
6.5 Conclusions .......................................................................................................................... 57
7 REFERENCES ........................................................................................................................... 58
8 LIST OF FIGURES .................................................................................................................... 61
9 LIST OF TABLES ..................................................................................................................... 62
10 List of Symbols ........................................................................................................................... 63
11 Appendices ................................................................................................................................. 64
1
1 INTRODUCTION
Natural gas is naturally occurring hydrocarbon mixture which comprises primarily of methane,
varying quantities of the members of the paraffin series with/without aromatics, carbon-dioxide,
hydrogen sulfide, mercury, nitrogen and helium (» Background NaturalGas.Org, 2014). It is an
important industrial and domestic fuel and it is used in different forms. It occurs mostly under the
surface of the earth in rock sub-layers either alone or in association with crude oil. It can also be
produced from shale (coal-bed methane), from biogas, and in gas hydrates. It has been in use since
the early 19th century and the natural gas industry is very vital to meeting the world’s energy needs.
Before natural gas is used, it has to be processed to remove unwanted components. The entire value
chain of production and transportation to sales of natural gas is very large. A general overview of the
processes in production of natural gas is presented in the following sections of this material.
Water is regarded as a main contaminant in natural gas mixtures It is always present in varying
amounts depending on upstream conditions. It can exist as free water or as vapor in equilibrium with
the gas. It is naturally present at reservoir conditions where pressures are typically within 100-1000
bars and temperatures are within 50-200oC. Besides this, there are other sources of water in natural
gas such as from saturation in gas treating processes like gas sweetening (V. J Aimikhe et al., 2016).
The presence of free water can lead to the formation of hydrates in transmission lines and plant
facilities, corrosion of metal parts, giving rise to problems with multiphase flow and plugging of
pipelines. The prevention of these problems is important when transporting natural gas and in gas
processing facilities to avoid wastes in capital investment due to equipment damage, increase in
operational costs as a result remedial actions taken to remove hydrates and damage to the
environment. The reduction of the water vapor content of natural gas can be achieved in many ways.
This thesis focuses on mechanical refrigeration and inhibition of the free water with inhibitors like
monoethylene glycol (MEG), diethylene glycol (DEG), triethylene glycol (TEG) and methanol to
reduce the hydrate formation temperature
1.1 Research Aims
The purpose of this research is to optimize the dew point control module of a gas plant ‘X’ using the
process simulator - Aspen HYSYS in order improve the efficiency of the gas conditioning. This will
be done by varying the input inhibitor concentration and looking at it effects on the dew point and

2
hydrate formation temperature of the gas. A comparison would also be made on the performance of
the different glycols.
1.2 Overview of the Dewpoint control Module
The schematic of the dew point control module is shown in Appendix A1. Associated gas arrives the
plant from nearby producing wells thorough 4” and 6” pipes and are fed into multiphase gas-liquid
separators (or slug catchers) to remove the condensate liquid and free liquid water. The gas is then
fed to compressors if required to increase the pressures to 58-60 bar. From the compressors, the feed
inlet gas passes through two gas-gas heat exchangers where it is used to warm a feed of cold process
gas coming from a Low Temperature separator (LTS) located downstream of the chiller. At the inlet
and outlet points of the twin gas-gas heat exchangers, Lean MEG (concentrated MEG) is mixed
directly with the gas stream through nozzles. The cold gas exiting the heat exchangers is also mixed
with MEG. It is then fed to a chiller which utilizes liquid propane and low temperature condensation.
The dew point of the gas is thus set to sales specifications. After exiting the chiller, the gas is fed into
the low-temperature separator to separate condensed liquids. The liquids are sent to the stabilization
unit of the plant for further processing while the dry chilled gas goes into the heat exchanger to pre-
cool feed inlet gas. The processed gas exiting the heat exchangers which is now at the required dew
point is fed into the pipelines for transportation as ‘market gas’. The underflow from the LTS which
is normally referred to as Rich MEG (diluted with water) is then sent to a regenerator package where
the water is removed in a reboiler and the lean MEG (with low water content) is pumped back to the
gas-gas heat exchangers, see Appendix A2.
1.3 Benefits of the research work
The starting phases of plant design are very critical and although there may be many uncertainties but
some questions have to answered as it would have a huge impact in the operation of the plant. An
important consideration as it relates to this thesis is the amount of water that would be handled from
the reservoir during the productive life of the well. There is also need to estimate the value of the
natural gas products and natural gas liquids and check the economic viability of their recovery.
Therefore, this thesis adds to the number of literatures that already address these topics. The proper
estimation of water content impacts the efficiency of dehydrating and inhibition processes. The choice
of inhibitor and quantities required, availability of facilities for recovery of the inhibitor, waste water
3
disposal plans and so on are further questions that need to be answered. This paper attempts to answer
these questions.
1.4 Research Outline
This research work will begin with a quick review of the Natural Gas Processing Industry, the
components of Natural gas, its basic uses and the industry specifications for sales gas.
The next section will introduce the theoretical basics employed in the estimation of water vapor
content of natural gas. A literature review spanning the various methods is elaborated on. The next
topic discusses the structure and formation of hydrates of natural gas mixtures. It further discusses
the methods of hydrate prediction. The section then concludes with the methods of prevention of
hydrates, where it elaborates on dehydration and inhibition processes.
Section 4 gives a description of the gas plant which was modelled in HYSYS and process conditions
under which the plant operates. Comparison is made between theoretical models of calculation of
water vapor content and the results obtained in HYSYS.
Section 5 is a discussion of the results from the modelling and the final section of the work gives a
summary and conclusion of the entire work.
1.5 Executive Summary
Water is a main contaminant in natural gas mixtures if present in the liquid phase. Although
hydrocarbons are generally not soluble in water, very small amounts of water can be retained in
natural gas mixtures. The amount of water vapor in the vapor hydrocarbon phase is referred to as its
water content and it depends on system pressure, temperature and composition of the liquid and gas
phases in equilibrium. If not handled properly, condensed water can lead to many operational
problems in natural gas transportation and processing facilities; chief among these are the formation
of gas hydrates and dissolution of diluents leading to corrosion.
The research paper models a gas plant which utilizes mechanical refrigeration and hydrate inhibition
with ethylene glycol using Aspen HYSYS. The effects of varying some parameters was then
investigated to determine their effect on the water content (dew point) of the gas and hydrate
formation temperature.

4
The results from the simulation show that the optimum flow rate for inhibitor is around 30 L/h. In
addition, diethylene glycol gave the best hydrate suppression (-46oC) when compared with
monoethylene glycol (-35oC) and triethylene glycol (-36oC). The lower the temperature of the chiller,
the lower the water vapor content of the sales gas.

5
2 LITERATURE REVIEW OF NATURAL GAS PROCESSING
Gas processing is the term describing the sum total of processes that take gas from producing wells
to the consumer. A major part of this value chain is the mid-stream which generally encompasses the
gathering, compression and processing functions between the production wellhead and the
transmission lines. The mid-stream and associated processes are primarily used to condition the sales
gas.
2.1 Components of Natural Gas
Natural gas mixtures contain a large collection of many different compounds belonging to various
chemical families with widely different physical and chemical properties. The compounds that make
up a natural mixture can be organic or inorganic. This is perhaps the reason why is very difficult to
study and characterize such a mixture. However, the main component are the organic compounds
belonging to the homologous (family) series called the Paraffins especially the compounds with
carbon lengths from 1-10. They may also contain small and insignificant amounts of other
hydrocarbon compounds like the Olefins, Aromatics, and Naphthenes. Besides these organic
compounds, natural gas mixtures also contain contaminants. These substances reduce the amount of
energy that can be generated from the utilization of natural gas; in addition, they are also the cause of
operational problems in transportation lines and processing facilities and they are usually
environmental pollutants. As a result, they have to be removed by treating the natural gas stream. The
common contaminants in natural gas are the acid gases (example carbon dioxide and hydrogen
sulfide), mercaptans (compounds of Sulphur called thiols), and inert gases (example nitrogen, argon
and helium). Other contaminants are oxygen and mercury (1984, pp. 34–35)
The separation of these contaminants, as well as the conditioning of the natural gas stream to meet
pipeline specifications and sales contract requirement form the essence of the ‘mid-stream’ section of
the natural gas industry. Figure 1 is chart showing the natural gas industry midstream processes.

Figure 1 Overview of Natural Gas Processing (Campbell, 1984, p. 25)
6

7
2.2 Function of Gas Plants
The goal of gas plants is the processing of gas in order to produce high quality natural gas. The plant
can also have an optional section for recovery of Natural gas liquids (NGL) thereby increasing the
plant’s profitability.
The following are some of the roles of gas plants according to (Kidnay et al., 1995):
- Gas dehydration to prevent pipeline corrosion and formation of gas hydrates.
- Recovery of Carbon-dioxide and/or nitrogen for use in Enhanced Oil Recovery (EOR).
- Upgrading the gas quality by removal of the undesired diluents such as nitrogen, hydrogen sulfide
and carbon dioxide. Nitrogen is the most difficult to remove because the process involves cryogenic
separation.
- Helium recovery; natural gas is a primary source of Helium gas and sometimes and additional
facility is added to the plant to remove this constituent.
- Stabilization of the produced condensate.
- Liquefaction of the treated natural gas to make transportation to far away markets possible or for
storage.
The processes involved are discussed in the following.
Field operations
Most plants have field operations and a network of gathering lines that convey the untreated gas and
liquids into the plant. The field operations typically include the measurement of inlet gas, separation
of the free hydrocarbon liquid, dehydration of gas, the removal of acid gas constituents and
compression. These stations are referred as gathering stations. Compression might be necessary at
booster stations. Chemical injection is also carried out at the field stations for corrosion and hydrate
prevention. The gas/liquid stream leaves the gathering points or manipulation points and are
transported to the processing plants for conditioning. Flow from gathering stations are usually two-
phase stratified flow and because of this pigging is necessary for the removal if condensed heavy
hydrocarbons and water.
Receiving the Inlet Stream at the processing plant
If the inlet stream is not completely free of liquids, then the liquids must be separated. At the inlet
receiving, the initial gas-liquid separation is made. The separated water and free hydrocarbon liquids,

8
and any solids present are then removed from the gas and then they flow downstream in the plant for
further processing. Sometimes an optional compressor is installed to pressurize the inlet gas; it might
be necessary to have such a compressor at the inlet because high pressure is necessary for efficient
cryogenic liquid recovery. (Kidnay et al., 1995) If inlet pressures are 50 bar (700psi) or higher, it is
unnecessary to compress the gas. For most offshore streams, the inlet pressures are low, and
compression is necessary.
Gas treating
Some field operations also have plants to separate the acid gases if their concentrations are in excess
of exposure limits. Several plants employ water-based adsorbents to purge the gas of impurities. Gas
treating is also called Gas Sweetening. Some methods used in gas sweetening are –
▪ Chemical Absorption
▪ Physical Adsorption
▪ Adsorption onto fixed beds
▪ Membrane separation
Chemical Absorption is one of the most used methods for removal of H2S and CO2. The process uses
amines which are water-soluble organic nitrogen compounds that form an aqueous basic solution.
They react with acid gases reversibly to produce water-soluble salts. The acid gas is then regenerated
under conditions of low pressure and high temperature. The gas is then removed with the overhead at
the regenerator while the amine solution is recycled into the absorber. The commonly used amines in
gas treating are the monoethanol amine (MEA), diethanol amine (DEA), methyl diethanol amine
(MDEA), diglycol amine (DGA) and diisopropanol amine (DIPA).
Physical adsorption is a physical process; no chemical reaction takes place. The acid gas is dissolved
in the solvents. It is used in systems with high partial pressures. The physical solvents require less
energy for regeneration compared to amines. The processes are proprietary and may require
licenses.(Campbell, 1984)
Adsorption on fixed beds is a process where the sulfur compounds are removed selectively by
adsorption in membranes and molecular sieves. Its application is limited to streams with low sulfur
content (100-200kg/day).(Campbell, 1984)

9
Carbon dioxide can be selectively removed using membranes but they are not as effective for sulfur
compounds because of required low limits for these impurities.
There are some other methods for the removal of H2S and CO2 but these schemes are optimized for
specific applications. Examples are the use of liquid scavengers.
The acid gas recovered in the treating process is vented if it contains only CO2 without any H2S. If it
contains H2S and Sulphur products, then it becomes a feed to the Sulfur recovery unit and a Tail gas
unit (TGU) for recovery of dry sulfur. Of course, the inclusion of these units in a gas plant is hinged
on the cost to benefit ratio and if markets are available for it then it is a required option.
Dehydration
The dehydration of natural gas is necessary to prevent gas hydrate and corrosion. It is also important
to prevent multiphase flow related problems in the presence of free water. (Campbell, 1984). Acid
gases in a water environment form mildly acidic solutions which corrode metal parts and equipment.
The processes and mechanisms of dehydration and reduction of water content would be discussed in
more detail later.
Optional Processes
Hydrocarbon liquid recovery is necessary in plants that produce Natural gas liquids (NGL) and it
involves cryogenic separation to produce ethane and heavier hydrocarbon fractions. The liquids
produced are further processed in order to stabilize to meet sales requirements. NGL is a broad term
that refers to liquids with ethane and higher hydrocarbon fractions as their main component; they are
produced typically by refrigeration of the gas stream. Other liquids produced by separation at ambient
temperatures are sometimes called field condensates and are mixtures of C5+ components i.e. Pentane
and heavier paraffin fractions.
If the nitrogen content of the natural gas stream is high, then a nitrogen recovery unit is needed. The
recovered nitrogen is becoming more important for use in Enhanced oil recovery (EOR).
Trace compounds are present in natural gas at low concentrations. They are required to be removed
to meet environmental requirements, product specification and processing requirements. For
example, the inert gas helium, whose recovery is typically uneconomical unless the concentration is
above 0.5 vol% (Kidnay et al., 1995). The trace components BTEX (benzene, toluene, ethylbenzene

10
and xylene) and mercury are also necessary to be separated. BTEX is of environmental concern while
elemental mercury has been a concern in aluminum boilers where it causes fouling.
The majority of plants that have cryogenic hydrocarbon recovery use turboexpanders to provide
refrigeration in the cryogenic section and must recompress the gas before it goes to the pipeline. The
gas is compressed in single stage or multiple stage compressors before entering the transportation
line.
Figure 2 is a block diagram that summarizes the previous discussion showing the main processes
involved in gas processing and the products at each stage.

11
Figure 2 Basic schematic of operations in a gas plant (Modified by author from (Kidnay et al., 1995))
Natural
gasoline
Liquids Processing NGL
Outlet Compression
Liquefaction
Sales
gas
LNG
N2
Nitrogen rejection Helium Recovery Crude
helium
Hydrocarbon recovery Dehydration
Gas Treating
Elemental
sulfur Sulfur recovery
CO2
Inlet Compression Inlet receiving
Field compression
Field dehydration
Field acid gas
removal
Field liquids
removal
Gas and liquids from
wells

12
2.3 Uses of Natural Gas
Aside from the use of natural gas in heating for residential and commercial places, it is used in many
industries for industrial processes. It is used in electricity generation and is touted to be the
replacement fuel for crude oil and coal as a source of energy for the future. It is also used as a fuel for
vehicles. The main products from the natural gas processes and their uses are summarized in Table
1.
2.4 Sales Gas Specifications
Sales gas (market gas) is essentially conditioned natural gas that is transported in pipelines and sent
to markets where the gas is used and consists of mainly methane and decreasing quantities of ethane,
propane etc. Sales gas must meet several specifications before it enters into the transmission system.
Generally referred to as transportation specifications, their values differ all around the world. The
following is a brief discussion on the general sales specifications.
Heating value (HV)
The heating values is normally expressed either as the Higher heating value (HHV) or the Lower
heating value (LHV).
The ‘gross’ or higher heating value is the amount of heat produced on combustion of a mole of gas
when the theoretical amount of air is used provided the produced water from the combustion is
condensed to the reference temperature.
The ‘net’ or lower heating value is the amount of heat produce from the combustion of a mole of the
gas provided the water produced is not condensed.
The unit of the HV is MJ.

13
Table 1 Uses of Products of Natural gas Processing
Product Uses
Methane Principally used as a fuel and is the main constituent of pipeline gas.
Ethane Used as fuel along with natural gas and used mainly in the industrial
manufacture of ethylene; a constituent of polyethylene
Propane It has various uses. In the United States for instance, it is used as a fuel for
transport, as a petrochemical, as an industrial chemical, and for residential
purposes.
Propane-Ethane mix This is the left-over of lighter components from NGL extraction used as
feedstock in refineries and as a petrochemical.
Isobutane It is used as feedstock for production of methyl tertiary butyl ether (MTBE),
for production of Propylene oxide and a feedstock for reformulated gasoline.
n-Butane Primarily used in gasoline as a blending product or isomerized to isobutane.
In mixture with propane, it is used in making the propellant in aerosols.
Natural gas
liquids (NGL)
The natural gas liquids refer to all components that are liquefied in the gas
plant. It is a broad classification for ethane, propane, butanes and natural
gasoline.
Natural gasolines A mixture of the pentanes and heavier hydrocarbon fractions used as a
blending component in gasoline and feedstock for C5/C6 isomerization
Sulphur Based on economics, some plants are designed to separate hydrogen sulfide
and convert it to elemental sulfur. It is used in the vulcanization of rubber
and production of sulfuric acid amongst other uses.
Carbon dioxide
and Nitrogen
In plants where substantial amounts of nitrogen and carbon dioxide are
produced, the recovered gases are used in pressure maintenance and
enhanced oil recovery processes. Nitrogen is also used in artificial lifting
methods.

14
Table 2 shows typical heating values of the first six hydrocarbons in the paraffin series.
Table 2 HHV and LHV of some hydrocarbons (McAllister et. al., 2011)
Component HHV @ 25oC and
101.325kPa [MJ/kg]
LHV @25oC and
101.325kPa [MJ/kg]
Methane 55.536 50.048
Ethane 51.902 47.611
Propane 50.322 46.330
Iso-Butane 49.363 45.577
n-Butane 49.511 45.725
Iso-Pentane 48.909 45.249
n-Pentane 49.003 45.343
Hexane 48.674 45.099
In Europe gas markets, the Wobbe number is additional specification for the sales gas. It gives a
measure of the gas interchangeability. If two gases have the same Wobbe number, then they will give
the same amount of heat for the same pressure drop across the burner tip orifice assuming the
temperature and pressure remains the same.
Dew Point
The definition of dew point can be in reference to the water or the hydrocarbon. With reference to
water, it is stated as the mass of water per unit volume of the gas or the maximum allowable water
dew point temperature at a specified pressure. Specification of water dew point must be referenced to
the pressure which is normally the typically the operating pressure of the pipeline.
Hydrocarbon dew point control is the maximum temperature below which the first drop of
hydrocarbon liquid is formed. Hydrocarbon dew point control is necessary to prevent liquid formation
that can reduce the throughput of gas, cause excessive slugging and/or interfere with metering. The
hydrocarbon dew point is also expressed at a temperature specified at a given pressure. The value
depends on the climate and the end buyer. Typical values in North America are between -10oC to
5oC. (Campbell, 1984).

15
Specification for non-hydrocarbons
The amount of sulfur in sales gas is controlled to prevent corrosion, odor and toxicity in the sales gas.
It is normally included in the sales contracts. The concentration of nitrogen is normally limited to less
than 2-3 mol% as its presence limits the heating value of the gas. The specification for CO2 is a
maximum of 2-3 mol% because of it can produce acidic solutions in water. Oxygen has specific limits
of 0.1-0.2 mol% but is seldom present in natural gas. It is also specified because it is corrosive in a
wet environment (Campbell, 1984).
Delivery temperature and pressure
This requirement specifies the delivery pressure. It is taken as the maximum anticipated line pressure
but it varies from one customer to another. A maximum delivery temperature of about 49oC is
specified at the delivery point.
The Table 3 below shows some examples of sales specifications in 3 different continents.
Table 3 General Sales Gas Specifications in various Gas markets adapted from (Campbell, 1984, p. 29)
Specification Europe USA Middle East
Hydrocarbon
dewpoint 0 to -5 oC at P < 7000 kPa
-10 to 4 oC at specified
pressure
5oC at any pressure less
than the delivery pressure
Water dewpoint
or Water content -10 – (-12) oC at 7000 kPa 60-110 mg H2O/std m3 0oC at 6900 kPa
H2S concentration 5-7 mg/Nm3 280-1121kg/std m3 N/A**
CO2
concentration 2-3 mole % 1-3 mole% 3 mole%
N2 concentration n/s* n/s* N/A**
Oxygen 10 ppmv (mole) 0.1-0.2 mole % 0.1 mole %
Mercaptan conc 6-15 mg/Nm3 280-1121kg/std m3 15 mg/std m3
Heating value 40-46 MJ/Nm3 353-424 kJ/std m3 387 - 402 kJ/std m3
*: usually not specified
** not applicable
16
3 WATER CONTENT OF NATURAL GAS MIXTURES-
THEORECTICAL BACKGROUND
3.1 Literature Review
Studies on the impact of free liquid water in gas pipelines and processing facilities have been on for
a very long time due to its direct effect on corrosion in facilities and in the formation of hydrates.
The first recorded work on the water content of gases was in 1881 by Poynting (Campbell, 1984).
The first known gas hydrates were discovered by Sir Humphrey Davy in 1810. Davy discovered the
hydrate formed by chlorine and water. Villard (1881) presented data on gas hydrates (Campbell, 1984,
p. 156).
In the American natural gas industry, Hammerschimdt provided explanation that freezing experienced
in gas transmission lines was not caused by water ice but by gas hydrates and it was then discovered
that hydrates not only formed at areas of low winter temperatures but also along transmission lines
where elevated pressures occurred (1949, p. 1).
The work and paper presented by Hammerschimdt and his colleagues (1949, p. 5) provided a good
review of the works of various scholars who researched on gas hydrates.
Shroeder (1926, pp. 21–71) reported the history of the discovery of gas hydrates. Later in 1882,
Wroblewski, reported a carbon dioxide hydrate. The hydrate of acetylene was discovered by Cailletet,
in 1878; he was also the first to discover that a sudden decrease in pressure aided in the formation of
these crystalline compounds. The first H2S hydrate was reported by Woehler in 1840. Also, of note
is the work of Villard and de Forcrand who for more than 40 years researched on hydrate and
compounds that form them. It was Villard (Villard, 1888a, 1888b) who first reported hydrates of
methane, ethane, acetylene, and ethylene. The first double hydrate formed by H2S and CS2 was
reported by Schutzenberger. The double hydrates are definite compounds having a definite melting
point. They are not composed of single hydrates, because the decomposition temperature of the
double hydrate may be entirely different from the decomposition temperature of either single hydrate.
De Forcrand further characterized the mixture of hydrogen sulfide and aqueous alcohol that was
obtained by Woehler (1840) as a mixed hydrate. In addition, he discovered the family of
“sulfhydrierten” hydrates which are compounds in which hydrogen sulfide unites with different
halogen-substitution derivatives of the aliphatic series, in hydrate form. After the discovery of Villard,
17
the double hydrate of CO2 and phosphine was discovered by Cailletet and Bordet (1882). In 1887,
De Forcrand and Sully Thomas, also reported that tetrachloromethane and acetylene formed a double
hydrate. They further reported double hydrates of acetylene, ethylene, SO2 and CO2 with the
following; ethylene chloride, ethylene bromide, methyl iodide, methyl bromide, methylene chloride
and methylene iodide. Other compounds e.g. ether and CO2 were reported by Hempel and Siedel.
Methyl mercaptan forms crystalline hydrates with water (Dictionary of Applied Chemistry, 1928, p.
316).
The method of absorption using hygroscopic solids or reactive liquids in the dehydration of gas was
first documented in the 1920s. Glycerol was one of the first liquids used in drying fuel gas (1997, p.
953). The first reported solution used for gas dehydration is Calcium Chloride solution which dates
back to the 1930s (Swerdloff, 1957). Diethylene glycol (DEG) and triethylene glycol which follow
each other in the homologous series was first reported to be used in 1936 (1997, p. 953) According
to Kohl et al, there were at least 5000 gas plants which utilized a type of glycol in North America in
1957 (Polderman, 1957) The application of glycerol in the dehydration of super-critical CO2 has also
been developed and documented in literature (Diaz & Miller, 1984) while DEG/TEG systems has
been used in streams rich with sub-critical CO2. Sulfuric acid is also good desiccant but is used in
special cases because of its corrosiveness (Kohl & Nielsen, 1997).
Elhady (2005) made a review of the operational challenges of a processing plant that utilized glycols
for dewpoint control in offshore Mediterranean. In his paper, he pointed that some of the operational
problems experienced was due to high glycol loses from salt contamination, loss of efficiency in the
low temperature separators, and plugging of the spray nozzles before the gas-gas heat exchanger.
The interaction between water and natural gas can be a tough nut for operators of gas producing fields
and operators of gas plants because of the problems caused by hydrates. It is therefore imperative to
deploy tools and techniques to prevent it. Bölkény et al. (Bölkény & Konyha, 2015) devised a
Telemetry system to remotely monitor the gas well so as prevent hydrates.
3.2 Water Content of Natural Gas
The environment where hydrocarbons are found typically also contain water. Hydrocarbons and water
are natural neighbors being found at equilibrium and reservoir conditions. Natural Gas is
insignificantly immiscible with water and this slight miscibility is important for prediction of hydrate
formation but does not affect the vapor-liquid equilibrium behavior. At 25oC (77oF) and 100 kPa, n-
18
pentane has a mole fraction of 3.5x10⁻⁶ (Campbell, 1984). Generally, the solubility of the paraffins
decreases with carbon number, while the aromatics and naphthenic hydrocarbons have a higher
solubility in water. In mixture containing liquid water and hydrocarbons, two liquid phases are present
and the water content in the gas phase is determined by the vapor pressure of the liquid water and the
gas composition.
Water is almost typically present at wellhead condition. The concentration of water varies from trace
amounts to saturation.(Kidnay et al., 1995). The natural gas inlet stream at the gas plant is generally
taken to be saturated with water unless there has been dehydration in the pipelines upstream of the
plant.
The water content is required to be below the lowest pipeline temperature to prevent free-water
formation. The amount of water in a gas depends on the temperature and pressure of the system. In
addition, it is also affected by the composition of the gas (1997, p. 947). Because transporting
conditions are seldom static, it is important to compare the water content at different points in the
system, in order -
▪ To estimate the amount of water loading for dehydration
▪ To establish the amount of free water at any point in the system.
For illustrative purposes, if at a location A in the system, the saturation water content is 100kg/106
std m3 and at another location B downstream, it is 50kg/106 std m3, then if no water has been
withdrawn, there are 50 kg of free water in the system per 106 std m3 of gas flowing. The water is
available to form hydrates unless it is removed or inhibited. It can also accelerate corrosion if the gas
mixtures contain acid gases.
Water content prediction and estimation is crucial in the design and construction of natural gas
processing facilities especially at low temperatures where temperatures in pipelines as low as -20oC
have been recorded.
There are 4 ways of calculating the water content available in literature (Campbell, 1984; V. J
Aimikhe et al., 2016). They are:
▪ Vapor-Liquid equilibrium correlations (partial pressures and fugacity)
▪ Saturation water-content charts
▪ Use of Empirical or Semi-empirical correlations

19
▪ Use of Equations of state or thermodynamic models
Each of these methods are discussed in the following and they would be used in calculating the water
content of the gas composition that was used for the model in the next section.
Vapor-Liquid Equilibrium
Raoult’s law when applied to the gas-water mixture yields:
𝑦𝑤 = 𝑝𝑣 ∗ 𝑥𝑤
𝑝 (1)
For practical cases, the mole fraction of water in the liquid can be taken as 1.0 because of the
immiscibility of gas in the liquid phase. Therefore equation 1 reduces to:
𝑦𝑤 =
𝑃𝑣
𝑃
(2)
This equation is valid only at low pressures where the ideal gas law is valid. It is recommended for
system pressures up to about 400kPa (Campbell, 1984).
Predicting Water content from Charts
Empirical charts showing the water content of natural gas plotted against temperature are available in
literature (Campbell, 1984). These charts were developed based on data from several sources.
Examples are those by McKetta and Wehe, Campbell, and Guo and Galambor (2016, p. 2). Figure 3
is a typical correlation.
These charts can be applied for lean sweet natural gas. They have a likely error of 6-10% which is
probably more accurate than the underlying data that was used in developing the correlation
(Campbell, 1984). It should be noted that at temperatures below the hydrate temperature of the gas
where the condensed phase is a solid (hydrate), its saturated (equilibrium) water content with the gas
hydrate is lower than when it is in equilibrium with the metastable liquid. The metastable liquid is the
present

20
Figure 3 Water Content Chart (Campbell, 1984)
during the ‘time-dependent’ hydrate formation processes (1984, p. 152). This effect is depicted in the
figure 4 (1997, p. 947). The dotted lines below and to the left the hydrate formation line represent the
meta-stable equilibrium between water vapor in the gas phase and super-cooled liquid water. The
actual equilibrium water content with the solid (ice or hydrate) has a lower value (as seen with the
thick lines). A major drawback in the use of these charts is that they are developed for a limited gas

21
composition and are not recommended especially at low temperatures and high pressures where the
most stable phase are gas hydrates. These regions are usually depicted as dotted lines on these charts.
Figure 4 Equilibrium water content curves below hydrate formation point
(Source: Gas Purification, Kohl A.L, Nielsen R.B., 5th Edition)
3.2.2.1 Predicting Water content of Sour Gases from Charts
As earlier mentioned, the water vapor content of natural is dependent on the gas composition. The
presence of substantial amounts of H2S or CO2 increases the equilibrium water content especially at
pressures over 1000 psia (1997, p. 947)

22
There are several methods of estimating water content of gases containing H2S and CO2. Generally,
there are correlations for estimating sour gas water content. The chart in Figure 8 was calculated
using the SRK equation of state assuming hydrocarbon portion of gas is methane. It is assumed that
CO2 has 70% of the water content of H2S at the same temperature and pressure. The H2S equivalent
is obtained as:
𝐻2𝑆(𝑒𝑞𝑢𝑖𝑣) = %𝐻2𝑆 + 0.7 ∗ (%𝐶𝑂2) (3)
The method is limited to an H2S equivalent of 50% and applicable for temperatures from 10-177oC
and pressures from 1379 kPa to 69 MPa.
Figure 5 Water Content Ratios for Sour Gas (Campbell, 1984)
Another method for determination is the correlation done by Robinson et al (Kohl & Nielsen, 1997,
p. 947) for pressures between 1000 psia and 10000 psia and combined acid concentrations of up to
40%. for dry methane typical data are given in Table 4. The water content increase caused by the
acid gases is higher at higher pressures and lower temperatures. The H2S equivalent when
extrapolating table 2 to other concentrations is obtained by the equation below.
𝐻2𝑆(𝑒𝑞𝑢𝑖𝑣) = %𝐻2𝑆 + 0.7 ∗ (%𝐶𝑂2) (4)
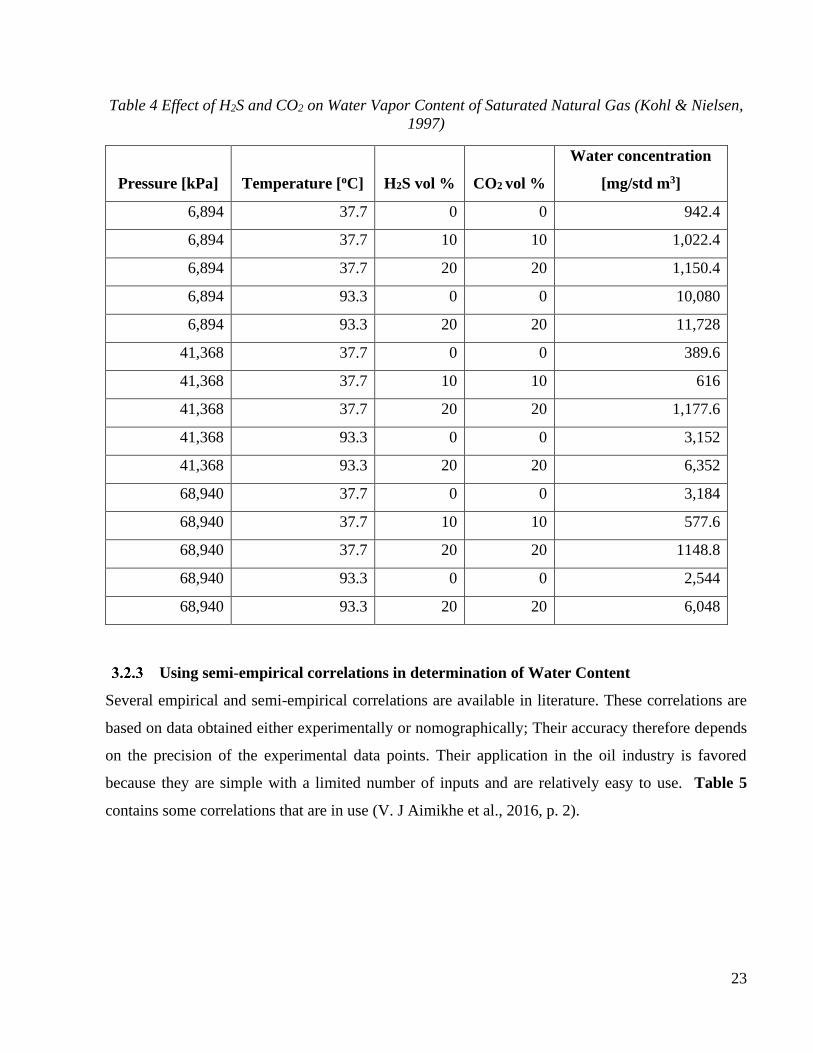
23
Table 4 Effect of H2S and CO2 on Water Vapor Content of Saturated Natural Gas (Kohl & Nielsen,
1997)
Pressure [kPa] Temperature [oC] H2S vol % CO2 vol %
Water concentration
[mg/std m3]
6,894 37.7 0 0 942.4
6,894 37.7 10 10 1,022.4
6,894 37.7 20 20 1,150.4
6,894 93.3 0 0 10,080
6,894 93.3 20 20 11,728
41,368 37.7 0 0 389.6
41,368 37.7 10 10 616
41,368 37.7 20 20 1,177.6
41,368 93.3 0 0 3,152
41,368 93.3 20 20 6,352
68,940 37.7 0 0 3,184
68,940 37.7 10 10 577.6
68,940 37.7 20 20 1148.8
68,940 93.3 0 0 2,544
68,940 93.3 20 20 6,048
Using semi-empirical correlations in determination of Water Content
Several empirical and semi-empirical correlations are available in literature. These correlations are
based on data obtained either experimentally or nomographically; Their accuracy therefore depends
on the precision of the experimental data points. Their application in the oil industry is favored
because they are simple with a limited number of inputs and are relatively easy to use. Table 5
contains some correlations that are in use (V. J Aimikhe et al., 2016, p. 2).

Correlation Pressure
range (bar)
Temperature
Range (oC)
Kazim (1996)
(for sweet
natural gas)
20 – 83 < 82.22 𝑦𝑤 = 𝐴 × 𝐵𝑡
𝐴 = ∑ 𝑎𝑖 (𝑝 − 350
600)
𝑖−1
4
𝑖=1
𝐵 = ∑ 𝑏𝑖 (𝑝 − 350
600)
𝑖−14
𝑖=1
Gandhidsan
(2003)
- - 𝑊𝑤𝑎𝑡𝑒𝑟 = 593.335𝑒0.05486𝑇 × 𝑃−0.81462
where;
Wwater [kg water/106m3], T [oC], P [MPa]
Moshfeghian
(2014)
(for lean sweet
natural gas)
6.9 - 689 -40 - 100 𝑊𝑎𝑡𝑒𝑟 𝑐𝑜𝑛𝑡𝑒𝑛𝑡 = (
𝐴
𝑃+ 𝐵) 𝐶
𝐴 = 𝐴𝐴 + 𝐵𝐴𝑇 + 𝐶𝐴𝑇2 + 𝐷𝐴𝑇3 + 𝐸𝐴𝑇4 𝐵 = 𝐴𝐵 + 𝐵𝐵𝑇 + 𝐶𝐵𝑇2 + 𝐷𝐵𝑇3 + 𝐸𝐵𝑇4
Sloan (1982) 13.8 - 138 -40 - 48 𝑊 = 16.02𝑒𝑥𝑝 [𝑎1 + 𝑎2𝑙𝑛 𝑝 +
𝑎3 + 𝑎4𝑙𝑛 𝑝
𝑇 + 273.15+
𝑎5
(𝑇 + 273.15)2+ 𝑎6(𝑙𝑛 𝑝)2]
Ning (1999) 1-1000 - 𝑊 = (1015.32 + 1.1𝑇 − 18.2𝑑 − 1.42𝑇𝑑) × (1 − 0.02247𝑆) × 𝑒𝑥𝑝(𝑎0 + 𝑎1𝑇 + 𝑎2𝑇2)
𝑑 = ∑𝑚𝑗𝑦𝑗
28.966
Behr (1983) 13.3-207 𝑊 = 𝑎0 + 𝑒𝑥𝑝 (𝑎1 +
𝑎2 + 𝑎3 ln 𝑝 + 𝑎4(ln 𝑝)2
(𝑇 + 273.15)2) + 𝑎5 ln 𝑝 + 𝑎6(ln 𝑝)2 + 𝑎7(ln 𝑝)3
+𝑎8 + 𝑎9 ln 𝑝 + 𝑎10(ln 𝑝)2 + 𝑎11(ln 𝑝)3
(𝑇 + 273.15)3
Table 5 Empirical and Semi-empirical correlations for water content (2016)
24

25
Use of Thermodynamic Models
These methods provide a more robust and accurate estimation of water content for gases for a wide
range of gas compositions, temperature, and pressures. Although models based on the equations of
state can be relatively complex, the use of computers to make it easier to make use. Examples of
commonly employed equations of state are the SRK, Peng Robinson, Cubic Plus Association and
GERG Equations of State. V.J. Aimikhe et al.(2016) used experimental data from a high pressure
variable volume cell with an analyzer based on the Tuneable Diode Laser Absorption Spectroscopy
(TDLAS) technology to validate the Cubic Plus Association EoS in the range -20-20oC and using
regression analysis obtained close correlation with the CPA EoS.
3.3 Application of the knowledge of water content in gas dehydration
Estimation of water content is useful in the determination of the quantity of water which condenses
out of the gas. As mentioned earlier, free water impacts disposal, corrosion and hydrate formation.
For most high-pressure natural gas systems, the amount of condensed water is small relative to the
total stream rate but if there is an error in calculating the right water loading, the efficiency of
dehydration is affected. According to Campbell (1984), changes of as little as 5oC in ambient range
can result in about 25-30% increase in water content.
In many cases, the water content of gas upstream is greater than at downstream of the system. In these
instances, the difference account for the water that condenses out of the gas. To account for amount
of free water, a suitable correlation may be used. For the cases where no dehydration occurs between
the separator at the wellsite and a processing facility, we can say that the gas is holding the maximum
water vapor it can at the reservoir pressure and temperature i.e. it is saturated. Hence, we can estimate
the amount of liquid water in the inlet gas that arrives at the plant. In most cases of course, liquid
water is present from the reservoir in addition to water in the vapor phase.
3.4 Introduction to Gas Hydrates
Gas hydrates are a class of solid, nonstoichiometric compounds (meaning that they cannot be
represented by a chemical formula) called CLATHARATES (Kidnay et al., 1995, p. 40). They form
when a host molecule forms a cage with hydrogen bonding around ‘guest’ molecules. In the case of
natural gas, water is the host molecule and methane is the guest molecule. They will typically form
in free water systems at ambient temperatures less than 27oC and moderate pressures greater than
26
600 kPa. Three different structures of hydrates have been identified in literature; these are structures
S1, S2 and H. The guest molecule determines the type of structure formed while the solubility of the
gas governs the rate of formation. (Campbell, 1984, p. 158). The number of water molecules in a
crystal of a gas hydrate is called the hydrate number and it is a function of pressure. Butane forms an
unstable hydrate and with the exception of neopentane, hydrocarbons heavier than butane do not form
hydrates. Mixtures are known to form hydrates more readily than pure components. The gases that
normally form hydrates are methane, ethane, propane, n-butane, isobutane, hydrogen sulfide, nitrogen
and carbon di-oxide. The rate of formation of hydrates depends on the size and solubility of the
component while the structure formed is affected by the molecule (heavier molecules form the s2
structure). Individual crystals are formed in the liquid phase because practically, the required quantity
and energy for hydrogen atoms to bond exists in this phase. The crystals formed are small at first but
when they join at their faces and edges, the become large enough to plug the pipe giving rise to various
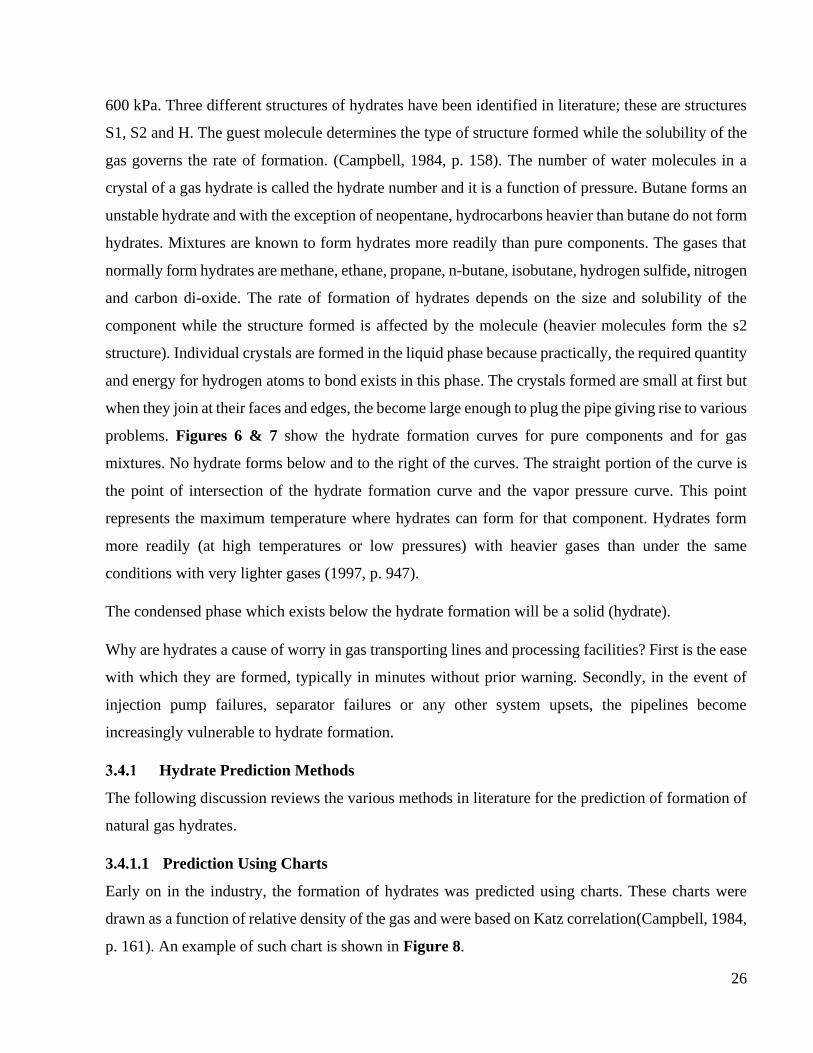
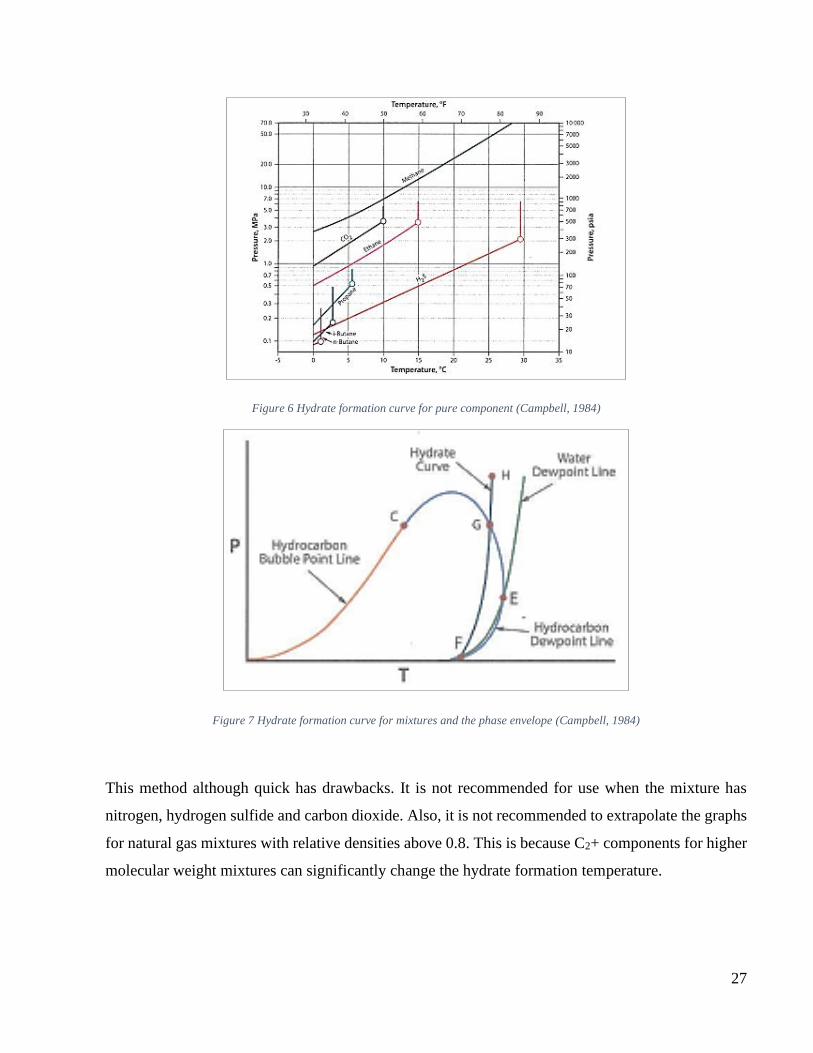
problems. Figures 6 & 7 show the hydrate formation curves for pure components and for gas
mixtures. No hydrate forms below and to the right of the curves. The straight portion of the curve is
the point of intersection of the hydrate formation curve and the vapor pressure curve. This point
represents the maximum temperature where hydrates can form for that component. Hydrates form
more readily (at high temperatures or low pressures) with heavier gases than under the same
conditions with very lighter gases (1997, p. 947).
The condensed phase which exists below the hydrate formation will be a solid (hydrate).
Why are hydrates a cause of worry in gas transporting lines and processing facilities? First is the ease
with which they are formed, typically in minutes without prior warning. Secondly, in the event of
injection pump failures, separator failures or any other system upsets, the pipelines become
increasingly vulnerable to hydrate formation.
Hydrate Prediction Methods
The following discussion reviews the various methods in literature for the prediction of formation of
natural gas hydrates.
3.4.1.1 Prediction Using Charts
Early on in the industry, the formation of hydrates was predicted using charts. These charts were
drawn as a function of relative density of the gas and were based on Katz correlation(Campbell, 1984,
p. 161). An example of such chart is shown in Figure 8.
27
Figure 6 Hydrate formation curve for pure component (Campbell, 1984)
Figure 7 Hydrate formation curve for mixtures and the phase envelope (Campbell, 1984)
This method although quick has drawbacks. It is not recommended for use when the mixture has
nitrogen, hydrogen sulfide and carbon dioxide. Also, it is not recommended to extrapolate the graphs
for natural gas mixtures with relative densities above 0.8. This is because C2+ components for higher
molecular weight mixtures can significantly change the hydrate formation temperature.

28
Figure 8 Natural Gas Hydrates - formation conditions (Campbell, 1984)
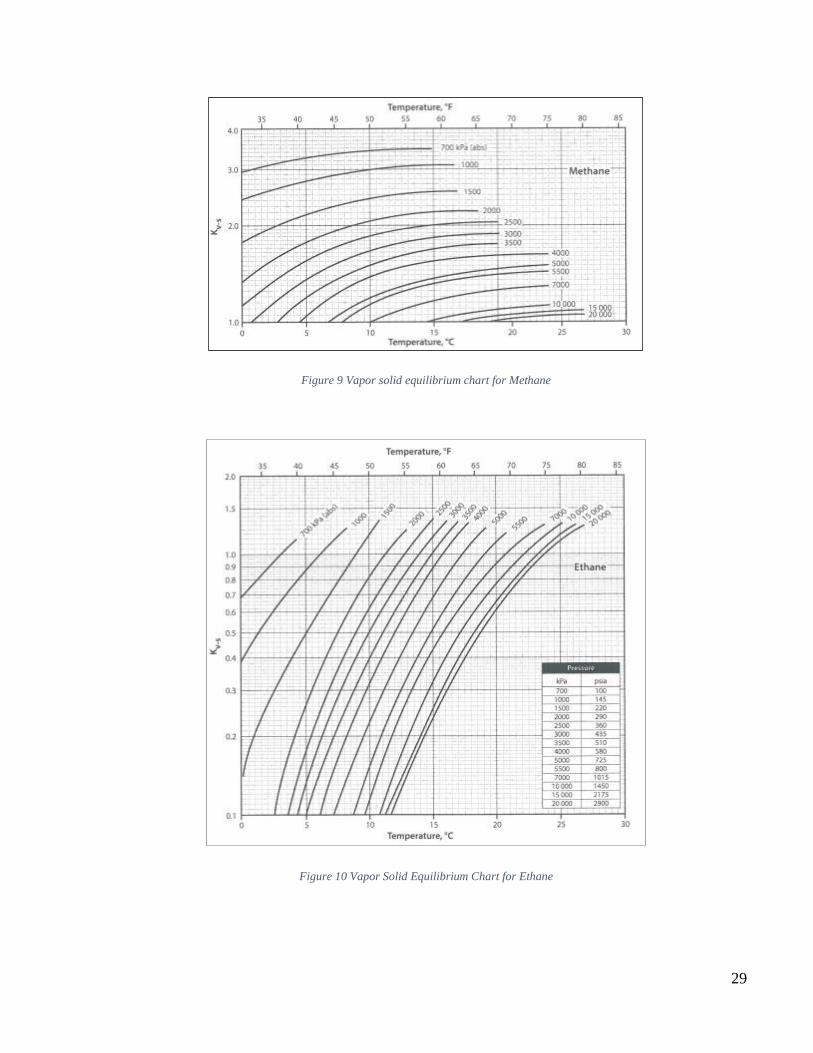
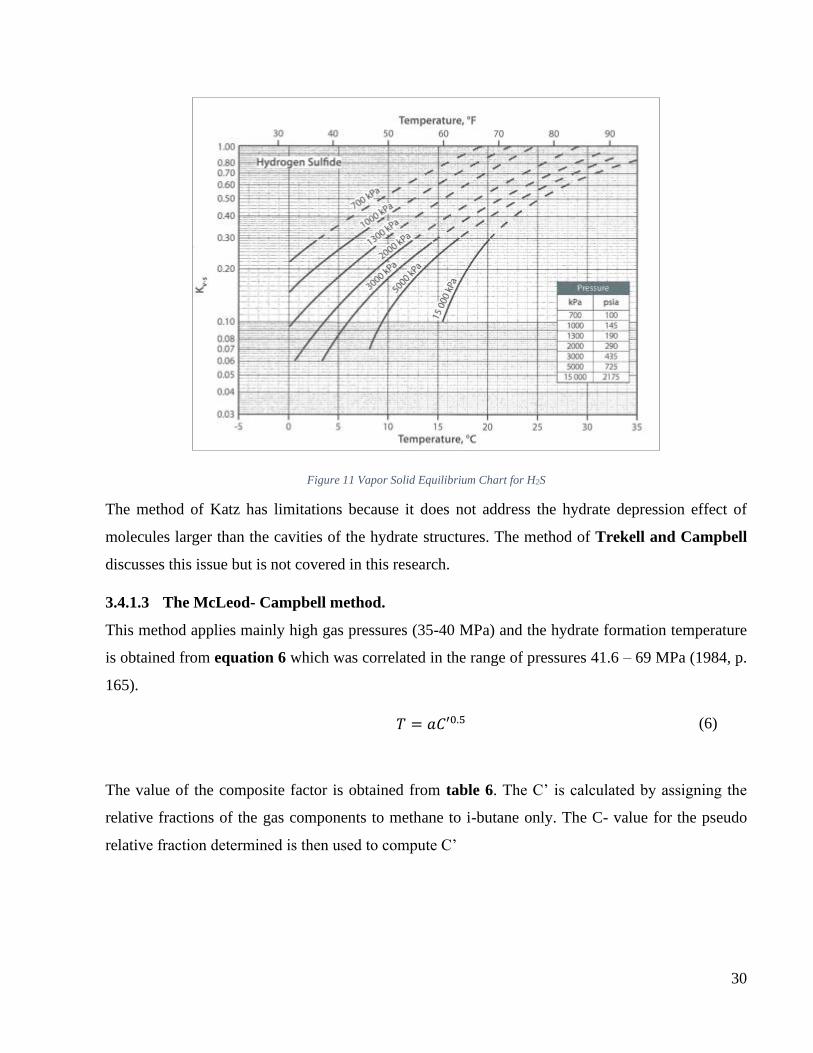
3.4.1.2 Using Vapor-Solid Equilibrium constants
These charts were developed by Katz and some of his coworkers (Campbell, 1984, p. 161). They
developed Kv-s equilibrium constants to be used in hydrate prediction. The method has proven
accurate up to Kv-s values = 1.0 but the accuracy reduces when pressures exceed 7.0 MPa. The method
was developed for sweet natural gas and so the use in mixtures with high concentrations of H2S and
CO2 is not recommended. When Kv-s values are known for all the components, it is possible to perform
dew-point calculations. Note: the Kv-s values for non-hydrate formers is taken as infinity. Equation
5 must be satisfied at the system’s conditions which dictate hydrate formation:
∑𝑦𝑖
𝐾𝑣−𝑠⁄ = 1.0
(5)
yi is the mole fraction of the component in the vapor phase. The calculation involves iterations at
various T and P. An initial value of T is assumed and then Kv-s values are obtained from the chart
functions at the assumed temperature and system pressure. If equation 5 above is not satisfied,
another value is assumed for T and the process is repeated until the equation is satisfied. Some Kv-s
charts are shown in Figures 9-11.
29
Figure 9 Vapor solid equilibrium chart for Methane
Figure 10 Vapor Solid Equilibrium Chart for Ethane
30
Figure 11 Vapor Solid Equilibrium Chart for H2S
The method of Katz has limitations because it does not address the hydrate depression effect of
molecules larger than the cavities of the hydrate structures. The method of Trekell and Campbell
discusses this issue but is not covered in this research.
3.4.1.3 The McLeod- Campbell method.
This method applies mainly high gas pressures (35-40 MPa) and the hydrate formation temperature
is obtained from equation 6 which was correlated in the range of pressures 41.6 – 69 MPa (1984, p.
165).
𝑇 = 𝑎𝐶′0.5 (6)
The value of the composite factor is obtained from table 6. The C’ is calculated by assigning the
relative fractions of the gas components to methane to i-butane only. The C- value for the pseudo
relative fraction determined is then used to compute C’

31
Table 6 McLeod - Campbell Component Factors (Campbell, 1984, p. 166)
As mentioned earlier, the presence of acid gases like H2S and CO2 can introduce errors into the
prediction of hydrate formation conditions. Therefore, the correlations earlier discussed are not
reliable or sour gas mixtures. Baille and Wichert (1987) devised a method for the determination of
the hydrate forming conditions of gases with content of H2S. The charts are available in the Appendix
B (Campbell, 1984, p. 166).
The effect of CO2 on the hydrate formation temperature depends on the gas composition (1984). For
example, the hydrate formation temperature at a given pressure is slightly higher for a gas mixture of
methane and CO2 compared to pure methane. For gases with considerable amount of sour gases,
Campbell (1984) recommends the use of equations of state that is verified with experimental data.
Generally, in the prediction of hydrate forming conditions, the use of equations of state (EoS) are
more accurate than the empirical correlations that have been previously discussed under
determination of water content.
METHODS OF PREVENTING HYDRATES
Many methods are available for drying natural gas and hence prevent hydrate formation. According
to the Handbook of Natural Gas Engineering (Bölkény & Konyha, 2015; Katz et al., 1959), industry
wide methods in use are –
▪ Adsorption
▪ Absorption
▪ Mechanical refrigeration
▪ Cooling and Compression
▪ Using Chemical Absorbents
▪ Keeping the system conditions i.e. pressure and temperature outside the hydrate formation
region.

32
Since the focus of this research is on using absorbents such as glycols to inhibit the formation of gas
hydrates (a form of dehydration), the other methods would only be touched on briefly.
Adsorption involves the use of desiccants like silica gel, alumina and bauxite.
Dehydration by Cooling involves the decrease of the saturation water content by cooling the gas.
The water content is decreased either by pressure increase or temperature reduction. Hot gases
saturated with water vapor may be dehydrated by directly cooling the gas. After gas compression, the
gas stream is cooled to remove the condensed water. Unless the cooling reduces the gas to
temperatures below the minimum temperature that will be encountered in the system at the prevailing
pressure, then cooling does not prevent the further condensation of water.
Chemical reactions are also very effective. The chemicals used have high reactivity with water and
reduce the saturated water content of hydrants such that very low water vapor pressures are achieved.
The drawback of using chemicals is that they are very difficult to recover thereby making their usage
uneconomical; hence they are mainly used in the laboratory in determination of water in gases.
Keeping control of transporting conditions requires placing thermal stations along pipelines and
transporting gas with low pressures. This increases operational costs and the specified delivery
pressures cannot be achieved.
3.4.2.1 Absorption (Dehydration) Process
The process of absorption is a physical process that is accomplished by dehydrating the gas stream
with chemicals or inhibition of the condensed water phase with chemicals. The dehydration process
removes the water in form of water vapor. This method of drying is the most suitable however it has
economic constraints (1984, p. 170). As an alternative, the free water is allowed to remain in the pipes
and processing plants. This makes it imperative to inhibit this free water in the case that the
temperature of the system falls below hydrate forming conditions. In addition, dehydration is more
common on offshore operations but less common in onshore operations.
A liquid suitable for absorption must meet the following basic requirements according to (Katz et al.,
1959, p. 604):
▪ High affinity for water
▪ Low cost
▪ Non corrosiveness
33
▪ Stability towards gas components
▪ Stability during regeneration
▪ Ease of regeneration
▪ Low or moderate viscosity
▪ Low vapor pressure at contact temperature
▪ Low solubility for natural gases and hydrocarbon liquids
▪ Low foaming or emulsifying tendencies
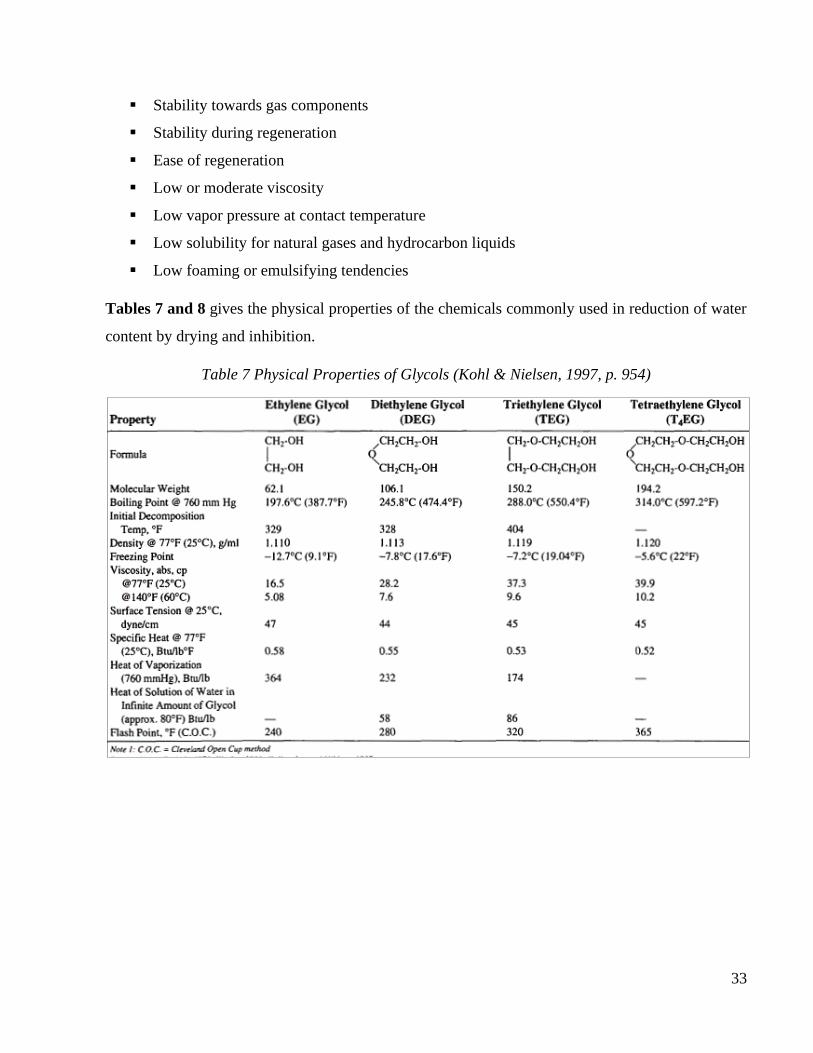
Tables 7 and 8 gives the physical properties of the chemicals commonly used in reduction of water
content by drying and inhibition.
Table 7 Physical Properties of Glycols (Kohl & Nielsen, 1997, p. 954)

34
Table 8 Physical Property of Methanol (Campbell, 1984; Physical Properties of Methanol, n.d.)
Methanol
Formula CH3-OH
Molecular Weight 32
Density [g/cm3] @ 25 oC 0.80
Boiling Point @ 101.325kPa
[oC] 64.6
Freezing Point [oC] -93.9
Viscosity at 0oC [cP] 0.79
3.4.2.1.1 Glycol Selection
The choice of the type of glycol employed is judged by which can meet the requirements (hydrate
depression temperature and dew point) at a lower cost. In applications where the liquid is directly
injected into the pipelines to prevent hydrates downstream of the point of injection, viscosity of the
liquid agent is more important when compared to its dehydration ability. Methanol, MEG and DEG
are used in these applications. The higher glycols are used for higher temperature applications where
excessive vaporization of DEG is probable (Kohl & Nielsen, 1997, p. 953).
Triethylene glycol (TEG) is widely used in the industry for dehydration operations, but at temperature
ranges below 50oF, diethylene glycol is preferred because high viscosity of TEG in this temperature
range (1997, p. 953).
Water and glycol show complete mutual solubility in the liquid phase. This high affinity may be
attributed to O-H bonds that are set up between the hydroxyl groups of the glycol and the water.
Experimental data on the liquid vapor equilibrium of glycol-water systems reveal that they exert very
low water vapor pressures hence the vapor pressure of water in equilibrium with various
concentrations of glycol can be presented by plotting water dewpoint against contact temperature for
various glycol concentrations.

35
3.4.2.2 Hydrate Prevention by Inhibition
Hydrates can be prevented by inhibition of any free water which condenses out of the gas phase. It is
different from dehydration because in this case although free water is present in the stream, it is not
able to cause crystallization. The principal liquids used as inhibitors are methanol, mono ethylene
glycol and diethylene glycol. Table 9 provides a relative comparison between these substances.
3.4.2.2.1 Types of Chemical Inhibitors
Chemical Inhibitors are classified into two categories:
1. Thermodynamic Inhibitors
2. Low dosage Hydrate inhibitors (LDHI)
The LDHIs are of two types – Anti-agglomerates (AA) and Kinetic hydrate inhibitors (KHI). These
were developed in the 90s. AAs do not prevent hydrate formation but prevent the agglomeration of
small solid crystals to form larger plugs. KHIs retard the formation of hydrates by increasing the time
Table 9 Inhibitors for Hydrate prevention (adapted by author from (Kohl & Nielsen, 1997, p. 999))
Hydrate suppression by Injector Inhibition
Inhibitor Minimum Temperature Remarks
Methanol -95oC to -106oC Severe loses occur in the vapor
phase (above -29oC)
Ethylene Glycol -42oC
Significant vapor losses above
-1oC. The loss to vapor and
hydrocarbon liquid is less than
methanol
Di-ethylene glycol and tr-
ethylene glycol -23oC
They are used systems with
low pressure and when the
losses of MEG are significant
or if the system includes a
DEG/TEG dehydrator.

36
it takes for hydrates to form. They do this by ensuring that the host molecules are unable to form the
cages. They can be used at concentrations in the 1% range in the aqueous phase and they are non-
volatile (Kidnay et al., 1995, p. 45). The proper dosage of KHIs must be determined empirically to
avoid excess application leading to the enhancement of hydrate formation rates. They are limited to
a hydrate depression of 15.5oC (25oF). Some authors have recommended a maximum hydrate
depression of 11oC for these inhibitors (1995, p. 45).
3.4.2.2.2 Thermodynamic Inhibition
Thermodynamic inhibitors reduce the hydrate formation temperature. Examples are methanol,
monoethylene glycol and diethylene glycol. The glycols are easily recoverable but the economics of
recovery of methanol make it unfavorable.
3.4.2.2.3 Refrigeration systems utilizing glycol systems
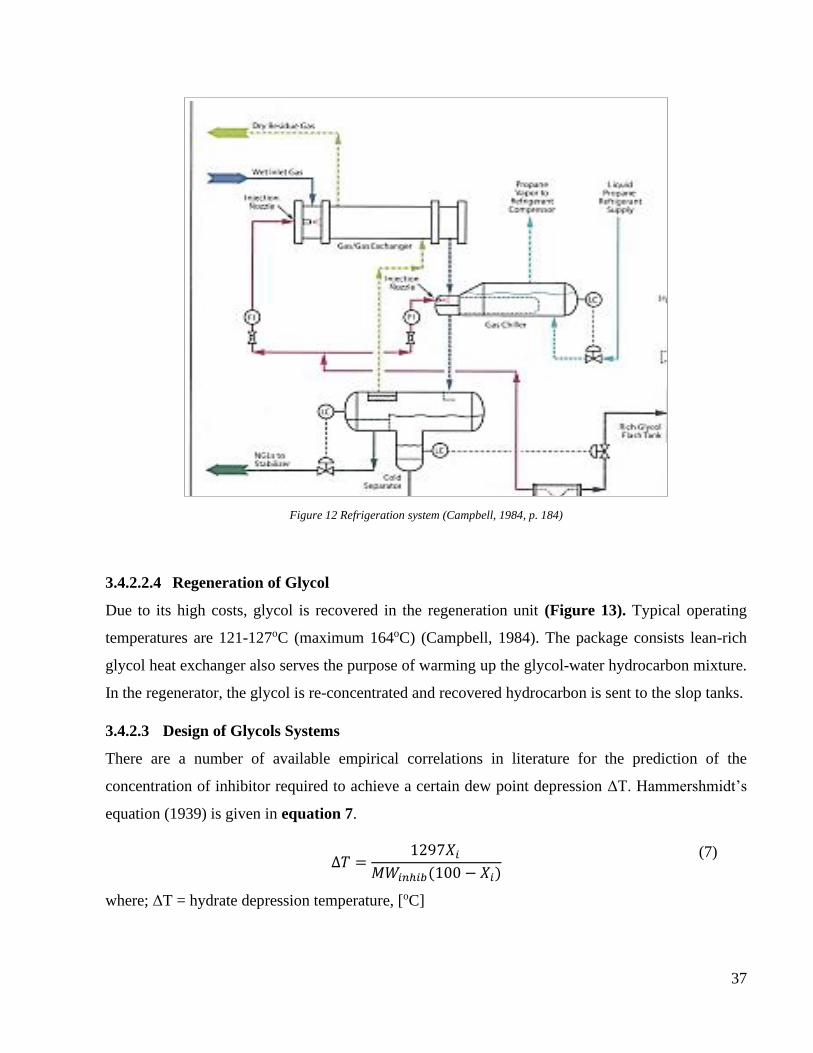
Figure 12 shows the mechanical refrigeration system set-up showing the basic elements. The
construction of the heat exchangers can be shell and tube, plate or brazed aluminum. As the glycol
is injected, mixing is important along the flow path of the gas. To achieve this, it is sprayed on the
tube sheet of the heat exchanger so that a good distribution is ensured into all the tubes. Typical
injection rates exceed the actual required (2-3 times). The injection is necessary to reduce the hydrate
temperature of the gas before it goes for cooling by refrigeration or expansion in JT valves.
The next step in the process involves cooling. It results in the condensation of water and liquid
hydrocarbons. The glycols absorb the water and the leaving the condensate liquids. The mixture
comprising the gas, liquid and rich glycol then flows into the separator. In the separator, the glycol
and condensed water phase are separated from the liquid hydrocarbons. Studies from previous
researchers suggest that the equilibrium metastable dewpoint of the gas is lower than the lowest
temperature of the LTS at the prevailing temperature (1984, p. 183).
Another very important consideration in the design and rating of the exchangers system is the increase
in viscosity of glycol at low temperatures. To mitigate this, some plant designs have heaters installed
downstream of the separator to increase the temperature of the underflow coming from it. Separator
design must ensure that efficient separation of glycol-water mixture from hydrocarbons. The degree
of separation impacts the regeneration (re-concentration) of the glycol in the regenerator package.
The freezing point of lean glycol must also be lower than the lowest temperature encountered in the
system but it must be within the eutectic temperature range (usually 75-80 weight%).
37
Figure 12 Refrigeration system (Campbell, 1984, p. 184)
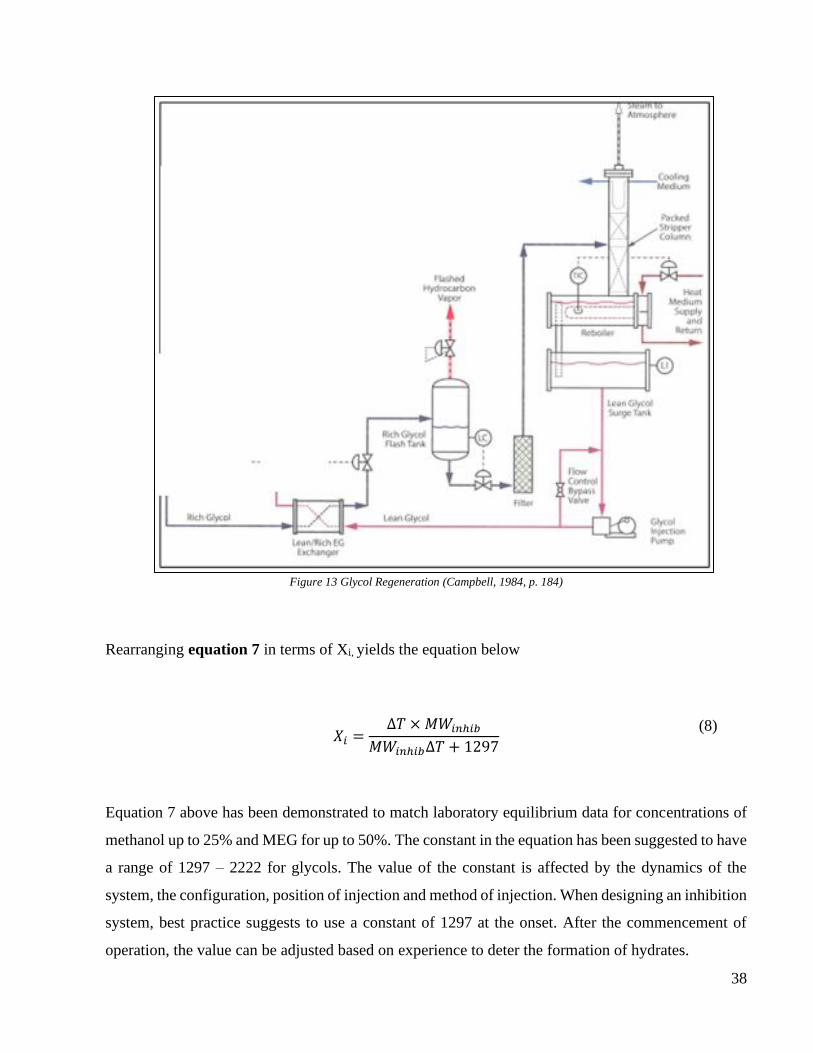
3.4.2.2.4 Regeneration of Glycol
Due to its high costs, glycol is recovered in the regeneration unit (Figure 13). Typical operating
temperatures are 121-127oC (maximum 164oC) (Campbell, 1984). The package consists lean-rich
glycol heat exchanger also serves the purpose of warming up the glycol-water hydrocarbon mixture.
In the regenerator, the glycol is re-concentrated and recovered hydrocarbon is sent to the slop tanks.
3.4.2.3 Design of Glycols Systems
There are a number of available empirical correlations in literature for the prediction of the
concentration of inhibitor required to achieve a certain dew point depression ΔT. Hammershmidt’s
equation (1939) is given in equation 7.
∆𝑇 =
1297𝑋𝑖
𝑀𝑊𝑖𝑛ℎ𝑖𝑏(100 − 𝑋𝑖)
(7)
where; ΔT = hydrate depression temperature, [oC]
38
Figure 13 Glycol Regeneration (Campbell, 1984, p. 184)
Rearranging equation 7 in terms of Xi, yields the equation below
𝑋𝑖 =
∆𝑇 × 𝑀𝑊𝑖𝑛ℎ𝑖𝑏
𝑀𝑊𝑖𝑛ℎ𝑖𝑏∆𝑇 + 1297
(8)
Equation 7 above has been demonstrated to match laboratory equilibrium data for concentrations of
methanol up to 25% and MEG for up to 50%. The constant in the equation has been suggested to have
a range of 1297 – 2222 for glycols. The value of the constant is affected by the dynamics of the
system, the configuration, position of injection and method of injection. When designing an inhibition
system, best practice suggests to use a constant of 1297 at the onset. After the commencement of
operation, the value can be adjusted based on experience to deter the formation of hydrates.
39
Nielsen and Buklin (1983, p. 71) also proposed the following equation for methanol concentrations
up to 80% and MEG concentrations up to about 70% (1984):
∆𝑇 = −72 × (1 − 𝑥𝑚) (9)
3.4.2.4 Determination of Inhibitor injector rate:
The required inhibitor injection rate is determined from the equation 10.
𝑚𝐼 = 𝑚𝑤(
𝑋𝑖
𝑋𝑙 − 𝑋𝑖) (10)
The concentration of inhibitor in the lean phase is usually 100% for methanol and 60-80% for glycols.
In gas processing facilities, the weight percent of inhibitor in the rich phase is set based on two criteria:
(1) sub-cooling and (2) mixing. Usually the latter dictates the concentration and it is specified based
on a dilution ratio of 10% maximum for Xl to Xi.
3.4.2.5 Inhibitor loses to the Hydrocarbon Phase
Due to the solubility of inhibitor in the hydrocarbon phase, loses may occur. According to Campbell,
a useful guideline for estimating glycol loses in the vapor phase of the hydrocarbon is 3.5L/106 std
m3 but no losses occur in the liquid phase (1984, p. 174). The Engineering Data Book (GPSA, 2004)
suggests that vaporization loses of glycol can be ignored and a solution loss of 0.07 kg/m3 of NGL is
a commonly acceptable estimate for design purposes (1995, p. 46). Campbell (1984) suggests that the
entrainment of glycol can however be significant especially if the separation equipment is not
performing optimally.
Methanol loses in the vapor phase are however higher than glycol because it is more volatile. Figure
14 shows a chart that can be used to estimate the loses which is based on data from (Ng et al., 1988;
Ng & Chen, 1995; Aicher & Gray, 2000; Jacoby, 1953; Richon et. al, 2008) (Campbell, 1984)
To use the chart, the K value is obtained at the system temperature and pressure; the losses are then
computed with Equation 11
𝑘𝑔𝑀𝑒𝑂𝐻
106 𝑠𝑡𝑑 𝑚3= 1.35 × 10⁶(𝐾)(𝑥)
where x = mole fraction of methanol in solution
(11)

40
Figure 14 Estimation of methanol losses to vapor phase (determination of K value)
(Campbell, 1984, p. 175)
It is common to assume that if there are negligible amounts of aromatics in the condensate, then the
loses are minimal. If, however, the concentration of aromatics is significant; the solubility of methanol
is a strong function of the composition of water phase and hydrocarbon phase. Figure 15 reproduced
from (Campbell, 1984) is made to estimate the loses to the liquid phase.
Effects of Salts and other contaminants on the Glycol performance
Salts present in produced water are capable of lowering the hydrate formation temperature with or
without the presence of hydrate inhibitors (1984, p. 174). For example, NaCl, and CaCl2 can give a
higher hydrate formation temperature depression than methanol. The hydrate suppression of KCl is
the lowest. However, the presence of these impurities also affects the operation of the heat exchangers
and can contaminate the glycol. The paper presented by Elhady (2005, p. 2) includes
recommendations to mitigate glycol contamination by solids and salts. The salt impurities deposit on
the inner sides of the tube in the reboiler and reduce the area available for heat conduction. If salt
contamination is unavoidable, then the glycol must be purified by filtration or ion exchange. Asides
from salt contamination, we can also have contamination from the glycol degradation or from
surfactants in the gas stream. They can be removed using filters like activated charcoal. Alternatively,
they are also removed by distillation in vacuum.
Depending on the particle size distribution, several filters with cuts ranging from 25-50 microns and
even 1 micron are available options. Frequent shutting down of the plant is also recommended to
clean out nozzles blocked as a result of contamination (2005)

41
Figure 15 Liquid-liquid distribution ratio for methanol and hydrocarbons
(Campbell, 1984, p. 176)
Comparison of Glycols
Elhady (2005) suggests that MEG is a better choice for hydrate inhibition than DEG. In practice,
MEG is more commonly utilized in refrigeration and Joule-Thompson (JT) plants. In his paper, he
sums up advantages of MEG over DEG as shown below –
▪ It gives a better hydrate formation temperature depression per pound of due to its lower
molecular weight.
▪ MEG has a lower viscosity at lower temperatures than DEG.
▪ It has a lower solubility in the liquid hydrocarbon phase.
▪ The freezing point of MEG-water solutions gives it a wider operation range.
▪ It is cheaper than DEG.
However, under warmer operational conditions, DEG has a lower vaporization than MEG.
3.4.4.1 Comparing Methanol and Glycols
Although the two substances are used to inhibit hydrate formation in pipelines and in processing
facilities, they have relative advantages and disadvantages over each other.

42
3.4.4.1.1 Advantages of Methanol
• It is relatively inexpensive.
• It has very low freezing point.
• It requires lower concentrations in the aqueous phase.
• It has low viscosity than glycols.
• It is transported in the vapor phase after injection which enhances mixing with the natural gas
mixtures and dissociation of hydrates downstream of the injection point.
3.4.4.1.2 Disadvantages of Methanol
• The loses to the vapor phase is high.
• Asides from loses, it causes contamination of the vapor and liquid hydrocarbon phases.
• It has a higher toxicity than the glycols.
• It is a flammable liquid (low flash point).
• It is difficult to regenerate.
3.4.4.1.3 Advantages of Glycols
• The liquid has low vapor pressures and so the loses to the vapor phase is insignificant.
• High flash point so not as flammable as methanol
• Can be easily regenerated.
• They are less toxic than methanol.
• They are not considered as contaminants in hydrocarbons.
3.4.4.1.4 Disadvantages of Glycols
• They are more expensive than methanol.
• Salts and solids in the produced water can contaminate the glycol in the regeneration package
necessitating the need for special designs.
• They have higher viscosities making their separation from liquid hydrocarbons difficult.
• They are transported in the liquid phase and so are less efficient in dissociating hydrates.
• They require higher concentration in the aqueous phase.
The two inhibitors types are hazardous and strict regulations guides their disposal onshore and
offshore. MEG is stored in warm storage vessels in cold weather because of its high viscosity but this
is not an issue for methanol. The presence of MEG in the discharge water on offshore platforms gives

43
it a false result when the discharge water is tested for oil and grease. Methanol is used mostly in
intermittent operations while glycols are used in continuous operations.
Effect of Freezing Point and Concentration on Glycols
Glycols do not form solids when they freeze but form a mushy-like liquid. For the optimum
performance of glycol-water systems, freezing of the glycol solution should be avoided. The Figure
16 shown is a graph adapted from Campbell (Campbell, 1984) and shows the variation of freezing
point of MEG with concentration. In order to avoid problems with freezing of the glycol solution, the
operating points must always be between the lines at a given temperature (freezing point).
Furthermore, it can be seen that a concentration of 60-70% by weight is safe at all temperature points.
As earlier mentioned, the general practice is to inject a lean fluid which contains 20-30 weight %. of
water.
Dew point depression
This term is used to measure the effectiveness of a dehydrating solution. It is the difference in
temperature between the dehydrated gas and the contact temperature. The value is fairly constant for
a given dehydration system over a fairly wide range of temperature and pressure (Kohl & Nielsen,
1997, p. 952). Note: the water vapor pressure over dehydrating solutions normally varies with
temperature in approximately the same way as vapor pressure of pure water.
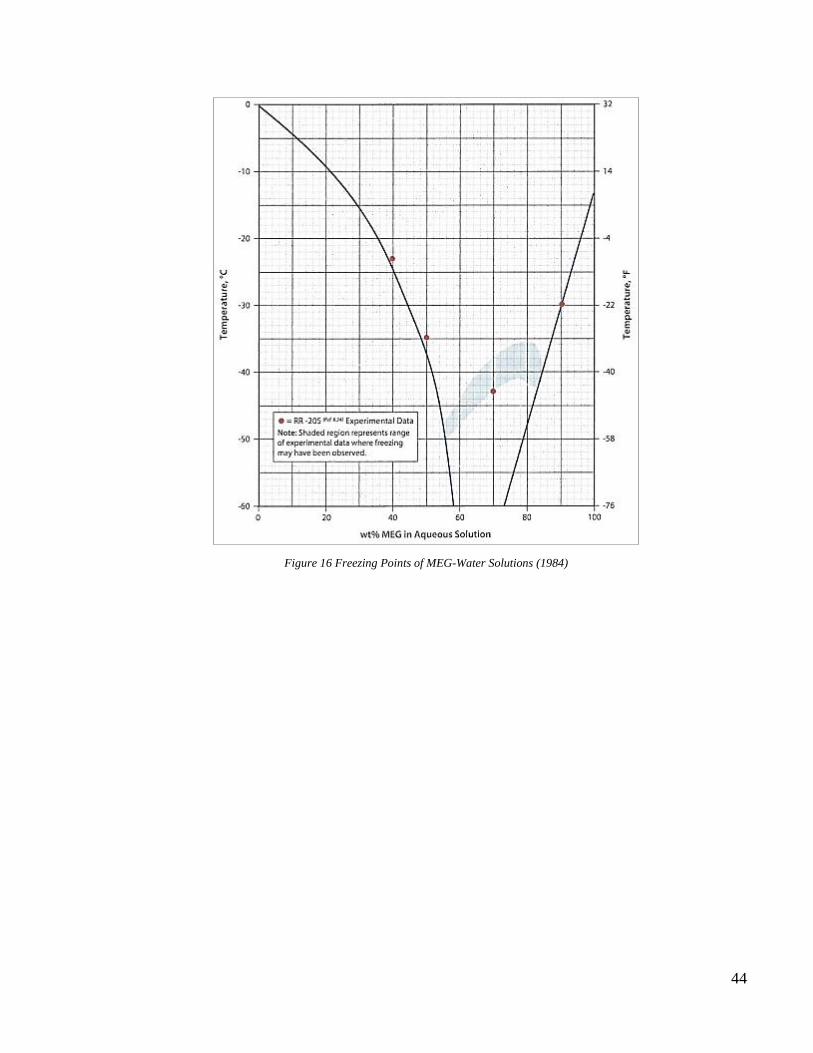
44
Figure 16 Freezing Points of MEG-Water Solutions (1984)
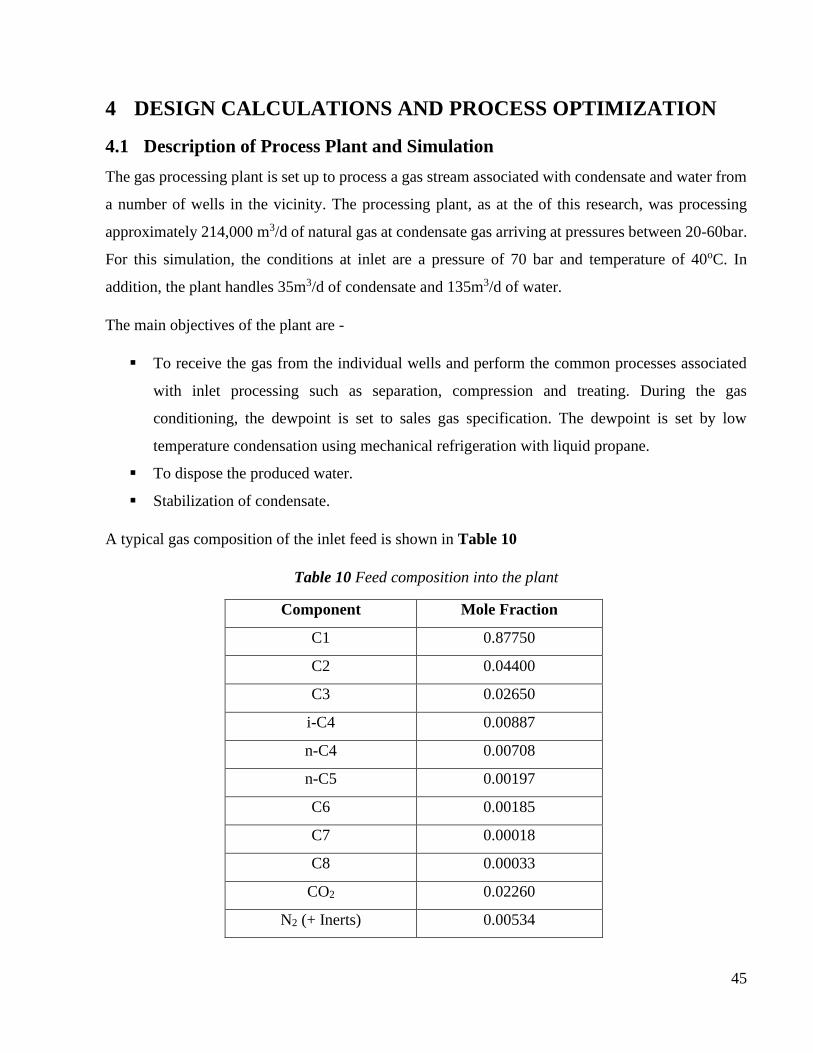
45
4 DESIGN CALCULATIONS AND PROCESS OPTIMIZATION
4.1 Description of Process Plant and Simulation
The gas processing plant is set up to process a gas stream associated with condensate and water from
a number of wells in the vicinity. The processing plant, as at the of this research, was processing
approximately 214,000 m3/d of natural gas at condensate gas arriving at pressures between 20-60bar.
For this simulation, the conditions at inlet are a pressure of 70 bar and temperature of 40oC. In
addition, the plant handles 35m3/d of condensate and 135m3/d of water.
The main objectives of the plant are -
▪ To receive the gas from the individual wells and perform the common processes associated
with inlet processing such as separation, compression and treating. During the gas
conditioning, the dewpoint is set to sales gas specification. The dewpoint is set by low
temperature condensation using mechanical refrigeration with liquid propane.
▪ To dispose the produced water.
▪ Stabilization of condensate.
A typical gas composition of the inlet feed is shown in Table 10
Table 10 Feed composition into the plant
Component Mole Fraction
C1 0.87750
C2 0.04400
C3 0.02650
i-C4 0.00887
n-C4 0.00708
n-C5 0.00197
C6 0.00185
C7 0.00018
C8 0.00033
CO2 0.02260
N2 (+ Inerts) 0.00534

46
As shown, the gas is categorized as a ‘Lean sweet gas’ because of the high concentration of natural
gas and low quantities of the Natural Gas Liquids (NGL). Furthermore, it is categorized as ‘sweet’
because it contains minimal acid gas constituents – CO2 and H2S.
The focus of the thesis is to optimize the dew point control module and determine which glycol is
best for optimum hydrate formation temperature depression and the required optimum concentration;
the model is set up in the Aspen HYSYS environment to reflect the following main unit processes -
the gas-gas heat exchanger, the chiller, the low temperature separator, and the glycol injection points.
Gas from the inlet receiver is pre-cooled with processed gas coming from the LTS in the gas-gas heat
exchanger before entering into the propane chiller. The chiller cools the gas; water and liquid
hydrocarbon condenses as the gas reaches the dewpoint conditions. 80-82 weight % mono ethyl glycol
is injected upstream and downstream of the heat exchanger. The stream then feeds into the LTS where
the hydrocarbon condensate and the water + MEG (rich phase) are separated from the gas. The dry
gas passes through a coalescing filter to remove any left-over glycol or water in it. The dry gas then
passes through the gas-gas heat exchanger and then into the sales gas pipeline as ‘market gas’. The
separated liquid hydrocarbon is sent to the stabilization units of the plant while the rich glycol sent to
the regeneration unit. A heat exchanger is usually included at the underflow of the LTS to warm the
rich glycol-water mixture. The regeneration unit comprises of a Reboiler, lean MEG-rich MEG heat
exchanger, flash drum, MEG filter, carbon filter, MEG injection pump and a condenser. The
regenerated glycol is then re-circulated to the dewpoint control module. Usually the trace gas
recovered from the MEG flash drum is sent to the flare (see Appendices A-1 and A-2).
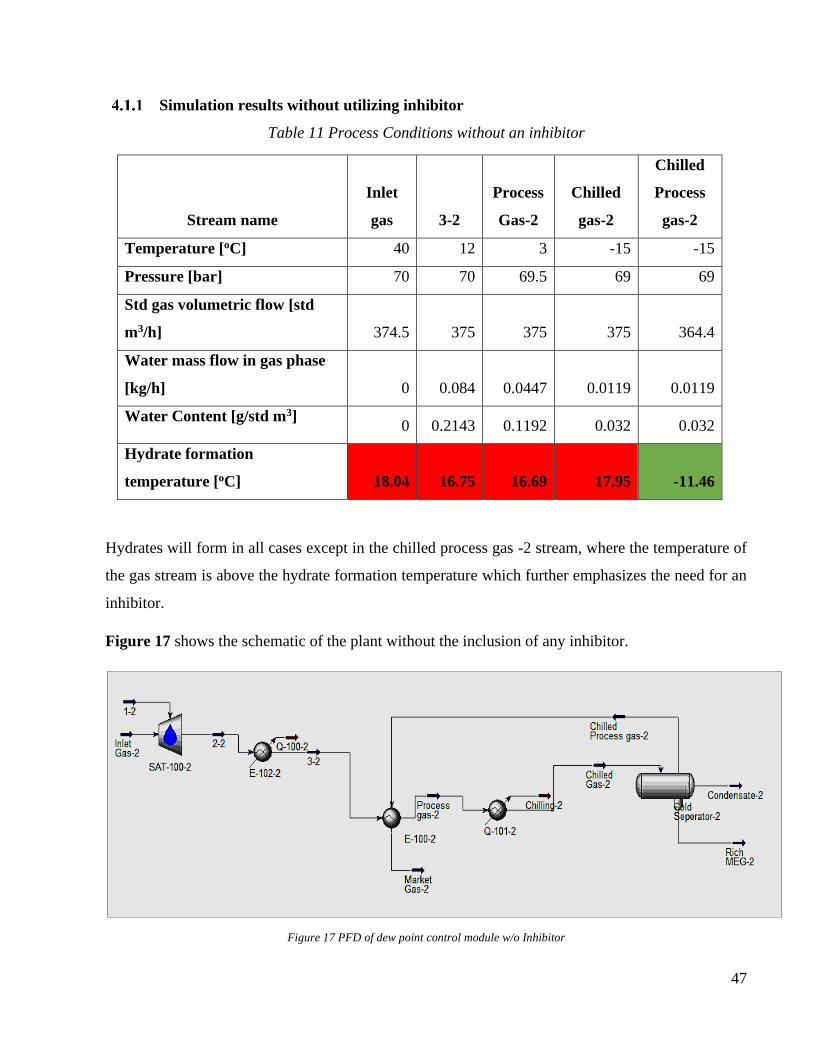
47
Simulation results without utilizing inhibitor
Table 11 Process Conditions without an inhibitor
Stream name
Inlet
gas 3-2
Process
Gas-2
Chilled
gas-2
Chilled
Process
gas-2
Temperature [oC] 40 12 3 -15 -15
Pressure [bar] 70 70 69.5 69 69
Std gas volumetric flow [std
m3/h] 374.5 375 375 375 364.4
Water mass flow in gas phase
[kg/h] 0 0.084 0.0447 0.0119 0.0119
Water Content [g/std m3] 0 0.2143 0.1192 0.032 0.032
Hydrate formation
temperature [oC] 18.04 16.75 16.69 17.95 -11.46
Hydrates will form in all cases except in the chilled process gas -2 stream, where the temperature of
the gas stream is above the hydrate formation temperature which further emphasizes the need for an
inhibitor.
Figure 17 shows the schematic of the plant without the inclusion of any inhibitor.
Figure 17 PFD of dew point control module w/o Inhibitor

48
The existing installation uses 80-82 wt. %. monoethyl glycol for inhibition It is injected before the
gas/gas heat exchanger at a rate of 60 L/h. Typical concentration of lean glycol is 75-80% weight.
The process flow diagram utilized to run the case studies is shown in Figure 18
Figure 18 PFD for the HYSYS Simulation
KEY:
1, 1-2: Water stream
2, 2-2: Saturated gas
3, 3-2: Gas from Inlet Separator
4.2 Predicting the water content of the inlet gas stream using correlations in
literature
Method 1: Calculating mole fraction of water in gas using Raoult’s equation for stream 3-2 (see
figure 17). From equation (1)
𝑦𝑤 = 𝑃𝑣
𝑃
At T = 12oC and P = 7 MPa; Pv of water = 1.402 kPa (obtained from SVP water charts- see Appendix
C-1)
yw = 2.002 x 10⁻⁴
To obtain the concentration in mass per unit volume, the following relationship is used;
49
𝑘𝑔
𝑤𝑎𝑡𝑒𝑟
106𝑠𝑡𝑑 𝑚3 = 761400𝑦𝑤
(12)
Therefore, the concentration of water = 0.152 g/std m3.
Method 2: Using the correlation in Figure 3, the water content at 12oC and 7 MPa is 0.235 g/std m3.
The value of water content obtained from the chart is closer to the value calculated by the simulator
because the Raoult’s law method is valid at pressures that do not exceed 400 kPa and where the gas
is very close to being ideal.
4.3 Predicting the hydrate temperature for the inlet gas stream.
Problem Statement:
The gas that arrives the gas plant is 200,000 std m3/d. The hydrate formation temperature is 17oC and
assuming the lowest temperature expected in the system is -10oC. The gas enters the system at a
temperature of 12oC and pressure of 7 MPa and it exits at -10oC and pressure of 6.9 MPa. The density
of the glycol is 1100 Skg/m3 and the concentration of lean glycol is 82 weight %. Molecular weight
of inhibitor is 62. Calculation of amount of 82 weight % glycol required to prevent formation of
hydrate is as follows -
Solution:
I. The hydrate depression required = {17-(-10)} oC = 27 oC
II. The water content at inlet conditions from charts = 235 kg/106 std m3
III. Water content at the outlet conditions from charts = 56 kg/106 std m3
IV. Mass of water condensed = 200,000 𝑚3
𝑑(
(235−56)𝑘𝑔
106 𝑠𝑡𝑑 𝑚3 ) = 38.433 kg/d
V. The concentration of MEG required in the water phase is calculated with equation 8
𝑋𝑖 =27 × 62
62 × 26.75 + 1297 (100) = 56.12%
VI. Mass of inhibitor is calculated using equation 10
𝑚𝐼 = 38.433 ×56.12
82 − 56.12= 174.65 𝑘𝑔/𝑑
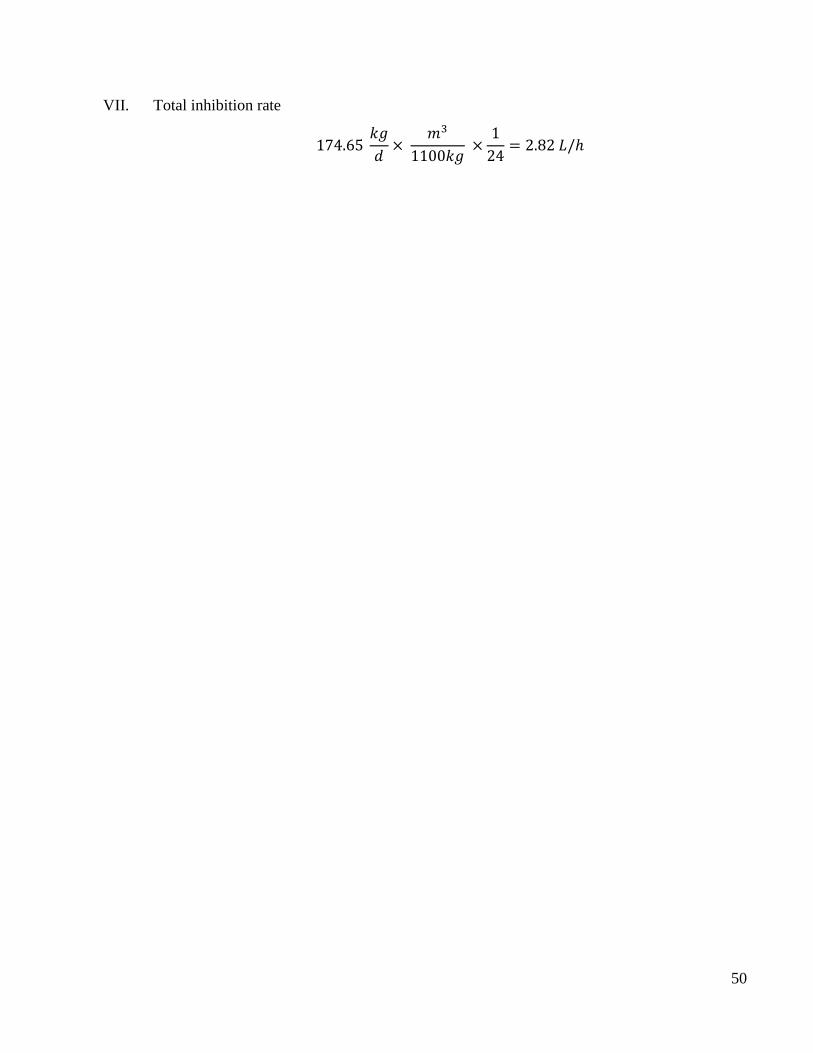
50
VII. Total inhibition rate
174.65 𝑘𝑔
𝑑×
𝑚3
1100𝑘𝑔 ×
1
24= 2.82 𝐿/ℎ
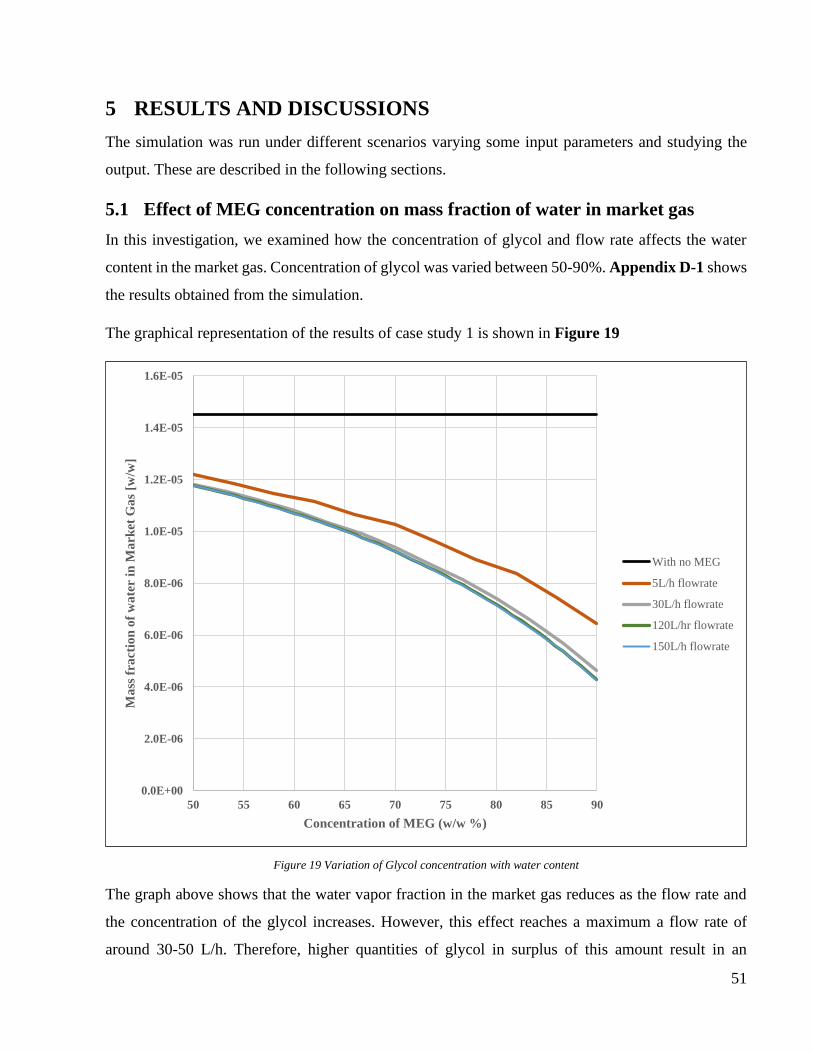
51
5 RESULTS AND DISCUSSIONS
The simulation was run under different scenarios varying some input parameters and studying the
output. These are described in the following sections.
5.1 Effect of MEG concentration on mass fraction of water in market gas
In this investigation, we examined how the concentration of glycol and flow rate affects the water
content in the market gas. Concentration of glycol was varied between 50-90%. Appendix D-1 shows
the results obtained from the simulation.
The graphical representation of the results of case study 1 is shown in Figure 19
Figure 19 Variation of Glycol concentration with water content
The graph above shows that the water vapor fraction in the market gas reduces as the flow rate and
the concentration of the glycol increases. However, this effect reaches a maximum a flow rate of
around 30-50 L/h. Therefore, higher quantities of glycol in surplus of this amount result in an
0.0E+00
2.0E-06
4.0E-06
6.0E-06
8.0E-06
1.0E-05
1.2E-05
1.4E-05
1.6E-05
50 55 60 65 70 75 80 85 90
Ma
ss f
ract
ion
of
wa
ter i
n M
ark
et G
as
[w/w
]
Concentration of MEG (w/w %)
With no MEG
5L/h flowrate
30L/h flowrate
120L/hr flowrate
150L/h flowrate

52
insignificant change in the water content of the gas. As mentioned earlier in this work, the
concentration of glycol used should be in the eutectic region on the glycol freezing point graph to
prevent it from freezing. This concentration is usually between 75-80% by weight. The glycol is
usually used in excess because it is regenerated in the process and losses to the vapor and liquid
hydrocarbon phases are minimal.
5.2 Relative inhibition strength of Glycols based on Concentration at Constant
Flow Rate
The flow rate of the lean glycol solution was held constant at 120 L/h while changing the type of
glycol utilized to investigate which would give the best inhibition and the lowest fraction of water
vapor in the market gas over a concentration range of 50-90% by weight. The results obtained from
the simulator is shown graphically in Figure 20. The tables can be viewed in Appendix D-2.
Figure 20 Comparing the inhibition strength of the glycols
0
0.00001
0.00002
0.00003
0.00004
0.00005
0.00006
45 55 65 75 85 95
Mas
s fr
acti
on o
f w
ater
in m
arket
gas
[w/w
]
Glycol Concentration [w/w%]
MEG
DEG
TEG

53
As seen from the chart Figure 20, DEG gives the result with the lowest water vapor content in the
simulation while TEG gives the highest water vapor content within the same operating range. In
practice however, most plants utilize MEG because of its advantages over DEG such as cost and
lower freezing point. This had been discussed earlier in chapter three.
5.3 Hydrate Formation Temperature of Chilled Gas as a function of Flow Rate
at constant glycol concentration
In this investigation, the concentration of MEG was kept constant at 82% by weight while varying
the flow rate to see the effect of the quantity of glycol on the hydrate formation temperature of the
chilled gas stream which enters into the sales pipeline. Figure 21 is a graphical representation of the
results of the simulation while Appendix D-3 shows the same results in tables.
Figure 21 Glycol flow rate vs Hydration formation temperatureof chilled gas
The results confirm the conclusions made in the first case study. The effect of the amount of injected
glycol on the hydrate temperature of the chilled gas is insignificant beyond 30 L/h.
-25
-20
-15
-10
-5
0
0 20 40 60 80 100 120
Hy
dra
te f
orm
ati
on
tem
per
atu
re [°C
]
Glycol Flow rate [L/hr]
Given: constant glycol concentration
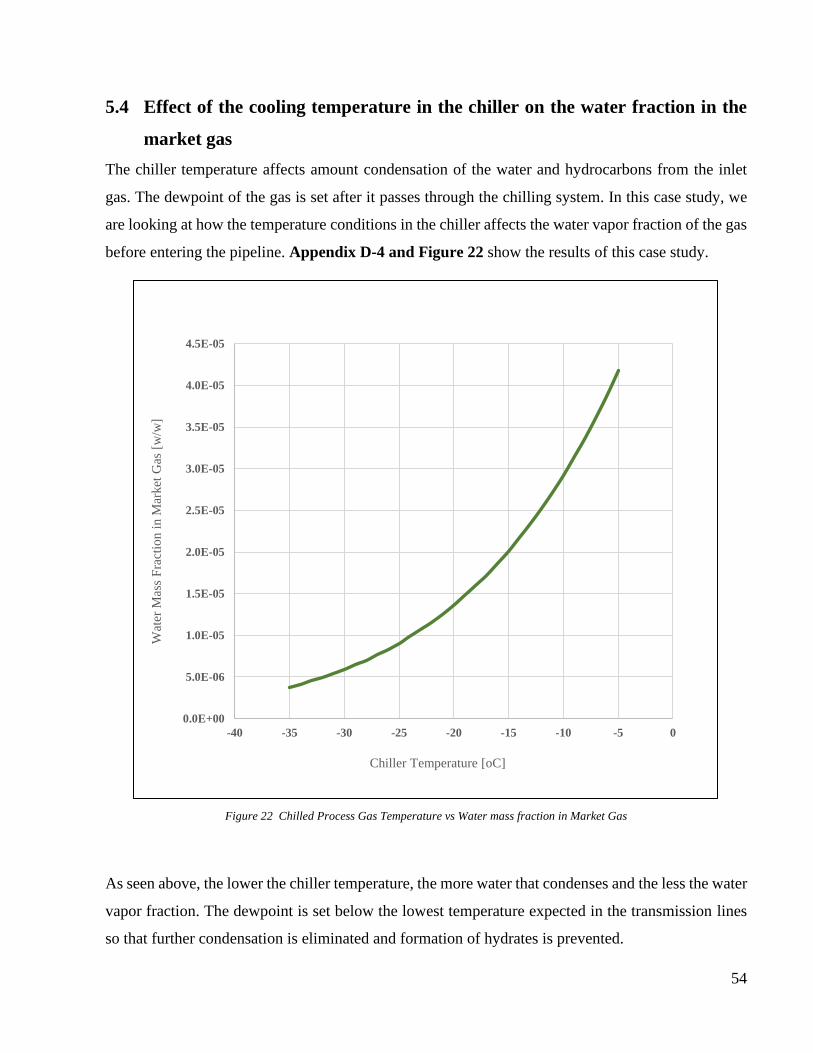
54
5.4 Effect of the cooling temperature in the chiller on the water fraction in the
market gas
The chiller temperature affects amount condensation of the water and hydrocarbons from the inlet
gas. The dewpoint of the gas is set after it passes through the chilling system. In this case study, we
are looking at how the temperature conditions in the chiller affects the water vapor fraction of the gas
before entering the pipeline. Appendix D-4 and Figure 22 show the results of this case study.
Figure 22 Chilled Process Gas Temperature vs Water mass fraction in Market Gas
As seen above, the lower the chiller temperature, the more water that condenses and the less the water
vapor fraction. The dewpoint is set below the lowest temperature expected in the transmission lines
so that further condensation is eliminated and formation of hydrates is prevented.
0.0E+00
5.0E-06
1.0E-05
1.5E-05
2.0E-05
2.5E-05
3.0E-05
3.5E-05
4.0E-05
4.5E-05
-40 -35 -30 -25 -20 -15 -10 -5 0
Wat
er M
ass
Fra
ctio
n i
n M
arket
Gas
[w/w
]
Chiller Temperature [oC]
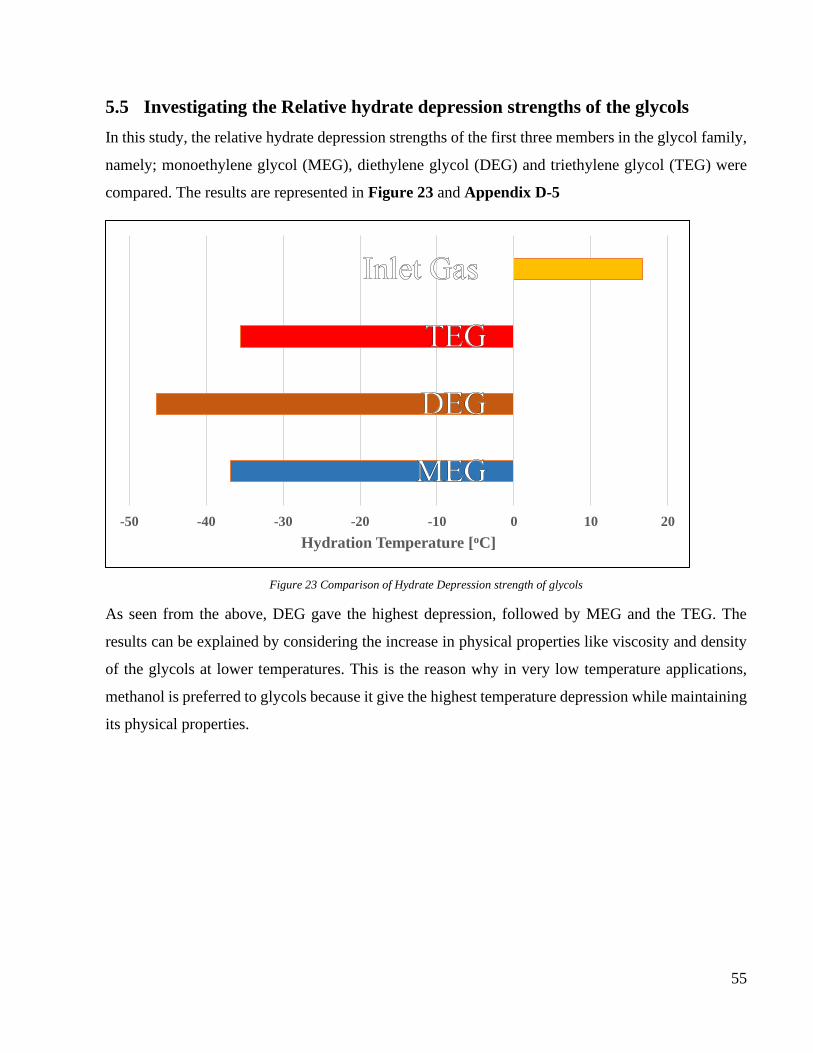
55
5.5 Investigating the Relative hydrate depression strengths of the glycols
In this study, the relative hydrate depression strengths of the first three members in the glycol family,
namely; monoethylene glycol (MEG), diethylene glycol (DEG) and triethylene glycol (TEG) were
compared. The results are represented in Figure 23 and Appendix D-5
Figure 23 Comparison of Hydrate Depression strength of glycols
As seen from the above, DEG gave the highest depression, followed by MEG and the TEG. The
results can be explained by considering the increase in physical properties like viscosity and density
of the glycols at lower temperatures. This is the reason why in very low temperature applications,
methanol is preferred to glycols because it give the highest temperature depression while maintaining
its physical properties.
-50 -40 -30 -20 -10 0 10 20
Hydration Temperature [oC]

56
6 SUMMARY AND CONCLUSIONS
6.1 Glycol Selection
To meet requirements for water content of the gas stream, the plant utilizes monoethylene glycol for
inhibition. However, from the simulation run, it can be seen that a better alternative is by using
diethylene glycol for the following reasons:
▪ DEG gave the best hydrate depression of the 3 glycol types investigated.
▪ It also resulted in the lowest mass fraction of water vapor in the market gas.
6.2 Selection of Concentration of Glycol
The choice of glycol concentration has previously detailed in the earlier part of this work is predicated
on the configuration of the system, the location of injection points and the mixing rate. However,
from literature and the experiential knowledge gathered from industry, it is recommended to use
concentrations within the 75-80 weight % range. From the results obtained in the simulation, the
higher the concentration, the lower the mass fraction of the water in market gas.
6.3 Selection of Flow Rate
Generally, the rate of injection is always in surplus of the theoretical amount. From the case studies,
it was determined that a flow rate of 30 L/h would give approximately the same inhibition as an
injection rate of 120 L/h. The excess should be reduced as much as possible especially because the
glycol may become entrained in the vapor or liquid phases of the hydrocarbon, which could lead to
production of low-quality gas and NGLs which are out of specifications. Furthermore, it could
contribute to problems in separation equipment or plugging of filters.
6.4 Chiller Operating Conditions
The lower the cooling temperature, the lower the mass fraction of water in the market gas. The aim
of the refrigeration which is to set the water and hydrocarbon dewpoint of the gas before entering the
sales pipeline is thus achieved at lower temperatures. The dew point is set to lowest possible
temperature in the pipeline. In determining the operating temperature of the chiller, other factors that
might be considered include energy requirements and the type of coolant utilized.
57
6.5 Conclusions
From the foregoing, the simulation carried out leads to the following conclusions:
• Of the 3 glycols investigated in the simulator, DEG gave the greatest hydrate depression
temperature. The second choice for consideration would then be MEG, and lastly TEG,
• The glycol used in the system has the following effect on the water content of the market (dry)
gas (in descending order with DEG being the highest): DEG > MEG > TEG
• A glycol injection rate of 30-60 L/h is sufficient for the efficient inhibition of the water
condensed out of the gas by refrigeration.
• A glycol weight % range between 75-80% is sufficient for the efficient inhibition.
While the scope of the thesis’ problem statement was attained, it is important to mention that there is
still so much thar can be studied using the simulator. A possible next phase of this investigation would
be including the glycol regeneration package to further investigate the effects of other parameters on
system efficiency thereby optimizing the whole system.

58
7 REFERENCES
» Background NaturalGas.org. (2014, July 9).
https://web.archive.org/web/20140709040340/http://naturalgas.org/overview/background/
Aicher, T. B., & Gray, R. M. (2000, February). Methanol Hydrate Inhibition. Lawrence Reid Gas
Conditioning Conference, University of Oklahoma.
Baillie, C., & Wichert, E. (1987). Chart Gives Hydrate Formation Temperature for Natural Gas.
O&GJ, 85(14).
Bölkény, I., & Konyha, J. (2015, January 1). Prevention of Hydrate Formation On Gas Well.
https://doi.org/10.26649/musci.2015.013.
Campbell, J. (1984). Gas Conditioning and Processing (9th ed., Vol. 1). Campbell Petroleum Series.
Deaton, W. M., & Frost Jr., E. M. (1949). Gas Hydrates and Their Relation to the Operation of
Natural-Gas Pipe Lines. American Gas Association.
Diaz, Z., & Miller, J. H. (1984). Drying Substantially Supercritical CO2 with Glycerol (Patent No.
4,478,612).
Dictionary of Applied Chemistry (Vol. 4). (1928). Longmans, Green & Co.
Ehady, A. A. A. (2005, November). Operating Expenses of DEG and MEG for Hydrate and Dew
point control in Gas Production Offshore Mediterranean. International Petroleum Technology
Conference, Doha, Qatar.
GPSA. (2004). Engineering Data Book Dehydration (12th ed.). Gas Processors Supply Association.
Hammerschmidt, E. G. (1939). Preventing and removing gas hydrate formations in natural gas
pipelines. Oil and Gas Journal, 37(52), 66.
Jacoby, R. H. (1953, May 5). Vapor-Liquid Equilibrium Data for the Use of Methanol in Preventing
Gas Hydrates. Gas Hydrate Control Conference, Norman, OK.
Katz, D. L., Cornel, D., Kobayashi, R., Poettmann, F. H., Vary, J. A., Elenbaas, J. R., & Weinaug, C.
F. (1959). Handbook of Natural Gas Engineering. McGraw-Hill Book Company Inc.

59
Kidnay, A. J., Parrish, W. R., & McCartney, D. G. (1995). Fundamentals of Natural Gas Processing
(2nd ed.). CRC Press.
Kohl, A. L., & Nielsen, R. B. (1997). Gas Purification (5th ed.). Gulf Publishing Company.
McAllister et. al., S. (2011). Fundamentals of Combustion Processes. Springer Science+ Business
Media.
Ng, H. J., & Chen, C. J. (1995). Vapour-Liquid and Vapour-Liquid Equilibria for H2S CO2, Selected
Light Hydrocarbons and a Gas Condensate in Aqueous Methanol or Ethylene Glycol Solutions (RR-
149). GPA/GRI.
Ng, H. J., Chen, C. J., & Robinson, D. B. (1988). The solubility of Methanol or Glycol in Water-
Hydrocarbon Systems Project 825-87 (GPA Report No. 117; p. 11). Gas Processors Association.
Nielsen, R. B., & Bucklin, R. W. (1983). Why not use methanol for hydrate control. Hydrocarbon
Processing, 62(4), 71–78.
Physical Properties of Methanol. (n.d.). Retrieved June 22, 2020, from
https://www.cetinerengineering.com/Properties.htm
Polderman, L. D. (1957). Dehydrating Natural Gas with Glycol. 55, 107–112.
Richon et. al. (2008). Water and Inhibitor Distribution in Gas Product Systems (RR-198). Gas
Processors Association.
Schroeder, W. (1926). A review and discussion of Gas Hydrates. Ahren’s Sammlung Chemischer Und
Chemish-Technischer Vortrage, 28, 21–71.
Swerdloff, W. (1957). Oil and Gas Journal. Oil and Gas Journal, 55, 122–129.
V. J Aimikhe, Joel, A. F., Ikiensikimama, S. S., & Iyuke, S. (2016, August 2). Predicting Water
Content of Sweet Natural Gas—Hydrate systems. SPE Nigeria Annual International Conference and
Exhibition, Lagos, Nigeria.
Villard, P. (1888a). Sur les hydrates de methane et d’ethylene [Hydrates of Methane and of Ethylene.].
Compt. Rend., 107, 395–397.

60
Villard, P. (1888b). Sur quelques nouveaux hydratesde gaz. [Some New Gas Hydrates.]. Compt.
Rend., 106, 1602–1603.
61
8 LIST OF FIGURES
Figure 1 Overview of Natural Gas Processing (Campbell, 1984, p. 25) .............................................. 6
Figure 2 Basic schematic of operations in a gas plant (Modified by author from (Kidnay et al., 1995))
............................................................................................................................................................ 11
Figure 3 Water Content Chart (Campbell, 1984) ............................................................................... 20
Figure 4 Equilibrium water content curves below hydrate formation point ...................................... 21
Figure 5 Water Content Ratios for Sour Gas (Campbell, 1984) ........................................................ 22
Figure 6 Hydrate formation curve for pure component (Campbell, 1984) ........................................ 27
Figure 7 Hydrate formation curve for mixtures and the phase envelope (Campbell, 1984) .............. 27
Figure 8 Natural Gas Hydrates - formation conditions (Campbell, 1984) ......................................... 28
Figure 9 Vapor solid equilibrium chart for Methane .......................................................................... 29
Figure 10 Vapor Solid Equilibrium Chart for Ethane ........................................................................ 29
Figure 11 Vapor Solid Equilibrium Chart for H2S ............................................................................. 30
Figure 12 Refrigeration system (Campbell, 1984, p. 184) ................................................................. 37
Figure 13 Glycol Regeneration (Campbell, 1984, p. 184) ................................................................. 38
Figure 14 Estimation of methanol losses to vapor phase (determination of K value) ....................... 40
Figure 15 Liquid-liquid distribution ratio for methanol and hydrocarbons ....................................... 41
Figure 16 Freezing Points of MEG-Water Solutions (1984) .............................................................. 44
Figure 17 PFD of dew point control module w/o Inhibitor ................................................................ 47
Figure 18 PFD for the HYSYS Simulation ........................................................................................ 48
Figure 19 Variation of Glycol conc with water content ..................................................................... 51
Figure 20 Comparing the inhibition strength of the glycols ............................................................... 52
Figure 21 Glycol flow rate vs Hydration formation temperatureof chilled gas ................................. 53
Figure 22 Chilled Process Gas Temperature vs Water mass fraction in Market Gas ....................... 54
Figure 23 Comparison of Hydrate Depression strength of glycols .................................................... 55
62
9 LIST OF TABLES
Table 1 Uses of Products of Natural gas Processing ......................................................................... 13
Table 2 HHV and LHV of some hydrocarbons (McAllister et. al., 2011) ........................................ 14
Table 3 General Sales Gas Specifications in various Gas markets adapted from (Campbell, 1984, p.
29) ....................................................................................................................................................... 15
Table 4 Effect of H2S and CO2 on Water Vapor Content of Saturated Natural Gas (Kohl & Nielsen,
1997) ................................................................................................................................................... 23
Table 5 Empirical and Semi-empirical correlations for water content (2016) ................................... 24
Table 6 McLeod - Campbell Component Factors (Campbell, 1984, p. 166) ..................................... 31
Table 7 Physical Properties of Glycols (Kohl & Nielsen, 1997, p. 954) ........................................... 33
Table 8 Physical Property of Methanol (Campbell, 1984; Physical Properties of Methanol, n.d.) ... 34
Table 9 Inhibitors for Hydrate prevention (adapted by author from (Kohl & Nielsen, 1997, p. 999))
............................................................................................................................................................ 35
Table 10 Feed composition into the plant .......................................................................................... 45
Table 11 Process Conditions without an inhibitor ............................................................................. 47
63
10 LIST OF SYMBOLS
Symbol Meaning Unit
yw mol fraction of water in vapor phase, [-]
pv vapor pressure at system temperature, [N/m2]
P system pressure, [N/m2]
xw mol fraction of water in liquid phase, [-]
T system temperature, [K], [oC]
yi mol fraction of component, i in vapor phase, [-]
Kv-s vapor-solid equilibrium constant, [-]
a correlation factor for McLeod-Campbell method for hydrate prediction, [-]
C Mcleod- Campbell composite component factor, [-]
ΔT depression of hydrate temperature, [oC]
MWinhib molecular weight of inhibitor, [-]
Xi % weight of inhibitor in the rich liquid water phase of the inhibitor, [-]
Xm mol fraction of inhibitor in the rich liquid water inhibitor solution, [-]
mI mass flow rate of inhibitor solution, [kg/d]
mw mass flow rate of water, [kg/d]
Xl weight % of inhibitor in the aqueous solution (lean phase), [-]
X mol fraction of methanol in solution, [-]
K equilibrium constant for methanol, [-]

64
11 APPENDICES
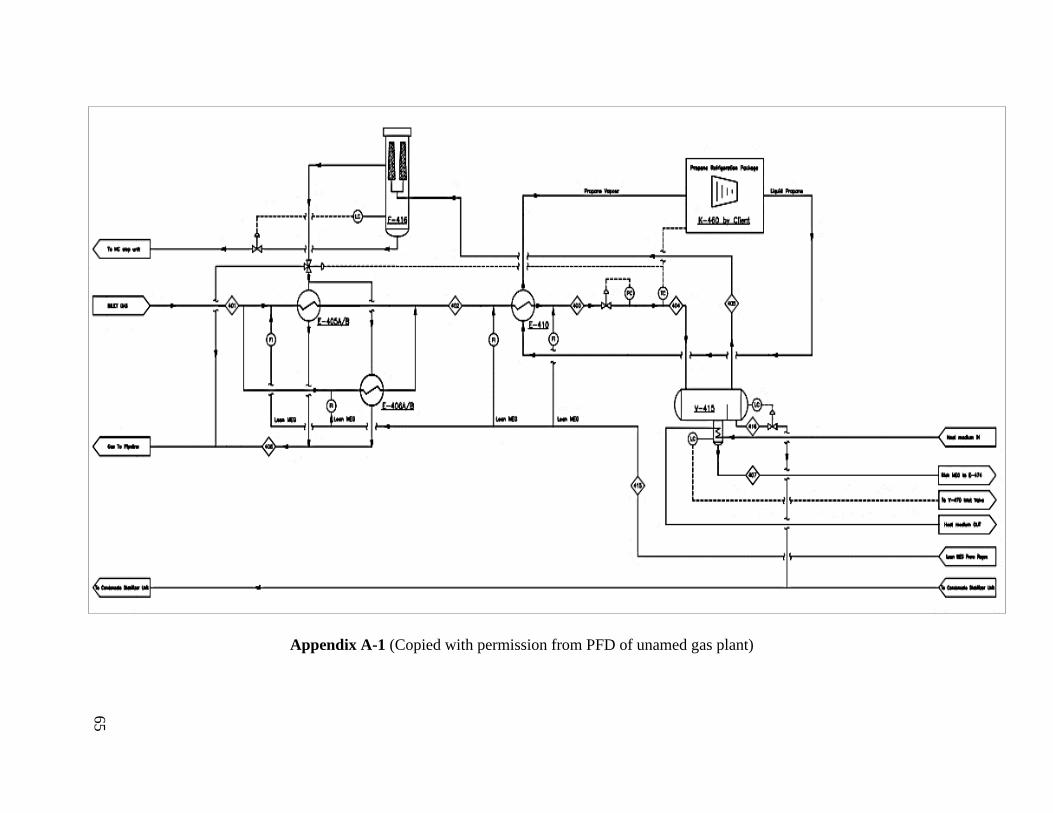
Appendix A-1 (Copied with permission from PFD of unamed gas plant)
65

Appendix A-2 (Copied with permission from PFD of unamed gas plant)
66
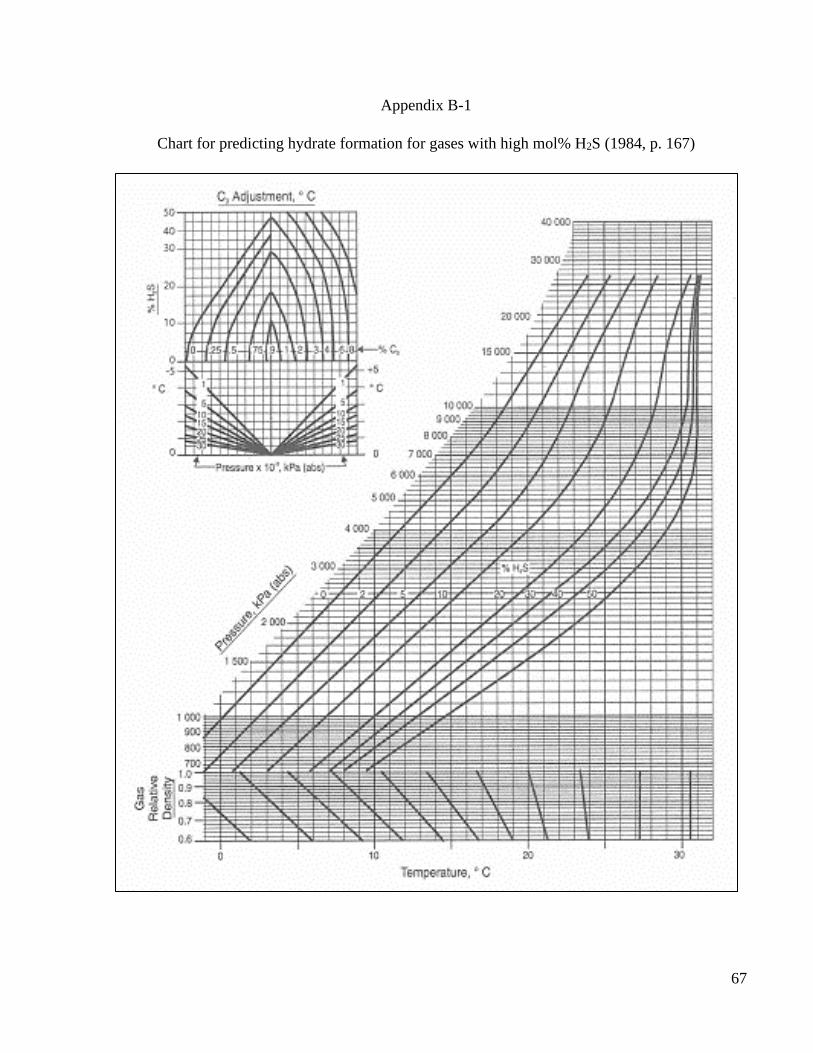
67
Appendix B-1
Chart for predicting hydrate formation for gases with high mol% H2S (1984, p. 167)

68
Appendix C (Source: https://www.engineeringtoolbox.com/water-vapor-saturation-pressure-d_599.html Accessed: June 26, 2020)

69
Appendix D-1
Variation of water mass fraction in market gas with concentration at flow rate of 120L/h
Mass
Fraction
of water
in market
gas [-]
%
weight
of
Glycol
0.0000118 50.00
0.0000117 50.83
0.0000116 51.67
0.0000115 52.50
0.0000115 53.33
0.0000114 54.17
0.0000113 55.00
0.0000112 55.83
0.0000111 56.67
0.0000110 57.50
0.0000109 58.33
0.0000108 59.17
0.0000107 60.00
0.0000106 60.83
0.0000105 61.67
0.0000104 62.50
0.0000103 63.33
0.0000102 64.17
0.0000100 65.00
0.0000099 65.83
0.0000098 66.67
0.0000096 67.50
0.0000095 68.33
0.0000094 69.17
0.0000092 70.00
0.0000091 70.83
0.0000089 71.67
0.0000088 72.50
0.0000086 73.33
0.0000085 74.17
0.0000083 75.00
0.0000081 75.83
0.0000080 76.67
0.0000078 77.50
0.0000076 78.33
0.0000074 79.17
0.0000072 80.00
0.0000070 80.83
0.0000068 81.67
0.0000066 82.50
0.0000063 83.33
0.0000061 84.17
0.0000059 85.00
0.0000056 85.83
0.0000054 86.67
0.0000051 87.50
0.0000048 88.33
0.0000046 89.17
0.0000043 90.00

70
Variation of water mass fraction in market gas with concentration at flow rate of 150L/h
Mass
Faction of
water in
market gas
[-]
Glycol wt %
1.18E-05 50.00
1.15E-05 53.33
1.11E-05 56.67
1.07E-05 60.00
1.03E-05 63.33
9.77E-06 66.67
9.23E-06 70.00
8.61E-06 73.33
7.93E-06 76.67
7.16E-06 80.00
6.31E-06 83.33
5.35E-06 86.67
4.27E-06 90.00
Variation of water mass fraction in market gas with concentration at flow rate 30L/h
Mass Fraction
of water in
market gas [-]
Glycol
wt %
1.18E-05 50.00
1.15E-05 53.33
1.12E-05 56.67
1.08E-05 60.00
1.04E-05 63.33
9.91E-06 66.67
9.38E-06 70.00
8.78E-06 73.33
8.16E-06 76.67
7.42E-06 80.00
6.59E-06 83.33
5.67E-06 86.67
4.64E-06 90.00

71
Variation of water mass fraction in market gas with concentration at a flow rate 5L/h
Mass
Fraction of
Water [-]
MEG wt %
1.22E-05 50.00
1.19E-05 54.00
1.15E-05 58.00
1.12E-05 62.00
1.07E-05 66.00
1.03E-05 70.00
9.63E-06 74.00
8.93E-06 78.00
8.40E-06 82.00
7.47E-06 86.00
6.44E-06 90.00

72
Appendix D-2
Comparing Inhibitive Strengths of Glycols
Flow rate
Water Frac in
market Gas
with TEG
Water Frac in
market Gas
with DEG
Water Frac in
market Gas
with MEG
50 4.83E-05 3.36E-05 3.72E-05
51.67 4.79E-05 3.29E-05 3.67E-05
53.33 4.74E-05 3.21E-05 3.62E-05
55 4.69E-05 3.14E-05 3.56E-05
56.67 4.63E-05 3.06E-05 3.50E-05
58.33 4.56E-05 2.98E-05 3.44E-05
60 4.49E-05 2.90E-05 3.37E-05
61.67 4.41E-05 2.81E-05 3.31E-05
63.33 4.32E-05 2.72E-05 3.23E-05
65 4.23E-05 2.63E-05 3.16E-05
66.67 4.13E-05 2.54E-05 3.08E-05
68.33 4.02E-05 2.44E-05 2.99E-05
70 3.91E-05 2.34E-05 2.90E-05
71.67 3.79E-05 2.24E-05 2.81E-05
73.33 3.66E-05 2.14E-05 2.71E-05
75 3.52E-05 2.03E-05 2.60E-05
76.67 3.37E-05 1.92E-05 2.49E-05
78.33 3.21E-05 1.80E-05 2.37E-05
80 3.05E-05 1.69E-05 2.25E-05
81.67 2.88E-05 1.57E-05 2.12E-05
83.33 2.69E-05 1.44E-05 1.98E-05
85 2.49E-05 1.32E-05 1.84E-05
86.67 2.28E-05 1.18E-05 1.68E-05
88.33 2.06E-05 1.05E-05 1.51E-05
90 1.82E-05 9.07E-06 1.34E-05
Appendix D-3
Hydrate Formation Temperature of Processed Gas at different flow rates
Flow rate MEG 82%w/w
[m3/h]
Hydrate formation temperature
Processed gas
0 -11.46
5 -17.74
30 -19.42
120 -19.79

73
Appendix D-4
Effect of chiller temperature on the fraction of water vapor in market gas
Chiller Temperature [oC] Mass Frac of water
w/w [-]
-5 4.18E-05
-6 3.90E-05
-7 3.63E-05
-8 3.38E-05
-9 3.14E-05
-10 2.92E-05
-11 2.71E-05
-12 2.52E-05
-13 2.34E-05
-14 2.17E-05
-15 2.01E-05
-16 1.86E-05
-17 1.72E-05
-18 1.59E-05
-19 1.47E-05
-20 1.36E-05
-21 1.25E-05
-22 1.16E-05
-23 1.07E-05
-24 9.82E-06
-25 9.04E-06
-26 8.32E-06
-27 7.64E-06
-28 7.02E-06
-29 6.44E-06
-30 5.90E-06
-31 5.41E-06
-32 4.95E-06
-33 4.53E-06
-34 4.14E-06
-35 3.78E-06

74
Appendix D-5
Comparison of Relative Hydrate depression effect of the glycols
Glycol Hydrate formation
temperature
Inlet Gas 16.7546
MEG -36.8415
DEG -46.4885
TEG -35.5656