optimisation of petaloid base dimensions and process
TRANSCRIPT

OPTIMISATION OF PETALOID BASE DIMENSIONS AND
PROCESS OPERATING CONDITIONS TO MINIMISE
ENVIRONMENTAL STRESS CRACKING IN INJECTION
STRETCH BLOW MOULDED PET BOTTLES
A dissertation submitted for the degree of
Doctor of Philosophy
by
BILAL DEMIREL
M.Sc. Chemical Engineering
B.Sc. Chemical Engineering
School of Aerospace, Mechanical, and Manufacturing Engineering
RMIT University
Melbourne
Australia
September 2008

DEDICATION
i
DEDICATION
To my mother who recently passed away and whom I respected and will always love

DECLARATION
ii
DECLARATION
The author declares that:
(1) To the best of my knowledge, this thesis does not contain any material previously written
or published by another person except where reference is made;
(2) The thesis has not been submitted previously, in whole or in part, to qualify for any other
academic award;
(3) The content of the thesis is the result of work which has been carried out since the official
commencement date of the approved research program.
Bilal Demirel

ACKNOWLEDGEMENT
iii
ACKNOWLEDGEMENT
I thank God (most gracious and most merciful) for giving me strength and patience to complete
this thesis.
I am grateful to my family for their valuable support. I am especially thankful to my children, my
wife and my mother-in law. They have all shown great patience since I started this project. I also
would like to thanks to Murat Sariucak for his efficient support during my entire project.
I am very grateful to my supervisor Dr Fügen Daver for everything she has done at all stages of my
candidature, for her feedback and commenting on my thesis, for securing the support of an
industrial sponsor. I also thank her for the constant support, inspiration and true friendship.
I acknowledge Mr. Gary Hutchinson and Mr. Steve Gavin of Visy Industries for their technical support
and guidance in PET bottle production and testing.
I would like to specially thank Mr. Peter Tkatchyk for his generous and sincere support during my
laboratory experiments and in particular for providing instruments and equipment in the thermal
tests.
I wish to thank Mr. Gary Emmerson and Mr. Tony Labita for their support regarding information
technology and related issues.
I also wish to thank Dr. Philip Francis, Manager, Electron Microscopy, Applied Physic Science,
Science, Engineering and Technology Portfolio for providing access to the Environmental Scanning
Electron Microscopy (ESEM) facilities and Mr. Peter Cooper for his guidance during ESEM and
optical microscopy studies.

ACKNOWLEDGEMENT
iv
Last but not least, I would like to acknowledge my friends Baris Koca, Ali Turgut, Ismail Atas
and Mustafa Uzkar for their valuable discussion, recommendations and guidance regarding bottle
mould design and stress analysis.

TABLE OF CONTENTS
v
TABLE OF CONTENTS
Page
DEDICATION i
DECLARATION ii
ACKNOWLEDGEMENTS iii
TABLE OF CONTENTS v
ABBREVIATIONS AND SYMBOLS xi
LIST OF FIGURES xv
LIST OF TABLES xxiii
LIST O PUBLICATIONS ARISING FROM THIS WORK xxvii
ABSTRACT 1
Chapter 1. INTRODUCTION 3
1.1. PET MATERIAL AND BOTTLES FOR CARBONATED SOFT DRINKS 4
1.2. CRACKING AT THE BOTTOM OF THE BOTTLE 6
1.3. THE MAIN OBJECTIVES OF THE RESEARCH 7
1.4. SPECIFIC RESEARCH QUESTIONS TO BE ADDRESSED 7
1.5. STRUCTURE OF THE THESIS 8
Chapter 2. LITERATURE REVIEW 10
2.1. INTRODUCTION 11
2.2. DEVELOPMENT OF THE PET BOTTLE 11
2.3. PET MATERIAL AND PROPERTIES 12
2.3.1. Crystallization behavior of PET 14
2.3.1.1. Crystallinity calculation 20

TABLE OF CONTENTS
vi
Page
2.3.2. Physical aging 23
2.3.2.1. Factors affecting aging 25
2.3.3. Mechanical property changes 25
2.3.3.1. Orientation 25
2.3.3.2. Influence of orientation conditions on PET films 27
2.4. ENVIRONMENTAL STRESS CRACKING 30
2.4.1. Environmental stress cracking in PETbottles 34
2.5. MANUFACTURE OF PET BOTTLES FOR CARBONATED SOFT DRINKS 40
2.5.1. Injection stretch blow molding 41
2.5.2. Extrusion blow molding 43
2.5.3. Injection blow molding 43
2.6. PROCESS CONDITIONS 44
2.6.1. Preform temperature 46
2.6.2. Heat transfer 49
2.6.3. Blow pressure – Time 54
2.6.4. Stretch rod displacement as a function of time 55
2.7. OPTIMIZATION INJECTION STRETCH BLOW MOULDING PROCESS 57
2.7.1. Bottle bottom weight 59
2.7.2. Bottle and petaloid base design 60
Chapter 3. BOTTLE BASE DESIGN AND OPTIMIZATION 62
3.1. INTRODUCTION 63
3.2. CURRENT BOTTLE DESIGN 64
3.3. FINITE ELEMENT ANALYSIS 68

TABLE OF CONTENTS
vii
Page
3.3.1. Generation of a model for finite element analysis 70
3.3.2. Stress analyses of solid bodies 71
3.4. VON MISES STRESS ANALYSIS AND SIMULATION PROCEDURE 73
3.4.1. Setting the material properties 74
3.4.2. Static solution parameters 74
3.4.3. Application of restraints 75
3.4.4. Application of pressure 77
3.4.5 Mesh generation 79
3.5. RESULTS AND DISCUSSION 83
3.6 OPTIMIZATION OF BASE GEOMETRY 88
3.6.1. Experimental design with ECHIP-7 88
3.6.2. Assessment of the response variables with ECHIP-7 93
3.7 CONCLUSION 97
Chapter 4. ISBM PROCESS DESIGN WITH BLOW VIEW 8.2 99
4.1. INTRODUCTION 100
4.2. SIMULATION SETTING FOR THE PROCESS OPTIMIZATION 102
4.2.1 Process and material model 102
4.2.2 Alignment of the bottle mold and stretch rod 102
4.2.3 Preform thickness profile 103
4.2.4 Temperature profile of the preform 107
4.2.5 Stretch rod movement 107
4.2.6 The pressure profile as a function of time 111
4.2.7 ISBM process settings 113

TABLE OF CONTENTS
viii
Page
4.2.8 Deformation mode of the preform during stretch/preblow 118
4.3 SIMULATION RESULTS WITH BLOW VIEW 123
4.3.1 Thickness in the bottle base 123
4.3.2 Simulated stress in the bottle base 128
4.3.3 Simulated crystallinity in the bottle base 132
4.3.4 Simulated molecular orientation in the bottle base 136
4.3.5 Simulated biaxial ratio in the bottle base 140
4.3.6 The comparison of the simulated properties with respect to the base thickness 144
4.4 CONCLUSION 147
Chapter 5. EXPERIMENTAL PROCEDURES AND EVALUATION OF THE OPTIMISED
BASE DESIGN 149
5.1. INTRODUCTION 150
5.2. EXPERIMENTAL 152
5.2.1 Burst pressure 152
5.2.1.1 Apparatus 153
5.2.1.2 Procedure 153
5.2.2 Top load strength test 153
5.2.2.1 Apparatus 153
5.2.2.2 Procedure 154
5.2.3 Material and the weight of bottle sections 154
5.2.4 Environmental stress crack resistance tests 156
5.2.4.1 Apparatus 156
5.2.4.2 Preparation environmental stress cracking agent 156

TABLE OF CONTENTS
ix
Page
5.2.4.3 Procedure 156
5.2.5 Thermal stability test 157
5.2.5.1 Apparatus 157
5.2.5.2 Procedure 158
5.2.6 Chemical carbonation procedure for thermal test 159
5.2.6.1 Apparatus 159
5.2.6.2 Procedure 159
5.2.6.3 Definitions and calculations 160
5.2.7 Crystallinity 162
5.2.7.1. Apparatus 162
5.2.7.2. Procedure 163
5.2.8 Environmental scanning electron microscopy (ESEM) and Optical Microscopy 164
5.3 EXPERIMENTAL RESULTS AND DISCUSSION 165
5.3.1 Burst strength 165
5.3.2 Top load strength 167
5.3.3 Environmental stress cracking 169
5.3.4 Thermal stability of the bottles 172
5.3.5 Crystallinity 174
5.3.6. Morphology 178
5.3.7. Relationship of ESCR to that of physical and mechanical properties of
the bottle base 180
5.4 CONCLUSION 184

TABLE OF CONTENTS
x
Page
Chapter 6. CONCLUSIONS AND SUGGESTIONS FOR FURTHER WORK 185
6.1. INTRODUCTION 186
6.2. SUGGESTIONS FOR FURTHER WORK 189
REFERENCES 190
APPENDICES 216
APPENDIX A. STRESS ANALYSIS STATISTICS IN CATIA V5 R14 217
APPENDIX B. SIMULATION RESULTS 225
APPENDIX C. STANDARD AND OPTIMISED BOTTLE PROPERTIES 233
APPENDIX D. MDSC ANALYSIS RESULTS AND CRYSTALLINITY 245
CALCULATION
APPENDIX E. SEM IMAGES OF THE CRACKED BOTTLE BASES 250

ABBREVIATIONS AND SYMBOLS
xi
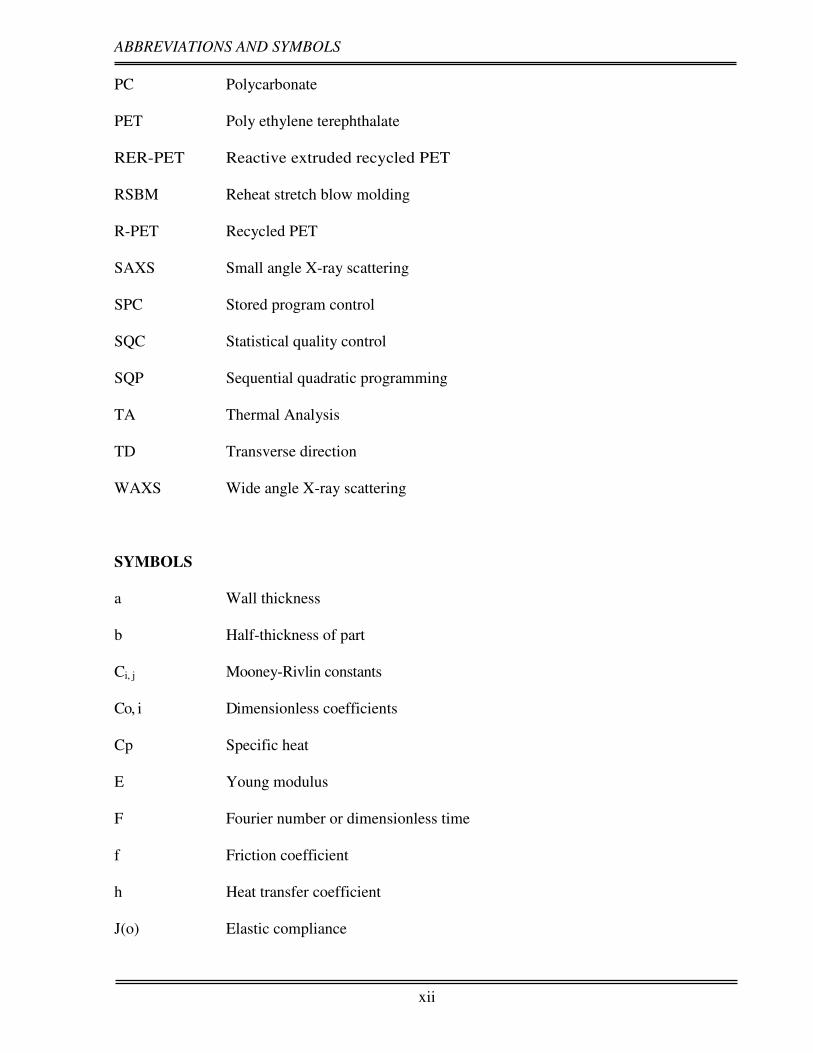
ABBREVIATIONS AND SYMBOLS
ABBREVIATIONS
ASCRU Accelerated stress crack test unit
ASTM American standard test methods
CAD Computer aided design
CAM Computer aided manufacturing
CHDM Cyclohexane dimethanol
CSD Carbonated soft drink
DMA Dynamic mechanical analysis
DOT Design optimization tools
DSC Differential scanning calorimetry
ESC Environmental stress cracking
ESCR Environmental stress crack resistance
ESEM Environmental scanning electron microscopy
FEA Finite element analysis
FEM Finite element method
FT-IR Fourier transformed infrared
HDPE High-density polyethylene
IMI Industrial materials institute
ISBM Injection stretch blow molding
IRS Internal reflectance spectroscopy
MD Machine direction
MDSC Modulated differential scanning calorimerty
NMR Nuclear magnetic resonance
ABBREVIATIONS AND SYMBOLS
xii
PC Polycarbonate
PET Poly ethylene terephthalate
RER-PET Reactive extruded recycled PET
RSBM Reheat stretch blow molding
R-PET Recycled PET
SAXS Small angle X-ray scattering
SPC Stored program control
SQC Statistical quality control
SQP Sequential quadratic programming
TA Thermal Analysis
TD Transverse direction
WAXS Wide angle X-ray scattering
SYMBOLS
a Wall thickness
b Half-thickness of part
Ci, j Mooney-Rivlin constants
Co, i Dimensionless coefficients
Cp Specific heat
E Young modulus
F Fourier number or dimensionless time
f Friction coefficient
h Heat transfer coefficient
J(o) Elastic compliance

ABBREVIATIONS AND SYMBOLS
xiii
K Stress intensity factor
k Thermal conductivity
Ta Ambient temperature
Tav Average temperature
TC Cold crystallization temperature at the first heating stage in MDSC
TC1 Cold crystallization temperature at the cooling stage in MDSC
Te Ejection temperature of plastic part
Tf Mould temperature
Tg Glass transition temperature
Ti Initial temperature of polymer melts
Tm Melting point
Tm Mid-plane temperature
T(y, t) Temperature as function of thickness and time
t Time
tc Cooling time
U(ε) Strain energy potential
X Weight of acid
Xc Polymer crystallinity
W Bottle base weight
Wc Critical value for inelastic tensile strain energy density
Y Carbonation Required (Gas Volumes)
y Distance from mid-plane of part
Z Brimful capacity of container
∆H Measured enthalpy of melting sample

ABBREVIATIONS AND SYMBOLS
xiv
∆Hu Enthalpy of fusion per mole of PET
∆H100 Enthalpy of melting a 100 % crystalline sample
τxy Shear stress
γxy Shear strain
υ Poisson’s ratio
� Thermal diffusivity
λ Principal stretch ratio
σ Applied stress
σc Critical stress
σ(o) Instantaneous maximum stress
ε Tensile strain
εc Total critical tensile strain
ρ Measured density of PET sample
ρa Amorphous PET density
ρc Crystalline PET density

LIST OF FIGURES
xv
LIST OF FIGURES
Page
Fig. 2-1 PET synthesis reactions 13
Fig. 2-2 The repeat unit of polyethylene terephthalate 13
Fig. 2-3 Schematic diagram of completely amorphous phase 19
Fig. 2-4 Schematic morphology of semi-crystalline polymers a) schematic appearance
b) alignment of semi-crystalline layers c) microscopic appearance 20
Fig. 2-5 Three dimensional structures of rotational isomers of PET
(a) Trans, (b) Gauche 23
Fig. 2-6 Cracks in the petaloid bottom of the bottle
(a) cracks in radial direction (b) cracks in circumferential direction 35
Fig. 2-7 Schematic drawing of bottle base valley width and foot length 36
Fig. 2-8 Schematic drawing of bottle base clearance 36
Fig. 2-9 Stretch-blow molding of PET bottles 42
Fig. 2-10 The preform design used in ISBM process 43
Fig. 2-11 Temperature along the length of the preform 47
Fig. 2-12 Pressure versus time for 2 lt CSD bottles 55
Fig. 2-13 Stretch rod displacement versus time for AOKI blow molder 56
Fig. 2-14 Different types of preform geometry used in the industry 58
Fig. 2-15 CAD drawing of a typical petaloid base of a bottle 60
Fig. 3-1 1500 ml PET bottle drawing and dimensions 65
Fig. 3-2 The CATIA drawing of the standard (current) PET bottle 66
Fig. 3-3 Dimensioned CATIA model of one segment of the bottle base. 67
Fig. 3-4 The CAD drawing of the standard (current) PET bottle base 67

LIST OF FIGURES
xvi
Page
Fig. 3-5 Finite element structure 69
Fig. 3-6 Various finite elements 71
Fig. 3-7 CATIA dialog box for ‘static solution parameters’ 75
Fig. 3-8 CATIA dialog box for clamp type and number of faces supported 76
Fig. 3-9 Application of restraints to the base of the bottle 77
Fig. 3-10 CATIA dialog box for applied pressure 78
Fig. 3-11 The application of pressures on the inner surfaces of the bottle 78
Fig. 3-12 The meshed surface of the bottle 79
Fig. 3-13 The mesh geometry and dimensions of elements on the bottle surface 80
Fig. 3-14 The mesh size used in the stress analysis 80
Fig. 3-15 The deformed mesh with the restraints and loads as a result of the deformation 82
Fig. 3-16 The Von Mises stress on amplification magnitude of 63.7 82
Fig. 3-17 Translational displacement vectors as a result of the pressure inside the bottle 83
Fig. 3-18 The highest Von Mises stress as a function of clearance 85
Fig. 3-19 The highest Von Mises stress as a function of valley width 85
Fig. 3-20 The highest Von Mises stress as a function of foot length 85
Fig. 3-21 Max stress at two different wall thicknesses for the bottle base parameters
a) foot length b) valley width c) clearance 87
Fig. 3-22 Design parameters of the petaloid base of the PET bottle 88
Fig. 3-23 Experimental design via ECHIP; design and response variables 90
Fig. 3-24 Making a design via ECHIP; model specification, max of trials 90
Fig. 3-25 The combinations of trials generated for stress analysis 91
Fig. 3-26 The number of trials or resolution for the experimental test on CATIA 92
Fig. 3-27 Optimization ‘response surface’ in 2-D without constraint 96

LIST OF FIGURES
xvii
Page
Fig. 3-28 Optimization ‘response surface’ in 3-D with constraint 96
Fig. 3-29 CAD drawing of the optimum bottle base 97
Fig. 4-1 PET Eastapak 9921 rheological properties and relevant model coefficients 102
Fig. 4-2 Stretch rod and bottle alignment in Blow View 103
Fig. 4-3 Preform design menu in Blow View 8.2 for the 40 g. preform 104
Fig. 4-4 Design currently used in industry for the 40 g preform 105
Fig. 4-5 Alternative design for the 34 g. preform 106
Fig. 4-6 Preform design menu in Blow View 8.2 for the 34 gr. preform 107
Fig. 4-7 Temperature profile of the preform 108
Fig. 4-8 Stretch rod dimensions used in this study 108
Fig. 4-9 Stretch rod displacement vs. time (a) model-2 (b) model-3 110
Fig. 4-10 Pressure vs. time profile for (a) model-1 (b) model-2 (c) model-3 112
Fig. 4-11 Preform shapes for Stretch/Pre-blow deformation steps – model-1 120
Fig. 4-12 Preform shapes for Stretch/Pre-blow deformation steps – model-2 121
Fig. 4-13 Preform shapes for Stretch/Pre-blow deformation steps – model-3 122
Fig. 4-14 Thickness on the bottom of the bottle
(a) model-1 (b) model-2 (c) model-3 (d) comparison of the models 125
Fig. 4-15 The thickness s in the bottom of the bottle for model1
(a) temperature range 98-115 oC for 40 gr. preform
(b) temperature range 93-110 oC for 40 gr. preform
(c) temperature range 93-110 oC for 34 g. Preform 127
Fig. 4-16 Simulated thickness s in the bottle base for model 2
(a) temperature range 98-115 oC for 40 g. preform

LIST OF FIGURES
xviii
Page
(b) temperature range 93-110 oC for 40 g. preform
(c) temperature range 93-110 oC for 34 g. Preform 127
Fig. 4-17 Simulation of thickness s in the bottle base for model 3
(a) temperature range 98-115 oC for 40 g. Preform
(b) temperature range 93-110 oC for 40 g. Preform
(c) temperature range 93-110 oC for 34 g. preform 127
Fig. 4-18 Simulation of stress s on the bottle base
(a) model-1 (b) model-2 (c) model-3 (d) comparison of the models 129
Fig. 4-19 Simulation of stress s in the bottle base for model 1
(a) temperature range 98-115 oC for 40 g. preform
(b) temperature range 93-110 oC for 40 g. preform
(c) temperature range 93-110 oC for 34 g. preform 131
Fig.4-20 Simulation of stress s in bottle base for model-2
(a) temperature range 98-115 oC for 40 g. preform
(b) temperature range 93-110 oC for 40 g. preform
(c) temperature range 93-110 oC for 34 g. preform 131
Fig. 4-21 Simulation of stress s in bottle base for model-3
(a) temperature range 98-115 oC for 40 g. preform
(b) temperature range 93-110 oC for 40 g. preform
(c) temperature range 93-110 oC for 34 g. preform 131
Fig. 4-22 Crystallinity on the bottle base
(a) model-1 (b) model-2 (c) model-3 (d) comparison of the models 133
Fig.4-23 Simulation of crystallinity in the bottle base for model-1
(a) temperature range 98-115 oC for 40 g. preform

LIST OF FIGURES
xix
Page
(b) temperature range 93-110 oC for 40 g. preform
(c) temperature range 93-110 oC for 34 g. preform 135
Fig. 4-24 Simulation of crystallinity in the bottle base for model-2
(a) temperature range 98-115 oC for 40 g. preform
(b) temperature range 93-110 oC for 40 g. preform
(c) temperature range 93-110 oC for 34 g. preform 135
Fig. 4-25 Simulation of crystallinity in the bottle base for model-3
(a) temperature range 98-115 oC for 40 g. preform
(b) temperature range 93-110 oC for 40 g. preform
(c) temperature range 93-110 oC for 34 g. preform 135
Fig. 4-26 Simulation of molecular orientations on the bottle base
(a) model-1 (b) model-2 (c) model-3 (d) comparison of the models 137
Fig. 4-27 Simulation of molecular orientation in the bottle base for model-1
(a) temperature range 98-115 oC for 40 g. preform
(b) temperature range 93-110 oC for 40 g. preform
(c) temperature range 93-110 oC for 34 g. preform 139
Fig.4-28 Simulation of molecular orientation in the bottle base for model-2
(a) temperature profile 98-115 oC; 40 g. preform
(b) temperature profile 93-110 oC; 40 g. Preform
(c) temperature profile 93-110 oC; 34 g. preform 139
Fig. 4-29 Simulation of molecular orientation in the bottle base for model 3
(a) temperature profile 98-115 oC; 40 g. preform
(b) temperature profile 93-110 oC; 40 g. Preform
(c) temperature profile 93-110 oC; 34 g. preform 139

LIST OF FIGURES
xx
Page
Fig. 4-30 Biaxial Ratio on the bottle base
(a) model-1 (b) model-2 (c) model-3 (d) comparison of the models 141
Fig. 4-31 Simulation of biaxial ratios in the bottle base for model-1
(a) temperature profile range 98-115 oC; 40 g. preform
(b) temperature profile 93-110 oC; 40 g. Preform
(c) temperature profile 93-110 oC; 34 g. preform 143
Fig. 4-32 Simulation of biaxial ratios in the bottle base for model-2
(a) temperature range 98-115 oC for 40 g. preform
(b) temperature range 93-110 oC for 40 g. Preform
(c) temperature range 93-110 oC for 34 g. preform 143
Fig. 4-33 Simulation of biaxial ratios in the bottle base for model-3
(a) temperature profile 98-115 oC; 40 g. preform
(b) temperature profile 93-110 oC; 40 g. preform
(c) temperature profile 93-110 oC; 34 g. preform 143
Fig. 4-34 The relationship between thickness and crystallinity in the base 144
Fig. 4-35 The relationship between thickness and stress in the base 145
Fig. 4-36 The relationship between thickness and molecular orientation in the base 145
Fig. 4-37 The relationship between thickness and biaxial ratio in the base 146
Fig. 5-1 Apparatus developed for cutting of PET bottles 155
Fig. 5-2 The base, body and top section of PET bottle 155
Fig. 5-3 Points at which crystallinity values observed by SEM 163
Fig. 5-4 ESEM analysis chamber and the sample of the cracked bottle base 164
Fig.5-5 Burst strength performance of the bottles 166

LIST OF FIGURES
xxi
Page
Fig.5-6 Top-load performance of the bottles 167
Fig.5-7 Bottle Base weights 168
Fig.5-8 Accelerated stress crack performance of the bottles 170
Fig. 5-9 ESC at the bottom of the bottle with standard base
(a) central cracks (b) diagonal cracks 171
Fig. 5-10 ESC at the bottom of the bottle with optimum base 171
Fig. 5-11 Thickness of the bottles with standard and optimized base 172
Fig. 5-12 MDSC diagram of the standard bottle base 175
Fig. 5-13 MDSC diagram of the optimum bottle base 175
Fig. 5-14 Actual crystallinity in the optimum and standard bottle bases 178
Fig. 5-15 Optical microscope images of the cracks around the center of optimum base 179
Fig. 5-16 SEM image of the crack propagation in the standard bottle base 179
Fig. 5-17 SEM image of the crack propagation in the optimized model 180
Fig. 5-18 Simulation of the stress under load in the optimised bottle base 181
Fig. 5-19 Simulated stress and measured thickness in the optimized bottle base 182
Fig. 5-20 Comparison of crystallinity in the new and standard bases; model-2 182
Fig. 5-21 Comparison of molecular orientations in the new and standard bases; model-2 183
Fig. 5-22 Comparison of biaxial ratios in the new and standard bases; model-2 183
Fig. A-1 Boundary conditions in the bottle 218
Fig. A-2 Deformed mesh in the bottle under the internal pressure of 0.4 MPa 222
Fig. A-3 Optimum von Mises stress for the internal pressure of 0.4 MPa 222
Fig. B-1 Comparison of thickness profile of the optimised and standard bases
a) model-1 b) model-2 c) model-3 226

LIST OF FIGURES
xxii
Page
Fig. B-2 Comparison of stress profile of the optimised and standard bases
a) model-1 b) model-2 c) model-3 227
Fig. B-3 Comparison of crystallinity of the optimised and standard bases
a) model-1 b) model-2 c) model-3 229
Fig. B-4 Comparison of molecular orientations of the optimised and standard bases
a) model-1 b) model-2 c) model-3 230
Fig. B-5 Comparison of biaxial ratios of the optimised and standard bases
a) model-1 b) model-2 c) model-3 232
Fig. D-1 Heat flow curve; and cystallinity of the optimised base design at the region of
(a) valley, (b) valley transition, (c) centre, (d) foot transition, (e) foot. 247
Fig. D-2 Heat flow curve; and cystallinity of the standard base design at the region of
(a) valley, (b) valley transition, (c) centre, (d) foot transition, (e) foot 249
Fig. E-1 SEM Images of the cracked bottle base with standard design 250
Fig. E-2 SEM Images of the cracked bottle base with optimised design 252

LIST OF TABLES
xxiii
LIST OF TABLES
Page
Table 2-1 Thermal properties and density of PET 49
Table 3-1 1500 ml billboard CSD-Stock dimensions and specifications 64
Table 3-2 Material properties for virgin PET 74
Table 3-3 Design parameters 89
Table 3-4 Von Mises stress values for standard deviation of the study 92
Table 3-5 1500 ml. PET bottle von-Mises stress values for the pressure of 0.40 MPa 94
Table 3-6 1500 ml. PET bottle von-Mises stress values for the pressure of 0.60 MPa 95
Table 3-7 The base dimensions of the current and proposed bottles 98
Table 4-1 Processing conditions for model-1
(a) temperature range 98-115 oC for 40 g. Preform
(b) temperature range 93-110 oC for 40 g. Preform
(c) temperature range 93-110 oC for 34 g. Preform 114
Table 4-2 Processing conditions for model-2
(a) temperature range 98-115 oC for 40 g. Preform
(b) temperature range 93-110 oC for 40 g. Preform
(c) temperature range 93-110 oC for 34 g. Preform 116
Table 4-3 Processing conditions for model-3
(a) temperature range 98-115 oC for 40 g. Preform
(b) temperature range 93-110 oC for 40 g. Preform
(c) temperature range 93-110 oC for 34 g. Preform 117
Table 5-1 Injection stretch blow molding process parameters for the 1.5 lt. bottle 151

LIST OF TABLES
xxiv
Page
Table 5-2 Regions and represents used in MDSC 163
Table 5-3 Burst strength performance of the bottles 166
Table 5-4 Top-load performance of the bottles 167
Table 5-5 Bottle section weights 168
Table 5-6 Accelerated stress crack performance of the bottles 169
Table 5-7 Thermal stability of the bottles; changes in
(a) base clearance, bottle height and fill point; (b) body diameter 173
Table 5-8 Properties of the selected points in the standard bottle base 176
Table 5-9 Properties of the selected points in the optimum bottle base 177
Table A-1 Mesh entities and sizes 217
Table A-2 Element type 217
Table A-3 Element Quality 217
Table A-4 Structure Computation results 218
Table A-5 Restraint computation results 219
Table A-6 Applied load-1 computation results 219
Table A-7 Stiffness computation results 219
Table A-8 Singularity computation results 220
Table A-9 Constraint computation results 220
Table A-10 Direct method computation results 220
Table A-11 Factorized computation results 221
Table A-12 Applied forces computation results 221
Table A-13 Von Mises stress values for the pressure of 0.4 MPa
at different wall thickness 223

LIST OF TABLES
xxv
Page
Table A-14 Von Mises stress values for the pressure of 0.6 MPa
at different wall thickness 224
Table C-1 Bottle burst pressure values for the bottle with standard base 233
Table C-2 Bottle burst pressure values for the bottle with optimum base 233
Table C-3 Bottle burst pressure values for the bottle with optimum base; 234
preform reheat temperature of 105 oC
Table C-4 Bottle burst pressure values for the bottle with optimum base; 234
preform reheat temperature of 110 oC
Table C-5 Bottle burst pressure values for the bottle with optimum base; 235
preform reheat temperature of 115 oC
Table C-6 Top load test and section weights of the bottle with standard base 235
Table C-7 Top load test and section weights of the bottle with optimum base 236
Table C-8 Top loads and section weights of the bottle with optimum base 236
preform reheat temperature of 105 oC
Table C-9 Top loads and section weights of the bottle with optimum base 237
preform reheat temperature of 110 oC
Table C-10 Top loads and section weights of the bottle with optimum base 237
preform reheat temperature of 115 oC
Table C-11 Accelerated stress crack resistance for off-machine performance 238
Table C-12 Accelerated stress crack resistance a few days after blow molding 238
Table C-13 ASC Resistance to the average temperatures for the optimum base 239
less than 24 hours after blow molding
Table C-14 Thermal stability test for the 1500 ml. bottle with standard base 240
Table C-15 Thermal stability test for the 1500 ml. bottle with optimum base 241

LIST OF TABLES
xxvi
Page
Table C-16 Thermal stability test for the 1500 ml. bottle with optimum base 242
preform reheat temperature of 105 oC
Table C-17 Thermal stability test for the 1500 ml. bottle with optimum base 243
preform reheat temperature of 110 oC
Table C-18 Thermal stability test for the 1500 ml. bottle with optimum base 244
preform reheat temperature of 115 oC

LIST OF PUBLICATION
xxvii
LIST OF PUBLICATION ARISING FROM THIS WORK
Demirel, B., Daver, F., Kosior E. (2007). "Optimum design of PET bottle bases against
environmental stress cracking", Conference Proceedings, 23rd Annual Meeting of the Polymer
Processing Society, (PPS-23), Salvador, Brazil, 27-31
Demirel, B., Daver, F., Kosior E. (2007). "Petaloid bases of PET bottles: Design and process
optimization against environmental stress cracking ", Conference Proceedings, SPE ANTEC,
Cincinnati, OH, 2159-2164
Demirel, B., Daver, F., Kosior E. (2008). “The optimization of petaloid base dimensions and
operating conditions for injection stretch blow moulded PET bottles”, Conference
Proceedings, 24th Annual Meeting of the Polymer Processing Society, (PPS-24), Salerno,
Italy
Daver, F., Demirel, B. (2009).”Optimization of PET bottle via numerical modeling: A statistical
design of experiment approach”, Journal of Applied Polymer Science (Submitted)
Demirel, B., Daver, F. (2009) “Effects of the geometrical modification of the petaloid base on the
final physical properties of the PET bottles”, Journal of Applied Polymer Science (Submitted)
Demirel, B., Daver, F. (2009) “Simulation of stress in the base of the PET bottles under different
processing conditions”, Journal of Applied Polymer Science (in preparation)

ABSTRACT
1
ABSTRACT
Injection stretch blow moulded PET bottles are the most widely used container type for
carbonated soft drinks. PET offers excellent clarity, good mechanical and barrier
properties, and ease of processing. Typically, these bottles have a petaloid-shaped base,
which gives good stability to the bottle and it is the most appropriate one for beverage
storage. However, the base is prone to environmentally induced stress cracking and this a
major concern to bottle manufacturers.
The object of this study is to explain the occurrence of stress cracking, and to prevent it
by optimising both the geometry of the petaloid base and the processing parameters
during bottle moulding.
A finite element model of the petaloid shape is developed in CATIA V5 R14, and used to
predict the von Mises stress in the bottle base for different combinations of three key
dimensions of the base: foot length, valley width, and clearance. The combination of
dimensions giving the minimum stress is found by a statistical analysis approach using an
optimisation and design of experiments software package ECHIP-7.
A bottle mould was manufactured according to the optimum base geometry and PET
bottles are produced by injection stretch blow moulding (ISBM). In order to minimize
the stresses at the bottom of the bottle, the ISBM process parameters were reviewed and
the effects of both the stretch rod movement and the temperature profile of the preform
were studied by means of the process simulation software package (Blow View version

ABSTRACT
2
8.2). Simulated values of the wall thickness, stress, crystallinity, molecular orientation
and biaxial ratio in the bottle base were obtained. The process parameters, which result in
low stress and uniform material in the bottle base, are regarded as optimum operating
conditions.
In the evaluation process of the optimum bottle base, bottles with standard (current) and
optimized (new) base were produced under the same process conditions via a two-stage
ISBM machine. In order to compare both the bottles, environmental stress crack
resistance, top load strength, burst pressure strength, thermal stability test as well as
crystallinity studies via modulated differential scanning calorimetry (MDSC) and
morphology studies via environmental scanning electron microscopy (ESEM) and optical
microscopy were conducted.
In this study carried out, the new PET bottle with the optimised base significantly
decreased the environmental stress cracking occurrence in the bottom of the bottle. It is
found that the bottle with optimised base is stronger than the bottle with standard base
against environmental stress cracking. The resistance time against environmental stress
cracking are increased by about % 90 under the same operating process conditions used
for standard (current) bottles; and by % 170 under the optimised process conditions
where the preform re-heating temperature is set to 105 oC.

Chapter 1 INTRODUCTION
3
Chapter 1
INTRODUCTION

Chapter 1 INTRODUCTION
4
1.1 PET MATERIAL AND BOTTLES FOR CARBONATED SOFT DRINKS
Polyethylene terephthalate (PET) is a versatile and commercially important polymer. It is the
preferred resin for containers of carbonated soft drink, juice, and many other beverages. PET also
has many applications in medical and pharmaceutical, household and chemical, electronic and
automotive, as well as food packaging markets. This widely used material can be found in rigid
and flexible packaging, composite molded structures, and tapes and discs of various kinds.
Markets for PET are increasing rapidly; the world market is expected to reach 20 million tones in
the near future.
Efforts have intensified to improve the barrier properties and hot-fill capabilities of PET in order
to extend its applications to include even more food and oxygen-sensitive products. These
technologies include new high barrier resins, coatings, multilayer structures with oxygen
scavengers, heat settings and blending [Jabarin, 2003].
It is commonly accepted that plastic packaging has a number of advantages over glass packaging;
namely, they are lighter, cheaper, and unbreakable [Rosato, 1998]. Furthermore, less energy is
required to produce a plastic bottle and the environmental footprint is reduced still further if the
plastic packaging is properly recycled. Of course, plastic has limitations, particularly in food
packaging. These may involve load bearing strength (e.g. when the product must be stacked
during storage and transportation), low vacuum resistance and high permeability. A particular
limitation is that pressuration from the contents the plastic bottle can result in substantial
deformation [Van Dijk, 1997]. This phenomenon is demonstrated as paneling and results in an
unaesthetic packaging that gives the consumer the impression that something has happened to the
contents.

Chapter 1 INTRODUCTION
5
PET is the most commonly used material for carbonated soft-drink bottling [BSDA, 2000] since
it offers excellent clarity, good mechanical and barrier properties, and ease of processing [Martin,
et al., 1999].
The petaloid base is the widely used bottle design. The alternative is a two-piece bottle in which a
separate flat-bottomed cup is fitted over the hemispherical base of the as-moulded bottle. The
petaloid-shaped base gives a self-standing feature to the bottle and the production cost is less than
that of two-piece bottle. However, the base is prone to stress cracking under pressure from the
carbonation content, when the bottle is exposed to line lubricants or stored at hot and humid
environments for long periods; and this a major concern to bottle manufacturers.
There is a number of parametric modeling in the literature for the ISBM process, which is used
for the processing of polymer materials, especially for PET bottle production. Computer aided
design (CAD) and computer aided manufacturing (CAM) software programs are needed to
produce bottle-mould initial design with minimal modeling and production time as processing
and mould design are time consuming and expensive [Chua and Lye, 1998]. It is convenient to
use blow molding systems in the manufacture of hollow plastic items like containers and bottles
due to favorable cost factors, possibility of variable wall thicknesses, and low stresses [Rosato
and Rosato, 1989].
Processes utilized for fabrication of commercial PET products include injection molding, blow
molding, extrusion, thermoforming, and film blowing. The ease of fabrication, the quality of the
fabricated products, and the end-use properties are all dependent on basic material properties and
specific responses during the various steps of each of the processing methods used to convert the
resin into the final product. It is obvious that PET occupies an increasingly strong share of the

Chapter 1 INTRODUCTION
6
plastics market and also demonstrates a strong potential for application and property
enhancements through selection and modification of material and processing variables [Jabarin,
2003].
1.2 CRACKING AT THE BOTTO M OF THE BOTTLE
The main problem with the one-piece bottle is stress cracking in the petaloid shaped base during
the storage of the soft-drink, causing major inconvenience for carbonated soft drink producers
and distributors. For this reason, bottle and petaloid shaped base need to be redesigned by using
computer programs employing Finite Element Analysis (FEA) techniques to prevent cracking at
the base of the bottles before being produced with the injection stretch blow molding (ISBM)
process. So far, a few computer simulation programs have been used for this purpose [Rosato
and Rosato, 1989]. Both the bottle design and the ISBM process parameters are optimised by
means of these programs, improving resistance to stress cracking, and reducing the time and cost
of bottle production.
PET is subject to environmental stress cracking (ESC) and a brittle failure initiated by surface
imperfection. In general, ESC occurs when the glassy polymer is exposed to an aggressive
medium and loaded at low stress for long periods of time [Wright, 1996; Joao et al., 2000;
Howard, 1959]. Since at least 15% of all plastics failures in service are caused by ESC [Wright,
1996], the investigation of the phenomena is very important for the applications of engineering
plastics.
Some researchers [Chevalier et al., 1999] have focused on crystallinity as the main contributor to
the cracking problem. Processing temperature, pressure and environment have been known to
affect crystallinity [Jabarin, 1998].

Chapter 1 INTRODUCTION
7
1.3 THE MAIN OBJECTIVES OF THE RESEARCH
The objectives of the research are as follows:
(1) To review the standard (current) design of various PET bottles in terms of strength, stretching
ratio and peak stresses when filled.
(2) To determine the mechanism of crack formation experimentally.
(3) To systematically conduct numerical modeling and finite element analysis of a PET bottle in
order to examine the effect of changes to geometry and key dimensions of the petaloid base.
(4) To develop a more rational design process that can be applied to the design of other PET
products by means of advanced finite element analysis and experimental verifications.
(5) To optimise ISBM process via simulation and verify optimum process parameters
experimentally.
(6) To test the optimized bottles, which are produced under optimum ISBM operating conditions,
against the environmental stress crack resistance.
1.4 SPECIFIC RESEARCH QUESTIONS TO BE ADDRESSED
The specific research questions to be addressed are as follows:
(1) What effect does the geometry of the petaloid base have on stress cracking?
(2) What are the effects on stress cracking of process conditions, such as preform reheat
temperature, pre-blow and final blow pressure
(3) What is the relationship between the stretching and blowing stages?
(4) Do the material properties play a role in stress cracking?
(5) At what conditions are the current PET bottles cracking when filling with carbonated soft
drink?
(6) How will the newly designed PET bottles perform in terms of the quality?

Chapter 1 INTRODUCTION
8
(7) What type of tests should be carried out on both the standard (current) bottles and the newly
designed (optimum) bottles?
(8) Will the commercial finite element package CATIA respond to detailed stress analysis?
(9) Will the outcomes of numerical methods comply with the newly produced PET bottles?
(10) What are the effects of the preform temperature on bottle properties?
1.5 STRUCTURE OF THE THESIS
In the literature review, the principal characteristic properties of PET, including chemical and
physical properties, and the factors affecting these properties are reviewed in detail with respect
to the proposed research questions. The processes utilized in the production of PET bottle and
the parameters pertaining to these processes are reported. Some detailed explanation is made
regarding the material models used in simulation programs.
In the third chapter of this study, the geometrical design process of the petaloid base of the 1.5 lt.
bottle, on the base of which the environmental stress cracking occur, is discussed. Here, a new
design is proposed that aims to minimise the stresses induced in the base by the carbonation
pressure of the bottle content. Since the analysis of the stress was done using the Catia, all steps
associated with this process are explained in detail. The knowledge related to the design
parameters of the petaloid shaped base and the optimization process via ECHIP-7 software
program are also given in detail.
Fourth chapter describes the ISBM process optimization via the Blow View 8.2 software program.
The most appropriate process conditions are identified for the bottle design according to the FEM
optimisation. These are defined by considering the effects of both the stretch rod movement used
for stretching the preform, the temperature of the preform and the preform weight on the physical

Chapter 1 INTRODUCTION
9
properties of the material in the bottle base section. The properties, such as thickness,
crystallization, molecular orientation, stress, biaxial ratio are obtained through the Blow View 8.2
simulation software program and these values are assessed with the aim of defining appropriate
process conditions.
In the fifth chapter, the new bottle base is obtained by optimising both the bottle base design and
process parameters which are used in fabrication of the bottles. The bottles with the standard base
and the optimum base are produced under the same process conditions and the performance tests
are performed for both bottles with the aim of comparison. The results of top load strength,
environmental stress crack resistance, burst pressure, material, thermal stability and percent
crystallinity are presented in this chapter. In this chapter, crack morphology is studied for current
and new bottles, based on Environmental Scanning Electron Microscopy (ESEM) and optical
microscopy images of the cracks.
The overall project conclusions are given in chapter 6. Suggestions for further study are also
included in this chapter.

Chapter 2 LITERATURE REVIEW
10
Chapter 2
LITERATURE REVIEW

Chapter 2 LITERATURE REVIEW
11
2.1. INTRODUCTION
PET has the most application among plastics and is found most commonly in daily life. It is used
especially in containers produced for storing and carrying food and liquids; in particular
carbonated soft drinks (CSDs). However, some cracking problems have been observed at the
bottom of bottles; due to either the geometrical shape of the petaloid base or the process
parameters.
In this literature review the development of the PET bottle is reviewed, followed by a discussion
of physical and chemical properties of PET and the factors that affect these properties. In the
third section the problem of cracks occurring in the bottle base is reviewed and its causes
investigated. In the fourth section, detail information is presented on PET bottle manufacturing.
In the fifth section, the material models that are used in simulation programs are explained. The
process parameters of the injection stretch blow molding (ISBM) such as blow pressure and
timings and their effects on PET bottle production are investigated in the sixth section. In the last
section, attention is focused on the optimization process in relation to the process parameters and
bottle base design, as well as preform design. Some explanations about the design process are
also presented.
2.2. DEVELOPMENT OF THE PET BOTTLE
PET poly (ethylene terephthalate) was developed in the 1940’s and since then it has played an
important role in the food and beverage packaging industry [Bjorksten et al., 1956]. Due to its
popularity the use of PET in carbonated soft drinks bottles has been studied extensively
[Bonnebat et al., 1981; Erwin et al., 1983; Cakmak et al., 1984; Leigner, 1985]. Initially, PET
bottles consisted of two pieces; the blown bottle section, and a separate ‘cap’section fitted over

Chapter 2 LITERATURE REVIEW
12
the over the hemispherical bottle base. The polyethylene cap section made the bottle self-standing.
In recent times, PET bottles have been made in one piece with a self-standing petaloid-shaped
base [Lyu and Pae, 2003].
The desirable properties of PET (clear, lightweight, high strength, stiffness, favorable creep
characteristics, low flavor absorption, high chemical resistance, barrier properties and low
price) [Bjorksten et al., 1956; Dominghaus, 1993] make it the material of choice for carbonated
soft drinks containers [Wang et al., 1998], fibers and films. Due to low cost, better aesthetic
appearance, and better handling, PET is being preferred over polycarbonate (PC) polymers
[VanderPlaats, 1999].
PET has been also known for many years as a textile fiber forming material. But lately, it has
started to be used in extrusion foam processing for textile fibers because of its elastic nature
[Yilmazer et al., 2000]. PET is also used as a recyclable polymer, and the markets for recycled
PET (R-PET) are growing by the year.
2.3. PET MATERIAL AND PROPERTIES
PET is commonly obtained through a polycondensation process by re-acting a dicarboxylic acid
(terephthalic acid) with a diol (ethylene glycol) and eliminating methanol, as shown below (fig.
2-1) [Joel, 1995].
n[H3COOC COOCH3 ] + n[ HO(CH2)2OH]
Dimethyl terephthalate Ethylene glycol

Chapter 2 LITERATURE REVIEW
13
[ -OOC COOCH2 CH2O ]n + 2n[ CH3OH]
Polyethylene terephthalate Methanol
Fig.2-1. PET synthesis reactions
The polymers obtained usually have high molecular weight, low carboxyl, and acetaldehyde
content, and they can be used for beverage bottle or industrial yarns [Chang et al., 1983]. Most of
the physical and mechanical properties of polymers improve as molecular weight increases. PET
follows this same trend and its organic repeat unit is as in fig. 2-2. End uses dictate the molecular
weight of the polyester. As the requirements of mechanical properties become more stringent,
higher molecular weight becomes necessary. The PET soft drink bottles should have an intrinsic
viscosity of 0.72 dl/g, a density greater than 1.38 g/cm3 and crystallinity greater than 40 percent
[Cobbs et al., 1953]. High molecular weight PET is produced by one of the following three
methods [Chang et al., 1983].
(1) Continuation of the melt polymerization of PET,
(2) Chemical coupling (interlinking) reaction,
(3) Solid state polymerization of PET
Fig.2-2. The repeat unit of Polyethylene terephthalate

Chapter 2 LITERATURE REVIEW
14
A project of solid-stating of PET at low molecular temperature was carried out by [Chang et al.,
1983]. PET polymerization is carried out by heating the pre-polymer containing higher carbon
content at temperatures below its melting point but above its glass transition temperature.
2.3.1. Crystallization behavior of PET
‘Crystalline’ means that the polymer chains are parallel and closely packed, and ‘amorphous’
means that the polymer chains are disordered [Robertson, 1993]. Most polymers exist as complex
structures made up of crystalline and amorphous regions. Crystallinity is usually induced by
heating above the glass transition temperature (Tg) and is often accompanied by molecular
orientation [Jabarin, 1984]. It is impossible to reach 100 % crystallinity with the lowest free
energy because polymers do not have a uniform molecular weight. Instead, the polymers can only
react to produce partly crystalline structures, usually called "semicrystalline" [Strobl, 1997].
The degree of polymer crystallinity depends on both intrinsic and extrinsic factors. Narrow
molecular weight, linear polymer chain structure, and high molecular weight are very important
pre-conditions in terms of obtaining high crystallinity [Robertson, 1993]. Crystallinity is also
affected by extrinsic factors, like stretch ratio, mode of extension and crystallization temperature
in the preparation of polymer films [Varma et al., 1998]. Below the glass transition temperature,
polymer chains are rigid; after reaching the glass transition temperature, the chains become more
flexible and are able to unfold under stress. If the temperature is above Tg and stretching is carried
out, the randomly coiled and entangled chains begin to disentangle, unfold, and straighten and
some of them even slide over their nearest neighbor chains [Benning, 1983].
PET is a crystallizable polymer because of its regularity in chemical and geometric structures. It
is either in the semi-crystalline state or in the amorphous state. The levels of crystallinity and

Chapter 2 LITERATURE REVIEW
15
morphology significantly affect the properties of the polymers [Groeninckx, et al., 1976;
Starkweather, et al., 1956; Dixon and Jackson, 1968]. Even with limitations in its barrier
properties and mechanical strength, crystalline PET is still widely used. Polymers with high
crystallinity have a higher glass transition temperature Tg ( Tg is 67° C for amorphous PET and
81° C for crystalline PET ) [Collins et al., 1973] and have higher modulus, toughness, stiffness,
tensile strength, hardness and more resistance to solvents, but less impact strength [Groeninckx,
et al., 1976; Starkweather, et al., 1956; Dixon and Jackson, 1968].
Crystallinity in PET is usually induced by thermal crystallization and/or by stress or strain-
induced crystallization. Thermally induced crystallization occurs when the polymer is heated
above Tg and not quenched rapidly enough. In this condition the polymer turns opaque due to the
spherulitic structure generated by thermal crystallization aggregates of un-oriented polymers
[Jabarin, 1982]. In stress-induced crystallization, stretching or orientation is applied to heated
polymer and the polymer chains are rearranged in a parallel fashion and become closely packed
[Salem, 1998]. The crystallization process is composed of nucleation and spherulitic
crystallization, and may occur at temperatures above Tg and below the melting point Tm [Miller,
1966]. Quenching the melt quickly results in a completely amorphous PET [Collins et al., 1973].
Crystalline polymers have a heterogeneous structure due to the interspersed amorphous regions
while amorphous polymers in all their forms (melts, rubbers, glasses, etc.) have a homogeneous
structure. Polymers are characterized by a glass transition temperature Tg and a melting
temperature Tm [Mark et al., 1985]. The glass transition behavior of semi-crystalline polymers are
greatly affected by the factors affecting degree of crystallinity such as molecular weight, amount
of crystalline phase and morphology [Groeninckx et al., 1976; Miller, 1966; Munk and
Aminabhavi, 2002; Newman and Cox, 1960; Illers and Breuer, 1963; Ito, 1974; Lee and Min,

Chapter 2 LITERATURE REVIEW
16
1999; Struik, 1978]. The glass transition temperature of semi-crystalline polymer is higher and
broader than that of the amorphous polymer [Groeninckx et al., 1976; Newman and Cox, 1960;
Illers and Breuer, 1963; Struik, 1978].
Crystalline polymers are characterized by a Tm and amorphous polymers are characterized by a
Tg. At the melting point, polymers are like a rubber-liquid. For crystalline polymers, the
following relationship between Tg and Tm has been described [Robertson, 1993].
Tg 2/3Tm (for unsymmetrical chains) (Equation 1)
and
Tg 1/2Tm (for symmetrical chains) (Equation 2)
PET has a Tg between 340 to 353 K (67 to 80 °C) and a Tm of 540 K (267 °C).
The crystallization of PET has been widely investigated. The Avrami equation was adopted by
[Keller and Lester, 1954], with using the density balance method, where the amorphous fraction
was calculated from the final density at that condition, rather than the density of 100% crystalline
PET. X-ray analyses and polarizing microscopy were used to observe crystalline structures.
Different structures could be obtained by adjusting crystallization temperature or previous melt
conditions. The maximum rate of crystallization occurs at 180°C. Further research in this subject
has also been reported [Rybnikar, 1960; Lu and Hay, 2001; Misra and Stein, 1972].
Studies have been conducted on the kinetics of crystallization of different commercial PET
materials in terms of the Avrami equation with a Differential Scanning Calorimetry (DSC)
method and confirmed that the rate constant k is very sensitive to crystallization temperature

Chapter 2 LITERATURE REVIEW
17
[Jabarin, 1987]. Different PET samples have different crystallization mechanisms. With
increasing crystallization temperature, spherulite diameter increases [Keller, 1955].
Ozawa studied the kinetics of dynamic crystallization of PET. He obtained crystallization curves
through DSC at different cooling rates [Ozawa, 1971]. A modified Avrami equation was applied
to the primary crystallization in a non-isothermal situation. Jabarin compared the crystallization
rate parameters of both isothermal and dynamic processes, and found that they are similar to each
other in terms of mechanisms of crystallization. A method was developed to predict the minimum
cooling rate required to obtain non-crystalline PET [Jabarin, 1987].
In addition to time and temperature, many other factors such as pressure, the degree of molecular
orientation [Alfonso et al., 1978] and environment [Jabarin, 1998] have influence on
crystallization mechanism, morphology, and final properties of PET. Nucleating agents also
affect the crystallization of PET. Some studies have investigated the effect of the additives on
crystallization behavior [Groeninckx et al., 1974; Mitra and Misra, 1988].
The crystallization behavior of PET with and without catalysts has been compared by [Asano et
al., 1989]. They found that nucleation has a great influence on overall crystallization rate at low
temperatures near Tg. Moisture and molecular weight have a great effect on crystallization
[Jabarin, 1987a; 1987b]. It is found that the kinetics of crystallization depends on molecular
weight and that with increasing percentage of moisture, the half-time crystallization and
induction time of crystallization decrease. Spherulite growth rate was independent of water
absorbed [Jabarin, 1987a].
Stress is an important factor, affecting crystallization. The effect of stress-induced crystallization
of PET has been investigated with density measurements, wide-angle X-ray diffraction and

Chapter 2 LITERATURE REVIEW
18
small-angle light scattering measurements [Misra and Stein, 1975]. Amorphous PET films were
stretched at constant strain rates below and above Tg. The stress-induced crystallization has also
been analyzed as a function of time and orientation level [Venkateswaran et al., 1998].
[Marco et al., 2002] focused on the crystallinity induced by stretching PET at temperatures above
the glass transition, and on the influence of stretch and blow molding parameters on the
properties of the final product.
A study has been conducted with PET material and found that reducing the shot size (amount of
material injected into the mould cavity) will minimize crystallinity while hold time (length of
time the gate remains open allowing more material to be pushed into the mold cavity) has no
effect at the lower shot size. However, with a larger shot size, a low hold time is necessary to
reduce crystallinity. The least crystallinity occurs with minimum hold time and minimum shot
size [Zagarola, 1998].
In a study conducted by [Hanley et al., 2006], it was found that the extent of the orientation and
crystallinity depends upon the geometry of the bottle base, and that there is an abrupt change
from the amorphous region to the crystalline regions. The valley and the transition region to the
foot are the most biaxially oriented regions of the base. The orientation in the middle of the foot
is more circular and the crystallization is less. This shows that the stretch in this region is more
uniaxial (or less biaxial), but crystalline lamellae are still observed.
Some experimental works has been conducted on the orientation and crystallization of PET films
subjected to uniaxial or biaxial drawing under industrial processing conditions [Chevalier et al.,
1999; Yang et al., 2004; Blundell et al., 1999; 2000; Mahendrasingam et al., 1999; 2000]. The

Chapter 2 LITERATURE REVIEW
19
changes in the degree of orientation and crystallinity have been investigated using the wide-angle
X-ray scattering (WAXS) technique [Blundell et al., 2000]. By analyzing the crystalline
diffraction patterns, they found that the orientation of the developing crystals depends on the
relation of the draw rate and temperature to the chain relaxation process, and that the
crystallization rate is highly temperature dependent. Everall et al. used polarized attenuated
reflection infrared spectroscopy to quantify biaxial orientation in PET films and stretch blow
molded bottles [Everall et al., 2002].
Crystallization may be due to many nuclei centres forming small spherulites at low temperatures.
Larger crystal structures may be obtained when the material is crystallized at higher temperatures
or by slow cooling from the melt, but 100% crystallinity is never possible in normal processing
conditions [Miller, 1966; Munk and Aminabhavi, 2002]. Usually the percentage crystallinity is
lower than 90% [Munk and Aminabhavi, 2002]. In general, polymeric materials are semi-
crystalline with crystalline and amorphous phases co-existing [Boyer, 1975]. Schematic diagrams
of the completely amorphous phase and the morphology of semi-crystalline polymers are shown
in fig. 2-3 and 2-4 respectively [Boyer, 1975] [Joel, 1995].
Fig.2-3. Schematic diagram of completely amorphous phase [Boyer, 1975]

Chapter 2 LITERATURE REVIEW
20
Fig.2-4. Schematic morphology of semi-crystalline polymers [Joel, 1995]
a) Schematic appearance b) Alignment of semi-crystalline layers c) Microscopic appearance
The morphology is described by the spherulite radius, lamellar thickness and long period;
distance between two adjacent lamellae. Small angle light scattering, microscopy, and X-ray
analyses are usually applied to obtain these parameters [Miller, 1966]. Even at the same
crystallinity content, samples crystallized at higher temperature are more opaque and brittle
[Keller and Lester, 1954]. Samples with smaller spherulite sizes have higher yield stress, lower
ultimate elongation and high brittleness temperature [Starkweather et al., 1959] and higher
impact strength [Ohlberg et al., 1959].
2.3.1.1. Crystallinity calculation
Several methods have been used to determine the amount of crystallinity [Chua and Lye, 1998;
region

Chapter 2 LITERATURE REVIEW
21
Jabarin, 1998]. They include density measurement, X-ray diffraction, infrared absorption, nuclear
magnetic resonance (NMR), and differential scanning calorimetry (DSC). However, the
calculated results may vary with the methods used [Miller, 1966].
Density measurement is one of the best methods of quantifying percent crystallinity [Cobbs et al.,
1953]. The crystallinity of a polymer can be easily calculated using this method because there are
differences of density between crystalline and amorphous regions in polymers, and the
relationship is in proportion to the degree of crystallization. The first method is given at [ASTM,
2000]. Here, calculation is made by comparing sample weights in air and in isopropanol using the
following equation:
( )( )
c
a
c ρρρρχ
−−=
(Equation 3)
Where χc is the polymer crystallinity; ρ is the measured density of PET sample; ρa is the density of
amorphous PET; and ρc is the density of crystalline PET.
A second method to calculate crystallinity is an estimate based on the measured density using
carbon tetrachloride and n-heptane in a density gradient column [Maruhashi, 2001].
( )
( ) 100x %ac
ac
c ρρρρρρχ
−−= (Equation 4)
Where is Xc the % crystallinity; ρ is the measured PET sample density; ρc is the crystalline PET
density; and ρa is the amorphous PET density.
Another method, which is widely used, to analyze thermally induced property changes of a
polymer is Differential Scanning Calorimetry (DSC). This is based on recording the heat flow that

Chapter 2 LITERATURE REVIEW
22
is added to either the sample or the reference [Brody, 2001]. The initial crystallinity can be
calculated by determining the total enthalpy change in the temperature range of glass transition
and the equilibrium melting temperature between the sample and perfectly crystallized material
[Reading et al., 2001].
100
cH
H
∆∆=χ (Equation 5)
Where ∆H is the measured enthalpy of melting the sample; and ∆H100 is the enthalpy of melting a
100 % crystalline sample of the same material. In practice, a 100 % crystalline polymer cannot be
achieved, so ∆H100 is replaced by the enthalpy of fusion per mole of PET (∆Hu) [Hatakeyama and
Quinn, 1994].
Infrared absorption is based on the observation that infrared intensity changes accompany
crystallization. A method has been developed to study the isothermal crystallization process of
PET film [Cobbs and Burton, 1953]. Schmidt [1963] demonstrated that the band intensity change
of stretched PET can be interpreted by orientation and structural factor. Lofgren and Jabarin used
polarized internal reflectance spectroscopy (IRS) to evaluate molecular orientation and
crystallinity of PET film surfaces and found that this technique can be used for characterization of
the structure of oriented and crystalline PET when the sample is not restricted by its thickness and
clarity [Lofgren and Jabarin, 1994].
For beverage bottles with the volumes greater than 2 litres, PET l is preferred because when
subjected to an elongational deformation, at a certain true strain, the material becomes much
stiffer, so that it resists further deformation [Wang et al., 1999].

Chapter 2 LITERATURE REVIEW
23
The amorphous phase of PET contains both trans and gauche isomers; while the crystalline phase
is in the trans form only (fig. 2-5a, b). At any given levels of crystallinity, the amount of
conformational structure may be different [Schmidt, 1963].
Fig.2-5. Three dimensional structures of rotational isomers of PET [Schmidt, 1963]
(a) Trans, (b) Gauche
2.3.2. Physical aging
Physical aging which is also called internal aging [Ehrenstein, 2001] is a time-dependent
behavior of glassy systems; which include both polymeric and low molecular weight materials
[Struik, 1978; Tant and Wikes, 1981; Hutchinson, 1995]. It is generally observed in amorphous
polymers and partially crystalline PET. Physical aging is a reversible process causing no
permanent modification of the structure [Struik, 1978]. This is different from chemical aging and
biological aging in which the polymer structure is permanently affected.
Physical aging causes some material property changes. These include thermal, mechanical, and
electrical properties. Aging will generally cause glass transition temperatures to shift to higher
positions, brittle failure to increases, and density and enthalpy of relaxation values to increase
[Tant and Wikes, 1981]. In the studies carried out, it is found that during aging, density, yield
stress, drawing stress and elastic modulus increase, while impact strength, fracture energy,
(a) (b)

Chapter 2 LITERATURE REVIEW
24
ultimate elongation and creep rate decrease [Tant and Wikes, 1981; Jabarin and Lofgren, 1992;
Azar et al., 1983].Various techniques have been used for in-depth studies of property changes due
to aging [Tant and Wikes, 1981; Hutchinson, 1995; Lu and Hay, 2000; Moore et al., 1981].
Dynamic Mechanical analysis (DMA) [Tant and Wikes, 1981], Differential Scanning
Calorimetry (DSC) [Lu and Hay, 2000], Fourier Transform Infra-red (FTIR) spectroscopy
[Moore et al., 1981] are frequently used to test mechanical property responses to aging. Recently,
a positron lifetime annihilation technique has been used to study the physical aging process
[Sathyanarayana et al., 2002].
Lu and Hay studied the effect of physical aging on the rate of cold crystallization of PET by DSC
[Lu and Hay, 2000]. They found that aging accelerates the crystallization rate. In amorphous PET
during volume recovery by FTIR, the changes in conformation have been characterized by
[Moore et al., 1981]. They suggested that changes detected with FTIR spectroscopy may have a
correlation with the onset of brittleness. Tant and Wilkes studied the physical aging of
semicrystalline PET of various crystallinities by stress-strain behavior, stress relaxation, and DSC
measurement. They concluded that semicrystalline polymer undergoes physical aging and with
increasing crystallinity, the extent and rate of physical aging decreases [Tant and Wilkes, 1981].
As aging time increases the glass transition peak rises to higher temperatures [Canadas et al.,
1998]. However, it was found that the whole amount of the amorphous phase was almost constant
during the aging for the small change of density [Zhao et al., 2002].
Gas permeation is also sensitive to physical aging. With increasing aging time, gas permeability
decreases [Dorkenoo and Pfromm, 1999]. The decrease of the gas permeability is often attributed
to the loss of free volume [McCaig and Paul, 2000].

Chapter 2 LITERATURE REVIEW
25
2.3.2.1. Factors affecting aging
There are many factors that may affect the aging process. These are water absorption [Zelkó et al.,
2000; Sűvegh and Zelkó, 2002; Sun et al., 1999; Berens and Hodge, 1984; Han and McKenna,
1997; Jabarin and Lofgren, 1986; 1986; Launay, 1999] sample thickness [Dorkenoo and Pfromm,
1999; McCaig and Paul, 2000; Pfromm and Koros, 1995; McCaig et al., 2000], stress [Berens
and Hodge, 1984] and molecular weight. On the other hand, aging time and temperature are
controlling factors [Mark et al., 1985]. It was found that the glass transition temperature,
crystallization temperature, degree of orientation and yield stress decreased because of the
absorbed water [Jabarin and Lofgren, 1986; 1986; Jabarin, 1998] and the diffusion coefficient
increases with temperature [Launay, 1999].
2.3.3. Mechanical property changes
Temperature and strain history are important factors for the mechanical properties of PET [Yang
et al., 2004]. Its stress-strain curve shows strong strain-softening followed by strain-hardening
under large strains. It is also found that a relatively broad molecular weight provides good
physical properties and processibility [Strebel and Benson, 1996].
2.3.3.1. Orientation
Orientation is a process of stretching the polymer material under heat to align the molecular
chains [Robertson, 1993]. Orientation improves the strength and durability to polymer material
[Stuart, 2002]. In addition, other physical properties such as tensile and impact strengths, stiffness,
clarity, resistance to crazing (cracking), and barrier characteristics may also be significantly
enhanced in oriented films. On the other hand, orientation may cause detrimental effects on
elongation. Common commercially oriented films include PET, low density polyethylene,
polyamide, polypropylene.

Chapter 2 LITERATURE REVIEW
26
Polymers can be oriented in either one direction (uniaxial orientation) or in two directions (biaxial
orientation). Biaxial orientation is more widely used in film manufacture. Polymers are stretched
at a temperature above the glass transition temperature but below the melt temperature. This is the
method most used in practice to orient the polymer material. Below the glass transition
temperature, polymer chains are rigid; they become more flexible at the glass transition
temperature and are able to unfold under stress. If stretching is above Tg, the polymer chains,
which are randomly coiled and entangled, begin to disentangle, unfold, and straighten [Benning,
1983]. Orientation ensures more crystallization while the chains and crystalline structure align in
the direction of stretching. The best process conditions are where maximum chain uncoiling and
alignment, and minimum viscous flow, or chain slippage, are achieved [Munk and Aminabhavi,
2002].
Some studies have been conducted on the molecular structure of PET [. Brooks and explored the
molecular organization of PET molecules in the petaloid bases of high quality bottles, and bottles
that had split under load under a range of controlled experimental conditions (e.g., temperature,
shear, and chain composition) through small-angle X-ray scattering (SAXS) technique [Brooks
and Giles, 2002]. It was found by the symmetry of the SAXS pattern that there is no preferred
orientation of the molecular chains. However, Hanley et al. found that biaxial orientation of the
PET crystallites occurred across a foot and down a corresponding valley in the base of the
petaloid shaped bottles [Hanley et al., 2006].
Hoop extension in the bottle walls is achieved by pressure applied to the inner wall of the
preform in the blowing stage. Differences in hoop extension in the inner and outer surfaces of a
bottle wall result in differences in morphological properties of the inner and outer surfaces of the
bottles [Everall et al., 2002].

Chapter 2 LITERATURE REVIEW
27
In a project titled “visualization study and analysis on preform growth in polyethylene
terephthalate stretch blow molding” Huang et al. compared the profiles of different preform types;
dolphin, sandpile, and two-bubble-type. They concluded that the inflating speed of the stretched
preform for the dolphin-type preform growth was higher than that of the sandpile-type and two-
bubble-type preform growths [Huang et al., 2006]. Uniformity of thickness in the final bottle is
very important in mitigating against environmental stress cracking, and since preform shape
directly influences thickness the design of the preform is very important.
The central region of the bottle base does experience some thinning during the stretch blow
molding process, but this region should be amorphous for good bottles after processing. However,
reduced thickness leads to reduced strength of the base, until the material is stretched far enough
for strain hardening to occur, at which point there is a dramatic increase in overall strength
[Hanley et al., 2006].
2.3.3.2. Influence of orientation conditions on PET films
A way of enhancing PET mechanical properties is to orient the material by controlling polymer
morphology. When the force is increased to stretch the film stretch ratio, chain orientation, and
elastic modulus increase along the stretch direction. However, the relation between drawing
parameters, polymer structure, and mechanical properties of oriented films is very complex [Ward,
1975].
Most of the commercially used PET is biaxially drawn at a constant extension rate in two modes:
sequential or simultaneous. For simultaneous drawing, the temperature is normally between 80
and 95°C. For sequential drawing the temperature in the forward draw is generally in the 80-95°C
range, and in the transverse draw it is usually 5-10°C higher [Salem, 1999]. Satoto et al. [1999]

Chapter 2 LITERATURE REVIEW
28
have focused on molecular mobility in PET films that were unstretched and biaxially stretched at
90°C and 95°C, and found that the unstretched sample had less thermal stability to temperature
change than the stretched samples.
A number of studies on the effect of orientation on the barrier properties of PET are reported in
the literature [Fan et al., 2000; Osborn and Jenkins, 1992; McEvoy et al., 1998; Chevalier et al.,
1999; Chevalier, 1999]. Fan et al., [2000] have conducted a significant study of biaxial stretch
ratio effects on PET film permeability and showed that the carbon dioxide permeability of
oriented PET film was much more influenced by the stretch ratio in the machine direction (MD)
than the stretch ratio in the transverse direction (TD). They also stated that there is a slight
decrease in permeability with an increase in the TD stretch ratio and also that the best stretch ratio
pair for reducing carbon dioxide permeability was 3.5 MD x 3.0 TD in this condition.
Some studies have been made of the effect of changes in the degree of PET orientation and
crystallinity over a wide range of drawing rates and draw ratios using the wide-angle X-ray
scattering (WAXS) technique to analyze the crystalline diffraction patterns [Blundell et al., 1999;
2000; Mahendrasingam et al., 1999; 2000]. They have found that the orientation of the developing
crystals depends on the relation of the draw rate and temperature to the chain relaxation process,
and that the crystallization rate is highly temperature dependent.
The biaxial orientation in PET films and stretch blow molded bottles has been examined using
polarized attenuated reflection infrared spectroscopy [Everall et al., 2002] and it was found that
there were significant gradients in orientation through the film thickness and bottle walls. They
also reported that the bottles exhibited complex orientation patterns that depend on preform and
mold design, which may be associated with the temperature non-uniformity and changes in the

Chapter 2 LITERATURE REVIEW
29
preform during stretch-blow molding.
A series of studies on the structure and properties of biaxially stretched PET sheets under different
temperatures and orientation rates were conducted by [Maruhashi, 2001; Maruhashi and Asada,
1996]. The results showed that thermal shrinkage was very small at 85°C, which is hot-filling
temperature, for sheets stretched at both high temperature and high speed. Sheets stretched at a
higher temperature and a lower speed, were easy to soften at 85°C because molecular segment
relaxation occurred under these conditions, instead of crystallization. Sheets stretched at a lower
temperature (85°C) showed large thermal shrinkage, although there was high crystallinity in the
sheets due to the large increase in strain during stretching.
Some researchers [e.g. Jabarin, 1984; 1992] also carried out numerous studies of orientation and
stress-induced crystallization of PET. Their research indicated that the mechanical and transport
properties of PET are directly dependent on the degree of orientation, and that stress-induced
crystallization of annealed, stretched PET can be processed depending on the residual degree of
orientation. A super-molecular structure is also found by [Evstatiev et al., 1992]. This structure is
formed by cold-drawing of rapidly quenched PET films that were highly organized and consisted
of a relatively large number of maximally extended chains in the amorphous regions.
Various measurement techniques are currently available in industry to examine and interpret the
structures and properties of the polymer based on different macromolecular or morphologic
characteristics. They include light scattering, wide-angle X-ray and small-angle X-ray diffraction
[Sathyanarayana et al., 2002].

Chapter 2 LITERATURE REVIEW
30
2.4. ENVIRONMENTAL STRESS CRACKING
Studies of environmental stress cracking (ESC) began in the 1950s when it was observed in
polyethylene natural gas pipes [Howard, 1959]. (ESC) is a brittle failure initiated by surface
imperfections and occurs when the glassy polymer is exposed to an aggressive medium and
loaded at low stress for a long period of time [Howard, 1959]. At least 15% of all plastic failures
in service are due to ESC [Wright, 1996].
ESC has a number of causes. It is a time-dependent brittle failure process, which depends on
environmental factors such as chemical solution and stress [Jabarin, 1998]. In general, studies
made have been focused on the mechanism of crazing: from craze initiation and craze growth
until failure, because a craze is the precursor of ESC behavior. The failure mechanism of
polystyrene thin film was investigated by means of electron microscopy [Wellinghoff and Baer,
1975]. It was found that the heterogeneous surface initiates small voids (< 30nm in diameter)
which coalesce in response to stress concentrations. Crazing is as a result of a repetition of the
above two processes.
There are two simple viscoelastic criteria to predict craze initiation. According to Wright and
Gotham, the total critical tensile strain is composed of two components under constant stress
[Wright and Gotham, 1983]. These are elastic strain and inelastic strain:
( ) ( ) ( ) K 0inelasticelasticc +=+= σεεε J (Equation 6)
Where J (o) is the elastic compliance and σ is the applied stress.
Under constant strain (ε) conditions,

Chapter 2 LITERATURE REVIEW
31
( )
−⋅=ε
σσ Kc 10 (Equation 7)
Where σc is the critical stress and σ (o) is the instantaneous maximum stress generated under
stress relaxation conditions.
The inelastic strain contains both delayed elastic and viscous elements. Crazing occurs as the
inelastic strain reaches a critical value (K). For many polymer- environment combinations, K is
lower than 0.1%.
For the second criterion; under constant stress conditions,
( )σσε c
c
WJ += 0 (Equation 8)
Moreover, under constant strain conditions:
( )( )c
c
c
W
σσσ
−=
0 (Equation 9)
Crazing is observed as the inelastic tensile strain energy density exceeds a critical value Wc,
which has a typical order of 0.1 N mm/mm.
Surface energy mechanisms and plasticization are two widely held theories to explain the role
the environment plays in stress cracking [Yaffe and Kramer, 1981; Bernier and Kambour, 1968;
Kefalas, 1995]. The first theory postulated that the ESC agents reduce surface tension and are
adhesive on polymer surface, and thus reduce the surface energy for craze initiation. In the
plasticization theory, ESC agents act as plasticizers to reduce resistance to craze formation.

Chapter 2 LITERATURE REVIEW
32
Material structure variables, including molecular weight, lamellar orientation and branch length
have great influence on ESC behavior. As polymers with high molecular weight have long
chains in their molecular structure, their ESC resistance is usually high [Joao et al., 2000;
Lustiger, 1986]. Whilst craze initiation is independent of molecular weight craze development
and breakdown increase with molecular weight according to Fellers and Kee. [Fellers and Kee,
1974].
Crystalline content and its nature also affect ESC. Whilst many studies have been conducted into
ESC, the conclusions on this phenomenon are not consistent. It is generally agreed that
amorphous plastics are more susceptible to ESC than semi-crystalline plastics because of their
poor permeation barrier [Wright, 1996]. However, for polyethylene, ESC resistance decreases as
crystallinity increases [Howard and Martin, 1960]. A graphic model for the brittle failure of
semi-crystalline polymers was presented by [Lustiger and Markham, 1983] under ESC
conditions. When a low level of stress is applied tie molecule chains, which begin and end in
adjacent lamellae, are stretched. The stretching can be maintained for a long while without
breaking the chain because it is under low stress. After a certain time, as most tie molecules
begin to untangle, brittle failure occurs. If the polymer molecules are in a liquefied environment,
the tie molecules are “lubricated” and failure is accelerated.
Hittmair and Ullman [1962] studied ESC in polyethylene and found that crazing occurred along
the spherulite diameter. That the ESC of semi-crystalline polymer is an “interlamellar failure
process” is confirmed by other researchers [Lustiger and Markham, 1983; Peterlin, 1975].
A study has been conducted using X-ray diffraction, optical microscopy and constant strain rate
tensile tests [Shanahan et al., 1980]. It was found that the greater ESC resistance occurs at the

Chapter 2 LITERATURE REVIEW
33
same degree of crystallinity, as spherulite size gets smaller, and that craze propagation is
hindered by the presence of spherulites.
Thermal history is another factor affecting ESC resistance of polymers. Arnold studied the
effects of physical aging on the brittle fracture behavior of polystyrene [Arnold, 1995]. He found
that longer physical aging time reduced the lifetimes of all samples, because physical aging
reduced the toughness and reduced the craze strength, resulting in brittle fracture. The crazes
formed in ethanol were examined by means of transmission optical microscopy and scanning
electron microscopy and it was found that longer aging time will delay craze formation, but that
these crazes are less stable than those formed at the early stage.
Resin properties have effects on resistance to ESC. In general, lowering density increases crack
resistance and copolymers have higher crack resistance than homopolymers [Strebel and Benson,
1996]. Jabarin and Lofgren [1992] studied the environmental aging and stress-cracking behavior
of homopolymer and copolymer PET at 30°C. They found the number of crazes which developed
under stress increased as exposure time increased. At equivalent conditions, the higher the
copolymer concentration (in terms of cyclohexane dimethanol (CHDM)) the more crazes are
formed. However, without a stress cracking agent more samples exhibited brittle failure during
tensile testing. When no stress acted on the samples no crazes developed. Brittle failure occurred
in these samples when aging time was long enough. They concluded that brittle failure may be
related to crazing, but it must be caused by other factors, such as enthalpies of relaxation.
The ESC behavior of amorphous PET in aqueous NaOH at ambient conditions was investigated
by Moskala [1998]. In that study, creep crack growth rate was determined as a function of the
applied stress intensity factor (K). It was found that the crazing growth was discontinuous and

Chapter 2 LITERATURE REVIEW
34
was due to the virgin polymer and the hydrolysis effect. At same value of K, crack growth rate
increased with increased NaOH concentration.
2.4.1. Environmental stress cracking in PET bottles
High environmental stress crack resistance is one of the primary requirements of PET bottles
used for commercial and industrial containers. In an aggressive environment, these bottles must
withstand low stresses for long periods without cracking [Strebel and Benson, 1996].
Both resin and processing variables affect crack resistance. Strebel and Benson conducted a study
to determine the effects of blow-molding process variables on crack resistance in high-density
polyethylene (HDPE) bottles. They focused on the effects of mold temperature, melt temperature,
die temperature, molding time, blow time and drop time (the time in which the bottle is released).
Tests were carried out using internal pressure for bottles blown at each condition, and it was
found crack resistance decreased with increasing die temperature, mold temperature and mold
time, increased with increasing drop time [Strebel and Benson, 1996]. However, George and
O'Shea reported an increase in crack resistance with decreasing mold temperature [George and
O'Shea, 1990].
It could be conjectured that increased die temperature reduces the viscosity of the PET resulting
in increase in the bottle base weight. However, for one type of polycarbonate, it was found that
increasing the die temperature actually increased stress crack resistance [Roseblade, 1983].
The use of a petaloid shape for the base of carbonated PET bottles is widespread, but sharp
angles in the complex geometry of this shape become stress concentrators, and environmental
stress cracking mostly occurs in the bottle base. Because PET is less oriented near the injection

Chapter 2 LITERATURE REVIEW
35
gate and is most exposed to stress crack agents [Zagarola, 2000] unfortunately, this phenomenon
has been little studied and it is not accurately understood [Brooks and Giles, 2002].
In general, two types of cracking are encountered; radial and circumferential. Radial cracks (fig.
2-7a) begin at the center of the base and go outwards, whereas circumferential cracks (fig 2-7b),
are located some distance from the base center [Lyu and Pae, 2003].
(a) Cracks in radial direction (b) cracks in circumferential direction
Fig.2-6. Cracks in the petaloid bottom of the bottle [Lyu and Pae, 2003]
A study using Small-Angle X-Ray Scattering has been conducted by Hanley et al. [2006] on the
molecular morphology of the petaloid bases of PET bottles. They have said that the likelihood of
failure by cracking is directly related to the polymer morphology in the petaloid base and that,
therefore, the production process can significantly influence cracking susceptibility. They found
that the polymer chains in the central region of the bottle base are circumferentially aligned but
also non-crystalline and also assumed that the alignment happens during the stretch blow molding
stage and the morphology is fixed by quenching the temperature before the chains have time to
relax. They concluded that the maximum principle stress was located in the valleys of the petaloid
base and that crazing strongly influenced crack formation.
Location of Leakage Location of Leakage

Chapter 2 LITERATURE REVIEW
36
It is also reported that crazing occurs in brittle materials under tensile stress [McCrun et al., 1997;
Sternstein et al., 1968] and that high temperatures accelerate the stress crack development so that
cracking failures typically occur more often in warmer climates [Zagarola, 2000; Hanley et al.,
2006]. Thus, the crazing is strongly related to ambient temperature as well as the tensile
principal stresses.
A further study has been concluded by Lyu and Pae [2003] and found that there are three key
design parameters (fig. 2-8 and 2-9) affecting circumferential cracking in the bottle base; foot
length, valley width and clearance (the distance from the centre of the base to the surface that the
bottle stands on).
Fig.2-7. Valley width and foot length Fig. 2-8. Clearance
Cracks occur in the transition region [Zagarola, 2000; Lyu and Pae, 2003; Hanley et al., 2006]
because of thinning of the base, but only in regions where the stretch ratio was not yet great
enough to induce strain hardening and crystallization [Lyu and Pae, 2003]. The region where the
cracks do not occur corresponds to the amorphous region [Hanley et al., 2006].
Lyu and Pae redesigned the petaloid shape in a 2 lt PET bottle using results from a study of the
maximum principal stress in the bottle [Lyu and Pae, 2003]. They observed base cracking in a

Chapter 2 LITERATURE REVIEW
37
solvent cracking test, and analyzed the effective stress and the maximum principal stress in a
carbonated bottle using computer simulation. They concluded that the cracks were due not only to
insufficient strength of material (because of insufficient stretching of the PET), but were also due
to the design of the petaloid shape. The highest maximum principal stress occurred at the valley of
the petaloid, in a circumferential direction, and was a major cause of the cracking.
Because the geometry of the base is complicated, it is difficult achieve a stretch ratio above the
natural draw ratio in this area [Bonnebat et al., 1981]. Some researchers therefore performed their
work by changing the dimensions of the parameters on the petaloid base [Lyu and Pae, 2003].
Stretching and temperature are only two of the parameters important to the arrangements of
polymer chains [Yang et al., 2004]. The increments of the stress were found to be very small for
low stretch ratios in PET stretched at elevated temperature [Venkateswaran et al., 1998;
Dumbleton, 1968; Rietsch, 1990]. The polymer chains are arranged in the stretching direction as
the stretch ratio increases. Subsequently, the stress increases drastically as the stretch ratio
increases after a certain point of the stretch ratio.
Abrupt thickness reductions without compensating increases in the material strength cause the
structural weakness in the bottle base. Therefore, to prevent cracking, the stretch ratio in bottle
blowing should be higher than the hardening point so that mechanical properties relevant to the
molecular orientation can be at the acceptable level, and at the same time, the maximum principal
tensile stress should be lowered or minimized at the valleys of the petaloid [Lyu and Pae, 2003].
The same authors have also concluded that a large foot length, large clearance, and narrow valley
width can be used to prevent the circumferential cracks on the bottle base regardless of the bottle
size.

Chapter 2 LITERATURE REVIEW
38
There are many methods developed for ESC testing [Wright, 1996]. Single cantilever or three-
point bending for rigid materials, bent- strip test for flexible materials, tensile, creep rupture and
tensile creep methods are widely used. Micro-hardness measurement has been accepted as a new
test method.
Choi et al. investigated the ESC mechanism and cracking failure characterization of high density
polyethylene (HDPE) by means of scanning electron microscopy [Choi et al., 2007]. They have
observed differences in morphology of the cracks and they concluded that the samples with
fibrillar cracks showed high stress crack resistance whereas samples with sharp, straight cracks
showed low stress crack resistance values.
The role of injection and blow molding set-up in reducing the bottles’ vulnerability to stress
cracking has been discussed by [Zagarola, 2000]. He discussed process optimization for stress
crack resistance and illustrated typical key process variables affecting stress cracking; including
interactions with injection molding variables. He concluded that crude bottle base design, the size
of bottles with greater diameters, and abrupt transitions at the bottle base make the bottle
vulnerable to stress cracking and also that the injection process, the blow process, and the age of
the preform (older is more susceptible) affect bottle durability.
Zagarola lists the key factors , affecting vulnerability to stress crack failures as follows:
crystallinity in the preform gate that penetrates through the end cap surface; crystallinity rings in
the end cap; contamination; too low intrinsic viscosity; excessive injection packing; abrupt
thickness transition from thick to thin as in the base from the gate to the foot; poor molecular
orientation in the base or neck , usually reflected as excessive base thickness; brittle bases from
excessive preform or bottle storage.

Chapter 2 LITERATURE REVIEW
39
[Zagarola, 2000] has demonstrated in his study that one of the key control factors was the hold
time for the injection process. He also found that most stress resistance was achieved with the
lower weight (less packed) preform, and that the greater stretch pressure consistently increased
ESCR.
Perhaps the most important finding from Zaragola’s investigation was that thickness and base
clearances have no relation with good or poor resistance. He illustrated all obtained results
through scatter diagrams.
The literature provides some leads to improving the stress crack resistance properties of blow-
moulded bottles. The following are a selection:
• Since cooling rate affects the morphology and properties of the product, the mold should be
quickly quenched to reduce crack propagation rates. [Shanahan et al., 1980; George and
O'Shea, 1990; Strebel and Moet, 1995].
• It is not necessary to cool blow-molded bottles with liquid nitrogen because this does not
affect stress crack resistance [ASTM, 2005], and only slightly improves top-load resistance
[Gibbs, 1989].
• Bottle contact with the mold should be only long enough to solidify the melt [Strebel and
Benson, 1996].
• The injection speed should be slowed or the barrel temperature reduced for polycarbonate
[Roseblade, 1983] and also processing of fluoropolymers under high temperatures or high
shear decreases stress crack resistance [Imbalzano et al., 1991].

Chapter 2 LITERATURE REVIEW
40
• PET bottle preforms should be firstly injection molded in batches and cooled to room
temperature so that the preform is virtually amorphous. For the stretch blow moulding stage
preforms should be reheated above the glass transition temperature, but below the cold
crystallization temperature. Hereby, the crystallinity and molecular orientation are to be
induced [Rosato and Rosato, 1989].
2.5. MANUFACTURE OF PET BOTTLES FOR CARBONATED SOFT DRINKS
PET bottles for carbonated beverages started to be produced in the mid 1970’s by the Dupont
Company, from PET resin by biaxially orientating it [Rosato and Rosato, 1989]. Since then, PET
bottles are now widely used in packaging carbonated beverages, bottled water and other
beverages such as juices and liquor, because of the excellent mechanical properties, gas barrier,
chemical resistance, clarity and gloss [Marco et al., 2002].
There are two main types of PET bottle used commercially in the beverage industry; one for
carbonated beverages and one for hot-filled drinks [Maruhashi and Asada, 1996]. Carbonated
beverage bottles require strength to withstand the higher internal pressure of typical carbonated
soft drinks, and hot-filled bottles, greater thermal stability with less shrinkage at a temperature of
85°C [Robertson, 1993; Briston, 1992].
In the industry, there are a few kinds of processing methods developed to process polymer
materials. These methods vary depending on the quality of polymer material to be produced, the
type of polymer resins used, the quality of the production desired. In general, there are currently
three kinds of processing methods and these are as follows; (1) Extrusion Blow Molding (2)
Injection Blow molding (3) Injection Stretch Blow Molding

Chapter 2 LITERATURE REVIEW
41
2.5.1. Injection stretch blow molding
The injection stretch blow molding process is used for the production of containers having biaxial
molecular orientation, such as for beverages, food, household, industrial and pharmaceutical
products. The most commonly used material is PET, since it offers excellent clarity, good
mechanical and barrier properties, and ease of processing [McEvoy et al., 1998; Thibault et al.,
2007; Martin et al., 1999].
There are two distinct stretch blow molding techniques; the one-stage process; and the two stage
process. In the one-stage process the preform (shaped like a test tube, Fig. 2-11) is injection
molded, conditioned to the appropriate temperature, and blown into a container; all in one
continuous process [McEvoy et al., 1998].
In the two-stage process, there are three steps (Fig. 2-10). The Preform is injection molded
separately and stored at ambient temperature until the time necessary. It is then reheated using
infrared heating elements to the desired forming temperature range (90 to 110°C) and blown to
the final shape. During blowing the sides of the bottle are stretched bi-orientational (longitudinal
then radial); whereas the shoulders and base of the bottle are not stretched as much. A typical
bottle profile is shown in Fig. 2-11. Finally, the stretched and blown bottle is removed from the
mold and kept at ambient temperature for solidification. During the blowing stage, the preform is
stretched in the vertical direction by a cylindrical rod. A pre-blow pressure is applied inside the
preform to prevent contact between the stretching rod and the inside wall of the preform; which
may lead to container defects, When the stretch rod reaches to the base of the bottle, a high blow
pressure is applied in the radial direction to complete the final bottle shape and maximize cooling
efficiency. The blow pressure air is applied for few seconds and the product is finally taken out
of the mold [McEvoy et al., 1998; Thibault et al., 2007; Baczek, 2003].

Chapter 2 LITERATURE REVIEW
42
Because of the relatively high cost of the molding and equipment, this technique is best for
producing high-volume items such as carbonated beverage bottles. If no stretch rod motion is
included the bottle formation process is known as blow molding [McEvoy et al., 1998]. [Wang et
al., 1999] have used a two-stage model for PET material processing because it evaluates the
strain hardening and the strain rate hardening in a proper way.
Fig.2-9. Stretch-blow molding of PET bottles [McEvoy et al., 1998].

Chapter 2 LITERATURE REVIEW
43
Fig.2-10. The preform design used in ISBM process [VanderPlaats, 1999]
2.5.2. Extrusion blow molding
This process comprises the conventional extrusion of a parison, or tube, using a die very similar
to that used for making pipe or tubing [Crawford, 1987]. The tube is extruded downward
between the two halves of an open mould until parison reaches a certain length, when the mould
closes and pinches off the parison at the top and bottom end. For products with a natural opening
such as bottles, the parison in the mould is blown by means of pressured air at the neck end. For
products without a natural opening, the blowing air is injected to the inside from any convenient
point of the parison by piercing it. After cooling, the mould is opened, the part is ejected, and any
excess material is trimmed [Menary, 2001].
2.5.3. Injection blow molding
In this process, the material is injection moulded around a core pin [Crawford, 1987]. The
molten polymer material on the core pin is indexed to the blow moulding station where it is

Chapter 2 LITERATURE REVIEW
44
blown, cooled, and stripped from the core pin. In this method, the amount of trim scrap is not
much more than that in extrusion blow moulding. More detail can be achieved in the neck and
finish area (thread area) and control of wall thickness is easier than in extrusion blow moulding.
However unlike injection stretch blow moulding this method is not effective improving material
properties and orientation. Generally, this method is used only for the production of relatively
small bottles [Menary, 2001].
2.6. PROCESS CONDITIONS
A critical development step in simulation technologies is the ability to use the process set-up as
input for the simulation. This can be done by integrating the successive simulation steps from
preform reheat to part cooling [Martin et al., 1999]. Since process conditions have significant
effects on the final thickness, crystallinity, biaxial orientation and consequently final material
properties, the initial preform temperature, the heat transfer, the balance between stretching and
blowing rate, the cooling rate of the product as well as the initial preform shape must be
optimized in order to achieve good bottle wall thickness in the produced products [Pham et al.,
2004; Schmidt et al., 1966; 1998].
There are numerous experimental studies on this subject in the literature, to find out the effects of
processing conditions on wall thickness, crystallinity, stress and the other mechanical properties
of the final product.
It is understood from the studies carried out so far that the types of preform growth in the
stretching and blowing stage in ISBM process depends on the geometry and sizes of the preform,
the hoop and longitudinal stresses within it, and the temperature along it. However, the critical
Chapter 2 LITERATURE REVIEW
45
factor is surely the delay time of the pre-blow influencing the thickness along the sidewall of the
PET bottles [Huang et al., 2006].
A study on the design of the PET preform has been presented by [Zagarola, 1998]. He asserted
that the process conditions such as small cushion, low hold pressure, and minimum hold times
reduce gate crystallinity and residual stresses, whereby lightweight preforms could be achieved.
An experimental work has been conducted on a properly instrumented ISBM machine to define
the effects of processing parameters on the bottle performance [Schmidt et al., 1998]. They tried
to understand the pressure effects and also processed with preform free inflation. Findings are
compared with a simple thermodynamic model and they also developed a numerical model for
the thermo mechanical simulation of the ISBM process. One of the results they achieved is that
an increase in the pre-blowing delay induces more material displacement from the neck to the
bottom of the bottle.
Cracking problems in carbonated soft drink bottles have been investigated and it is reported that
the ISBM set-up played a key role in stress crack resistance and that optimum process design
could double or triple stress crack resistance. So the best method for maximum stress crack
resistance is with the study of the process parameters; it is not sufficient to improve stress crack
resistance only via specifications of the bottle parameters [Zagarola, 2000]. He suggested that
since the process effects were typically highly interactive and complex, the best way to discover
the optimum set-up was to use statistically designed experiments and to control all processes in
the manufacturing system so that stress crack resistance is kept constant. He noticed that a small
change in average weight of the preforms by as little as 0.3 grams, introduced in injection stage
of the ISBM process, could significantly affect environmental stress crack performance.

Chapter 2 LITERATURE REVIEW
46
2.6.1. Preform temperature
One of the most important process parameters is the preform temperature, which defines the
ultimate performance of the bottle [Monteix et al., 2001]. The ability to control the temperature
profile on the preform as well as blow pressure and the stretch rod sequence during stretching and
inflation is critical [Martin et al., 1999]. Reheating and the temperature of the preform are
achieved by means of infrared radiation supplied by an array of lamps in conjunction with
convection. Generally, the temperature range of the preform is between 90 and 115°C. This is the
range preferred in industrial scale production because it avoids pearlescence (stress whitening
due to microvoiding) and haziness in the bottle. The axial temperature profile along the preform
should be controlled because both the neck region above the support ring and the bottom region
of the preform should remain cooler than the main body temperature; the bottle closure region
can be distorted due to being over heated and the bottom of the bottle can be ruptured by the
stretched rod. However, the body temperature profile of the preform may vary because of
tapering in the thickness of the wall. Moreover, when the temperature in the preform is wrong, too
much material may reside in the sidewall and not in the base [Wang et al., 1998]. The temperature
profile of the preform base is important for the final morphology of the petaloid base [Hanley et
al., 2006].
Lebaudy and Grenet [2001] have stated, based on experiments on PET, that it is essential to have
the preform temperature either below or close to the glass transition (Tg) to achieve principally
oriented glassy structure and that the crystalline structure could be enhanced as well by drawing
or thermal treatments [Lebaudy and Grenet, 2001]. Zagarola has also stated that reducing reheat
temperature increased top-load strength for both light and heavy weight preforms and that the
lighter weight preform was also better at both reduced reheat temperature and increased reheat
temperature [Zagarola, 1998]. Moreover, he has also obtained the greatest base clearance at low

Chapter 2 LITERATURE REVIEW
47
re-heat temperature for the light weight preform and at high reheat temperature for the heavy
weight preform.
The temperature range between the bottom and the neck region of the preform prior to the
stretching is between 15-20°C. The average temperature along the length of the preform is shown
in fig. 2-12 [McEvoy et al., 1998]. The temperature profile is also important in terms of clarity
and material in the bottle. Lower temperatures require higher blowing pressures and vice versa.
Fig.2-11. Temperature along the length of the preform [McEvoy et al., 1998]
The subsequent inflation of the preform is strongly dependant on the design of the preform and
the temperature on the preform. The hot zones of the preform are to blow faster and consequently
become thinner, on the contrary of this, the colder and stiffer zones are to blow slower and
remain thicker [Martin et al., 1999].
Monteix et al. have completed an experimental study with numerical simulation of a preform that
was exposed to infrared radiative heating [Monteix et al., 2001]. They found that the final

Chapter 2 LITERATURE REVIEW
48
thickness of the part was dependant on the initial temperature inside the preform which is
determined at the re-heating stage.
It has been demonstrated by other researchers that a temperature exists through the thickness [Wang
et al., 1998] and that it is at least as important as temperature along the preform. However,
measurement of the temperature profile on or through the preform is extremely difficult because the
heat transfer rate from the outer surface of the preform to the environment is too high [Nyugen and
Prystay, 1978]. But temperature is very important since it determines how well material is
distributed between the sidewall and the base of the moulded bottle [Wang et al., 1998]. Wang et al.
measured the temperature on the preform experimentally using an infrared camera but they could
not measure the temperature through the thickness. The infrared camera gives a good indication of
the relative temperature along the length of the preform, but is unable to determine the temperature
through the thickness. There have been some attempts to measure temperature profile through the
thickness direction with methods such as fluorescence spectroscopy [Bur et al., 1994; Migler and
Bur, 1998], ultrasonic [Konno et al., 1993; Wadley et al., 1986] and infrared pyrometry [Rietveld
and Lai, 1994; Lai and Rietveld, 1996].
A method called inversion technique has been developed to measure the temperature through the
preform thickness by using surface temperature measurement [Nyugen and Prystay, 1978].
Some researchers have simulated the heating of the preform and subsequently used the results to
predict temperature [Hartwig and Michaeli, 1995]. Other researcher attempted to determine the 3D
temperature of preform by using a ‘zone’ method in a new heating simulation employed in the
blow moulding process [Walter, 2004].

Chapter 2 LITERATURE REVIEW
49
2.6.2. Heat transfer
Strain-induced crystallinity is highly dependant on the temperature reduction rate, so
optimization of the cooling system in the mold to achieve the desirable mechanical properties in
material is essential. This is because the heat transfer coefficient has significant effect on the
temperature reduction rate. However, significant nonlinear differentials exist in the temperature,
temperature reduction rate and strain, both through the thickness and length directions throughout
the process, especially in the neck areas and relatively thick bottle base [Yang et al., 2004]. The
thermal properties and the density of PET are shown in table 2-1.
Table 2-1. Thermal properties and density of PET [Schmidt et al., 1998]
Density 1336 kg/m3
Conductivity 0.25 W/m/oK
Specific Heat (at 296 oK) 1130 J/kg/
oK
In the last two decades extensive studies have been made in heat transfer modeling of extrusion
blow molding and thermoforming. Since both mold cooling time and cooling temperature
directly affect the part solidification rate and average part ejection temperature, and consequently
the final part properties such as residual stresses and the level of crystallinity. However, the heat
transfer question has been neglected in almost all published numerical studies of ISBM with the
exception of the studies conducted by Schmidt [Schmidt et al., 1998]. Researchers have assumed
temperatures remain constant during the process. The grounds for this assumption are as follows:

Chapter 2 LITERATURE REVIEW
50
• The process time in stretch-blow molding is generally much shorter (typically within 2.0
seconds) than in extrusion blow molding and thermoforming [McEvoy et al., 1998; Menary,
2001; Wang et al., 2000; Menary et al., 2000].
• The preform temperature in stretch-blow molding is not high enough to produce thermally
induced crystallinity.
• There is a lack of relevant experimental data and history of temperature, which is very
difficult to measure because of the closed mold and short process time.
• Stretch-blow molding is characterized by strain-induced crystallization due to its critical
effects on the performance of the final bottle [Yang et al., 2004].
The relationship between heat transfer and thickness in the PET bottle have been studied via
non-isothermal finite element model and parametric studies of contact conditions and heat
transfer coefficients [Yang et al., 2004]. It was found that lower friction coefficients and heat
transfer coefficients between the stretch rod and the preform both lead to a thinner bottle base.
The available heat transfer equations have been reviewed by various researchers [Yu and
Sunderland, 1992; Liang and Ness, 1996]. Stelson has conducted a study on calculating cooling
times for polymer injection molding, comparing all available formulae from a theoretical stand-
point, and discussing their derivations for both thin and thick parts [Stelson, 2003]. He has also
clarified which equations are theoretically correct, and concluded that if the ejection criterion is
based on mid-plane temperature, equation (13) is correct [Busch et al., 1988], but if the ejection
criterion is based on average temperature, equation (14) is correct. [Xu and Kazmer, 1999].
Dietzel and Menges have listed cooling formulae for many simple shapes such as cylinders,

Chapter 2 LITERATURE REVIEW
51
spheres, and parallelepipeds [Dietzel et al., 1991; Menges et al., 2001]. However, the most used
formulae are those for a flat plate of infinite length but and finite thickness.
−−
=fe
fi
cTT
TTat
παπ4
ln2
2
………….…………………………………....………….Equation 10
−−
=fe
fi
cTT
TTat
22
2 8ln
παπ …………..…………….…………………...…………Equation 11
The cooling time formula for plates is as follows; in its most used form.
−−
=fe
fi
cTT
TTC
aCt 1
2
0 lnα
………………………………………...…………………...Equation 12
Where,
tc is the cooling time,
a is the thickness,
α is the thermal diffusivity of the polymer,
Ti is the initial temperature of the polymer melt,
Tf is the mould temperature
Te is the ejection temperature of the part.
The heat deflection temperature of the material is often taken as an acceptable value for Te.
In the solution of the equation (16) the assumptions are that the mould is maintained at a
constant temperature, Tf, the polymer has a constant initial temperature, Ti, thermal contact

Chapter 2 LITERATURE REVIEW
52
between the polymer and mould is perfect, and thermal diffusivity of the cooling polymer is
constant [Carslaw and Jaeger, 1959; Bird et al., 1960].
( ) ( )b
ynCose
nTT
TTb
tn
n
n
fi
fty π
π
απ
+×
+
−=−−
+−∞
=∑
2
1
2
1
12
2
22
2
1
0
, ……………………………… (Eq. 13)
Where
a is the part thickness,
b is the part half-thickness,
c0 and ci are the dimensionless coefficients of equations (1) and (2) respectively,
F is the Fourier number or dimensionless time,
t is the time (s),
tc is the cooling time (s),
Tav is the average temperature,
Te is the ejection temperature,
Tf is the final temperature,
Ti is the initial temperature,
Tm is the mid-plane temperature,
T(y, t) is the temperature,
y is the distance from mid-plane of part (m),
� is the thermal diffusivity (m2/s) where temperatures are given in degrees.
Dubay and Bell have investigated the cooling cycle of injection molding for cylindrical shaped
plastics components and formulated a numerical model by using the full conservative form of the
energy equation with temperature dependent polymer properties having continuous equations of

Chapter 2 LITERATURE REVIEW
53
state [Dubay and Bell, 1998]. They concluded that the cooling time predictions from the
numerical method were in good agreement with experimental results and that the model they
proposed predicted shorter cooling times than the often used non-conservative heat conduction
model, which uses constant polymer properties or a temperature dependent thermal diffusivity.
They also realized that for parts which had a thickness of 3 mm, [Ballman and Shusman, 1959]
and the conservative model have given very good agreement in cooling time but the statistical
cooling time model of Busch was more suitable for plastics parts [Busch et al. ,1988].
An inverse method has been proposed for estimation of the initial temperature profile of a preform for
polymer processing [Nyugen and Prystay. 1978]. Since the wall thickness of the preform is usually
small compared to its height or width, it is reasonable to assume that heat transfer is one-
dimensional. Moreover, as the mold temperature is controlled approximately at the same
temperature on both sides, the temperature through the thickness is considered symmetric. The
equation governing the temperature evolution in the preform can then be simplified as follows;
this differential equation solution has been given by Carslaw and Jaeger [Carslaw and Jaeger,
1959]
dX
dTk
dt
d
dt
dTC
p=ρ …………...…………………………………………...……………Equation 14
with the following boundary and initial conditions:
0=dX
dT at X = 0 (on the plane of symmetry) …………...…….…Equation 15
( )a
TThdX
dTk −=− at X=d (on the surface)…………………………………Equation 16

Chapter 2 LITERATURE REVIEW
54
T(x,t = 0) = f(x) ………………………………………...……………………...………Equation 17
Where
T is the temperature,
Ta is the ambient temperature,
ρ is the density,
Cp is the specific heat,
k is the thermal conductivity,
h is the heat transfer coefficient,
t and x denote time and spatial coordinate, respectively
d is the half thickness of the part.
2.6.3. Blow pressure – Time
The sequence of the stretching and blowing has a considerable effect on preform growth [Huang
et al., 2006] and blow pressure determines the total processing time of the bottles [Wang et al.,
1998]. The deformation of the preform imposed by stretch rod and blow pressure has been
studied during the stretching and blowing stages. Three types of preform growth have been
observed ‘dolphin-type’, ‘sandpile-type’, and ‘two bubble-type’ [Huang et al., 2006].
Wang et al. have conducted blow molding simulations in three regimes; blowing without
stretching, complete stretch followed by blowing, and partial stretch followed by blowing to
completion [Wang et al., 1998]. The results have shown that the last method yields the best
thickness in the final product. McEvoy et al. have obtained the same result in their studies; that
applying a pre-blow pressure does over-predict the side wall thickness of the bottle in simulations
[McEvoy et al., 1998]. They have worked with AOKI ISBM machines and applied around 0.1–

Chapter 2 LITERATURE REVIEW
55
0.2 MPa as a pre-blow pressure and 4 MPa as a blow pressure. The fig.2-13 shows the ideal
pressure development rates as a function of time for a 2 lt bottle.
0
5
10
15
20
25
30
35
40
45
0 0.2 0.4 0.6 0.8 1 1.2 1.4
Time (secs)
Pre
ssu
re(B
ar)
pres vs time
Fig.2-12. Pressure vs. time for 2 lt bottles
2.6.4. Stretch rod displacement as a function of time
Correct stretch rod ensures the desired strain hardening of PET in the side walls and hence a
constant wall thickness in this area. If the movement is too slow relative to the pre-blow
activation or when there is no stretch rod movement, the preform can go off-centre and cause non
uniform wall thicknesses. If the movement is too rapid, the preform may rupture [McEvoy et al.,
1998].
The base of the bottle is stretched very little, the temperature range around that section is lower
(around 80°C) than in the upper areas, and the rod may also stick to the bottom of the bottle
[Hanley et al., 2006]. That is why; the bottom section of the bottle demonstrates weakness in
terms of stress cracking resistance. After stretching stops near the base, the rest of the areas
continue to be stretched first by the ‘pre-blow’ pressure and then the ‘final-blow’ pressure.

Chapter 2 LITERATURE REVIEW
56
Consequently, compression may occur at the bottom area [Yang et al., 2004]. The fig.2-14 shows
the typical stretch rod displacement vs. time relationship. McEvoy et al. have simulated the
stretch blow molding process of PET bottles in AOKI-ISBM machine according to this model
[McEvoy et al., 1998].
Fig. 2-13 Stretch Rod Displacement vs. Time for AOKI blow molder [McEvoy et al., 1998]
Pham et al. have demonstrated a model describing the mechanical behavior of PET [Pham et al.,
2004]. They have also explained that PET undergoes strain hardening when it is stretched;
stretching of the preform is essential to achieving uniform wall thickness in the formed bottle.
Because strain hardening depends on the temperature profile and strain-rate; at any given strain,
increasing the temperature reduces the strain hardening properties and vice versa. In contrast, at a
fixed temperature increasing strain rate causes the polymer to strain-harden, particularly at large
strain values. So, if the preform being blown touches the mould before strain hardening occurs, the
material does not reach its natural draw ratio and consequently the desired uniform wall thickness can
not be achieved [Wang et al., 1998].

Chapter 2 LITERATURE REVIEW
57
2.7. OPTIMIZATION INJECTION STRETCH BLOW MOULDING PROCESS
The design of a PET preform is highly complex especially from a numerical optimization point of
view. The ISBM process sequence is complex and coupled. However, the rheological behavior of
the material during the stretching and blowing stages is highly nonlinear and thermally dependent.
In short, optimization of the ISBM process is very complicated [Thibault et al., 2007].
There is limited work in the literature in terms of numerical modeling for design optimization; the
only work conducted in this subject is the study which Lee and Soh have made for ISBM [Lee
and Soh, 1996]. They developed a finite element method to determine the optimal thickness
profile of a preform for a blow-molded part and tried to find the required wall thickness. They
assumed that the preform was not axially stretched during the forming stage.
A study related to extrusion blow molding has been conducted, and it is proposed that a closed-
loop optimization approach analogous to classical process control system can be used to
manipulate the process parameters in order to determine the thickness of the inflated part
[Laroche et al., 1995].
Gauvin et al. [2003] have revised the previous work by means of a gradient-based approach in
order to minimize the design objective function by fixing the processing parameters. In polymer
injection molding, in order to minimise the filling time of the polymer material, some researchers
have attempted to optimise the gate location through a design sensitivity analysis coupled with a
gradient-based approach [Smith et al., 1997; Kabanemi et al., 2002]. There are several papers in
metal forming [Xinhai et al., 2006], which propose different algorithms to optimise the preform
mould design.

Chapter 2 LITERATURE REVIEW
58
Some studies have been carried out with the intention of developing a design optimisation
environment for the design of preforms and container moulds, and two complementary
optimisation algorithms have been proposed [Thibault et al., 2007].
Since thickness in a preform affects blown container performance specifications such as top load,
pressurization, and vacuum loads, prediction of preform thickness is emphasised in a
performance optimization process [VanderPlaats, 1999]. On the other hand, there are different
types of preform available in industry, and the choice depends on the bottle to be produced and
the desired final thickness. These preform models are shown in Fig. 2-15.
Three different types of stretch ratios are considered in the preform design: axial, hoop and end-
cap thickness ratio. The detailed expressions on the preform design have been provided [Vander
Plaats, 1999]. A number of numerical optimisation techniques are found in the literature, such as
traditional gradient techniques of zero, first, and second-order or soft computing methods. Vander
Plaats has used a second order method because of this method’s strong track record.
Fig.2-14. Different types of preform geometry used in the industry [VanderPlaats, 1999]
Outside taper Inside taper Dual side taper Base step design

Chapter 2 LITERATURE REVIEW
59
2.7.1. Bottle base weight
Over-thickening in the base of the PET bottle is a commonly encountered problem in ISBM
process. More material is piled up at the base due to this problem and thus material waste arises.
The problem also results in under-straining and, consequently, less crystallization and orientation.
Optimizing preform design and process conditions is therefore crucially important to achieving
thinner, highly orientated, and more crystallized bottle bases [Yang et al., 2004].
The packing pressure of the injection molded preform [Brooks and Giles, 2002; Zagarola, 1998]
and the temperature of the preform during stretch blow molding [Venkateswaran et al., 1998]
determine the final properties of the bottle. In the ‘injection stage’ of the material into the mold,
the ‘hold time’, which is the length of time the gate remains open allowing more material to be
pushed into the mold cavity, relates to the preform weight. For this reason, the hold time and the
shot size should be kept as short as possible in order to force less material into the end of the
preform; which finally forms the base of the bottle. However, the cooling efficiency of the body
and neck of the preform is also important because these regions in the mold resist the addition of
more material [Hanley et al., 2006].
In order to observe heat transfer and contact conditions in the ISBM process and to define friction
and heat transfer coefficients, Yang et al. [2004] have developed a model. They concluded that
the friction coefficient and heat transfer coefficient between the stretch rod and the preform
affected only the bottom area, and also that both lower friction coefficients and lower heat
transfer coefficients led to a thinner bottle base since only in this condition the bottom remains
relatively softer to stretch.

Chapter 2 LITERATURE REVIEW
60
Some researchers have assumed that the hemispherical base of the PET bottle would not
significantly affect the wall thickness along the neck, shoulder, and side-wall regions and conducted
their study under this assumption [Wang et al., 1998]. It has been reported that in extrusion blow
molding systems the bottle base weight was affected by ‘drop time’ and ‘parison sag’ [Strebel and
Benson, 1996]. As the drop time and parison sag increase the bottle base weight also increases; this
is why the weight of the bottle base affects the crystallinity, consequently affecting potential for
cracking.
2.7.2. Bottle and petaloid base design
The petaloid base shape currently used in commercial applications is shown in fig. 2-16.
Fig.2-15. CAD drawing of a typical petaloid base of a bottle
There are many types of bottles in use, and their shape varies depending on the usage, material
type and blow molding machine [Chua and Lye, 1998]. Preforms should be well designed in

Chapter 2 LITERATURE REVIEW
61
terms of both the desired bottle wall thickness and the bottle shape to be produced. In the
literature, there are valuable guidance regarding preform and bottle design [Masood and
Keshavamurthy, 2005; Zagarola, 1998]. The bottle’s collapsibility is highly dependant on its
wall thickness [Masood and Keshavamurthy, 2005] and the draw ratio on the parallel (hoop)
direction should be about 35% more than the perpendicular (axial) direction [Rosato and
Rosato, 1989].
Some useful suggestions regarding the factors which should be considered in the design of blow-
moulded bottles can be listed as follows:
1. It should be considered that wall thickness vary from side panels to corners.
2. Rounding and filleting of edges and corners is very important because this increases
resistance to higher levels of stress.
3. There should be a harmony among the sections of the bottle. Abrupt thickness changes
between sections causes cracking. So very narrow or very wide bottoms and tops are not
recommended.
4. The neck section of the bottle has to withstand both handling and liquid pressure inside
the bottle. Therefore, the thickness of this section is highly important.
5. The shoulder of the bottle should be strong, but flexible enough to withhold the liquid
pressure and also be resistant to cracking.
6. The bottle base is the most important section of the bottle from a functional point of view
and should be slightly concave because it absorbs external shocks and improves impact
strength [Zagarola, 1998].

Chapter 3 BOTTLE BASE DESIGN AND OPTIMIZATION
62
Chapter 3
BOTTLE BASE DESIGN
AND
OPTIMIZATION
Chapter 3 BOTTLE BASE DESIGN AND OPTIMIZATION
63
3.1 INTRODUCTION
The goal of the study presented in this chapter is to determine the petaloid geometry and
dimensions in the base of the bottle that will maximise resistance to environmental stress
cracking.
A finite element model of a standard 1500 ml bottle is developed in CATIA. In the optimization
process, another design of experiment and optimization program called ECHIP-7 was utilized.
The relative parameters of the bottle base and the optimization range of these parameters were
defined, and hereby combinations of the base dimensions to be used in the optimization process
were generated by ECHIP. Stresses in the base are calculated by means of the finite element
analysis according to these combinations of base dimension; finally, the base dimensions which
result in the minimum von Mises stress are identified as the optimum base dimensions.
Furthermore, the optimization was conducted at two different wall thickness of the PET in the
bottle base under two different internal pressure applied from the inside of the bottle; and the
optimisation studies were systematically repeated under these conditions.
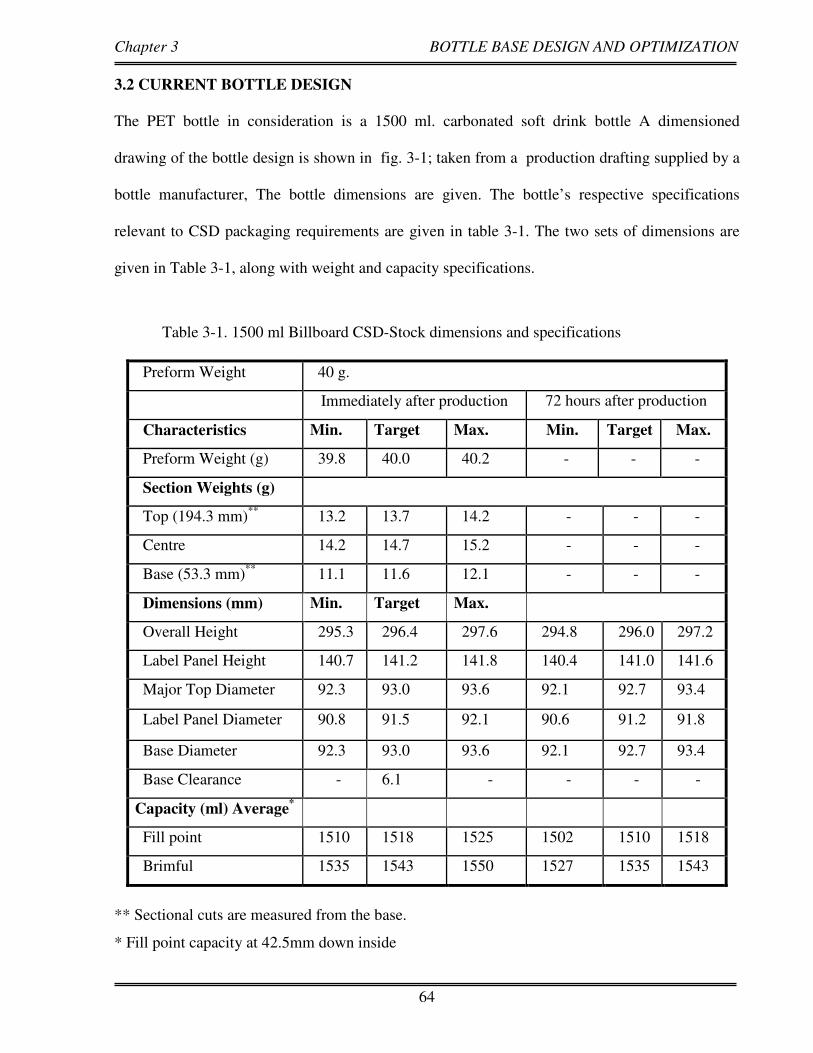
Chapter 3 BOTTLE BASE DESIGN AND OPTIMIZATION
64
3.2 CURRENT BOTTLE DESIGN
The PET bottle in consideration is a 1500 ml. carbonated soft drink bottle A dimensioned
drawing of the bottle design is shown in fig. 3-1; taken from a production drafting supplied by a
bottle manufacturer, The bottle dimensions are given. The bottle’s respective specifications
relevant to CSD packaging requirements are given in table 3-1. The two sets of dimensions are
given in Table 3-1, along with weight and capacity specifications.
Table 3-1. 1500 ml Billboard CSD-Stock dimensions and specifications
Preform Weight 40 g.
Immediately after production 72 hours after production
Characteristics Min. Target Max. Min. Target Max.
Preform Weight (g) 39.8 40.0 40.2 - - -
Section Weights (g)
Top (194.3 mm)**
13.2 13.7 14.2 - - -
Centre 14.2 14.7 15.2 - - -
Base (53.3 mm)**
11.1 11.6 12.1 - - -
Dimensions (mm) Min. Target Max.
Overall Height 295.3 296.4 297.6 294.8 296.0 297.2
Label Panel Height 140.7 141.2 141.8 140.4 141.0 141.6
Major Top Diameter 92.3 93.0 93.6 92.1 92.7 93.4
Label Panel Diameter 90.8 91.5 92.1 90.6 91.2 91.8
Base Diameter 92.3 93.0 93.6 92.1 92.7 93.4
Base Clearance - 6.1 - - - -
Capacity (ml) Average*
Fill point 1510 1518 1525 1502 1510 1518
Brimful 1535 1543 1550 1527 1535 1543
** Sectional cuts are measured from the base.
* Fill point capacity at 42.5mm down inside

Chapter 3 BOTTLE BASE DESIGN AND OPTIMIZATION
65
Fig.3-1. 1500 ml PET bottle drawing and dimensions

Chapter 3 BOTTLE BASE DESIGN AND OPTIMIZATION
66
In the CATIA model the top, centre and base sections are generated separately and then joined
together to form the whole bottle as shown in fig. 3-2. The bottle base is further divided into five
72o segments. The CATIA model of a single 72
o segment is shown in fig 3-3, and the completed
base in fig. 3-4.
Fig.3-2. The CATIA drawing of the standard (current) PET bottle

Chapter 3 BOTTLE BASE DESIGN AND OPTIMIZATION
67
Fig.3-3. Dimensioned CATIA model of one segment of the bottle base
Fig.3-4. CATIA model of the current bottle base

Chapter 3 BOTTLE BASE DESIGN AND OPTIMIZATION
68
All studies related to optimization of the bottom of the bottle are conducted on the base section.
Although the wall thickness varies through the base, in order to test the effect of base dimensions
on the stress observed, a uniform wall thickness of 2 mm. throughout the bottle was assumed; and
all optimization analysis was done according to this assumption. The analysis was repeated for
wall thicknesses of 1 mm. and 0.5 mm.
3.3 FINITE ELEMENT ANALYSIS
In the FEA method the structure is modelled as a network of small elements interconnected at
their nodes. The fact that a real structure can be sub-divided into relatively small elements each of
a simple shape is fairly basic but it is the most important principle of the finite element analysis
method (fig. 3-5). The displacement or stress patterns around these very small elements can be
represented by a relatively simple mathematical equation such as a linear or quadratic function, and
has a set of 'nodes' at each end of a line element or at each corner of a quadrilateral element. In order
to form a mesh that is a mathematical model of the design, each element is joined together at adjacent
nodes. In principle, the applied loads and the direction on which the model is supported should be
defined. The nodes are points at which different elements are joined together; nodes are the locations
where values of unknowns (usually displacements) are to be approximated. The mathematical
equations of the models generated in simple geometrical shapes are resolved by FEM and these
resolved thousands of simultaneous equations are combined in a sum. This sum is the total of the
solution across the element. The shape and size of the element mesh are very important parameters in
terms of the accuracy of the result. There are not any certain rules about what constitutes a good
mesh but there are guidelines.

Chapter 3 BOTTLE BASE DESIGN AND OPTIMIZATION
69
Fig.3-5. Finite element structure
The software programs currently in use are used to develop and analyze some physical properties
of the model studied. The development usually contains three stages.
1. Pre-processing stage: In this stage, the model or the component to be studied is drawn like in
the conventional CAD drawing. The drawings will define the geometry of the component although
often some additional geometrical information will be required. In addition, the material properties,
the applied loads and supports or restraints on the structure should be defined to complete the finite
element modeling.
2. Analysis stage: The software program solves the mathematical equations relating forces to stress,
displacement etc. within the timeframe of a few minutes or several hours, even days. For the simple
model and good conditioned computer, the analysis time is very small, but for the complex model and
small size computer analysis time becomes long.
3. Post-processing stage: In this stage, the numerical results achieved from the analysis are shown
in order to assist the assessment of the numerical data. For example, stress results achieved can be
plotted using colors to represent different levels of stress [McEvoy, 1997].
F1 F2
F2
F1 F1 F2
llllll
Simple
element
llllll llllll llllll llllll llllll

Chapter 3 BOTTLE BASE DESIGN AND OPTIMIZATION
70
3.3.1 Generation of a model for finite element analysis
All commercial computer FEM programs have a library of element types and these elements can
be selected automatically by the program, as well as manually. These are one dimensional (lines
such as shells, beams), two-dimensional (surfaces) and three- dimensional (blocks). Moreover,
these may also be of the straight or curved sides. Two-dimensional elements are of rectangles,
squares, triangles, or other quadrilaterals. Three dimensional elements are tetrahedral or
triangular prisms, hexahedral bricks (fig. 3-6). There are normally nodes at the corners of the
elements. Each element has certain degrees of freedom; i.e. freedom to move in given directions.
The simplest elements have only one or two degrees, the movement in the x and/or y directions
can be regarded as of them and also the movement in the z axis and rotations about the x, y and z
axes can be added for more complex elements which have multiple freedom degrees. In some
instances, more than one type of element can be used for the model considered.
The mesh element shape should fairly represent its basic shape because highly distorted elements
results in poor results. In case that the number of elements is required to be increased,
engineering experience is of course important. The elements to be selected in mesh are matched
to the geometry of the structure, the accuracy, and type of result required. Generally, the number
of elements in a model should be enough and the mesh size and shape should be defined so as to
represent the model so that the model can represent the actual behavior and lead to better and
accurate results. However, increasing the number of elements increases computer time and cost
[McEvoy, 1997].

Chapter 3 BOTTLE BASE DESIGN AND OPTIMIZATION
71
3 Element Beam Element
3 Noded 2D Triangular 8 Noded 2D solid
Quadrilateral Element
4 Noded 3D solid
Tetrahedral Element
20 Noded 3D Solid
Hexahedral Element
6 Noded 3D solid
Tetrahedral Element
Fig.3-6. Various finite elements
3.3.2. Stress analyses of solid bodies
Stress strain relationship: For a two-dimensional plane stress element, stresses and strains are
related by the following equations;
( ) ( )yxx
E ευευ
σ ⋅+⋅−
=21
( ) ( )xyy
E ευευ
σ ⋅+⋅−
=21

Chapter 3 BOTTLE BASE DESIGN AND OPTIMIZATION
72
( ) xyxy
E γυ
τ+
=12
Where
σx, σy are tensile stress in x and y direction respectively.
εx, εy are the strain in x and y direction respectively.
υ is poisson’s ratio
E is Young modulus,
τxy is shear stress
γxy is shear strain.
These equations may be expressed in matrix form as;
= .
or in shorthand form as;
{σ} = D . {ε}
where |D| expresses the material stiffness of the element. For example, for a spring element of modulus E
this would be given by
D =
σx
σy
τxy
E
(1-υ2)
1 υ 0
υ 1 0
0 0 (1/2)(1- υ)
εx
εy
γxy
E 0
0 E

Chapter 3 BOTTLE BASE DESIGN AND OPTIMIZATION
73
The computations and the design procedures involved in the finite element analysis are both very
complicated and time consuming and are impossible for manual calculations. However, these
calculations have been possible through software programs like CATIA, Abaquous, and Pro-
Engineer etc.
3.4 VON MISES STRESS ANALYSIS AND SIMULATION PROCEDURE
The conditions that the product might experience in use should be defined correctly in the
analysis and simulation stage. The bottle model generated in the mechanical design section of
CATIA was automatically transferred into the ‘Analysis and Simulation Work Bench’. The
material properties of PET are then required for the stress and deformation analysis step.
The von Mises yield criterion [Von mises, 1913] suggests that the yielding of materials begins
when the second deviatoric stress invariant reaches a critical value (k). For this reason, it is
sometimes called the plasticity or flow theory. It is part of a plasticity theory that applies best to
ductile materials, such as metals. Prior to yield, material response is assumed to be elastic.
In material science and engineering the von Mises yield criterion can be also formulated in terms
of the von Mises stress or equivalent tensile stress, (σv), a scalar stress value that can be
computed from the stress tensor. In this case, a material is said to start yielding when its von
Mises stress reaches a critical value known as the yield strength, (σy). The von Mises stress is
used to predict yielding of materials under any loading condition from results of simple uniaxial
tensile tests. The von Mises stress satisfies the property that two stress states with equal distortion
energy have equal von Mises stress.

Chapter 3 BOTTLE BASE DESIGN AND OPTIMIZATION
74
Because the von Mises yield criterion is independent of the first stress invariant, it is applicable
for the analysis of plastic deformation for ductile materials such as metals, as the onset of yield
for these materials does not depend on the hydrostatic component of the stress tensor.
3.4.1 Setting the material properties
As PET material properties vary depending on the conditions exposed to, the material properties
in the actual production conditions should be used to achieve the best performance. The
properties for PET are given in table 3-2.
Table 3-2. Material properties for virgin PET
Young Modulus 2.9 GPa
Poisson Ratio 0.4
Density 1200 kg/m3
Thermal Expansion 0.00007 1/ oC
Yield Strength 55 MPa
3.4.2 Static solution parameters
For static case solutions, problems are defined as either linear or non-linear. A linear problem is
where there is no contact feature (virtual or real), no pressure fitting property, and where the
displacement is a linear function of the load. Non-linear is the condition that there is at least one
contact feature (virtual or real) or pressure fitting property, and the displacement is a non linear
function of the load.

Chapter 3 BOTTLE BASE DESIGN AND OPTIMIZATION
75
A new Analysis Case is a set of object corresponding to a new set of specifications of
simultaneous environmental actions on a given system. To create object sets for the new
specifications, a new Static Case should be inserted. This cause a static solution procedure for the
computation of the system response according to applied static loads under given restraints. The
static solution parameters can be set as shown in fig. 3-7.
Fig.3-7 CATIA dialog box for ‘static solution parameters’
The method is selected depending on the type of model; small, medium or complex. For small
models it is recommended, that the method be set as auto; whereby the stresses can be computed
automatically. In this study, the Gauss Method was chosen. The Gauss Method is a direct method
which is mainly recommended for computing stresses in small to medium models.
3.4.3 Application of restraints
Restrains must be applied to the body to be analysed so that static analysis such as stress,
deformation analysis can be carried out. These restraints may be in either one, two, or three

Chapter 3 BOTTLE BASE DESIGN AND OPTIMIZATION
76
dimensions. There are different types of restraints in the ‘Generative Structural Analysis
Workbench’ and the isostatic restraints were selected out of them.
The restraints were applied to the bottom of the bottle because the deformations during filling are
taken into consideration in the upright standing position. So clamps were held to the parts of the
bottom of the bottle where it touches the ground in 8 faces as indicated in CATIA dialog box
shown in fig. 3-8. Once the surfaces are selected, the program automatically chooses restraints
(fig. 3-9). The body is prevented from rigid-body translations and rotations by means of the
boundary condition.
Fig.3-8. CATIA dialog box for clamp type and number of faces supported

Chapter 3 BOTTLE BASE DESIGN AND OPTIMIZATION
77
Fig.3-9. Application of restraints to the base of the bottle
3.4.4 Application of pressure
The stresses due to the pressure of the carbonation of the content are simulated and applied in the
Generative Structural Analysis Workbench of CATIA. On this workbench, pressures can be
applied onto the selected surfaces and the magnitude and direction of the pressure can be given as
the input.
According to the information obtained from bottle manufacturers and the studies investigated, the
pressure applied by the carbonation pressure of the content ranges between 400,000 and 600,000
N/m2. According to the CATIA dialog box shown in fig. 3-10, these pressures were applied to
the inner surfaces of the PET bottle (fig. 3-11) and then stress analyses were conducted.
Clamps

Chapter 3 BOTTLE BASE DESIGN AND OPTIMIZATION
78
Fig.3-10. CATIA dialog box for applied pressure
Fig.3-11.The application of pressures on the inner surfaces of the bottle
The inner surfaces
exerted by pressure

Chapter 3 BOTTLE BASE DESIGN AND OPTIMIZATION
79
3.4.5 Mesh generation
Once the pressure and constraints are set up, the program automatically starts the computation to
calculate the stresses occurring on the bottle surface and to identify the areas where the maximum
and minimum stresses arise. However, prior to this step, the elements and the nodes, required for
the stress calculations must be generated. This is referred to as ‘meshing’ or mesh generation.
Generating suitable mesh geometry is very important to achieving more accurate results. CATIA
supports two types of mesh: ‘Linear Tetrahedron’ and ‘Parabolic Tetrahedron’. In this study, the
Linear Tetrahedron mesh type was used because it covers more surface than the parabolic
tetrahedron and it is a much simpler. The complete meshed bottle is shown in fig. 3-12. The mesh
geometry and dimensions are shown in fig. 3-13. When all input parameters are set up, von Mises
Stress values and displacements can be computed.
Fig.3-12. The meshed surface of the bottle

Chapter 3 BOTTLE BASE DESIGN AND OPTIMIZATION
80
Fig.3-13. The mesh geometry and dimensions of elements on the bottle surface
Fig.3-14. The mesh size used in the stress analysis

Chapter 3 BOTTLE BASE DESIGN AND OPTIMIZATION
81
The petaloid base of the bottle being geometrically a very complicated shape has made the proper
selection of mesh geometry difficult. Linear Tetrahedron mesh geometry was therefore selected
but the mesh size was kept as small as possible by depending on the capacity of the computer
studied on. But, the time consumed for computation increased as the mesh size got small. In this
study, 2.527 mm. was considered as the smallest mesh size to be studied (Fig. 3-14).
The fact that the computer processor is fast and the other components of the computer used in the
study are suitable for CATIA program is highly important. The size of the mesh form is also
important from the accuracy of the stress point of view. In this study, the mesh size is kept as
small as possible, because the smaller the mesh size the more accurate the stress values.
Meshing time may vary depending on the size and geometry shape of the surface on which
computation is made. Once the meshing is over, the computation is completed and the program
shows the time elapsed and the memory used in the computation. Then the report for post-
analysis is automatically generated and the deformed mesh form and the stress on the bottle
surface are shown (fig. 3-15). The colour coded scale on the top left corner of the computer
screen indicates the magnitude of the stress.
When the inner wall of the bottle is subjected to pressure exerted by the carbonated soft drink,
three dimensional stresses are created. They are combined into ‘Equivalent’ or von Mises stresses.
If the von Mises stress exceeds the yield stress, then the material is considered to be at a failure
condition. The von Mises stress obtained from the analysis is given in fig. 3-16 and fig. 3-17.

Chapter 3 BOTTLE BASE DESIGN AND OPTIMIZATION
82
Fig.3-15. The deformed mesh with the restraints and loads as a result of the deformation
Fig.3-16. The von Mises stress on amplification magnitude of 63.7

Chapter 3 BOTTLE BASE DESIGN AND OPTIMIZATION
83
Fig.3-17. Translational displacement vectors as a result of the pressure inside the bottle
3.5 RESULTS AND DISCUSSION
To establish the optimum base parameters the data obtained from the stress analysis in CATIA
were input to the ECHIP-7 design of experiments and optimization software program, and
optimization was achieved based on statistical analysis of the simulated stress results via ECHIP.
Following can be said about the simulated stress in the bottle.
• The stresses are most intense in the middle sidewall section of the bottle. But, whilst the
stresses on the base of the bottle are low, those on the edges between the base and sidewall
are found to be rather high. That is to say, the high stresses are recorded on the sidewall at
which the bottle is the most sound and the low stresses are on the base section where the
bottle is the weakest.

Chapter 3 BOTTLE BASE DESIGN AND OPTIMIZATION
84
• The maximum stress values were taken into consideration in the optimization process.
Increases in the maximum stress values are almost the same for the pressure of both 0.4 MPa
and 0.6 MPa. At some combinations of petaloid base parameters resulted in the material
yielding in the base by becoming convex. To ensure for the bottle to be self-standing, some
constraints were applied for the clearance settings for the optimisation process in ECHIP-7.
• Small foot length and small clearance are required for a sound base design to achieve low
simulated stress values. Valley width does not seem to have considerable effect on the stress.
Nevertheless, wall thickness also needs to be minimised to reduce material cost.

Chapter 3 BOTTLE BASE DESIGN AND OPTIMIZATION
85
Clearance: 1mm
Max Stress: 8.64 MPa
(a)
Clearance: 6 mm
Max Stress: 10.1 MPa
(b)
Clearance: 12 mm
Max Stress: 11.7 MPa
(c)
Fig.3-18. The highest von Mises stress as a function of clearance
Valley width: 4.85mm
Max Stress: 10.6 MPa
(a)
Valley width: 16.17mm
Max Stress: 9.86 MPa
(b)
Valley width: 27.49mm
Max Stress: 10.2 MPa
(c)
Fig.3-19. The highest von Mises stress as a function of valley width
Foot Length: 16 mm
Max Stress: 10.3 MPa
(a)
Foot Length: 28 mm
Max Stress: 8.9 MPa
(b)
Foot Length: 41 mm
Max Stress: 10.3 MPa
(c)
Fig.3-20.The highest von Mises stress as a function of foot length

Chapter 3 BOTTLE BASE DESIGN AND OPTIMIZATION
86
Fig. 3-18, 3-19, and 3-20 respectively, show the effects of clearance, valley width, and foot
length dimension on the max von Mises stress in the bottle base. It is clear that valley width has
no significant influence. Fig. 3-21 shows the effects of wall thickness on these stress relationships.
Increased wall thickness results in lower maximum stress values for all optimization parameters.
On the other hand, the maximum stress values comperatively decreased along with the increasing
wall thickness and the average maximum stress values for the 1 mm and 2 mm are around 2.00 x
107 N/m
2 and 1.00 x 10
7 N/m
2 respectively. Ideally, wall thickness should be optimised as a
function of stress, production cost, burst strength and other physical properties such as gas
permeation.
0.00E+00
5.00E+06
1.00E+07
1.50E+07
2.00E+07
2.50E+07
0 10 20 30 40 50
Foot Length (mm)
Ma
x S
tre
ss
(N
/m2
)
1 mm
2 mm
(a)

Chapter 3 BOTTLE BASE DESIGN AND OPTIMIZATION
87
0.00E+00
5.00E+06
1.00E+07
1.50E+07
2.00E+07
2.50E+07
3.00E+07
0 5 10 15 20 25 30
Valley Width (mm)
Ma
x S
tre
ss
(N
/m2
)
1 mm
2 mm
(b)
0.00E+00
5.00E+06
1.00E+07
1.50E+07
2.00E+07
2.50E+07
3.00E+07
3.50E+07
0 5 10 15
Clearance (mm)
Ma
x S
tre
ss
(N
/m2
)
1 mm
2 mm
(c)
Fig.3-21. Max stress at two different wall thicknesses
for the bottle base parameters (a) foot length (b) valley width (c) clearance
Clearance (mm)

Chapter 3 BOTTLE BASE DESIGN AND OPTIMIZATION
88
3.6 OPTIMIZATION OF BASE GEOMETRY
In this study, the bottom of the PET bottle of 1500 ml. is optimized against environmental stress
cracking. As in the previous study conducted by Lyu and Pae [2003], three parameters of the
bottle base are regarded as to having the most influence on stress crack resistance: foot length,
valley width, and clearance (fig. 3-22).
Fig.3-22. Design parameters of the petaloid base
In the standard PET bottle, foot length, valley width, and clearance dimensions are 36.0, 7.0 mm
and 6.1 mm respectively. The minimum and maximum values identify the optimization range for
each parameter.
3.6.1 Experimental design with ECHIP-7
The optimisation process was carried out by ECHIP-7 experimental design and optimization
program. Hereby, both the time required for calculation and the numbers of stress analysis step
were significantly reduced; and the optimisation process was based on a scientific approach.
The maximum and minimum values of the design parameters (table 3-3) are chosen so as the
petaloid base was not deformed and stayed upright position.

Chapter 3 BOTTLE BASE DESIGN AND OPTIMIZATION
89
Table 3-3. Design parameters
Design Parameters Minimum Maximum
Foot length (mm) 16 41
Clearance (mm) 1 12
Valley Width (degree) 3 17
Echip-7, a design of experiment and optimization program provides the user with the ‘standard’
and ‘algorithmic’ design options; model specifications such as quadratic, interaction, central
composite in cube, partial cubic, central composite in sphere and Box-Behnken. The algorithmic
design in partial cubic was regarded as a suitable model for this study, because there is one block
variable for clearance parameter and three input variables; on the other hand algorithmic design is
not linear but flexible in terms of using the results obtained from the stress tests; and the
experimental region on the stress analysis has also a few constraints.
After three design variables mentioned above are entered, the type of design was defined (fig. 3-
23); and the number of trials is calculated through the ‘make design’ command (fig. 3-24). A
maximum of 21 total trials are carried out according to the experimental design generated by
ECHIP-7 and von Mises stress values obtained from CATIA V5-R14 are input as the response
variable as shown in fig. 3-25. If the 21 trials are equal to or less than the number calculated
through the ‘How many trials?’ command, the model generated by the program is then feasible
for the stress analysis test in CATIA V5-R14, otherwise, the model can not be applied.

Chapter 3 BOTTLE BASE DESIGN AND OPTIMIZATION
90
Fig.3-23. Experimental design via ECHIP; design and response variables, design type
Fig.3-24. Making a design via ECHIP; model specification, max of trials

Chapter 3 BOTTLE BASE DESIGN AND OPTIMIZATION
91
In order to verify the suitability of the model generated by the ECHIP-7 program to this study, for
stress analysis tests, standard deviation of the stress analysis tests should be estimated properly.
That is why, some stress analysis were made for some selected combinations of the design
parameters of the petaloid shaped base and the standard deviation is then found to be 0.5 x 10⁶
N/m2 as calculated by the Windows EXCEL program (Table 3-4). This value refers to the
standard deviation resulting from the stress analysis calculated through the CATIA software. As
to the least important difference which is the smallest change in the response that one desires to
detect, is accepted to be 1.5 x 10⁶ N/m
2.
Fig.3-25. The combinations of trials generated for stress analysis

Chapter 3 BOTTLE BASE DESIGN AND OPTIMIZATION
92
Table 3-4. Von Mises stress values for standard deviation of the study
Applied Pressure 0.6 MPa Von Mises Stress Values of the 1500 lt. Bottles Bottle wall Thickness 1 mm
Von Mises Stress Values (N/m2)
X (mm)
Y (mm)
Z (mm) Test1 Test2 Test3 Test4 Test5
22 17.79 1.5 2.82x10⁷
2.79 x10⁷ 2.89 x10
7 2.87 x10
7 2.77 x10
7
Average Standard Deviation: 0.5 x10
6
X: Foot length Y: Clearance Z: Valley width
As can be seen from table 3-4, at these conditions the standard deviation for this experimental
study is 0.5 E+6, the least important difference is 1.5 E+6; and the continuous model is partial
cubic, the number of trials was calculated by the ECHIP-7 program as 18 (fig. 3-26). Since the
trial numbers defined in the algorithmic design function and ‘How many trials?’ menu are very
close to each other, the proposed design model shown in fig. 3-25 is feasible for the stress
analysis test on CATIA. This is why, after obtaining the test results from CATIA, the results were
imported back into the ECHIP-7 under ‘response variables’. Then, the results were analyzed by
ECHIP-7.
Fig.3-26. The number of trials or resolution for the experimental test on CATIA

Chapter 3 BOTTLE BASE DESIGN AND OPTIMIZATION
93
3.6.2 Assessment of the response variables with ECHIP-7
The results obtained from the analysis made in CATIA, according to the experimental design
generated in the ECHIP-7 are entered to the software program as response variables for the
assessment. But, reforming the base geometry by abiding to the generated bottle base parameter
combinations at times has been difficult. Some minor adjustments in bottle base parameters other
than the foot length, valley width, and clearance have been necessary in order for the base
geometry not to be deformed. That is why, there have been slight deviations of the combinations
generated by ECHIP-7 and of the corresponding stress values, but these were taken into
consideration during the calculation of standard deviation used with the ECHIP-7 software.
The ECHIP-7 program automatically analyzes the variables loaded into the program and the
results are given on graphs and tables. Furthermore, the effects of input variables on the output
variables can be investigated through the ‘Analyze Data’ menu. The simulated stress results are
obtained by CATIA according to the combinations shown in fig. 3-25 and they are given in table
3-5 and table 3-6 for the pressures values of 0.40 MPa and 0.60 MPa respectively.

Chapter 3 BOTTLE BASE DESIGN AND OPTIMIZATION
94
Table 3-5. 1500 ml. PET bottle von-Mises stress values for the pressure of 0.40 MPa
1500 ML BOTTLE von MISES STRESS VALUES (N/m2) Pressure: 0.4 MPa
0.5 mm 1 mm 2 mm
No X
(mm)
Y
(mm)
Z
(deg)
Max
(107)
Min
(105)
Max
(107)
Min
(105)
Max
(107)
Min
(105)
15 16 1 3 6.04 1.73 2.73 1.96 1.29 2.39
11 16 1 10 5.86 1.50 3.00 2.24 1.30 3.76
13 16 1 17 5.97 2.59 3.32 4.99 1.52 4.14
20 16 4.67 12.33 7.37 2.16 3.50 3.07 1.40 3.09
6 16 6.5 3 7.22 0.79 3.39 2.08 1.44 0.71
4 16 6.5 17 6.96 9.14 3.42 17.5 1.63 10.4
9 16 12 3 8.28 1.43 4.15 2.35 1.73 1.31
3 16 12 10 8.22 2.71 3.58 4.01 1.59 2.45
17 24.33 4.67 7.67 6.65 1.08 3.41 1.84 1.34 1.86
12 28.5 1 3 5.97 1.55 3.29 2.01 1.35 1.92
7 28.5 1 17 6.04 4.87 2.92 9.80 1.46 5.95
16 28.5 12 10 7.45 1.44 3.35 3.82 1.66 4.72
5 28.5 12 17 6.90 17.2 3.87 7.47 1.62 9.31
18 32.67 4.67 7.67 7.42 1.77 3.47 1.98 1.46 2.10
21 32.67 8.33 3 7.80 1.69 4.06 2.07 1.70 1.86
10 41 1 10 7.37 1.42 3.16 1.97 1.49 2.17
2 41 1 17 7.27 2.99 3.63 2.46 1.73 5.22
8 41 6.5 3 8.59 1.11 4.30 1.91 1.76 2.08
19 41 8.333 12.333 8.18 1.86 4.03 2.05 1.59 1.99
1 41 12 3 9.04 1.40 4.82 1.97 2.04 2.30
14 41 12 17 7.71 3.85 3.83 2.88 1.70 2.29
X: Foot length Y: Clearance Z: Valley width

Chapter 3 BOTTLE BASE DESIGN AND OPTIMIZATION
95
Table 3-6. 1500 ml. PET bottle von-Mises stress values for the pressure of 0.60 MPa
1500 ML BOTTLE von MISES STRESS VALUES (N/m2) Pressure: 0.6 MPa
0.5 mm 1 mm 2 mm
No X
(mm)
Y
(mm)
Z
(deg)
Max
(107)
Min
(105)
Max
(107)
Min
(105)
Max
(107)
Min
(105)
15 16 1 3 6.04 1.73 2.73 1.96 1.29 2.39
11 16 1 10 5.86 1.50 3.00 2.24 1.30 3.76
13 16 1 17 5.97 2.59 3.32 4.99 1.52 4.14
20 16 4.67 12.33 7.37 2.16 3.50 3.07 1.40 3.09
6 16 6.5 3 7.22 0.79 3.39 2.08 1.44 0.71
4 16 6.5 17 6.96 9.14 3.42 17.5 1.63 10.4
9 16 12 3 8.28 1.43 4.15 2.35 1.73 1.31
3 16 12 10 8.22 2.71 3.58 4.01 1.59 2.45
17 24.33 4.67 7.67 6.65 1.08 3.41 1.84 1.34 1.86
12 28.5 1 3 5.97 1.55 3.29 2.01 1.35 1.92
7 28.5 1 17 6.04 4.87 2.92 9.80 1.46 5.95
16 28.5 12 10 7.45 1.44 3.35 3.82 1.66 4.72
5 28.5 12 17 6.90 17.2 3.87 7.47 1.62 9.31
18 32.67 4.67 7.67 7.42 1.77 3.47 1.98 1.46 2.10
21 32.67 8.333 3 7.80 1.69 4.06 2.07 1.70 1.86
10 41 1 10 7.37 1.42 3.16 1.97 1.49 2.17
2 41 1 17 7.27 2.99 3.63 2.46 1.73 5.22
8 41 6.5 3 8.59 1.11 4.30 1.91 1.76 2.08
19 41 8.33 12.33 8.18 1.86 4.03 2.05 1.59 1.99
1 41 12 3 9.04 1.40 4.82 1.97 2.04 2.30
14 41 12 17 7.71 3.85 3.83 2.88 1.70 2.29
X: Foot length Y: Clearance Z: Valley width
The response surfaces in 2-D and then 3-D are shown in fig. 3-27, and 3-28 respectively. The
optimum dimensions of the foot length, valley width, and clearance which minimize the stresses
on the bottle surface are found to be 29.00 mm, 8.40 mm, and 5.80 mm. Stress values are plotted
as a function of foot length versus valley width at a clearance dimension of 5.8 mm. In this
optimization process, the clearance dimension is constrained in order to prevent the bottle base
deforming/yielding to a convex shape. This is why the minimum clearance was set to 5.8 mm.
The optimized bottle base shape to be used in the further study is shown in fig. 3-29.

Chapter 3 BOTTLE BASE DESIGN AND OPTIMIZATION
96
Fig.3-27. Optimization ‘response surface’ in 2-D without constraint
Fig.3-28. Optimization ‘response surface’ in 3-D with constraint

Chapter 3 BOTTLE BASE DESIGN AND OPTIMIZATION
97
Fig.3-29. CAD drawing of the optimum bottle base
3.7 CONCLUSION
In this chapter, in order to minimize the cracking occurred on the base of the PET bottle of 1500
ml, the optimization process of the petaloid base geometry was carried out by using CATIA and
ECHIP-7 software programs. As a result, the existing petaloid base of the standard bottle was
reformed and the parameters of the bottle base currently being used, such as the valley width,
foot length, and clearance, the numerical values of which are 4.25 mm, 20 mm, and 5 mm
respectively, are optimized with the new values of 8.40 mm, 29 mm, and 5.80 mm, respectively.
In this case, the maximum stress value of 1x 10⁷ N/m
2 of the standard (current) bottle has been
optimized to 8.92 x 10⁶ N/m
2 in new (optimised) bottle.

Chapter 3 BOTTLE BASE DESIGN AND OPTIMIZATION
98
Table 3-7. The base dimensions of the current and proposed bottles
Standard (Current) Design Optimised (New) Design
Foot Length (mm) 20 29
Valley Width (mm) 4.25 8.40
Clearance (mm) 5 5.80
Resultant Stresses for an internal
pressure of 0.4 MPa.
10 MPa 8.9 MPa

Chapter 4 ISBM PROCESS DESIGN WITH BLOW VIEW 8.2
99
Chapter 4
ISBM PROCESS DESIGN WITH
BLOW VIEW 8.2

Chapter 4 ISBM PROCESS DESIGN WITH BLOW VIEW 8.2
100
4.1 INTRODUCTION
This chapter describes a simulation study of the injection stretch blow moulding of the PET bottle
using the Blow View 8.2 simulation program. The study investigated the effects of selected
process parameters on, wall thickness, stress, crystallization, molecular orientation, and biaxial
ratio.
Three process parameters were investigated:
1. Preform weight; 34 g and 40 g
2. Preform temperature; 93-110 oC and 98-115
oC
3. Degree of stretching applied by the stretch rod and the accompanying ‘free-blow’ pressure
profile as a function of time
Three degrees of stretching were simulated:
• Zero stretching. The stretch rod was not applied; i.e. the bottle was free-blown.
• 50% stretch. The stretch rod was applied to stretch the bottle to half its final length; thereafter,
the bottle was formed only by blow pressure.
• Full stretch. The stretch rod was applied for the whole of the moulding period followed by
blowing.
Degree of stretching applied by the stretch rod and the accompanying ‘free-blow’ pressure profile
as a function of time define three different processing conditions, namely model-1, model-2 and
model-3.
The CATIA file of the bottle is first converted to the IGES format and then transferred to the
Blow View 8.2 program as a patran file for use as the ISBM mold, along with a patran file of the

Chapter 4 ISBM PROCESS DESIGN WITH BLOW VIEW 8.2
101
stretch rod. The preform design was generated through Blow View’s ‘Preform Design Menu’.
The preform weight was 40 g, as required for a 1.5lt bottle. Throughout the study the preform is
blown into the mold gradually so as to represent the ‘free-blowing’ conditions. That is why, the
magnitude of pressure required to blow the preform, has been adjusted accordingly.

Chapter 4 ISBM PROCESS DESIGN WITH BLOW VIEW 8.2
102
4.2 SIMULATION SETTING FOR THE PROCESS OPTIMIZATION
4.2.1 Process and material model
This study is based on two-stage blow molding processes; the preform is produced separately,
and then blown after re-heating to the blow temperature. Accordingly, the injection stage, which
produces the preform, is not considered in this study.
For the material model, the visco-hyperelastic model was chosen due to its demonstrated
credibility in ISBM simulation studies. The material selected was PET Eastapak 9921 (Eastman
Company), which is available in the Blow View database. The material’s rheological properties
and relevant model coefficients are given in fig. 4-1.
Fig.4-1. PET Eastapak 9921 rheological properties and relevant model coefficients
4.2.2 Alignment of the bottle mould and stretch rod
This process is rather important because an error in this alignment can cause wrong deformation
motion in the stretching and blowing stage. Stretch rod and mold alignment in Blow View 8.2 is
shown in fig. 4-2.

Chapter 4 ISBM PROCESS DESIGN WITH BLOW VIEW 8.2
103
Fig.4-2. Stretch Rod and Bottle alignment in Blow View
4.2.3 Preform thickness profile
The thickness profile of the preform is one of the most important parameters that affect the
thickness of the final bottle. Hereby, the desired thickness in the bottle is ensured by the preform
design. While the uniformity of the bottle base thickness could be targeted, because the abrupt
thickness changes in the base is claimed to be the source of the crack development at the bottom
of the bottle [Lyu and Pae, 2003] more importantly, thickness profile which will minimize the
stress and also reduce the variations in stress along the bottle base is targeted. Therefore,
thickness profile which minimizes the stress with minimum variation produces the optimum
processing conditions.

Chapter 4 ISBM PROCESS DESIGN WITH BLOW VIEW 8.2
104
The preform design can be imported to the simulation program, however, in this study the
preform design was generated by the simulation program’s own design menu (fig. 4-3). The
study is conducted based on the preform design currently used in the industry which weighs 40 g.
as shown in fig. 4-4. Process optimisation is also considered for preform design where the
preform weight is reduced to 34 g. by changing preform wall thickness (fig. 4-5 and fig. 4-6).
Fig.4-3. Preform design menu in Blow View 8.2 for the 40 g. preform

Chapter 4 ISBM PROCESS DESIGN WITH BLOW VIEW 8.2
105
Fig.4-4. Design currently used in industry for the 40 g preform

Chapter 4 ISBM PROCESS DESIGN WITH BLOW VIEW 8.2
106
Fig.4-5. Alternative design for the 34 g. preform

Chapter 4 ISBM PROCESS DESIGN WITH BLOW VIEW 8.2
107
Fig.4-6. Preform design menu in Blow View 8.2 for the 34 g. preform
4.2.4 Temperature profile of the preform
In effect, thickness and temperature profile of the preform are interrelated and they affect
the thickness of the final bottle, especially in the bottom of the bottle [Wang et al., 1998]. The
amount of the PET material being piled at the bottom of the bottle increases linearly with the
decreasing temperature. In this study, two preform temperature profiles were considered; a low
temperature range of 93-110 oC and a high temperature range of 98-115
oC. A particular
temperature profile of the preform (fig. 4-7) can be input through Blow View’s preform design
menu.
4.2.5 Stretch rod movement
If the stretch rod displacement is not in harmony with other process parameters either the blown
preform ruptures or strain-hardening can not be achieved due to insufficient stretching [McEvoy
et al., 1998]. In this study, the stretch rod movement is adjusted so that the preform stretched

Chapter 4 ISBM PROCESS DESIGN WITH BLOW VIEW 8.2
108
according to that of ‘free-blowing’ conditions. In order to investigate the effect of the stretch rod
motion on the performance of the bottle, the preform was stretched and blown under three
different regimes (models).
Fig.4-7. Temperature profile of the preform
Fig.4-8. Stretch rod dimensions used in this study

Chapter 4 ISBM PROCESS DESIGN WITH BLOW VIEW 8.2
109
The stretch rod design used in this study is given in fig. 4-8. In the simulation, it is assumed
friction between the preform and the stretch rod is too small to be considered.
For the first regime described as ‘zero stretching’ or ‘free-blowing’ (model-1), the stretch rod was
not used in the process and the preform was blown only through the pre-blow pressure.
For the second regime described as ‘50% stretch’ (model-2), the rod stretched the preform just
half way down the mold. After that point, the preform was blown by the pre-blow pressure
applied inside the preform (fig. 4-9. (a)).
For the third regime described as ‘full stretch’ (model-3), the preform was stretched by the stretch
rod up to the bottom of the bottle mold and the final blow pressure was then applied to complete
all bottle corners (fig. 4-9. (b)).

Chapter 4 ISBM PROCESS DESIGN WITH BLOW VIEW 8.2
110
84
104
124
144
164
184
204
0 0.2 0.4 0.6 0.8 1 1.2 1.4
Time (sec)
Str
etc
h R
od
Dis
pla
ce
me
nt
(mm
)
(a)
0
50
100
150
200
250
300
350
0 0.2 0.4 0.6 0.8 1 1.2 1.4 1.6
Time (sec)
Str
etc
h R
od
Dis
pla
ce
me
nt
(mm
)
(b)
Fig.4-9. Stretch rod displacement vs. time (a) model-2 (b) model-3

Chapter 4 ISBM PROCESS DESIGN WITH BLOW VIEW 8.2
111
4.2.6 The pressure profile as a function of time
As the preform is stretched by the stretch rod a small amount of ‘pre-blow’ pressure is applied. A
higher pressure which plays a major role in forming the rest of the bottle is applied. The ‘pre
blow’ pressure which is applied only during the time the stretch rod gets up to the base of the
bottle is 0.1 to 0.2 MPa, whereas the final pressure can reach up to 4 MPa. The combined
duration of these ‘blow pressures’ define the total processing time [Wang et al., 1998]. The ‘pre-
blow’ and ‘final-blow’ pressure values were defined so as to comply with the ‘free-blowing’ just
as in the stretch rod movement setting [McEvoy et al., 1998]. Magnitude and timing of the ‘pre-
blow’ and ‘final blow’ will vary under each ‘stretching regime’ in accordance with the stretch rod
movement and the total processing time as a function of the preform weight, the temperature
profile of the preform. The pressure-time profiles of each model are given in fig. 4-10 (a), (b) and
(c).
Pressure vs Time for Model 1
0
0.5
1
1.5
2
2.5
3
3.5
4
4.5
0 0.2 0.4 0.6 0.8 1 1.2 1.4 1.6
Time(Sec)
Pre
ssu
re(M
Pa)
98-115 C 40 gr preform
93-110 C 40 gr preform
93-110 C 34 gr preform
(a)

Chapter 4 ISBM PROCESS DESIGN WITH BLOW VIEW 8.2
112
Pressure vs Time for Model 2
0
0.5
1
1.5
2
2.5
3
3.5
4
4.5
0 0.2 0.4 0.6 0.8 1 1.2 1.4 1.6
Time(Sec)
Pre
ssu
re(M
Pa)
98-115 C 40 gr preform
93-110 C 40 gr preform
93-110 C 34 gr preform
(b)
Pressure vs Time for Model 3
0
0.5
1
1.5
2
2.5
3
3.5
4
4.5
0 0.2 0.4 0.6 0.8 1 1.2 1.4 1.6
Time(Sec)
Pre
ssu
re(M
Pa)
98-115 C 40 gr preform
93-110 C 40 gr preform
93-110 C 34 gr preform
(c)
Fig.4-10. Pressure vs. time profile for (a) model-1 (b) model-2 (c) model-3

Chapter 4 ISBM PROCESS DESIGN WITH BLOW VIEW 8.2
113
4.2.7 ISBM process settings
Both the bottle mould temperature and the stretch rod temperature were set to 30 °C during the
process. It was assumed that the stretch rod is made of the aluminum and the heat transfer
coefficient for the stretch rod surfaces was taken to be 1000 W/m2 °C
The ISBM process settings for model-1, model-2 and model-3 are tabulated in Table 4-1, Table
4-2 and Table 4-3 respectively. For each model, two different preform temperature profiles of
108-115 oC and 103-110
oC were considered for the 40 g preform; and only low temperature
profile of 103-110 oC was considered for the 34 g preform.
Table 4-1. Processing conditions for model-1
(a) Temperature range 98-115 oC for 40 g. preform
Preform Weight: 40 gr. Temperature Range: 98-115 oC

Chapter 4 ISBM PROCESS DESIGN WITH BLOW VIEW 8.2
114
(b). Temperature range 93-110 oC for 40 g. preform
(c). Temperature range 93-110 oC for 34 gr. preform
Temperature Range: 93-110 oC Preform Weight: 40 gr.
Preform Weight: 34 gr. Temperature Range: 93-110 oC

Chapter 4 ISBM PROCESS DESIGN WITH BLOW VIEW 8.2
115
Table 4-2. Processing Conditions for model-2
(a) Temperature range 98-115 oC for 40 g. preform
Table 4-2(b). Temperature range 93-110 oC for 40 g. preform
Temperature Range: 98-115 oC Preform Weight: 40 gr.
Preform Weight: 40 gr. Temperature Range: 93-110 oC

Chapter 4 ISBM PROCESS DESIGN WITH BLOW VIEW 8.2
116
Table 4-2 (c). Temperature range 93-110 oC for 34 g. preform
Table 4-3. Processing Conditions for model-3
(a) Temperature range 98-115 oC for 40 g. preform
Temperature Range: 93-110 oC Preform Weight: 34 gr.
Preform Weight: 40 gr. Temperature Range: 98-115 oC

Chapter 4 ISBM PROCESS DESIGN WITH BLOW VIEW 8.2
117
Table 4-3(b). Temperature range 93-110 oC for 40 g. preform
Table 4-3 (c). Temperature range 93-110 oC for 34 g. preform
Temperature Range: 93-110 oC Preform Weight: 40 gr.
Temperature Range: 93-110 oC Preform Weight: 34 gr.

Chapter 4 ISBM PROCESS DESIGN WITH BLOW VIEW 8.2
118
4.2.8 Deformation mode of the preform during stretch/preblow
The effect of the processing conditions on the final properties of the bottle is investigated by
means of Blow View 8.2 software program. Firstly, the movement of the stretch rod and the
temperature on the preform were fixed according to the defined models. The preform was blown
while adjusting the pre-blow pressure. When the timing of the stretch rod is not in harmony with
the ‘pre-blow’ pressure, the preform was ruptured through where the preform wall thickness was
thinnest, and the software program stopped producing an error message. On the other hand, when
the stretch rod movement was very quick, preform stretching did not occur, and the strain-
hardening did not happen. That is why; the stretch rod speed should be in harmony with the ‘pre-
blow’ pressure in the duration of ISBM process. Sometimes ‘sticking’ between the stretch rod
and the part of the preform occurred, when the stretch rod and the material were in contact with
each other during the initial stretching stage. This issue was resolved either increasing the pre-
blow pressure or decreasing the friction constant between aluminum mold and polymer material.
At the final blowing stage, when the contact of the PET bottle with the mold was not fully
completed, the problem was fixed with the additional increase of the final pressure. In addition,
sometimes, when the final-blow pressure is applied, ‘bubble formation’ has been observed at the
bottom of the bottle. This problem was fully fixed applying the final-pressure in a shorter time.
The followings are some of the reasons for increasing the level of difficulty of this study:
• ISBM process settings are highly dependant with each other
• The bottle base with petaloid shape is geometrically very complicated
• The PET material physical properties are not constant because they vary depending on the
time, strain rate and the ambient conditions.

Chapter 4 ISBM PROCESS DESIGN WITH BLOW VIEW 8.2
119
As the objective of this study is to improve the resistance of the petaloid base of the bottle against
environmental stress cracking, attention is concentrated on this region. In this study carried out
with the Blow View 8.2, it was aimed for the thickness in the base to be uniform, and for the
stress to be minimized. Fig. 4-11, fig. 4-12 and fig. 4-13 show the deformation mode of the
preform in nine steps during stretch/pre-blow for each model separately.

Chapter 4 ISBM PROCESS DESIGN WITH BLOW VIEW 8.2
120
a b
c d
e f
Fig.4-11. Preform shapes for Stretch/Pre-blow deformation steps – model-1
MODEL1 STEP2
MODEL1 STEP1
MODEL1 STEP3
MODEL1 STEP5
MODEL1 STEP7
MODEL1 STEP9

Chapter 4 ISBM PROCESS DESIGN WITH BLOW VIEW 8.2
121
a b
c d
e f
Fig.4-12. Preform shapes for Stretch/Pre-blow deformation steps – model-2
MODEL2 STEP1
MODEL2 STEP3
MODEL2 STEP4
MODEL2 STEP5
MODEL2 STEP6
MODEL2 STEP7

Chapter 4 ISBM PROCESS DESIGN WITH BLOW VIEW 8.2
122
a b
c d
e f
Fig.4-13. Preform shapes for Stretch/Pre-blow deformation steps – model-3
MODEL3 STEP1
MODEL3 STEP3
MODEL3 STEP4
MODEL3 STEP5
MODEL3 STEP6
MODEL3 STEP7

Chapter 4 ISBM PROCESS DESIGN WITH BLOW VIEW 8.2
123
4.3 SIMULATION RESULTS WITH BLOW VIEW
4.3.1 Thickness in the bottle base
In this part of the study, the thickness in the bottle base is investigated for all models as a
function of the initial temperature profile of the preform and preform weight. The following
processing conditions are considered for all three models:
• Temperature profile of 98-115 oC; 40 g. preform
• Temperature profile of 93-110 oC; 40 g. preform
• Temperature profile of 93-110 oC ; 34 g. preform
The results are given in fig. 4-14 (a), (b) and (c) for model-1, model-2 and model-3 respectively;
and fig. 4-14 (d) compares the actual (measured) thickness of the optimized bottle base with the
simulated thickness values.
Model 1
0.00
0.50
1.00
1.50
2.00
2.50
3.00
3.50
300 320 340 360 380
Distance from top of the Bottle (mm)
Bo
ttle
Wal
l T
hic
knes
s (m
m)
98-115 C-40 gr. Preform
93-110 C-40 gr. Preform
93-110 C-34 gr. Preform
(a)
Distance from the center of the bottle base
-40 - 20 0 20 40

Chapter 4 ISBM PROCESS DESIGN WITH BLOW VIEW 8.2
124
Model 2
0.00
0.50
1.00
1.50
2.00
2.50
3.00
3.50
300 320 340 360 380
Distance from top of the Bottle (mm)
Bo
ttle
Wal
l T
hic
knes
s (
mm
)
98-115 C-40 gr. Preform
93-110 C-40 gr. Preform
93-110 C-34 gr. Preform
(b)
Model3
0.00
0.50
1.00
1.50
2.00
2.50
3.00
3.50
4.00
300 320 340 360 380
Distance from top of the Bottle (mm)
Bo
ttle
Wal
l T
hic
knes
s (m
m)
98-115 C-40 gr. Preform
93-110 C-40 gr. Preform
93-110 C-34 gr. Preform
(c)
Distance from the center of the bottle base
-40 - 20 0 20 40
Distance from the center of the bottle base
-40 - 20 0 20 40

Chapter 4 ISBM PROCESS DESIGN WITH BLOW VIEW 8.2
125
0.00
0.50
1.00
1.50
2.00
2.50
3.00
3.50
4.00
300 320 340 360 380
Distance from top of the Bottle (mm)
Bo
ttle
Wal
l T
hic
knes
s (m
m)
Model 1
Model 2
Model 3
Actual
(d)
Fig.4-14. Thickness in the bottle base
(a) model-1 (b) model-2 (c) model-3 (d) comparison of the models
For the three models, the highest base thickness was obtained with model-3, the lowest with
model-1. On the other hand, it is found that the uniform thickness in the bottle base was achieved
with model-1. The bottle base thickness in the centre region increased as the extent of preform
stretching towards the base of the bottle is increased. Hence, the uniformity of the thickness could
not be achieved. The highest base thickness was obtained in the central region called ‘pinch’. The
thickness of the base started to decrease in the direction away from the center of the base,
towards the bottle side panels and reached a constant value of 0.3 mm. The abrupt thickness
changes in the bottle base tend to increase with the extent of the stretch rod movement; abrupt
thickness changes are more prominent with model-3, while no such abrupt thickness changes are
observed with model-1. Most importantly, it is observed that the thickness profile achieved by
Temperature: 98-115 OC
Preform: 40 gr.
Comparison of the Models
Distance from the center of the bottle base
-40 - 20 0 20 40

Chapter 4 ISBM PROCESS DESIGN WITH BLOW VIEW 8.2
126
model-2 processing conditions is very similar to the actual thickness profile of the optimized
bottle base as shown in fig. 4-14(d).
Another observation recorded is that the thickness in the valley and the foot regions of the bottle
base are quite different from each other. The thickest values are found in the centre of the base,
and then in the valley; and the thinnest values are found in the foot section. This can be observed
in simulated thickness values for all three models (fig 4-15 to 4-17). In case of a lower
temperature profile and a lower preform weight, bottle base thickness becomes more uniform.

Chapter 4 ISBM PROCESS DESIGN WITH BLOW VIEW 8.2
127
Temperature Range: 98-115 oC
Preform Weight: 40 g.
(a)
Temperature Range: 98-115 oC
Preform Weight: 40 g.
(a)
Temperature Range: 98-115 oC
Preform Weight: 40 g.
(a)
Temperature Range: 93-110 oC
Preform Weight: 40 g.
(b)
Temperature Range: 93-110 oC
Preform Weight: 40 g.
(b)
Temperature Range: 93-110 oC
Preform Weight: 40 g.
(b)
Temperature Range: 93-110 oC
Preform Weight: 34 g.
(c)
Temperature Range: 93-110 oC
Preform Weight: 34 g.
(c)
Temperature Range: 93-110 oC
Preform Weight: 34 gr.
(c)
Model 1 98-115 OC – 40 gr preform Model 1 93-110 OC – 40 gr preform Model 1 93-110 OC – 34 gr preform
Model 2 98-115 OC – 40 gr preform Model 2 93-110 OC – 40 gr preform Model 2 93-110 OC – 34 gr preform
Model 3 98-115 OC – 40 gr preform Model 3 93-110 OC – 40 gr preform Model 3 93-110 OC – 34 gr preform
Fig.4-15. Pictures of the thickness distributions at the bottom of the bottle for model-1
Fig.4-16. Pictures of thickness distributions at the bottom of the bottle for model-2
Fig.417. Pictures of the thickness distributions at the bottom of the bottle for model-3

Chapter 4 ISBM PROCESS DESIGN WITH BLOW VIEW 8.2
128
4.3.2 Simulated stress in the bottle base
The simulated stress in the bottle base are studied for two different preform temperature profiles
and two different preform weights for each model (Fig 4-18. (a), (b), (c)). Whereas Fig. 4-18. (d)
compares the simulated stresses in the bottle base for a high preform temperature profile (98-115
oC) and a heavy preform (40 g) with respect to the three models.
Model1
-5.00E+01
0.00E+00
5.00E+01
1.00E+02
1.50E+02
2.00E+02
300 320 340 360 380
Distance from top of the Bottle(mm)
Stre
ss (M
Pa)
98-115 C-40 gr. Preform
93-110 C-40 gr. Preform
93-110 C-34 gr. Preform
(a)
Model 2
-1.00E+01
0.00E+00
1.00E+01
2.00E+01
3.00E+01
4.00E+01
5.00E+01
6.00E+01
7.00E+01
8.00E+01
300 320 340 360 380
Distance from top of the Bottle (mm)
Str
ess
(M
Pa)
98-115 C-40 gr. Preform
93-110 C-40 gr. Preform
93-110 C-34 gr. Preform
(b)
Distance from the center of the bottle base
-40 - 20 0 20 40
Distance from the center of the bottle base
-40 - 20 0 20 40

Chapter 4 ISBM PROCESS DESIGN WITH BLOW VIEW 8.2
129
Model 3
0.00E+00
2.00E+01
4.00E+01
6.00E+01
8.00E+01
1.00E+02
1.20E+02
1.40E+02
1.60E+02
1.80E+02
2.00E+02
300 320 340 360 380
Distance from top of the Bottle (mm)
Str
ess
(M
Pa
)
98-115 C-40 gr. Preform
93-110 C-40 gr. Preform
93-110 C-34 gr. Preform
(c)
Compariment of the Models
-1.00E+01
0.00E+00
1.00E+01
2.00E+01
3.00E+01
4.00E+01
5.00E+01
6.00E+01
7.00E+01
8.00E+01
300 320 340 360 380
Distance from top of the Bottle (mm)
Str
ess
(MP
a)
Model1
Model2
Model3
(d)
Fig.4-18. Simulated stress in the bottle base for (a) model-1 (b) model-2
(c) model-3 (d) comparison of the models
Temperature: 98-115 OC
Preform: 40 gr.
Comparison of the Models
Distance from the center of the bottle base
-40 - 20 0 20 40
Distance from the center of the bottle base
-40 - 20 0 20 40

Chapter 4 ISBM PROCESS DESIGN WITH BLOW VIEW 8.2
130
The stress in the bottle base is not highly dependant on the preform weight and the initial
temperature profile of preform; the stress values are only slightly different from each other.
However, when the results are compared with respect to the models, the minimum and maximum
stress values in the centre of the base are obtained through model-2 and model-1, respectively
(Fig. 4-18(d)). Most importantly, stress is minimized for model-2, which gives the optimum base
thickness for the bottles. It can be said that the stretch rod movement has an impact on the stress
in the base centre. The highest stress values are in the foot region and the lowest in the centre of
the base. This can be observed in simulated stress values for all three models (fig 4-19 to 4-21).
As expected there is an inverse relationship between the wall thickness and the stresses in the
bottle base.

Chapter 4 ISBM PROCESS DESIGN WITH BLOW VIEW 8.2
131
Temperature Range: 98-115 oC
Preform Weight: 40 g.
(a)
Temperature Range: 98-115 oC
Preform Weight: 40 g.
(a)
Temperature Range: 98-115 oC
Preform Weight: 40 g.
(a)
Temperature Range: 93-110 oC
Preform Weight: 40 g.
(b)
Temperature Range: 93-110 oC
Preform Weight: 40 g.
(b)
Temperature Range: 93-110 oC
Preform Weight: 40 g.
(b)
Temperature Range: 93-110 oC
Preform Weight: 34 g.
(c)
Temperature Range: 93-110 oC
Preform Weight: 34 g.
(c)
Temperature Range: 93-110 oC
Preform Weight: 34 g.
(c)
Model 1 98-115 OC – 40 gr preform Model 1 93-110 OC – 40 gr preform Model 1 93-110 OC – 34 gr preform
Model 2 98-115 OC – 40 gr preform Model 2 93-110 OC – 40 gr preform Model 2 93-110 OC – 34 gr preform
Model 3 98-115 OC – 40 gr preform Model 3 93-110 OC – 40 gr preform Model 3 93-110 OC – 34 gr preform
Fig.4-19. Pictures of the stress distributions at the bottom of the bottle for model-1
Fig.4-20. Pictures of the stress distributions at the bottom of the bottle for model-2
Fig.4-21. Pictures of the stress distributions at the bottom of the bottle for model-3

Chapter 4 ISBM PROCESS DESIGN WITH BLOW VIEW 8.2
132
4.3.3 Simulated crystallinity in the bottle base
The crystallinity in the bottle base are simulated at two different preform temperature profiles and
two different preform weights for each model (Fig 4-22 (a), (b), (c)). Fig. 4-22 (d) compares the
simulated crystallinity in the bottle base for a high preform temperature profile (98 -115 oC) and a
heavy preform (40 g) for the three models.
Model1
-5.00E-02
0.00E+00
5.00E-02
1.00E-01
1.50E-01
2.00E-01
2.50E-01
3.00E-01
3.50E-01
4.00E-01
300 320 340 360 380
Distance from top of the Bottle (mm)
Cry
stal
linity
98-115 C-40 gr. Preform
93-110 C-40 gr. Preform
93-110 C-34 gr.Preform
(a)
Model 2
0.00E+00
5.00E-02
1.00E-01
1.50E-01
2.00E-01
2.50E-01
3.00E-01
3.50E-01
4.00E-01
300 320 340 360 380
Distance from top of the Bottle (mm)
Cry
sta
llin
ity
98-115 C- 40 gr. Preform2
93-110 C- 40 gr. Preform
93-110 C- 34 gr. Preform
(b)
Distance from the center of the bottle base
-40 - 20 0 20 40
Distance from the center of the bottle base
-40 - 20 0 20 40

Chapter 4 ISBM PROCESS DESIGN WITH BLOW VIEW 8.2
133
Model 3
-5.00E-02
0.00E+00
5.00E-02
1.00E-01
1.50E-01
2.00E-01
2.50E-01
3.00E-01
3.50E-01
4.00E-01
300 320 340 360 380
Distance from top of the Bottle (mm)
Cry
sta
llin
ity
98-115 C- 40 gr. Preform
93-110 C- 40 gr. Preform
93-110 C- 34 gr.Preform
(c)
Compariment of the Models
-5.00E-02
0.00E+00
5.00E-02
1.00E-01
1.50E-01
2.00E-01
2.50E-01
3.00E-01
3.50E-01
4.00E-01
300 320 340 360 380
Distance from top of the Bottle (mm)
Cry
stal
linit
y
Model1
Model2
Model3
(d)
Fig.4-22. Simulated crystallinity distribution in the bottle base for a) model-1 b) model2
c) model-3 d) comparison of the models
Temperature: 98-115 OC
Preform: 40 gr.
Comparison of the Models
Distance from the center of the bottle base
-40 - 20 0 20 40
Distance from the center of the bottle base
-40 - 20 0 20 40

Chapter 4 ISBM PROCESS DESIGN WITH BLOW VIEW 8.2
134
In the center of the bottle base, there are not significant differences in crystallinity as a function
of both the preform temperature and the preform weight for all three models. However, there
have been certain differences in crystallinity values between the models as shown in fig 4-22 (d).
The model-2, which gives the optimum base thickness, results in lowest and most uniform
crystallinity values. For all three models, crystallinity increases across the foot/valley sections of
the base towards the side panels of the bottle. This can be observed in simulated crystallinity
values (fig 4-23 to 4-25).

Chapter 4 ISBM PROCESS DESIGN WITH BLOW VIEW 8.2
135
Temperature Range: 98-115 oC
Preform Weight: 40 g.
(a)
Temperature Range: 98-115 oC
Preform Weight: 40 g.
(a)
Temperature Range: 98-115 oC
Preform Weight: 40 g.
(a)
Temperature Range: 93-110 oC
Preform Weight: 40 g.
(b)
Temperature Range: 93-110 oC
Preform Weight: 40 g.
(b)
Temperature Range: 93-110 oC
Preform Weight: 40 g.
(b)
Temperature Range: 93-110 oC
Preform Weight: 34 g.
(c)
Temperature Range: 93-110 oC
Preform Weight: 34 g.
(c)
Temperature Range: 93-110 oC
Preform Weight: 34 g.
(c)
Model 1 98-115 OC – 40 gr preform Model 1 93-110 OC – 40 gr preform Model 1 93-110 OC – 34 gr preform
Model 2 98-115 OC – 40 gr preform Model 2 93-110 OC – 40 gr preform Model 2 93-110 OC – 34 gr preform
Model 3 98-115 OC – 40 gr preform Model 3 93-110 OC – 40 gr preform Model 3 93-110 OC – 34 gr preform
Fig.4-23. Simulations of the crystallinity in the bottle base; model-1
Fig.4-25. Simulations of the crystallinity in the bottle base; model-3
Fig.4-24. Simulations of the crystallinity in the bottle base; model-2

Chapter 4 ISBM PROCESS DESIGN WITH BLOW VIEW 8.2
136
4.3.4 Simulated molecular orientation in the bottle base
The molecular orientation in the bottle base are simulated at two different preform temperature
profiles and two different preform weights for each model (Fig 4-26. (a), (b), (c)). Fig. 4-26. (d)
compares the simulated molecular orientation in the bottle base for a high preform temperature
profile (98 -115 oC) and a heavy preform (40 g) for the three models.
Model1
-2.00E-02
0.00E+00
2.00E-02
4.00E-02
6.00E-02
8.00E-02
1.00E-01
1.20E-01
1.40E-01
1.60E-01
300 320 340 360 380
Distance from top of the Bottle (mm)
Mol
ecul
ar O
rien
tatio
n
98-115 C-40 gr. Preform
93-110 C-40 gr. Preform
93-110 C-34 gr. Preform
(a)
Model 2
0.00E+00
2.00E-02
4.00E-02
6.00E-02
8.00E-02
1.00E-01
1.20E-01
1.40E-01
1.60E-01
1.80E-01
2.00E-01
300 320 340 360 380
Distance from top of the Bottle (mm)
Mo
lecu
lar
Ori
enta
tio
n
98-110 C-40 gr. Preform
93-110 C-40 gr. Preform
93-110 C-34 gr. Preform
(b)
Distance from the center of the bottle base
-40 - 20 0 20 40
Distance from the center of the bottle base
-40 - 20 0 20 40

Chapter 4 ISBM PROCESS DESIGN WITH BLOW VIEW 8.2
137
Model 3
-2.00E-02
0.00E+00
2.00E-02
4.00E-02
6.00E-02
8.00E-02
1.00E-01
1.20E-01
1.40E-01
300 320 340 360 380
Distance from top of the Bottle (mm)
Mole
cula
r O
rien
tati
on
98-115 C-40 gr. Preform
93-110 C-40 gr. Preform
93-110 C-34 gr. Preform
(c)
Compariment of the Models
-2.00E-02
0.00E+00
2.00E-02
4.00E-02
6.00E-02
8.00E-02
1.00E-01
1.20E-01
1.40E-01
300 320 340 360 380
Distance from top of the Bottle (mm)
Mol
ecu
lar
Ori
enta
tion
Model1
Model2
Model3
(d)
Fig.4-26. Simulations of molecular orientation in the bottom of the bottle a) model-1 b) model-2
c) model-3 (d) comparison of the models
Temperature: 98-115 oC
Preform: 40 gr.
Comparison of the Models
Distance from the center of the bottle base
-40 - 20 0 20 40
Distance from the center of the bottle base
-40 - 20 0 20 40

Chapter 4 ISBM PROCESS DESIGN WITH BLOW VIEW 8.2
138
Molecular orientation increases from the centre of the base towards the side walls of the bottle
independent of preform temperature profile and weight. However, the molecular orientation
peaks near to the base center in the foot/valley region for high preform temperature profile (98-
115 oC) and heavy preform weight (40 g.). For low temperature profile and light preform, the
peak in molecular orientation occurs further down near the side panels of the bottle. It important
to note, that the model-2, which gives the optimum base thickness, results in minimum and
highly uniform molecular orientation values. For all models, the molecular orientation higher in
the foot region of the base compared to the valley; this can be observed in the simulated
molecular orientation values (fig 4-27 to 4-29).

Chapter 4 ISBM PROCESS DESIGN WITH BLOW VIEW 8.2
139
Temperature Range: 98-115 oC
Preform Weight: 40 g.
(a)
Temperature Range: 98-115 oC
Preform Weight: 40 g.
(a)
Temperature Range: 98-115 oC
Preform Weight: 40 g.
(a)
Temperature Range: 93-110 oC
Preform Weight: 40 g.
(b)
Temperature Range: 93-110 oC
Preform Weight: 40 g.
(b)
Temperature Range: 93-110 oC
Preform Weight: 40 g.
(b)
Temperature Range: 93-110 oC
Preform Weight: 34 g.
(c)
Temperature Range: 93-110 oC
Preform Weight: 34 g.
(c)
Temperature Range: 93-110 oC
Preform Weight: 34 g.
(c)
Model 1 98-115 OC – 40 gr preform Model 1 93-110 OC – 40 gr preform Model 1 93-110 OC – 34 gr preform
Model 2 98-115 OC – 40 gr preform Model 2 93-110 OC – 40 gr preform Model 2 93-110 OC – 34 gr preform
Model 3 98-115 OC – 40 gr preform Model 3 93-110 OC – 40 gr preform Model 3 93-110 OC – 34 gr preform
Fig.4-27. Simulation of molecular orientation in the bottle base for model-1
Fig.4-28. Simulation of molecular orientation in the bottle base for model-2
Fig.4-29. Simulation of molecular orientation in the bottle base for model-3

Chapter 4 ISBM PROCESS DESIGN WITH BLOW VIEW 8.2
140
4.3.5 Simulated biaxial ratio in the bottle base
The biaxial ratio in the bottle base are simulated at two different preform temperature profiles and
two different preform weights for each model (Fig 4-30. (a), (b), (c)). Fig. 4-30. (d) compares the
simulated biaxial ratio in the bottle base for a high preform temperature profile (98 -115 oC) and a
heavy preform (40 g) for the three models.
Model1
8.00E-01
1.30E+00
1.80E+00
2.30E+00
2.80E+00
3.30E+00
3.80E+00
4.30E+00
4.80E+00
300 320 340 360 380
Distance from top of the Bottle (mm)
Bia
xial
Rat
io
98-115 C-40gr. Preform
93-110 C-40 gr. Preform
93-110 C-34 gr. Preform
(a)
Model 2
1.00E+00
1.50E+00
2.00E+00
2.50E+00
3.00E+00
3.50E+00
4.00E+00
300 320 340 360 380
Distance from top the Bottle (mm)
Bia
xia
l R
ati
o
98-115 C-40 gr. Preform
93-110 C-40 gr. Preform
93-110 C-34 gr. Preform
(b)
Distance from the center of the bottle base
-40 - 20 0 20 40
Distance from the center of the bottle base
-40 - 20 0 20 40

Chapter 4 ISBM PROCESS DESIGN WITH BLOW VIEW 8.2
141
Model 3
1.00E+00
1.50E+00
2.00E+00
2.50E+00
3.00E+00
3.50E+00
4.00E+00
4.50E+00
300 320 340 360 380
Distance from top of the Bottle (mm)
Bia
xia
l R
ati
o
98-115 C-40 gr. Preform
93-110 C-40 gr. Preform
93-110 C-34 gr. Preform
(c)
Compariment of the Models
1.00E+00
1.50E+00
2.00E+00
2.50E+00
3.00E+00
3.50E+00
4.00E+00
300 320 340 360 380
Distance from top of the Bottle (mm)
Bia
xial
Rta
io
Model1
Model2
Model3
(d).
Fig.4-30. Simulation of biaxial ratio in the bottle base a) model-1 b) model-2
c) model-3 (d) comparison of the models
Temperature: 98-115 oC
Preform: 40 gr.
Comparison of the Models
Distance from the center of the bottle base
-40 - 20 0 20 40
Distance from the center of the bottle base
-40 - 20 0 20 40

Chapter 4 ISBM PROCESS DESIGN WITH BLOW VIEW 8.2
142
The biaxial ratio increases from the centre of the base towards the side panels of the bottle for all
models. This is because the stretch rod stops at the closed end of the bottle; hence no further axial
stretching can take place at the very centre of the base. Whereas, the material in the outer regions
away from the centre towards the side wall panels of the bottle, is further stretched radially by the
final blow pressure, generating a peak in biaxial ratio in the transition region between the base
center and valley/foot region of the base; this can be observed in the simulated biaxial ratio
values for all three models. (fig 4-31 to 4-33).
Biaxial ratio increases from the centre of the base towards the side walls independent of
processing model used. However, the biaxial ratio peaks in the transition to the foot/valley region
for low preform temperature profile (93-110 oC), low preform weight (34 g) in model-1; and for
low preform temperature (93-110 oC) and high preform weight (40 g) in model-2. For model-3,
biaxial ratio peaks in the transition to the foot/valley region at low preform temperature profile
(93-110 oC) independent of preform weight. The model-2, which gives the optimum base
thickness, results in minimum and highly uniform biaxial ratio values.

Chapter 4 ISBM PROCESS DESIGN WITH BLOW VIEW 8.2
143
Temperature Range: 98-115 oC
Preform Weight: 40 g.
(a)
Temperature Range: 98-115 oC
Preform Weight: 40 g.
(a)
Temperature Range: 98-115 oC
Preform Weight: 40 g.
(a)
Temperature Range: 93-110 oC
Preform Weight: 40 g.
(b)
Temperature Range: 93-110 oC
Preform Weight: 40 g.
(b)
Temperature Range: 93-110 oC
Preform Weight: 40 g.
(b)
Temperature Range: 93-110 oC
Preform Weight: 34 g.
(c)
Temperature Range: 93-110 oC
Preform Weight: 34 gr.
(c)
Temperature Range: 93-110 oC
Preform Weight: 34 g.
(c)
Model 1 98-115 OC – 40 gr preform Model 1 93-110 OC – 40 gr preform Model 1 93-110 OC – 34 gr preform
Model 2 98-115 OC – 40 gr preform Model 2 93-110 OC – 40 gr preform Model 2 93-110 OC – 34 gr preform
Model 3 98-115 OC – 40 gr preform Model 3 93-110 OC – 40 gr preform Model 3 93-110 OC – 34 gr preform
Fig.4-31. Simulations of the biaxial ratios in the bottle base; model-1
Fig.4-33. Simulations of the biaxial ratios in the bottle base; model-3
Fig.4-32. Simulations of the biaxial ratios in the bottle base; model-2

Chapter 4 ISBM PROCESS DESIGN WITH BLOW VIEW 8.2
144
4.3.6 The comparison of the simulated properties with respect to the base thickness
The simulated values of the crystallinity, the stress, the molecular orientation and the biaxial ratio
are compared with the base thickness of the bottle (fig. 4-34 to fig. 4-37).
-5.00E-02
0.00E+00
5.00E-02
1.00E-01
1.50E-01
2.00E-01
2.50E-01
3.00E-01
3.50E-01
4.00E-01
300 320 340 360 380
Distance (mm)
Cry
stal
linity
0
0.5
1
1.5
2
2.5
3
3.5
Thi
ckne
ss (m
m)
Model1 Crystallinity
Model1 Thickness
Fig.4-34. The relationship between thickness and crystallinity in the base
-4 - 2 4
Distance from the center of the bottle base

Chapter 4 ISBM PROCESS DESIGN WITH BLOW VIEW 8.2
145
Fig.4-35. The relationship between thickness and stress in the base
-2.00E-02
0.00E+00
2.00E-02
4.00E-02
6.00E-02
8.00E-02
1.00E-01
1.20E-01
1.40E-01
300 320 340 360 380
Distance (mm)
Mol
ecu
lar
Ori
enta
tion
0.00
0.50
1.00
1.50
2.00
2.50
3.00
3.50
Th
ick
nes
s (m
m)
Model1 Molecular Orientation
Model1 Thickness Distribution
Fig.4-36. The relationship between thickness and molecular orientation in the base
-1.00E+01
0.00E+00
1.00E+01
2.00E+01
3.00E+01
4.00E+01
5.00E+01
6.00E+01
7.00E+01
300 320 340 360 380
Distance (mm)
Stre
ss (M
Pa)
0
0.5
1
1.5
2
2.5
3
3.5
Thi
ckne
ss (m
m)
Model1 Stress Distribution
Model1 Thickness Distribution
-20 20 40 -40
20 -40 -20 4
Distance from the center of the bottle base
Distance from the center of the bottle base

Chapter 4 ISBM PROCESS DESIGN WITH BLOW VIEW 8.2
146
1.00E+00
1.10E+00
1.20E+00
1.30E+00
1.40E+00
1.50E+00
1.60E+00
1.70E+00
1.80E+00
1.90E+00
300 320 340 360 380
Distance (mm)
Bia
xial
Rat
io
0
0.5
1
1.5
2
2.5
3
3.5
Thi
ckne
ss (m
m)
Model1 Biaxial Ratio
Model1 Thickness Distribution
Fig.4-37. The relationship between thickness and biaxial ratio in the base
The crystallinity and the stress decrease with the increasing thickness in the base (fig 4-34 and fig
4-35). Whereas, molecular orientation and biaxial ratio are minimum in the centre of the base and
they peak in the transition regions between the centre and the foot/valley region of the base (fig
4-36 and fig 4-37). It was claimed that the circumferential cracks in the bottle are due to the
abrupt changes in thickness of the bottle base; the abrupt thickness changes in the base resulted in
the abrupt changes in the crystallinity and the molecular orientation; and the transition regions to
the valley/foot are the most bi-axially oriented regions of the base [Hanley et al., 2006]. It is
confirmed by this simulation, that there is an abrupt change (decrease) in thickness with
accompanying changes (increase) in crytallinity and stresses in the base. The molecular
orientation and the biaxial ratio peak in the transition regions where the base thickness changes
abruptly. In addition, reducing the preform weight from 40 g to 34 g; and processing without the
use of the stretch rod caused biaxial ratio to increase; whereas the biaxial orientation ratio
somehow decreased with increasing preform temperature profile from 93-110 oC to 95-115
oC.
-40 -20 20 40
Distance from the center of the bottle base

Chapter 4 ISBM PROCESS DESIGN WITH BLOW VIEW 8.2
147
In general, the extent of axial stretching exerted by the rod on the wall panels is higher than the
radial stretching carried out by the final pressure in the bottle base. Consequently, the
cyrstallinity, molecular orientation and biaxial ratio in the wall panels are expected to be higher
than the centre of the bottle base.
4.4 CONCLUSION
In this chapter, the process optimization via the Blow View 8.2 simulation program is explained.
In order to achieve a uniform thickness and to minimize stress in the bottle base, two different
preform temperature profiles of 93-110 oC and 98-115
oC are considered for the 40 g. preform
which is currently in use for the production of 1.5 lt. PET bottle. Furthermore, preform weight is
reduced to 34 g by changing the standard design. For the new design, only lower preform
temperature range of 93-110 oC is used for the simulation studies. The thickness, stress,
crystallinity, molecular orientation, and biaxial ratio in the bottle base are obtained for each
processing model. The comments pertaining to each are given under their respective title.
The model-1 introduces highly uniform and minimum wall thickness in the bottle base. In this
model, the preform is not stretched due to the stretch rod not being used; excessive PET material
is not carried by the rod to the bottle base. Hence, most of the material on the preform walls stays
on the side panels of the bottle compared to model-2 and model-3, where stretching relies on the
stretch rod movement as well as blow pressure. As the amount of polymer material available in
bottle base becomes less, thinner and more uniform thickness is achieved. Whereas for the
model-2 and model-3, which depend on the movement of stretch rod, as the amount of the
polymer material transported to the bottle base increases, both thicker and less uniform base
thickness are obtained. Hence, theoretically, it is more suitable for the stretch rod not to be used
in ISBM process in terms of achieving uniform and thinner base thickness.

Chapter 4 ISBM PROCESS DESIGN WITH BLOW VIEW 8.2
148
On the other hand, analysis of simulated stress results reveals that, for the model-2, it is possible
to minimise stress in the bottle base. Although, preform temperature range and the weight of
preform also affect the stress in the bottle base; the thicker the base, the smaller the stress
becomes; but the changes in thickness become abrupt with the increasing base thickness and
hence the stress cracking may be adversely affected if the strain hardening point has not been
reached during stretching of the base. In general, higher stress values are found in the foot and
valley regions of the bottle; and the lower stress values are recorded in central region of the base.
For model-2, simulation studies indicate that the crystallinity, biaxial ratio and molecular
orientation all decreased at the bottle base while minimizing stress. Although uniformity of the
base thickness is not achieved in model-2, as long as the stress in the base is minimized, a non-
uniform base thickness may provide the environmental stress crack resistance if the stretching of
the base is sufficient to induce strain hardening. Hence, it can be concluded that the injection
stretch blow moulding parameters are optimised when the bottle is processed according to the
model-2.

Chapter 5 EXPERIMENTAL PROCEDURES AND EVALUATION
149
Chapter 5
EXPERIMENTAL PROCEDURES AND
EVALUATION OF THE OPTIMISED
BASE DESIGN

Chapter 5 EXPERIMENTAL PROCEDURES AND EVALUATION
150
5.1 INTRODUCTION
Injection stretch blow moulded PET bottles are subjected to various performance tests before
being qualified for packaging purposes in industry. Whilst the specifics of the quality regime are
directly dependant on the type of liquid to be kept in the bottle, the following tests are generally
applied:
• Burst Pressure Test
• Top Load Test and Material Distribution
• Environmental Stress Crack Resistance Test
• Crystallinity
• Drop Test
• Permeability to Liquids and Gases
For the purposes of this study the first four tests are regarded as sufficient to assess bottle quality.
In this study, bottle samples of each base design were produced using a two-stage stretch blow
machine. 40 g injection molded preforms was used throughout. The process parameters are given
in table 5-1.

Chapter 5 EXPERIMENTAL PROCEDURES AND EVALUATION
151
Table 5-1. Injection stretch blow molding process parameters for the 1.5 lt. bottle
Process Parameters
SCREW
Diameter 38 mm
Screw speed 100 rpm
Nozzle Diameter 3 mm
HOT RUNNER BLOCK
Sprue 275°C
Block 275°C
Nozzle 295°C
BARREL TEMPERATURE
Front 275°C
Middle 275°C
Rear 270°C
Nozzle 275°C
INJECTION PRESSURE
Primary 140 Kgf/cm2
Secondary 60 Kgf/cm2
Injection speed 200 m/s
STRETCH BLOW MOLDING
Cold preform temperature 80 °C
Preform re-heat temperature 109 °C
Pre-blow 1.25 MPa
Final blow 4 MPa
Base: 12°C
Shell: 12°C Water temperatures
Oven: 10°C
Machine Oil Temperature 35°C
Stretch Rod Speed 1.0 m/s
Stretch rod outside diameter 14 mm
Process time 2.48 sec.

Chapter 5 EXPERIMENTAL PROCEDURES AND EVALUATION
152
To investigate the effect of preform temperature, samples of the new (optimised) bottle were
produced using preform temperatures of 105, 110, and 115 oC. The bottles with the optimum
base produced under this process operating conditions were fully formed but there has been a
slight pearlescence problem for the bottles produced at 105 oC preform reheat temperature. Also
some contact problem was observed on the optimum base of the bottle. Some measures have
been taken to eliminate this problem; e.g. reducing the friction between the bottle base and the
mold, and removing air pockets that developed between the mold and the bottle surfaces
5.2 EXPERIMENTAL
5.2.1 Burst pressure
Carbonated beverages pressurise the bottle at up to 100psi (7 Bar). The pressurised bottle should
not expand excessively, or worse still blow up, at the bottler's filler line.
A number of factors can lead to low bottle burst strength; insufficient wall thickness in some
areas due to poor material distribution, wide mould parting lines that may be due to loss of mould
compensation (neck, shoulder or side-wall failure), mould damage, etc. Similarly, excessive
expansion can occur in the shoulder or panel regions as a result of low section weight or poor
material distribution.
AGR Plastics pressure tester, with ramp fill capability. The test head seals the brink of the bottle.
The bottle is filled with water and pressurised rapidly to 100 psi. The pressure is then increased at
a controlled rate until the bottle fails or the maximum pressure limit of the tester is reached.

Chapter 5 EXPERIMENTAL PROCEDURES AND EVALUATION
153
5.2.1.1 Apparatus:
In the analyses, AGR Plastic Pressure Tester with Ramp Fill capability is used.
5.2.1.2 Procedure:
a. A reporting system is firstly ensured to input results throughout the conduct of this test. This
may be a computer based stored program control system, Excel spreadsheet or manual
report form.
b. The "Ramp Fill" mode of testing is selected.
c. The "Initial Pressure" is set at 100 psi and the "Expansion Limit" is set to ‘none’.
d. The bottle is positioned into the neck support feature inside the test chamber.
e. The door of the test chamber is closed. There is a safety interlock on the door, if not fully
closed, the Burst Tester will not commence testing the bottle.
f. The ‘Test Button’ is pressed. The test head clamps down and seal the finish of the bottle.
The Burst Tester then fills the bottle with water, rapidly increases pressure to the "Initial
Pressure" setting and then ramps the pressure up until failure occurs or the maximum
pressure limit of the tester is reached.
g. If the bottle bursts, the ‘Fail Indicator’ lights up in red. The ‘Pass Indicator’ lights up in
green if the bottle does not burst.
h. When the test is completed, the ‘test head’ rises. The chamber door is opened and the bottle
is removed.
i. The "Bottle Pressure" result is recorded.
5.2.2 Top load strength test
5.2.2.1 Apparatus:
Top load strength tests were conducted using the INSTRON 4466 instrument with a system
connected to a computer.

Chapter 5 EXPERIMENTAL PROCEDURES AND EVALUATION
154
5.2.2.2 Procedure:
a. The bottle to be tested is firstly positioned into the test instrument
b. A compression force is applied on the top of the bottle
c. When the bottle is cracked or bended by the force, the test is completed
d. Maximum load and the load at failure are recorded by computer system.
5.2.3 Material and the weight of bottle sections
In order to measure the material on the bottle, the bottles are sectioned into three parts. These
three sections are named as base, centre, top, and these sections’ distances from the base are 53.3
mm and 194.3 mm. In this process, it is important that the bottle be separated into its sections by
means of an appropriate apparatus that will not allow any material lost. Therefore, conducting
this process through a sharp material is an inconvenient method. To this end, an electrical
mechanism, which consists of a thin filament that can be heated through electrical current and
two folding frames that one of them is mobile and the other one is immobile is used and pictured
in fig. 5-1. In addition, there is another cylindrical apparatus in the middle of the mechanism
firmly clamping the bottle to be cut. Hence, the bottle sections can be separated from each other
by melting the PET material via the hot filament.
The bottle is divided into three sections namely the base, body and top by means of a custom
made apparatus as shown in fig. 5-2. The three sections of the bottle, which are shown in fig 5-3,
are separately weighted by means of the precision scale and the values are recorded for
assessment.

Chapter 5 EXPERIMENTAL PROCEDURES AND EVALUATION
155
Fig.5-1. Apparatus developed for cutting of PET bottles
Fig.5-2. The base, body and top section of PET bottle

Chapter 5 EXPERIMENTAL PROCEDURES AND EVALUATION
156
The thickness is very important as well as weight of bottle sections. Especially on the bottle base,
increasing the amount of the PET material is to increase the thickness of this section which
directly relates to the crack formation in the base. Therefore, the base thickness values for the
foot, valley, and central regions of the new and standard bottles (preform reheat temperature 105
oC) are measured by vernier caliper.
5.2.4 Environmental stress crack resistance tests
5.2.4.1 Apparatus
a. Accelerated Stress Crack Test Unit (ASCRU)
b. Scales
c. 0.20% Sodium Hydroxide Solution (NaOH)
d. Computer
e. DATALYZER SPECTRUM SQC Program
f. Safety Glasses
5.2.4.2 Preparation environmental stress cracking agent
a. Caustic Solution must be prepared using pellets of concentrated NaOH
b. Two grams of NaOH pellets should be added to every 1 liter of cool tap water
5.2.4.3 Procedure
a. All bottles to be analyzed are collected and prepared to analysis
b. It is ensured that drain valves from each compartment are closed
c. Approximately 500ml (enough to immerse the base of the bottle) is added to each
compartment
d. Each bottle is labeled and filled to flange with cool tap water
e. Each bottle is attached to the unit by screwing the finish to the metallic caps

Chapter 5 EXPERIMENTAL PROCEDURES AND EVALUATION
157
f. Each bottle is placed into appropriate compartment and lid is closed and latches are secured
g. The unit is switched on.
h. To initiate each sample, the corresponding start button is pressed and held until it lights up
i. Undetected leaks are checked at 15 and 30 minutes into the test.
j. The unit is to display the time when bottle fails. It is allowed for 1 hour for test to
complete and then the failure time and location of failure on the base are recorded.
5.2.5 Thermal stability test
The Thermal Stability Test is designed to measure dimensional changes of filled carbonated PET
beverage bottles induced by thermal stresses that occur during the life of the filled bottle.
Satisfactory Thermal Stability performance is considered as a critical requirement by the bottlers.
A carbonated product exerts pressure on the inside of a bottle; and as temperature increases this
internal pressure increases, causing the bottle to expand and creep as function of time. Excessive
creep will cause the beverage fill level to drop, which will negatively affect appearance of the
package and reduce shelf life of the product.
5.2.5.1 Apparatus:
a. Separate controlled storage facilities capable of maintaining storage temperatures of 22±1°C
and 38±1°C
b. Height gauge with scribe
c. Vernier diameter measurement tape (Pi Tape)
d. Dial or Vernier Calipers
e. Base clearance gauge

Chapter 5 EXPERIMENTAL PROCEDURES AND EVALUATION
158
5.2.5.2 Procedure
1. Bottles to be analyzed, as many as required, are selected for this test
2. A height gauge fitted with a scribe to mark the appropriate nominal product fill level onto
each bottle is used.
3. Height of all samples to the bottom of the neck support ledge is measured.
4. The label panel diameter of all samples are measured with a Pi tape
5. Pinch diameter and the base diameter are measured with calipers
6. The base clearance of all samples is measured.
7. All bottles are chemically carbonated to a certain target level.
8. All bottles are stored at 22 ± 1°C for 20 - 24 hours.
9. All bottles are transferred to the 38 ±1 °C storage facility and stored for 24 hours.
10. All bottles are removed from the 38°C storage facility and allowed to condition at 22 ± 1°C
for 4 hours
11. The bottle perpendicularity, the minimum and maximum heights are measured and the
average of the minimum and maximum heights is recorded as the final height.
12. Measurements in the number 5 and 6 are repeated.
13. The "Fill Point Drop' which is the distance between the scribed reference line and the bottom
of the product meniscus is measured.
% Increase = * 100
Final Pinch / Base Ratio = * 100
(Final height or diameter dimension) - (Initial empty bottle dimension)
(Initial empty bottle dimension)
(Final Pinch diameter)
(Final Base diameter)

Chapter 5 EXPERIMENTAL PROCEDURES AND EVALUATION
159
5.2.6 Chemical carbonation procedure for thermal test
Carbon Dioxide generation in the CSD bottle is required to carry out the thermal test. In this
study, a procedure obtained from packaging companies is employed, which describes a method of
carbonation using chemicals to generate the Carbon Dioxide, and it is given concisely as follows.
This procedure is applicable to the carbonation of any rigid container, specifically PET bottles. In
addition, the carbonation with PET bottles will be approximately 5% lower than the target level
due to the initial bottle expansion and absorption of CO2 into the bottle wall, at 1–2 days after
preparation by this procedure. Therefore, the carbonation level should be 5% higher than the
target level.
5.2.6.1 Apparatus:
a. Laboratory Balance with an accuracy of ± 0.01 gram or better.
b. Film wrap such as ‘Cling’ or ‘Glad’.
c. Citric Acid, monohydrate, COOHCH2C (OH) COOHCH2COOH.H20
d. Sodium Hydrogen Carbonate (NaHCO3) or Sodium Carbonate (Na2CO3)
e. Water at 18 – 23°C and closures
5.2.6.2 Procedure:
a) Principle:
Carbon dioxide (CO2) can be generated by the reaction of citric acid and sodium hydrogen
carbonate in water according to the chemical equation (1) or citric acid and sodium carbonate in
water according to the chemical equation (2).

Chapter 5 EXPERIMENTAL PROCEDURES AND EVALUATION
160
b) Using sodium hydrogen carbonate:
3 NaHCO2 + COOHCH2C (OH) COOHCH2COOH.H20
COONaCH2 (OH) COONaCH2COONa + 3 CO2 + 3 H2O.....… (1)
c) Using sodium carbonate:
3 Na2CO2 + 2 COOHCH2C (OH) COOHCH2COOH.H20
2 COONaCH2 (OH) COONaCH2COONa + 3 CO2 + 3 H2O ...… (2)
5.2.6.3 Definitions and calculations:
1. Beverage Carbonation is measured in gas volumes:
One gas volume = volume of CO2 gas at 15.5°C (60°F) and 1 atm. pressure that will dissolve in
an equal volume of liquid
E.g.: 1.5 liter bottle at 4.0 volumes = 1.5 x 4.0 = 6.0 liters of CO2 at 15°C and 1 atm.
a) Calculations using sodium hydrogen carbonate
b) Amount of sodium hydrogen carbonate (base) required:
W = (Z / 22.4) * (Molecular Weight of NaHCO3 = 84.0) * Y
W = 3.75 * Z * Y grams
Where:
W = Weight of base (grams)

Chapter 5 EXPERIMENTAL PROCEDURES AND EVALUATION
161
Z = Brimful capacity of container (liters)
Y = Carbonation required (Gas Volumes)
c) Amount of citric acid required:
X =
X = 0.90 * (W) grams
Where:
X = Weight of Acid (gram)
d) Calculations using sodium carbonate
e) Amount of sodium carbonate (base) required:
W = (Z / 22.4) * (Molecular Weight of Na2 CO3 = 106.0) * Y
W = 4.7 * Z * Y grams
e) Amount of citric acid required:
X = (2/3) * (W) * (Molecular Weight of COOHCH2C (OH) COOHCH2COOH.H20 = 210.1/
Molecular Weight of Na2 CO3 = 106.0) * 1.08 (to ensure an excess of acid)
X = 1.43 * (W) grams
1. The nominal fill level of the bottle is identified, and scribed a line (or mark with permanent
marker) at this level onto the bottle
2. The amount of Citric Acid and Sodium Hydrogen Carbonate or Sodium Carbonate required for
each bottle are calculated
(1/3) * (W) * (Molecular Weight of Citric Acid = 210.1)
Molecular Weight of NaHCO3 = 84.0) * 1.08 (to ensure an excess of acid)

Chapter 5 EXPERIMENTAL PROCEDURES AND EVALUATION
162
3. Into an empty bottle, the required amount of Citric Acid to the nearest 0.1 of a gram is
weighed and the bottle is filled with water at room temperature just below the fill level.
4. A closure is applied and the bottle is shaked until all Citric Acid is dissolved.
5. The level of the water is adjusted up the fill level marked on the bottle.
6. A piece of film wrap is cut with large enough to be able to roll the base chemical into a
cylinder, small enough to pass through the finish opening.
7. The required amount of Sodium Hydrogen Carbonate or Sodium Carbonate is weighed onto
the film wrap and rolled to fully encase the chemical.
8. The chemical roll is inserted into the bottle, the bottle is squeezed to remove the headspace air,
and a closure is applied.
9. The bottle is vigorously shaked to release the chemical from the fill wrap.
10. After approximately 5 minutes, the bottle is shaked again until the chemicals have been fully
dissolved.
5.2.7 Crystallinity
In order to explain the reason for the cracks that occur on the PET bottle base and to explain the
differences in the resistance times against ESC, crystallinities at five critical points both in the
standard and optimum bottle bases were obtained by Modulated Differential Scanning
Calorimetry (MDSC) method (fig. 5-3).
5.2.7.1. Apparatus:
a. MDSC 2920, TA Instrument.
b. Laboratory balance with an accuracy of ± 0.0001 gam or better.
c. Crimped aluminum pans
d. A clamp to assemble aluminum pans

Chapter 5 EXPERIMENTAL PROCEDURES AND EVALUATION
163
5.2.7.2. Procedure:
a. Approximately 10 mg of the sample is cut from the identified points in the bottle base
b. The sample is accurately weighed and put into the crimple pans
c. Two heating and cooling cycle between 25 and 280°C are applied on the sample. All
heating and cooling rates are 2°C/min with temperature modulation ± 0.5 °C for every 40 sec.
Fig.5-3. Points at which crystallinity values observed by SEM
Table 5-2 Regions and represents used in MDSC
Regions Represents
Distance from
the base center
(mm)
Valley V 30
Transition to valley V1 13
Centre (Injection point) C 0
Transition to foot F1 13
Foot F 30
F F1
C V1
V

Chapter 5 EXPERIMENTAL PROCEDURES AND EVALUATION
164
5.2.8 Environmental scanning electron microscopy (ESEM) and optical microscopy
In order to explain the mechanism of environmental stress cracking, of the crack morphology
both for the standard and the new bottle bases are studied by Environmental Scanning Electron
Microscopy (ESEM) and optical microscopy. The specimens used in the analysis were collected
from samples tested by the Environmental Stress Crack Resistance (ESCR) tests. The results
obtained from this study are based on observation of specimens via Environmental Scanning
Electron Microscopy (FEI Quanta 200 ESEM) as shown in fig. 5-4 and Optical Microscopy
(Olympus Twin Optic). The observations have been useful in terms of explaining the initial crack
location, its direction, appearance of cracks and ultimately shedding a light in the significant
difference between the ESCR of the standard and optimized bottles.
Fig.5-4. ESEM analysis chamber and the sample of the cracked bottle base

Chapter 5 EXPERIMENTAL PROCEDURES AND EVALUATION
165
Apparatus and accessories used in this study and their settings are as follows:
a. FEI Quanta 200 ESEM - Scanning Electron Microscope
(Low Vacuum, High voltage = 15.0 kV, Pressure= 0.5 Torr, Filament current = 2.02 A
Emission current = 102 µA)
b. Olympus Twin Optic Optical Microscope
(zoom magnification=1.8x10, Optic GSWH 10x22)
c. Kyowa Fibre Optic FL6 light source
d. Pixelink Digital Image Capture System (resolution 1600x1200 pixels = 2Mp)
5.3 EXPERIMENTAL RESULTS AND DISCUSSION
5.3.1 Burst strength
Burst strength tests both for the standard bottle, were carried out within three days after the
bottles were produced by the stretch blow molding process. In order to determine the effects of
the temperature of the preforms on the performance of the bottles, burst strength test were also
conducted for the new bottles on the new (optimized) bottles which were produced using three
different preform temperatures of 105, 110 and 115
oC. These values refer to the average
temperatures on the preform. Whereas, the standard bottles which are currently used in industry
were produced under the standard industrial operating conditions only.
Burst pressures and volumetric expansions are given in table 5-3 and figure 5-5. Burst pressure
indicates the maximum pressure that the bottle can bear, and volumetric expansion gives the
change in volume at the time of failure.

Chapter 5 EXPERIMENTAL PROCEDURES AND EVALUATION
166
Table 5-3. Burst strength performance of the bottles
Burst Pressure
(psi)
Expansion
(ml)
Standard Base 205±02 579±75
Optimum Base 194±02 541±53
Optimum Base (Preform Temp. 105 oC) 204±18 411±92
Optimum Base (Preform Temp. 110 oC) 197±02 435±44
Optimum Base (Preform Temp. 115 oC) 179±04 510±66
177
182
187
192
197
202
104 106 108 110 112 114 116
Preform Temperature (C)
Bu
rst
Pre
ssu
re (
psi
)
Fig.5-5. Burst strength performance of the bottles
Except for the bottle produced at the preform temperature of 105 oC, the burst strength and
volumetric expansion of the new bottle was reduced relative to the standard bottle. However,
considering the standard variation of the results, the differencences between the bottles are not
statistically significant.

Chapter 5 EXPERIMENTAL PROCEDURES AND EVALUATION
167
5.3.2 Top load strength
The top load strength tests were carried out 3 days after the bottles were produced by the Stretch
Blow Molding Process. The results are given in table 5-4 and figure 5-6.
Table 5-4. Top-load performance of the bottles
Max load at buckling/bending (kg)
Standard Base 31.1±0.6
Optimum Base 29.2±0.5
Optimum Base (Preform Temp. 105 oC) 31.8±0.4
Optimum Base (Preform Temp. 110 oC) 33.0±0.3
Optimum Base (Preform Temp. 115 oC) 33.2±1.0
31.5
32
32.5
33
33.5
104 106 108 110 112 114 116
Preform Temperature (C)
Ma
x L
oa
d (k
g)
Fig.5-6. Top-load performance of the bottles

Chapter 5 EXPERIMENTAL PROCEDURES AND EVALUATION
168
When produced under standard operating conditions, the new bottle had lower top load strength
than the standard bottle. However, at higher preform temperatures the new bottle showed
improved top load strength over the standard bottle; and this improvement increased with
increasing preform temperature. This can be explained by referring to bottle section weights in
table 5-5 and figure 5-7.
Table 5-5. Bottle section weights
Base (g)
Centre (g) Top (g)
Standard Base 11.3 15.0 13.7
Optimum Base 11.8 14.8 13.5
Optimum Base (Preform Temp. 105 oC) 12.1 14.5 13.4
Optimum Base (Preform Temp. 110 oC) 11.8 14.8 13.4
Optimum Base (Preform Temp. 115 oC) 11.6 14.9 13.5
11
11.3
11.6
11.9
12.2
12.5
104 106 108 110 112 114 116
Preform Temperature (C)
Base
Wei
gh
ts (
g)
Fig.5-7. Bottle Base weights

Chapter 5 EXPERIMENTAL PROCEDURES AND EVALUATION
169
The results indicate that in the bottle with the new base design there is slight shift in material
distribution from the centre section to the base section; and no change in the top section. Since
buckling under top loading is most likely to occur in the centre section, thinning in this region
might explain the reduction in top load strength in the new bottle. As the preform temperature is
increased, the material in the base move mainly to the centre section with a corresponding
increase in top load strength is observed at high preform temperatures for the new bottle with
optimized base design.
5.3.3 Environmental stress cracking resistance
The ESCR tests were carried out both on the standard and new bottles just after production and a
few days later. To examine the effect of the preform temperature, this test was also conducted on
bottles produced at the three different preform temperatures. The results are given in table 5-6
and figure 5-8.
Table 5-6. Accelerated stress crack performance of the bottles
Time to crack development (minutes)
Standard Base 34±10
Optimum Base 64±18
Optimum Base (Preform Temp. 105 oC) 92±08
Optimum Base (Preform Temp. 110 oC) 79±18
Optimum Base (Preform Temp. 115 oC) 68±15

Chapter 5 EXPERIMENTAL PROCEDURES AND EVALUATION
170
According to the obtained results, the resistance exhibited against environmental stress cracking
has been very high for the optimized bottle base, which is almost 76 percent higher than the
standard bottles. Also, resistance that the bottle base exhibits against environmental stress
cracking decreased with increase in the preform temperature. This ESCR time is 92 minutes for
preform temperature of 105 oC whilst it is only 68 minutes for preform temperature of 115
oC.
In addition, that ESCR decreases as a function of post-production storage time. Relevant results
can be seen in Appendix C in Table C-11, 12 and 13.
65
75
85
95
104 106 108 110 112 114 116
Preform Temperature (C)
Tim
e (m
inu
tes)
Fig.5-8. Accelerated stress crack performance of the bottles
The cracks occurring at the bottom of the standard and new bottles are shown in Fig. 5-9 and
fig.5-10 respectively. In the standard base the cracks developed both radially in the centre of the
base (fig.5-9(a)) and diagonally across the base (fig.5-9(b)).

Chapter 5 EXPERIMENTAL PROCEDURES AND EVALUATION
171
(a)
(b)
Fig.5-9. ESC at the bottom of the bottle with standard base (a) central cracks (b) diagonal cracks
Fig.5-10. ESC at the bottom of the bottle with optimum base

Chapter 5 EXPERIMENTAL PROCEDURES AND EVALUATION
172
The abrupt changes in thickness are mainly observed in the central region of the base rather than
the other regions of the base for both bottles (Fig 5-11). However, the thickness changes on the
foot and valley regions are not abrupt but gradual; that is why, the cracks form at the central
region for both bottle bases. In addition, it is found that the thickness in the valley region is
higher than the foot region for both bottle bases. The resistance to environmental stress cracking
increased as a result of optimized base geometry and a lower preform set temperature, causing
the base to become thicker than the standard bottles currently used in industry.
Fig.5-11. Thickness of the bottles with standard and optimized base
5.3.4 Thermal stability of the bottles
Thermal tests were performed for bottles, percentages changes in base clearance, bottle height fill
point drop and body diameter are given in Table 5-7 (a) and (b).

Chapter 5 EXPERIMENTAL PROCEDURES AND EVALUATION
173
Table 5-7. Thermal stability of the bottles; changes in (a) base clearance, bottle height and fill
point; (b) body diameter
(a)
Base
Clearance
(%)
Bottle Height
Growth
(%)
Fill Point
Drop (mm)
Standard Base 61.1 ± 0.1 2.0 ± 0.06 22.9 ± 1.27
Optimum Base 72.6 ± 0.06 1.6 ± 0.04 21.8 ± 0.20
Optimum Base (Preform Temp. 105 oC) 81.7 ± 0.07 4.2 ± 0.07 16.6 ± 0.1
Optimum Base (Preform Temp. 110 oC) 86.7 ± 0.09 4.0 ± 0.06 15.4 ± 0.1
Optimum Base (Preform Temp. 115 oC) 87.5 ± 0.08 3.9 ± 0.05 16.3 ± 0.1
(b)
Growth in Diameter (%)
Upper Panel Lower Panel Base
Standard Base 2.2 ± 0.07 2.4 ± 0.23 1.4 ± 0.46
Optimum Base 2.4 ± 0.09 2.3 ± 0.05 1.6 ± 0.24
Optimum Base (Preform Temp. 105 oC) 4.4 ± 0.09 4.5 ± 0.22 3.5 ± 0.5
Optimum Base (Preform Temp. 110 oC) 4.2 ± 0.08 4.0 ± 0.2 2.7 ± 0.6
Optimum Base (Preform Temp. 115 oC) 4.4 ± 0.08 3.7 ± 0.2 2.6 ± 0.5
The clearance for the bottle with standard base is changed from 7.2 mm to 2.8 mm whereas it
changed from 6.2 mm to 1.7 mm for optimized base. However, the percentage change in base
clearance is similar for both bottles. As for the relationship of the change of clearance at the

Chapter 5 EXPERIMENTAL PROCEDURES AND EVALUATION
174
bottle base with the average preform temperature, clearance on the bottle base decreases with the
increasing temperature. Furthermore, it is not reasonable to produce bottles with the average
preform temperature of above 110 oC. The excessive concaveness of the base and the loss of
self-standing feature of the bottles in an upright position would be problematic.
For the fill point drop result is better for the bottle with the optimized base because the change in
this parameter is lower for the newly designed bottle. Similarly growth in body diameter for the
upper and lower panels, and the base is close to standard bottle.
5.3.5 Crystallinity
By means of MDSC method, the crystallinity values at critical points in the bottle base are
calculated. Resultant heat flow curves in arbitrary units are given at these points for the bottles
with standard base and the optimized base as shown in Fig. 5-12 and Fig. 5-13 respectively.
From these curves, thermal characteristic such as glass transition temperature (Tg), cold
crystallization temperature (Tcc), crystallization temperatures (Tc), and melting point (Tm) are
obtained and percent crystallinity (%χ) is calculated.

Chapter 5 EXPERIMENTAL PROCEDURES AND EVALUATION
175
-14
-12
-10
-8
-6
-4
-2
0
0 50 100 150 200 250 300
Temperature (C)
Arb
itra
ry H
ea
t F
low
(W
/g)
Fig. 5-12 MDSC diagrams of the standard bottle base
Fig. 5-13 MDSC diagrams of the optimised bottle base
Valley-trans
Valley
Centre
Foot Trans
Foot
Valley
Valley-trans
Centre
Foot Trans
Foot

Chapter 5 EXPERIMENTAL PROCEDURES AND EVALUATION
176
The thermal characterization parameters and percentage crystallinities are given for the standard
base and the optimized base in table 5-8 and 5-9 respectively. Glass transition temperatures (Tg),
which are related to amorphous structure of the material, vary between 6 oC and 8
oC for standard
and optimized bottle base respectively; it is not possible to observe any trend. Crystallization
temperatures (Tc) are slightly higher for the optimized bottle base compared to the standard base.
Similarly, crystallization temperatures (Tc) do not demonstrate a trend either in the standard or in
the optimized bottle base. Cold crystallization temperature (Tcc) for both bottles shows a
significant increase in the base centre and the transition regions. This is also reflected in high
percentage crystallinity (% χ) in the centre and the transition regions of the base. For both bottles,
base centre virtually indicates an amorphous structure with the χ of 10%.
Table 5-8 Properties of the selected points in the standard bottle base
Location
on the base 1st heating Cooling 2nd heating χ
Tg
(oC)
Tcc
(oC)
∆∆∆∆Hcc
J/g Tm
(oC)
∆∆∆∆Hm
(J/g) Tc
(oC)
∆∆∆∆Hc
J/g Tg
(oC)
Tm1
(oC)
Tm2
(oC)
∆∆∆∆Hm
(J/g)
(%)
Foot 78.4 89.5 5.5 253.6 45.3 201.2 39.8 81.0 242.4 252.7 37.4 43.4
Foot Trans 70.9 90.6 5.9 253.7 43.2 198.9 37.1 79.6 242.3 252.0 35.8 32.2
Centre 73.2 116.8 15.9 252.3 41.7 198.3 37.7 81.7 241.7 252.3 39.2 10.0
Valley
Trans 78.4 110.3 9.4 253.0 39.9 198.9 33.4 81.6 241.8 252.0 34.5 23.0
Valley 75.0 88.1 5.9 252.9 44.1 199.4 39.2 79.7 240.6 251.9 37.8 51.8

Chapter 5 EXPERIMENTAL PROCEDURES AND EVALUATION
177
Table 5-9 Properties of the selected points in the optimum bottle base
Location
on the base 1st heating Cooling 2nd heating χ
Tg
(oC)
Tcc
(oC)
∆∆∆∆Hc
J/g Tm
(oC)
∆∆∆∆Hm
(J/g) Tc
(oC)
∆∆∆∆Hc
J/g Tg
(oC)
Tm1
(oC)
Tm2
(oC)
∆∆∆∆Hm
(J/g)
(%)
Foot 79.1 77.8 12.8 253.4 45.2 202.5 40.1 78.7 242.9 251.7 36.0 31.2
Foot Trans 75.7 95.9 6.3 253.5 43.3 202.4 35.5 82.1 243.3 252.3 35.9 38.2
Centre 76.5 116.0 18.2 252.4 39.5 201.7 36.9 82.2 243.1 252.3 37.1 14.1
Valley Trans 72.3 114.5 20.1 252.3 41.1 202.8 41.8 80.4 243.7 252.0 38.6 14.4
Valley 78.6 91.2 5.0 253.9 46.3 202.7 41.6 81.8 243.0 252.3 38.5 50.3
Crystallinity values decrease in the direction towards the centre of the base for both bottles as
shown in Fig. 5-14. The crystallinity of the optimised base (38.2%) is higher than the standard
base (32.2%) for the valley transition region between the centre and the valley; but for the foot
transition region between the center and the foot it is not the case; the crystallinity of the
optimised base (14.4%) is lower than the standard base (23.0%) in this region. As for the foot
region, crystallinity value for the optimised base (50.3%) is similar to that of standard base
(51.8%). Nevertheless, it can be said that the crystallinity values across the base are not much
different between the two bottles.

Chapter 5 EXPERIMENTAL PROCEDURES AND EVALUATION
178
0
5
10
15
20
25
30
35
40
45
50
55
60
-40 -30 -20 -10 0 10 20 30 40
Distance from the centre of the bottle base
Cry
stallin
ity (%
)
Optimized bottle base
Standard bottle base
Fig.5-14 Actual crystallinity in the optimum and standard bottle bases
5.3.6. Morphology
Cracks observed in both the standard and the optimized bottle bases are initiated at the injection
pin, which acts a stress concentration point, as shown in the optical microcopy image of the bottle
base (Fig. 5-15); cracks do not exactly pass through the base centre. The cracks were limited
within the central region of the optimised base and did not reach the foot or the valley of the base
in the optimised bottle base. Whereas for the standard base, not only central cracks, but in some
samples diagonal cracks appeared across the transition regions in the base.
There are clear differences between the appearance of cracks found in the standard and the new
bottle base. The cracks in the standard bottle base propagate in a rather straight manner (Fig. 5-
16), whereas for the optimized bottle base, cracks take up a spiral form, demonstrating a fibrous
appearance (Fig. 5-17). In spite of the fact that both bottles are produced under the same standard
process operating conditions and made out of the same material, mechanism of crack appears to
be significantly different resulting in significant differences in ESCR times. The crack
Valley Region Centre Region Foot Region

Chapter 5 EXPERIMENTAL PROCEDURES AND EVALUATION
179
propagation mechanisms may be associated with the base properties such as morphology and
crystallinity as well as wall thickness of the base.
Fig.5-15. Optical microscope images of the cracks around the center of optimum base
Fig.5-16. SEM image of the crack propagation in the standard bottle base
Magnification 1.8x10

Chapter 5 EXPERIMENTAL PROCEDURES AND EVALUATION
180
Fig.5-17. SEM image of the crack propagation in the optimized model
5.3.7 Relationship of ESCR to that of physical and mechanical properties of the bottle base
Cracks occur within the central zone of the optimised base design. In this region, the crystallinity
values are lower than other regions of the base; hence ESCR should be higher in this region,
since the ESCR is expected to increase with the decreasing crystallinity [Brocka et al., 2007]. On
the other hand, the highest simulated stress values are found to be in the centre region of the
bottle base based on stress simulation conducted via CATIA under the stresses similar to
accelerated environmental stress cracking test conditions (Fig. 5-18). The actual thickness in the
bottle base which is produced from preforms at an average re-heat temperature of 105 oC, and the
simulated stress of the optimum bottle base are given in figure 5-19. Though the central region of
the base is the strongest section based on the thickness, the crack failures have taken place in this
region because of higher stress values generated in this region. The other regions are stronger
against the ESC because of stress being less. That is why ESC starts within the central region and
comes to a stop once reaching the transition zone in the optimized bottles.

Chapter 5 EXPERIMENTAL PROCEDURES AND EVALUATION
181
Fig. 5-18 Simulation of the stress in the optimised bottle base under load
0.00E+00
2.00E+06
4.00E+06
6.00E+06
8.00E+06
1.00E+07
1.20E+07
1.40E+07
1.60E+07
1.80E+07
-30 -20 -10 0 10 20 30
Distance from the Centre of the Bottle Base (mm)
Str
ess (
MP
a)
0
0.5
1
1.5
2
2.5
3
Th
ickn
ess (
mm
)
Fig. 5-19 Simulated stress and measured thickness in the optimized bottle base
Foot Region Centre Region Valley Region

Chapter 5 EXPERIMENTAL PROCEDURES AND EVALUATION
182
Fig. 5-20 to Fig. 5-22 shows how the new and the standard base differ in terms crystallinity,
molecular orientation and biaxial ratio under optimised processing conditions as defined by
model-2. Similar results for other models are given in Appendix B. It can be said that crystallinity,
molecular orientation and biaxial ratio increase towards the foot and the valley regions of the
bottle base, the magnitude of increase is bigger for the optimised bottle. However, the
crystallinity, molecular orientation and biaxial ratio in the standard and optimised base design do
not differ in the central region where the environmental stress cracking is mainly observed. This
reinforces the hypothesis that in this comparative study, the increase in the ESCR is most likely
resulted from the reduction in environmental stress arising from the carbonated soft drink due to
modified geometry of the optimised base.
Comparison of the New and Standard Bases for Model-2
-5.00E-02
0.00E+00
5.00E-02
1.00E-01
1.50E-01
2.00E-01
2.50E-01
3.00E-01
300 320 340 360 380
Distance from top of the Bottle (mm)
Cry
stal
linit
y
New Base
Standard Base
Fig.5-20. Comparison of crystallinity in the new and standard bases; model-2
Distance from the center of the bottle base
- 40 - 20 0 20 40

Chapter 5 EXPERIMENTAL PROCEDURES AND EVALUATION
183
Comparison of the New and Standard Bases for Model-2
-1.00E-02
0.00E+00
1.00E-02
2.00E-02
3.00E-02
4.00E-02
5.00E-02
300 320 340 360 380
Distance from top of the Bottle (mm)
Mole
cula
r O
rien
tati
on
New Base
Standard Base
Fig. 5-21. Comparison of molecular orientations in the new and standard bases; model-2
Comparison of the New and Standard Bases for Model-2
1.00E+00
1.10E+00
1.20E+00
1.30E+00
1.40E+00
1.50E+00
1.60E+00
1.70E+00
1.80E+00
1.90E+00
2.00E+00
300 320 340 360 380
Distance from top of the Bottle (mm)
Bia
xial
Rta
io
New Base
Standard Base
Fig. 5-22. Comparison of biaxial ratios in the new and standard bases; model-2
Distance from the center of the bottle base
-40 - 20 0 20 40
Distance from the center of the bottle base
- 40 - 20 0 20 40

Chapter 5 EXPERIMENTAL PROCEDURES AND EVALUATION
184
5.4 CONCLUSION
In this chapter of the study, the physical, mechanical and geometrical changes resulting from the
introduction of a new petaloid base are assessed by the appropriate test methods. The results of
the performance tests of the optimised bottle base are presented.
According to these results, the optimization study carried out on the petaloid shaped bottle base
has been very effective and has significantly increased the ESCR of the bottle. While the amount
of material transferred to the base is slightly increased due to the change of geometry of the bottle
base equivalent environmental stress reduced at this modified geometry.
While the top load strength increased at standard operating conditions, the burst strength slightly
decreased for the new bottle produced at the preform temperatures of 105 o
C, 110 oC, and 115
oC.
Similarly, thermal stability tests proved that the optimised base did not adversely affect the
bottles in terms of thermal stability. So, the optimization process of the petaloid based bottle is
successfully completed in terms of preventing the environmental stress cracking.
As for the outcomes achieved by the process parameters change, it is observed that the ESCR
reduces with the increasing preform reheat temperature. On the other hand, burst pressure values
decreased but top load values increased with the increasing temperature. Furthermore, the
clearance value for the optimum base reduced with the increasing temperature. So, one of the
most important achievement of this study is that the temperature profile of the preform should be
kept as low as possible to ensure high ESCR and to prevent the concaveness at the bottom of the
bottle.

Chapter 6 CONCLUSIONS AND SUGGESTIONS FOR FUTHER WORK
185
Chapter 6
CONCLUSIONS AND SUGGESTIONS FOR
FURTHER WORK

Chapter 6 CONCLUSIONS AND SUGGESTIONS FOR FUTHER WORK
186
6.1. INTRODUCTION
In this chapter, the overall conclusions obtained from this study are presented and suggestions for
further work are explained. Answers to the specific research questions are also given. In this
chapter, only the general results are given since the conclusion of each chapter of the thesis has
been presented in their respective section in detail.
At the present time, the carbonated soft drinks are generally kept in the containers made from
PET material mainly because of its advantageous physical properties. The shapes and sizes of the
bottles vary depending on the amount and type of the drink to be stored. Nevertheless, the bottom
petaloid shapes of all bottles used for carbonated soft drinks are almost similar to each other. Due
to the shape of the bottle base being petaloid, cracks sometimes occur in this base section of the
bottles. In this study, the base of the 1500 ml PET bottle has been redesigned optimizing the
petaloid shape. According to the obtained results, the base geometry has a significant effect on
the environmental stress cracking. As explained in detail in chapter 3, only the valley section of
the petaloid base itself does not have a major effect on the cracking. However, this parameter
comes into question with other parameters of the petaloid shape. This outcome is related to the
research question 1.
The PET bottles are produced by the ISBM process. This process has a number of parameters
and each of these parameters significantly affects the cracks occurrence in the bottle base
according to the outcomes obtained in chapter 3. Both the injection molding parameters and
stretch blow molding (SBM) process parameters are very important for the environmental stress
cracking. In this study, it is focused only on the SBM process, which is the second stage in the
two-stage processing. The most important parameters to be taken into consideration in SBM
process are regarded as the initial temperature profile of the preform, the speed of stretch rod,

Chapter 6 CONCLUSIONS AND SUGGESTIONS FOR FUTHER WORK
187
magnitude and the timing of the pre-blow and final-blow pressures. Each of them has a
significant effect on the environmental stress cracking because they directly affect the amount of
the PET material amount in the bottle base and the extent of stretching of the material in the base
during the processing. Consequently, the amount of material in the base and the extent of
stretching affect the thickness, crystallization, and molecular orientation, biaxial ratio at the
bottom of the bottle. The resistance against environmental stress cracking at the bottom of the
bottle decreased with increasing initial temperature profile on the preform because of decreasing
thickness in the bottle base. On the other hand, crystallization and molecular orientation
increased together with the increasing temperature according to the results obtained through the
Blow View 8.2 simulation program (Research question 2).
The cracks occurring in the base also depend on the process conditions, material properties, and
storage conditions. The PET bottles of 1.5 it that are produced in SBM process are exposed to the
environmental stress cracking tests in certain time intervals. After the production, the passing
time caused the resistance that the bottle base exhibits against environmental stress cracking to
decrease. The maximum resistance is achieved in the tests performed just after the production
(Research question 6).
In order to be able to compare the new and standard bottle base with each other, bottles are
produced at the same standard processing process conditions used in industry. In addition, the
samples for the optimum based bottle are produced at three different initial temperatures profiles
on the preform with the aim of defining the temperature effects on the bottle. Top load strength,
burst pressure strength, thermal stability, environmental stress crack resistance, and crystallinity
and morphology studies are conducted on all bottles. According to the results obtained, the
ESCR of the bottle with optimized base is significantly higher than the standard based bottle,

Chapter 6 CONCLUSIONS AND SUGGESTIONS FOR FUTHER WORK
188
whereas nearly all performance test results are similar to the standard based bottle’s values
(Research question 6, 7).
The optimization process of the petaloid base of the 1500 ml PET bottle is carried out by means
of CATIA V5 R14 version software program. In this optimization process, the base geometry is
targeted to result in minimum stress in the bottle base and ECHIP-7 software program is used to
assess the results found through CATIA V5 R14. In conclusion, the optimization process is
completed by means of Catia V5 R14 and Echip-7 software programs, and the resistance of the
bottle base against environmental stress cracking is significantly enhanced. Stress analysis and
design process with Catia V5 are conducted conveniently because the software program allowed
both the mesh geometry to be easily generated and the material properties to be fully entered.
Catia V5 R14 software is therefore an appropriate program for stress analysis and design process
(Research question 8 and 9).
Both the preform design and the initial temperature effect on the physical properties of the bottle
are predicted by means of Blow View 8.2 software program. To this end, the weight of preform
is decreased and the preform design is altered accordingly. In addition, the physical changes
occurring especially in the bottle base are observed. According to the obtained results, as the
preform weight decreases, the thickness of the bottom of the bottle decreases and the other
parameters such as crystallinity, molecular orientation, and biaxial ratio also changed. In this
study, there has not been an opportunity to investigate the effect of the low weight preform on
ESCR (Research question 10).

Chapter 6 CONCLUSIONS AND SUGGESTIONS FOR FUTHER WORK
189
6.2. SUGGESTIONS FOR FURTHER WORK
The following suggestions will be useful in terms of understanding this environmental stress
crack phenomenon occurring on the bottle base.
1- In order to observe the effects of the preform produced at various injection pressures and mold
temperature on ESCR, some preform samples can be produced by changing ISBM process
settings.
2- Other geometrically modified preform samples can be produced to compare the changes on
the bottle base in terms of the thickness, crystallinity, molecular orientation, and ESCR. The
preform weight may be reduced modifying its design and wall thickness so the thickness in the
bottle base is uniform and minimum. I suggest focusing on minimum stress.
3- In order to investigate the effects of the bottle mold temperature on the physical properties, the
bottle samples can be produced with various mold surface temperatures and then ESCR tests can
be performed.
4- This study has focused on two stage ISBM process where preform is reheated. A single stage
ISBM process should be considered because one stage ISBM is becoming widespread. The
bottles produced with both methods can be compared with each other in terms of ESCR.
5- Three different models are developed for SBM process in this study but these models could
not be applied to SBM process due to the lack of machinery, which was available for
experimental work, produced pressure was well above the pressure considered for the models.
Therefore, bottle samples can be produced under these three processing models by improving
technical facility.

REFERENCES
190
REFERENCES

REFERENCES
191
Alfonso, G.C., Verdona, M.P., Wasiak A. (1978), “Crystallization Kinetics of Oriented
Poly(Ethylene Terephthalate) from the Glassy State”, Polymer, 19, 711–716.
ASTM (2005), “Standard Test Method for Environmental Stress-Crack Resistance of Blow-
Molded Polyethylene Containers; D2561-95(2005) - Procedure B”, American Society for Testing
and Materials, Philadelphia, USA
ASTM (2000), “Standard Test Methods for Density and Specific Gravity (Relative Density) of
Plastics by Displacement; D792-00”, American Society for Testing and Materials, Philadelphia,
USA
Awaja, F., Pavel, D. (2005),”Recycling of PET”, European Polymer Journal, 41, 2614–2634.
Azar, A. A., Biddlestone, F., Hay, J. N., Haward, R. N. (1983), “The Effect of Physical Aging on
The Properties of Poly(Ethylene Terephthalate)”, Polymer, 24, 1245-1251.
Baczek, S. (2003), “Low Shear In-Mould Decoration-Processes For The Manufacture Of Three-
Dimensional Molded Interconnect Devices (3D-MID), Conference Proceedings, SPE ANTEC,
Nashville, USA.
Ballman, R. L., Shusman, T. (1959), “Easy Way to Calculate Injection Molding Set-up Time”,
Modern Plastics, 126, 130-131
Benning, C. J. (1983), “Plastic Films for Packaging”, Lancaster, Pennsylvania, Technomic
Publishing Co.

REFERENCES
192
Berens, A. R., Hodge, I. M. (1984), “Effects of Stress and Vapor Exposure Before and During
Aging on Enthalpy Relaxation of Poly(Vinyl Chloride)”, Polymer Engineering Science, 24,
1123-1129.
Bernier, G. A., Kambour, R. P. (1968), “The Role of Organic Agents in the Stress Crazing and
Cracking of Poly(2, 6-dimethyl-l, 4-phenylene oxide)”, Macromolecules, 1, 393-400.
Bird, R. B., Stewart, W. E., Lightfoot, E. N. (1960), “Transport Phenomena”, New. York, USA,
John Wiley and Sons.
Bjorksten, J., Tovey, H., Harker, B., Henning, J. (1956), “Polyesters and their Applications”,
London, UK., Chapman and Hall.
Blundell, D. J., Oldman, R. J., Fuller, W. (1999), ”Orientation and Crystallization Mechanisms
During Fast Drawing of Poly(Ethylene Terephthalate) ”, Polymer Bulletin, 42, 357-363.
Blundell, D. J., Mahendrasingam, A., Martin, C. (2000),”Orientation Prior to Crystallization
During Drawing of Poly(Ethylene Terephthalate)”, Polymer, 41, 7793-7802.
Bonnebat, C., Roullet, G., de Vries, A. J. (1981),”Biaxially Oriented Poly(Ethylene Terephthalate)
Bottles: Effects of Resin Molecular Weight on Parison Stretching Behavior”, Polymer
Engineering Science, 21,189-195.
Boyer, R. F. (1975),”Glassy Transitions in Semi-Crystalline Polymers” Journal Polymer Science
Symposium, 50, 189-242

REFERENCES
193
Briston, J. (1992), “Advances in Plastics Packaging Technology”, Surrey, UK., Pira International.
Brocka, Z., Schmactenberg, E., Ehrenstein, G. W. (2007), “Radiation Cross Linking Engineering
Thermoplastic for Tribological Applications”, Conference Proceedings, SPE ANTEC, Cincinnati,
USA
Brody, A. (2001), “Strategies for Polyester Packaging”, Food Technology, 55, 68-69.
Brooks, D. W., Giles, G. A. (2002), “PET Packaging Technology”, Sheffield, Academic Press.
BSDA: British Soft Drinks Association, 2000, found at
http://www.britishsoftdrinks.com/htm/qa/ai_carbon.htmi
Bur, A. J., Wang, F. W., Thomas, C. L., Rose, J. L. (1994), “In-Line Optical Monitoring of
Polymer Injection Molding”, Polymer Engineering Science, 34, 671-679.
Busch, J. V., Field, F. R., Rosato, D. V. (1988), “Computer Aided Part Cost Analysis for
Injection Molding”, Conference Proceedings, SPE ANTEC, Boston, USA
Cakmak, M., Spruiell, J. E., White, J. L. (1984), “A Basic Study of Orientation in Poly(Ethylene
Terephthalate) Stretch-Blow Molded Bottles”, Polymer Engineering Science, 24, 1390-1395.
Canadas, J. C., Diego, J. A., Mudarra, M., Belana, J. (1998), ”Comparative TSPC, TSDC and
DSC Physical Aging Studies on PET-a”, Polymer, 39, 2795-2801.

REFERENCES
194
Carslaw H. S., Jaeger, J. C. (1959), “Conduction of Heat in Solids”, Oxford, UK, Clarendon
Press.
Chang, S., Sheau, M. F., Chen, S. M. (1983), “Solid-State Polymerization of Poly(Ethy1ene
Terephthalate)”, Journal Applied Polymer Science, 28, 3289-3300.
Chevalier, L. (1999), “Influence of Microstructure Evolution on Mechanical Strength of Blown
Poly(Ethylene Terephthalate)”, Plastics Rubber and Composites, 28, 385-392.
Chevalier, L., Linhone, C., Regnier, G. (1999), “Induced Crystallinity During Stretch–Blow
Moulding Process and Its Influence on Mechanical Strength of Poly(Ethylene Terephthalate)
Bottles”, Plastics Rubber and Composites, 28, 393-400.
Choi, B. H., Weinhold, J., Reuschle, D., Kapur, M. (2007), “Investigation of Fracture Mechanism
of HDPE Subjected to Environmental Stress Cracking”, Conference Proceedings, SPE ANTEC,
Cincinnati, USA.
Cobbs, W. H., Jr., Burton, R. L. (1953), ”Crystallization of Polyethylene Terephthalate”, Journal
of Polymer Science, 10, 275-290.
Collins, E. A., Bares, J., Billmeyer, F. W. (1973), “Experiments in Polymer Science”, New York,
USA, John Wiley and Sons.
Chua, C. K., Lye, S. L. (1998), “Parametric Modelling of Drinking Bottles”, Integrated
Manufacturing Systems, 9, 99–108.

REFERENCES
195
Crawford, R. J. (1987), “Plastic Engineering”, Pergamon Press, Second Edition
DeGroot, J. A., Doughty, A. T., Stewart, K. B., Patel, R. M. (1994),”Effects of Cast Film
Fabrication Variables on Structure Development and Key Stretch Film Properties”, Journal
Applied Polymer Science, 52, 365-376.
Dietzel, H., Schumann, J., Muller, K. (1991), “Calculating the cooling and sealing times
analytically”, Kunststoffe, 81, 1138-1140.
Dixon, E. R., Jackson, J. B. (1968), “The Inter-relation of Some Mechanical Properties
with Molecular Weight and Crystallinity in Poly(Ethylene Terephthalate)”, Journal of
Material Science, 3, 464-470.
Dominghaus, H. (1993), “Plastic for Engineering: Materials, Properties, Applications”,
New York, USA, Hanser Publishers.
Dorkenoo, K. D., Pfromm, P. H. (1999), “Experimental Evidence and Theoretical Analysis of
Physical Aging in Thin and Thick Amorphous Glassy Polymer Films”, Journal Polymer Science,
Part B: Polymer Physic, 37, 2239-2251.
Dubay, R., Bell, A. C. (1998), “An Experimental Comparison Of Cooling Time for Cylindrical
Plastic Components Using Heat Conduction Models In the Non-Conservative Forms’, Polymer
Engineering Science, 38, 1048-1059.

REFERENCES
196
Dumbleton, J. H. (1968), “Influence of Crystallinity and Orientation on Sonic Velocity and
Birefringence in Poly(Ethylene Terephthalate) Fibers”, Journal of Polymer Science, 6, 795-800.
Ehrenstein, G. W. (2001), “Polymer Materials-Structure-Properties-Applications”, Munich,
Germany, Hanser Publishers.
Erwin, L., Pollock, M. A., Gonzalez, H. (1983),”Blowing of Oriented PET Bottles: Predictions of
Free Blown Size and Shape”, Polymer Engineering Science, 23, 826-829.
Everall, N., MacKerron, D., Winter, D. (2002), “Characterization of Biaxial Orientation
Gradients in Poly(Ethylene Terephthalate) Films and Bottles Using Polarized Attenuated Total
Reflection FTIR Spectroscopy ”, Polymer, 43, 4217-4223.
Evstatiev, M., Fakirov, S., Apostolov, A., Hristov, H., Schultz, J. M. (1992) “Structure and
Mechanical Properties of Highly Oriented Poly(Ethylene Terephthalate) Films” Polymer
Engineering and Science, 32, 964-970.
Fan, G., Di Maio L., Incarnato, L., Scafato, P., Acierno, D. (2000), “The Relative Significance of
Biaxial Stretch Ratio Effects on The Permeability of Oriented PET Film”, Packaging Technology
and Science, 13, 123-132.
Fellers, J. F., Kee, B. F. (1974), “Crazing Studies of Polystyrene. I. A New Phenomenological
Observation”, Journal Applied Polymer Science, 18, 2355-2365.

REFERENCES
197
Gauvin, C., Thibault, F., Laroche, D. (2003), ”Optimization of Blow Molded Part Performance
Through Process Simulation”, Polymer Engineering Science, 43, 1407-1414.
George G. A., O'Shea, M. S. (1990), “The Effect of Morphology on The Environmental
Degradation of Nylon 6 Under Tensile Load”, Polymer Degradation and Stability, 28, 289-310.
Gibbs, M. (1989), Conference Proceedings, SPE ANTEC, New York, USA.
Groeninckx, G., Berghmans, H., Overbergh, N., Smets, G. (1974), ”Crystallization of
Poly(Ethylene Terephthalate) Induced by Inorganic Compounds. I. Crystallization Behavior from
the Glassy State in a Low-Temperature Region”, Journal polymer Science, Polymer Physic, 12,
303-316.
Groeninckx, G., Berghmans, H., Smets, G. (1976), “Morphology and Modulus-
Temperature Behavior of Semicrystalline Poly(Ethylene Terephthalate) (PET)”,
Journal of Polymer Science, Polymer Physic, 14, 591-602.
Han, W. H., McKenna, G. B. (1997), “Plasticizer Effects on Physical Aging of Epoxy”,
Conference Proceedings, SPE ANTEC, Toronto, Canada..
Hanley, T., Sutton, D., Cookson, D., Koisor, E., Knott, R. (2006), ”Molecular Morphology of
Petaloid Bases of PET Bottles: A Small-Angle X-Ray Scattering Study”, Journal of Polymer
Science, 99, 3328-3335.
Hartwig, K., Michaeli, W. (1995), “Modelling and simulation of the injection stretch-blow
molding process”, Conference Proceedings, SPE ANTEC, Boston, USA

REFERENCES
198
Hatakeyama, T., Quinn, F.X. (1994), “Thermal Analysis: Fundamentals and Applications to
Polymer Science”, New York, USA, John Wiley & Sons Inc.
Hittmair, P., Ullman, R. (1962),” Environmental Stress Cracking of Polyethylene”, Journal
Applied Polymer Science, 6, 1-14.
Howard, J. B. (1959), “A Review of Stress Cracking in Polyethylene”, SPE Journal, 15, 397- 409
Howard, J. B., Martin, W. M. (1960), “Effects of Thermal History on Some Properties of
Polyethylene”, SPE journal, 16, 407-412.
Huang, H. X., Yin, Z. S., Liu, J. H. (2006),”Visualization Study and Analysis on Preform Growth
in Polyethylene Terephthalate Stretch Blow Molding”, Journal Applied Polymer Science, 103,
564-573.
Hutchinson, J. M. (1995), “Physical Aging of Polymers”, Progress in Polymer Science, 20, 703-
760.
Illers, H., Breuer, H. (1963),”Molecular Motions in Polyethylene Terephthalate”, Journal of
Colloid Science, 18, 1-31.
Imbalzano, J. F., Washburn, D. N., Mehta, P.M. (1991), “Permeation and Stress Cracking of
Fluoropolymers”, Chemical Engineering, 1, 105-108.
Ito, E. (1974), “Studies of The Amorphous Region of Polymers. I. Relationship Between the
Change of Structure and Glass-Transition Temperature in Drawn Poly(Ethylene Terephthalate)”,
Journal of Polymer Science, Polymer Physic, 12, 1477-1483.

REFERENCES
199
Jabarin, S.A. (1982), “Optical Properties of Thermally Crystallized Poly(Ethylene
Terephthalate)”, Polymer Engineering and Science, 22, 815-820.
Jabarin, S.A. (1984), “Orientation Studies of Poly(Ethylene Terephthalate)”, Polymer
Engineering and Science, 24, 376-384.
Jabarin, S. A., Lofgren, E. A. (1986), “Effect of Water Absorption on Physical Properties of High
Nitrile Barrier Polymers”, Polymer Engineering Science, 26, 405-409.
Jabarin, S. A., Lofgren, E. A. (1986), “Effects of Water Absorption on Physical Properties and
Degree of Molecular Orientation of Poly (Ethylene Terephthalate)”, Polymer Engineering
Science, 26, 620-625.
Jabarin, S. A. (1987), “Crystallization Kinetics of Polyethylene Terephthalate. I. Isothermal
Crystallization from The Melt”, Journal Applied Polymer Science, 34(1), 85-96.
Jabarin, S. A. (1987), ”Crystallization Kinetics of Polyethylene Terephthalate. II. Dynamic
Crystallization of PET”, Journal Applied Polymer Science, 34, 97-102.
Jabarin, S. A. (1987),”Crystallization Kinetics of Poly(Ethylene Terephthalate). III. Effect of
Moisture on The Crystallization Behavior of PET from The Glassy State”, Journal Applied
Polymer Science, 34, 103-108.
Jabarin, S.A. (1992), “Strain-Induced Crystallization of Poly(Ethylene Terephthalate)”, Polymer
Engineering and Science, 32, 1341-1349.

REFERENCES
200
Jabarin, S. A., Lofgren, E. A. (1992), “Environmental Aging and Stress-Cracking of
Poly(ethylene Terephthalate)”, Polymer Engineering Science, 32, 146-156.
Jabarin, S. A. (1998), “PET Technology and Processing Textbook”, Toledo University Press.
Jabarin, S. A. (2003), “Advances in Barrier Concepts for Improved Rigid Packaging’, Conference
Proceedings, SPE ANTEC, Nashville, USA.
Joao, B. P. Soares, Abbott, R. F., Kim, J. D. (2000), “Environmental stress cracking resistance of
polyethylene: The use of CRYSTAF and SEC to establish structure-property relationships”,
Journal of Polymer Science Part B: Polymer Physics, 38, 1267-1275.
Joel, R. F. (1995), “Polymer Science and Technology”, Englewood Cliffs, New Jersey, USA,
Prentice Hall PTR
Kabanemi, K. K., He´tu, J. F., Derdouri, A. (2002) “Design Sensitivity Analysis Applied to
Injection Molding for Optimization of Gate Location and Injection Pressure”, Symposium
Proceedings, National Research Council of Canada (NRC), Boucherville, Canada
Kefalas, V. A. (1995), “Solvent Crazing as A Stress-Induced Surface Adsorption and Bulk
Plasticization Effect”, Journal Applied Polymer Science, 58, 711-717.
Keller, K., Lester, G. R. (1954), Philosophical Transactions of the Royal Society of London.
Series B, Biological Sciences, London, UK, A247, 1-34.

REFERENCES
201
Keller, A. (1955),”The Spherulitic Structure of Crystalline Polymers. Part I. Investigations with
The Polarizing Microscope”, Polymer Science, 17(84), 291-308.
Konno, M., Cui, A., Nishiwaki, N., Hori, S. (1993), “Measurement of The Polymer Melt
Temperature in Injection Molding Machine by Using Ultrasonic Technique”, Conference
Proceedings, SPE ANTEC, New Orleans, USA.
Lai, G. Y., Rietveld, J. X. (1996), “Role of Polymer Transparency and Temperature Gradients in
The Quantitative Measurement of Process Stream Temperature During Injection Molding via IR
Pyrometry”, Polymer Engineering Science, 36,1755-1768.
Laroche, D., DiRaddo, R. W., Pecora, L. (1995), “Closed-loop optimization and integrated
analysis of the blow moulding process”, Conference Proceedings, Numiform, New York, USA
Launay, A., Thominette, F., Verdu, J. (1999), “Water Sorption in Amorphous Poly(Ethylene
Terephthalate)”, Journal Applied Polymer Science, 73, 1131-1137.
Lebaudy, Ph., Grenet, J. (2001),”Heating Simulation of Multilayer Preforms”, Journal of Applied
Polymer Science, 80, 2683-2689.
Lee D. K., Soh, S. K. (1996), “Prediction of Optimal Preform Thickness in Blow Molding”,
Polymer Engineering Science, 36, 1513-1520.
Lee, S. C., Min, B, G. (1999), “Depression of Glass Transition Temperature Due to The Chain
Extension in Glassy State”, Polymer, 40, 5445-5448.

REFERENCES
202
Leigner, F. P. (1985), “Free-Blown PET Preforms Characterize Blown Bottles”, Plastics
Engineering 41, 47-51.
Liang J. Z., Ness, J. N. (1996), “The Calculation of Cooling Time in Injection Moulding”,
Journal Material Processing Technology, 57, 62-64.
Lofgren, E. A., Jabarin, S. A. (1994), “Polarized Internal Reflectance Spectroscopic Studies of
Oriented Poly(Ethylene Terephthalate)”, Journal Applied Polymer Science, 51, 1251-1267.
Lu, X., Hay, J. N. (2000), “The Effect of Physical Aging on The Rates of Cold Crystallization of
Poly(Ethylene Terephthalate)”, Polymer, 41, 7427-7436.
Lu, X. F., Hay, J. N. (2001), “Isothermal Crystallization Kinetics and Melting Behaviour of
Poly(Ethylene Terephthalate)”, Polymer, 42, 9423-9431.
Lustiger, A., Markham, R. L. (1983), ”Importance of Tie Molecules in Preventing Polyethylene
Fracture Under Long-Term Loading Conditions”, Polymer, 24, 1647-1654.
Lustiger, A. (1986), “Failure of Plastics”, Munich, Germany, Hanser Publishers.
Lyu, M. Y., Pae, Y. (2003), ”Bottom Design of Carbonated Soft Drink Poly(Ethylene
Terephthalate) Bottle to Prevent Solvent Cracking”, Journal of Apply Polymer Science, 88, 1145-
1152.

REFERENCES
203
Mahendrasingam, A., Martin, C., Fuller, W., Blundell, D. J, (1999), ”Effect of Draw Ratio and
Temperature on The Strain-Induced Crystallization of Poly (Ethylene Terephthalate) at Fast
Draw Rates”, Polymer, 40, 5553-5565.
Mahendrasingam, A., Blundell, D. J., Martin, C. (2000),”Influence of Temperature and Chain
Orientation on The Crystallization of Poly(Ethylene Terephthalate) During Fast Drawing”,
Polymer, 41, 7803-7814.
Marco, Y., Chevalier, L., Poitou, A. (2002), “Induced Crystallization and Orientation of
Poly(Ethylene Terephthalate) During Uniaxial and Biaxial Elongation”, Macromolecule
Symposium, 185, 15-34.
Mark, H. F., Bikales, N. M., Overberger, C. G., Menges, G. (1985), “Organophosphorus
polymers”, Encyclopedia of Polymer Science and Engineering, 10, 595-618.
Martin, L., Stracovsky, D., Laroche, D., Bardetti, A., Ben-Yedder, R., DiRaddo, R. (1999),
“Modeling and Experimental Validation of The Stretch Blow Moulding of PET”, Conference
Proceedings, SPE ANTEC, New York, USA
Maruhashi, Y., Asada, T. (1996), “Structure and Properties of Biaxially Stretched Poly(Ethylene
Terephthalate) Sheets”, Polymer Engineering and Science, 36, 483-494.
Maruhashi, Y. (2001), “Structure and Physical Properties of Biaxially Stretched Polyethylene
Terephthalate Sheets Under Different Heat-Set and Stretch Conditions”, Polymer Engineering
and Science, 41, 2194-2199.

REFERENCES
204
Masood, S. H., Keshavamurthy, V. (2005), “Development of Collapsible PET Water Fountain
Bottles”, Journal of Materials Processing Technology, 162, 83-89.
McCaig, M. S., Paul, D. R. (2000), “Effect of Film Thickness on the Changes in Gas
Permeability of a Glassy Polyarylate Due To Physical Aging. Part I. Experimental Observations”,
Polymer, 41, 629-637.
McCaig, M. S., Paul, D. R., Barlow, J. W. (2000), “Effect of Film Thickness on the Changes in
Gas Permeability of a Glassy Polyarylate Due to Physical Aging Part II. Mathematical Model”,
Polymer, 41, 639-648.
McCrun, N. G., Buckley, C. P., Bucknall, C. B. (1997), “Principles of Polymer Engineering”,
Oxford, UK., Oxford University Press.
McEvoy, J. P. (1997), “Computer Aided Design for Injection Blow Molded Plastic Containers”,
PhD Thesis, The Queen’s University Belfast, UK
McEvoy, J. P., Armstrong, C. G., Crawford, R. J. (1998),”Simulation of the Stretch Blow
Moulding Process of PET Bottles”, Advances in Polymer Technology, 17, 339-352.
Menary, G. H., Armstrong, C. G., Crawford, R. J., McEvoy, J. P. (2000),”Modelling of
Poly(Ethylene Terephthalate) In Injection Stretch-Blow Moulding”, Plastic Rubber Composite,
29, 360-370.

REFERENCES
205
Menary, G. H. (2001), “Modelling Injection Stretch Blow Moulding and The Resulting ‘In
Service’ Performance of PET Bottles”, Belfast, UK., The Queen’s University Press.
Menges, G., Michaeli, W., Mohren, P. (2001) “How to Make Injection Molds”, Munich,
Germany, Hanser Publishers.
Migler, K. B., Bur, A. J. (1998), “Fluorescence Based Measurement of Temperature Profiles
During Polymer Processing”, Polymer Engineering Science, 38, 213-221.
Miller, M. L. (1966), “The Structure of Polymers”, New York, USA, Reinhold Publishing Corp.
Misra, A., Stein, R. S. (1972), “Light Scattering Studies of The Early Stages of The
Crystallization of Poly(Ethylene Terephthalate)”, Journal of Polymer Science Part B: Polymer
Letters , 10, 473-477.
Misra, A., Stein, R. S. (1975),”Stress-Induced Crystallization of Poly(Ethylene Terephthalate)”,
Journal Polymer Science, Polymer Physic, 17, 235-257.
Mitra, D., Misra, A. (1988),”Study on the Effect of Dibenzylidene Sorbitol as A Nucleating
Agent on the Crystallization and Morphology of Poly(Ethylene Terephthalate)”, Journal Applied
Polymer Science, 36, 387-402.
Monteix, S., Schmidt, F., Le Maoult, Y., Ben Yedder, R., Diraddo, R. W., Laroche, D.
(2001),”Experimental Study and Numerical Simulation Of Preform or Sheet Exposed to Infrared
Radiative Heating”, Journal of Materials Processing Technology, 119, 90-97.

REFERENCES
206
Moore, R. S., O’Loane, K., Shearer, J. C. (1981), “Fourier Transform Infrared Characterization
of Conformational Changes in Amorphous Poly(ethylene Terephthalate) During Volume
Recovery”, Polymer Engineering Science, 21, 904-906.
Moskala, E. J. (1998), “A Fracture Mechanics Approach to Environmental Stress Cracking in
Poly(Ethylene-Terephthalate)”, Polymer, 39, 675-680.
Munk, P., Aminabhavi, T.M. (2002), “Introduction to Macromolecular Science”, New York,
USA, John Wiley & Sons, Inc.
Newman, S., Cox, W.P. (1960), “The Glass Temperature of Semicrystalline Polymers”, Journal
of Polymer Science, 46, 29-49.
Nyugen, K. T., Prystay, M. (1978), “An Inverse Method for Estimation of the Initial Temperature
Profile and Its Evolution in Polymer Processing”, International Journal of Heat and Mass
Transfer, 42, 1969-1978.
Ohlberg, S. M., Roth, J., Raff, R. A. V. (1959), “Relationship between impact strength and
spherulite growth in linear polyethylene”, Journal Applied Polymer Science, 1, 114-120.
Osborn, K.R., Jenkins, W.A. (1992), “Plastic Films: Technology and Packaging Application”,
Lancaster, Pennsylvania, Technomic Publishing Co.
Ozawa, T. (1971),”Kinetics of Non-Isothermal Crystallization”, Polymer, 12(3), 150-158.

REFERENCES
207
Peterlin, A. (1975),”Environmental Effects on Low Temperature Crazing of Crystalline
Polymers”, Journal Polymer Science Symposium, 50, 243-264.
Pfromm, P. H., Koros, W. J. (1995), “Accelerated Physical Ageing of Thin Glassy Polymer Films:
Evidence from Gas Transport Measurements”, Polymer, 36, 2379-2387.
Pham, X. T., Thibault, F., Lim, L. T. (2004), “Modeling and Simulation of Stretch Blow Molding
of Polyethylene Terephthalate”, Polymer Engineering and Science, 44, 1460-1472
Reading M., Price, D. M., Orliac, H. (2001), “Measurement of Crystallinity in Polymers Using
Modulated Temperature Differential Scanning Calorimetry”, Materials Characterization by
Dynamic and Modulated Thermal Analytical Techniques, ASTM STP 1402, 17-31.
Rietsch, F. (1990), “Strain-Induced Crystallization of Oriented Poly (Ethylene Terephthalate):
Influence on the Tensile Yield Stress Behaviour”, European Polymer, 26, 1077.
Rietveld, J. X., Lai, G. Y. (1994), “Inverse Method for Obtaining The Temperature Profile
Within A Mold via IR Pyrometry”, Conference Proceedings, SPE ANTEC, San Francisco, USA.
Robertson, G.L. (1993), “Food Packaging: Principles and Practice”, New York, USA, Marcel
Dekker Inc.
Rosato, D.V., Rosato, D.V. (1989), “Blow Molding Handbook”, Oxford, UK., Oxford University
Press.

REFERENCES
208
Rosato, D. V. (1998), “Blow Molding Handbook”, Cincinnati, USA, Hanser/Gardner
Publications Inc.
Roseblade, R. J. (1983), “The Effect of Injection Moulding Processing Parameters on the
Environmental Stress Cracking Resistance of Polycarbonate Mouldings", Ascot Vale, Vic.,
Australia, Materials Research Laboratories
Rybnikar, F. (1960),”Secondary Crystallization of Polymers”, Journal of Polymer Science, 44,
517-522.
Salem, D.R. (1998), “Microstructure Development during Constant-Force Drawing of
Poly(Ethylene Terephthalate) Film”, Polymer, 39, 7067-7077.
Salem, D. R. (1999), “Orientation and Crystallization in Poly(Ethylene Terephthalate) during
Drawing at High Temperatures and Strain Rates”, Polymer Engineering and Science, 39, 2419-
2430.
Sathyanarayana, P. M., Shariff, G., Thimmegowda, M. C., Ramani, R., Ranganathaiah, C.,
Ashalatha, M. B., (2002), “Structural Relaxation in Poly(Ethylene Terephthalate) Studied by
Positron Annihilation Lifetime Spectroscopy”, Polymer International, 51, 765-771.
Satoto, R., Morikawa, J., Hashimoto, T. (1999), “Thermally Stimulated Current Studies on
Molecular Relaxation and Blow Moulding of Poly(Ethylene Terephthalate)”, Polymer
International, 48, 509-514.

REFERENCES
209
Schmidt, P. G. (1963), “Polyethylene Terephthalate Structural Studies”, Journal Polymer Science,
A1, 1271-1292.
Schmidt, F. M., Agassant, J. F., Bellet, M., Desoutter, L. (1966), “Viscoelastic Simulation of PET
Stretch/Blow Molding”, Journal Non-Newtonian Fluid Mechanic, 64, 19-42.
Schmidt, L. R., Carley, J. F. (1975)”Biaxial stretching of heat-softened plastic sheets:
Experiments and results”, Polymer Engineering Science,15, 51-62.
Schmidt, F. M., Agassant, J. F., Bellet, M. (1998), “Experimental Study and Numerical
Simulation of The Injection Stretch/Blow Molding Process”, Polymer Engineering and Science,
38, 1399-1412.
Shanahan, M. E. R., Chen-Fargheon, C., Schultz, J. (1980), “The Influence of Spherulitic Size on
The Environmental Stress Cracking of Low Density Polyethylene”, Makromolekular Chemie,
181, 1121-1126.
Smith, D. E., Chen, C. J., Usman, M., Koskey, J. (1997), “Multi-Gate Injection Molding Process
Optimization Using Design Sensitivity. Analysis”, American Society Mechanical Engineering,
New York, USA
Starkweather, H. W., JR., Moore, G. E., Hansen, J. E., Roder, T. M., Brooks, R. E.
(1956), ”Effect of Crystallinity on The Properties of Nylons ” Journal of Polymer Science,
21, 189-204.

REFERENCES
210
Starkweather, H. W., Richard, J. R., Brooks, R. E. (1959), “Effect of Spherulites on The
Mechanical Properties of Nylon 66”, Journal Applied Polymer Science, 1, 236-239.
Stelson, K. A. (2003), “Calculating Cooling times for Polymer Injection Moulding”, Proceedings
of the institution of Mechanical Engineers, 217, 709-713
Sternstein, S. S., Ongchin, L., Silverman, A. (1968), “Craze Formation and Shear Yielding
Considered for Glassy Polymers in terms of Stress Field Requirements”, Journal Polymer
Science Symposium, 7, 175-199.
Strebel, J. J., Moet, A, (1995), “The Effects of Annealing on Fatigue Crack Propagation in
Polyethylene”, Journal Polymer Science, Polymer Physic, 33, 1969-1984
Strebel, J. J., Benson, M. (1996),”The Effect of Processing Variables on The Environmental
Stress Crack Resistance of Blow-Molded Polyethylene Bottles”, Polymer Engineering And
Science, 36, 1266-1271.
Strobl, G. (1997), “The Physics of Polymers: Concepts for Understanding Their Structures and
Behavior” Berlin, Germany, Springer.
Struik, L. C. E. (1978), “Physical Aging of Amorphous Polymer and other Materials”,
Amsterdam, Elsevier applied science publishers.
Stuart, B. (2002), “Polymer Analysis”, New York, USA, John Wiley & Sons

REFERENCES
211
Sun, N., Yang, J., Shen, D. (1999), “The Effect of Water Absorption on The Physical Ageing of
Amorphous Poly(Ethylene Terephthalate) Film”, Polymer, 40, 6619-6622.
Sűvegh, K., Zelkó, R. (2002), “Physical Ageing of Poly(vinylpyrrolidone) under Different
Humidity Conditions”, Macromolecules, 35, 795-800.
Tant, M. R., Wikes, G. L. (1981), “An Overview of The Non-Equilibrium Behavior of Polymer
Glasses”, Polymer Engineering Science, 21, 874-895.
Tant, M. R., Wilkes, G. L. (1981), “Physical Aging Studies of Semi-crystalline Poly(ethylene
Terephthalate)”, Journal Applied Polymer Science, 26, 2813-2825.
Thibault, F., Malo, A., Lanctot, B., Diraddo, R. (2007), “Preform shape and operating condition
optimization for the stretch blow molding process”, polymer engineering science, 47, 289-301
VanderPlaats, G. N. (1999), “Numerical Optimization Techniques for Engineering Design”,
Colorado Springs, USA, VanderPlaats Research & Development Inc.
Van Dijk, R. (1997), “FEA as A Design Tool”, Packaging Today Europe, 1, 40-44.
Varma, P., Lofgren, E.A., Jabarin, S.A. (1998), “Properties and Kinetics of Thermally
Crystallized Orientated Poly(Ethylene Terephthalate) (PET) I: Kinetics of Crystallization”,
Polymer Engineering and Science, 38, 237-244.

REFERENCES
212
Venkateswaran, G., Cameron, M. R., Jabarin, S. A. (1998), “Effects of Temperature Profiles
Through Preform Thickness on The Properties of Reheat-Blown PET Containers”, Advances in
Polymer Technology, 17, 237-349.
Von Mises, R. (1913), “Mechanik der Festen Korper im plastisch deformablen Zustand”, Nachr.
Math. Phys., 1, 582–592.
Wadley, H. N. G., Norton, S. J., Mauer, F., Droney, B. (1986), “Ultrasonic Measurement of
Internal Temperature ”, Philosophical Transactions of the Royal Society of London Series,
London, UK, A320, 341-361.
Walter Michaeli, E. H. (2004),” Saving Time by Foam Injection Molding”, Conference
Proceedings, SPE ANTEC, Chicago, USA.
Wang, S., Makinouchi, A., Nakagawa, T. (1998), “Three-Dimensional Viscoplastic FEM
Simulation of a Stretch Blow Molding Process”, Advances in Polymer Technology, 17, 189-202.
Wang, S., Makinouchi, A., Okamoto, M., Kotaka, T., Maeshima, M., Ibe, N., Nakagawa, T.
(2000), “Viscoplastic Material Modelling for the Stretch Blow Moulding Simulation”,
International Polymer Processing, 15, 166-175.
Wang, S., Makinouchi, A., Okamoto, M., Kotaka, T., Maeshima, M., Ibe, N., Nakagawa, T.
(1999), “3D FEM Simulation of the Stretch Blow Molding Process with A Two-Stage Material
Model”, Conference Proceedings, SPE ANTEC, New York, USA.

REFERENCES
213
Ward, I.M. (1975), “Structure and Properties of Oriented Polymers”, New York, USA, John
Wiley and Sons
Wellinghoff, S., Baer, E. (1975), “The Mechanism of Crazing in Polystyrene” Journal
Macromolecular Science–Physic, 11, 367-387
Wright, D. C., Gotham, K. V. (1983),”Solvent-Crazing Criteria”, Polymer Engineering Science,
23, 135-139.
Wright, D. (1996), “Environmental Stress Cracking of Plastics”, Shawbury, UK, Rapra
Technology Ltd
Xinhai, Z., Guogun, Z., Guangchun, W., Tonghai, W. (2006), “Sensitivity Analysis Based
Multiple Objective Preform Die Shape Optimal Design in Metal Forging”, J. Mater. Sci. Technol.,
22, 273-278.
Xu, H., Kazmer, D. A. (1999), “Stiffness Criterion for Cooling Time Estimation”, International
Polymer Processing, 14, 103-108
Yaffe, M. B., Kramer, E. J. (1981), “Plasticization Effects on Environmental Craze
Microstructure”, Journal of Material Science, 16, 2130-2136.
Yang, Z. J., Harkin-Jones, E. M. A., Armstrong, C. G., Menary, G. H. (2004), “Finite Element
Modelling of Stretch-Blow Molding of PET Bottles Using Buckley Model: Plant Tests and

REFERENCES
214
Effects of Process Conditions and Material Parameters”, Journal of Process Mechanical
Engineering, 218, 237-250.
Yang, Z. J., Jones, E. H., Menary, G. H., Armstrong, C. G. (2004), “A Non-Isothermal Finite
Element Model for Injection Stretch-Blow Molding of PET Bottles with Parametric Studies”,
Polymer Engineering Science, 44, 1379-1390.
Yilmazer, U., Xanthos, M., Bayram, G., Tan, V.(2000), “Viscoelastic Characteristics of Chain
Extended/Branched and Linear Polyethylene Terephthalate Resins”, Journal of Applied Polymer
Science, 75, 1371-1377.
Yu, C. J., Sunderland, J. E. (1992), “Determination of Ejection Temperature and Cooling Time in
Injection Molding”, Polymer Engineering Science, 32, 191-197.
Zagarola, S. W. (1998), “Designing PET Preform Injection Molding Process for The Lightest
Practical Weight Offers Opportunities for Improved Productivity and Quality”, Conference
Proceedings, SPE ANTEC, Atlanta, USA.
Zagarola, S. W. (2000), “Blow and Injection Molding Process Set-Ups Play a Key Role in Stress
Crack Resistance for PET Bottles for Carbonated Beverages’, Conference Proceedings, SPE
ANTEC, Orlando, USA.
Zelkó, R., Süvegh, K., Marton, S., Rácz, I. (2000), “Effects of Storage Conditions on the Free
Volume of Polyvinylpyrrolidone: Comparison of Positron Lifetime Data with the Tensile
Strength of Tablets”, Pharmaceutical Research, 17, 1030-1032.

REFERENCES
215
Zhao, J., Wang, J., Li, C., Fan, Q. (2002), “Study of The Amorphous Phase in Semi-crystalline
Poly(Ethylene Terephthalate) Via Physical Aging”, Macromolecules, 35, 3097-3103.

APPENDICES
216
APPENDICES

APPENDIX A STRESS ANALYSIS STATISTICS IN CATIA V5 R14
217
In appendix A section, the statistic values that belong to the optimum Von Mises stress analysis
carried out through CATIA V5 R14 version are given in tables. The statistical values are for the
optimum stress analysis conducted under the internal pressure of 0.4 MPa and optimum base
dimensions optimized by ECHIP-7.
Table A-1. Mesh entities and sizes
Entity Size
Nodes 35732
Elements 119467
Table A-2. Element type
Connectivity Statistic
TE4 119467 ( 100.00% )
Table A-3. Element Quality
Criterion Good Poor Bad Worst Average
Skewness 113915
( 95.35% )
5421
( 4.54% ) 131 ( 0.11% ) 0.993 0.450
Distortion
(deg)
79651
( 66.67% )
34992
( 29.29% )
4824
( 4.04% ) 62.962 30.300
Stretch 119421
( 99.96% ) 46 ( 0.04% ) 0 ( 0.00% ) 0.178 0.623
Min. Length
(mm)
119467
( 100.00% ) 0 ( 0.00% ) 0 ( 0.00% ) 0.556 1.670
Max. Length
(mm)
119467
( 100.00% ) 0 ( 0.00% ) 0 ( 0.00% ) 5.310 3.123
Shape Factor 119402
( 99.95% ) 65 ( 0.05% ) 0 ( 0.00% ) 0.160 0.675
Length Ratio 119440
( 99.98% ) 27 ( 0.02% ) 0 ( 0.00% ) 6.570 1.944

APPENDIX A STRESS ANALYSIS STATISTICS IN CATIA V5 R14
218
Fig.A-1. Boundary conditions on the bottle
Table A-4. Structure Computation results
Number of nodes 35732
Number of elements 119467
Number of D.O.F 107196
Number of Contact relations 0
Number of Kinematic relations 0
Linear tetrahedron 119467

APPENDIX A STRESS ANALYSIS STATISTICS IN CATIA V5 R14
219
Table A-5. Restraint computation results
Name: Restraint Set 1
Number of S.P.C 1563
Table A-6. Applied load-1 computation results
Fx (N) 0.04106
Fy (N) -151.3
Fz (N) 0.008740
Mx (N.m) 0.0001245
My (N.m) -00009121
Mz (N.m) -0.001402
Table A-7. Stiffness computation results
Number of lines 107196
Number of coefficients 1893765
Number of blocks 4
Maximum number of coefficients per bloc 499992
Total matrix size Mb 22.08

APPENDIX A STRESS ANALYSIS STATISTICS IN CATIA V5 R14
220
Table A-8. Singularity computation results
Number of local singularities 0
Number of singularities in translation 0
Number of singularities in rotation 0
Generated constraint type MPC
Table A-9. Constraint computation results
Number of constraints 1563
Number of coefficients 0
Number of factorized constraints 1563
Number of coefficients 0
Number of deferred constraints 0
Table A-10. Direct method computation results
Name StaticSet.1
Restraint RestraintSet.1
Load LoadSet.1
Strain Energy 1.350e+000 J
Equilibrium

APPENDIX A STRESS ANALYSIS STATISTICS IN CATIA V5 R14
221
Table A-11. Factorized computation results
Method SPARSE
Number of factorized degrees 105633
Number of supernodes 7191
Number of overhead indices 546522
Number of coefficients 20605248
Maximum front width 1680
Maximum front size 1412040
Size of the factorized matrix (Mb) 157.206
Number of blocks 21
Number of Mflops for factorization 1. 155e+004
Number of Mflops for solve 8. 295e+001
Minimum relative pivot 1. 019e-002
Table A-12. Applied forces computation results
Components Applied Forces Reactions Residual Relative Magnitude
Error
Fx (N) 4.1058e-002 -4.1058e-002 3.2193e-011 9.9400e-013
Fy (N) -1.5128e+002 1.5128e+002 -1.7337e-011 5.3531e-013
Fz (N) 8.7403e-003 -8.7403e-003 -1.8613e-010 5.7472e-012
Mx (Nxm) 1.2454e-004 -1.2454e-004 1.8579e-011 2.0913e-012
My (Nxm) -9.1206e-005 9.1206e-005 2.1079e-012 2.3727e-013
Mz (Nxm) -1.4019e-003 1.4019e-003 9.8382e-012 1.1074e-012

APPENDIX A STRESS ANALYSIS STATISTICS IN CATIA V5 R14
222
Fig.A-2. Deformed mesh on the bottle under the internal pressure of 0.4 MPa.
Fig.A-3. Optimum Von Mises stress for the internal pressure of 0.4 MPa.
Von Mises stress (nodal values)
N/m2
On Boundary

APPENDIX A STRESS ANALYSIS STATISTICS IN CATIA V5 R14
223
Table A-13. Von Mises stress values for the pressure of 0.4 MPa. at different wall thickness
Von Mises Stress values (MPa)
Bottle wall thickness (mm) 0.5 1 2
Foot Length
(mm)
Valley width
(mm)
Clearance
(mm) Max Min Max Min Max Min
16 1 3 40.30 0.12 18.20 0.13 8.63 0.16
16 1 10 39.10 0.10 20.00 0.15 8.66 0.25
16 1 17 39.80 0.17 22.10 0.33 10.20 0.28
16 4.667 12.333 49.10 0.14 23.40 0.25 9.36 0.21
16 6.5 3 48.10 0.05 22.60 0.14 9.59 0.05
16 6.5 10 45.70 0.11 20.70 0.30 9.83 0.11
16 6.5 17 46.40 0.61 22.80 1.16 10.90 0.69
16 12 3 55.20 0.10 27.60 0.16 11.50 0.09
16 12 10 54.80 0.18 23.90 0.27 10.60 0.16
16 12 17 50.50 0.19 23.70 0.22 10.50 0.26
24.333 4.667 7.667 44.30 0.07 22.70 0.12 8.97 0.12
28.5 1 3 39.80 0.10 22.00 0.13 9.01 0.13
28.5 1 17 40.30 0.33 19.50 0.65 9.75 0.40
28.5 6.5 10 50.10 0.10 19.70 0.17 10.10 0.15
28.5 6.5 17 51.20 0.05 21.60 0.77 11.00 0.39
28.5 12 3 50.90 0.08 29.30 0.14 12.60 0.10
28.5 12 10 49.70 0.10 22.30 0.26 11.10 0.32
28.5 12 17 46.00 1.15 25.80 0.50 10.80 0.62
32.667 4.667 7.667 49.50 0.12 23.10 0.13 9.75 0.14
32.667 8.333 3 52.00 0.11 27.10 0.14 11.30 0.12
41 1 3 51.50 0.12 26.20 0.12 10.50 0.13
41 1 10 49.10 0.09 21.10 0.13 9.96 0.15
41 1 17 48.40 0.20 24.20 0.16 11.50 0.35
41 6.5 3 57.30 0.07 28.70 0.13 11.70 0.14
41 8.333 12.333 54.50 0.12 26.90 0.14 10.60 0.13
41 12 3 60.20 0.09 32.10 0.13 13.60 0.15
41 12 10 54.80 0.11 29.20 0.13 13.90 0.20
41 12 17 51.40 0.26 25.50 0.19 11.30 0.15

APPENDIX A STRESS ANALYSIS STATISTICS IN CATIA V5 R14
224
Table A-14. Von Mises stress values for the pressure of 0.6 MPa. at different wall thickness
Von Mises Stress Values (MPa)
Bottle wall thickness (mm) 0.5 1 2
Foot Length
(mm)
Valley width
(mm)
Clearance
(mm) Max Min Max Min Max Min
16 1 3 60.40 0.17 27.30 0.20 12.90 0.24
16 1 10 58.60 0.15 30.00 0.22 13.00 0.38
16 1 17 59.70 0.26 33.20 0.50 15.20 0.41
16 4.667 12.333 73.70 0.22 35.00 0.31 14.00 0.31
16 6.5 3 72.20 0.08 33.90 0.21 14.40 0.07
16 6.5 10 68.60 0.17 31.00 0.45 14.70 0.16
16 6.5 17 69.60 0.91 34.20 1.75 16.30 1.04
16 12 3 82.80 0.14 41.50 0.24 17.30 0.13
16 12 10 82.20 0.27 35.80 0.40 15.90 0.25
16 12 17 75.80 0.29 35.60 0.33 15.70 0.39
24.333 4.667 7.667 66.50 0.11 34.10 0.18 13.40 0.19
28.5 1 3 59.70 0.16 32.90 0.20 13.50 0.19
28.5 1 17 60.40 0.49 29.20 0.98 14.60 0.60
28.5 6.5 10 75.10 0.15 29.60 0.26 15.10 0.23
28.5 6.5 17 76.80 0.07 32.30 1.16 16.40 0.58
28.5 12 3 76.40 0.12 44.00 2.09 18.80 0.15
28.5 12 10 74.50 0.14 33.50 0.38 16.60 0.47
28.5 12 17 69.00 1.72 38.70 0.75 16.20 0.93
32.667 4.667 7.667 74.20 0.18 34.70 0.20 14.60 0.21
32.667 8.333 3 78.00 0.17 40.60 0.21 17.00 0.19
41 1 3 77.30 0.18 39.20 0.19 15.70 0.20
41 1 10 73.70 0.14 31.60 0.20 14.90 0.22
41 1 17 72.70 0.30 36.30 0.25 17.30 0.52
41 6.5 3 85.90 0.11 43.00 0.19 17.60 0.21
41 8.333 12.333 81.80 0.19 40.30 0.21 15.90 0.20
41 12 3 90.40 0.14 48.20 0.20 20.40 0.23
41 12 10 82.20 0.16 43.80 0.19 20.90 0.30
41 12 17 77.10 0.39 38.30 0.29 17.00 0.23

APPENDIX B SIMULATION RESULTS
225
Comparison of the new and standard bases for Model1
0.00
0.50
1.00
1.50
2.00
2.50
3.00
3.50
300 320 340 360 380
Distance (mm)
Wal
l Th
ickn
ess
(mm
)New Base
Standard Base
Fig. B-1(a). Comparison of thickness profile of the optimised and standard bases; model-1
Comparison of The New and Standard Bases for Model-2
0.00
0.50
1.00
1.50
2.00
2.50
3.00
3.50
300 320 340 360 380
Distance from top of the Bottle (mm)
Bo
ttle
Wal
l T
hic
knes
s (m
m)
New Base
Standard Base
Fig. B-1(b). Comparison of thickness profile of the optimised and standard bases; model-2
Distance from the center of the bottle base
-- 40 - 20 0 20 40
Distance from the center of the bottle base
--40 20 0 20 40

APPENDIX B SIMULATION RESULTS
226
Model3
0.00
0.50
1.00
1.50
2.00
2.50
3.00
3.50
4.00
300 310 320 330 340 350 360 370 380 390
Distance from top of the Bottle (mm)
Bo
ttle
Wal
l T
hic
knes
s (m
m)
New Base
Standard Base
Fig. B-1(c). Comparison of thickness profile of the optimised and standard bases; model-3
Comparison of the New and Standard Bases for Model-1
-1.00E+01
0.00E+00
1.00E+01
2.00E+01
3.00E+01
4.00E+01
5.00E+01
6.00E+01
7.00E+01
300 320 340 360 380
Distance from top of the Bottle (mm)
Str
ess
(MP
a)
New Base
Standard Base
Fig.B-2.(a) Comparison of stress profile of the optimised and standard bases; model-1
Distance from the center of the bottle base
-40 - 20 0 20 40
Distance from the center of the bottle base
- 40 - 20 0 20 40

APPENDIX B SIMULATION RESULTS
227
Comparison of the New and Standard Bases for Model-2
-1.00E+01
0.00E+00
1.00E+01
2.00E+01
3.00E+01
4.00E+01
5.00E+01
6.00E+01
7.00E+01
8.00E+01
300 320 340 360 380
Distance from top of the Bottle (mm)
Str
ess
(MP
a)
New Base
Standard Base
Fig.B-2(b). Comparison of stress profile of the optimized and standard bases; model-2
Compariment of the Models
0.00E+00
1.00E+01
2.00E+01
3.00E+01
4.00E+01
5.00E+01
6.00E+01
7.00E+01
8.00E+01
300 320 340 360 380
Distance from top of the Bottle (mm)
Str
ess
(MP
a)
New Base
Standard Base
Fig.B-2(c). Comparison of stress profile of the optimised and standard bases; model-3
Distance from the center of the bottle base
-40 - 20 0 20 40
Distance from the center of the bottle base
- 40 - 20 0 20 40

APPENDIX B SIMULATION RESULTS
228
Comparison of the New and Standard Bases for Model-1
-5.00E-02
0.00E+00
5.00E-02
1.00E-01
1.50E-01
2.00E-01
2.50E-01
3.00E-01
3.50E-01
4.00E-01
300 320 340 360 380
Distance from top of the Bottle (mm)
Cry
stal
linit
y
New Base
Standard Base
Fig.B-3.(a) Comparison of crystallinity of the optimised and standard bases; model-1
Comparison of the New and Standard Bases for Model-2
-5.00E-02
0.00E+00
5.00E-02
1.00E-01
1.50E-01
2.00E-01
2.50E-01
3.00E-01
300 320 340 360 380
Distance from top of the Bottle (mm)
Cry
stal
linit
y
New Base
Standard Base
Fig.B-3(b). Comparison of crystallinity of the optimised and standard bases for model-2
Distance from the center of the bottle base
- 40 - 20 0 20 40
Distance from the center of the bottle base
- 40 - 20 0 20 40

APPENDIX B SIMULATION RESULTS
229
Compariment of the Models
0.00E+00
5.00E-02
1.00E-01
1.50E-01
2.00E-01
2.50E-01
3.00E-01
300 320 340 360 380
Distance from top of the Bottle (mm)
Cry
stal
linit
y
New Basel
Standard Base
Fig.B-3(c). Comparison of crystallinity of the optimised and standard bases for model-3
Comparison of the New and Standard Bases for Model-1
-2.00E-02
0.00E+00
2.00E-02
4.00E-02
6.00E-02
8.00E-02
1.00E-01
1.20E-01
1.40E-01
300 320 340 360 380
Distance from top of the Bottle (mm)
Mol
ecu
lar
Ori
enta
tion
New Base
Standard Base
Fig.B-4. (a).Comparison of molecular orientations of the optimized and standard bases; model-1
Distance from the center of the bottle base
- 40 - 20 0 20 40
Distance from the center of the bottle base
- 40 - 20 0 20 40

APPENDIX B SIMULATION RESULTS
230
Comparison of the New and Standard Bases for Model-2
-1.00E-02
0.00E+00
1.00E-02
2.00E-02
3.00E-02
4.00E-02
5.00E-02
300 320 340 360 380
Distance from top of the Bottle (mm)
Mole
cula
r O
rien
tati
on
New Base
Standard Base
Fig.B-4(b). Comparison of molecular orientations of the optimized and standard bases; model-2
Compariment of the Models
0.00E+00
1.00E-02
2.00E-02
3.00E-02
4.00E-02
5.00E-02
6.00E-02
7.00E-02
8.00E-02
9.00E-02
300 320 340 360 380
Distance from top of the Bottle (mm)
Mol
ecu
lar
Ori
enta
tion
New Base
Standard Base
Fig.B-4(c). Comparison of molecular orientations of the optimized and standard bases; model-3
Distance from the center of the bottle base
-40 - 20 0 20 40
Distance from the center of the bottle base
-40 - 20 0 20 40

APPENDIX B SIMULATION RESULTS
231
Comparison of the New and Standard Bases for Model-1
8.00E-01
9.00E-01
1.00E+00
1.10E+00
1.20E+00
1.30E+00
1.40E+00
1.50E+00
1.60E+00
1.70E+00
1.80E+00
300 320 340 360 380
Distance from top of the Bottle (mm)
Bia
xial
Rta
io
New Base
Standard Base
Fig.B-5.(a) Comparison of biaxial ratios of the optimized and standard bases; model-1
Comparison of the New and Standard Bases for Model-2
1.00E+00
1.10E+00
1.20E+00
1.30E+00
1.40E+00
1.50E+00
1.60E+00
1.70E+00
1.80E+00
1.90E+00
2.00E+00
300 320 340 360 380
Distance from top of the Bottle (mm)
Bia
xial
Rta
io
New Base
Standard Base
Fig. B-5(b). Comparison of biaxial ratios of the optimized and standard bases; model-2
Distance from the center of the bottle base
- 40 - 20 0 20 40
Distance from the center of the bottle base
- 40 - 20 0 20 40

APPENDIX B SIMULATION RESULTS
232
Compariment of the Models
1.00E+00
1.50E+00
2.00E+00
2.50E+00
3.00E+00
3.50E+00
4.00E+00
300 320 340 360 380
Distance from top of the Bottle (mm)
Bia
xial
Rta
io
New Base
Standard Base
Fig.B-5(c). Comparison of biaxial ratios of the optimized and standard bases; model-3
Distance from the center of the bottle base
-40 - 20 0 20 40

APPENDIX C STANDARD AND OPTIMISED BOTTLE PROPERTIES
233
Table C-1. Bottle burst pressure values for the bottle with standard base
Standard Base
Burst Expansion Time
Samples (psi) (ml) (seconds)
1 202 678 39
2 203 663 38
3 207 508 33
4 204 531 35
5 205 577 37
6 207 518 35
Average 205 579 36
Std Dev 2 75 2
Table C-2. Bottle burst pressure values for the bottle with standard base
Optimum base
Burst Expansion Time
Samples (psi) (ml) (seconds)
1 192 516 33
2 193 494 32
3 198 610 35
4 193 590 34
5 195 556 33
6 195 478 31
Average 194 541 33
Std Dev 2 53 1
The following tests were carried out within 2 hours after the bottles were produced by Stretch
Blow Molding Process.

APPENDIX C STANDARD AND OPTIMISED BOTTLE PROPERTIES
234
Table C-3. Bottle burst pressure values for the bottle with optimum base;
preform reheat temperature of 105 oC
105 oC Preform Set-point
Burst Expansion Time
Samples (psi) (ml) (seconds)
1 209 428 33
2 210 486 35
3 210 444 33
4* 151* 155* 22*
5 207 392 32
6 212 498 35
7 213 471 34
8 203 383 31
9 212 426 33
10 209 423 33
11 210 414 32
Average 204 411 32
Std Dev 18 92 4
(*) This bottle failed in the base whilst all other bottles failed in the panel area as is normal for
good bottle production.
Table C-4. Bottle burst pressure values for the bottle with optimum base; preform reheat
temperature of 110 oC
110 oC Preform Set-point
Burst Expansion Time
Samples (psi) (ml) (seconds)
1 198 415 32
2 199 451 33
3 195 424 32
4 199 433 33
5 194 409 31
6 197 343 30
7 196 433 32
8 197 458 32
9 196 485 31
10 197 501 33
Average 197 435 32
Std Dev 2 44 1

APPENDIX C STANDARD AND OPTIMISED BOTTLE PROPERTIES
235
Table C-5. Bottle burst pressure values for the bottle with optimum base; preform reheat
temperature of 115 oC
115 oC Preform Set-point
Burst Expansion Time
Samples (psi) (ml) (seconds)
1 179 492 32
2 179 508 32
3 176 631 34
4 175 480 32
5 178 488 32
6 182 578 34
7 177 520 31
8 181 407 28
9 173 438 28
10 186 561 34
Average 179 510 32
Std Dev 4 66 2
Table C-6. Top load test and section weights of the bottle with standard base
Standard Base
Top Load Section Weights (g)
Samples Peak (Kg) Base Centre Top
1 30.3 11.3 15.0 13.6
2 31.8 11.3 15.0 13.7
3 31.3 11.3 15.1 13.7
4 31.1 11.4 15.0 13.6
5 30.5 11.4 15.0 13.7
6 31.3 11.3 15.0 13.8
Average 31.1 11.3 15.0 13.7
Std Dev 0.6 0.1 0.0 0.1

APPENDIX C STANDARD AND OPTIMISED BOTTLE PROPERTIES
236
Table C-7. Top load test and section weights of the bottle with optimum base
Optimum base
Top Load Section Weights (g)
Samples Peak (Kg) Base Centre Top
1 29.6 11.8 14.7 13.4
2 29.7 11.8 14.7 13.6
3 28.7 11.9 14.8 13.4
4 29.4 11.7 14.7 13.6
5 28.5 11.7 14.8 13.6
6 29.4 11.6 14.8 13.6
Average 29.2 11.8 14.8 13.5
Std Dev 0.5 0.1 0.1 0.1
Table C-8. Top loads and section weights of the bottle with optimum base;
preform reheat temperature of 105 oC
105 oC Preform Set-point
Top Load Section Weights (g)
Samples Peak (Kg) Base Centre Top
1 31.6 12.1 14.5 13.4
2 32.6 12.2 14.5 13.4
3 31.6 12.1 14.6 13.5
4 31.6 12.1 14.5 13.4
5 31.8 12.2 14.5 13.4
6 31.7 12.1 14.6 13.5
Average 31.8 12.1 14.5 13.4
Std Dev 0.4 0.0 0.1 0.1

APPENDIX C STANDARD AND OPTIMISED BOTTLE PROPERTIES
237
Table C-9. Top loads and section weights of the bottle with optimum base;
preform reheat temperature of 110 oC
110 oC Preform Set-point
Top Load Section Weights (g)
Samples Peak (Kg) Base Centre Top
1 32.8 11.8 14.8 13.4
2 33.6 11.7 14.8 13.4
3 33.1 11.8 14.8 13.6
4 33.0 11.8 14.7 13.4
5 32.8 11.7 14.8 13.4
6 33.0 11.8 14.7 13.4
Average 33.0 11.8 14.8 13.4
Std Dev 0.3 0.0 0.1 0.1
Table C-10. Top loads and section weights of the bottle with optimum base;
preform reheat temperature of 115 oC
115 oC Preform Set-point
Top Load Section Weights (g)
Samples Peak (Kg) Base Centre Top
1 34.2 11.5 15.1 13.5
2 34.3 11.7 14.8 13.6
3 31.9 11.6 14.9 13.5
4 33.4 11.6 15.0 13.5
5 32.2 11.7 14.9 13.6
6 33.2 11.5 14.8 13.5
Average 33.2 11.6 14.9 13.5
Std Dev 1.0 0.1 0.1 0.0

APPENDIX C STANDARD AND OPTIMISED BOTTLE PROPERTIES
238
Table C-11. Accelerated stress crack resistance for off-machine performance
ACCELERATED STRESS CRACK PERFORMANCE (minutes)
Samples Standard Base Optimum base
1 61 66
2 51 58
3 25 87
4 49 77
5 47 71
6 21 82
Average 42 74
Std Dev 16 11
Table C-12. Accelerated stress crack resistance a few days after blow molding
ACCELERATED STRESS CRACK PERFORMANCE (minutes)
Samples Standard Base Optimum base
1 32 68
2 36 73
3 44 64
4 14 75
5 36 61
6 37 53
7 31 50
8 27 66
9 31 67
10 48 60
Average 34 64
Std Dev 10 18

APPENDIX C STANDARD AND OPTIMISED BOTTLE PROPERTIES
239
Table C-13 ASC Resistance to the average temperatures for the optimum base less than 24 hours
after blow molding
ACCELERATED STRESS CRACK PERFORMANCE (minutes)
Samples 105 oC 110 oC 115 oC
1 83 103 48
2 101 69 75
3 91 67 57
4 87 81 81
5 100 60 83
6 81 86 46
7 98 63 79
8 93 61 73
9 85 113 84
10 103 82 52
Average 92 79 68
Std Dev 8 18 15

240
Table C-14. Thermal stability test for the 1500 ml. bottle with standard base
1500 ml. BOTTLE WITH STANDARD BASE Sample Bottle Height (mm) Bottle Diameters (at locations defined in specifications sheet) Base
Number (to bottom of flange) Upper Panel Lower Panel Base Clearance
Initial Final Initial Final Initial Final Initial Final (Initial)
1 274.2 279.8 90.9 93.0 91.0 93.4 92.6 93.9 7.2
2 274.3 280.0 91.0 93.0 90.9 93.0 92.1 93.9 7.0
3 274.2 279.6 91.0 93.0 91.0 93.0 93.0 93.9 7.3
Average 274.2 279.8 91.0 93.0 91.0 93.1 92.6 93.9 7.2
St. Dev 0.06 0.20 0.07 0.02 0.04 0.25 0.42 0.00 0.15
Minimum 274.2 279.6 90.9 93.0 90.9 93.0 92.1 93.9 7.0
Maximum 274.3 280.0 91.0 93.0 91.0 93.4 93.0 93.9 7.3
Sample Fill Point Base Height Growth in Diameters percent) Pinch / Base Ratio
Number Drop (mm) Clearance Growth (if applicable)
Final
Perpendicularity Final
Final (percent)
Upper Panel
Lower Panel Base Initial Final
1 24.3 2.8 2.0 2.3 2.6 1.4 98.3 99.5
2 22.4 2.9 2.1 2.2 2.3 1.9 98.7 99.0
3 21.9 2.7 2.0 2.2 2.2 1.0 97.8 99.0
Average 22.9 2.8 2.0 2.2 2.4 1.4 98.3 99.2
St. Dev 1.27 0.10 0.06 0.07 0.23 0.46 0.42 0.26
Minimum 21.9 0.0 2.7 2.0 2.2 2.2 1.0 97.8 99.0
Maximum 24.3 0.0 2.9 2.1 2.3 2.6 1.9 98.7 99.5
AP
PE
ND
IX C
ST
AN
DA
RD
AN
D O
PT
IMIS
ED
BO
TT
LE
PR
OP
ER
TIE
S
240

241
Table C-15. Thermal stability test for the 1500 ml. bottle with optimum base
1500 ml. BOTTLE WITH OPTIMUM BASE Sample Bottle Height (mm) Bottle Diameters (at locations defined in specifications sheet) Base
Number (to bottom of flange) Upper Panel Lower Panel Base Clearance
Initial Final Initial Final Initial Final Initial Final (Initial)
1 273.8 278.3 91.0 93.3 91.1 93.2 92.8 94.1 6.2
2 273.9 278.3 91.1 93.3 91.0 93.2 92.3 94.0 6.3
3 273.9 278.5 91.2 93.3 91.1 93.2 92.5 94.2 6.2
Average 273.9 278.4 91.1 93.3 91.1 93.2 92.6 94.1 6.2
St. Dev 0.06 0.12 0.10 0.04 0.07 0.03 0.24 0.13 0.06
Minimum 273.8 278.3 91.0 93.3 91.0 93.2 92.3 94.0 6.2
Maximum 273.9 278.5 91.2 93.3 91.1 93.2 92.8 94.2 6.3
Sample Fill Point Base Height Growth in Diameters Percent Pinch / Base Ratio
Number Drop (mm) Clearance Growth (if applicable)
Final
Perpendicularity Final
Final (percent)
Upper Panel
Lower Panel Base Initial Final
1 21.6 1.7 1.6 2.5 2.3 1.3 98.1 99.1
2 21.8 1.6 1.6 2.4 2.4 1.7 98.5 99.2
3 22.0 1.7 1.7 2.3 2.3 1.8 98.5 99.0
Average 21.8 1.7 1.6 2.4 2.3 1.6 98.4 99.1
St. Dev 0.20 0.06 0.04 0.09 0.05 0.24 0.22 0.11
Minimum 21.6 0.0 1.6 1.6 2.3 2.3 1.3 98.1 99.0
Maximum 22.0 0.0 1.7 1.7 2.5 2.4 1.8 98.5 99.2
AP
PE
ND
IX C
ST
AN
DA
RD
AN
D O
PT
IMIS
ED
BO
TT
LE
PR
OP
ER
TIE
S
241

242
Table C-16. Thermal stability test for the 1500 ml. bottle with optimum base preform reheat temperature of 105 oC
1500 ml. BOTTLE WITH OPTIMUM BASE (105 oC) Sample Bottle Height (mm) Bottle Diameters (at locations defined in specifications sheet) Base
Number (to bottom of flange) Upper Panel Lower Panel Base Clearance
Initial Final Initial Final Initial Final Initial Final (Initial)
1 273.2 284.5 91.4 95.2 91.4 95.5 93.0 96.3 6.0
2 273.2 285.0 91.4 95.5 91.4 95.5 93.0 96.2 6.1
Average 273.2 284.8 91.4 95.4 91.4 95.5 93.0 96.3 6.0
St. Dev 0.00 0.35 0.00 0.23 0.00.00 0.000.00 0.00 0.11 0.07
Minimum 273.2 284.5 91.4 95.2 91.4 95.5 93.0 96.2 6.0
Maximum 273.2 285.0 91.4 95.5 91.4 95.5 93.0 96.3 6.1
Sample Fill Point Base Height Growth in Diameters percent) Pinch / Base Ratio
Number Drop (mm) Clearance Growth (if applicable)
Final
Perpendicularity Final
Final (percent) Upper Panel
Lower Panel Base Initial Final
1 17.0 1.0 4.1 4.2 4.5 3.6 98.2 99.1
2 16.2 1.2 4.3 4.5 4.5 3.4 98.3 99.4
Average 16.6 1.1 4.2 4.4 4.5 3.5 98.2 99.3
St. Dev 0.57 0.12 0.13 0.25 0.00 0.11 0.06 0.21
Minimum 16.2 0.0 1.0 4.1 4.2 4.5 3.4 98.2 99.1
Maximum 17.0 0.0 1.2 4.3 4.5 4.5 3.6 98.3 99.4
242
AP
PE
ND
IX C
S
TA
ND
AR
D A
ND
OP
TIM
ISE
D B
OT
TL
E P
RO
PE
RT
IES

243
Table C-17. Thermal stability test for the 1500 ml. bottle with optimum base preform reheat temperature of 110 oC
1500 ml. BILLBOARD WITH OPTIMUM BOTTLE BASE (110 oC) Sample Bottle Height (mm) Bottle Diameters (at locations defined in specifications sheet) Base
Number (to bottom of flange) Upper Panel Lower Panel Base Clearance
Initial Final Initial Final Initial Final Initial Final (Initial)
1 274.0 285.0 91.4 95.2 91.4 95.2 93.0 95.5 5.8
2 274.0 285.0 91.4 95.2 91.4 94.9 93.0 95.5 6.1
Average 274.0 285.0 91.4 95.2 91.4 95.1 93.0 95.5 6.0
St. Dev 0.00 0.00 0.00 0.00 0.00 0.23 0.00 0.00 0.17
Minimum 274.0 285.0 91.4 95.2 91.4 94.9 93.0 95.5 5.8
Maximum 274.0 285.0 91.4 95.2 91.4 95.2 93.0 95.5 6.1
Sample Fill Point Base Height Growth in Diameters percent) Pinch / Base Ratio
Number Drop (mm) Clearance Growth (if applicable)
Final
Perpendicularity Final
Final (percent) Upper Panel
Lower Panel Base Initial Final
1 15.2 1.0 4.0 4.2 4.2 2.7 98.4 99.7
2 15.6 0.5 4.0 4.2 3.8 2.7 98.6 99.3
Average 15.4 0.8 4.0 4.2 4.0 2.7 98.5 99.5
St. Dev 0.28 0.36 0.00 0.00 0.25 0.00 0.14 0.24
Minimum 15.2 0.0 0.5 4.0 4.2 3.8 2.7 98.4 99.3
Maximum 15.6 0.0 1.0 4.0 4.2 4.2 2.7 98.6 99.7
AP
PE
ND
IX C
S
TA
ND
AR
D A
ND
OP
TIM
ISE
D B
OT
TL
E P
RO
PE
RT
IES
243

244
Table C-18. Thermal stability test for the 1500 ml. bottle with optimum base preform reheat temperature of 115 oC
1500 ml. BOTTLE WITH OPTIMUM BASE (115 oC) Sample Bottle Height (mm) Bottle Diameters (at locations defined in specifications sheet) Base
Number (to bottom of flange) Upper Panel Lower Panel Base Clearance
Initial Final Initial Final Initial Final Initial Final (Initial)
1 274.6 285.0 91.7 95.5 91.7 94.7 93.0 95.4 5.5
2 274.6 285.5 91.7 96.0 91.4 95.1 93.0 95.4 5.7
Average 274.6 285.3 91.7 95.8 91.6 94.9 93.0 95.4 5.6
St. Dev 0.00 0.35 0.00 0.34 0.23 0.22 0.00 0.00 0.11
Minimum 274.6 285.0 91.7 95.5 91.4 94.7 93.0 95.4 5.5
Maximum 274.6 285.5 91.7 96.0 91.7 95.1 93.0 95.4 5.7
Sample Fill Point Base Height Growth in Diameters percent) Pinch / Base Ratio
Number Drop (mm) Clearance Growth (if applicable)
Final
Perpendicularity Final
Final (percent) Upper Panel
Lower Panel Base Initial Final
1 15.5 0.8 3.8 4.2 3.3 2.6 98.6 99.3
2 17.0 0.6 4.0 4.7 4.0 2.6 98.4 99.7
Average 16.3 0.7 3.9 4.4 3.7 2.6 98.5 99.5
St. Dev 1.06 0.13 0.13 0.37 0.50 0.00 0.14 0.23
Minimum 15.5 0.0 0.6 3.8 4.2 3.3 2.6 98.4 99.3
Maximum 17.0 0.0 0.8 4.0 4.7 4.0 2.6 98.6 99.7
AP
PE
ND
IX C
S
TA
ND
AR
D A
ND
OP
TIM
ISE
D B
OT
TL
E P
RO
PE
RT
IES
244

APPENDIX D MDSC ANALYSIS RESULTS AND CRYSTALLINTY CALCULATION
245
Fig.D-1(a). Heat flow curve; and cystallinity of the optimised base design at the valley region
Fig.D-1(b). Heat flow curve; and cystallinity of the optimised base design at the valley transition

APPENDIX D MDSC ANALYSIS RESULTS AND CRYSTALLINTY CALCULATION
246
Fig.D-1(c). Heat flow curve; and cystallinity of the optimised base design at the centre region
Fig.D-1(d). Heat flow curve; and cystallinity of the optimised base design at the foot transition

APPENDIX D MDSC ANALYSIS RESULTS AND CRYSTALLINTY CALCULATION
247
Fig.D-1(e). Heat flow curve; and cystallinity of the optimised base design at the foot region
Fig.D-2(a). Heat flow curve; and cystallinity of the standard base design at the valley region

APPENDIX D MDSC ANALYSIS RESULTS AND CRYSTALLINTY CALCULATION
248
Fig.D-2(b). Heat flow curve; and cystallinity of the standard base design at the valley transition
Fig.D-2(c). Heat flow curve; and cystallinity of the standard base design at the centre region

APPENDIX D MDSC ANALYSIS RESULTS AND CRYSTALLINTY CALCULATION
249
Fig.D-2(d). Heat flow curve; and cystallinity of the standard base design at the foot transition
Fig.D-2(e). Heat flow curve; and cystallinity of the standard base design at the foot region

APPENDIX E SEM IMAGES OF THE CRACKED BOTTLE BASES
250
a
d
g
j
b
e
h
k
c
f
i
l
Fig.E-1. SEM Images of the cracked bottle base with standard design

APPENDIX E SEM IMAGES OF THE CRACKED BOTTLE BASES
251
a
d
g
j
b
e
h
k
c
f
i
l
Fig.E-2. SEM Images of the cracked bottle base with optimized design

APPENDIX E SEM IMAGES OF THE CRACKED BOTTLE BASES
252
m
p
n
q
o
r
Fig.E-2. SEM Images of the cracked bottle base with optimized design (continue)