optimisation of a transcription-translation coupled in
TRANSCRIPT

Chapter 3 RESULTS This chapter is organised along the processing steps of a coupled
transcription-translation system. We start with breaking the cells and walk via
optimisation of the in vitro system until the fractionation of the cell lysate.
3.1 Optimisation of the method for cell breakage
Liquid-based homogenisation is the most widely used cell disruption
technique for small volumes and cultured cells. One of the effective methods to
obtain cell lysate has always been a grinding of the cells together with hard and
small particles, like Alcoa – aluminium oxide (Alcoa-305) - in a mortar, until
the production of this reactive was stopped. This led us to the analysis of
existing methods for isolation of cell lysate and selection of the best. Among
others was French Press technique named for the inventor Stacey French, an
instrument used to disrupt cells. The sample (volume of 40 to 250 ml) is placed
in the bottom chamber of the machine, and the pressure on the sample is raised
to a particular level. The cells are then forced into a different chamber, while the
rapid change in depression between the two chambers causes the rupture of the
cells. Only two passes are required for efficient lysis due to high pressures of 7-
8,000 psi used with this process. The equipment is expensive, but the French
press is often the method of choice for breaking bacterial cells mechanically.
Nirenberg and Matthaei first used a mortar and pestle to grind the cells and
release the cell sap, but soon moved to the French press to create their cell-free
system of E. coli bacteria.
OOppeerraattiinngg PPrriinncciippllee ooff tthhee MMiiccrroofflluuiiddiizzeerr PPrroocceessssoorr
Microfluidics' homogenisers contain air-powered intensifier pumps
designed to supply the desired pressure at a constant rate to the product stream.
As the pump travels through its pressure stroke, it drives the product at constant
pressure through precisely defined fixed-geometry microchannels within the
interaction chamber. 44

As a result, the product stream accelerates to high velocities creating shear
rates within the product stream that are orders of magnitude greater than any
other conventional means. Pressure (17,000 psi) and shear forces are the
parameters that break the cells.
The Microfluidizer model M-110L (Figure 3.1-1) is a suitable apparatus for
producing high yields in cell rupture with minimal processing and easy
recovery. In this apparatus cell walls are ruptured by shearing forces that do not
destroy cell contents, such as ribosomes, and allow for easy separation.
Figure 3.1-1 Microfluidizer Processor M-110L. High shear fluid processing system for
lab-volume cell rupture from Microfluidics. Designations: 1 – air pressure regulator, 2 – air valve, 3 – feed reservoir, 4 – continuous flow outlet, 5 – an ice-water box, with 6 – interaction chamber where cells are ruptured, and 7 – cooling coil.
After all it is suitable for several reasons:
sample volume – a wide range can be used, from 14 ml (12 ml recovery) up
to 400 ml and/or 1 litre;
temperature of the S30 cell lysate – the pressure block can be cooled with
ice water that leaves the sample temperature at low levels: the temperature is
raised during the cell crashing from 0 to about 12°C for less than 2 min;
45

dilution – the S30 cell lysate has to be as concentrated as possible. This can
be also a limiting step, because if cell suspension is too thick it can block the
microchannel inside the pressure steel-block (interaction chamber, Figure 3.1-1,
assigned as 6). We found out that a suspension of cells with 1 ml of buffer per 1
g of cells pellet that can go through a tip of 10 ml glass pipette by gravity flow
can suffice. Therefore, the intracellular cell milieu is diluted slightly more than
2-fold.
3.2 Selection of the optimal E. coli strain for the batch system
We thought at the beginning of this project that a strain deficient in RNases
would help to obtain a high protein yield output. However, we observed that
mRNA degradation does not play a main role for the synthesis of a protein it
codes for (see section 3.6). The synthesis of mRNA goes faster than its
degradation and thus degradation does not affect the rate of protein synthesis.
For example, when we compared the E. coli strains Can/20-12E (Zaniewski et
al., 1984) with BL21, the latter was superior; Can/20-12E lacks five RNases (I-,
II-, D-, BN- and T-) and BL21 was in contrast deficient in the protease genes lon
and ompT. The lon gene codes for an aminopeptidase La, a heat shock protein
and ATP-dependent Ser protease La with broad substrate specificity that
degrades short-lived regulatory and abnormal proteins in the presence of ATP; it
hydrolyses two ATPs for each peptide bond cleaved in the protein substrate. The
ompT gene codes for an outer membrane protein T (OmpT) that is also called
protease VII. This protease can cleave T7 RNA polymerase, ferric enterobactin
receptor protein (FEP), antimicrobial peptide protamine and other proteins
preferentially between two consecutive basic amino acids (Dekker et al., 2001).
In a course of this study BL21 was used as a main source for cell-free
lysate preparations. Also, a number of protease deficient strains were selected
from the American Type Culture Collection (ATCC) and from the literature, a
brief overview of their genotypes and the corresponding sources is given in
46

Table 3.2-1. The efficiencies of the corresponding lysates will be tested after this
thesis project.
Table 3.2-1. Strains, selected for further study in cell-free system for protein synthesis.
Name Genotype Description Source References
Rosetta TM BL21 lacYZ deletion, lacks lon and ompT proteases; Camr
Six tRNAs on a plasmid: proL tRNA, leuW tRNA, argW tRNA, glyT tRNA, argU tRNA, ileX tRNA
Novagen
LC24 snoC; Tcr HA63 snoB; lon
(Huala et al., 1991)
SF120
F- ∆(lacIPOZY)X74 galE galK thi rpsL ∆PhoA(PvuII) ptr32::ΩCatR degP41(∆PstI-KanR) ∆(ompT)
Protease-deficient ATCC (Baneyx and Georgiou, 1991)
C41 (DE3) F dcm ompT hsdS (rB mB) gal λ (DE3); Ampr
C43 (DE3) F dcm ompT hsdS (rB mB) gal λ (DE3); Ampr; derivative of C41(DE3)
Protease-deficient; derivatives of E. coli B strain, BL21(DE3)
Avidis
(Miroux and Walker, 1996; Studier and Moffatt, 1986)
3.3 Batch system: in vitro coupled transcription-translation
The in vitro coupled transcription-translation system has got its name from
the fact that both processes of transcription and translation are performed in one
and the same tube. In order to obtain the protein of interest there is no need to
obtain and isolate the mRNA in a significant amount before giving it to the
translation reaction. In a coupled system there are already components for both
processes, and the only requirement is to add the gene (linear or circular DNA)
under T7 RNA polymerase promoter. Thus, transcription is performed by T7
RNA polymerase and translation is performed by ribosomes and additional
factors present in the cell extract. It may sound easy, but it is also necessary to
add the “building blocks” for either process, nucleotide triphosphates (NTPs) for
mRNA and amino acids for protein synthesis. It is also necessary to regenerate
the general energy source, which is adenosine triphosphate (ATP), as well as to
47

buffer the whole system to an “in vivo near” pH and ionic condition and to block
the activity of the intrinsic E. coli RNA polymerase in order to avoid unspecific
products. All these aspects were taken into account, adjusted and published by
several groups before (Zamecnik, 1969). Kim and Swartz, 2000 (Kim and
Swartz, 2000) published a table with final concentrations of most of the
components of the system, which seemed to us inconvenient due to the odd
concentrations, e.g. 57.2 mM HEPES instead of 60 mM (see Table 3.3-1, central
column). After the final concentration of each of the components was brought to
even numbers (Table 3.3-1, column on the right hand), stock solutions were
prepared, divided into suitable aliquots, shock-frozen and stored at –80°C. One
of our aims in optimising the batch system for in vitro coupled transcription-
translation was to determine volumes and final concentrations of mixes and
solutions to ease up the pipetting scheme and storage of stock solutions.
In general, the reaction mix has to be mixed together in a few steps. Before
I will talk about the steps I will consider the various mixes. The HEPES salts
solution (HSS) is a mixture of stable components of the system, which buffers
its pH (HEPES•KOH) and supports the ionic condition (NH4+ acetate, K+
glutamate), as well as blocks the pathway for degradation of some amino acids
(Na+ oxalate, [Kim, 2000 #14604]); it can be stored for long time at – 80°C and
is not affected by multiple thawing. The other mixture, small compound solution
(SCS), which name says already that it contains relatively small molecules -
source for energy regeneration and tRNAs, is less stable than HSS and needs
fresh preparation about every half a year. Both stock-solutions mentioned are
added to the LM-Mix together with NTPs, PEP (for ATP regeneration, too),
PEG-8000 (to create “in vivo near” viscosity of the system) and amino acids
(two of 20 amino acids, aspartic acid and tyrosine are prepared separately due to
their solubility requirements). This LM-Mix is prepared on the same day, when
the main experiment is planned and could be used for a set of reactions at once.
Still, this LM-Mix is added to the Master-Mix along with a defined
concentration of T7 RNA polymerase, Mg2+ acetate, labelled methionine (if
48

required) to detect synthesized proteins easily, and antibiotic rifampicin, which
blocks activity of the E. coli RNA polymerase molecule (β subunit, Williams
and Piddock, 1998). And still this Master-Mix is not yet a reaction, ready for
incubation, because some of the essential components are missing. To the
Master-Mix we added DNA with a gene of interest under T7 promoter and S30
cell lysate from E. coli BL21 strain. Eventually this is the reaction mix (R-Mix),
ready for protein synthesis.
Table 3.3-1 Optimisation of the final concentration of the batch cell-free system for protein synthesis.
Component Final concentration (Kim and Swartz,
2000)
Final concentration 19. Jan 02
HEPES-KOH (pH 8.2) 57,2 mM 60 mMAmmonium acetate 80 mM 80 mMPotassium glutamate 200 mM 230 mMSodium oxalate 2,7 mM 3 mMDTT 1,76 mM 2 mMCycle-AMP 0,67 mM 0.7 mMFolinic acid 34 µg/ml 35 µg/mltRNAs 340 µg/ml 350 µg/mlNADH 0,33 mM 0.35 mMCoenzyme A 0,27 mM 0.3 mMATP 1,2 mM 1.5 mMCTP 0,86 mM 1 mMGTP 0,86 mM 1 mMUTP 0,86 mM 1 mMPEG-8000 2% (w/v) 2% (w/v)Methionine 2 mM 2 mMAmino acids (19) 0.5 mM 2 mMPEP 33 mM 35 mMMagnesium acetate 15 mM 12 mMT7 RNA polymerase 30 µg/ml 100 µg/mlE. coli S30 cell lysate 4-6 A260Plasmid DNA 4 µg/60 µlRifampicin 10 µg/ml3H-Leu 1.2 µM -----35S-Met ----- 1.5 µM
49

Figure 3.3-1 gives a schematic overview of the composition of the R-Mix
together with the dilution factors (DF), which facilitate calculation of final
concentrations.
R-MixMaster-MixDNA
50 µl S30Master-Mix
LM-MixMet (fc 2 µM)
(1:50,000 35S)T7 PolymeraseRifampicin
30 µl Mg2+ acetate
LM-MixSCSHSSNTPsPEPPEG-800018 aa (fc 2mM)
12.5 µl DY (fc 0.75)
SCSDTTcAMPFolinic AcidtRNANADH
1 µl CoEnzA
HSSHEPES·KOHNH4
+ acetateK+ glutamate
5 µl Na+ oxalate
DF 1.7
DF 2.4 (4x)
DF 12.5 (50x)
DF 2.5 (10x)
Up to 300 µg GFP/(ml*90 min) in batch system
R-MixMaster-MixDNA
50 µl S30Master-Mix
LM-MixMet (fc 2 µM)
(1:50,000 35S)T7 PolymeraseRifampicin
30 µl Mg2+ acetate
LM-MixSCSHSSNTPsPEPPEG-800018 aa (fc 2mM)
12.5 µl DY (fc 0.75)
SCSDTTcAMPFolinic AcidtRNANADH
1 µl CoEnzA
HSSHEPES·KOHNH4
+ acetateK+ glutamate
5 µl Na+ oxalate
DF 1.7
DF 2.4 (4x)
DF 12.5 (50x)
DF 2.5 (10x)
Up to 300 µg GFP/(ml*90 min) in batch system Figure 3.3-1. Schematic representation of the modified Swartz & Kim in vitro system
(Kim and Swartz, 2000). The reaction mix (R-Mix) is prepared from the given stock solutions, which are added subsequently according to this scheme. Golden numbers stand for dilution factor (DF).
We started with the investigation of the parameters of the optimised
system, measuring the levels of GFPcyc3 synthesis by TCA precipitation.
Kinetics of the GFPcyc3 synthesis reflect the way this reaction goes, i.e. the
rate, as well as the extent of the protein synthesis – how soon does the system
reaches the GFPcyc3 saturation phase (Figure 3.3-2). According to our
measurements the extent of the reaction can be observed after 120 minutes,
while its rate after 15 minutes.
50

Incubation time (min)0 20 40 60 80 100 120 140 160 180
CPM
(pm
ol G
FP)
0
200
400
600
800
1000
1200
1400
1600
25
8.3
Incubation time (min)0 20 40 60 80 100 120 140 160 180
CPM
(pm
ol G
FP)
0
200
400
600
800
1000
1200
1400
1600
25
8.3
15 min (rate) 120 min (extent)15 min (rate) 120 min (extent)
Figure 3.3-2 Kinetics of the GFPcyc3 synthesis. Characterising the batch system by the rate and extent of protein synthesis reaction.
The next step was the systematic modelling of the modified Swartz system,
in order to have a reliable method to characterise the protein synthesis. The TCA
precipitation analysis results always stroke us with a high background
radioactivity counts. With the following example I will try to explain what that
means. The sample reaction without plasmid DNA template would serve as the
‘background’ for those reactions that contain DNA template for protein
synthesis. After TCA precipitation the minus DNA sample shows 400 cpm,
which is taken as a background and subtracted from the 1600 counts of the
sample with a DNA template. We looked for ways to reduce it, and examined
whether a pre-incubation would diminish the large background. For this we pre-
incubated reaction mixes in the absence of [35S]-Met extending pre-incubation
time from 10 to 30 and 90 minutes that was followed by a normal main
incubation of 120 minutes in presence of [35S]-Met (Figure 3.3-2). As the figure
shows, the background level stayed same (Figure 3.3-2, green closed circles),
indicating that it does not depend on the pre-incubation time, and the [35S]-Met
incorporation into GFPcyc3 synthesis in the presence of DNA template
decreases (Figure 3.3-2, red closed circle). A possible explanation of the high
51

background might be the transfer of methionine from the Met-tRNA to the N-
termini of proteins present in the S30 extract.
Pre-incubation time, (min)
CPM
IncorporationBackground
Pre-incubation time, (min)
CPM
IncorporationBackground
0 10 min 30 min 90 min0
500
1000
1500
2000
2500
0 10 min 30 min 90 min0
500
1000
1500
2000
2500
Figure 3.3-4 Pre-incubation of the reaction mixes in the absence of [35S]-Met. Prior the main incubation samples with and without DNA (background) were incubated for 10, 30, and 90 minutes, followed by normal main-incubation of 120 minutes. Green closed circles indicate background level, and red closed circles indicate the level of [35S].
Therefore, the large background cannot be removed by pre-incubation.
Table 3.3-2 shows that background is independent of the presence of T7 RNA
polymerase (compare cpm values of the assay #1 and assay #2, which are about
the same). The background showed also, that it is not affected much by the
presence of DNA template in the absence of the T7 RNA polymerase (i.e., no
mRNA production from the given DNA template, that results in the absence of
protein synthesis). In the presence of both T7 RNA polymerase and plasmid
DNA template the synthesis is only two fold above the background.
These data indicate that the TCA analysis is not a precise measure for this
system that should reflect both given protein synthesis levels and the quality of
the synthesised protein. If the hypothesis is correct that the background is caused
by amino acid transferases that transfer aminoacyl residue from an aa-tRNA to
the N-termini of mature proteins, we would expect the following: the
background cpm would be scattered over a large MW-range, whereas the DNA
52

template dependent protein synthesis (GFP) would lead to a focusing of the
corresponding cpm in the GFP product. Therefore, the background cpm would
not be seen on an SDS-gel in contrast to the GFP counts. Figure 3.3-5 shows
that our expectations were fulfilled: only a GFP band is seen.
Table 3.3-2 Investigation of the background in a TCA precipitation
dependency on the presence of T7 RNA polymerase.
2300++4
1275+-3
940-+2
800--1
CPM(background)
DNAplasmid
T7 RNA polymerase
Assay, No.
2300++4
1275+-3
940-+2
800--1
CPM(background)
DNAplasmid
T7 RNA polymerase
Assay, No.
– DNA + DNA– DNA + DNA
Figure 3.3-5 SDS gel with synthesised GFP scanned with PhosphoImager. Only
proteins with [35S]-Met label are seen as a defined band of the expected size coded by the added DNA template.
Another point was to improve the expressivity of the system itself in order
to obtain higher levels of active and soluble fraction of the protein of interest. A
number of approaches on this field are discussed in the sections below.
53

3.4 Quality criteria for the judgement of GFP expression
In order to characterize the activity of this cell-free system by analysing
yield and activity of the synthesized protein, we used the fluorescent protein
GFP (Chalfie et al., 1994; Prasher, 1995; Prasher et al., 1992) as a reporter
protein, because this protein is easy to handle and to detect. Another good
reason for it was that with this protein we could not only determine the total
yield, but also the active fraction of the synthesized protein. In many cases the
system can produce µg to mg amounts per ml of total protein synthesis. With
GFP it is easy to identify active fraction of native protein in respect to the total
protein synthesis. After the synthesis of GFP is finished, its fluorophore has to
be folded properly, which is a criterion for its activity. The activity is
determined by the fluorescence of GFP using ultraviolet-light (UV) excitation
(Figure 3.4-1).
1 2 3 4 5 6 71 2 3 4 5 6 7
Figure 3.4-1 Green fluorescent protein in native PAA gel exposed to ultraviolet-light
excitation. Lanes 1 and 2 contain GFPcyc3; lanes 3 and 4 – WT GFP; lanes 5 to 7 – WT GFP standard (with known concentration), in different amounts.
A reporter GFP cycle3 (GFPcyc3) has three point mutations that allow a
fast maturation within 3-4 hours, whereas WT requires maturation overnight at
4°C (Crameri et al., 1996). It was expressed from DNA plasmid for in vitro
expression (pIVEX2.2) with T7 promoter and STREP-tag at the N-terminus.
The latter one explains the different migration behaviour in the native gel as
compared to the WT. Samples of the reaction mix during incubation were
withdrawn at different time points (kinetics), and studied for rate and extent of
protein synthesis reaction.
54

3.4.1 Denaturing SDS polyacrylamide gel
Analysing the GFP band within the S30 protein pattern we were lucky to
detect that the GFP band hardly overlaps with any of the S30 extract bands. This
opened the possibility to determine the total amount of the protein synthesised in
vitro. Reference curves for the determination of the amount of synthesized GFP
were made by applying defined GFP amounts to the gels. The input variations of
the S30 reaction mixture per lane were normalized by scanning a well-defined
band from the S30 pattern and taking into account the respective pixel numbers
(see Figure 3.4-2 and Figure 3.4-3A).
1 2 3 4 5 6 7 8
*
1 2 3 4 5 6 7 8
**
GFPGFP
Figure 3.4-2 GFPcyc3 in SDS-PAAG. Lane 1 corresponds to sample in the absence of GFPcyc3 plasmid; lanes 2-7 – in the presence of GFPcyc3 plasmid; lane 8 – standard GFP. * – band used to normalize input.
3.4.2 Native polyacrylamide gel
We know already that GFP can emit green light when exited with ultra
violet waves (UV-light), and this event indicates that the protein is folded
correctly and its fluorophore is formed properly, and thus we can judge
GFPcyc3 by quality. We examined whether this property is maintained after
electrophoresis in the PAAG under non-denaturing conditions (i.e. in absence of
SDS), thus conserving its active form, and whether radiation of the gels with
UV-light will still result in fluorescence of this protein band. Indeed, in native
PAAG conditions we could detect the fluorescence of GFP in the gel (Figure
3.4-3B), and it allows estimating the concentration of active molecules when 55
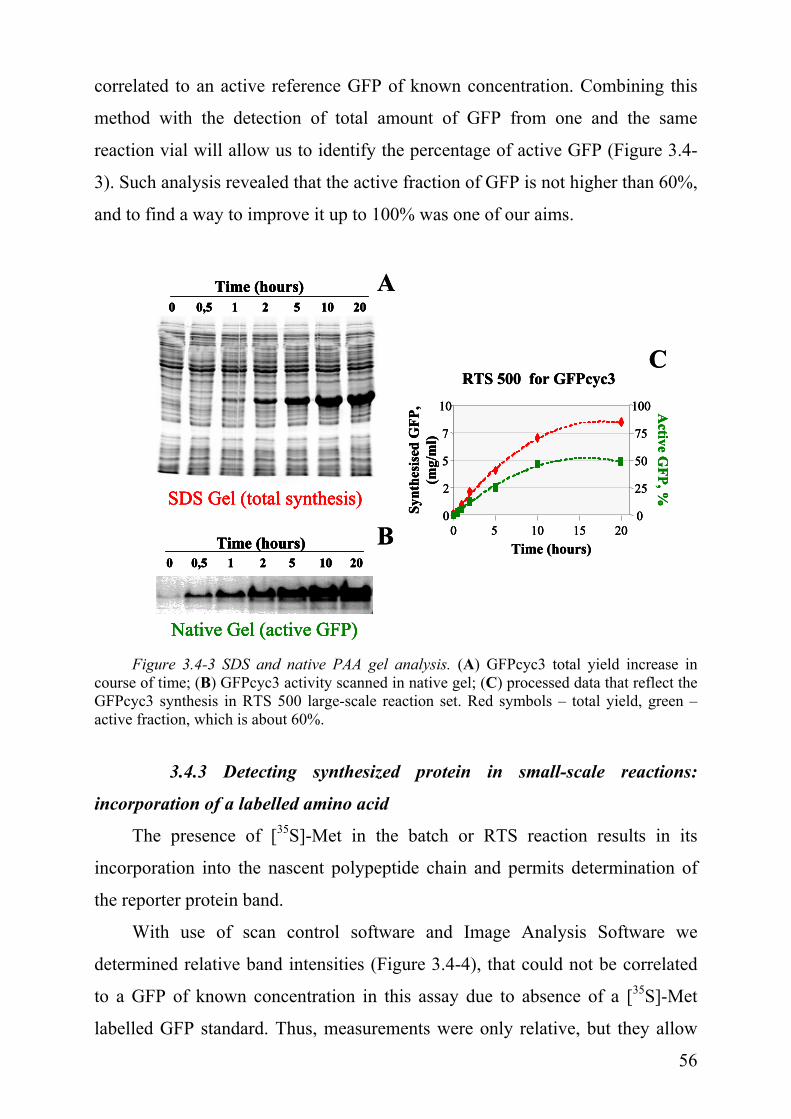
correlated to an active reference GFP of known concentration. Combining this
method with the detection of total amount of GFP from one and the same
reaction vial will allow us to identify the percentage of active GFP (Figure 3.4-
3). Such analysis revealed that the active fraction of GFP is not higher than 60%,
and to find a way to improve it up to 100% was one of our aims.
A0 0,5 1 2 5 10 20
Time (hours)
0 0,5 1 2 5 10 20Time (hours) B
CRTS 500 for GFPcyc3
Time (hours)
Synt
hesi
sed
GFP
,(m
g/m
l)
0
2
5
7
10
5 10 15 200
25
50
75
100
0
A0 0,5 1 2 5 10 20
Time (hours)
0 0,5 1 2 5 10 20Time (hours)
0 0,5 1 2 5 10 20Time (hours)
0 0,5 1 2 5 10 20Time (hours)
0 0,5 1 2 5 10 20Time (hours)
0 0,5 1 2 5 10 20Time (hours) B
CRTS 500 for GFPcyc3
Time (hours)
Synt
hesi
sed
GFP
,(m
g/m
l)
0
2
5
7
10
5 10 15 200
25
50
75
100
0
RTS 500 for GFPcyc3
Time (hours)
Synt
hesi
sed
GFP
,(m
g/m
l)
0
2
5
7
10
5 10 15 200
25
50
75
100
0
SDS Gel (total synthesis)SDS Gel (total synthesis)SDS Gel (total synthesis)SDS Gel (total synthesis)
Native Gel (active GFP)
Active G
FP, %
Native Gel (active GFP)Native Gel (active GFP)Native Gel (active GFP)
Active G
FP, %A
ctive GFP, %
Figure 3.4-3 SDS and native PAA gel analysis. (A) GFPcyc3 total yield increase in course of time; (B) GFPcyc3 activity scanned in native gel; (C) processed data that reflect the GFPcyc3 synthesis in RTS 500 large-scale reaction set. Red symbols – total yield, green – active fraction, which is about 60%.
3.4.3 Detecting synthesized protein in small-scale reactions:
incorporation of a labelled amino acid
The presence of [35S]-Met in the batch or RTS reaction results in its
incorporation into the nascent polypeptide chain and permits determination of
the reporter protein band.
With use of scan control software and Image Analysis Software we
determined relative band intensities (Figure 3.4-4), that could not be correlated
to a GFP of known concentration in this assay due to absence of a [35S]-Met
labelled GFP standard. Thus, measurements were only relative, but they allow
56

identifying fragmented proteins. This also allows analysing synthesis of a
protein, which band is overlapping with one of the S30-extract proteins and thus
cannot be detected by Coomassie staining.
1 2 3 4 51 2 3 4 5
Figure 3.4-4 [35S]-Met labelled proteins in SDS-PAAG Digitised image generated after
scanning the gel by PhosphorImager. Lane 1 – EF-Tu; lanes 2 and 3 – EF-Ts; lanes 4 and 5 – GFPcyc3.
TCA precipitation allows estimation of relative number of single protein
chains synthesised by single ribosome, since we know the specific activity of
[35S]-Met, the number of Met residues per protein molecule and the number of
70S ribosomes per aliquot (we used the relationship 1 A260 unit of S30 is 24
pmol x 0.8 ≈ 18 pmol 70S ribosomes). This method was applied, when studying
the T7 RNA polymerase mutants.
3.5 Synchronising the reactions of transcription and translation
3.5.1 Utilization of the “slow” T7 RNA polymerases (M. Dreyfus,
Paris)
As mentioned earlier an in vitro coupled transcription-translation system
utilises T7 RNA polymerase (RNAP, or transcriptase), derived from T7
bacteriophage, for mRNA transcription from the plasmid DNA, and the
machinery for translation (ribosome, factors, tRNA synthetases, etc.) from the E.
coli cell lysate.
In E. coli cells processes of transcription and translation are tightly
coupled. It is known that E. coli RNAP proceeds with a speed of ~60
nucleotides per second, and while mRNA is synthesised E. coli ribosomes 57

initiate translation on the nascent chain of mRNA and proceed with a speed of
~20 amino acids per second (Bremer and Dennis, 1996), which is ~20 codons
been deciphered per second. It follows that the first ribosome pursues
immediately the transcriptase. These facts explain the tight coupling of
transcription and translation leaving no room for a significant gap between the
transcriptase and the following ribosome. Therefore, the nascent mRNA chain
cannot form a secondary structure and thus complicate or even block translation
elongation (Iost and Dreyfus, 1995). On the other hand, ribosomes protect
mRNA from endonucleases that usually initiate the process of degradation from
the 5’ into 3’ end direction.
It is known that wild type T7 RNAP synthesises about 5 times faster than
the wild type E. coli RNAP at 37°C (Chamberlin and Ring, 1973; Lewicki et al.,
1993). Thus, using T7 transcriptase could influence tight coupling of
transcription-translation process in a cell-free system as described in the
preceding paragraph. This means that the situation now has pretty much changed
for the ribosomes. Even though they might manage to initiate on a nascent
mRNA without problems, the distance between T7 RNAP and the first
translating ribosome will dramatically increase allowing formation of secondary
structures that 70S ribosomes are not capable to resolve. The result is that
ribosomes are stalled on the mRNA.
To overcome such a dissonance in this system, Prof. Dr. M. Dreyfus kindly
provided us T7 RNAP mutants (Figure 3.5.1-1) that might solve the problem.
All constructs coding for T7 RNAPs are derivatives of pBH1161 (He et al.,
1997) and therefore they all encode the transcriptase with a His6 tag. Besides the
wild type enzyme, these plasmids encode the following polymerases:
I810S – single mutant with substitution of isoleucine into serine in position
810, (Bonner et al., 1994; Bonner et al., 1992), a very slow RNA polymerase
(1/6 as fast as WT in vitro; Bonner et al., 1994), due to a relatively severe active
site mutation. This enzyme is hardly faster than the E. coli RNA polymerase, but
it is very poorly processive, which limits its usefulness.
58

P266LP266L
I810SI810S
Figure 3.5.1-1 Structure of a transcribing T7 RNA polymerase initiation complex (Cheetham and Steitz, 1999). Blue colour indicates the T7 RNAP molecule; double helix represents the unwound DNA (green and red chains). Arrows direct the point mutation sites, isoleucine 810 to serine, and proline 266 to leucine.
I810S/P266L – double mutant, has the same active-site mutation and an
additional mutation that is located far apart from the active site – a conserved
proline at position 266 is substituted into leucine. As a result of this secondary
mutation, the processivity is greatly improved.
I810N/P266L – where the I810N mutation appeared as a by-product of
mutagenesis on I810S. According to estimates, this enzyme is ca. 2.5-fold
slower than WT (this is an in vivo measurement; see (Iost et al., 1992; Makarova
et al., 1995), but the cases examined in the in vivo and in vitro rate
measurements are consistent), i.e. the active site change is less severe in this
case than in the I810S case. In association with P266L, I810N may represent a
useful compromise between the reduction of speed, and the maintenance of a
high processivity.
P266L – this enzyme carries only the mutation increasing processivity. It is
more active than the WT.
Taking into account the information about the T7 RNAP mutants we
expected that the double mutant I810N/P266L would enable “in vivo near” tight
coupling, resulting in the prevalence of a completed protein chains and
fragmentation decrease. First we analysed the T7 RNA polymerase mutants for 59

mRNA production in the batch system with small-scale reactions using [35S]-
Met for GFPcyc3 detection in order to identify, whether there is any difference
in the protein yield. From the results summarized in Table 3.5.1-1, based on
TCA precipitation and relative number of molecules synthesised by single
ribosome (assuming that 30% of the ribosomes were active), we could identify
that:
(i) GFP synthesis by ribosomes from an mRNA transcribed by P266L
mutant was about the same as compared to the wild type;
(ii) translation in the presence of the I810S T7 RNAP mutant resulted in
two-fold decrease of GFP synthesis, compared to the wild type, and
so was the translation of mRNA from I810S/P266L double mutant –
in this case it may be due to severe active site mutation as reported
above, which could result in defective or abortive mRNA transcripts;
(iii) translation in the presence of another double mutant, I810N/P266L,
was just slightly improved above the discussed mutants.
Table 3.5.1-2 Activity of the T7 RNAP mutants in a batch system: [35S]-Met incorporation and TCA precipitation results.
Mutant activity (GFP per ribosome)wt 3.8I810S 1.7P266L 4.1I801S/P266L 1.8I810N/P266L 2.3
Reaction volume – 50 µl; samples were withdrawn after 15 min of incubation at 37 °C.
Taking into account these date we selected T7 RNAP double mutants as
objects for further investigation, and the WT T7 polymerase as a control. We
checked whether the mutant T7 polymerases can improve the ratio active- /
total- GFP synthesis. We note that from this kind of assay we cannot judge the
activity of GFP molecules. To investigate both the total yield and the active
fraction we performed the following experiment, where we increased the
60

reaction volume to 1 ml and run it in a special vial, where the reaction chamber
is supplied by building blocks from the feeding chamber (10 ml) through a
semipermeable membrane.
A B
CT7I810S/P266L
T7I810N/P266L T7
WT
GFP
1 2 3
controlGFP
WT
T7I810N/P266L
T7I810S/P266L
1 2 3 4
GFP synthesis in 10h
I810S/P266LI810N/P266L
WT
T7 RNA polymerase
mg/
ml
0
2
4
SDSNative
A B
CT7I810S/P266L
T7I810N/P266L T7
WT
GFP
1 2 3
controlGFP
WT
T7I810N/P266L
T7I810S/P266L
1 2 3 4
T7I810S/P266L
T7I810N/P266L T7
WT
GFP
1 2 3
T7I810S/P266L
T7I810N/P266L T7
WT
GFP
1 2 3
controlGFP
WT
T7I810N/P266L
T7I810S/P266L
1 2 3 4
controlGFP
WT
T7I810N/P266L
T7I810S/P266L
1 2 3 4
GFP synthesis in 10h
I810S/P266LI810N/P266L
WT
T7 RNA polymerase
mg/
ml
0
2
4
SDSNative
GFP synthesis in 10h
I810S/P266LI810N/P266L
WT
T7 RNA polymerase
mg/
ml
0
2
4
SDSNativeSDSNative
SDS gelSDS gelSDS gelSDS gel
Native gelNative gelNative gelNative gel
Figure 3.5.1-2 Fed-batch large-scale synthesis of GFP, (not RTS). T7 RNAP WT and slow mutants after 10h of incubation: SDS (A), and native (B) PAA gels, and comparison between total (red) and active (green) protein yield (C).
When GFPcyc3 gene was expressed in the large-scale reactions, its
production from the mRNA transcribed by the double mutant I810N/P266L
wins over GFPcyc3 production from mRNA molecules synthesised by the other
double mutant I810S/P266L, for GFPcyc3 expression (compare lanes 1 and 2,
Figure 3.5.1-2A). Both double mutants still run drastically behind in GFPcyc3
yield from the mRNA transcribed by the WT T7 RNAP (compare lanes 2 and 3,
Figure 3.5.1-2A). In spite of the enormous difference in total yields seen with
61

the mutants versus wild-type T7 polymerase, the level of the active GFPcyc3
synthesized in the presence of the I810N/P266L mutant hardly differs to that in
the presence of WT T7 RNAP (lanes 2 and 3 in Figure 3.5.1-2B; compare also
red and green bars in Figure 3.5.1-2C). This means, that if the condition for tight
coupling of transcription-translation processes is kept as “in vivo near”, then
even the protein folding is affected positively: the level of active GFPcyc3 is
almost 100% (Figure 3.5.1-2C).
3.5.2 Varying the temperatures of incubation
Protein folding is a hierarchic process, sometimes pictured as an inverted
funnel, in three fundamental stages. All proteins begin with a primary amino
acid sequence, which folds into intermediate secondary shapes comprising the
well known α helices and β sheets, and then into the final tertiary, or native
form, in which they fulfil their function. Some proteins undergo a further phase,
combining with other folded proteins to form quaternary structures.
In vivo expression of proteins often leads to inactive products. The reason
is the following: if the synthesis of a single protein is so intensive that
hydrophobic patches of neighboured nascent chains can contact before being
buried and thus shielded inside the protein structure, the nascent chains will
aggregate and eventually form inclusion bodies.
Decrease of incubation temperature slows down processes in cells (Lewicki
et al., 1993) and in cell-free systems, and the process of folding is among them.
We carried out GFPcyc3 synthesis in RTS 100 and 500 under 37°C, 30°C, 25°C
and 20°C to examine the effect on the protein synthesis (total yield), as well as
on the amount of active protein molecules in this yield (active fraction). The
results are summarized in Figure 3.5.2-1, where the left panel (Figure 3.5.2-1A)
presents the comparison of total GFPcyc3 synthesis and a fraction of active
GFPcyc3 at different temperatures. It is clearly seen that at 30°C the total
fraction goes up to 2 mg/ml while the active fraction is about 60% of it, and as
the incubation temperature was changed to 37°C the amount of active GFP cyc3
62

fraction is significantly reduced to less than 50% (0.6 mg/ml from 1.6 mg/ml of
total protein). Decrease in temperature reduces the total yield of GFPcyc3 to 1
mg/ml at 25°C and to 0.6 mg/ml at 20°C, but for these cases almost 100% of
GFP was active. There is a clear effect of temperature decrease both on the
amount and quality of GFP, with best output of active fraction for 20°C where it
reaches 100% (Figure 3.5.2-1B).
Synthesis of GFPcyc3
0
0,5
1
1,5
2
2,5
37°C 30°C 25°C 20°CTemperature
GFP
(mg/
ml)
Total GFPActive GFP
Active fraction
0
25
50
75
100
37°C 30°C 25°C 20°CTem perature
activ
e fr
actio
n, %
C
A B
( )
37 30 25 20
Temperature [°C]
0
25
50
75
100
Active
fraction, %
Synthesis of GFPcyc3
0
0,5
1
1,5
2
2,5
37°C 30°C 25°C 20°CTemperature
GFP
(mg/
ml)
Total GFPActive GFP
Active fraction
0
25
50
75
100
37°C 30°C 25°C 20°CTem perature
activ
e fr
actio
n, %
C
A B
( )
37 30 25 20
Temperature [°C]
0
25
50
75
100
Active
fraction, %
C
( )
37 30 25 20
Temperature [°C]
0
25
50
75
100
Active
fraction, %
Total synthesis and active fraction of GFPcyc3Total synthesis and active fraction of GFPcyc3Total synthesis and active fraction of GFPcyc3
0
1
2
Tot
al G
FP,
mg/
ml
0
1
2
Tot
al G
FP,
mg/
ml
0
1
2
Tot
al G
FP,
mg/
ml
Figure 3.5.2-1 The effect of the temperature for incubation in RTS 500 on the active fraction of GFP. (A) comparison of the temperature effect on total protein synthesis and active fraction for different temperatures; (B) comparison of the behaviour of active fraction for different temperatures; (C) dependency curves of total yield (red) and active fraction (green) levels on the incubation temperature (X-axis).
Though the amount of GFPcyc3 goes down, the level of its activity
significantly goes up (Figure 3.5.2-1C). In following experiments an incubation
temperature of 20°C was often used as an alternative to incubation at 30°C.
63

3.6 An endeavour to increase the outcome of the given protein
3.6.1 Prolongation of the half-life of the mRNA: pseudo-circulation
(J. Remme, Tartu)
In order to identify, whether the stability of a given mRNA in such an in
vitro system is a critical factor for the expression of a given protein, we tested
the expression of GFP from two different constructs described bellow, versus
expression from pIVEX2.2GFPcyc3 (as a 100% control).
The idea for constructs mentioned came from literature data that point at
the difference of stability for various RNAs in E. coli (or any) cells. Usually, the
most stable RNAs against the activity of endonucleases are ribosomal ones
(rRNAs). Half-life of naked rRNAs before assembly is longer due to pseudo-
circulation, which is achieved by stem formation between 5’ and 3’ end of, for
example, 23S rRNA (Figure 3.6.1-1). The spacer regions flanking the mature
RNA sequences are also highly conserved. Precursor sequences at the 5’ end
and 3’ end of 16S and 23S rRNA contain complementary sequence tracts that
form strong base-paired stems enclosing the sequence of the mature species. The
146 nucleotides upstream of 16S rRNA include 131 involved in stem formation.
Those and the 43 nucleotides immediately following mature 16S rRNA are
identical in the four operons studied. The stem bracketing 23S rRNA involves
114 nucleotides on the 5’ side and 71 nucleotides 3’ to the 23S rRNA, and
actually includes eight base pairs involving the 5’ and 3’ terminal nucleotides of
mature 23S rRNA (see (Srivastava and Schlessinger, 1990) and references
within).
64

Figure 3.6.1-1 Schematic structure of an rrn operon and major processing steps for the
16S and 23S rRNA. The drawing is not to scale. Primary processing cleavages by RNase III (3, 4, 7, 8, and 9), and secondary processing to produce the mature termini of 16S rRNA (1, 5’ end, and 2, 3’ end), 23S rRNA (10, 5’ end, and 11, 3’ end), and 5S rRNA (12). The RNase P cleavage site (5) is shown at the 5’ end, and RNase E site (6) at the 3’ end of the tRNAs. Solid lines indicate mature 16S and 23S rRNA sequences; a hatched line indicates other precursor sequences (Srivastava and Schlessinger, 1990). In E. coli processing at the ends of the mature 16S and 23S rRNAs is coupled, since base pairing is required to generate the RNase III cleavage sites.
The stability determinant of pre-23S rRNA was used to increase the
stability of mRNA (Liiv et al., 1996). To this end, GFP gene was inserted into
rRNA coding sequence (Figure 3.6.1-2).
Figure 3.6.1-2 Map of pT7-3GFPA5 construct.
65

Ability of the chimerical RNA (5' region of 23S rRNA - GFP coding
sequence - 3' region 23S rRNA) to form the processing stem was tested in vitro
according to RNase III cleavage. This enzyme is known to recognize
specifically and to cleave the processing stem (double helix) at position –7 in
respect of 5' terminus of 23S rRNA. RNase III cleavage at position –7 was
detected by reverse transcriptase primer extension. In order to test the specificity
of the processing stem formation, the mutation V20 was introduced into 5'
spacer sequence. This mutation blocks the formation of the double helix in the
pre-23S rRNA (Liiv and Remme, unpublished).
The results of RNase III cleavage performed by the Remme group clearly
showed that the processing stem is specifically formed in the chimerical
constructs where both 5' and 3' spacers were present. Therefore, it is evident that
the processing stem of 23S rRNA can be used to prepare pseudo-circular
mRNA.
These complementary sequences used in the constructs from the Remme
group to flank GFP sequence should result in stem formation and pseudo-
circulation of mRNA molecule. This, in turn, should prolong the half-life of
mRNA and, thus, its recycling by the ribosomes should possibly result in
increase of the protein yield. This is the idea for construct named pXB-
GFP∆A5. Another construct, made as a control and named pXB-GFP∆V20
carries a 20-nucleotide insert that disrupts complementarity between flanking
sequences and does not produce a pseudo-circulated mRNA molecule, which, in
turn, should be readily degraded and, as a result, should have poor or zero level
of GFP synthesis.
Unexpectedly, both constructs yielded about the same total level of
GFPcyc3 (Figure 3.6.1-3B), which is about twice less as the synthesis of GFP
from our control plasmid, pIVEX2.2-GFPcyc3 (Figure 3.6.1-3A).
66

pIVEX2.2-GFPcyc3
pXBGFP-A5 (stable sec.str.)
pXBGFP-A5V20 (control, unst.)
0 0,5 1 2 5 10 20Total synthesis
A
Time (hours)
Con
cent
ratio
n of
G
FP,(
mg/
ml)
0
2
4
6
8
0 10 20
cyc3A5V20
B
pIVEX2.2-GFPcyc3
pXBGFP-A5 (stable sec.str.)
pXBGFP-A5V20 (control, unst.)
0 0,5 1 2 5 10 20Total synthesis
pIVEX2.2-GFPcyc3
pXBGFP-A5 (stable sec.str.)
pXBGFP-A5V20 (control, unst.)
0 0,5 1 2 5 10 20Total synthesis
A
Time (hours)
Con
cent
ratio
n of
G
FP,(
mg/
ml)
0
2
4
6
8
0 10 20
cyc3A5V20
Time (hours)
Con
cent
ratio
n of
G
FP,(
mg/
ml)
0
2
4
6
8
0 10 20
cyc3A5V20
cyc3A5V20
B
Figure 3.6.1-3 Synthesis of GFPcyc3 from pIVEX2.2, pXBGFP∆A5, and pXBGFP∆A5-
V20 constructs in a fed large-scale reaction, SDS gel. (A) GFPcyc3 total synthesis analysed in SDS gel; (B) chart comparison of the levels of GFP total synthesis.
Obviously, the half-life of mRNA is not a limiting factor in our coupled
transcription-translation system. Therefore, we decided to study the fate of
mRNA during protein synthesis in the next experiment.
3.6.2 Fate of the transcribed mRNA during the protein synthesis
In order to identify what is the fate of mRNA molecule we measured in
parallel the mRNA synthesized in the system via Northern blot, the total yield of
GFP protein and its active fraction via polyacrylamide gel analysis. First, the
study of the behaviour of mRNA transcripts (by Northern blot analysis), and
GFP synthesis during incubation for 25 hours in the large-scale reaction system
(RTS 500) from one and the same tube revealed that after one hour the mRNA
amount decreases (Figure 3.6.2-1, lane corresponding to the second and fifth
hours), whereas the rate of GFP synthesis is maximal until the seventh hour.
67

1.5 0 7 10 150,5 1 5Time (hours)
T7-mRNA (pmol/µl)
252022.5 3.5
GFPmRNA
1.5 0 7 10 150,5 1 5Time (hours)
T7-mRNA (pmol/µl)
252022.5 3.5
GFPmRNA
Figure 3.6.2-1 Northern blot describing levels of mRNA synthesis in the course of 25
hours of incubation for RTS 500 large-scale reaction. On the very left first three lanes represent pure mRNA transcripts of GFPcyc3 gene by T7 RNA polymerase. The other lanes are reaction samples from one and the same reaction vial taken at different time point, indicated above, (hours). The two bands above the GFP mRNA are products of incomplete transcription termination.
When the amount of GFP saturates, the rate of mRNA synthesis recovers,
which is after the seventh hour of incubation (Figure 3.6.2-2) clearly saying that
NTPs are not limiting the reaction of transcription. These results confirm that
synthesis of mRNAs or their half-lives are not limiting factors for protein
synthesis in our system.
0
330
660
1000
0 0.5 1 2 5 7 10 15 20 25Time (hours)
GFP
con
cent
ratio
n (p
mol
/µl)
0
0.6
1.2
1.8 mR
NA
concentration (pmol/µl)
Total fraction of GFPActive fraction of GFPmRNA
( )
( )
0
330
660
1000
0 0.5 1 2 5 7 10 15 20 25Time (hours)
GFP
con
cent
ratio
n (p
mol
/µl)
0
0.6
1.2
1.8 mR
NA
concentration (pmol/µl)
Total fraction of GFPActive fraction of GFPmRNA
Total fraction of GFPActive fraction of GFPmRNA
( )
( )
Figure 3.6.2-2 Tendency of mRNA and protein synthesis (total and active) in the RTS
500 large-scale reaction. Closed blue triangles represent behaviour of mRNA that is rapidly synthesised during first few hours, in contrast to the protein synthesis (both, total (red) and active (green) fractions). mRNA notably reduces during the time when protein synthesis is actively going (time points between two and seven hours), and goes up again as soon as protein synthesis level stabilises (after seventh hour).
68

3.6.3 Prevention of amino-acid shortage during the protein synthesis
As it was discussed in the Introduction already, Kim and Swartz reported
that some of the twenty amino acids, namely arginine, cysteine, and tryptophan
were metabolised in an in vitro cell-free system even in the absence of protein
synthesis and therefore the shortage of these amino acids could impair protein
synthesis (Kim and Swartz, 2000).
This encouraged us to add a mixture all twenty amino acids after five hours
of incubation. The following Figure 3.6.3-1 presents the outcome of an amino
acid addition that was analysed for total GFPcyc3 synthesis, and where samples
were withdrawn before amino-acid addition and after (arrow, red line and
squares), and compared to those of the reaction where no addition was made
(blue line and diamonds). Indeed, a burst of protein synthesis is seen after the
amino acids addition.
The next experiment was performed to observe the influence of the
addition of the mixture of amino acids on total protein synthesis and active
fraction of GFPcyc3 at different temperatures.
0
3
6
9
0 0.5 1 2 5 10 15 20 25 30 40
Time (hours)
GFP
con
cent
ratio
n (m
g/m
l)
1x Amino acids2x Amino acids
Amino acids2nd addition
( ) 30°C
0
3
6
9
0 0.5 1 2 5 10 15 20 25 30 40
Time (hours)
GFP
con
cent
ratio
n (m
g/m
l)
1x Amino acids2x Amino acids1x Amino acids2x Amino acids
Amino acids2nd addition
( ) 30°C
Figure 3.6.3-1 The effect of the second addition of the amino acids mix. After five hours
of incubation a mixture of twenty amino acids was added (arrow).
69

Figure 3.6.3-2 presents the (i) comparison of GFP synthesis with and
without a second addition of amino acids; this was performed at 30°C and 20°C;
(ii) relation between total protein synthesis (blue bars) and level of active
fraction (green bars) within one the mentioned conditions is also shown. This
assay shows that indeed both decrease of incubation temperature to 20°C and a
second addition of the mixture of all twenty amino acids improve the yield for
about 20%. Furthermore, the GFP synthesized was 100% active!
0
2
4
6
8
30°C (-AA) 30°C (+AA) 20°C (-AA) 20°C (+AA)
GFP
con
cent
ratio
n (m
g/m
l) Total synthesis
Active fraction
3723
71
93
0
2
4
6
8
30°C (-AA) 30°C (+AA) 20°C (-AA) 20°C (+AA)
GFP
con
cent
ratio
n (m
g/m
l) Total synthesis
Active fraction
3723
71
93
Figure 3.6.3-2 The effect of the second addition of the amino acids mix and decrease in
temperature for incubation. A mixture of twenty amino acids was added as described (assigned with plus in brackets); large green numbers above indicate percentage of GFPcyc3 active fraction.
3.7 An attempt to improve the expression of eukaryotic genes in E. coli
system
3.7.1 Addition of the tRNA fraction of the Rosetta TM strain
(Novagen)
The Rosetta™ (DE3) strain is derived from lacZY mutant of BL21 (lon and
ompT proteases deletion), to enable precise control of expression levels by
70

adjusting the concentration of IPTG. This strain was designed to alleviate codon
bias when expressing proteins of eukaryotic origin in E. coli.
When the mRNA of heterogeneous genes is over-expressed in E. coli,
differences in codon usage can impede translation due to the demand for one or
more tRNAs that may be rare or lacking in the population (Baca and Hol, 2000;
Goldman et al., 1995; Kane, 1995). It has been well established that insufficient
tRNA pools can lead to translational stalling, premature translation termination,
translation frame-shifting and amino acid misincorporation (Kurland and
Gallant, 1996).
Six tRNAs were introduced into the commercially available Rosetta strain
that carries the pRARE plasmid with the corresponding tRNA genes: proL
tRNA, leuW tRNA, argW tRNA, glyT tRNA, argU tRNA, ileX tRNA. Under the
IPTG induction these tRNA species are overexpressed in bacterial cell and their
pool could be normalized to that of eukaryotes. The plasmid carries a
chloramphenicol resistance (Figure 3.7.1-1).
Figure 3.7.1-1 Map of pRARE plasmid family The basic structure of pRARE is
indicated. pLysSRARE and pLacIRARE contain the genes encoding T7 lysozyme (LysS) and lac repressor (lacI), respectively. Also indicated are chloramphenicol resistance gene (Cam), replicon (P15A ori) and tRNA genes. tRNA genes corresponding to rare codons in E. coli are indicated in blue.
71

We isolated tRNAs from the Rosetta strain on a analytical scale after
induction and checked two of them, which were predicted to be over-expressed.
We selected tRNALeu and tRNAIle against the non-overexpressed tRNAVal used
as a control and performed a charging assay (amino acylation) with either [14C]-
Leu or [14C]-Ile versus [3H]-Val amino acids. The ratio (cpm [14C]/cpm [3H])
derived from the Rosetta cells (overexpression) versus the ratio derived from
wild-type cells reflects the degree of tRNA overexpression. With this assay we
observed that the ratio tRNALeu/tRNAVal in the Rosetta strain is about twice as
high as in wild type E. coli (= tRNAbulk; 3.7 versus 1.7) indicating that tRNALeu
is twice as much abundant in the Rosetta strain as in the wild-type E. coli (Table
3.7.1-1).
Table 3.7.1-1 Charging of Rosetta tRNA with either [14C]-leucine or [14C]-isoleucine versus tRNAbulk with [3H]-valine.
[14C]-Leu [3H]-Val
[14C]-Ile [3H]-Val
tRNAs (Rosetta) 3.7x 0.85x tRNAbulk (E. coli) 1.7x 0.93x
In contrast, the tRNAIle/tRNAVal ratios are about the same (0.85 and 0.93)
indicating that Ile was not overexpressed in contrast to the claim of the plasmid
producer Novagen.
For this reason we have a hesitation for overall usage of this strain for
expression of eukaryotic genes, whether in vivo or in vitro.
3.8 Investigation of the fragmentation of a given protein
An object for this study was E. coli translational elongation factor EF-Tu,
where Tu stands for temperature unstable property of this protein, because it
denatures easily during and after purification. Furthermore, when it is translated
in vitro, in addition to the mature protein band a few fragments are observed
(Figure 3.8-1B, fragments assigned as 1 and 2).
72

As a control for a protein that is not fragmented, we used another E. coli
translational elongation factor EF-Ts, for it is relatively stable towards
temperature increase. Both factors were cloned into pET23c(+) vector, that has a
T7 promoter, using Nde I and Xho I restriction enzymes (Materials and Methods,
Figure 2.6.1-2 for vector map, page 32; part 2.6.3 for cloning strategy, page 35).
1 hour
EF-
Tu
EF-
Tu
5 hours
EF-Tu synthesis at 30°C
A
(band intensities):
EF-
Ts
EF-
Ts
3
21
B
1 hour
EF-
Tu
EF-
Tu
5 hours
EF-Tu synthesis at 30°C
A
(band intensities):
EF-
Ts
EF-
Ts
3
21
B
GFP
c3
GFP
c3
GFP
c3
GFP
c3
Fragmentation index
1+2 1+2+3 = 0.16
0.160.04
Fragmentation index
1+2 1+2+3 = 0.16
0.160.04
Figure 3.8-1 Synthesis of EF-Tu at 30°C with [35S]-Met incorporation. Samples analysed after 1 hour (A) and 5 hours (B) of the reaction run start. Number 3 corresponds to the mature EF-Tu protein, number 2 and 1 correspond to the fragments of EF-Tu on the EF-Tu panel. Arrows indicate bands taken for calculation of the fragmentation index (F.I.) expressed by a formula shown in red frame. Red numbers represent the calculated F.I.
As a control for the efficiency of expression level, we used standard
GFPcyc3 plasmid DNA. Expression of all three genes was carried out in RTS
100 small-scale reactions, incorporating [35S]-Met, in order to monitor
fragmentation levels. When expression reactions were incubated at 30°C,
samples for SDS-PAAG analyses were withdrawn for two time points, after one
and five hours of the reaction incubation. We observed that at the early stage of
incubation (1 h) the fragmentation level of EF-Tu was relatively low (Figure
3.8-1A), and after the reaction stop four distinct bands were observed, one of
which corresponded to the EF-Tu full-length protein and another three were
fragments of the EF-Tu (Figure 3.8-1B). We selected two lower bands, indicated
with numbers 1 and 2 on Figure 3.8-1B, and the band corresponding to mature 73

EF-Tu was indicated with number 3, to calculate the fragmentation index – a
measure of the level of fragmentation for this protein (Figure 3.8-1B) based on
band intensities. The yield of GFPcyc3 synthesis was used as a control for a
mainly non-fragmented protein.
If temperature via, e.g. proteases, were the main reason for the
fragmentation of EF-Tu, then reduction to 20°C should result in the reduction of
fragmentation level (lessened number of fragments and their amount), as well as
an increase to 37°C would result in the increase of fragmentation level (more
fragments in number and amount). We therefore ran the next expression
reactions at different incubation temperatures. We observed that level of
fragmentation was lower at the beginning of each reaction (Figure 3.8-2, a 2
hours (A) and a 40 min (B) panels). Another thing that we observed was that at
37°C EF-Tu full-length protein synthesis increased (relative to GFPcyc3
synthesis) compared to that at 20°C, as well as that the number of fragments and
amount of each had increased, too. In order to understand relative EF-Tu full-
length protein synthesis level we compared its band intensity to that of
GFPcyc3, at different incubation temperatures.
EF-Tu synthesis at 37°C40 min 4 hours
3
21
EF-Tu synthesis at 20°C2 hours
3
21
8 hoursA B
EF-
Tu
EF-
Ts
EF-
Tu
EF-
Ts
EF-
Tu
EF-
Ts
EF-
Ts
EF-
Tu
EF-Tu synthesis at 37°C40 min 4 hours
3
21
3
21
EF-Tu synthesis at 20°C2 hours
3
21
3
21
8 hoursA B
EF-
Tu
EF-
Ts
EF-
Tu
EF-
Ts
EF-
Tu
EF-
Ts
EF-
Ts
EF-
Tu
0.05 0.080.070.04 0.05 0.080.070.04
GFP
c3
GFP
c3
GFP
c3
GFP
c3
GFP
c3
GFP
c3
GFP
c3
GFP
c3
Figure 3.8-2 Investigating the temperature affect on the synthesis of EF-Tu. Synthesis of elongation factors and GFP: (A) at 20°C during eight hours, and (B) at 37°C during four hours. Red numbers indicate the fragmentation index.
74

The lower the number the lower the fragmentation is (Figure 3.8-2 and
Table 3.8-1, F.I. grey row). Production of EF-Tu is better at 37°C, though for
both, 20°C and 37°C EF-Tu full-length protein yield increases twice as much at
the end of incubation reaction (Table 3.8-1, last row EF-Tu/GFP, compare
values within green and red columns). The level of fragmentation is relatively
the same at any incubation temperature tested here (Table 3.8-1, EF-Tu column,
compare values of the grey row). We conclude that the reason for EF-Tu
fragmentation is different and not temperature-produced or dependent.
Table 3.8-1 Fragmentation index of EF-Tu at different temperatures and EF-Tu over GFPcyc3 synthesis.
20°C 30°C 37°C NAME 2h 8h 1h 5h 40 min 4h EF-Tu, mature, pxl 447672 1361372 170041 3420355 157453 1624355Frg. #1, pxl 7300 33713 2270 178573 3480 67817Frg. #2, pxl 9298 75517 4595 371541 5106 64100F.I. 0.04 0.07 0.04 0.16 0.05 0.08 EF-Tu/GFP 0.58 1.17 0.38 0.76 0.65 2.29
Data obtained from relative band intensities processed in ImageQuant and Excel software. Fragmentation index (F.I.) was calculated according to following: (Frg. #1 + Frg. #2)/(Frg. #1 + Frg. #2 + EF-Tu), all values in pixels for definite area.
The next investigation addressed the question, whether the presence of
amino-acylated tRNAPhe (tRNAPhe:Phe mixture) given in excess over all other
tRNAs would stimulate the ternary complex formation (EF-Tu•Phe-
tRNAPhe•GTP) and then prevent degradation of EF-Tu. Here, we assume that
free EF-Tu is a good target for proteases, unlike the ternary complex. To
perform this assay we needed to know the relative amount of EF-Tu synthesised,
so that we could give a tRNAPhe:Phe mixture in excess, about three times as
much as EF-Tu is expected to be synthesised during five hours of incubation in
RTS 100 small-scale reaction. The amount of Phe amino acid should also be in
excess over tRNAPhe, about four times. We know that in the RTS100 small-scale
reaction the yield of GFPcyc3 is about 500 µg/ml after five hours of incubation.
And from previous experiments, when expressed in RTS 100 small-scale
75

reaction at 30°C for five hours, we estimated that EF-Tu synthesis relative to
GFPcyc3 is ~50% after one hour of incubation and ~60% after five hours of
incubation (Table 3.8-1, EF-Tu column, see values within orange rows). This
means that ~ 250 µg/ml of EF-Tu is synthesised. The tufB gene is 1,185 nt long,
resulting in a 395 amino acids protein, which is about 44.40 kDa in molecular
weight. We assume that the upper range of EF-Tu synthesis in the system is 440
µg/ml = 440 mg/l, which is 10 pmol/µl and thus the amount of tRNAPhe we
needed is 30 pmol. This, in turn, has to be added into reaction mix (25 µl final
volume) in a volume not larger than 2.5 µl, i.e., 750 pmol of tRNAPhe in 2.5 µl,
and, in turn, the amount of Phe amino acid has to be 3000 pmol in the reaction
mix.
The following set of RTS100 small-scale reactions was planned: EF-Tu or
GFPcyc3 gene alone, in the absence of tRNAPhe:Phe mixture; EF-Tu or
GFPcyc3 gene in the presence of tRNAPhe:Phe mixture from the beginning of
reaction incubation; and EF-Tu of GFPcyc3 gene in the presence of
tRNAPhe:Phe mixture added one hour later, after the reaction incubation started
already. Samples from each reaction tube were analysed after one and five hours
of reaction incubation. Synthesised proteins were marked with [35S]-Met, same
as in previous experiments. If the EF-Tu protein in the form of ternary complex
is more stable towards fragmentation, then an extra addition of the amino
acylated tRNA would stimulate the ternary complex formation and, as a result,
reduction of fragmentation level should follow. Because previous results on the
influence of different temperatures of incubation showed little affect on the EF-
Tu fragmentation, next reactions were performed at 30°C. Here, the three-fold
excess of tRNAPhe and the phenylalanine amino acid in ratio 1:4 mixture over
expected full-length EF-Tu protein synthesised, was added either from the
beginning of reaction, or one hour later after the incubation had already started.
According to the estimation (Table 3.8-2) of the fragmentation index and overall
analysis of the full-length EF-Tu protein synthesis, presence of tRNAPhe:Phe
76

mixture had a little positive effect on the reduction of EF-Tu fragmentation
when was added one hour after incubation of the reaction had started.
Table 3.8-2 Influence of the addition of tRNAPhe:Phe mixture to the protein synthesis reaction.
Name Band int., 1 hour
EF-Tu / GFPcyc3 F.I. Band int.,
5 hour EF-Tu /
GFPcyc3 F.I.
EF-Tu 3835508.0 0.7 0.31 2832487.7 0.47 0.44 EF-Tu +, f.t.b. 1793103.4 2.9 0.39 1228826.4 0.72 0.53 EF-Tu +, a.1.h. 3568024.8 1.3 0.30 2731133.8 0.94 0.47 Data obtained from relative band intensities processed in ImageQuant and Excel software. F.I. – fragmentation index; + - stand for addition of tRNAPhe:Phe mixture; f.t.b. – from the beginning of reaction; a.1.h. – after one hour of the reaction start. Band intensities are given in pixels.
Along with results discussed above we now consider, whether
fragmentation of the EF-Tu protein might be due to activity of proteases present
in the S30 lysate. We selected three protease inhibitor mixes, described below.
The protease inhibitory (P.I.) mixes B and HP are from Serva and a Cocktail
mix is from Sigma, respectively. The P.I. mix B is aimed to protect proteins in
cell extracts isolated from prokaryotes, the P.I. mix HP to protect recombinant
His-tagged proteins, both are directed towards proteolytic activity of aspartate
proteases, metallo proteases and cysteine proteases as well as serine proteases;
and the P.I. Cocktail mix is optimised for bacterial cell use and is a mixture of
protease inhibitors with broad specificity for the inhibition of serine, cysteine,
aspartic, metalloproteases, and aminopeptidases, too.
As in previous experiments, these mixtures were added from the beginning
of reaction incubation, or one hour later, after the reaction had started already.
Samples for SDS-PAAG analyses were withdrawn after one and five hours of
incubation (Figure 3.8-3). In the case, when mixtures were added one hour later,
the samples were taken just before the addition of protease inhibitor mixes
(Figure 3.8-4A).
77

EF-Tu + P.I. f.t.b.
MixB
Mix HP
CocktailMix
GFP + P.I. f.t.b.
MixB
Mix HP
CocktailMix
Without P.I. Without P.I.
EF-
Tu
GFP
EF-
Tu
GFP
EF-Tu +P.I. f.t.b.
MixB
Mix HP
CocktailMix
GFP + P.I. f.t.b.
MixB
Mix HP
CocktailMix
A BEF-Tu + P.I. f.t.b.
MixB
Mix HP
CocktailMix
EF-Tu + P.I. f.t.b.
MixB
Mix HP
CocktailMix
GFP + P.I. f.t.b.
MixB
Mix HP
CocktailMix
GFP + P.I. f.t.b.
MixB
Mix HP
CocktailMix
Without P.I. Without P.I.
EF-
Tu
GFP
EF-
Tu
GFP
EF-Tu +P.I. f.t.b.
MixB
Mix HP
CocktailMix
EF-Tu +P.I. f.t.b.
MixB
Mix HP
CocktailMix
GFP + P.I. f.t.b.
MixB
Mix HP
CocktailMix
GFP + P.I. f.t.b.
MixB
Mix HP
CocktailMix
A B
Figure 3.8-3 Investigating the effects of the Protease Inhibitor (P.I.) mix on the
synthesis of EF-Tu. P.I. mix was added from the beginning (f.t.b.) of reaction. (A) samples analysed after one hour of reaction run. (B) Reactions were stopped after five hours of incubation.
noD
NA
noD
NA
EF-Tu
GFP
EF-Tu + P.I. a.1.h.
MixB
Mix HP
CocktailMix
GFP + P.I. a.1.h.
MixB
Mix HP
CocktailMix
A B
noD
NA
noD
NA
EF-Tu
GFP
EF-Tu + P.I. a.1.h.
MixB
Mix HP
CocktailMix
EF-Tu + P.I. a.1.h.
MixB
Mix HP
CocktailMix
GFP + P.I. a.1.h.
MixB
Mix HP
CocktailMix
GFP + P.I. a.1.h.
MixB
Mix HP
CocktailMix
A B
Figure 3.8-4 Investigating the effects of Protease Inhibitor (P.I.) mix on the synthesis of
EF-Tu, when added after one hour (a.1.h.) of the reaction incubation start. (A) samples analysed after one hour of reaction run, before P.I. mix was added. (B) Reactions were stopped after five hours of incubation.
78

The results allow one general conclusion: it looks like the addition of the
P.I. mixes abolished not only the fragments of EF-Tu, but also the synthesis of a
full-length protein (Figures 3.8-3 and 3.8-4, compare lanes in the absence of P.I.
and lanes where any of P.I. mixes was added). Obviously, components of these
mixes have negative effects on the process of protein synthesis itself and these
mixes are more recommended to be used for protein storage, when isolated from
cells. Though, considering that EF-Tu is a His-tagged protein the HP mix of
protease inhibitors is more appropriate for use. This mix also did not impair the
overall synthesis of both, EF-Tu and GFPcyc3, though reduced the yield of full-
length product compared to the samples from reactions in the absence of any P.I.
mix.
3.9 Division of the E. coli lysate into fractions that are simple in
controlling
Previous studies used total cell lysates. Ganoza et al., who used ribosome
as an “affinity matrix”, based on the fact that many of the proteins, which are
required for each step of protein synthesis, bind to 70S ribosomal particles,
described another possibility. By use of different concentrations of Mg2+ and
varying concentration of NH4+ and K+ ions it was possible to selectively elute
sets of these proteins that yielded in: each of initiation (IF1, IF2, IF3) and
elongation (EF-Tu and EF-G) factors, together with proteins that – according to
the Ganoza group – are required to reconstruct synthesis, EF-P, W, and
“rescue.” Authors found that ribosomal eluate are also enriched with each
aminoacyl-tRNA synthetase. The relative amounts of EF-Ts and EF-G are
higher in the ribosome-free (also known as S100) supernatant (Ganoza et al.,
1996).
In the course of this study we aimed to analyse protein expression with a
fractionated E. coli lysate system. Fractionation of the S30-lysate is outlined in
Figure 3.9-1.
79

Cells rupture,Debris removal = S30
Ultracentrifugation
Supernatant = Sediment =
Suspending in 1M NH4Cl(1ml per 1 g ribosomes), Ultracentrifugation
Supernatant =(High Salt Washed Proteins)
Cells rupture,Debris removal = S30
Ultracentrifugation
Supernatant = Sediment =
Suspending in 1M NH4Cl(1ml per 1 g ribosomes), Ultracentrifugation
Supernatant =(High Salt Washed Proteins)
S100 crude 70S
HSWP
S100 crude 70S
HSWP
Figure 3.9-1 Schematic representation of the fragmentation procedure. Fractions used for further analysis are indicated red.
The idea was that with three fractions instead of one compound S30
preparation the system possibly could be better monitored and controlled. We
examined the effects of the fractions in the batch system with GFPcyc3
expression. The results in Figure 3.9-2A indicate that the best yield is obtained
in the presence of all three fractions, including crude 70S, high salt washed
proteins and S100, which indicates that they all contain essential components for
the protein synthesis. In Figure 3.9-2B we present the summary of the
temperature effect in such a fractionated system.
According to the results with fractionated system, GFP synthesis in batch
system with S30 extract or in the presence of HSWP (high-salt washed proteins,
see Figure 3.9-1) together with crude 70S was similar at the incubation
temperature of 30°C (lanes 5 and 2, respectively), and about five times higher in
the presence of all fractions when incubated at 20°C (lanes 4 and 5).
80

DNAHSWPS100
70S ++--
++--
+++-
+++-
++-+
++-+
++++
++++
-+--
S30
-
--
20 °C
30 °C 1 2 3 4 5
+-++
+
++
S30
---
-
Controls
20°C
FragmentationTotal synthesis
1 2 3 4 5
GFP
norm
aliz
ed(a
.u.)
70SDNAHSWPS100
++--
+++-
++-+
++++
+--
S30
40
1
2
3
4
4-
A B
DNAHSWPS100
70S ++--
++--
+++-
+++-
++-+
++-+
++++
++++
-+--
S30
-
--
20 °C
30 °C 1 2 3 4 5
+-++
+
++
S30
---
-
Controls
20°C
FragmentationTotal synthesis
1 2 3 4 5
GFP
norm
aliz
ed(a
.u.)
70SDNAHSWPS100
++--
+++-
++-+
++++
+--
S30
40
1
2
3
4
4-
20°C
FragmentationTotal synthesis
1 2 3 4 5
GFP
norm
aliz
ed(a
.u.)
70SDNAHSWPS100
++--
+++-
++-+
++++
+--
S30
40
1
2
3
4
4-
A B
30°C 30°C 30°C
GFPcyc3
GFPcyc3
GFPcyc3GFPcyc3
GFPcyc3GFPcyc3
Figure 3.9-2 Synthesis of 2 GFPcyc3 in batch system (here, 55 µl reaction volume) with [35S]-Met incorporation. (A) SDS PAA gel analyses, in the upper panel components and their combinations are indicated. (B) Summary of SDS gel results, including fragmentation level that was calculated as total field of a lane without the GFP band vs. the GFP band alone. Panel at the bottom corresponds to components and their combination. The boxed-in components indicate, that addition of S100 greatly increases total GFPcyc3 synthesis.
Figure 3.9-2B indicates clearly that addition of S100 greatly increases total
GFPcyc3 synthesis, while in the absence of it the synthesis is as little as when
only non-fragmented S30-extract is present.
Not only non-ribosomal proteins that are found on crude 70S are important
for efficient protein synthesis in vitro, but also some additional proteins/factors
from the ribosome-free supernatant (S100), among which EF-Ts and EF-G are
probably involved (Ganoza et al., 1996).
81