optimal regular volume sampling - tu wien · optimal regular volume sampling ... keywords: volume...
TRANSCRIPT

Optimal Regular Volume Sampling
ThomasTheußl�
TorstenMoller�
MeisterEduardGroller��
Instituteof ComputerGraphicsandAlgorithms�Graphics,Usability, andVisualizationLab
ViennaUniversityof Technology SimonFraserUniversity
Figure1: CT scansof a lobsteranda tooth,representedonCartesianandbody-centeredcubicgrids(left andright images,respectively). Therepresentationvia body-centeredcubicgridsrequiresapproximately30%lesssamples.
Abstract
The classificationof volumetricdatasetsaswell as their render-ing algorithmsaretypically basedon therepresentationof theun-derlying grid. Grid structuresbasedon a Cartesianlattice arethede-factostandardfor regularrepresentationsof volumetricdata.Inthis paperwe introducea moregeneralconceptof regulargridsforthe representationof volumetricdata. We demonstratethata spe-cific typeof regular lattice- theso-calledbody-centered cubic - isableto representthesamedatasetasa Cartesiangrid to thesameaccuracy but with 29.3%lesssamples.This speedsup traditionalvolumerenderingalgorithmsby thesameratio, which we demon-strateby adoptingasplattingimplementationfor thesenew lattices.We investigatedifferentfiltering methodsrequiredfor computingthenormalson this lattice.Thelatticerepresentationresultsalsoinlosslesscompressionratiosthatarebetterthanpreviously reported.Althoughotherregulargrid structuresachievethesamesampleeffi-ciency, thebody-centeredcubicis particularlyeasyto use.Theonlyassumptionnecessaryis thattheunderlyingvolumeis isotropicandband-limited- an assumptionthat is valid for mostpracticaldatasets.
Keywords: volumedata,Cartesiangrid, closepacking,hexagonalsampling,bodycenteredcubic
1 Introduction
Differentgrid structureshave beenstudiedextensively in variousfields like chemistry[18], solid statephysics[1], condensedmat-ter physics[10] or crystallography[7]. Researchersin thesefieldshave studiedthestructureof atomsandmolecules,which areoftenplacedin a regular grid structure. This structureis optimizedforenergy states1 andresultsin coveringspaceascloselyaspossible.���
theussl,meister� @cg.tuwien.ac.at,http://www.cg.tuwien.ac.at/home/�[email protected],http://www.cs.sfu.ca/˜graphics/
1This is, of course,aseriousoversimplification.However, for almostalltheelementsthelowestenergy stateis crystalline[10].
Results in multi-dimensionalsignal processingshow that aCartesiansamplingstructureis not the most efficient one [16].Efficiency hereis measuredin termsof samplingpoints per unithyper-volume. Undertheassumptionthat thesampledfunction isisotropicandband-limitedthe resultingfrequency supportwouldbe a hyper-sphere. Hence the most efficient samplingschemewould arrangethereplicated(hyper-spherical)frequency responseasdenselyaspossiblein frequency domain.
Theproblemof how to placeasmany (hyper-)spheresaspossi-ble in a fixed(hyper-)volumeis known asthespherepackingprob-lem [14]. This hasbeenstudiedby many mathematiciansin up toquitestaggeringdimensions(ConwayandSloane[3] giveexamplesof dimensionsup to 1048584). The problemof packingspheresoptimally hasbeenstatedin 1900 by Hilbert as his now famousProblem18 [6]. It is still not solved completely. However, sev-eral regular grid structuresareknown which areoptimal. Amongtheseis the body-centeredcubic (bcc) grid, which turnsout to beparticularlyeasyto use.
In the imageprocessingcommunityit is well known that sam-pling an image on a Cartesiangrid is not optimal. By using ahexagonalsamplingschemeonecansave13.4%samples[12]. Re-searchhasbeendirectedto adaptalgorithmslike straightline gen-eration [9], distancetransformations[2], or oversampling[8] tohexagonalgrids. However, the inherentCartesianstructureof dis-playdeviceslimits theuseof hexagonalgridsfor imageprocessingsothat2D hexagonalgridsarerarelyused.
In volume visualization, or generallywhen dealing with 3Dfunctionswe arenot boundto Cartesiangrids. The representationof thefunctionwe wantto visualizecanbearbitrarily chosensincetypicallyonly two-dimensionalprojectionsof thedatasetareexam-ined.Sinceit hasbeenshown thatabccgrid canrepresentisotropic,band-limiteddataasaccuratelyasCartesiangridsusing29.3%lesssamples[4], theadvantagesof usinga bccgrid aresignificant.
In thispaperwewill show how wecantake advantageof hexag-onalsamplingin volumerendering.We outlineandproposesolu-tions for the inherentissuesof re-samplingof rectangulargridsaswell asinterpolationandgradientestimation.
Theremainderof thispaperis organizedasfollows. Wesumma-rize theresultsof hexagonalsamplingin 2D andderive anoptimal
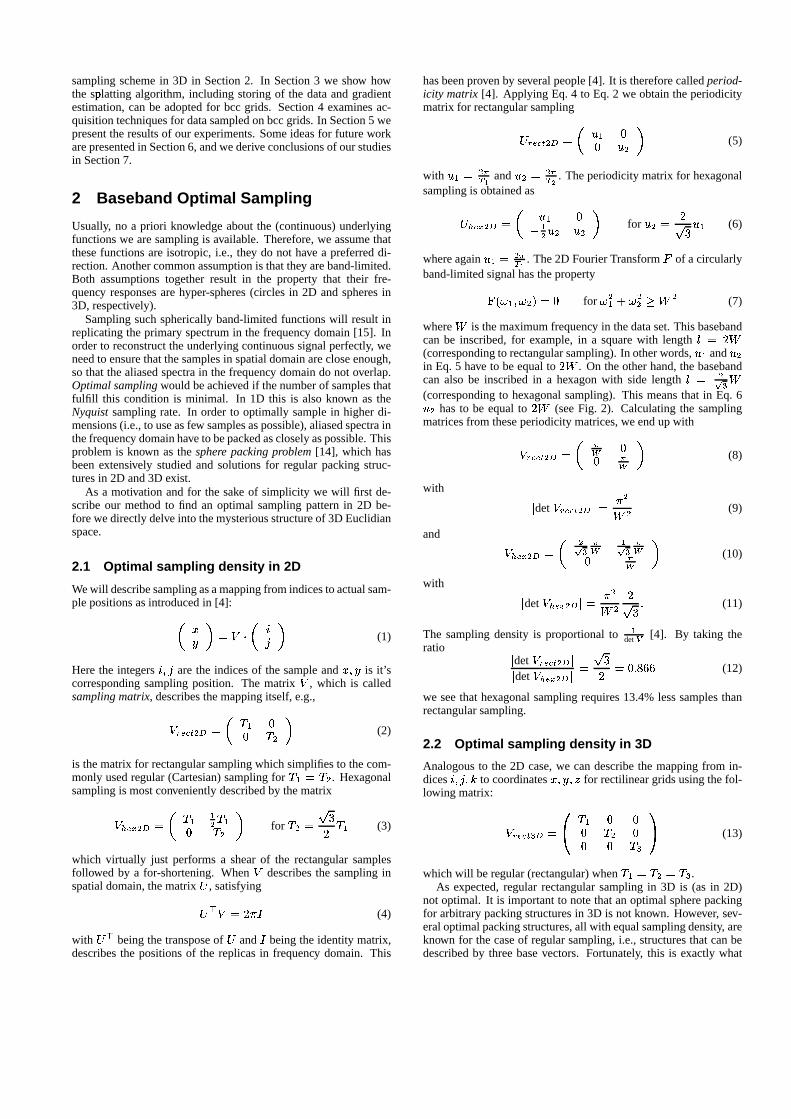
samplingschemein 3D in Section2. In Section3 we show howthe splatting� algorithm,including storingof the dataandgradientestimation,canbe adoptedfor bcc grids. Section4 examinesac-quisitiontechniquesfor datasampledonbccgrids. In Section5 wepresenttheresultsof our experiments.Someideasfor futureworkarepresentedin Section6, andwederiveconclusionsof ourstudiesin Section7.
2 Baseband Optimal Sampling
Usually, no a priori knowledgeaboutthe (continuous)underlyingfunctionswe aresamplingis available. Therefore,we assumethatthesefunctionsareisotropic,i.e., they do not have a preferreddi-rection.Anothercommonassumptionis thatthey areband-limited.Both assumptionstogetherresult in the property that their fre-quency responsesarehyper-spheres(circles in 2D andspheresin3D, respectively).
Samplingsuchsphericallyband-limitedfunctionswill result inreplicatingtheprimaryspectrumin the frequency domain[15]. Inorderto reconstructtheunderlyingcontinuoussignalperfectly, weneedto ensurethatthesamplesin spatialdomainarecloseenough,sothat thealiasedspectrain thefrequency domaindo not overlap.Optimalsamplingwould beachievedif thenumberof samplesthatfulfill this condition is minimal. In 1D this is alsoknown as theNyquistsamplingrate. In orderto optimally samplein higherdi-mensions(i.e., to useasfew samplesaspossible),aliasedspectrainthefrequency domainhaveto bepackedascloselyaspossible.Thisproblemis known asthe sphere packing problem[14], which hasbeenextensively studiedand solutionsfor regular packingstruc-turesin 2D and3D exist.
As a motivation andfor the sake of simplicity we will first de-scribeour methodto find an optimal samplingpatternin 2D be-forewedirectlydelve into themysteriousstructureof 3D Euclidianspace.
2.1 Optimal sampling density in 2D
Wewill describesamplingasamappingfrom indicesto actualsam-plepositionsasintroducedin [4]:���� ��������� �
(1)
Herethe integers��� �
arethe indicesof thesampleand�� �
is it’ scorrespondingsamplingposition. The matrix
�, which is called
samplingmatrix, describesthemappingitself, e.g.,��������� �"!# �%$'& (( $ � �(2)
is thematrix for rectangularsamplingwhich simplifiesto thecom-monly usedregular (Cartesian)samplingfor
$ & $ �. Hexagonal
samplingis mostconvenientlydescribedby thematrix�*) �,+��"! � $'& &� $'&( $ � �for
$ �- /. 01 $'&(3)
which virtually just performsa shearof the rectangularsamplesfollowed by a for-shortening.When
�describesthe samplingin
spatialdomain,thematrix 2 , satisfying243 �5 17698(4)
with 2 3 beingthetransposeof 2 and8
beingtheidentity matrix,describesthe positionsof the replicasin frequency domain. This
hasbeenprovenby severalpeople[4]. It is thereforecalledperiod-icity matrix [4]. Applying Eq.4 to Eq. 2 we obtaintheperiodicitymatrix for rectangularsampling2 �:�;�,� �"! �=<�& (( < � �
(5)
with< & �,>?A@ and
< � �,>?�B . Theperiodicitymatrix for hexagonalsamplingis obtainedas2 ) �,+��"! � <�& (C &� < � < � �
for< �D 1. 0 <�&
(6)
whereagain<�& �,>?E@ . The2D FourierTransformF of a circularly
band-limitedsignalhasthepropertyGIHKJ &L� J �NM (for
J �&PO J ��RQTS �(7)
where
Sis themaximumfrequency in thedataset.Thisbaseband
can be inscribed,for example, in a squarewith length U 1 S(correspondingto rectangularsampling).In otherwords,
<�&and
< �in Eq. 5 have to beequalto
1 S. On theotherhand,thebaseband
can also be inscribedin a hexagonwith side length U �V W S(correspondingto hexagonalsampling). This meansthat in Eq. 6< �
hasto be equalto1 S
(seeFig. 2). Calculatingthe samplingmatricesfrom theseperiodicitymatrices,weendupwith� ������� �"! � >X (( >X �
(8)
with Ydet
��������� �"! Y 6 �S �(9)
and �*) �,+��"! � �V W >X &V W >X( >X �(10)
with Ydet
� ) ��+��"! Y 6 �S � 1. 0PZ (11)
The samplingdensity is proportionalto&
det [ [4]. By taking theratio
Ydet
��������� �"! YYdet
�*) �,+��"! Y /. 01 ( Z \A]A] (12)
we seethathexagonalsamplingrequires13.4%lesssamplesthanrectangularsampling.
2.2 Optimal sampling density in 3D
Analogousto the 2D case,we candescribethe mappingfrom in-dices
��� � �:^to coordinates
_� � ��`for rectilineargridsusingthefol-
lowing matrix: � �:�;�,� W ! bac $ & ( (( $ � (( ( $ Wedf (13)
whichwill beregular(rectangular)when$'& $ �- $ W .
As expected,regular rectangularsamplingin 3D is (as in 2D)not optimal. It is importantto notethatanoptimalspherepackingfor arbitrarypackingstructuresin 3D is not known. However, sev-eraloptimalpackingstructures,all with equalsamplingdensity, areknown for thecaseof regularsampling,i.e., structuresthatcanbedescribedby threebasevectors. Fortunately, this is exactly what

spatialdomain frequency domain
rectangularsamplingx
y
. . .
.
.
.
T1
T2
y
. . .
u2
.
.
.
W
u1
ω
xω
hexagonalsampling T1
T2
x
. . .
y ...
y
u1
u2
. . .
W
.
.
.
x
ω
ω
Figure2: 2D regularrectangularandhexagonalsamplingin spatialandfrequency domain.
we need,sincewe do not want to sacrificetheimplicit indexing ofthegrid pointsthatmakesregulargrid representationssoattractive.
Amongtheoptimalregularpackingstructuresarethehexagonalclosepacked(hcp)structureandthefacecenteredcubic(fcc) struc-ture [3]. In orderto achieve a closepackingin frequency domainusinganfcc lattice,weusethefollowing matrix:
2hg ��� 243g ��� bac < (i<(i< << < ( df (14)
An fcc lattice consistsof simplecubic cells with additionalsam-pling pointsin thecenterof eachcell face.Onecell of anfcc latticeis depictedin Fig. 3 with thebasevectorsfrom Eq.14.
By pluggingEq. 14 in Eq. 4 we endup with a samplingmatrixwhichdescribesa bodycenteredcubic(bcc)lattice:��j ��� lk1 ac $ C $ $C $ $ $$ $ C $ df (15)
with$ �,>m .
A bcclatticealsoconsistsof asimplecubiccell but with onlyoneadditionalsamplingpoint, which is right in the centerof the cell.Fig. 4 depictsonecell of abcclattice.Note,thatthebasevectorsofFig. 4 do not correspondto Eq. 15, astheseareratherunintuitive.Wechoseanothersetof basevectors,which is moreconvenientforour purposeof indexing thedatapoints,seeSection3.1. They aredescribedby thesamplingmatrix��j ��� bac $ ( &� $( $ &� $( ( &� $ df (16)
u1
u2
u3
Figure3: Onecell of anfcc latticewith basevectors<*n
. Theblackdotsmark additionalsamplepoints(in the centerof the faces)ascomparedto a simplecubiccell.

To guaranteethatthereplicasin frequency domaindo notoverlap,
b1
b3
b2
Figure4: Onecell of abccstructurewith basevectorso n . Theonlydifferenceto asimplecubiccell is oneadditionalsamplepointrightin thecenterof thecell, markedwith a blackdot.<
hasto beequalto1 S
for rectangularsampling.Sincetheperi-odicity matrix is analogousto the2D periodicitymatrix we endupwith Y
det
� ������� W ! Y 6 WS W (17)
For thefcc lattice,<
hasto beequalto. 1 S
, whichyieldsYdet
��j ��� Y 6 WS W . 1(18)
By againtakingtheratioYdet
�������,� W ! YYdet
��j �;� Y ( Z p ( p (19)
weseethatweneed29.3%lesssamplesthanwith rectangularsam-pling2. Thismeansthatif wesampleafunctiononaregularrectan-gulargrid with samplingdistance
$ �, wecanincreasethesampling
distance$ j
for a bccgrid to. 1 $ �
.In the above examplewe startedwith an fcc lattice in the fre-
quency domainwhichresultedin abcclatticein thespatialdomain.We couldalsochooseanhcplattice,sinceit hasthesamepackingdensityasan fcc lattice [3]. However, anhcp lattice in frequencydomainis alsoanhcplattice in spatialdomainandhcplatticesareratherdifficult to index [7]. Therefore,wepreferto useabccgrid.
3 Implementation Details
In orderto usea bcc grid in practicewe have to addresssomein-herentimplementationissues.First,we have to think abouthow toorganizethe grid in memory. We presenta schemewhich storesthe samplingpoints in a three-dimensionalarray. The addressingschemeis of specialimportance,sincewewantto takeadvantageoftheimplicit orderingin regulargrid structures.Next wedescribetheslight modificationsnecessaryto usesplattingon bcc grids. Here
2DudgeonandMersereau[4] give a ratio of 0.705,i.e.,29.5%lesssam-ples.This is simplydueto aroundingerror, comparetheresultsof PetersenandMiddleton[16].
we needto addressissuesof interpolation.In orderto incorporateshadingin our renderingalgorithm we describetwo methodsonhow to estimategradientson grid pointsof a bcclattice.
3.1 Storage scheme
For thesakeof simplicity andclarity of figures,wefirst presentourstorageschemein 2D which is thenextendedto 3D.
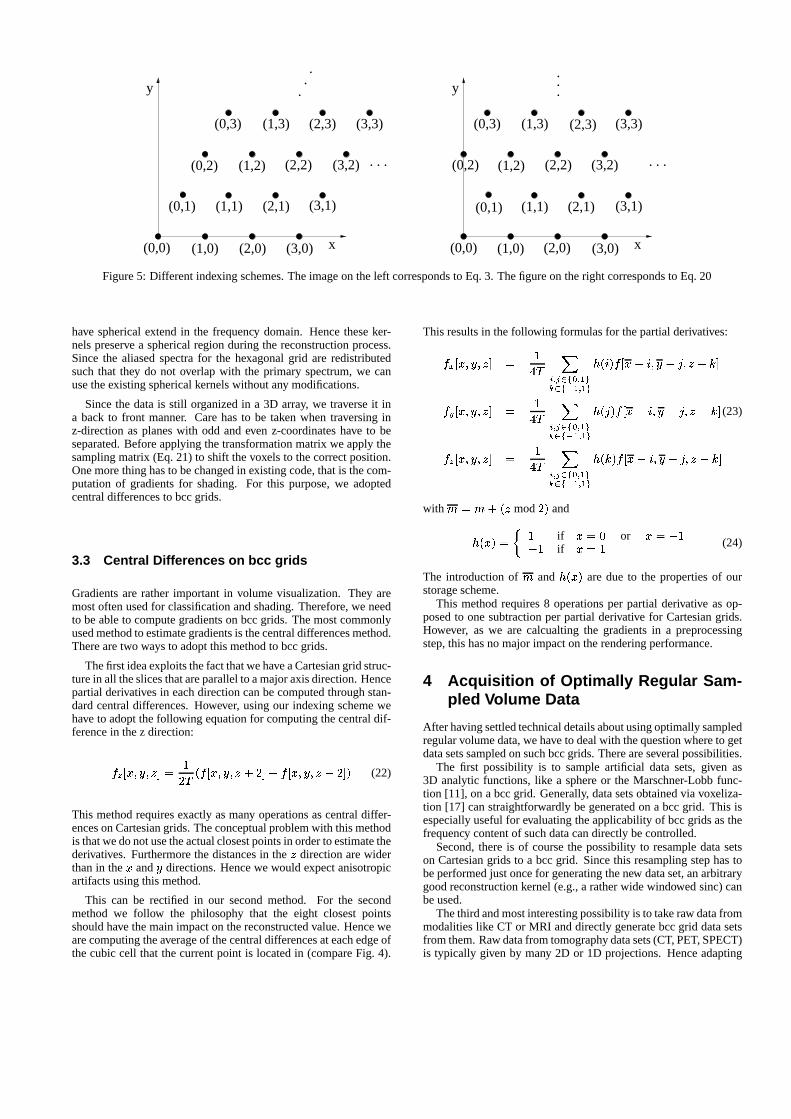
In 2D the optimal sampling pattern is hexagonal sampling.Hexagonalsamplingasdescribedby Eq. 3, resultsin ratherawk-ward indexing aswe still want to samplea rectangulararea. Themeaningof thematrix in Eq.3 is to shift the
� � )row by theamount&� $ & �
. Sincethisholdsfor infinite longrows,theresultwouldbethesameto shift thesamerow by
&� $ & H � C 1 M &� $ & � C $ &. Extending
this ideaandsincewe actuallylike to describea finite, rectangulararea,we shift only rows with odd index which is achieved by thefollowing matrix:�*) �,+��"! � $'& &� $'& H �
mod1 M( $ � �
for$ � /. 01 $ &
(20)
Theeffect is illustratedin Fig. 5. On theleft, theresultof applyingEq.3 canbeseenwhereastheeffect of applyingEq.20 is depictedon theright.
Thesameproblemexistsin 3D. However, thesolutionis assim-pleasin 2D. Thefollowing matrix��j �;� bac $ ( &� $ H ^
mod1 M( $ &� $ H ^
mod1 M( ( &� $ df (21)
shiftsonly planeswith oddz-coordinateshalf a unit in x andy di-rection. The result is that thesliceswith even z coordinatesmakeupa3D Cartesiangrid, thesliceswith oddz coordinatesalsomakeup a 3D Cartesiangrid which is shiftedto the centersof the firstgrid. Fig. 6 shows a bccgrid with the two inter-penetratingCarte-siangridsmarkeddifferently. In practicewe still storethedatain a3D arraywith animplicit shift of sliceswith oddz coordinates.
Figure6: A bccgrid interpretedastwo inter-penetratingCartesiangrids.
3.2 Splatting on bcc grids
Theoriginal splattingalgorithm,asdescribedby Westover [19], isstraightforwardly adoptedto bcc grids. This algorithm gains itspower by using sphericalreconstructionkernels. Thesekernels
x
. . .
y
(0,0) (1,0) (2,0) (3,0)
(0,1) (1,1) (2,1) (3,1)
(0,2) (1,2) (2,2) (3,2)
(0,3) (1,3) (2,3) (3,3)
.
.
.
x
y
. . .
(0,0) (1,0) (2,0)
(0,1) (1,1) (2,1) (3,1)
(0,2) (1,2) (2,2) (3,2)
(3,3)(2,3)(1,3)(0,3)
(3,0)
.
..
Figure5: Differentindexing schemes.Theimageon theleft correspondsto Eq.3. Thefigureon theright correspondsto Eq.20
have sphericalextendin the frequency domain. Hencetheseker-nelspreserve a sphericalregion during the reconstructionprocess.Sincethe aliasedspectrafor the hexagonalgrid are redistributedsuchthat they do not overlapwith the primary spectrum,we canusetheexistingsphericalkernelswithoutany modifications.
Sincethe datais still organizedin a 3D array, we traverseit ina back to front manner. Carehasto be taken when traversinginz-directionasplaneswith odd andeven z-coordinateshave to beseparated.Beforeapplyingthetransformationmatrix we applythesamplingmatrix (Eq.21) to shift thevoxelsto thecorrectposition.Onemorethinghasto bechangedin existingcode,thatis thecom-putationof gradientsfor shading. For this purpose,we adoptedcentraldifferencesto bccgrids.
3.3 Central Differences on bcc grids
Gradientsareratherimportantin volumevisualization. They aremostoftenusedfor classificationandshading.Therefore,we needto beableto computegradientson bccgrids. Themostcommonlyusedmethodto estimategradientsis thecentraldifferencesmethod.Therearetwo waysto adoptthismethodto bccgrids.
Thefirst ideaexploitsthefactthatwehaveaCartesiangrid struc-turein all theslicesthatareparallelto amajoraxisdirection.Hencepartialderivativesin eachdirectioncanbecomputedthroughstan-dardcentraldifferences.However, usingour indexing schemewehave to adoptthefollowing equationfor computingthecentraldif-ferencein thez direction:q�rts �� � �"`Eu vk1 $ H q�s �� � �,` O 1 u C q�s �� � ��` C 1 u M
(22)
This methodrequiresexactly asmany operationsascentraldiffer-encesonCartesiangrids.Theconceptualproblemwith thismethodis thatwedonotusetheactualclosestpointsin orderto estimatethederivatives. Furthermorethedistancesin the
`directionarewider
thanin the
and
�directions.Hencewe would expectanisotropic
artifactsusingthis method.
This can be rectified in our secondmethod. For the secondmethod we follow the philosophy that the eight closestpointsshouldhave themainimpacton thereconstructedvalue.Hencewearecomputingtheaverageof thecentraldifferencesateachedgeofthecubiccell that thecurrentpoint is locatedin (compareFig. 4).
This resultsin thefollowing formulasfor thepartialderivatives:q + s �� � ��`Eu kw $ xn y z�{}|"~�y &��� {t|�� & y &���� H � M q�s C ��� � C � �"` C ^}uq7�ts �� � ��`Eu kw $ xn y z�{}|"~�y &��� {t|�� & y &�� � H � M q�s C �"� � C � �:` C ^}u
(23)
q r s �� � ��`Eu kw $ xn y z�{}|"~�y &��� {t|�� & y &�� � H ^ M q�s C �"� � C � �:` C ^tuwith � � O H `
mod1 M
and
� H M �� kif
(or
C kC kif
k (24)
The introductionof � and � H Maredue to the propertiesof our
storagescheme.This methodrequires8 operationsper partial derivative asop-
posedto onesubtractionper partial derivative for Cartesiangrids.However, as we are calcualtingthe gradientsin a preprocessingstep,this hasno majorimpacton therenderingperformance.
4 Acquisition of Optimally Regular Sam-pled Volume Data
After having settledtechnicaldetailsaboutusingoptimallysampledregularvolumedata,wehave to dealwith thequestionwhereto getdatasetssampledonsuchbccgrids.Thereareseveralpossibilities.
The first possibility is to sampleartificial data sets,given as3D analytic functions,like a sphereor the Marschner-Lobb func-tion [11], on a bccgrid. Generally, datasetsobtainedvia voxeliza-tion [17] canstraightforwardly begeneratedon a bccgrid. This isespeciallyusefulfor evaluatingtheapplicabilityof bccgridsasthefrequency contentof suchdatacandirectlybecontrolled.
Second,thereis of coursethe possibility to resampledatasetson Cartesiangrids to a bccgrid. Sincethis resamplingstephastobeperformedjustoncefor generatingthenew dataset,anarbitrarygoodreconstructionkernel(e.g.,a ratherwide windowedsinc)canbeused.
Thethird andmostinterestingpossibilityis to takeraw datafrommodalitieslike CT or MRI anddirectly generatebccgrid datasetsfrom them.Raw datafrom tomographydatasets(CT, PET, SPECT)is typically given by many 2D or 1D projections.Henceadapting

reconstructionalgorithmfor bccgridshasthepotentialof speedingup these� typically very costlyoperationsby almost30%. Likewiseimagedataacquiredin the frequency domain(e.g. MRI) couldbe(re)sampledontoanfcc grid. We couldeasilyacquirethesamplesin the frequency domainon a facecenteredcubic grid anduseamodifiedinverseFFT to generatea bcc grid dataset. That wouldallow eitherfasteracquisitiontimesor moreaccurateimageswhensamplesareacquiredon a bccgrid.
5 Results
Wepeformedseveralteststo evaluatetheapplicabilityof bccgrids.First,wecomparedourgradientreconstructionschemesto thecom-monly usedcentraldifferenceson Cartesiangrids.Then,we modi-fiedanexistingsplatterto operateonbccgrids.Finally, assamplingon bcc grids resultsin a kind of compressionof the data,we alsocomparedit to existingcompressiontechniquesfor volumetricdata.
5.1 Gradient estimation
In order to evaluatethe quality of the gradientapproximationweusedthreedifferentanalyticalfunctionsfor comparisonpurposes:� sphericalwith linearfalloff:q & H �� � ��` M =� � O � � O ` �
(25)� Sincfunction:q � H �� � �"` M ��"��� H � � O � � O ` � M� � O � � O ` �(26)
� simplifiedMarschner-Lobb:q W H _� � �"` M �"��� H � O � � O ` � M(27)
We computedtheactualfunctionvaluesat thepositionsdefinedbythebccgrid sothatno errorswereintroducedduringthesamplingprocess.We thenappliedour two gradientreconstructionschemesandcomputedthe differenceof the normalswith the analyticallycomputednormalsat the samplinggrid. We recordedtwo errors– the error in the magnitudeof the normalaswell as the angularerror in thenormal. We thenlooked at theseerrorsin onesliceata time. Sincein our indexing schemeanxy-slice(z is constant)iseasyto extractwechosexy slices.Furthermore,wewereinterestedin how well theseerrorscompareto errorsintroducedby centraldifferencesandlinear filtering on regular rectilineargrids. Hencewe computedthenormalsasif theoriginal datasetwasgivenon arectangulargrid usingcentraldifferencesandlinearinterpolation.
Theresultsof our experimentcanbeseenin Fig 7 (a) – (c). Thefirst row shows the relative error in magnitudewherethe secondrow shows the angularerror. Columnonedepictstheerrorof ourfirst gradientreconstructionmethod(Eq. 22) that is basedon cen-tral differencesat the grid point itself. Column 2 correspondstomethodtwo (Eq.23),which is theaverageof all centraldifferencesat theof thecubeedgessurroundingthesamplingpoint. In thelastcolumnwe computedthe linearly interpolatedcentraldifferences,assumingthedatasetwasgivenon a regulargrid with correspond-ing dimensions.
Fig 7(a)shows theerrorimagesfor functionq &
. In this imageanangularerror of 15 degreesandan amplitudeerror of 30% corre-spondsto white(255).Fig.7(b)showstheerrorimagesfor functionq �
. Hereanangularerrorof 30 degreesandanamplitudeerrorof60%correspondsto white (255).Finally theresultsfor function
q W
(a)
(b)
(c)
Figure7: Differenceimagesof analyticallycalculatedgradientstoour gradientestimationschemes(seeSec.3.3), first two columns,andcentraldifferenceswith linear interpolation,third column,for(a) sphere,(b) Sinc, and(c) simplified Marschner-Lobb function.Thetoprowsshow theerrorin magnitudewhereasthebottomrowsshow the angularerror.(a) error in magnitudeby 30% andan an-gularerrorof 15 degreescorrespondsto white, (b) amplitudeerrorof 60% andan angularerror of 30 degreescorrespondsto white,(c) amplitudeerrorof 10%andanangularerrorof 5 degreescorre-spondsto white.

aredisplayedin Fig. 7(c). Here5 degreesfor theangularerrorand10%for theamplitudeerrorcorrespondto white (255).
From theseimageswe concludethatboth our differencemeth-ods are quite comparablewith centraldifferencingand linear in-terpolationon regular grids. Henceoneneednot to worry aboutquality lossby usingbcc grids for volumerenderingapplications.Furthermoresincethereareno large differencesbetweenthe twointroducedmethodsin Section3.3,we don’t find theexpensive op-erationsof method2 justified.
5.2 Splatting
Fig. 8 shows imagesof the Marschner-Lobb datasetsampledona
w (�� w (�� w (Cartesiangrid (as describedby Marschnerand
Lobb [11]) on the left respectively a1 \ � 1 \ ��� ] bcc grid on
the right. This dataset is quite demandingfor a straightforwardsplatter, however, theresultsof thetwo differentgrid structuresarecomparablein quality.
Thedatasetsthatweusedfor renderingtheimagesin Fig. 9 (seecolor plate)wereproducedusinga high-qualityinterpolationfilter.Weusedthe � W
-4EFfilter asdesignedbyMoller etal [13]. In Fig.9we show resultsof renderingthelobsterlobsterdataset,aswell as“neghip” datasetaswell astheHigh PotentialIron Proteindatasetby Louis NoodlemanandDavid Case,of ScrippsClinic, La Jolla,California.Again,a regularCartesiangrid wasusedon theleft anda bcc grid on the right. Therearesomesmall visible differencesin theimages,which mostlystemfrom thedifferenttransferfunc-tions. Sincewe classifydifferentvaluesthat represent2 differentgrid positionsonecannotexpect identicalpictures.Hencewe seesomedifferencesresultingfrom the problemof pre-classification[20].
We alsodid sometimings which arereportedin Table1. It isinterestingto notethat thespeedupfor somedatasetswerebiggerthanexpected.Thiscouldhavebeencausedby thedecreasedmem-ory cachingnecessary. For a very small dataset(lobster)we sawexpectedspeedupsnear30%.
5.3 Compression
Our resultsindicatethat the resampleddatahave the potentialtoleadto bettercompression.Wewereableto show thatourcompres-sionratiosfor practicaldatasetsarebetterthanwhatwasachievedusing the gzip utility. Also, our overall compressionratioswerebetterthenpreviously reported[5]. Table2 shows compressionra-tios of variousvolumedatasets. Note, that the last two columnsgive percentagesascomparedto the original datasize indicatingthe overall compressionratio, which is what we areinterestedin.However, thecompressionof syntheticdatasetsis a rathersurpris-ing resultandneedsto befurtherinvestigated.
6 Future Work
We would like to adoptothervolumerenderingalgorithmsto bodycenteredcubicgridsandseehow they perform.As thebccgrid ac-tually consistsof two Cartesiangridswhichareshiftedwith respectto eachother, it shouldbepossibleto designa shear-warp like al-gorithmfor bccgrids. For thesamereasonit shouldbepossibletoacceleratevolumerenderingby theuseof graphicshardware.
It would alsobe necessaryto comeup with a ray-castingalgo-rithm. For this purposeit would be interestingto investigatetheeffectsof interpolatingwithin bccgrids. Therefore,we would liketo adoptour filter analysisand designmethod[13] to bcc grids.Sinceeachsamplingpoint in a bcc grid haseight nearestneigh-bors(asopposedto a Cartesiangrid), sphericallysymmetricfilterswould deserve a morethoroughinvestigation.
7 Conclusions
We have presenteda samplingschemeof volumedatawhich saves29.3%samplesas comparedto Cartesiangrids. We assumethatthe functionswe aredealingwith are isotropicandband-limited,i.e., their frequency spectraarespheres.Therefore,a samplingpat-tern can be usedin a way that the replicasin frequency domain(introducedby thesamplingprocess)arepacked closely. Thereisno uniquesamplingpatternwhich achievesthis,however, we haveshowedthatabodycenteredcubicgrid resultsin aclosepackinginfrequency domainandis easyto use.With thissamplingpatternwereducedatasizeandthereforeimprove renderingrateswithout lossof quality.
To demonstratethe applicabilty in volume rendering,we haveadoptedthe splattingalgorithmto bcc grids. This requiresjust afew changesof an existing codeand is straightforward to imple-ment.In orderto performclassificationandshadingof thedatawedevelopedtwo gradientreconstructionschemes.Empiricalexperi-mentswith analytical3D functionsshow thatthesearecomparablewith centraldifferencescommonlyusedonCartesiangrids.Webe-lieve that significantgainscanbe achieved by usingbcc grids involumevisualizationandvolumegraphicsin general.
8 Acknowledgments
We thank the Masterfor his inspirationsandguidance. We alsowould like to thankZiemowit Trzesicki for his help in providingcodefor the resamplingof thegrids aswell asSteven Kilthau forlettingusadopthis splattingcodefor ourbccgrids.
References
[1] N.W. Ashcroft and N.D. Mermin. Solid State Physics.Prentice-Hall,Inc., Holt, RinehartandWinston,1st edition,1976.
[2] G. Borgefors. Distancetransformationson hexagonalgrids.PatternRecognition Letters, 9:97–105,1989.
[3] J.HConwayandN.J.A.Sloane.SpherePackings,LatticesandGroups. Springer, 3rdedition,1998.
[4] D. E. DudgeonandR. M. Mersereau.MultidimensionalDig-ital SignalProcessing. Prentice-Hall,Inc.,Englewood-Cliffs,NJ,1stedition,1984.
[5] J.Fowler andR.Yagel.Losslesscompressionof volumedata.In Arie KaufmanandWolfgangKrueger, editors,Proceedingsof the1994SymposiumonVolumeVisualization, pages43–50.ACM SIGGRAPH,October1994. ISBN 0-89791-741-3.
[6] D. Hilbert. MathematischeProbleme. Nachrichten derKoniglichen Gesellschaft der Wissenschaften zu Gottingen,mathematisch-physikalischeKlasse, 3(1):253–297,1900.
[7] A.G. Jackson.Handbookof Crystallography. Springer, 1991.
[8] L. N. LesterandJ.Sandor. Computergraphicsonahexagonalgrid. Computers andGraphics, 8(1):401–409,1984.
[9] Yong-Kui Liu. Thegenerationof straightlineson hexagonalgrids. ComputerGraphicsForum, 12(1):27–31,March1993.
[10] M.P. Marder. CondensedMatterPhysics. JohnWiley & Sons,2000.

Dataset rectilinear bccgrid speedupuncbrain 1.51 0.8 47%hipip 0.103 0.059 43%lobster 0.056 0.043 23%
Table1: Timingsfor severaldifferentdatasetsarereportedin secondsperframe.
Figure8: Marschner-Lobb datasetrenderedby splattingwith a Cartesiangrid on theleft anda bccgrid on theright.
original bccgrid original (gzipped) bcc(gzipped) % original % bccuncbrain 9502732 6716017 4547141 2948524 47.8 31.0nerve 19922955 14021720 8819382 5744443 44.3 28.8ultrasound 6291467 4422747 4347958 3140634 69.1 49.91D-04 92410 64024 7028 14456 7.6 15.6Marschner-Lobb 64001 43913 22823 34861 35.7 54.5
Table2: Compressionratiosof severalvolumedatasets.Thelasttwo columsgive thepercentageascomparedto theoriginal datasize.

[11] S.R. MarschnerandR. J.Lobb. An evaluationof reconstruc-tion filters for volumerendering. In R. DanielBergeronandArie E. Kaufman,editors,Proceedingsof theConferenceonVisualization, pages100–107,Los Alamitos, CA, USA, Oc-tober1994.IEEE ComputerSocietyPress.
[12] R.M. Mersereau. The processingof hexagonally sam-pled two-dimensionalsignals. Proceedingsof the IEEE,67(3):930–946,June1979.
[13] T. Moller, K. Mueller, Y. Kurzion,R.Machiraju,andR.Yagel.Designof accurateandsmoothfilters for functionandderiva-tive reconstruction.In 1998SymposiumonVolumeVisualiza-tion, pages143–151.ACM SIGGRAPH,October1998.ISBN0-8186-9180-8.Held in ResearchTrianglePark, North Car-olina.
[14] N.J.A.Sloane.Thespherepackingproblem.In ICM: Proceed-ingsof theInternationalCongressof Mathematicians, 1998.
[15] A.V. OppenheimandR.W. Schafer. Discrete-TimeSignalPro-cessing. PrenticeHall Inc., Englewood Clif fs, 2nd edition,1989.
[16] D. P. PetersenandD. Middleton. Samplingandreconstruc-tion of wave-number-limited functionsin � -dimensionalEu-clideanspaces.InformationandControl, 5(4):279–323,De-cember1962.
[17] M. Sramekand A. E. Kaufman. Alias-free voxelization ofgeometricobjects.In HansHagen,editor, IEEETransactionsonVisualizationandComputerGraphics, volume5 (3),pages251–267.IEEEComputerSociety, 1999.
[18] A.F. Wells. Structural InorganicChemistry. Oxford Univer-sity Press,5thedition,1984.
[19] L. Westover. Footprintevaluationfor volumerendering.Com-puter Graphics (SIGGRAPH’90 Proceedings), 24(4):367–376,August1990.
[20] Craig M. Wittenbrink, ThomasMalzbender, andMichael E.Goss.Opacity-weightedcolor interpolationfor volumesam-pling. 1998VolumeVisualizationSymposium, pages135–142,October1998. ISBN 0-8186-9180-8.

Cartesiangrid body-centeredcubicgrid
Figure9: Imagesgeneratedvia splattingonaCartesiangrid ontheleft respectively abody-centeredcubicgrid ontheright. Thebody-centeredcubicgridsrequireapproximately30%lesssamples.Only smallqualitydifferencesarevisible, thatlikely arecausedby pre-classification.