optical properties -...
TRANSCRIPT

CHAPTER 4
OPTICAL PROPERTIES

75
4.1 INTRODUCTION
The various optical parameters such as refractive index, optical band gap
energy, oxide ion polarizability, interaction parameter etc are determined from optical
absorption spectra. These parameters provides information about the electronic band
structure, band tail and localized states. Optically induced transitions, which gives
information about optical constants are studied from optical absorption spectroscopy.
These optical transitions in which electrons jump from valence band to conduction
band are classified as interband transitions, transition across the band gap edges,
impurity level excitation, excitation generated transition and intraband transition.
In amorphous materials, we have direct and indirect transitions. Both the
transitions involve the interaction of an electromagnetic wave with an electron in the
valence band, which is then raised across the fundamental gap to the conduction band.
In the case of direct optical transitions, the electron from the top of valence band is
removed into the bottom of the conduction band at the same wave vector for the
electron. But indirect transitions, the interaction with lattice vibrations (phonons)
takes place resulting the change of wave vector of the electron. This transition is also
known as photon assisted transition.
4.2 REVIEW OF EARLIER WORK
A brief review of the earlier work carried out on some optical properties of
glasses is presented.
Farouk et al [1] studied the effect of γ-radiation on the optical properties of the
glassy system [xMgF2–10Al2O3-(40-x) TeO2–50Li2B4O7], (x = 0, 15, 20 and
40 mol%). It was observed that γ-radiation enhances the formation of NBOs. This

76
leads to a decrease in the optical band gap energy. Radiation induced changes include
hole trapping by bridging oxygen causing the increase of B–O bond length.
Rajesh et al [2,3] investigated structural and optical properties using XRD,
DSC, FTIR, optical absorption and near infrared luminescence spectra of strontium
lithium bismuth borate glasses doped with various concentrations of Er3+ and also in
Nd3+ doped alkali and mixed alkali (Li, Na, K, Li–Na, Li–K and Na–K) heavy metal
(PbO and ZnO) borate glasses.
A series of un-doped borate glasses [4] with Li2B4O7, LiKB4O7, CaB4O7, and
LiCaBO3 compositions of high optical quality and chemical purity were obtained
from corresponding polycrystalline compounds using standard glass synthesis and
technological conditions developed by authors. The optically thermopoled second
harmonic generation (SHG) effect in the Li2B4O7, LiKB4O7, CaB4O7, and
LiCaBO3 glasses were investigated and analyzed.
Sailaja et al [5] reported the optical properties of cadmium bismuth borate
glasses doped with various concentrations of Sm3+ ions. FT-IR spectra of Sm3+ doped
glasses have been used to identify the functional groups present in the glasses. From
the absorption spectrum, the experimental oscillator strengths were determined and
have been used to calculate the Judd–Ofelt intensity parameters. By using the Jude–
Ofelt intensity parameters, various radioactive properties have been studied.
Gedam [6] reported Li2O-B2O3-Nd2O3 glasses prepared by conventional melt
quench technique. Optical characterizations of these glasses were carried out. The
density and refractive index of these glasses increased while optical band gap and
radiation length decreased due to structural changes.

77
Glasses in the system ZnF2–ZnO–As2O3–TeO2 [7] were prepared by normal
melt quenching method. The optical constants of these glasses are determined over a
spectral range, providing the complex dielectric constant to be calculated. The values
of the optical band gap Eg for all types of electronic transitions and refractive index
have been determined. The optical parameters such as, ε∞, ωp, Ed and E0 have been
estimated. The values of N/m* reflect an increase in the free carrier concentration
with increasing ZnF2 content. This leads to an increase in the reflectance, R which in
turn increases the refractive index.
Krishna Kumari et al [8] prepared and studied the structural changes of
Co2+ and Ni2+ ions doped ZnO−Li2O− K2O−B2O3 glasses investigated by UV–vis–
NIR and FT-IR spectroscopy. The optical band gap and Urbach energies exhibited
the mixed alkali effect. Various physical parameters such as refractive index, optical
dielectric constant, polaron radius, electronic polarizability and inter-ionic distance
were also determined. FT-IR measurements of the all glasses revealed that the
network structure of the glasses are mainly based on BO3 and BO4 units placed in
different structural groups in which the BO3 units being dominant. The optical
absorption spectra suggest the site symmetry of Co2+ and Ni2+ ions in the glasses are
near octahedral.
Samee et al [9] studied the mixed alkali effect in borate glasses containing
three types of alkali ions. From the absorption edge studies, the values of indirect
optical band gap, direct optical band gap and Urbach energy have been evaluated. The
values of Eopt and ΔE show non-linear behavior with compositional parameter
showing the mixed alkali effect. The average electronic polarizability of oxide ions
αo2-, optical basicity Λ, and Yamashita–Kurosawa's interaction parameter A have been

78
examined to check the correlations among them and bonding character. Based on
good correlation among electronic polarizability of oxide ions, optical basicity and
interaction parameter, the present Li2O–Na2O–K2O–B2O3 glasses were classified as
normal ionic (basic) oxides.
Baki and El-Diasty [10] prepared lithium tungsten borate glass (0.56−x)B2O3–
0.4Li2O–xZnO–0.04WO3 (0≤x≤0.1 mol%) by the melt quenching technique for
photonic applications. The spectroscopic properties of the glass such as glass molar
polarizability, oxide ion polarizability, optical basicity and Yamashita–Kurosawa's
interionic interaction parameter were determined in a wide spectrum range (200–
2500 nm) using a Fresnel-based spectrophotometric technique. Optical properties of
Ni2+ doped 20ZnO + xLi2O + (30 − x)Na2O + 50B2O3 (5 ≤ x ≤ 25) glasses [11] were
carried out at room temperature. The optical absorption spectra confirm the site
symmetry of the Ni2+ doped glasses are near octahedral. It was observed that the
optical band gap and Urbach energies exhibit the mixed alkali effect.
Vijaya Kumar et al [12] studied glasses with composition Bi2O3-B2O3-BaO.
The optical absorption spectra of the glasses revealed that the cutoff wavelength
increases and optical band gap energy decreased with increased in BaO content. The
Eopt values of these glasses were found to be in the range 2.72–3.15 eV where as the
value of ∆E lies in the range 0.45–0.27 eV. The polarizability of oxygen ions in these
glasses is determined using optical absorption data.
Saddeek et al [13] prepared glasses with compositions Na2B4O7–Bi2O3–MoO3,
The optical transmittance and reflectance spectrum of the glasses have been recorded
in the wavelength range 300–1100 nm. The values of the optical band gap Eopt for
indirect transition and refractive index have been determined. The average electronic

79
polarizability of the oxide ion αO2− and the optical basicity have been estimated from
the calculated values of the refractive indices. The variations in the different physical
parameters such as the optical band gap, the refractive index, the average electronic
polarizability of the oxide ion and the optical basicity with Bi2O3 and MoO3 content
have been analyzed and discussed in terms of the changes in the glass structure. The
results are interpreted in terms of the increase in the number of non-bridging oxygen
atoms, substitution of longer bond-lengths of Bi–O, and Mo–O in place of shorter B–
O bond and the change in Na+ ion concentration.
Optical absorption and emission spectra of Ho3+ doped alkali, mixed alkali and
calcium phosphate glasses [14] have been studied. Variation of Judd–Ofelt intensity
of parameters (Ωλ), peak wavelengths of the hypersensitive transitions (λp), radiative
transition probabilities (Arad) and peak emission cross-sections (σp) with the variation
of alkalis, mixed alkalis and calcium in the phosphate glass matrix has been studied.
The shift in peak wavelength of the hypersensitive transition and Judd–Ofelt intensity
parameter (Ω2) are correlated with the structural changes in the host matrix. From the
luminescence spectra, the emission cross-sections (σp) are evaluated for the two
emission transitions of Ho3+ ion.
The refractive index (n) and density (ρ) of Bi2O3–B2O3 glasses [15] were
measured in the temperature range of 30–150 °C in order to clarify the temperature
dependence of the electronic polarizability of oxide ions (αO2−) and optical basicity
(Λ). It was found that the values of n, αO2−, and Λ increase almost linearly with
increasing temperature. The value of the temperature dependence of refractive index,
dn/dT, increases with increasing Bi2O3 content. Contrary, the values of dαO2−/dT, and
dΛ/dT, tend to decrease with increasing Bi2O3 content. They suggested that the

80
temperature dependence of the electronic polarizability of oxide ions in these glasses
has a large contribution for the temperature dependence of the refractive index in
comparison with the contribution of the volume thermal expansion coefficient. The
features in the temperature dependence of αO2− and Λ in the present glass system
might be related to the extremely weak single bond strength of Bi2O3 compared with
the strong single bond strength of B2O3.
Elfayoumi et al [16] reported optical absorption and emission spectra of
Sm3+ and Eu3+ co-doped lithium borate glass in the spectral range from 350 to
2400 nm. The oscillator strength, Judd–Ofelt intensity parameters, branching ratios
and radiative transition probabilities were calculated. The obtained results are
discussed and compared with other literature data for Eu3+ in various compounds.
Padmaja and Kistaiah [17] and Subhadra and Kistaiah [18] carried out optical
absorption studies on mixed alkali borate glasses to understand the effect of
progressive doping of one type of alkali ion with another type of alkali ion. Optical
parameters such as optical band gap, Urbach energy, oxide ion polarizability, optical
basicity and interaction parameter were evaluated from the experimental data. The
observed optical band gap and Urbach energy exhibit mixed alkali effect (MAE).
Venkateswarlu et al [19] presents the optical absorption and emission
properties of Pr3+ and Nd3+ doped two different mixed alkali chloroborate glass
matrices of the type B2O3-LiCl-NaCl and B2O3-LiCl-KCl. The variation of Judd–
Ofelt parameters, total radiative transition probabilities, radiative lifetimes, emission
cross-sections and refractive index with alkali contents in the glass matrix have been
discussed.

81
Kesavulu et al [20] reported the results on mixed alkali effect in Li2O–Cs2O–
B2O3 glasses doped with Cr3+ ions studied by optical absorption, electron
paramagnetic resonance and luminescence techniques. The optical absorption
spectrum exhibits three bands characteristic of Cr3+ ions in octahedral symmetry.
From the optical absorption spectral data, the crystal field (Dq) and Racah parameters
have been evaluated. From ultraviolet absorption edges, the optical band gap and
Urbach energies have been calculated.
The optical parameters of Fe3+ and Mn2+ doped Li2O-K2O-ZnO-B2O3 mixed
alkali glasses [21] have been determined through optical absorption studies. The
glasses exhibit typical optical absorption spectra of Fe3+ and Mn2+ ions. Progressive
substitution of Li with K induces non-linear variations in various optical parameters,
such as optical band gap and Urbach energy with composition. Optical basicity, oxide
ion polarizability, and interaction parameter values have been evaluated for all the
glass specimens.
Hemantha Kumar et al [22] reported optical absorption and fluorescence
studies on sodium potassium phosphate glass doped with Nd2O3. From the absorption
spectra, Racah , spin-orbit and configuration interaction parameters were calculated.
Judd–Ofelt intensity parameters were used to study the covalency as a function of
Nd3+ concentration. Results show that covalency decreases with the increase of Nd3+
concentration. From the absorption spectra, the optical band gaps (Eopt) for both direct
and indirect transitions have been obtained. All these spectroscopic parameters are
compared for different Nd3+ concentrations. From these studies, a few transitions are
identified for laser excitation among various transitions.
82
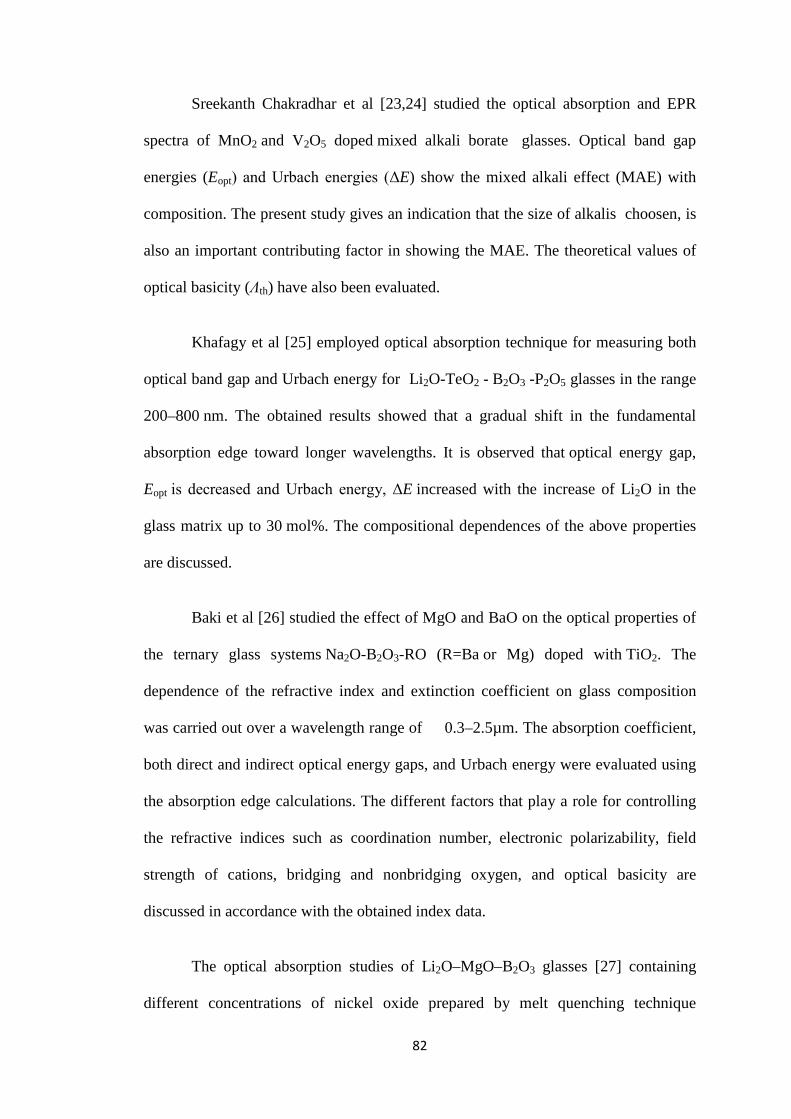
Sreekanth Chakradhar et al [23,24] studied the optical absorption and EPR
spectra of MnO2 and V2O5 doped mixed alkali borate glasses. Optical band gap
energies (Eopt) and Urbach energies (ΔE) show the mixed alkali effect (MAE) with
composition. The present study gives an indication that the size of alkalis choosen, is
also an important contributing factor in showing the MAE. The theoretical values of
optical basicity (Λth) have also been evaluated.
Khafagy et al [25] employed optical absorption technique for measuring both
optical band gap and Urbach energy for Li2O-TeO2 - B2O3 -P2O5 glasses in the range
200–800 nm. The obtained results showed that a gradual shift in the fundamental
absorption edge toward longer wavelengths. It is observed that optical energy gap,
Eopt is decreased and Urbach energy, ΔE increased with the increase of Li2O in the
glass matrix up to 30 mol%. The compositional dependences of the above properties
are discussed.
Baki et al [26] studied the effect of MgO and BaO on the optical properties of
the ternary glass systems Na2O-B2O3-RO (R=Ba or Mg) doped with TiO2. The
dependence of the refractive index and extinction coefficient on glass composition
was carried out over a wavelength range of 0.3–2.5µm. The absorption coefficient,
both direct and indirect optical energy gaps, and Urbach energy were evaluated using
the absorption edge calculations. The different factors that play a role for controlling
the refractive indices such as coordination number, electronic polarizability, field
strength of cations, bridging and nonbridging oxygen, and optical basicity are
discussed in accordance with the obtained index data.
The optical absorption studies of Li2O–MgO–B2O3 glasses [27] containing
different concentrations of nickel oxide prepared by melt quenching technique

83
indicate that the nickel ions occupy both tetrahedral and octahedral positions in the
glass network. However, the octahedral positions seem to be dominant when the
concentration of nickel oxide is 0.4 mol% in the glass matrix.
Mahmoud [28] studied the room temperature optical absorption and reflection
spectra of lithium borobismuthate glasses, recorded in the wavelength range 190–
1100 nm. From the absorption edge studies, the values of the optical band gap ,
Urbach energy , refractive index and complex dielectric constant were determined.
The dispersion of the refractive index is discussed in terms of the single-oscillator
Wemple–DiDomenico model. Pisarska [29] evaluated the optical constants of lead
borate glasses containing Dy3+ ions using absorption and luminescence measurements.
El Batal [30] performed optical, infrared, EPR and Raman spectral studies of
some lithium borate glasses containing varying WO3 contents before and after gamma
ray irradiation. Optical properties of oxide glasses have been extensively investigated
in various host matrices. Many glasses have been developed for visible and infrared
optical devices. In them borate is a suitable optical material with high transparency,
low melting point, high thermal stability and good alkali and rare earth ion solubility
[31-33].
The optical gaps of B2O3, alkali borate and alkali fluoroborate glasses [34]
were determined. The gap of B2O3 glass was 8.0 eV and the value decreased
monotonically with decreasing the B2O3 content in both alkali fluoroborate and alkali
borate glasses. When compared at a constant B2O3 content, the gap is in the order
Li>Na>K> fluoroborate.

84
Optical absorption and emission studies [35] were carried out on neodymium
doped alkali fluoroborophosphate glasses with mixed alkali fluorides as network
modifiers. The refractive indices and Judd–Ofelt parameters of these glasses have
been measured. The refractive index and density of single and mixed alkali borate
glass systems [36] have been measured and used to calculate the molar volume, molar
refractivity and molar refractivity of oxygen ion in order to investigate the
configurational changes that might be induced in the glass structure as the constituent
alkali ion is gradually replaced by another. Kojima et al [37] determined sound
velocities, elastic constants and refractive indices of mixed alkali Cs2O-Li2O-
B2O3 glasses from Brillouin scattering spectra in the frequency range 0 to 30 GHz.
Optical absorption, fluorescence and laser characteristics of Ho3+ incorporated
glass systems of ZrF4-BaF2-A1F3-RF (RF = LiF-NaF or NaF-KF pair) were examined
[38]. Physical properties such as density, refractive index, molar refractivity and
dielectric constant were measured. The measured absorption intensities were matched
with the best fit Judd-Ofelt intensity parameters. The effects of the holmium glass
chemical compositions were examined for properties such as spontaneous emission
probabilities, branching ratios and radiative lifetimes of lasing transitions by the use
of the Judd-Ofelt model. Studies were also carried out to understand the mixed alkali
fluoride effects on the measured values of induced emission cross sections for the
observed luminescent transitions 5I7.6, 5F5 and 5S2 → 5I8 of holmium glasses.
Sdiri & H. Elhouichet [39] and Mahamuda, & Swapna [40] investigated
optical properties of Pr3+ ions in lithium borate and Tm3+ ions in MO-Li2O-
B2O3 (M=Mg, Ca, Sr and Ba) glasses. From the experimental values of oscillator
strengths and calculated matrix elements, the Judd–Ofelt parameters were obtained

85
and their compositional dependence was investigated systematically. The predicted
lifetime for fluorescent levels decreases with decreasing content of Li2O.
Refractive index, optical absorption, absorption and emission cross-sections of
Tm3+/Yb3+-doped alkali-barium-bismuth-tellurite glasses [41] were determined. Wide
infrared transmission window, high refractive index and strong blue three-photon up
conversion emission of Tm3+ indicate that Tm3+/Yb3+ co-doped glasses are promising
up conversion optical and laser materials.
Binary zinc borate glasses of varied composition were prepared by the melt
quenching technique to samples of good optical quality [42]. Absorption, fluorescence
and optical excitation spectra of the glass matrix have been investigated. It is shown
that the composition of the glass strongly affects the position of the emission and
excitation maximum. Both the emission and the excitation spectra were progressively
red shifted with increasing zinc content in the glass matrix.
Borates and silicate glasses [43] containing boron oxide have been widely
used for optical lenses with high refractive index and low dispersion characteristics.
Alkali borate glasses are of great technological interest especially lithium borates as
solid electrolytes because of their fast ionic conduction. The effect of the presence of
either aluminum or lead oxide, or the presence of one of the following transition
metal, Fe2O3, TiO2 or V2O5 in lithium borate glasses was investigated. Glass
containing lead oxide had the highest refractive index.
Rama Moorthy et al [44] investigated optical absorption and
photoluminescence properties of Dy3+-doped alkali borate and alkali fluoroborate
glasses. From the measured absorption spectra, the oscillator strengths were

86
determined from the area under the absorption bands. Judd-Ofelt and the intensity
parameters were used for the calculation of radiative transition rates, branching ratios,
radiative lifetimes and integrated absorption cross-sections. From the radiative
spectroscopic parameters, it is predicted that these Dy3+-doped glasses are found to be
more attractive for blue–green solid-state laser devices.
Agarwal et al [45] recorded room temperature optical absorption and
reflection spectra of Li2O–K2O–Bi2O3–B2O3 glasses in the wavelength range 400–800
nm. From the absorption edge studies, the values of optical band gap (Eopt) and
Urbach energy (ΔE) have been evaluated. The values of Eopt lie between 2.21 and 2.55
eV for indirect allowed transitions, and for indirect forbidden transitions, the values
vary from 1.86 to 2.31 eV. The refractive index (n) and optical dielectric constant (ε)
have been evaluated from the reflection spectra. n and ε and Eopt show nonlinear
variation in their values which supports the existence of MAE in the optical properties
of the present glass system.
Yasser Saleh Mustafa Alajerami and Sooraj Hussain et al [46,47] presents the
optical absorption and emission properties of Dy3+ and Sm3+ in mixed alkali borate
glasses The variation of the Judd–Ofelt intensity parameters, hypersensitive band
positions, radiative transition probabilities, branching ratios, emission cross-sections
and optical band gaps with glass composition have been discussed.
The optical properties of Li2O−K2O−Bi2O3−B2O3−V2O5 glass system were
studied [48] from the optical absorption spectra recorded in the wavelength range
200−800 nm. The fundamental absorption edge has been identified from the optical
absorption spectra. The values of optical band gap for indirect allowed transitions

87
have been determined. An attempt was made to correlate the EPR and optical results
and to find the effect of Bi2O3 content on these parameters.
Glasses with composition Li2O-Na2O-K2O-B2O3 were prepared by Samee et
al [49] using the melt quenching technique. Optical energy band gap for various
indirect and direct (allowed and forbidden) transitions were determined using Tauc
plots. Based on good correlation among refractive index based electronic
polarizability of oxide ions, optical basicity and the Yamashita–Kurosawa’s
interaction parameter, the present Li2O-Na2O-K2O-B2O3 glasses were classified as
semi covalent oxides.
4.3 AIM AND SCOPE OF THE PRESENT WORK
Mixed alkali effect (MAE) in borate glasses has been studied extensively. In
spite of numerous investigations, there appears to be no universally accepted
mechanism for various mixed alkali effects. Though the mixed alkali effect must be of
limited interest in technological applications, it is receiving due importance in
understanding the general problems pertaining to ion transport in glasses. Many
investigations have been reported on mixed alkali effect in phosphate, borate, tellurite,
bismuthate and silicate glasses which contain alkali and/or alkaline earth oxides [50-
57].
In this chapter the mixed alkali effect in xLi2O–(30-x)Na2O–10WO3–60B2O3
(0 ≤ x ≤ 30 mol%) glasses was investigated through optical absorption. Using the
optical data, various optical parameters such as cut-off wavelength, optical band gap
energy, Urbach energy, band gap based optical basicity and interaction parameter,
dispersion energy, oscillator energy, oscillator strength, high frequency dielectric

88
constant and refractive index, ratio of free carrier concentration to the free carrier
effective mass, plasma frequency, optical relaxation time etc, were determined.
4.4 RESULTS AND DISCUSSION
The room temperature optical absorption spectra of xLi2O–(30-x)Na2O–
10WO3–50B2O3 glass is shown in figure 4.1.The non-sharp absorption edges in figure
give a clear indication of the amorphous nature of the glasses. The UV absorption
edge or the cutoff wavelength of all glasses in the present study were determined and
are presented in table 4.1. The variation of cutoff wavelength as a
function of compositional parameter in both the glass systems is illustrated in figure
4.2. It is reported that the fundamental absorption edge shifts towards longer
wavelengths in single alkali borate glasses with an increase in alkali content [58, 59].

89
In the present mixed alkali glasses, from the above figure 4.2 it is clear that the cut-off
wavelength varies non-linearly when Li2O is replaced with Na2O. This non-linear
variation in cut-off wavelength is a consequence of mixed alkali effect.
Fig. 4.2 Cutoff wavelength as a function of compositional parameter RLi
in the present glasses.
The optical absorption co-efficient α(ν), near the fundamental absorption edge
was determined from the relation
α(ν) = (1/d) log(I0/It) = 2.303A/d (4.1)
where I0 and It are the intensities of the incident and transmitted beams, respectively,
and d is thickness of the glass sample. The factor log(I0/It) corresponds to absorbance.
Davis and Mott [60] and Tauc and Menth [61] relate this data to the optical band gap,
Eopt through the following general relation proposed for amorphous materials.
0.0 0.2 0.4 0.6 0.8 1.0280
290
300
310
320
330
340
λc = 313nm
λc = 338nmC
ut-o
ff w
avel
egth
(nm
)
Compositional parameter RLi
311
287
313
307304
0.0 0.2 0.4 0.6 0.8 1.0280
290
300
310
320
330
340
λc = 313nm
λc = 338nmC
ut-o
ff w
avel
egth
(nm
)
Compositional parameter RLi
311
287
313
307304

90
2.5 3.0 3.5 4.00
2000
4000
6000
8000
10000
x=30
(αhν
)2/3 (c
m-1eV
)2/3
hν (eV)
x=0x=5
x=25
n=2/3
α(ν) = B (hν− Eopt)n / hν (4.2)
where B is a constant related to the extent of the band tailing, hν is incident photon
energy and n is a number which characterizes the transition process. The exponent, n
takes the values 1/2, 2, 3/2 and 3 for direct allowed, indirect allowed, direct forbidden
and indirect forbidden transitions, respectively. By plotting (αhν)n as a function of
photon energy hν (Tauc plots), one can find the optical energy band gap for all
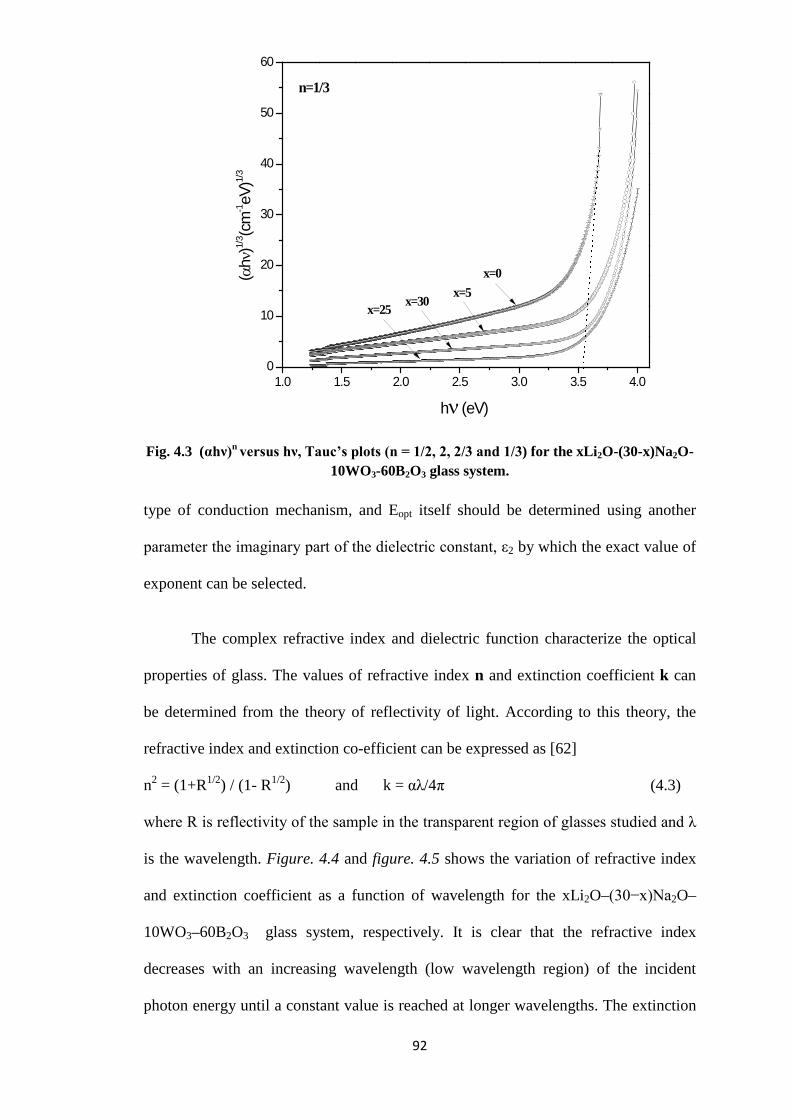
transitions. Figure 4.3 represents Tauc’s plots {(αhν)n vs hν} (n= 1/2, 2, 1/3, 2/3)
for x Li2O– (40−x)Na2O–10WO3–50B2O3 glass system. The values of optical band
gap energy Eopt can be obtained by extrapolating the absorption co-efficient to zero
transitions. The values of optical energy gap, Eopt, thus evaluated for the glass samples
at different values of n are listed in table 4.1.
Since the obtained values of the optical band gap (Eopt) are varying according
to the selected value of the exponent n, one cannot really decide which value of n is
better to be selected. Therefore, the Eq.4.2 may be rather used only for the
determination of the

91
1.0 1.5 2.0 2.5 3.0 3.5 4.00
10
20
30
40
50
60
70
80
90
x=0
x=25x=30
(αhν
)1/2 (c
m-1eV
)1/2
hν (eV)
x=5
n=1/2
2.5 3.0 3.5 4.00
5000
10000
15000
20000
25000
30000x=5
(αhν
)2 (cm
-1eV
)2
x=30
x=25
hν (eV)
x=0n=2
92
1.0 1.5 2.0 2.5 3.0 3.5 4.00
10
20
30
40
50
60
(αhν
)1/3 (c
m-1eV
)1/3
hν (eV)
x=0x=5
x=25 x=30
n=1/3
Fig. 4.3 (αhν)n versus hν, Tauc’s plots (n = 1/2, 2, 2/3 and 1/3) for the xLi2O-(30-x)Na2O-10WO3-60B2O3 glass system.
type of conduction mechanism, and Eopt itself should be determined using another
parameter the imaginary part of the dielectric constant, ε2 by which the exact value of
exponent can be selected.
The complex refractive index and dielectric function characterize the optical
properties of glass. The values of refractive index n and extinction coefficient k can
be determined from the theory of reflectivity of light. According to this theory, the
refractive index and extinction co-efficient can be expressed as [62]
n2 = (1+R1/2) / (1- R1/2) and k = αλ/4π (4.3)
where R is reflectivity of the sample in the transparent region of glasses studied and λ
is the wavelength. Figure. 4.4 and figure. 4.5 shows the variation of refractive index
and extinction coefficient as a function of wavelength for the xLi2O–(30−x)Na2O–
10WO3–60B2O3 glass system, respectively. It is clear that the refractive index
decreases with an increasing wavelength (low wavelength region) of the incident
photon energy until a constant value is reached at longer wavelengths. The extinction

93
300 400 500 600 700 800
0.00002
0.00004
0.00006
0.00008
0.00010
x= 10 mol%
x= 0 mol%
x= 15 mol%
Extin
ctio
n co
effic
ient (
k)
Wavelength (nm)
x= 25 mol%
300 400 500 600 700 800
1.5
2.0
2.5
3.0
3.5
4.0
4.5
x = 0 x = 5 x = 30
Refr
activ
e ind
ex (n
)
Wavelength (nm)
x = 25
coefficient is the imaginary part of the complex index of refraction, which also relates
to light absorption.
Fig. 4.4 The refractive index as a function of wavelength.

94
300 400 500 600 700 800
0.00002
0.00004
0.00006
0.00008
0.00010
x = 30 mol%
x = 20 mol%Ext
inct
ion
coef
ficie
nt (k
)
Wavelength (nm)
x = 5 mol%
Fig. 4.5 The extinction coefficient as a function of wavelength.
Real and imaginary parts of dielectric constant (ε1 and ε2) of a material are
related to the optical constants n and k values, using the formula
ε1= n2 - k2 and ε 2= 2nk (4.4)
Figure 4.6 shows the variation of real part of dielectric constant, ε 1, as a
function of photon energy hυ for the present glass samples. For all glass samples the
dielectric constant shows an exponential increase with photon energy.

95
1.5 2.0 2.5 3.0 3.5 4.01
2
3
4
x = 20 x = 15 x = 5
ε 1
Photo energy hν (eV)
x = 0
1.5 2.0 2.5 3.0 3.5 4.01
2
3
4
x= 10x= 25
ε 1
Photon energy (hν) (eV)
x= 30
Fig. 4.6 The real part of the dielectric constant as a function of photon energy.

96
2.0 2.5 3.0 3.5 4.0 4.50.00000
0.00005
0.00010
0.00015
0.00020
0.00025
0.00030
0.00035
3.812 eV
x = 0
x = 20
x = 10
ε 2
Photon energy (eV)
x = 15
2.0 2.5 3.0 3.5 4.0 4.50.00000
0.00005
0.00010
0.00015
0.00020
0.00025
0.00030
0.00035
x = 30
x = 25
ε 2
Photon energy (eV)
x = 5
3.767 eV
Fig. 4.7 Imaginary part of the dielectric constant as a function of photon energy.

97
0.0 0.2 0.4 0.6 0.8 1.03.5
3.6
3.7
3.8
3.9
4.0
Ban
d ga
p en
ergy
(eV
)
Compositional parameter RLi
Indirect allowed band gap direct allowed band gap Indirect forbidden band gap direct forbidden band gap
Figure 4.7 shows the imaginary part of the dielectric constant ε2, versus the
photon energy for the studied glass systems. The imaginary part of the complex
dielectric constant ε2 is related to extinction coefficient, which also relates to light
absorption. From the above figures, the optical band gap Eopt can be obtained by
extrapolating the imaginary part of the dielectric constant ε2 to zero as shown in the
figure 4.7. On a comparison of the optical energy gap values obtained from absorption
spectra in the case of indirect allowed transition are in good agreement with the values
estimated from the
Fig. 4.8 Optical band gap energy (for all transition) as a function of compositional
parameter RLi in present glasses.
dielectric measurements ε2. Thus, the type of electronic transition in the present glass
systems is indirect allowed. The values of optical band gap energy Eopt obtained from
the imaginary part of the dielectric constant ε2 are presented in table 4.1. In the
present glasses, the allowed indirect and direct band gap energy varies from 3.54 to
3.83 eV and 3.66 to 3.98 eV, respectively. Srinivasa Rao et al [63] and Huang et al

98
1.5 2.0 2.5 3.0 3.5 4.0
0
1
2
3
4
x = 30
x = 25x = 20
x = 15
x = 5
x = 10lnα
Photon energy (eV)
x = 0
[64] observed large band gap energies around 3.25 eV and 4.18 eV in PbO-Bi2O3-
As2O3-WO3 and Li2O-B2O3-WO3 glasses, respectively. The compositional
dependence of all optical band gap energy, Eopt for the present glass systems is
illustrated in figure 4.8. It is observed that the non-linear variation of band gap energy
with compositional parameter indicates the existence of mixed alkali effect.
Literature on optical properties of mixed alkali glasses support the notion of
defect formation in glass matrix caused by simultaneous movement of two unlike
mobile ions. Agarwal and co workers [45] have reported the existence of mixed alkali
effect in optical band gap in lithium-potassium borate glasses from the existence of a
minimum in optical band gap at equimolar concentrations of alkali cations. The
mixed alkali effect in indirect optical band gap energy is attributed to the formation of
large number of non-bridging oxygens (NBOs). The mixed alkali effect in optical
band gap energy was also reported by several other workers [14, 15, 6].
Fig. 4.9 Plots corresponding lnα vs hν for Li2O-Na2O-WO3-B2O3 glasses.

99
0.0 0.2 0.4 0.6 0.8 1.00.20
0.24
0.28
0.32
0.36
0.40
Urba
ch en
ergy (
eV)
compositional parameter RLi
The lack of crystalline long range order in amorphous or glassy materials is
associated with a tailing of density of states [65]. At lower values of absorption
coefficient, the extent of exponential tail of the absorption edge characterized by the
Urbach energy and it is given by
Fig.4.10. Compositional dependence of Urbach energy (ΔE) in the present
glasses.
α(ν) = C exp(hν/∆E) (4.5)
where C is a constant, ∆E is the urbach energy which indicates the width of the band
tails of the localized states. The optical absorption coefficient just below the
absorption edge shows exponential variation with photon energy indicating the
presence of Urbach’s tail. Figure 4.9 plots the variation of ln(α) against photon
energy, hν. The Urbach energy ∆E is calculated for the glasses taking the reciprocals
of slopes of these curves.

100
Table. 4.1: Cutoff wavelength (λc), Indirect allowed (αhυ)1/2, direct allowed (αhυ)2, indirect forbidden (αhυ)1/3, direct forbidden transitions (αhυ)2/3,
Eopt from ε2 and Urbach energy (ΔE) of the present glasses.
Glass composition λc (nm)
Optical band gap energies (Eo) (eV) ΔE (eV)
Eopt from ε2 (eV)
n = 2 n = 1/2 n = 2/3 n = 1/3
30Na2O-10WO3-60B2O3 338 3.660 3.538 3.602 3.552 0.285 3.534
5Li2O-25Na2O-10WO3-60B2O3 311 3.872 3.773 3.866 3.775 0.342 3.774
10Li2O-20Na2O-10WO3-60B2O3 287 3.977 3.835 4.023 3.808 0.394 3.832
15Li2O-15Na2O-10WO3-60B2O3 313 3.853 3.751 3.836 3.667 0.266 3.749
20Li2O-10Na2O-10WO3-60B2O3 307 3.931 3.818 3.895 3.759 0.288 3.812
25Li2O-5Na2O-10WO3-60B2O3 304 3.857 3.720 3.855 3.711 0.265 3.718
30Li2O-10WO3-60B2O3 313 3.900 3.770 3.893 3.852 0.235 3.767
The values of ∆E for different glass compositions are listed in table 4.1. The
exponential dependence of the optical absorption coefficient with photon energy may
arise from electronic transitions between the localized states. The density of these
states fall off exponentially with energy, which is consistent with the theory of Tauc
[66]. However, the exponential dependence of the optical absorption coefficient on
energy might arise from the random fluctuations of the internal fields associated with
the structural disorder in many materials. Figure 4.10 plots the variation of Urbach
energy ∆E as a function of compositional parameter in present glass systems. From
the above figure it is clear that the Urbach energy varies non-linearly, illustrating the
presence mixed alkali effect.
The dispersion of refractive index plays an important role in the research for
optical materials, because it is a significant factor for optical communication and in
designing devices for optical dispersion. An interesting model namely single
101
oscillator model describing the index dispersion behavior was proposed by Wemple
and Di- Domenico [67, 68].
This model is given to obtain a proper evaluation of the real part of the dielectric
constant ε1(ν). Hypotheses given to satisfy the model:
(1) the important interband transitions can be approximated by individual oscillators
νn,
(2) the summation over oscillators can be approximated, for ν <νn, by a summation
of the first strong oscillator and a proper combination of the higher order
contributions in which only the terms to order ν2 are retained providing a single
effective oscillator model of ε1(ν). It accounts for the dispersion curve according to
the relation:
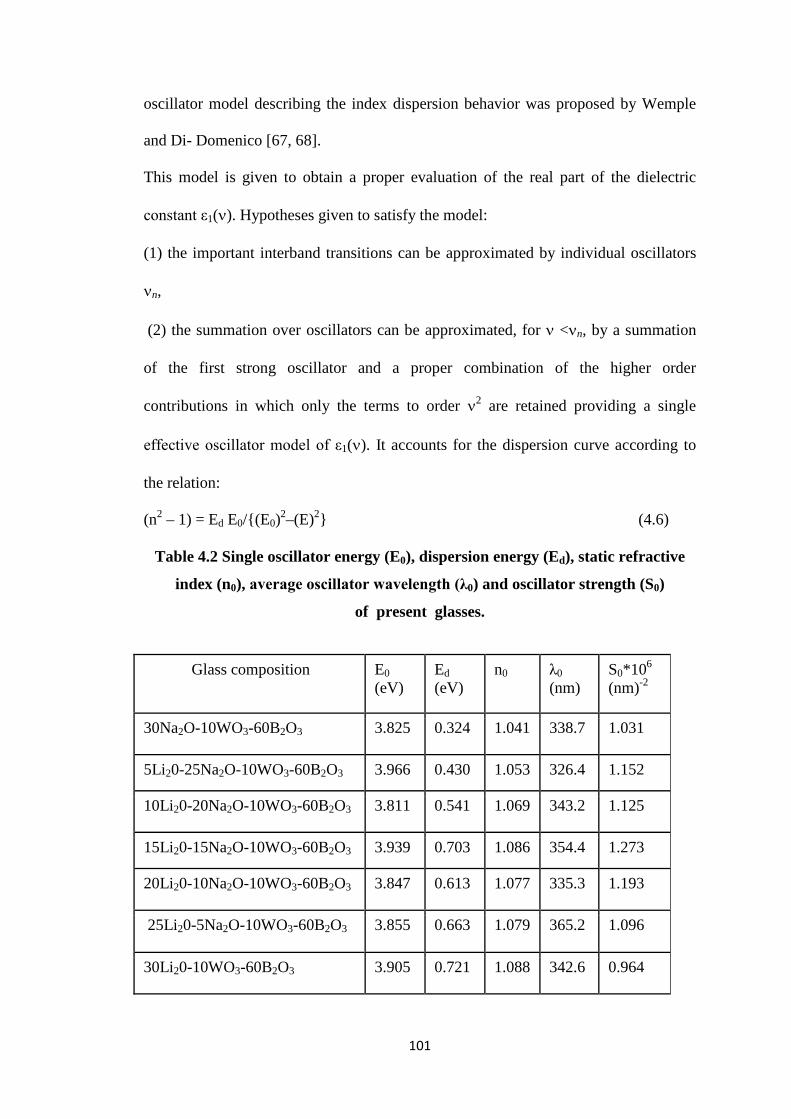
(n2 – 1) = Ed E0/{(E0)2–(E)2} (4.6)
Table 4.2 Single oscillator energy (E0), dispersion energy (Ed), static refractive
index (n0), average oscillator wavelength (λ0) and oscillator strength (S0)
of present glasses.
Glass composition E0 (eV)
Ed (eV)
n0 λ0 (nm)
S0*106 (nm)-2
30Na2O-10WO3-60B2O3 3.825 0.324 1.041 338.7 1.031
5Li20-25Na2O-10WO3-60B2O3 3.966 0.430 1.053 326.4 1.152
10Li20-20Na2O-10WO3-60B2O3 3.811 0.541 1.069 343.2 1.125
15Li20-15Na2O-10WO3-60B2O3 3.939 0.703 1.086 354.4 1.273
20Li20-10Na2O-10WO3-60B2O3 3.847 0.613 1.077 335.3 1.193
25Li20-5Na2O-10WO3-60B2O3 3.855 0.663 1.079 365.2 1.096
30Li20-10WO3-60B2O3 3.905 0.721 1.088 342.6 0.964

102
10 12 14 16 180
1
2
3
4
(hν)2 (eV)2
x= 10x= 25
x= 30
x= 5
1/ (n
2 -1)
x= 20
where E=hν is the photon energy, E0 and Ed are two parameters connected to the
optical properties of the material and they are known as the single oscillator energy
and the oscillator strength (or dispersion energy) respectively. E0 defines the average
energy gap usually considered as the energy separation between the centers of both
the conduction and the valence bands. Ed is a measure of the average strength of the
interband optical transitions and is related to the coordination number of the atoms.
Plotting (n2-1)-1 against (hν)2 , and fitting it to the straight part of the curve in the
high-energy region allows to obtain E0 and Ed (the slope and the intercept values) of
the single oscillator parameters. Figures 4.11 plots the variation of 1/(n2-1) with (hν)2
in the present glass systems. A typical linear fit graph is shown in figure 4.12. The
average electronic energy gap E0 and the electronic oscillator strength Ed for the
present glasses were determined and were listed table 4.2. The values of E0 varies
between 3.811 eV and 3.966 eV and the values of Ed between 0.324 eV and 0.721 eV
in the present glasses.
Fig. 4.11 The relation between 1/(n2-1) and (hν)2 for the present glass system.

103
8 10 12 14 16 180.0
0.5
1.0
1.5
2.0
2.5
3.0
3.5
x = 15
1/ (n
2 -1)
(hν)2 (eV)2
x = 0
Fig. 4.12 A typical linear fit for x = 0 and 15 glass samples.
The static refractive index n0 is the refractive index at zero photon energy.
The static refractive index can be deduced from the dispersion relation as
n0 = {1+ Ed /E0}1/2 (4.7)
The static refractive index n0 can also be determined by extrapolation of the
linear part of 1/(n2-1) verses (hν)2 plots. The evaluated values of n0 for the present
glass systems are presented in table 4.2
The single-oscillator model enables us to calculate the refractive index at
infinite wavelength (static refractive index) n0, average oscillator wavelength λ0 and
oscillator strength S0 through the relation [69]
(n02 - 1) / (n2 - 1) = 1- (λ0
2 / λ2) (4.8)

104
0.000000 0.000003 0.000006 0.000009 0.000012 0.0000150.0
0.5
1.0
1.5
2.0
2.5
3.0
3.5
4.0
x = 0
1/ (n
2 -1)
1/λ2
x = 15
0.000006 0.000008 0.0000100
1
2
3
4 x= 25
x= 10
x= 20x= 5
1/(n
2 -1)
1/λ2 (nm)-2
x= 30
Fig. 4.13 The relation between 1/(n2-1) and 1/λ2 for the present glass system.
Fig. 4.14 A typical linear fit for x = 0 and 15 glass samples.

105
1/ (n2 - 1) = {1- (λ02
/ λ2)} / (n02 - 1)
1/ (n2 - 1) = 1/( n02 - 1) - {λ0
2 / (n02 - 1)}* 1/λ2
1/ (n2 - 1) = 1/( n02 - 1) - 1/ S0 * 1/ λ2
(4.9)
where S0 = (n02 -1) / λ0
2
The values of λ0, and S0 are derived from a linear plot of (n2 – 1)-1 verses 1/
λ2. Figures 4.13 plots the variation of (n2 – 1)-1 verses 1/ λ2 for xLi2O–(30−x)Na2O–
10WO3–60B2O3 glass system, respectively. A typical linear fit graph is shown in
figure 4.14. The oscillator strength S0 and average oscillator wavelength λ0 were
obtained from the slopes and intercepts of the above plots. The values of S0 and λ0 for
the present glasses are given in table 4.2.
The complex dielectric function describes the interaction of electromagnetic
waves with matter. The complex dielectric constant ε of the material in terms of the
optical constants n and k is given as:
(n+ik)2 = ε/ ε0 = (ε1+i ε2)/ ε0 (4.10)
where ε0 is the dielectric constant of free space. Separation of the real part and the
imaginary one leads to the real part, [70,71].
ε1= n2 - k2 = ε∞ - [e2/4π2c2 ε0 ] [Nc/ m*] λ2 (4.11)
and to the imaginary part,
ε2= 2nk = (ε∞ ωp2/8π3c3τ)λ3 (4.12)
Here ε0 is the free space dielectric constant, Nc/m* the ratio of free carrier
concentration, Nc, to the free carrier effective mass, m*, τ is the optical relaxation
time and ε∞ is the high frequency dielectric constant. The plasma frequency ωp for
the valence electrons is given by:
ωp= {e2 Nc / ε0 ε∞ m*}1/2 (4.13)

106
100000 200000 300000 400000 500000 6000001.5
2.0
2.5
3.0
3.5
4.0
4.5
ε∞
x = 20x = 10
Real
part
of di
electr
ic co
nsta
nt (ε
1)
λ2 (nm)2
x = 15
where e is the charge of the electron. The parameters ε∞ and Nc/m* can be obtained
from the ε1 verses λ2 plots. Figure 4.15 plots the variation of real part of the dielectric
constant ε1 as a function of λ2 for xLi2O–(30−x)Na2O–10WO3–60B2O3 glass
system. The evaluated values of ε∞ and Nc/m* of the present glasses were presented in
table 4.3.
Using the values Nc/m* and ε∞, the plasma frequency ωp for the present
glasses were determined and are presented in table 4.3. The optical relaxation time τ
was determined using the equation τ = 1/ ωp and the calculated wavelength λω=ωp that
corresponds to the plasma frequency ωp was evaluated from the relation λω=ωp =
2πc/ωp. Table 4.3 presents the values of τ and λω=ωp for the present glasses.

107
100000 200000 300000 400000 500000 600000
1.5
2.0
2.5
3.0
3.5
4.0
4.5
x = 30x = 25 x = 5
Real
part
of d
ielec
tric c
onsta
nt (ε
1)
λ2 (nm)2
x = 0
ε∞
Fig. 4.15 Dependence of ε1on λ2 in the present glasses.
Table 4.3 High frequency dielectric constant (ε ∞), the ratio of free carrier concentration
to the free carrier effective mass, (Nc/m*), plasma frequency (ωp), optical relaxation
time (τ) and plasma frequency wavelength (λω=ωp)
Glass composition ε∞ Nc/m*10
54
(kg-m3)
ωp*1013
(Hz)
τ*10-15
(Sec)
λ( ω=ωp)
*103Å
30Na2O-10WO3-60B2O3 1.615 73.13 40.10 2.49 47.0
5Li2O-25Na2O-10WO3-60B2O3 1.348 68.90 38.44 2.60 49.0
10Li2O-20Na2O-10WO3-60B2O3 1.400 118.28 49.44 2.02 38.1
15Li2O-15Na2O-10WO3-60B2O3 1.442 113.47 47.70 2.10 39.5
20Li2O-10Na2O-10WO3-60B2O3 1.473 101.51 44.65 2.24 42.0
25Li2O-5Na2O-10WO3-60B2O3 1.489 88.94 32.68 2.89 62.4
30Li2O-10WO3-60B2O3 1.396 97.21 49.59 2.10 46.2

108
0.0 0.2 0.4 0.6 0.8 1.0
1.644
1.646
1.648
1.650
1.652
Ref
ract
ive
inde
x
Compositional parameter RLi
4.4.1 Refractive index
Refractive indices of the present glasses are measured by Brewster’s angle
technique, by using the below equation
n = tan φB (4.14)
Figure.4.16 shows the compositional dependence of refractive index of the
present glasses at room temperature. The refractive index of the present glasses are
presented in Table.4.4, varies from 1.644 to 1.652 and it varies non-linearly,
indicating the presence of mixed alkali effect. Similar mixed alkali effect in refractive
index was observed in mixed alkali zinc borate glasses doped with cobalt [72]. Since
the refractive index of the present glasses are less than 1.7, they can be used as optical
glasses.
Fig. 4.16 Refractive index as a function of compositional parameter RLi in present glasses.

109
The refractive index (n) and the dielectric constant (ε) of the glass are related by [73]
ε = n2 (4.15)
The reflection loss from the glass surface was computed from the refractive index by
using the Fresnel’s formula [74].
R = [(n −1)/(n +1)]2 (4.16)
The molar refractivity Rm for each glass was evaluated using [75]
Rm = [(n2 −1)/(n2 +2)] Vm (4.17)
where Vm is the molar volume. By introducing Avogadro’s number NA, the molar
refraction Rm can be expressed as a function of polarizability αm [76].
Rm= (4 π αm NA) / 3 (4.18)
With αm in (Å3), this equation can be transformed to
Rm= 2.52 αm (4.19)
The evaluated values of no, ε, R, and Rm are presented in table 4.4.
Table 4.4 Refractive index (n), dielectric constant (ε), Reflection loss (R), molar refractivity (Rm) and polarizability (αm) of the present glass system.
Glass composition no ε R Rm (cm-3)
αm (ions/cc)
30Na2O-10WO3-60B2O3 1.6499 2.722 0.0601 10.800 4.286
5Li2O-25Na2O-10WO3-60B2O3 1.6509 2.725 0.0603 10.252 4.068
10Li2O-20Na2O-10WO3-60B2O3 1.6480 2.716 0.0599 10.261 4.072
15Li2O-15Na2O-10WO3-60B2O3 1.6500 2.723 0.0602 10.075 3.998
20Li2O-10Na2O-10WO3-60B2O3 1.6440 2.703 0.0593 9.786 3.883
25Li2O-5Na2O-10WO3-60B2O3 1.6470 2.713 0.0597 9.787 3.884
30Li2O-10WO3-60B2O3 1.6520 2.729 0.0604 9.921 3.937
110
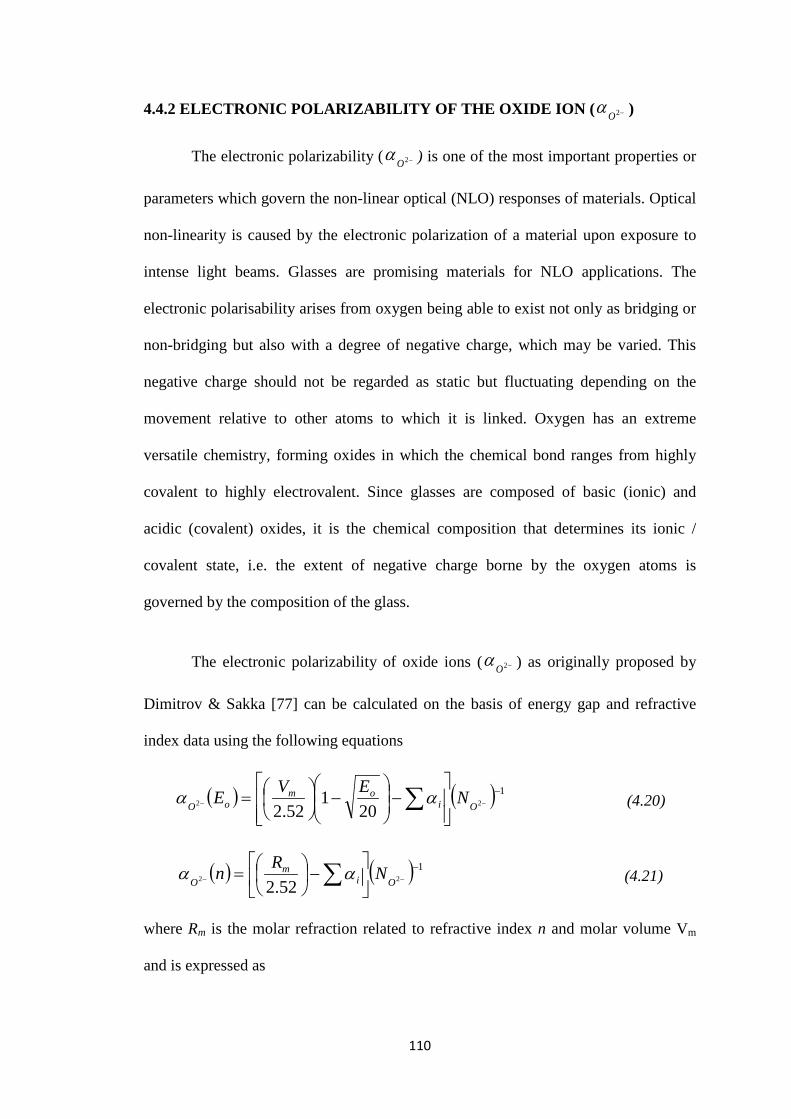
4.4.2 ELECTRONIC POLARIZABILITY OF THE OXIDE ION ( −2Oα )
The electronic polarizability ( −2Oα ) is one of the most important properties or
parameters which govern the non-linear optical (NLO) responses of materials. Optical
non-linearity is caused by the electronic polarization of a material upon exposure to
intense light beams. Glasses are promising materials for NLO applications. The
electronic polarisability arises from oxygen being able to exist not only as bridging or
non-bridging but also with a degree of negative charge, which may be varied. This
negative charge should not be regarded as static but fluctuating depending on the
movement relative to other atoms to which it is linked. Oxygen has an extreme
versatile chemistry, forming oxides in which the chemical bond ranges from highly
covalent to highly electrovalent. Since glasses are composed of basic (ionic) and
acidic (covalent) oxides, it is the chemical composition that determines its ionic /
covalent state, i.e. the extent of negative charge borne by the oxygen atoms is
governed by the composition of the glass.
The electronic polarizability of oxide ions ( −2Oα ) as originally proposed by
Dimitrov & Sakka [77] can be calculated on the basis of energy gap and refractive
index data using the following equations
( ) ( ) 122 20
152.2
−−−
−
−
= ∑ Oi
omoO NEVE αα (4.20)
( ) ( ) 122 52.2
−−−
−
= ∑ Oi
mO NRn αα (4.21)
where Rm is the molar refraction related to refractive index n and molar volume Vm
and is expressed as

111
( )( ) mm VnnR
+−
=21
2
2
(4.22)
where ∑ iα in the above equations denote molar cation polarizability, Rm is the
molar refractivity, and 2ON − denotes the number of oxide ions in the chemical
formula. For a typical glass For a typical glass composition 10Li2O–20Na2O–
10WO3–60B2O3, the value of ∑ iα is given by 2[(0.10) αLi + (0.20) αNa] + [ (0.10)
αW] + 2[(0.60) αB]. The values of αLi = 0.029 Å3, αNa = 0.179 Å3, αW = 0.147 Å3
and ˛αB = 0.002 Å3 are used. The value of NO2− remains constant and is equal to 2.4
for all the glass samples. The calculated values of −2Oα for energy gap data,
designated as −2Oα (Eo) is presented in table 4.5.
4.4.3 OPTICAL BASICITY (Λ)
The optical basicity (Λ) of an oxide medium as proposed by Duffy and Ingram
[78,79] is a numerical expression of the average electron donor power of the oxide
species constituting the medium. It is used as a measure of the acid-base properties of
oxides, glasses, alloys, molten salts etc. The optical basicity can be determined
experimentally from optical absorption spectra of doped ions such as Tl+, Pb2+ or Bi3+
and also from x-ray photoelectron spectroscopy (XPS).
In most circumstances, the characteristic process of acid-base reactions in
oxide systems is "the transfer of an oxygen ion from a state of polarization to
another". In a chemically complex melt or glass the capability of transferring
fractional electronic charges from the ligands (mainly oxide ions) to the central cation
depends in a complex fashion on the melt structure, which affects the polarization
state of the ligand itself. The mean polarization state of the various ligands and their

112
ability to transfer fractional electronic charges to the central cation are nevertheless
represented by the "optical basicity" of the medium [79].
An intrinsic relationship proposed by Duffy [80] exists between electronic
polarizability of the oxide ions −2Oα and optical basicity of the oxide medium Λ and is
given by
−=Λ
−2
1167.1Oα
(4.23)
This relation presents a general trend towards an increase in the oxide ion
polarizability with increasing optical basicity. The optical basicity values obtained by
using −2Oα (Eo) data, from equation (4.23) and designated as Λ(Eo) and is presented in
table 4.5. The optical basicity Λ(Eo) values varies non linearly with increase in Li2O
content.
On the other hand the so-called theoretical optical basicity (Λth), for the
present glasses can be calculated using the following equation which is based on the
approach proposed by Duffy [80]
32323322 22 OBOBWOWOONaONaOLiOLith XXXX Λ+Λ+Λ+Λ=Λ (4.24)
where xLi2O, xNa2O , xWO3 and xB2O3 are the contents of individual oxides in mole%.
ΛLi2O, ΛNa2O, ΛWO3 and ΛB2O3 are the theoretical optical basicity values assigned to
oxides present in the glass. The values ΛLi2O=1,ΛNa2O =1.15, ΛWO3 =1.045 and ΛB2O3
=0.42 are used in the present study [81]. The theoretical optical basicity Λth values
calculated using above equation for the mixed alkali tungsten borate glasses are
presented in table 4.5. It is found that the theoretical optical basicity decreases slightly
with increasing Li2O content. A good agreement exists between the values of Λ(Eo)
and Λth.

113
4.4.4 INTERACTION PARAMETER (A)
The interaction parameter is a quantitative measure for the inter ionic
interaction of negative ions such as F- and O2- with the nearest neighbours. Dimitrov
and Komatsu [82,83] applied the interaction parameter A proposed by Yamashita and
Kurosawa [84] to describe the polarizability state of an average oxide ion in numerous
simple oxides and its ability to form an ionic covalent bond with the cation. The
optical cutoff based interaction parameter A(Eo) can be expressed as a sum from the
parts each cation with the given oxide ion contributes to the total interaction for an
averaged cation anion pair in the glass matrix
( )( )( )
( )( )( ) +
++
−+
++
−=
−++
−
−++
−
−
−
−
−
2
2
2
2
2 22 2ONafNa
OfONa
OLifLi
OfOLi XXA
αααααα
αααααα
( )
( )( )( )
( )( )−++
−
−++
−
++
−+
++
−−
−
−
−
233
2
32233
2
3 2 OBfB
OfOB
OWfW
OfWO XX
αααααα
αααααα
(4.25)
where −fα = 3.921 Å3
, the electronic polarizability of the free oxide ion is used, taking
into account the value of ionic refraction of O2- theoretically determined by Pauling
[85] and −2Oα corresponds to −2Oα (Eo) and −2Oα (n) . The energy gap based interaction
parameter A(Eo) and A(n) are determined from equation (4.25) and are presented in
table 4.5.It has been established that the Yamashita-Kurosawa interaction parameter A
is closely related to the oxide ion polarizability and optical basicity of oxide glasses.
That is, larger the oxide ion polarizability and optical basicity, the smaller is the
interaction parameter. The correlation between A and Λ for present glasses are shown
in figure 4.17and figure 4.18 indicating a linear distribution of the optical basicity
with respect to the interaction parameter and this can be used as the optical basicity
scale for oxide glasses. The interaction parameter decreases with increasing optical

114
1.00 1.02 1.04 1.06 1.080.05
0.06
0.07
0.08
Inter
actio
n par
amete
r A(E
o)
Optical basicity(Eo)
0.60 0.62 0.64 0.66 0.68 0.70 0.72 0.74 0.76 0.78 0.80
0.165
0.170
0.175
0.180
0.185
0.190
0.195
0.200
Inte
ract
ion
para
met
er A
(n)
Optical basicity Λ(n)
4.17 Relationship between optical basicity (E0) and interaction parameter A(Eo)
in the present glasses.
4.18 Relationship between optical basicity (E0) and interaction parameter A(Eo) in the present glasses.

115
basicity. It is observed in the present study, that the glasses containing large
intermediate values of Λ and A.
Based on good correlation among electronic polarizability of oxide ions
( −2Oα ), optical basicity (Λ) and interaction parameter (A), the various simple oxides
can be classified into three groups.
(1) Semicovalent acidic oxides, Eg. B2O3, P2O5, SiO2 etc. These have
low −2Oα ---- (1-2 Å3)
low Λ ---- ( < 1)
large A ---- (0.20 - 0.25 Å3)
Table 4.5: Energy gap and refractive index based oxide ion polarizability (αO2-),
and interaction parameter A, theoretical optical basicity Λ th and optical basicity Λ(E0 and n) of present glasses.
Glass composition (αO2-)
(Eo) A(Eo) Λth Λ(Eo) (αO2
-) (n)
A(n) Λ (n)
30Na2O-10WO3-60B2O3 2.785 0.052 0.702 1.070 1.734 0.167 0.707
5Li2O-25Na2O-10WO3-60B2O3 2.581 0.071 0.694 1.023 1.649 0.183 0.784
10Li2O-20Na2O-10WO3-60B2O3 2.582 0.070 0.687 1.023 1.657 0.182 0.662
15Li2O-15Na2O-10WO3-60B2O3 2.555 0.069 0.679 1.016 1.633 0.188 0.647
20Li2O-10Na2O-10WO3-60B2O3 2.489 0.066 0.672 0.999 1.591 0.197 0.620
25Li2O-5Na2O-10WO3-60B2O3 2.511 0.077 0.664 1.005 1.597 0.198 0.624
30Li2O-10WO3-60B2O3 2.524 0.076 0.657 1.008 1.626 0.193 0.642

116
(2) Normal ionic (basic) oxides, Eg. TeO2, In2O3 etc. These have
intermediate −2Oα ---- (2-3 Å3)
Λ ---- ( close to 1)
intermediate A ---- (0.02 - 0.08 Å3)
(3) Very ionic or very basic oxides, Eg. BaO, Bi2O3 etc. These have
high −2Oα ---- ( > 3Å3)
high Λ ---- ( > 1)
small A ---- (0.003 - 0.008 Å3)
From the obtained values of −2Oα , Λ and A, the present glasses fall in the group (2)
i.e. normal ionic (basic) oxides.
117
4.5 CONCLUSIONS
The following conclusions are drawn from the study of optical properties on
xLi2O–(30-x)Na2O–10WO3–60B2O3 glass.
• The non-sharp absorption edges in the present study give a clear indication of
the amorphous nature of the glasses. The cut-off wavelength varies non-
linearly when Li2O is replaced with Na2O. This non-linear variation in cut-off
wavelength is a consequence of mixed alkali effect.
• The refractive index decreases with an increasing wavelength (low
wavelength region) of the incident photon energy until a constant value is
reached at longer wavelengths.
• On a comparison of the optical energy gap values obtained from absorption
spectra in the case of indirect allowed transition are in good agreement with
the values estimated from the dielectric measurements. Thus, the type of
electronic transition in the present glass systems is indirect allowed.
• The observed non-linear variation of band gap energy with compositional
parameter indicates the existence of mixed alkali effect.
• The Urbach energy also varies non-linearly, illustrating the presence mixed
alkali effect.
• Using single oscillator model, the oscillator energy E0, the dispersion energy
Ed, the static refractive index n0, the oscillator strength S0 and average
oscillator wavelength λ0 were determined. The values of E0 varies between
3.811 eV and 3.966 eV and the values of Ed between 0.324 eV and 0.721 eV
in the present glass systems.

118
• The ratio of free carrier concentration to the free carrier effective mass Nc/m*,
the optical relaxation time τ and ε∞ the high frequency dielectric constant were
determined in the present glass systems.
• The real and imaginary parts of the optical conductivity dependence of energy
in xLi2O–(30−x)Na2O–10WO3–60B2O3 glasses increases non-linearly with
increasing photon energy. This suggests that the increase in optical
conductivity is due to electron excitation by photon energy. The non-linear
variation of optical conductivity with compositional parameter indicates the
existence of mixed alkali effect.
• Energy band gap based electronic polarizability of oxide ions −2Oα (E0),
optical basicity Λ(E0) and interaction parameter A(E0) were evaluated for the
present glass systems. From the obtained values of −2Oα , Λ and A, the present
glasses were classified as normal ionic (basic) oxides.
119
REFERENCES
[1] M. Farouk, S. A. Fayek, M. Ibrahem, M. El Okr, Annals of Nuclear Energy 56
(2013) 39.
[2] D. Rajesh, Y.C. Ratnakaram, A. Balakrishna, J. Alloys Compd. 563 (2013) 22.
[3] M.V. Sasi Kumar, D. Rajesh, A. Balakrishna, Y.C. Ratnakaram, Physica B:
Condensed Matter 415 (2013) 67.
[4] B. V. Padlyak, V. T. Adamiv, Ya.V. Burak, M. Kolcun, Physica B: Condensed
Matter 412 (2013) 79.
[5] S. Sailaja, C. N. Raju, C. A. Reddy, B. D. P. Raju, Young-Dahl Jho, B. S.
Reddy, J. Mol. Struct. 1038 (2013) 29.
[6] R.S. Gedam, D.D. Ramteke. J. Rare Earths 30 (2012) 785.
[7] Shaik kareem Ahmmad, M.A. Samee , A. Edukondalu, Syed Rahman, Results
in Physics 2 (2012) 175.
[8] G. Krishna Kumari, Sk. Muntaz Begum, Ch. R. Krishna, D.V. Sathish, P.N.
Murthy, P.S. Rao and R.V.S.S.N. Ravikumar, Mater. Res. Bull., 47 (2012) 2646.
[9] M. A. Samee, A. M. Awasthi, T. Shripathi, Shashidhar Bale, Ch. Srinivasu,
Syed Rahman, J. Alloys Compd. 509 (2011) 3183.
[10] M. Abdel-Baki and F. El-Diasty, J. Solid State Chemistry 184 (2011) 2762.
[11] T. Raghavendra Rao, Ch. Rama Krishna, Ch. Venkata Reddy, U.S.
Udayachandran Thampy, Y.P. Reddy, P.S. Rao, R.V.S.S.N. Ravikumar.
Spectrochimica Acta Part A: Molecular and Biomolecular Spectroscopy 79
(2011) 1116.
[12] R. Vijaya Kumar, Shashidhar Bale, Ch. Srinivasu, M. A. Samee, K. Siva
Kumar, Syed Rahman, J. Alloys Compd. 490 (2010) 1.
[13] Y. B. Saddeek, K.A. Aly, A. Dahshan, I.M. El- Kashef, J. Alloys Compd. 494

120
(2010) 210.
[14] M. Seshadri, Y.C. Ratnakaram, D. Thirupathi Naidu, K. Venkata Rao, Opt.
Mater. 32 (2010) 535.
[15] T. Komatsu, T. Honma, V. Dimitrov, J. Non-Cryst. Solids 356 (2010) 2310.
[16] M. A. K. Elfayoumi, M. Farouk, M. G. Brik, M. M. Elok, J. Alloys Compd. 492
(2010) 712.
[17] G. Padmaja, P. Kistaiah, Solid State Sciences, 12 (2010) 2015.
[18] M. Subhadra, P. Kistaiah J. Alloys Compd. 505 (2010) 634.
[19] C. Venkateswarlu, G.N. Hemantha Kumar, M. Seshadri, Y.C. Ratnakaram,
K.S.R. Koteswara Rao and J.L. Rao, J. Alloys Compd. 502 (2010) 97.
[20] C.R. Kesavulu, R.P.S. Chakradhar, C.K. Jayasankar, J. L. Rao, J. Mol. Struct.
975 (2010) 93.
[21] G Padmaja, T.G. Reddy and P. Kistaiah, Philosophical Magazine Letters 91
(2011) 97.
[22] G.N. Hemantha Kumar, J. L. Rao, K. Ravindra Prasad, Y.C. Ratnakaram. J.
Alloys Compd. 480 (2009) 208.
[23] R.P. S. Chakradhar, B. Yasoda, J.L. Rao, N.O. Gopal J. Non-Cryst. Solids, 353
(2007) 2355.
[24] R.P. S. Chakradhar, K.P. Ramesh, J.L. Rao and J. Ramakrishna, Mater. Res.
Bull. 40 (2005) 1028.
[25] A.H. Khafagy, A.A. El-Adawy, A.A. Higazy, S. El-Rabaie and A.S. Eid, J.
Non-Cryst. Solids 354 (2008) 3152.
[26] M. Abdel-Baki, F.A. Abdel-Wahab, A. Radi, F. El-Diasty, J. Phys. Chem.
Solids 68 (2007) 1457.
121
[27] R. Balaji Rao , R. A. Gerhardt, N. Veeraiah, J. Phys. Chem. Solids 69
(2008)2813.
[28] Khaled H. Mahmoud, Int. J. Appl. Ceram. Technol. 6 (2009) 279.
[29] J. Pisarska J. Phys.: Condens. Matter 21 (2009) 285101.
[30] El. Batal, Indian J. Pure Appl. Phys. 47 (2009) 471.
[31] S.M. Kaczmarek, Opt. Mater. 19 (2002) 189.
[32] K. Marimuthu, S. Surendra babu, Muralidharan, S. Arumugam, C.K.
Jayasankar, Phys. Status. Solidi. A, 206 (2009) 131.
[33] Y.B. Saddeek, I.S. Yahia, K.A. Aly, W. Dobrowolski, Solid State Sciences, 12
(2010)1426.
[34] N. G. C. Astrath, L. C. Malacarne, J. H. Rohling, A. N. Medina, M. L.
Baesso, A. Steimacher, C. Jacinto, B. Karthikeyan, Opt. Mater. 33 (2011) 1563.
[35] A. Srinivasa Rao, J. L. Rao, Y. N. Ahammed, R. R. Reddy, T.V. Ramakrishna
Rao, Opt. Mater. 10 (1998) 129.
[36] S. Rani, S. Sanghi, N. Ahlawat, A. Agarwal, J. Alloys Compd. 597 (2014)
110.
[37] Simon Striepe, Morten M. Smedskjaer, Joachim Deubener, Ute Bauer, Harald
Behrens, Marcel Potuzak, Randall E. Youngman, John C. Mauro, Yuanzheng
Yue, J. Non-Cryst. Solids 364 (2013)44.
[38] M. A. Marzouk, , F. H. ElBatal, W. H. Eisa, N. A. Ghoneim, J. Non-Cryst.
Solids 387 (2014) 155.
[39] N. Sdiri, H. Elhouichet, M. Ferid, J. Non-Cryst. Solids, 389 ( 2014) 38.
[40] Sk. Mahamuda, K. Swapna, A. Srinivasa Rao, M. Jayasimhadri, T. Sasikala, K.
Pavani, L. R. Moorthy, J. Phys. Chem. Solids 74 (2013) 1308.
122
[41] H. Lin, K. Liu, L. Lin, Y. Hou, D. Yang, T. Ma, E. Yun Bun Pun, Q. An, J. Yu
and S. Tanabe, Spectrochimica Acta Part A: 65 (2006) 702.
[42] R.S. Kaundal, S. Kaur, N. Singh, K.J. Singh, J. Phys. Chem. Solids 71 (2010)
1191.
[43] R. V. Barde, S. A. Waghuley, J. Non-Cryst. Solids (2013) 117–125.
[44] L. Rama Moorthy, A. Radhapathy, M. Jayasimhadri, D.V.R. Moorthy,
R.V.S.S.N. Ravi Kumar, J. Alloys Compd. 408 (2006) 724.
[45] A. Agarwal, V. P. Seth, S. Sanghi, P. Gahlot, S. Khasa, Materials Letter 58
(2004) 694.
[46] Yasser Saleh Mustafa Alajerami, Suhairul Hashim, Wan Muhamad Saridan
Wan Hassan, Ahmad Termizi Ramli, Physica B 407 (2012) 2390.
[47] João Coelho, Cristina Freire , N. Sooraj Hussain, Spectrochimica Acta Part
A 86 (2012) 392.
[48] M. Subhadra and P. Kistaiah J. Phys. Chem. A, 115 (2011) 1009.
[49] M.A. Samee, A. Edukondalu, Shaik Kareem Ahmmed, Syed Rahman, J.
Electronic Materials 42 (2013) 2526.
[50] M. A. Marzouk, Y. M. Hamdy, H. A. ElBata, J. Mol. Str. 1056 (2014) 227.
[51] A. Shanmugavelu, V. Venkatramu, V.V. Ravi Kanth Kumar, Spectrochimica
Acta Part A: Molecular and Biomolecular Spectroscopy 122 (2014) 422.
[52] R. Lakshmikantha, N.H. Ayachit, R.V. Anavekar, J. Phys Chem. Solids 75
(2014) 168.
[53] A. Agarwal, S. Khasa, V.P. Seth, S. Sanghi, M. Arora, J. Mol. Stru. 1060 (2014)
182.
[54] R.S. Kundu, S. Dhankhar, R. Punia, K. Nanda, N. Kishore, J. Alloys Compd.
587 ( 2014) 66.

123
[55] L. Jyothi, G. Upender, R. Kuladeep, D. N. Rao, Mater. Res. Bull. 50 ( 2014)
424.
[56] Sunil Thomas, Rani George, Sk. Nayab Rasool, M. Rathaiah, V. Venkatramu,
Cyriac Joseph, N.V. Unnikrishna, Opt. Mater. 36 (2013) 242.
[57] S. El-Rabaie, T.A. Taha, A.A. Higazy, Physica B 432 (2014) 40.
[58] R. Sheibani, C. A. Hogarth, J. Mater. Sci. 26 (1991) 429.
[59] K. Subramanyam, M. Salagram, Opt. Mater. 15 (2000) 181.
[60] E.A. Davis, N.F. Mott, Philosophical Magazine 22 (1970) 903.
[61] J. Tauc, A. Menth, J. Non-Cryst. Solids 8 (1972) 569.
[62] D.P. Gosain, T. Shimizu, M. Ohmura, M. Suzuki, T. Bando, S. Okano. J. Mater.
Sci. 26 (1991) 2371.
[63] N.S. Rao, P.R. Rao, Y. Gandhi, Ch.S. Rao, G.S. Baskaran, V. Ravi Kumar,
N. Veeraiah, Physica B 406 (2011) 4494.
[64] P. Huang, X. Huang, F. Gan, Solid State Ionics 57 (1992) 169.
[65] M.A. Hassan, C.A. Hogarth, J. Mat. Sci. 23 (1988) 2500.
[66] J. Tauc, Amorphous and Liquid Semiconductor, Plenum, New York, 1974.
[67] S. H. Wemple, M. Di Domenico, Phys. Rev. B 3 (1971) 1338.
[68] S. H. Wemple, Phys. Rev. B 7 (1973) 3767.
[69] F.Yakuphanoglu, M. Durmus, M. Okutan, O. Koysal, V.Ahsen, Physica. B 373
(2006) 262.
[70] D. R. Penn, Phys. Rev., B128 (1962) 2093.
[71] A. Bakry, Egypt. J. Solids 31 (2008) 191.
[72] T. Raghavendra Rao, Ch. Venkata Reddy, Ch. Rama Krishna, U.S.
Udayachandran Thampy, R. Ramesh Raju, P. Sambasiva Rao, R.V.S.S.N.
Ravikumar, J. Non-Cryst. Solids 357 (2011) 3373.
124
[73] Y. Ohisti, S. Mitachi, T. Tanabe, Phys. Chem. Glasses 24 (1983) 135.
[74] J.E. Shelby, J. Ruller, Phys. Chem. Glasses 28 (1987) 262.
[75] A. Klinokowski, J. Non-Cryst. Solids 72 (1985) 117.
[76]. V. Dimitrov, S. Sakka, J. Appl. Phys. 79 (1996) 1736.
[77] V. Dimitrov and S. Sakka, J. Appl. Phys. 79 (1996) 1736.
[78] J.A. Duffy, Phys. Chem. Glasses 30 (1989) 1.
[79] J. A. Duffy and M. D. Ingram, J. Non-Cryst. Solids 21 (1976) 373.
[80] J. A. Duffy and M. D. Ingram, J. Am. Chem. Soc 93 (1971) 6448.
[81] R. W. Young, J. A. Duffy, G. J. Hassall and Z. Xu, Ironmaking Steelmaking 19
(1992) 201.
[82] V. Dimitrov and T. Komatsu, J. Ceram. Soc. Jpn 107 (1999) 1012.
[83] V. Dimitrov and T. Komatsu, J. Ceram. Soc. Jpn 108 (2000) 330.
[84] J. Yamashita and T. Kurosawa, J. Phys. Soc. Jpn. 10 (1955) 610.
[85] L. Pauling, Proc. Roy. Soc. Lon. A 114 (1927) 181.