opportunities in natural fiber composites - lucintel · creating the equation for growth natural...
TRANSCRIPT

Creating the Equation for Growth
Opportunities in Natural Fiber Composites
Creating the Equation for Growth
Lucintel Brief
Published: March 2011
Lucintel
1320 Greenway Dr., Suite 870, Las Colinas, TX 75038, USA.
Tel: +1-972-636-5056, E-mail: [email protected]
Copyright © Lucintel

Creating the Equation for Growth
Table Of Content
2
• Executive Summary
• Natural Fiber Composites Market Overview
• Natural Fiber Composites Competitiveness and Market Opportunity
• Market Trends and Opportunity
• Growth Opportunities in 2011 and Beyond
• Conclusions
• About Lucintel

Creating the Equation for Growth
Executive Summary
• Global natural fiber composites market reached $2.1B in 2010, with compound annual
growth rate of 15% in last five years
• Automotive & Construction: largest segments among natural fiber composite applications
• Bast fiber such as flax, Kenaf, hemp, etc. are materials of choice for automotive, while
wood plastic composite are preferred by building and construction players
• North American natural fiber composites market was largest for wood plastic division
whereas Europe is leader in automotive segments
• Driven by Government support, environmental regulations, and customer acceptance
• By 2016, natural fiber composite market expected to reach $ 3.8B (10% CAGR)
• Strong market opportunities driven by (i) Rising prices of petroleum based products, (ii)
strong government support for eco-friendly products, (iii) higher acceptance and (iv) lower
price of natural fiber composites
• Major challenges for natural fibers composite industry is natural fiber quality, such as fiber
degradation during processing, sensitive to humidity and fiber consistency/quality
• Performance improvement in materials will drive growth for natural fiber composites in new
application areas
3

Creating the Equation for Growth
Table Of Content
4
• Executive Summary
• Natural Fiber Composites Market Overview
• Natural Fiber Composites Competitiveness and Market Opportunity
• Market Trends and Opportunity
• Growth Opportunities in 2011 and Beyond
• Conclusions
• About Lucintel

Creating the Equation for Growth
Evolution of Natural Fiber Composites: Henry ford developed first car
with hemp fiber but due to economic limitations did not enter the market
5
Ap
plic
ati
on
s
Ma
teri
als
T
ime
Fra
me
Straw
Clay/mud
reinforced
composites
3000 year ago 1939
Flax+
Phenolic
Fuselage
skins of
spitfires
Hemp
Prototype
composite car
by Henry Ford
1942 1950-1990
Cotton +
Polyester
Body of
“Trabant” car
in Germany
Flax, Hemp,
kenaf, Abaca
Number of
Automotive
applications
2000 onwards 2004 onwards
Kenaf + PLA
E&E: Cases
of cellular
phones
Flax, Hemp,
kenaf
Sporting
goods
2006 onwards
In Egypt
clay/mud
reinforced by
straw to build
walls.
First
production
car built from
Natural fiber
compoites
Shortage of
Aluminum in
England, led
to use natural
fiber

Creating the Equation for Growth
Reinforced Natural Fiber Classification: Vegetable fibers are used as
reinforced material with two segments wood and non wood fibers
6
Seed/ Fruit
Bast Leaf Stalk Grass, Cane
Cotton
Kapok
Milkweed
Coir
Flax
Hemp
Jute
Ramie
Kenaf
Pineapple
(PALF)
Abaca
(Manila - hemp
) Henequen
Sisal
Wheat
Maize
Barley
Rye
Oat
Rice
Bamboo
Bagasse
Esparto
Sabei
Phragmites Communis
Non-Wood Fiber Wood Fiber
Natural Fiber
Hard Wood/
Soft
Wood
Recycled
Wood

Creating the Equation for Growth
Natural Fiber Composite Applications
7
Automotive
Door panels Seat backs Headliners
Dash boards Trunk liners
Compression Molding Injection Molding
Electrical & Electronics
Mobile cases Laptop cases
Injection Molding
Sporting Goods
Tennis Racket Bicycle Frames
Snowboards
Oven Cure
Construction
Door panels
Decking
Railing
Window
Frames
Extrusion
Compression
Molding
Injection
Molding

Creating the Equation for Growth
Table Of Content
8
• Executive Summary
• Natural Fiber Composites Market Overview
• Natural Fiber Composites Competitiveness and Market Opportunity
• Market Trends and Opportunity
• Growth Opportunities in 2011 and Beyond
• Conclusions
• About Lucintel
Creating the Equation for Growth
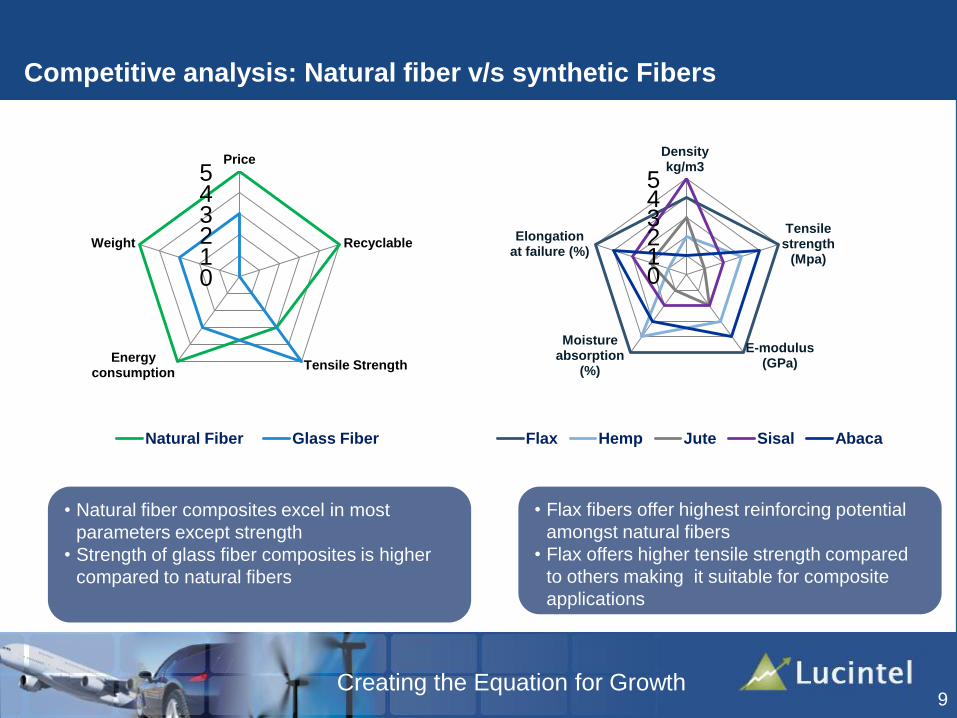
Competitive analysis: Natural fiber v/s synthetic Fibers
0 1 2 3 4 5
Price
Recyclable
Tensile Strength Energy
consumption
Weight
Natural Fiber Glass Fiber
9
0 1 2 3 4 5
Density kg/m3
Tensile strength
(Mpa)
E-modulus (GPa)
Moisture absorption
(%)
Elongation at failure (%)
Flax Hemp Jute Sisal Abaca
• Natural fiber composites excel in most
parameters except strength
• Strength of glass fiber composites is higher
compared to natural fibers
• Flax fibers offer highest reinforcing potential
amongst natural fibers
• Flax offers higher tensile strength compared
to others making it suitable for composite
applications

Creating the Equation for Growth
10
5 5 5
Key Fibers Automotive Construction E & E Sporting Goods
Flax
Hemp
Jute/Kenaf
Sisal
Abaca
Wood
Competing Natural Fiber in Different Applications
High Medium Low-Medium Low None
• Flax, hemp & kenaf are widely used for automotive interior application, with usage of these fibers just
begun in E & E and sporting goods applications
• Wood fiber is material of choice for construction due to lower life cycle cost and ease of maintenance
• Past shows European players have strong usage of flax, hemp and kenaf, whereas wood fiber has shown
significant growth in North America region

Creating the Equation for Growth
–
+
Pe
rfo
rma
nc
e/ P
ric
e R
ati
o (
str
en
gth
/$
)
Average amount per car (lbs)
Performance Price Comparison of Competing Materials for Automotive
Applications
11
–
Materials
Average
amount per
car (lbs)
Performance
/Price ratio
(Strength/$)
Steel 2000 1.1
Aluminum 600 0.2
FRP 77 0.7
Natural
Fiber Comp. 35.2 1.5
When taking into consideration the
density of steel, its relative performance
compares well to composites . . . .
+
Steel
Aluminum
Glass Fiber Composites (FRP)
Natural Fiber Composites

Creating the Equation for Growth
–
+
Pe
rfo
rma
nc
e/ P
ric
e R
ati
o (
Sp
. S
tre
ng
th/$
)
Average amount per car (lbs)
Performance Price Comparison of Competing Materials for Automotive
Applications
12
–
Materials
Average
amount per
car (lbs)
Performance
/Price ratio
(Specific
strength/$)
Steel 2000 0.15
Aluminum 600 0.08
FRP 77 0.36
Natural Fiber
Comp. 35.2 1.15
For equal volumes, composites
outperforms steel and aluminum.
Natural fibers has additional strong
penetration potential
+
Steel
Aluminum
Glass Fiber Composites (FRP)
Natural Fiber Composites

Creating the Equation for Growth
Composites (fiber reinforced plastics– glass and carbon fiber based)
Penetration in Various Market Segments: Natural fiber composites have
significant potential in transportation and construction market
13
Market Segment
Composite
Materials
Market
Structural
Materials Market
(Steel, Al &
Composites)
Composites
Penetration
Performance
Gap Price Gap
Transportation $2.7 B $75.7 B 3.6%
Marine $0.5 B $0.7 B 68%
Aerospace $2.0 B $19.1 B 10%
Pipe & tank $2.1 B $29.6 B 7%
Construction $3.1 B $78 B 4%
Wind Energy $2.0 B $5.4 B 38%
Consumer Goods $1.1 B $7.7 14%
0% – 25% 25% – 50%
Source: Lucintel

Creating the Equation for Growth
Table Of Content
14
• Executive Summary
• Natural Fiber Composites Market Overview
• Natural Fiber Composites Competitiveness and Market Opportunity
• Market Trends and Opportunity
• Growth Opportunities in 2011 and Beyond
• Conclusions
• About Lucintel

Creating the Equation for Growth
External Forces Shaping the Natural Fiber Composites Industry: Future higher
market fragmentation expected due to emerging economies. Companies in
Developed nations with innovation capability can thrive and gain share.
15
Natural Fiber
Composites
Industry
Suppliers Customers
Competitors
Workforce Technology
Regulators
• Specialization
• Efficiency
• Quality enhancement
• Uniformity in fibers
• Strategic sourcing
• Competition from
traditional material
markets
• Focus/specialization
• Skills
• Availability
• Location
• Proper utilization • Natural disaster
• Global recession
• Political instability
• Technical Service
• Specialization
• Efficiency
• Value-added
Catastrophe Distributors
• Innovation
• Performance
improvement
• Process
improvement
• Capital
• Directives on waste
and recycling
• Legislative on carbon
reduction
• Tax credits on
renewable
• Government programs
for natural products
• Awareness towards green
products
• Global platforms
• Technical service
• Partnership
• Application
development

Creating the Equation for Growth
16
Natural Fiber Composites Trend and Forecast 2005 - 2016
Natural Fiber Composites Trend & Forecast
2005 – 2016 (US$M)
Key Insights
3,805
2,171
1,086
2005 2010 2016
+15%
+10%
Notes: Market includes wood and non wood natural fiber
composite markets
• Natural fiber composites has
experienced healthy growth in last 5
years
• Market has two segments: wood fiber
and non-wood fibers
– Automotive is largest segment for
non-wood fibers
– Construction is for wood fibers
• Europe is largest region for
Automotive applications
• North America is largest region for
Building & Construction applications
• Natural fiber composites are new to
E&E and Sporting goods applications
• Environmental concerns are making
natural fiber composites suitable in
various new applications

Creating the Equation for Growth
Trend in GDP in Various Regions : 2005 - 2010
0%
5%
10%
15%
20%
25%
30%
35%
0% 5% 10%Na
tura
l F
ibe
r C
om
po
site
s g
row
th
rate
(20
05
-20
10
)
GDP growth rate(2005-2010)
Trend GDP vs Natural Fiber Composite in various regions :
2005 - 2010
North America
Europe
Others
Notes:
• Others includes Asia and rest of the world
• Bubble size represents market size 2010 ($ M)
• Natural fiber composites has
observed positive growth in
each region, and surpassed
GDP growth
• Natural Fiber Composites
industry performed well relative
to GDP during last 5 years, and
is expected to continue to grow
higher than GDP over next 5
years
17
Source: Lucintel

Creating the Equation for Growth
Notes:
• Others includes Asia and rest of the world
• Bubble size represents market size 2010 ($ M)
North America
Europe
Others-1
0
1
1
2
2
3
3
4
4
0 10 20 30 40 50
Na
tura
l Fib
er
Co
mp
osi
tes
vo
lum
e
pe
r ca
pit
a (
lbs/
cap
ita
) 2
01
0
GDP per capita ($ thousand/capita) 2010
Natural Fiber Composites potential in different regionsMarket Leader:
• North America is leader in natural fiber
composites consumption followed by
Europe
Potential Market:
• Europe shows potential due to
increasing awareness and
acceptance of natural fiber
composites by automotive players
• Asia has significant growth potential
as penetration per capita is
significantly lower than developed
nations
Natural Fiber Composites Potential in Different Regions
18
Source: Lucintel

Creating the Equation for Growth
Table Of Content
19
• Executive Summary
• Natural Fiber Composites Market Overview
• Natural Fiber Composites Competitiveness and Market Opportunity
• Market Trends and Opportunity
• Growth Opportunities in 2011 and Beyond
• Conclusions
• About Lucintel

Creating the Equation for Growth
Growth Opportunities of Natural Fiber Composites in Various
Applications
–
+
Gro
wth
Ra
te
Market Size
Building & construction
Automotive
E&E
Sporting
• Demand for natural fiber composites
expected to be high in automotive and
construction applications due to:
• Awareness towards green
products and increasing
acceptability
• Need for light weight and cost
effective products
• Reduce global warming impact
• Governmental support
• Natural fiber composites are new in
E& E and sporting segments, but has
healthy potential to capture good
market share in near future –
+
Key Insights
20

Creating the Equation for Growth
Drivers and Challenges
21
Major Drivers
Government
Support
Volatility in Oil
prices
Key Challenges
Material
quality
Inventory of
raw material
• Legislative/policy commitment to
carbon reduction
• Uniformity and consistency of raw
material are major industry
challenges
• Lower impact strength, not
suitable for applications requiring
optimal strength
• Low UV resistance limits market
Processing
• Natural Fiber variability and subsequent degradation while manufacturing composite products
• Technological improvements needed
Raw material
source
• Natural fiber composites made
with easily available renewable
sources
Properties • Lighter weight, low energy
consumption and low cost
product
Environmental
advantages
• Natural fiber composites are eco
friendly and help to reduce global
warming effect
• Fibers are hydrophilic which drives
potential degradation and
biological attack by fungi
• Subsequent difficulty to store for
long periods of time made more
acute by dependency on seasonal
production
• Impacts substitute materials
market and NFC costs less so
• Encourage world to use NFC

Creating the Equation for Growth
22
Racing Bicycle with
NFC:
• Museeuw Bikes has
developed first
racing bike with flax
carbon epoxy
prepreg
Model Name:
• MF1, MF3, MF5
Material used:
• Reinforcement: Flax,
Hemp
• Resin: Epoxy
Advantages
• Good anti-vibration
property
• low cost
Eco Mobile by NEC
2006:
• First time in world an
environmentally
sound material has
been used for a
mobile phone casing
Model Name:
• “FOMA(R)
N701iECO”
Material used:
• Reinforcement:
Kenaf
• Resin: Poly Latic
acid
Advantages
• Heat resistant
• Environment friendly
Innovations in Automotive:
1.OEM & Model Name:
• Ford Motor Co., 2010 FordFlex CUV
Applications:
• Trim bin
Material & Process:
• Wheat-Straw-Reinforced PP, Injection
molding
2. OEM & Model Name:
• BMW 2008MY BMW 7 Series Luxury Sedan
Applications:
• Door Panel
Material & Process:
• Prepreg of Natural fiber with acrylic polymer,
Compression molding
3.Process Innovation
• Highly automated D-LFT process by Damlier
Chrysler
Innovations in Natural Fiber Composites Market

Creating the Equation for Growth
23
Applications Fiber Size of
Opportunity Advantages Disadvantages
Door
panel/inserts
Kenaf/ Hemp
Wood fiber
Medium • Lower weight
• Lower cost
• Eco friendly
• Friendly
processing
• Thermal
recycling is
possible
• Good thermal
and acoustic
insulation
• Lower
strength
• High
moisture
absorption
• Lower
durability
• Poor fire
resistance
Rear parcel
shelves
Kenaf
Flax
Medium
Seatbacks Flax Medium
Spare tire
covers
Flax Medium
Other interior
trim
Kenaf
Flax
Small
Spare-wheel
pan
Abaca Medium
Natural fiber in automotive applications: Bast fiber such as flax, hemp
& kenaf are most suitable natural fibers for various automotive
applications and are focused on lower strength needs
Door Inserts
Door Panel
Interior Door Panel
DaimlerChrysler’s model with abaca + pp Mercedes E class reduced 20% weight with NFC

Creating the Equation for Growth
24
Applications Fiber Size of
Opportunity Key Drivers Disadvantages
Decking • Wood
flour/fiber:
mainly
natural
wood
alternatives
construction
applications
• Flax
• Rice husk
• Bagasse
High • Low life cycle cost
• Low & easy
maintenance
• Low moisture
absorption
• Lower variability
than wood
• Eco friendly
• Government
regulation
• Lower
strength
• High
moisture
absorption
• Lower
durability
• Poor fire
resistance
Railing
Systems
High
Window
frame
High
Fencing Medium
Panels High
Emerging Natural Fiber Composite Applications in Construction
Decking
Railing
Window frame Fencing Door frame Panels

Creating the Equation for Growth
25
Applications Fiber Size of
Opportunity Advantages Disadvantages
Tennis Racket Flax Medium • Good anti
vibration
• Lower cost
• Eco friendly
• Lower
strength
• High
moisture
absorption
• Lower
durability
• Poor fire
resistance
Bicycle Frame,
Fork, Seat Post
Flax Medium
Snowboarding Hemp Small
Mobile Cases Kenaf Medium
Laptop Cases Flax Medium
Natural fiber in other applications: Flax and kenaf fibers have strong
penetration in sporting goods and electronics applications
Laptop Cases
Bicycle with NFC frame Tennis Racket Snowboard
Musical Cases

Creating the Equation for Growth
Table Of Content
26
• Executive Summary
• Natural Fiber Composites Market Overview
• Natural Fiber Composites Competitiveness and Market Opportunity
• Market Trends and Opportunity
• Growth Opportunities in 2011 and Beyond
• Conclusions
• About Lucintel

Creating the Equation for Growth
Applications NFC Potential in 2015 NFC Potential Strength Improvement
@ Current Strength
@ 25% Improvement
@ 50% Improvement
Methodology: Sensitivity analysis between consumption volume & strength performance of natural fiber
Natural Fiber Composites Market Potential Analysis in Automotive in
2015
Bumpers Protection trim
Headliners Spare wheel
pan cover
Shelves Door inserts Door Panels
27
145 M lbs
US$ 72 M
234 M lbs
US$ 117 M
324 M lbs
US$ 162 M
Source: Lucintel

Creating the Equation for Growth
Conclusions
• New business models need to be re-invented to address the fast changing complex world
• Higher specific properties with lower prices of natural fiber composites are making it
attractive for various applications
• Good anti-vibration properties & low cost are key drivers for higher adoption of natural fiber
composites in sporting goods segment
• Due to lower life cycle cost & easy maintenance of wood plastic composites, it is gaining
more acceptance in building & construction applications
• Eco-friendly measures taken by electronic companies are the major growth drivers for
natural fiber composites in Electrical & Electronics applications
• Rising prices of petroleum based products, strong government support to eco-friendly
products, higher acceptance and positive growth of end use industries will drive natural fiber
composites growth to new horizon
• Performance improvement of natural fibers will help to cater more applications and
industries in near future

Creating the Equation for Growth
Conclusions
• New business models need to be re-invented to address fast changing complex world
• Higher specific properties with lower prices of natural fiber composites are improving
attractiveness for various applications
• Good anti-vibration properties & relative low cost are key drivers for higher adoption of
natural fiber composites in sporting goods segment
• Due to lower life cycle cost & easy maintenance of wood plastic composites, gaining more
acceptance in building & construction applications
• Eco-friendly measures taken by electronic companies are major growth drivers for natural
fiber composites in Electrical & Electronics applications
• Rising prices of petroleum based products, strong government support to eco-friendly
products, higher acceptance and positive growth of end use industries will drive natural
fiber composites growth
• Performance improvement of natural fibers will help to cater to more applications and
industries in near future
29

Creating the Equation for Growth
Table Of Content
30
• Executive Summary
• Natural Fiber Composites Market Overview
• Natural Fiber Composites Competitiveness and Market Opportunity
• Market Trends and Opportunity
• Growth Opportunities in 2011 and Beyond
• Conclusions
• About Lucintel

Creating the Equation for Growth
31
Lucintel is the leading global management consulting & market
research firm.
Lucintel creates your equation for growth and is committed to
actionable results that deliver significant value and long term growth
to our clients.
Lucintel has been creating measurable value for over 10 years and
for more than 1000 clients in 70 + countries worldwide.
Visit http://www.lucintel.com/imovie/ for a short 3.5-minute movie on
Lucintel solutions.
About Lucintel

Creating the Equation for Growth
Lucintel Products & Services: Over 100 market reports to optimize
your market research investment
32
Aerospace
Transportation
Marine
Construction
Renewable Energy
Recreational
Composite Materials
Market Reports Consulting
Growth and Strategic Consulting
Benchmarking
Opportunity Screening
Partner Search and Evaluation
Due Diligence and M&A
Market Entry Strategy

Creating the Equation for Growth
Lucintel has an extensive toolkit to address key strategic questions for
increasing your company’s profitability and market presence
33
• Is market space / opportunity of current
product offerings sufficiently robust?
• Markets are focus for many: how can my
company profitably differentiate?
• Based on our core skills, where should
we focus?
• Should we build or buy? Is build even an
option?
• What game changer actions exist and/or
is a more incremental approach best?
• What is the order sequence of market
entry segments / products?
Key Questions
Lucintel Consulting
Market Entry
Strategy
Build/Buy/Partner
Strategic Growth
Consulting
Salesforce Optimizati
on
Feasibility Study
Due Diligence
Opportunity Screening

Creating the Equation for Growth
Clients around the world value our services
34

Creating the Equation for Growth
Steve Parker
VP, Sales (Market Reports)
Cell :+1-214-213-2491
Roy Almaguer
Global Sales Manager
Email: [email protected]
Tel. : +1-210-878-7693 (Office)
Alan Clark
VP, Sales (Consulting)
Tel :+44 (0) 7875 708825
Nigel Odea
Business Development Manager
Cell : +44 (0) 207 558 8798
Reach Lucintel
For your business requirements and cutting edge consulting solutions, contact
Lucintel at [email protected] or Tel. +1-972-636-5056 or call one of the
following.
35