operational plan: hugh smith lake sockeye salmon stock
TRANSCRIPT

Regional Operational Plan CF.1J.2013.05
Operational Plan: Hugh Smith Lake Sockeye Salmon Stock Assessment, 2013–2015
by
Malika T. Brunette
and
Andrew W. Piston
August 2013
Alaska Department of Fish and Game Divisions of Sport Fish and Commercial Fisheries
1

Symbols and Abbreviations The following symbols and abbreviations, and others approved for the Système International d'Unités (SI), are used without definition in the following reports by the Divisions of Sport Fish and of Commercial Fisheries: Fishery Manuscripts, Fishery Data Series Reports, Fishery Management Reports, and Special Publications. All others, including deviations from definitions listed below, are noted in the text at first mention, as well as in the titles or footnotes of tables, and in figure or figure captions. Weights and measures (metric) centimeter cm deciliter dL gram g hectare ha kilogram kg kilometer km liter L meter m milliliter mL millimeter mm Weights and measures (English) cubic feet per second ft3/s foot ft gallon gal inch in mile mi nautical mile nmi ounce oz pound lb quart qt yard yd Time and temperature day d degrees Celsius °C degrees Fahrenheit °F degrees kelvin K hour h minute min second s Physics and chemistry all atomic symbols alternating current AC ampere A calorie cal direct current DC hertz Hz horsepower hp hydrogen ion activity pH (negative log of) parts per million ppm parts per thousand ppt, ‰ volts V watts W
General Alaska Administrative Code AAC all commonly accepted abbreviations e.g., Mr., Mrs.,
AM, PM, etc. all commonly accepted professional titles e.g., Dr., Ph.D., R.N., etc. at @ compass directions:
east E north N south S west W
copyright corporate suffixes:
Company Co. Corporation Corp. Incorporated Inc. Limited Ltd.
District of Columbia D.C. et alii (and others) et al. et cetera (and so forth) etc. exempli gratia (for example) e.g. Federal Information Code FIC id est (that is) i.e. latitude or longitude lat. or long. monetary symbols (U.S.) $, ¢ months (tables and figures): first three letters Jan,...,Dec registered trademark trademark United States (adjective) U.S. United States of America (noun) USA U.S.C. United States
Code U.S. state use two-letter
abbreviations (e.g., AK, WA)
Mathematics, statistics all standard mathematical signs, symbols and abbreviations alternate hypothesis HA base of natural logarithm e catch per unit effort CPUE coefficient of variation CV common test statistics (F, t, χ2, etc.) confidence interval CI correlation coefficient (multiple) R correlation coefficient (simple) r covariance cov degree (angular ) ° degrees of freedom df expected value E greater than > greater than or equal to ≥ harvest per unit effort HPUE less than < less than or equal to ≤ logarithm (natural) ln logarithm (base 10) log logarithm (specify base) log2, etc. minute (angular) ' not significant NS null hypothesis HO percent % probability P probability of a type I error (rejection of the null hypothesis when true) α probability of a type II error (acceptance of the null hypothesis when false) β second (angular) " standard deviation SD standard error SE variance population Var sample var

REGIONAL OPERATIONAL PLAN CF.1J.2013.05
OPERATIONAL PLAN: HUGH SMITH LAKE SOCKEYE SALMON STOCK ASSESSMENT, 2013–2015
by
Malika T. Brunette and Andrew W. Piston
Alaska Department of Fish and Game, Division of Commercial Fisheries, Ketchikan
Alaska Department of Fish and Game Division of Commercial Fisheries
August 2013

The Regional Operational Plan Series was established in 2012 to archive and provide public access to operational plans for fisheries projects of the Divisions of Commercial Fisheries and Sport Fish, as per joint-divisional Operational Planning Policy. Documents in this series are planning documents that may contain raw data, preliminary data analyses and results, and describe operational aspects of fisheries projects that may not actually be implemented. All documents in this series are subject to a technical review process and receive varying degrees of regional, divisional, and biometric approval, but do not generally receive editorial review. Results from the implementation of the operational plan described in this series may be subsequently finalized and published in a different department reporting series or in the formal literature. Please contact the author if you have any questions regarding the information provided in this plan. Regional Operational Plans are available on the Internet at: http://www.adfg.alaska.gov/sf/publications/
Malika T. Brunette and Andrew W. Piston, Alaska Department of Fish and Game, Division of Commercial Fisheries,
2030 Sea Level Drive, Suite 205, Ketchikan, AK 99901
This document should be cited as: Brunette, M. T., and A. W. Piston. 2013. Operational Plan: Hugh Smith Lake sockeye salmon stock assessment,
2013–2015. Alaska Department of Fish and Game, Division of Commercial Fisheries, Regional Operational Plan ROP.CF1J.2013.05, Douglas.
The Alaska Department of Fish and Game (ADF&G) administers all programs and activities free from discrimination based on race, color, national origin, age, sex, religion, marital status, pregnancy, parenthood, or disability. The department administers all programs and activities in compliance with Title VI of the Civil Rights Act of 1964, Section 504 of the Rehabilitation Act of 1973, Title II of the Americans with Disabilities Act (ADA) of 1990, the Age Discrimination Act of 1975, and Title IX of the Education Amendments of 1972.
If you believe you have been discriminated against in any program, activity, or facility please write: ADF&G ADA Coordinator, P.O. Box 115526, Juneau, AK 99811-5526
U.S. Fish and Wildlife Service, 4401 N. Fairfax Drive, MS 2042, Arlington, VA 22203 Office of Equal Opportunity, U.S. Department of the Interior, 1849 C Street NW MS 5230, Washington DC 20240
The department’s ADA Coordinator can be reached via phone at the following numbers: (VOICE) 907-465-6077, (Statewide Telecommunication Device for the Deaf) 1-800-478-3648,
(Juneau TDD) 907-465-3646, or (FAX) 907-465-6078 For information on alternative formats and questions on this publication, please contact:
ADF&G, Division of Sport Fish, Research and Technical Services, 333 Raspberry Rd, Anchorage AK 99518 (907) 267-2375
25

i

TABLE OF CONTENTS
Page LIST OF TABLES......................................................................................................................................................... ii LIST OF Figures ............................................................................................................................................................ ii
LIST OF APPENDICES ..............................................................................................................................................iii
PURPOSE...................................................................................................................................................................... 1
OBJECTIVES ................................................................................................................................................................ 1
Additional Tasks: ........................................................................................................................................................... 1 BACKGROUND ........................................................................................................................................................... 1 STUDY SITE ................................................................................................................................................................ 3
METHODS .................................................................................................................................................................... 5
Adult salmon enumeration ............................................................................................................................................. 5 Sockeye Salmon Run Projection ................................................................................................................................... 6 Mark-Recapture population estimate ............................................................................................................................. 7 Adult length, sex, and scale sampling ............................................................................................................................ 8 Coded-wire tag sampling ............................................................................................................................................... 8 Stream Surveys .............................................................................................................................................................. 9 Smolt sampling .............................................................................................................................................................. 9 DATA ANALYSIS ....................................................................................................................................................... 9
Mark-Recapture Population Estimate ............................................................................................................................ 9 Length, sex, and scale sampling .................................................................................................................................. 10 SCHEDULE AND DELIVERABLES ........................................................................................................................ 10
RESPONSIBILITIES .................................................................................................................................................. 10
REFERENCES CITED ............................................................................................................................................... 11
APPENDICES ............................................................................................................................................................. 14
LIST OF TABLES 1. Average cumulative proportion of Hugh Smith Lake sockeye salmon counted through the adult salmon
weir by statistical week, 1982–2012, and the projected weekly number of adults desired to meet the lower end of the escapement goal of 8,000–18,000 adult sockeye salmon. .................................................... 7
2. Coho salmon scale sampling targets and sampling periods, 2013–2015. ........................................................ 8
LIST OF FIGURES 1. Location of Hugh Smith Lake in Southeast Alaska......................................................................................... 4 2. Bathymetric map of Hugh Smith Lake, Southeast Alaska, showing the location of the weir site, the two
primary inlet streams, and other features of the lake system. .......................................................................... 4 3. Schematic diagram of the main channels of lower Buschmann Creek. 2. ....................................................... 5
ii

LIST OF APPENDICES A. Age composition of the escapement data analysis. ....................................................................................... 15 B. Hugh Smith Lake weir counts of sockeye salmon smolt by smolt year, and stocked fry and pre-smolt
releases by release year, 1981–2012. ............................................................................................................ 16 C. Annual sockeye salmon escapement at Hugh Smith Lake, 1980–2012.. ...................................................... 17
iii

PURPOSE The Hugh Smith Lake sockeye salmon run has been monitored on a long-term basis and information provided by stock assessment studies at the lake since 1980 constitutes the longest series of sockeye salmon population data in southern Southeast Alaska. We will continue stock assessment studies by operating a smolt weir in the spring and an adult weir through summer and fall to evaluate adult and juvenile abundance, and determine if the optimal escapement goal of 8,000–18,000 adult sockeye salmon is met. We will also estimate the size and age composition of emigrating smolt, as well as the length, sex, and age composition of the adult escapement, providing valuable information for run-reconstruction and stock-recruit analysis. Continued evaluation of Hugh Smith Lake sockeye salmon abundance is essential to improve the optimal escapement goal, fishery management actions to achieve that goal, and will benefit the commercial, personal use, subsistence, and sport fisheries that depend upon the health of this resource. Key words: escapement, optimal escapement goal, Hugh Smith Lake, lake stocking, mark-recapture, Oncorhynchus
nerka, sockeye salmon, stock of concern.
OBJECTIVES 1. Enumerate the adult salmon escapement through the Hugh Smith Lake weir, by species. 2. Provide a back-up estimate of the total spawning population of adult (non-jack) sockeye
salmon in Hugh Smith Lake with an estimated coefficient of variation no greater than 15% of the estimate.
3. Estimate the age, length, and sex composition of adult sockeye salmon in Hugh Smith Lake.
4. Estimate the age and size composition of sockeye salmon smolt at Hugh Smith Lake. 5. Project total sockeye salmon run size each week based on historical run timing at the
weir.
ADDITIONAL TASKS: Physical environmental data will be recorded daily at the weir, including stream height (to nearest 0.1 in), water and air temperature (°C), and daily precipitation (to nearest 0.1 in). Gauging stations and instruments have been standardized to enable comparisons between years.
BACKGROUND Hugh Smith Lake has been an important sockeye salmon (Oncorhynchus nerka) contributor to southern Southeast Alaska commercial net fisheries for over a century. Pre-statehood catch records from Boca de Quadra inlet ranged from 42,000 to 210,000 sockeye salmon from 1895 to 1912 (Rich and Ball 1933); however, it is not clear what portion of those harvests came from the waters of Revillagigedo Channel surrounding the entrance to Boca de Quadra inlet. Tagging studies have shown that sockeye salmon migrating through the waters surrounding Boca de Quadra are from highly mixed stocks (Hoffman et al. 1983 and 1984). Intense fishing pressure of the late 1800s and early 1900s supplied two canneries in Boca de Quadra inlet and a saltery adjacent to the estuary of Hugh Smith Lake (Rich and Ball 1933, Roppel 1982). Sockeye salmon harvests from Boca de Quadra declined sharply after 1912, and from 1918 to 1927 the catch averaged fewer than 10,000 fish (Rich and Ball 1933, Roppel 1982). Rich and Ball (1933) indicated this decline may have been partially due to closing all waters within 500 yards of the mouth of Sockeye creek
1

(the outlet stream of Hugh Smith Lake) to commercial fishing in 1916. A private hatchery was operated at the head of the lake from 1901 to 1903, and from 1908 to 1935, but numbers of adult sockeye salmon returning to the lake were not recorded (Roppel 1982). Egg take records suggest 3,000 to 6,000 females were taken for broodstock annually from Buschmann Creek, one of the primary spawning tributaries of Hugh Smith Lake (Roppel 1982). Moser (1898) concluded that despite overfishing, Hugh Smith Lake should produce annual runs of 50,000 sockeye salmon under average conditions.
The Alaska Department of Fish and Game (ADF&G) maintained a weir at the outlet of Hugh Smith Lake from 1967 to 1971 and annually since 1980. Beginning in the early 1980s, the lake was the subject of ADF&G enhancement efforts, which included nutrient enrichment from 1981 to 1984 and fry plants from 1986 to 1997 (Geiger et al. 2003). The vast majority of juveniles from these early stocking programs were not marked so detailed information on the proportions of stocked and wild fish in subsequent escapements is unavailable. Total escapements declined from an average of 17,500 fish in the 1980s, to 12,000 in the 1990s, and 3,500 fish from 1998 to 2002, including the lowest recorded escapement of 1,138 fish in 1998.
In 2003, the Alaska Board of Fisheries classified Hugh Smith Lake sockeye salmon as a stock of management concern (5 AAC 39.222) due to the long-term decline in escapement (Geiger et al. 2003). The board set an optimal escapement goal of 8,000–18,000 sockeye salmon (5 AAC 33.390) based on escapement goal analyses outlined in Geiger et al. (2003) and adopted an action plan to rebuild the sockeye salmon run1. The optimal escapement goal includes spawning salmon of wild and hatchery origin. The action plan directed ADF&G to review stock assessment and rehabilitation efforts at the lake and contained measures to reduce commercial harvests of Hugh Smith Lake sockeye salmon when the escapement was projected to be below the lower end of the escapement goal range. Fishery restrictions, in the form of time and area closures, affected the subdistrict 101-11 drift gillnet fishery and subdistrict 101-23 purse seine fishery near the entrance to Boca de Quadra (Figure 1). The rehabilitation effort included an existing hatchery stocking program for which eggs were collected from Buschmann Creek and brought to Southern Southeast Regional Aquaculture Association’s Burnett Inlet hatchery where they were hatched and thermally marked. Fry were transported back to Hugh Smith Lake in the spring, fed to pre-smolt size in net pens through July, and released from 1999 through 2003. ADF&G developed a commercial fisheries sampling project to determine the contribution, run timing, and distribution of stocked Hugh Smith Lake sockeye salmon in the commercial net fisheries when these fish returned as adults from 2003 to 2007 (Heinl et al. 2007).
The Hugh Smith Lake sockeye salmon run was removed from stock of concern status in 2006 because of recent improved escapements (Geiger et al. 2005). Total adult escapements have improved steadily from a low of 1,138 in 1998 and surpassed the lower bound of the escapement goal in nine of ten years, 2003–2012 (Appendix C; Piston 2009, Brunette and Piston 2011, 2012, and 2013 in prep). Stocked fish made up a significant portion of the escapements from 2003 to 2007 (Piston et al. 2006 and 2007). ADF&G conducted studies to identify factors that might limit sockeye salmon survival at various stages of their life history from 2004 to 2007 (Piston et
1 Hugh Smith Lake Sockeye Salmon Action Plan. Final Report to the Board of Fish, RC-106, February 2003.
2

al. 2006 and 2007, Piston 2008). These studies did not identify any factors in the freshwater environment that would result in reduced juvenile sockeye salmon survival rates. In addition, commercial fisheries sampling from 2004 to 2006 showed that management measures outlined in the action plan were appropriately timed and located to reduce harvests on the stock (Heinl et al. 2007).
In the 2013–2015 seasons, we will continue operations at the Hugh Smith Lake adult salmon counting weir. As in previous years, we will enumerate the adult escapement by species and conduct a secondary mark-recapture study on sockeye salmon as a backup escapement estimate in the event of a weir failure. Age, sex, and length information will be collected from a sub-set of sockeye salmon and bi-weekly foot surveys will be conducted on the two primary inlet streams to count spawning salmon in conjunction with mark-recapture efforts.
This project also assists in estimating spawning abundance of Hugh Smith Lake coho salmon (O. kisutch) which are an important indicator stock in Southeast Alaska. The ADF&G Commercial Fisheries Coho Salmon Research Project has coded-wire tagged juvenile coho salmon at Hugh Smith Lake since 1982 (Shaul 1994, 1998; Shaul et al. 2005 and 2009). We will also collect adult coho salmon data in conjunction with our sockeye salmon field studies each summer. Sockeye salmon smolt abundance will be estimated and length, sex, and age data will be collected from a sub-set of sockeye salmon smolt by Coho Salmon Research personnel at the spring smolt weir (Shaul et al. 2009).
STUDY SITE Hugh Smith Lake (55° 06’ N, 134° 40’ W; Orth 1967) is located on mainland Southeast Alaska, 67 km southeast of Ketchikan in Misty Fjords National Monument (Figure 1). The lake is organically stained and covers a surface area of 320 ha. It has a mean depth of 70 m, a maximum depth of 121 m, and a volume of 222.7⋅x 106 m3 (Figure 2). Hugh Smith Lake empties into nearby Boca de Quadra inlet via 50-m-long Sockeye Creek (ADF&G Anadromous Waters Catalog number 101-30-10750). Sockeye salmon spawn in two inlet streams: Buschmann Creek flows northwest 4 km to the head of the lake (ADF&G Anadromous Waters Catalog number 101-30-10750-2006, Beaver Pond Channel 101-30-10750-3003, Figure 3); and Cobb Creek flows north 8 km to the southeast head of the lake (ADF&G Anadromous Waters Catalog number 101-30-10750-2004; Figure 2). Cobb Creek has a barrier to anadromous migration approximately 0.8 km upstream. Hugh Smith Lake is meromictic– a layer of saltwater lies at the bottom of the lake, below a depth of 60 m, and does not interact with the freshwater layer above it.
3

Figure 1.–Location of Hugh Smith Lake in Southeast Alaska.
Figure 2.–Bathymetric map of Hugh Smith Lake, Southeast Alaska, showing the location of the weir
site, the two primary inlet streams, and other features of the lake system.
4

Figure 3.–Schematic diagram of the main channels of lower Buschmann Creek. Dashed lines indicate
tributaries that were accessible in the past but are now either blocked by beaver dams or did not have adequate water flow to accommodate spawning salmon as of September, 2012.
METHODS ADULT SALMON ENUMERATION ADF&G operated an adult salmon counting weir at the outlet of the lake, approximately 50 m from saltwater, from 1967 to 1971 and from 1981 to 2012. The weir is an aluminum bi-pod channel-and-picket design with an upstream trap for enumerating and sampling salmon. The weir will be operated from mid-June to early November and fish will be counted in a way that will minimize handling as much as possible. Integrity of the weir will be verified by periodic underwater inspections and a secondary mark-recapture study.
Adjacent to the primary upstream trap, we will build a secondary trap/counting station designed to allow for free passage of fish into the lake. The secondary trap will be fitted with a drop-closing door, allowing us to immediately block fish passage whenever a coho salmon, or other fish of interest, enters the secondary trap. Hugh Smith Lake coho salmon are an important indicator stock in Southeast Alaska so it is imperative that all coho salmon are examined for clipped adipose fins and the presence of coded-wire tags before they are passed into the lake (Shaul et al. 2005 and 2009). The secondary trap and drop-closing door allow us to count sockeye salmon as they pass freely through the counting station while continuing to meet the goals of the ongoing coho salmon study.
To aid in fish identification, we placed a white board on the streambed at the secondary trap/counting station. We also monitored fish passage with an underwater video camera so that if a coho salmon passed through the weir unexamined, we would still able to identify it as adipose-
5
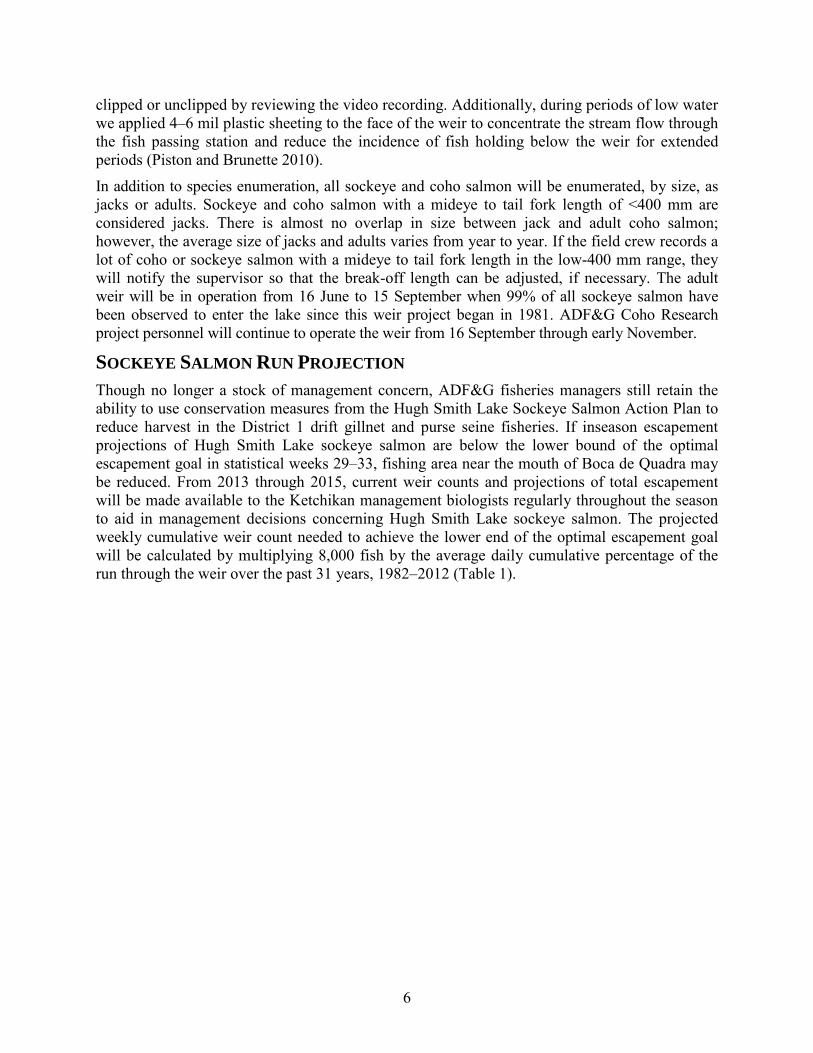
clipped or unclipped by reviewing the video recording. Additionally, during periods of low water we applied 4–6 mil plastic sheeting to the face of the weir to concentrate the stream flow through the fish passing station and reduce the incidence of fish holding below the weir for extended periods (Piston and Brunette 2010).
In addition to species enumeration, all sockeye and coho salmon will be enumerated, by size, as jacks or adults. Sockeye and coho salmon with a mideye to tail fork length of <400 mm are considered jacks. There is almost no overlap in size between jack and adult coho salmon; however, the average size of jacks and adults varies from year to year. If the field crew records a lot of coho or sockeye salmon with a mideye to tail fork length in the low-400 mm range, they will notify the supervisor so that the break-off length can be adjusted, if necessary. The adult weir will be in operation from 16 June to 15 September when 99% of all sockeye salmon have been observed to enter the lake since this weir project began in 1981. ADF&G Coho Research project personnel will continue to operate the weir from 16 September through early November.
SOCKEYE SALMON RUN PROJECTION Though no longer a stock of management concern, ADF&G fisheries managers still retain the ability to use conservation measures from the Hugh Smith Lake Sockeye Salmon Action Plan to reduce harvest in the District 1 drift gillnet and purse seine fisheries. If inseason escapement projections of Hugh Smith Lake sockeye salmon are below the lower bound of the optimal escapement goal in statistical weeks 29–33, fishing area near the mouth of Boca de Quadra may be reduced. From 2013 through 2015, current weir counts and projections of total escapement will be made available to the Ketchikan management biologists regularly throughout the season to aid in management decisions concerning Hugh Smith Lake sockeye salmon. The projected weekly cumulative weir count needed to achieve the lower end of the optimal escapement goal will be calculated by multiplying 8,000 fish by the average daily cumulative percentage of the run through the weir over the past 31 years, 1982–2012 (Table 1).
6

Table 1.–Average cumulative proportion of Hugh Smith Lake sockeye salmon counted through the adult salmon weir by statistical week, 1982–2012, and the projected weekly number of adults desired to meet the lower end of the escapement goal of 8,000–18,000 adult sockeye salmon.
2013 Statistical Week
Statistical Week Start and End Dates
1982–2012 Average Cumulative Percentile
Weekly Projected Escapement Needed to Reach Minimum Escapement Goal
of 8,000 Adults 25 16–22 June 1% 89 26 23–29 June 4% 297 27 30 June–6 July 8% 675 28 7–13 July 16% 1,268 29 14–20 July 25% 2,029 30 21–27 July 37% 2,996 31 28 July–3 August 49% 3,897 32 4–10 August 61% 4,919 33 11–17 August 70% 5,614 34 18–24 August 80% 6,372 35 25–31 August 89% 7,105 36 1–7 September 94% 7,492 37 8–14 September 97% 7,735 38 15–21 September 98% 7,854 39 22–28 September 99% 7,953 40 29 September–5 October 100% 7,975 41 6–12 October 100% 7,992 42 13–19 October 100% 7,996 43 20–26 October 100% 7,998 44 27 October–2 November 100% 7,999 45 3–9 November 100% 8,000
MARK-RECAPTURE POPULATION ESTIMATE A two-sample mark-recapture population study will be conducted to estimate the total spawning population of sockeye and coho salmon at Hugh Smith Lake. This study will help determine if fish passed through the weir uncounted or if sockeye salmon entered the lake before the weir was fish tight in mid-June. Adult sockeye salmon will be marked at a rate of 1 in 10 (10%) with a readily identifiable fin clip at the weir. Those fish will be anesthetized in a clove oil solution (Woolsey et al. 2004), fin-clipped, scale-sampled, and released upstream next to the trap to recover. Fish that do not appear healthy will not be marked. Marking will be stratified through time on the following schedule: right ventral fin clip 16 June–18 July; left ventral fin clip 19 July–15 August; and partial dorsal fin clip 16 August–November. We will not conduct a mark-recapture study for jack sockeye salmon (<400 mm) because most jacks pass freely through the weir pickets and are not accessible for sampling. All coho salmon (100%) will be given a partial dorsal fin clip through 15 September.
Weekly stream surveys will be conducted on the spawning grounds to sample spawners for marks. Live fish will be captured and examined for marks using dip nets in the creeks or by using a beach seine off the creek mouths. All carcasses found on stream surveys, floating in the lake, or washed up on the weir will also be examined for fin clips. Each examined fish will be recorded as either unmarked (no fin-clip) or marked, and by the appropriate fin clip (right ventral, left ventral, or dorsal fin clip). A secondary mark will be applied to sampled fish (a left operculum hole punch for live fish or the removal of the entire tail for dead fish) to prevent double sampling on subsequent sampling events. Our goal is to examine at least 600 sockeye salmon throughout the entire spawning season. A sample size of 600 fish in the second sampling
7

event should yield a population estimate with a coefficient of variation less than 15%, when a population of 9,000 (recent 20-year average wild escapement) is marked at a rate of 10% (Robson and Regier 1964).
ADULT LENGTH, SEX, AND SCALE SAMPLING The age composition of adult sockeye salmon at Hugh Smith Lake will be determined from a minimum of 600 scale samples collected from live fish at the weir. This sample size was selected based on work by Thompson (1992) for calculating a sample size to estimate several proportions simultaneously. A sample size of 510 fish is needed to ensure the estimated proportion of each adult sockeye salmon age class will be within 5% of the true value 95% of the time. We increased our scale sampling goal to 600 samples to guarantee the sample size target would be met, even if 15% of the samples were unreadable. We will begin by collecting scales from 1 out of every 10 fish (10%) and may adjust the sampling rate based on inseason escapement projections. Length and sex information will be recorded for each adult fish sampled. Fish shorter than 400 mm will be counted as jacks and not included in the adult sockeye salmon age composition sample. Three scales will be collected from the preferred area from each fish (INPFC 1963), placed on a gum card, and prepared for analysis as described by Clutter and Whitesel (1956). Scale samples will be analyzed at the ADF&G salmon-aging laboratory in Douglas, Alaska. Scale samples (4 scales per fish) will also be collected from coho salmon at the weir in a manner consistent with sockeye salmon scale sampling. Weekly coho salmon scale sample sizes are based on average run timing at Hugh Smith Lake so the number of scales collected each week will vary throughout the season (Table 2).
Table 2.–Coho salmon scale sampling targets and sampling periods, 2013–2015.
Time Period Target sample size Cumulative 9–15 August 10 10
16–22 August 10 20 23–29 August 40 60
30 August–5 September 70 130 6–12 September 90 220
13–19 September 90 310 20–26 September 90 400
27 September–3 October 90 490 4–10 October 50 540
11–17 October 50 590 18–24 October 30 620
25 October–7-November 10 630
CODED-WIRE TAG SAMPLING All coho salmon will be examined at the weir with a handheld metal detector to determine if they are coded-wire tagged. All adipose fin-clipped coho salmon that are coded-wire tagged (i.e., that signal presence of a metal tag when the wand is passed over the snout) will be released upstream alive. All adipose-clipped coho salmon that do not indicate the presence of a coded-wire tag will be sacrificed. Experience has shown that very few adipose-clipped fish returning to Hugh Smith Lake lack a coded-wire tag; thus, only a few fish will need to be sacrificed. Heads recovered from adipose-clipped coho salmon that do not register a coded-wire tag will be collected and sent to the ADF&G Mark, Tag and Age Laboratory, in Juneau for further inspection.
8

Stray Chinook salmon are occasionally recovered at the Hugh Smith Lake weir; however, since this system does not support a natural Chinook salmon spawning stock, no Chinook salmon will be passed into the lake. Chinook salmon that have an adipose fin will be removed from the trap and released below the weir where they will usually leave the system within 1–2 days. Adipose-clipped Chinook salmon will be sacrificed at the weir and the heads will be sent to the ADF&G Mark, Tag and Age Laboratory.
STREAM SURVEYS The number of live and dead salmon in the creek will be estimated, by species, during each survey of Buschmann and Cobb creeks. Cobb Creek will be surveyed from the mouth to the barrier falls (0.42 miles; 55° 05.35’ N, 130° 38.673’ W). Buschmann Creek will be surveyed to the top of the Hatchery Channel on the right fork and to the beaver ponds on the left fork (Figure 3). The right fork will be surveyed up to the top of the hatchery channel, but ideally would be surveyed further on large escapement years. Surveys of all Buschmann Creek stream channels will be attempted, weather permitting, at least twice each week near the peak of the run. Data will be entered into the ADF&G database at the end of the field season.
SMOLT SAMPLING Since 1982, ADF&G Coho Research personnel have operated a weir to enumerate and sample smolt as they emigrate from Hugh Smith Lake in the spring (Peltz and Haddix 1989, and Shaul et al. 2009 provide a physical description of weir). Coho Research personnel will enumerate all species through the smolt weir (including sockeye smolt), collect scale samples and length-weight data. Sixteen scale samples will be collected on days when fewer than 100 fish are captured at the weir, and 28 scale samples will be collected on days when greater than 100 fish are captured. The length (snout- to-fork in mm) and weight (to the nearest 0.1 g) will be recorded for each fish sampled. A preferred-area scale smear (Clutter and Whitesel 1956) will be collected from each fish and mounted on a 2.5 cm × 7.5 cm glass slide, four fish per slide.
DATA ANALYSIS MARK-RECAPTURE POPULATION ESTIMATE We will use Stratified Population Analysis System (SPAS) software (Arnason et al. 1996) to generate mark-recapture estimates of the total spawning population of sockeye salmon. SPAS was designed for analysis of two-sample mark-recapture data where marks and recoveries take place over a number of strata. Based on work by Chapman and Junge (1956), Darroch (1961), Seber (1982), and Plante (1990), this program calculates: 1) maximum likelihood (ML) Darroch estimates and pooled-Petersen (Chapman’s modified) estimates, and their standard errors; 2) χ 2 tests for goodness-of-fit based on the deviation of predicted values (fitted by the ML Darroch estimate) from the observed values; and 3) two χ 2 tests of the validity of using fully pooled data—a test of complete mixing of marked fish between release and recovery strata, and a test of equal proportions of marked fish in the recovery strata. We will choose full pooling of the data (i.e., the pooled-Petersen estimate) if the result of either of these tests is not significant (P>0.05). Our goal is to estimate the escapement such that the coefficient of variation is no greater than 15% of the point estimate. The manipulation of release and recovery strata in calculating estimates (the method used in SPAS) is presented and discussed at length by Schwarz and Taylor (1998).
9

The weir count will be deemed “verified” and entered as the official escapement estimate if it falls within the 95% confidence interval of the mark-recapture estimate for adult sockeye salmon. This is the same criterion used in previous years (Geiger et al. 2003). The escapement goal will be judged to have been met if the weir count falls within the escapement goal range and within the 95% confidence interval of the mark-recapture estimate. If both the weir count and the mark-recapture estimate are below the lower bound of the escapement goal range, the escapement goal will be deemed to have not been met. In the case where one or the other estimate falls within the escapement goal range, the weir count will be used, unless the weir count is below the lower bound of the 95% confidence interval of the mark-recapture estimate. We will use the mark-recapture “point” estimate, and not one or the other end of a confidence interval, for the purpose of judging the escapement objective.
LENGTH, SEX, AND SCALE SAMPLING Adult sockeye salmon scales will be aged at the ADF&G, Commercial Fisheries, Scale Lab in Douglas, Alaska. A video-linked microscope will be used to age sockeye smolt scales at the Ketchikan office. The weekly age-sex distribution, the seasonal age-sex distribution weighted by week, and the mean length by age and sex weighted by week for smolt and adults, will be calculated using standard methods (Cochran 1977; Appendix A).
SCHEDULE AND DELIVERABLES In 2013, the adult weir at Hugh Smith Lake will be installed on June 18th and we will immediately begin passing fish, collecting scale samples, and marking fish. Field crews will contact the office daily to relay fish counts and sampling progress. Daily cumulative weir counts and weekly run size projections will be forwarded to the Ketchikan Area Management Biologist. Sockeye salmon field work will end on September 15th, at which time the Coho Research Project will take over data collection at the weir through early November. A final report in the ADF&G Fisheries Data Series will be completed by the project leader after the field season. Results from these studies will also be incorporated into a regional sockeye salmon stock status report in the form of a Special Publication which is produced at 3-year intervals. Additional reporting will include a section of semi-annual, and 3-year, progress reports for Pacific Salmon Commission section entitled: Northern Boundary Annex: Fisheries management and stock assessment.
RESPONSIBILITIES Malika Brunette, Fishery Biologist II, Project Leader. Oversight of all aspects of project,
including planning, budgeting, permit acquisition, equipment inventory, personnel, and training. Collects and analyzes data and reports project results. Reports inseason escapement estimates to ADF&G management staff and SSRAA. Assists with fieldwork.
Andrew Piston, Fishery Biologist III, Project Leader. Assists with all aspects of the project, including operational planning, field work, data analysis, and technical report writing.
Robert Farley, Fish and Wildlife Technician III, Crew Leader. Responsible for all aspects of field operations, and equipment and camp maintenance. Ensure that scheduled field work is conducted and completed in a safe and timely manner. Direct the work of field assistants and ensure consistency and accuracy of data.
Jill Walker, Fish and Wildlife Technician II, Crew. Assist with all aspects of field operations, data collection, equipment and camp maintenance, and field camp duties.
10

Kimberly Vicchy, Fish and Game Program Technician. Provides administrative support to the project and assists with field work.
Steven Heinl, Regional Research Biologist. Assists with project operational planning, field work, and review of project report.
Haixue Shen, Biometrician II. Assists with sampling design, project operational planning, and data analysis.
REFERENCES CITED Arnason, A. N., C. W. Kirby, C. J. Schwarz, and J. R. Irvine. 1996. Computer analysis of data from stratified mark-
recovery experiments for estimation of salmon escapements and other populations. Canadian Technical Report of Fisheries and Aquatic Sciences 2106.
Brunette, M. T., and A. W. Piston. 2011. Hugh Smith Lake sockeye salmon studies, 2010. Alaska Department of Fish and Game, Fishery Data Series No. 11-32, Anchorage.
Brunette, M. T., and A. W. Piston. 2012. Hugh Smith Lake sockeye salmon studies, 2011. Alaska Department of Fish and Game, Fishery Data Series No. 12-33, Anchorage.
Brunette, M. T., and A. W. Piston. 2013. Hugh Smith Lake sockeye salmon studies, 2012. In Prep.
Chapman, D. G., and C. O. Junge. 1956. The estimation of the size of a stratified population. Ann. Math. Statist. 27:375–389.
Clutter, R., and L. Whitesel. 1956. Collection and interpretation of sockeye salmon scales. Bulletin of the International Pacific Salmon Fisheries Commission 9, New Westminster, British Columbia.
Cochran, W. G. 1977. Sampling techniques, 3rd Ed. John Wiley and Sons, New York.
Darroch, J. N. 1961. The two-sample capture-recapture census when tagging and sampling are stratified. Biometrika 48:241–260.
Geiger, H. J., T. P Zadina, and S.C. Heinl. 2003. Sockeye salmon stock status and escapement goal for Hugh Smith Lake. Alaska Department of Fish and Game, Division of Commercial Fisheries, Regional Information Report No. 1J03-05, Juneau.
Geiger, H.J., R.L. Bachman, S.C. Heinl, K. Jensen, T.A. Johnson, A. Piston, and R. Riffe. 2005. Sockeye salmon stock status and escapement goals in Southeast Alaska [in] Der Hovanisian, J.A. and H.J. Geiger, editors. Stock status and escapement goals for salmon stocks in Southeast Alaska 2005. Alaska Department of Fish and Game, Special Publication No. 05-22, Anchorage.
Heinl, S. C., X. Zhang, and H. J. Geiger. 2007. Distribution and run-timing of Hugh Smith Lake sockeye salmon in the District 101 commercial net fisheries of southern Southeast Alaska, 2004–2006. Alaska Department of Fish and Game, Fishery Manuscript No. 07-03, Anchorage.
Hoffman, Stephen H., Larry Talley, and M. C. Seibel. 1983. 1982 U.S./Canada research pink and sockeye salmon tagging, interception rates, migration patterns, run timing, and stock intermingling in southern Southeast Alaska and Northern British Columbia in Final Report. 1982 salmon research conducted in Southeast Alaska by the Alaska Department of Fish and Game in conjunction with joint U.S.-Canada Interception investigations. Contract No. NASO-82-00134.
Hoffman, Stephen H., Larry Talley, and M. C. Seibel. 1984. 1983 sockeye and chum salmon tagging, notional contribution rates, migration patterns, run timing, and stock intermingling research in southern Southeast Alaska and northern British Columbia in Final Report. 1983 salmon research conducted in Southeast Alaska by the Alaska Department of Fish and Game in conjunction with National Marine Fisheries Service Auke Bay Laboratory for joint U.S.-Canada Interception Studies. Contract No. WASC-83-ABC-00157.
International North Pacific Fisheries Commission. 1963. Annual Report 1961. Vancouver, British Columbia.
11

REFERENCES CITED (continued) Moser, J. F. 1898. The salmon and salmon fisheries of Alaska. Report of the operations of the United States Fish
Commission steamer Albatross for the year ending June 30, 1898. Bulletin of the U.S. Fish Commission, Washington D.C.
Orth, D. J. 1967. Dictionary of Alaska place names. Geological Survey Professional Paper 567. United States Government Printing Office, Washington.
Peltz, L., and M. Haddix. 1989. Coded-wire tagging of wild sockeye salmon smolt at Hugh Smith Lake, Alaska. Alaska Department of Fish and Game, FRED Division Report Series No. 91, Juneau.
Piston, A. W. 2008. Hugh Smith Lake sockeye salmon adult and juvenile studies, 2007. Alaska Department of Fish and Game, Fishery Data Series No. 08-43, Anchorage.
Piston, A. W. 2009. Hugh Smith Lake sockeye salmon adult and juvenile studies, 2008. Alaska Department of Fish and Game, Fishery Data Series No. 09-61, Anchorage.
Piston, A. W., and M. T. Brunette. 2010. Hugh Smith Lake sockeye salmon adult and juvenile studies, 2009. Alaska Department of Fish and Game, Fishery Data Series No 10-68, Anchorage.
Piston, A. W., S. C. Heinl, H. J. Geiger, and T. A. Johnson. 2006. Hugh Smith Lake sockeye salmon adult and juvenile studies, 2003 to 2005. Alaska Department of Fish and Game, Fishery Data Series No. 06-51, Anchorage.
Piston, A. W., S. C. Heinl, and H. J. Geiger. 2007. Hugh Smith Lake sockeye salmon adult and juvenile studies, 2006. Alaska Department of Fish and Game, Fishery Data Series No. 07-58, Anchorage.
Plante, N. 1990. Estimation de la taille d’une population animale a l’aide d’un modele de capture-recapture avec stratification. M.S. thesis, Universite Lval, Quebec.
Rich, W. H., and E. M. Ball. 1933. Statistical review of the Alaska salmon fisheries. Part IV: Southeastern Alaska. U. S. Department of Commerce, Bulletin of the Bureau of Fisheries, Volume XLVII, Bulletin No. 13, Washington, D. C.
Robson, D. S., and H. A. Regier. 1964. Sample size in Petersen mark-recapture experiments. Trans. Amer. Fish. Soc. 93:215–226.
Roppel, P. 1982. Alaska’s salmon hatcheries, 1891–1959. National Marine Fisheries Service, Alaska Historical Commission Studies in History No. 20.
Seber, G. A. F. 1982. The estimation of animal abundance. 2nd ed. Griffin, London.
Shaul, L. D. 1994. A summary of 1982–1991 harvests, escapements, migratory patterns, and marine survival rates of coho salmon stocks in Southeast Alaska. Alaska Department of Fish and Game, Division of Commercial Fisheries, Alaska Fishery Bulletin 1:10–34.
Shaul, L. D. 1998. Status of coho salmon stocks and fisheries in southeast Alaska through 1997. Alaska Department of Fish and Game, Division of Commercial Fisheries, Regional Information Report No. 1J98-26, Juneau.
Shaul, L.D., E.L. Jones, and K.F. Crabtree. 2005. Coho salmon stock status and escapement goals in Southeast Alaska [in] Der Hovanisian, J. A., and H. J. Geiger, editors. Stock status and escapement goals for salmon stocks in Southeast Alaska 2005. Alaska Department of Fish and Game, Special Publication No. 05-22, Anchorage.
Shaul, L.D, K.F. Crabtree, M. Kemp, and N. Olmsted. 2009. Coho salmon studies at Hugh Smith Lake, 1982–2007. Alaska Department of Fish and Game, Fishery Manuscript No. 09-04. Anchorage.
Schwarz, C. J., and C. G. Taylor. 1998. Use of the stratified-Petersen estimator in fisheries management: estimating the number of pink salmon (Oncorhynchus gorbuscha) spawners in the Fraser River. Can. J. Fish. Aquat. Sci. 55:281–296.
Thompson, S. K. 1992. Sampling. Wiley-Interscience, New York.
12

REFERENCES CITED (continued) Woolsey, J., M. Holcomb, and R. Ingermann. 2004. Effect of temperature on clove oil anesthesia in steelhead fry.
North American Journal of Aquaculture 66: 35–41.
13

APPENDICES
14

Appendix A.–Age composition of the escapement data analysis.
The weekly age-sex distribution, the seasonal age-sex distribution weighted by week, and the mean length by age and sex weighted by week, for smolt and adults, were calculated using equations from Cochran (1977; pages 52, 107–108, and 142–144).
Let
h = index of the stratum (week),
j = index of the age class,
phj = proportion of the sample taken during stratum h that is age j, nh = number of fish sampled in week h, and
nhj = number observed in class j, week h.
Then the age distribution was estimated for each week of the escapement in the usual manner: hhjhj nnp =ˆ . (1)
If Nh equals the number of fish in the escapement in week h, standard errors of the weekly age class proportions are calculated in the usual manner (Cochran 1977, page 52, equation 3.12):
( ) ( )( ) [ ]hhh
hjhjhj Nn
npp
pSE −
−
−= 1
1ˆ1ˆ
ˆ . (2)
The age distributions for the total escapement were estimated as a weighted sum (by stratum size) of the weekly proportions. That is,
( )NNpp hh
hjj ∑=ˆ , (3)
such that N equals the total escapement. The standard error of a seasonal proportion is the square root of the weighted sum of the weekly variances (Cochran 1977, pages 107–108):
( ) ( )[ ] ( )∑=h
jhhjj NNpSEpSE 22ˆˆ . (4)
The mean length, by sex and age class (weighted by week of escapement), and the variance of the weighted mean length, were calculated using the following equations from Cochran (1977, pages 142–144) for estimating means over subpopulations. That is, let i equal the index of the individual fish in the age-sex class j, and yhij equal the length of the ith fish in class j, week h, so that,
( )
( )∑∑ ∑
=
hhjhh
h ihijhh
j nnN
ynNY , and (5)
( )( ) ( )
−
−+−
−−
=
∑∑
ijhj
h
hjhjhjhij
h hh
hhh
jj Yy
nn
nyynn
NnNN
YV2
22
2ˆ1
11
ˆ1ˆˆ .
15

Appendix B.–Hugh Smith Lake weir counts of sockeye salmon smolt by smolt year, and stocked fry and pre-smolt releases by release year, 1981–2012. Proportions of stocked smolt were determined from otolith samples. Bolded hatchery releases were otolith-marked.
Release Year
Hatchery Release
Numbers Release
Type Smolt Year
Total Smolt
Counted
Freshwater Age Percent of Total Wild
Smolt Counted
Stocked Smolt
Counted
Proportion Stocked Smolt Age 1 Age 2 Age 3
1980 0 – 1981 319,000
71% 29% 0% 319,000 – – 1981 0 – 1982 90,000
83% 18% 0% 90,000 – –
1982 0 – 1983 77,000
60% 40% 0% 77,000 – – 1983 0 – 1984 330,000
92% 8% 0% 330,000 – –
1984 0 – 1985 40,000
51% 48% 1% 40,000 – – 1985 0 – 1986 58,000 c 73% 24% 3% 58,000 – – 1986 273,000 Unfed Fry 1987 104,000 42% 57% 1% -----No data----- 1987 250,000 Unfed Fry 1988 54,000 65% 35% 0% -----No data----- 1988 1,206,000 Unfed Fry 1989 427,000 83% 17% 0% -----No data----- 1989 532,800 Unfed Fry 1990 137,000 31% 68% 2% -----No data----- 1990 1,480,800 Unfed Fry 1991 75,000 64% 36% 0% -----No data----- 1991 0 – 1992 15,000 42% 57% 1% -----No data----- 1992 477,500 Fed Fry 1993 36,000 63% 36% 2% -----No data----- 1993 0 – 1994 43,000 75% 21% 4% -----No data----- 1994 645,000 Unfed Fry 1995 19,000 38% 62% 0% -----No data----- 1995 418,000 Unfed Fry 1996 16,000 44% 40% 16% -----No data-----
1996 358,000 Unfed Fry/ Pre-Smolt a 1997 44,000 52% 40% 8% 26,000 18,000 40%
1997 573,000 Unfed Fry 1998 65,000 81% 18% 1% 34,000 30,000 47% 1998 0 – 1999 42,000 68% 32% 0% 39,000 3,000 4% 1999 202,000 Pre-smolt b 2000 72,000 77% 22% 1% -----No data----- 2000 380,000 Pre-smolt b 2001 190,000 91% 8% 1% 44,000 145,000 77% 2001 445,000 Pre-smolt b 2002 297,000 88% 12% 0% 134,000 163,000 55% 2002 465,000 Pre-smolt b 2003 261,000 86% 14% 0% 76,000 185,000 71% 2003 420,000 Pre-smolt b 2004 364,000 88% 12% 0% 194,000 170,000 47% 2004 0 – 2005 77,000 54% 46% 0% 77,000 – – 2005 0 – 2006 119,000 63% 36% 1% 119,000 – – 2006 0 – 2007 89,000 71% 27% 2% 89,000 – – 2007 0 – 2008 59,000 62% 37% 1% 59,000 – – 2008 0 – 2009 116,000 40% 59% 1% 116,000 – – 2009 0 – 2010 64,000 19% 79% 2% 64,000 – – 2010 0 – 2011 244,000 89% 10% 1% 244,000 – – 2011 0 – 2012 179,000 d
179,000 – –
a In 1996, Southern Southeast Regional Aquaculture Association released 251,123 unfed fry into the lake in May and 106,833 pre-smolt in October. All fish released in 1996 and 1997 were otolith marked.
b In 1998, the total smolt count does not equal the sum of wild and stocked smolt due to rounding. c From 1999–2003, fry were pen-reared at the outlet of the lake beginning in late May and released as pre-smolt in late July and
early August. All fish from those releases were otolith marked. d Smolt age composition was not yet available for 2012 at the time of printing.
16
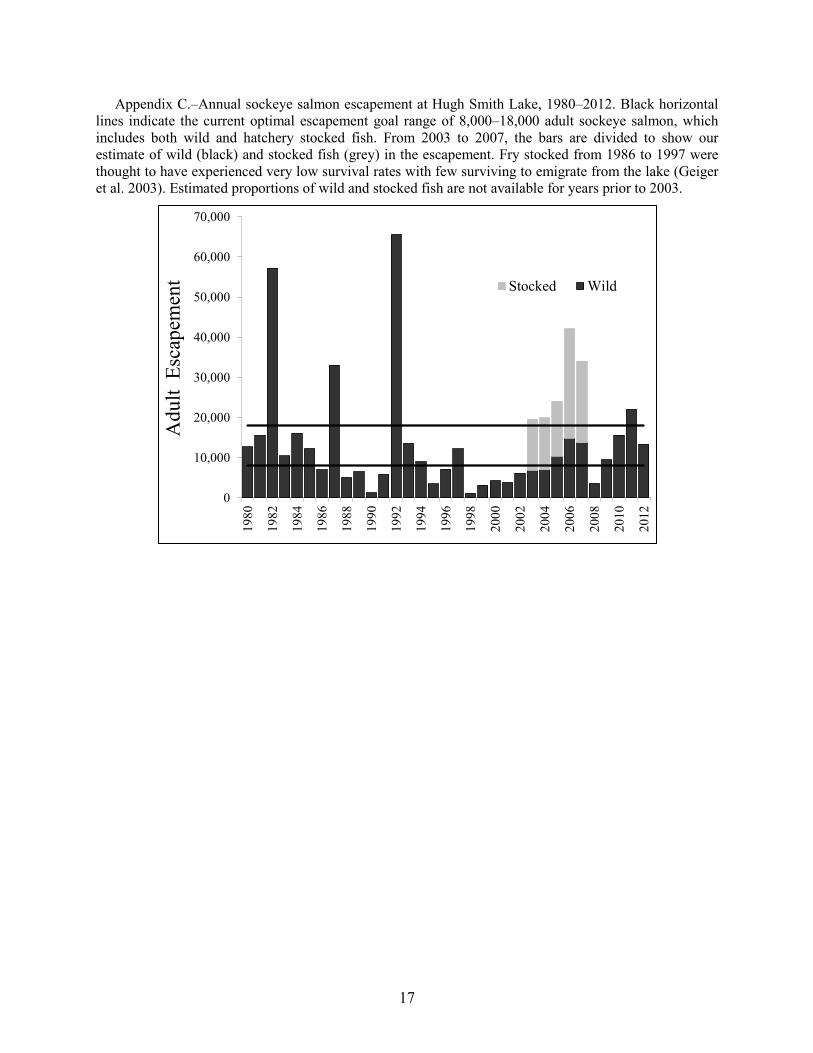
Appendix C.–Annual sockeye salmon escapement at Hugh Smith Lake, 1980–2012. Black horizontal lines indicate the current optimal escapement goal range of 8,000–18,000 adult sockeye salmon, which includes both wild and hatchery stocked fish. From 2003 to 2007, the bars are divided to show our estimate of wild (black) and stocked fish (grey) in the escapement. Fry stocked from 1986 to 1997 were thought to have experienced very low survival rates with few surviving to emigrate from the lake (Geiger et al. 2003). Estimated proportions of wild and stocked fish are not available for years prior to 2003.
0
10,000
20,000
30,000
40,000
50,000
60,000
70,000
1980
1982
1984
1986
1988
1990
1992
1994
1996
1998
2000
2002
2004
2006
2008
2010
2012
Adu
lt E
scap
emen
t Stocked Wild
17