operational optimization of integrated renewable energy
TRANSCRIPT
Operational Optimization of
Integrated Renewable Energy System – Microgrid
A Thesis
Submitted by
DILRAJ MEENA
(EE08B073)
in partial fulfillment of the requirements
for the award of the duel degree of
BACHELOR OF TECHNOLOGY
In
ELECTRICL ENGINEERING
and
MASTER OF TECHNOLOGY
In
POWER SYSTEMS AND POWER ELECTRONICS
DEPARTMENT OF ELECTRICAL ENGINEERING
INDIAN INSTITUTE OF TECHNOLOGY MADRAS.

ii
THESIS CERTIFICATE
This is to certify that the thesis titled Operational Optimization of Integrated Renewable
Energy system – Microgrid submitted by Dilraj Meena, to the Indian Institute of
Technology, Madras, for the award of the dual degree, Bachelor of Technology in Electrical
Engineering and Master of Technology in Power systems and Power electronics, is a
bonafide record of the research work done by him under our supervision. The contents of this
thesis, in full or in parts, have not been submitted to any other Institute or University for the
award of any degree or diploma.
Dr. Shanti K. Swarup
Project Guide
Dept. of Electrical Engineering Place: Chennai
IIT-Madras, 600036
Date: 7th May 2013

iii
ACKNOWLEDGEMENTS
I take immense pleasure in expressing my gratitude to my project guide, Dr. Shanti Swarup K,
professor of electrical engineering department, IIT Madras, whose continuous encouragement,
support and constant reviewing of my work throughout the course of project work. His dedication,
systematic approach and persistence to scientific research have made a great impact on me. I could
not have hoped for a better guide. He stood as constant source of inspiration to me while doing the
project.
I am thankful to all my friends for making my stay at IIT Madras memorable and giving me some of
the most unforgettable moments of my life. My personal thanks are extended to Vikrant, Amit,
Dinesh, Rohit, Swostik and Gunjan for their help in different phases of this project.

iv
ABSTRACT
Remote communities are in general not connected to the main power grid due to
geographical conditions and this condition is severe in India. A hybrid microgrid using
renewable energy as the main source can serve as a viable solution for this problem with
considerable economical and environmental benefits. The focus of this project is to
develop and study various microgrid used for different applications, especially for an
off-grid community in India that combines Solar irradiation and Wind as a main
renewable source of energy, and a storage system based on hydrogen, with zero load
rejection policy, while minimizing the cost of installation of such hybrid system.
Three types of Microgrid, Residential Microgrid, Remote Area Microgrid and
Microgrid Power has been developed and discussed in detail. Various comparative
studies has been done for better understanding of different aspects of Microgrid.
Keywords: Cost Optimization, Hydrogen storage, Economic dispatch, Remote Area
Microgrid, Industrial Microgrid, Residential Microgrid.
.

v
TABLE OF CONTENTS
THESIS CERTIFICATE ii
ACKNOWLEDGEMENTS iii
ABSTRACT iv
TABLE OF CONTENTS v
LIST OF FIGURES vii
LIST OF TABLES viii
ABBREVIATIONS ix
Chapter 1 Introduction.......................................................................................................................1
1.1. Project Motivation................................................................................................................1
1.2. Objective and Scope of the Project.......................................................................................2
1.3. Thesis Structure.....................................................................................................................2
Chapter 2 Microgrid Planning and Operation.................................................................................4
2.1. Overview: Renewable energy in India..................................................................................4
2.2. Microgrid: Basic introduction...............................................................................................7
2.3. Historical Background and Literature Survey.......................................................................9
2.4 Optimization tools: GAMS and HOMER.............................................................................11
Chapter 3 Remote Area Microgrid...................................................................................................13
3.1. Introduction..........................................................................................................................13
3.2. Components of developed Microgrid...................................................................................15
3.3. Optimization Problem formulation.......................................................................................19
3.4. Case study..............................................................................................................................21
3.5. Results and discussion...........................................................................................................27
3.6. Summary................................................................................................................................31
vi
Chapter 4 Industrial Microgrid........................................................................................................32
4.1. Introduction..........................................................................................................................32
4.2. Case study 1: Only utility based industrial Grid..................................................................33
4.3. Case study 2: Utility and DERs based industrial grid: IMGs..............................................41
4.4. Summary..............................................................................................................................43
Chapter 5 Residential Microgrid......................................................................................................44
5.1. Introduction.........................................................................................................................44
5.2. Case study 1: Traditional Storage system (battery bank)....................................................44
5.3. Case study 2: Hydrogen based Storage system...................................................................48
5.4. Comparison: Hydrogen vs Traditional battery bank storage system...................................51
5.5. Summary..............................................................................................................................53
Chapter 6 Conclusion and future work...........................................................................................54
6.1. Summary and conclusion...................................................................................................54
6.2. Project contribution............................................................................................................55
6.3. Suggestions for future work................................................................................................56
Refrences.......................................................................................................................................57
Bio-data........................................................................................................................................59

vii
LIST OF FIGURES
Fig. 2.1: India’s primary power consumption..............................................................................4
Fig. 2.2: India’s Potential and Installed capacity of RES.............................................................5
Fig- 2.3: Single line diagram of Microgrid...................................................................................8
Fig. 3.1: Flow chart of operation of the remote area microgrid………………………………..14
Fig. 3.2: Block diagram of the microgrid under study…………………………………………18
Fig. 3.3: Load data of a remote community……………………………………………………21
Fig. 3.4: Average solar data of a remote community…………………………………………..22
Fig. 3.5: Average wind data of a remote community…………………………………………..22
Fig. 3.6: Power share between Solar, Wind, Fuel cell and Electrolyzer……………………….25
Fig. 3.7: Screenshot of GAMS showing optimal sizing result for the Microgrid……………...27
Fig. 3.8: Hydrogen tank storage throughout the year…………………………………………..28
Fig. 3.9: Monthly data of wind speed (m/s) and Solar insolation……………………………...29
Fig. 3.10: Estimated cost of the project over the years………………………………………...30
Fig. 4.1: Typical fuel cost function of a thermal generating unit………………………………35
Fig. 4.2: Result showing power distribution between generators to achieve minimum cost…..37
Fig. 4.3: Result showing power distribution between generators to achieve minimum losses...38
Fig. 4.4: Curve showing Inverse relation between Cost and Losses of the system…………….39
Fig. 4.5 Industrial Load data profile……………………………………………………………40
Fig. 4.6 Power generation of PV based Industrial Microgrid ………………………………….41
Fig. 4.7 Net Industrial load……………………………………………………………………..41
Fig. 5.1: Load data of a Residential community………………………………………………..45
Fig. 5.2: Screenshot of GAMS showing optimal sizing result for the residential microgrid…...49
Fig. 5.3: Hydrogen tank storage throughout the year (kg)……………………………………....50
Fig. 5.4: Estimated cost of projects……………………………………………………………...52
viii
LIST OF TABLES
Table 2.1: Comparison between different types of Microgrid.....................................................8
Table 3.1: Microgrid components specifications.........................................................................23
Table 3.2: Efficiency of Various components of the microgrid...................................................26
Table 3.3: Cost distribution of the Remote area Microgrid.........................................................28
Table 3.4: Operation, maintenance and Replacement cost of the microgrid...............................30
Table 4.1: Summary of the Minimum loss and Minimum cost of operation scenario…………39
Table 4.2: Optimal dispatch operation of power plants for a day……………………………...40
Table 4.3: Net optimal dispatch operation of power plants……………………………………42
Table 4.4: Cost of operation comparison of Case studies 1 and 2……………………………..42
Table 5.1: Residential Microgrid components specifications………………………………….46
Table 5.2: Residential Microgrid components cost distribution……………………………….47
Table 5.3: Cost distribution of the hydrogen based residential Microgrid…………………….49
Table 5.4: Residential Microgrid project life calculation……………………………………...51
Table 5.5: Hydrogen storage based project life calculation……………………………………52
Table 5.6: Comparison between battery bank storage system and hydrogen based storage
system………………………………………………………………………………………….53

ix
ABBREVIATIONS
RES Renewable energy sources
DERs Distributed energy resources
GAMS General Algebraic Modelling System
MIP Mixed integer programming
NLP Nonlinear Programming
HOMER Hybrid Optimization Model for Electric Renewables
IRES-MG Integrated Renewable Energy Sources – Microgrid
NREL National Renewable Energy Laboratory
O&M Operation and Maintenance
IMGs Industrial microgrids
DG Diesel generator
SHP Small Hydro Power
1
Chapter 1
Introduction
1.1 Project Motivation
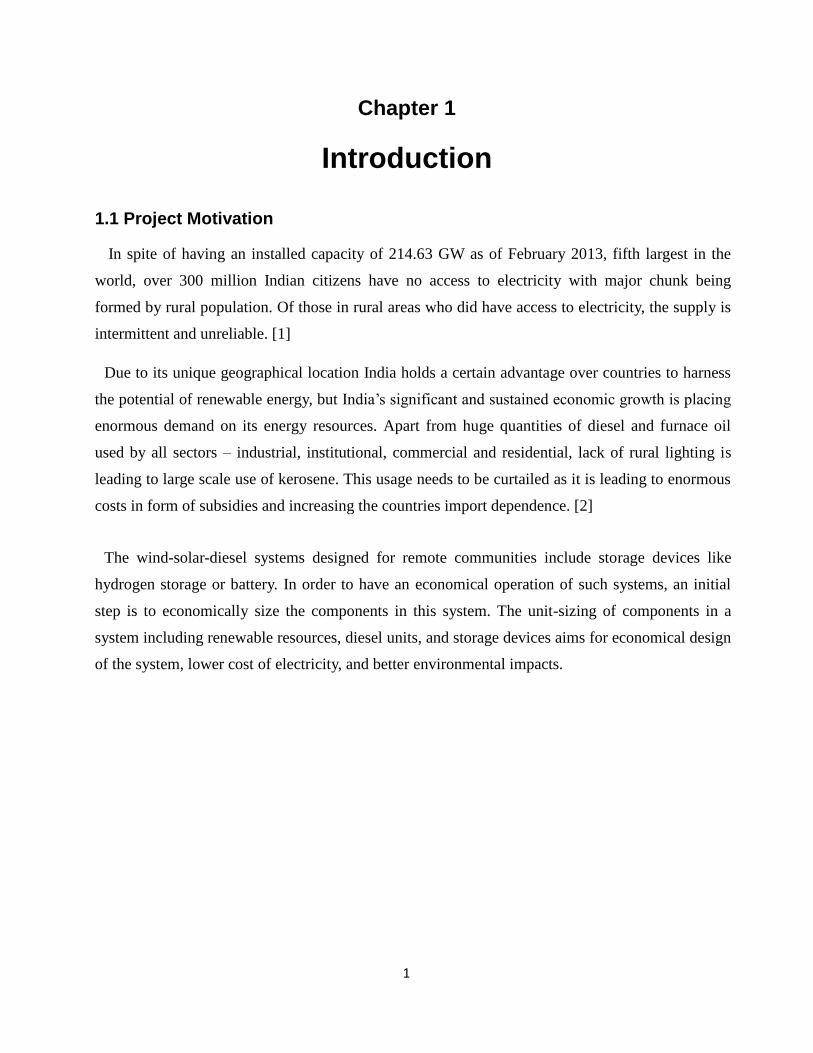
In spite of having an installed capacity of 214.63 GW as of February 2013, fifth largest in the
world, over 300 million Indian citizens have no access to electricity with major chunk being
formed by rural population. Of those in rural areas who did have access to electricity, the supply is
intermittent and unreliable. [1]
Due to its unique geographical location India holds a certain advantage over countries to harness
the potential of renewable energy, but India’s significant and sustained economic growth is placing
enormous demand on its energy resources. Apart from huge quantities of diesel and furnace oil
used by all sectors – industrial, institutional, commercial and residential, lack of rural lighting is
leading to large scale use of kerosene. This usage needs to be curtailed as it is leading to enormous
costs in form of subsidies and increasing the countries import dependence. [2]
The wind-solar-diesel systems designed for remote communities include storage devices like
hydrogen storage or battery. In order to have an economical operation of such systems, an initial
step is to economically size the components in this system. The unit-sizing of components in a
system including renewable resources, diesel units, and storage devices aims for economical design
of the system, lower cost of electricity, and better environmental impacts.

2
1.2 Objective and Scope of the project
1.2.1 Objective
The main objective of this project is to devlop operational optimization models for Remote area
microgrid, Residential microgrid and Industrial microgrid.
1.2.2 Scope
This project is related to operational optimization issues of remote area microgrid, residential
microgrid and industrial microgrid. Optimal sizing of the system has been done in case of remote
area and residential microgrid using General Algebraic Modelling system (GAMS) and Hybrid
Optimization Model for Electric Renewables (HOMER) whereas in case of industrial microgrid
emphasis has been on reduction of cost of operation of via inclusion of distributed energy resources
in the system for which an optimal generation and dispatch model has been developed using
quadratic optimization using GAMS. This project does not examine the dynamic behaviour of the
microgrid, the system control algorithms, voltage and frequency stability analysis and response of
the system when faults occur during its operation.
1.3 Thesis Structure
Chapter 2 is dedicated to historical background and literature survey. This chapter introduces the
current state of renewable energy resources in India and their application in microgrid research
keeping its application in off-grid areas in mind. In this chapter, a brief history of integration of
renewable resources in traditional, systems is given. Optimization methods for unit-sizing purposes
are discussed; pros. and cons. of each method are mentioned. A brief introduction has also been
given regarding types of microgrid.
Chapter 3 discusses about Remote area microgrid and various components used in hydrogen
based storage system. In the later part of the chapter problem formulation has been done to
optimally size the hybrid system and a yearlong study of operation has been performed to check the
reliability of the model.

3
Chapter 4 deals with issues related to Industrial microgrid and a comparative study has been
done in the chapter where industrial load is being supplied only by fuel based power plants and in
the second case where it is supplied by power plants in integration with distributed energy
resources.
Chapter 5 is dedicated to residential microgrid where consumption of average household is
calculated and a comparative study has been done between traditional battery bank storage system
and hydrogen based storage system where pros and cons of each storage system has been
discussed.
Chapter 6 summarizes the projects main points and contributions and proposes direction and
suggestion for future work.

4
Chapter 2
Microgrid Planning and Operation
2.1. Overview: Renewable energy in India
Economic growth, increasing prosperity and urbanization, rise in per capita consumption and
spread of energy are the key factors that are responsible for substantially increasing the total
demand for electricity as show in figure below. Thus there is an emerging energy supply-demand
imbalance.
Fig. 2.1: India’s Primary power consumption [Source: International Energy Outlook 2011]
Renewable energy can no longer be treated as “alternate energy” but is increasingly becoming a
vital part of the solution to the nation’s energy needs, as of march 31, 2012, installed capacity of
renewable energy based power generation was 24,503 MW. The major renewable energy sources in
India are wind energy, solar energy, biomass & waste energy, and small-hydro energy

5
Fig. 2.2: India’s Potential and Installed capacity of RES [Source: www.mnre.gov.in]
2.1.1. Wind Energy
Development of wind power began in the 1990’s and has progressed significantly in the last few
years and it accounts for 6% of India’s total installed capacity. As of 31 Jan 2013 country’s total
wind power installed capacity is 18634.9 MW, mainly spread across Tamilnadu (7134 MW), Gujrat
(3093 MW), Maharashtra (2310.7 MW), Karnataka (1730.1 MW), Rajasthan (1524.7 MW). [4]
2.1.2. Small-Hydro Energy
Hydro power projects with station capacity of 25 MW falls under the category of small hydro
power capacity (SHP). Total installed capacity of small hydro projects as on March 31, 2012, was
3200 MW, however the estimated potential is more than 15000 MW. Most of the latent potential is
in the Himalayan states. The SHP programme is largely private driven.

6
2.1.3. Solar Energy
India is densely populated and has high solar insolation, an ideal combination for using solar
power in India, with about 300 clear sunny days in a year, India’s theoretical solar power reception
is about 5000 trillion kwh/yr. The daily average solar energy incident over India varies from 4 to 7
kwh/m2. For example assuming efficiency of PV modules were as low as 10% this would still be a
thousand times greater than the domestic electricity demand projected for 2015 [5]. The grid
connected solar power as of December 2010 was merely 10 MW but by July 2012 the installed grid
connected photovoltaics had increased to 1040.6 MW. After realizing the potential of solar power
Indian government unveiled the ambitious Jawaharlal Nehru National Solar Mission to produce
20GW of solar power by 2022.
2.1.4. Biomass and Waste energy
Owing to its virtues, biomass gasification can play a key role in the electrification of rural and
remote communities as India’s climatic conditions offer an ideal environment for biomass
production. In spite of having a potential of over 30,000 MW of power from biomass but only 3000
MW was has been exploited leaving 90% of the potential capacity untapped.

7
2.2. Microgrid: Basic Introduction
A microgrid is a coordinated electrical system with multiple DERs and multiple loads, operation
of the system can be autonomous/semiautonomous either in parallel or islanded mode which will
be collectively treated by the grid as a controllable load or generator accordingly. It is connected to
the grid at only one point, the point of common coupling (PCC). The main objective of its
conception is to facilitate the penetration of distributed generation and provide high quality and
reliable energy supply. The components that constitute the microgrid may be physically close to
each other or distributed geographically.
The energy sources may be rotating generators or distributed energy (DE) sources directly
connected to grid or interfaced by power electronic inverters. The installed DE may be wind, solar,
fuel cells, geothermal, biomass, steam and gas turbines.
The connected loads may be critical or deferrable. Critical loads require reliable source of energy
and demand stringent power quality. Non-critical loads may be shed during emergency situations
and when required as set by the microgrid operating policies. The intermediate energy storage
device is an inverter-interfaced battery bank, hydrogen storage, super capacitors or flywheel [3].

8
Fig. 2.3: Single line diagram of Microgrid
The microgrid can operate in grid-connected mode or in islanded mode. In grid-connected mode,
the microgrid either draws or supplies power to the main grid. The microgrid components are
controlled using a decentralized decision making process in order to balance demand and supply
coming from the sources and the grid.
Microgrid can be classifies into various types depending upon the load it supplies, and thus has
characteristics of its own. Majorly it is divided into three type’s viz. Residential microgrid, Remote
Area microgrid and Industrial Microgrid. Differences between the above mentioned microgrids are
shown below in Table. 2.1:
Table 2.1: Comparison between different types of Microgrid
Residential Microgrid Remote Area Microgrid Industrial Microgrid
Utility Connected May be No Yes
Autonomous May be Yes No
Emphasis on Minimization of cost of
supply of power
To supply power for a
maximum period
Reliable power (zero
load rejection) with
minimum cost of
operation
IRES components PV/Wind PV/Wind/Hydro/Biomass Fuel based power
plants
9
As shown above each microgrid has its own preferences, components depending on its type,
location and demand. As in case of residential microgrid it can be autonomous or semi-
autonomous in nature. Whereas remote area microgrids are autonomous in nature mostly due to
geographical adverse conditions and aim of such microgrid is to supply power most of the time of
the year with minimum cost. In case of industrial microgrid, due to critical nature of industrial load
it should be ensured that load should be supplied at all time with no interruption in power supply
thus conventional source of power generation viz. fuel based power plants are used to supply the
major chunk of power of industrial load and distributed energy sources are used to supply a part of
it to reduce the cost of operation.
2.3. Historical background and literature survey
Remote communities, are in general not connected to the main power grid and they get their
power from diesel generators. Long geographical distances and lack of suitable means of
transportation make the fuel transportation difficult and costly, resulting in increase in the
generation cost of electricity. A hybrid microgrid using renewable energy as the main source can
serve as a viable solution for this problem with considerable economical and environmental
benefits.
Studies have shown that the integration of wind power into traditionally diesel-only remote area
power supply (RAPS) systems can significantly reduce the harmful emissions and life-cycle costs.
Due to the very high costs of installing and maintaining transmission lines, islands and small
villages located away from main grids often have their own power supply system. These
standalone systems are typically powered by conventional diesel generators as they have high
reliability, low capital cost and are easily deployable. But in the recent years however, the cost of
renewable energy sources is dropping and the diesel fuel price is increasing and its supply
diminishing, hybrid systems are already an attractive option plus they have no harmful effects on
the environments. [6]
Potential of unconventional sources to provide electricity to off-grid remote location can be
understood several case studies. In addition to this if we add wind turbines and diesel generator as a

10
back-up than we are looking a self-sustained reliable system capable of supplying the required
power [7-8]
Various optimization techniques, such as probabilistic approach, graphical construction method
and iterative technique, have been recommended for renewable energy system designs. Besides
these optimization techniques for designing solar and/or wind systems, some diesel generator
control strategies have been reported for the design of power generation systems including diesel
generators [9].
Further research showed that, [10] use fuel cells and electrolyzer storage had clear advantage
regarding portability and reliability, pollution though lacks in the aspects related to capital cost and
efficiency. The problem regarding heat and efficiency can be targeted [11] using CHP generation
system. New Technologies such as plastic micro-wind turbine [12] can also be incorporated for
better which seems very promising and has very low capital cost and negligible O/M cost.
In [13], an energy-flow model developed for performance analysis and unit sizing of an autonomous
wind-diesel microgrid has been introduced. A remote community is used as the study system, for which
a wind power plant has been integrated at a medium penetration level into a system served by diesel
generators. Lack of an energy storage component in this system is considered a disadvantage.
Reference [14] recommends a model for the design of stand-alone hybrid solar-wind diesel
systems. The problem formulation makes sure that annual cost of the system is minimized, while
using zero load rejection policy with minimum cost. The objective formulation has been solved
using Genetic algorithm
The optimization of a hydro-solar-wind-battery hybrid system in context of minimizing the
excess energy and cost of energy has been discussed in [15]. The configuration of the hybrid
system is derived based on a theoretical domestic load at a remote location.
A method for calculation of the optimum size of a battery bank and the PV array for a standalone
hybrid wind-PV system is developed in [16]. For a given load, the optimum number of batteries and
PV modules were calculated based on the minimum cost of the system.

11
The hybrid system developed for remote area in this project uses a wind turbine/pv array, as the
main source of energy, an electrolyser to absorb the excess power from the microsource, a
hydrogen tank to store the hydrogen generated by the electrolyser, a fuel cell to supply the power
deficit when the renewable resources is not adequate to meet the load, and a diesel generator as a
backup. In case of industrial microgrid an attempt has been made to reduce the cost of operation
while supplying industrial load by integration of renewable energy resources in the system.
2.4 Optimization tools GAMS and HOMER
2.4.1 GAMS
The General Algebraic Modeling System (GAMS) is a high-level modeling system for
mathematical programming and optimization. It consists of a language compiler and a stable of
integrated high-performance solvers. GAMS is tailored for complex, large scale modeling
applications, and allows you to build large maintainable models that can be adapted quickly to new
situations.
GAMS is especially useful for handling large, complex, one-of-a-kind problems which may
require many revisions to establish an accurate model. The system models problems in a highly
compact and natural way. The user can change the formulation quickly and easily, can change from
one solver to another, and can even convert from linear to nonlinear with little trouble. GAMS
provide solution to the problems much quicker than traditional platform used for programming
such problems such as MATLAB due to compact nature of its modelling and avoidance of solving
problems with running into loop each time for every indices.
In these project GAMS model has been built for all three microgrids discussed in chapter 2, viz.
Residential microgrid, Remote area microgrid and Utility connected serving different purpose in
each case which will be discussed in subsequent chapters.
2.4.2 HOMER
Hybrid Optimization Model for Electric Renewables is a computer model provided by NREL that
simplifies the task of evaluating design options for both off-grid and grid connected power systems
for remote, standalone and distributed generation (DG) applications.

12
HOMER optimization and sensitivity analysis algorithms allow the evaluation of the economic
and technical feasibility for a large number of technology options and to account for variation in
technology costs and energy resource availability. It models both conventional and renewable
energy technologies by making energy balance calculations for each of the 8760 hours in a year.
For each hour HOMER compares the electric demand of the system in that hour to the energy
system can supply in that hour and calculate flow of energy from each component resulting in an
optimal solution of installation cost and cost of project over its lifetime. The system cost
calculations accounts for costs such as capital, replacement, operation and maintenance, fuel and
interest rate.
In the project HOMER has been used as an analysis tool to conduct comparative studies between
hydrogen based storage and traditional battery based storage in Chapter 4 while discussing
Residential Microgrid.

13
Chapter 3
Remote Area Microgrid
3.1 Introduction
The microgrid proposed in Chapter 3 uses a solar array and wind turbine as the main source of
energy, hydrogen storage device including electrolyser to absorb the excess power from the wind
source, a fuel cell to supply the power deficit when the resources is not adequate to meet the
demand, a hydrogen tank to store the hydrogen generated by electrolyser, and a diesel generator as
a back-up source.
The two scenarios used for the purpose of unit-sizing are as follows:
1. Diesel-only operation: The system is operating in its traditional mode, and it uses diesel
generators as power source. This scenario can be considered as the base operating mode. The
advantages of this scenario are low capital cost, low maintenance, no dumped energy. The
disadvantages are dependence on fuel and very high greenhouse gas emissions.

14
2. Hybrid Operation: In this scenario, all the demand will be met by the renewable energy sources
(wind energy and solar energy). The flowchart of this scenario can be seen in Fig. 3.1, where the
decision making algorithm is illustrated.
Fig. 3.1: Flow chart of operation of the remote area microgrid
In the case where wind and solar together cannot meet the demand, the algorithm goes to check the
availability of power by fuel cell. If there is hydrogen in the tank, and the extra demand to be met is
less than capacity of fuel cell, fuel cell will supply the demand. Otherwise, diesel generator will
start to work, or will increase its power to meet the demand. It is assumed that there is no load
shedding. The advantages of this scenario are very low operating cost, increased reliability due to
hydrogen storage, very low emissions, and independence from fuel price variations. The
disadvantages are intermittent nature of renewable energy and high capital cost of system.
15
3.2. Components of Microgrid
Microsources used to supply loads in the developed microgrid are wind power and solar power
due to their yearlong availability in most of the parts of India as shown in the Fig. 2.3
3.2.1 PV Array
A number of solar cells connected to each other and mounted in a support structure or frame is
called a photovoltaic module. Modules are designed to supply electricity at certain voltage,
typically a 12 volt system. The current produced is directly dependent on how much light strikes
the module. Multiple photovoltaic cells can be wired together to form an array. In general, the
greater the surface area of a module or array, the more electricity will be produced. Photovoltaic
arrays produce direct electricity. They can be connected in series and parallel electrical
arrangements to produce and required voltage and current combination.
A bulk PV module consists of multiple individual solar cells connected, nearly always in series, to
increase the power and voltage from that of single solar cell. Under optimum tilt conditions, the
current density from a commercial solar cell is approximately is 30mA/𝑐𝑚2 to 36mA/𝑐𝑚2. Single
crystal cells are often 100𝑐𝑚2 , giving a current of about 3.5 ampere from a module. Multi
crystalline modules have larger individual solar cells but a lower current density and hence the
short-circuit current from these modules is often approximately 4A. However there is a large
variation on the size of multi-crystalline silicon solar cells, and therefore this current may vary.
Insolation data is converted into power output from the photovoltaic array using the following
equation [17]:
𝑃𝑃𝑉(𝑡) = 𝐼𝑛𝑠(𝑡) ∗ 𝐴 ∗ 𝐸𝑓𝑓𝑝𝑣 (3.1)
Where,
𝐼𝑛𝑠(𝑡) = insolation time at time t (kW/𝑚2)
𝐴 = area of single PV module (𝑚2)
𝐸𝑓𝑓𝑝𝑣 = Overall efficiency of the PV module and DC to DC boost convertor
Eqn (3.1) assumes temperature effects (on PV cells) are ignored.

16
3.2.2 Wind Turbine
Wind turbines make use of kinetic energy contained within the wind itself to turn a propellers of
different kinds, which then turns a generator to create electricity. Important factor in determining
wind power is the speed at which generator rotates. However since the generator rotation speed is
directly affected by the rotation of the turbine we need to look at the factors that affect the turbine
rotation, primary of these factors are wind speed and swept area by the blades of the wind turbine.
In the developed case hourly wind data is evaluated and converted to wind turbine. If the speed is
between the cut in and rated speed of turbine than the power output of wind turbine is defined as
[18]:
𝑃𝑊𝑖𝑛𝑑(𝑡) = 1
2∗ 𝜌 ∗ 𝐴 ∗ 𝑣3(𝑡) ∗ 𝐶𝑝 ∗ 𝐸𝑓𝑓𝑎𝑑 (3.2)
Where,
𝜌 = air density (kg/𝑚3)
𝐴 = area swept by the rotor (𝑚2)
𝑣(t) = wind speed (m/s)
𝐶𝑝 = efficiency of the wind turbine
𝐸𝑓𝑓𝑎𝑑 = efficiency of the AC to DC convertor

17
3.2.3 Hydrogen Storage
Hydrogen which has a specific energy of 143MJ/kg, about 40 kWH/kg requires about 50 to
60kWh of DC electricity in electrolyzer during electrolysis to generate 1kg of hydrogen which is
then then again converted to DC current via Fuel cells.
In this project hydrogen storage has been used as an alternate source of energy when power from
pv-wind hybrid system is lower than the demand. In this system excess power generated via wind
turbines/solar panels (generally in the day) is converted into hydrogen via electrolyzer and
hydrogen is stored in the hydrogen tanks for the use whenever there is deficit of power (generally
in night) via fuel cells which convert the chemical energy of the fuel directly into electrical energy.
Solid oxide fuel cells (SOFC) is one of the types of fuel cells and use ceramic materials as their
electrode and electrolyte. This allows SOFC to work at high temperatures. SOFC system also
exhibit stable performance with varying load. In addition to it proton exchange fuel cell deliver
high power density and offer the advantage of low volume and low weight compared with other
fuel cells [19].
3.2.4 Diesel generator as backup
A diesel engine power generator is the combination of a diesel engine with an electrical
generator to provide electricity. In the microgrid considered diesel generator is only used as back-
up as depicted in Fig. 3.2, rather than in a parallel operation or in standalone. Though in the case
study calculation has been done to determine the annual cost of the diesel used if the load was
completely supplied by a standalone diesel generator set.
Diesel generator has several advantages over the other internal combustion engines such as, they
have no high tension electrical ignition system to attend to resulting in high reliability and easy
adaptation to damp environment, their lifetime is more due to increased strength of the parts used
and they can deliver much more power of their rated power on continuous basis

18
3.2.5 Proposed Microgrid
The microgrid that will be developed and studied is shown in Fig. 3.2. It includes solar panel and
wind turbine connected to the DC bus via a squirrel-cage induction generator, load of the area, and
electrolyser-hydrogen storage-fuel cell system.
Fig. 3.2: Block diagram of the microgrid under study
Excess power generated at DC bus is converted into hydrogen via electrolyzer and hydrogen is
stored in Hydrogen tanks. Whenever power from microsources is not able to supply is able to
fulfill only partial demand Fuel cells comes into play and hydrogen stored is used to the load
demand. A simple power management algorithm has been used to operate the system.

19
3.3 Optimization problem formulation
This section presents the optimization model of Remote area microgrid. Problem formulation has
been done based on power dispatch algorithm presented in Fig-3.1. The mathematical formulation
is described in (3.3)-(3.9). The model is formulated as MIP (mixed integer programming) in
GAMS environment and the solver is BDMPL
A. Objective Function
The objective is to minimize the cost of electricity produced by the hybrid system. The cost of
electricity depends on capital and operating costs of components. The sizes of units and the energy
used by diesel generators reflect the cost of system. The simulation has been done for a year; so,
the objective function can be described as follows [8]:
𝐶𝑜𝑠𝑡 = 𝐶𝑓𝑐 ∗ 𝑎𝑓𝑐 + 𝐶𝑒𝑙𝑒𝑐 ∗ 𝑎𝑙𝑒𝑐 + 𝐶𝑤𝑖𝑛𝑑 ∗ 𝑎𝑤𝑖𝑛𝑑 + 𝐶𝑠𝑜𝑙𝑎𝑟 ∗ 𝑎𝑠𝑜𝑙𝑎𝑟 + 𝐶𝑑𝑖𝑒𝑠𝑒𝑙,𝑢𝑛𝑖𝑡 ∑ 𝑃𝑑𝑖𝑒𝑠𝑒𝑙, 𝑘𝑁𝑘=1 + 𝐶 (3.3)
Where,
𝐶𝑓𝑐 = Capital cost of a fuel cell unit
𝐶𝑒𝑙𝑒𝑐 = Capital cost of the electrolyzer unit
𝐶𝑤𝑖𝑛𝑑 = Capital cost of Wind turbine unit
𝐶𝑠𝑜𝑙𝑎𝑟 = Capital cost of PV module
𝐶𝑑𝑖𝑒𝑠𝑒𝑙,𝑢𝑛𝑖𝑡 = Cost of generation of 1 Unit of power from diesel generator
𝐶 = Miscellaneous cost of the system
afc = number of fuel cell units
alec = number of electrolyzer units
N depends upon period of simulation and sampling time in the case study provided in the project
samples are obtained once in a hour during a year, so N is 8760.
20
B. Constraints
1) Power flow equation constraint
𝑃𝑤𝑖𝑛𝑑,𝑘 + 𝑃𝑠𝑜𝑙𝑎𝑟,𝑘 + 𝑃𝑑𝑖𝑒𝑠𝑒𝑙,𝑘 + 𝑃𝑓𝑐,𝑘 − 𝑃𝑒𝑙𝑒𝑐,𝑘 − 𝑃𝑙𝑜𝑎𝑑,𝑘 = 0 (3.4)
∀ 𝑘 = 1 𝑡𝑜 𝑁
2) Power flow from fuel cell and electrolyzer
𝑃𝑓𝑐,𝑘 − 𝑃𝑓𝑐,𝑚𝑎𝑥 ≤ 0 (3.5)
𝑃𝑒𝑙𝑒𝑐,𝑘 − 𝑃𝑒𝑙𝑒𝑐,𝑚𝑎𝑥 ≤ 0 (3.6)
∀ 𝑘 = 1 𝑡𝑜 𝑁
3) Fuel cell and Electrolyzer sizing constraints
𝑃𝑓𝑐,𝑚𝑎𝑥 = 𝑎𝑓𝑐 ∗ 𝑃𝑓𝑐,𝑟𝑎𝑡𝑒𝑑 (3.7)
𝑃𝑒𝑙𝑒𝑐,𝑚𝑎𝑥 = 𝑎𝑒𝑙𝑒𝑐 ∗ 𝑃𝑒𝑙𝑒𝑐,𝑟𝑎𝑡𝑒𝑑 (3.8)
4) Hydrogen tank storage constraint
∑ (𝑃𝑒𝑙𝑒𝑐.𝑘 − 𝑃𝑓𝑐,𝑘𝑁𝑘=1 ) ≤ 𝐶𝐻2 (3.9)
∀ 𝑘 = 1 𝑡𝑜 𝑁
Where,
𝑃𝑓𝑐,𝑚𝑎𝑥 and 𝑃𝑒𝑙𝑒𝑐,𝑚𝑎𝑥 are maximum rated capacity of the stack of fuel cells and stack of the
electrolyzers,
𝐶𝐻2 = maximum capacity of hydrogen that can be stored in the hydrogen tank
𝑃𝑓𝑐,𝑟𝑎𝑡𝑒𝑑 and 𝑃𝑒𝑙𝑒𝑐,𝑟𝑎𝑡𝑒𝑑 are the rated capacity of single unit of fuel cell and electrolyzers
21
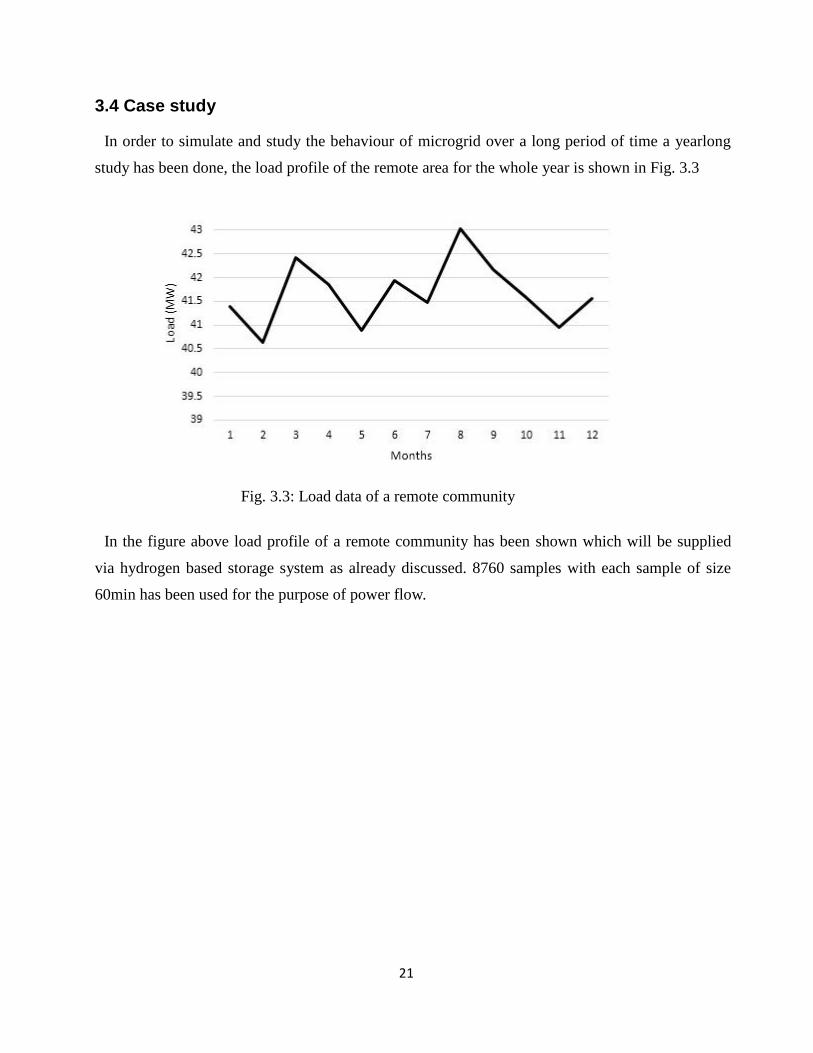
3.4 Case study
In order to simulate and study the behaviour of microgrid over a long period of time a yearlong
study has been done, the load profile of the remote area for the whole year is shown in Fig. 3.3
Fig. 3.3: Load data of a remote community
In the figure above load profile of a remote community has been shown which will be supplied
via hydrogen based storage system as already discussed. 8760 samples with each sample of size
60min has been used for the purpose of power flow.

22
Yearlong solar and wind data of the place considered in study has been shown in Fig. 3.3 and Fig 3.4
Fig. 3.4: Monthly average solar data of a remote community (wh/m2)
Fig. 3.5: Monthly average wind data of a remote community (m/s)

23
The information on microgrid components including wind turbine, fuel cell, electrolyser, hydrogen
tank, is given in Table-3.1.
Table-3.1: Microgrid components specifications
Wind
turbine
Fuel
cell
Electrolyser PV panel Power
Converter
Diesel
generator
Manufacture Hikochi
Electronics
Limited
Horizon fuel
cell
technologies
HySolGenics
M2
Reliance Luminous
Rated output
power per unit
(kW)
10 5 5 7 5 120
Cut-in speed
(m/s)
2.5 NA NA NA NA NA
Cut-out speed
(m/s)
25 NA NA NA NA NA
Rated speed 12 (m/s) NA NA NA NA NA
Swept area (m2) 50.24 NA NA NA NA NA
Capital cost (Rs) 624000 780000 468000 1060000 2,000 NA
Efficiency (%) 25 50 75 12.5 95 90
Lifetime (year) 20 6 7 20 5 20
Fuel consumption
(litre/hour)
NA NA NA NA 15

24
3.4.1. Scenarios
Two main scenarios has been considered in this, project first one is traditional diesel based system
in which power at all time is supplied via diesel generator and second one which is a hybrid pv-
wind system
A. Only Diesel
In this scenario, the system is operated in its traditional mode, where diesel generators are used as
the only power source. The diesel generator considered for this project is 140kw diesel generator
which consumes 14-16 litre of diesel while supplying power at the efficiency of 75 to 85%, which
is ideal for the load profile considered in this case, but as the load demand may vary over a large
range, efficiency of the generator From the above information cost of diesel for generation of 1 unit
can be calculated as:
Total annual load to be supplied via DG = 364.9 MW
Amount of diesel consumed to generate 1 unit of power = 1-1.5 litre
Cost of diesel to generate 1 unit of power = 50-75 Rs.
Total cost to supply the load demand throughout the year = 364900*70 = 27367500 Rs

25
B. Fully-renewable
To show proper functioning of the model a test simulation has been done for hourly data of load
wind power and solar power starting from midnight for 24 hours, results are shown in Fig. 3.6
Fig. 3.6: Power share between Solar, Wind, Fuel cell and Electrolyzer
It can be seen from the result that during night time from 12 am to 7am when there is no power
generation from solar and wind power so required amount of load is supplied by fuel cell. Solar panels
starts generation of power from 7am till 6pm as the system realizes that there is no power from
renewable sources during the night so it stores the extra hydrogen via electrolyzer in the hydrogen tank
keeping the load demand during night in mind.
The GAMS model, as explained before, is based on power share of the components with the
objectives of satisfying the demand of the area and minimizing the operating cost of the system that
results in minimum cost of electricity.

26
In this case simulation has been done for a yearlong hourly data of the wind speed, solar
irradiation and load data of the remote community. In spite of promising developments in the field
related to efficiencies of wind turbine, solar cells, fuel cells and electrolyzers, assumptions which
has been taken in this project are only of proven technology which has been listed below:
Table-3.2: Efficiency of Various components of the microgrid
Component Efficiency
(%)
Conversion of power
1. Solar panels 12.5 From Solar panels to DC to DC
boost convertor
2. Wind turbine 25 From Wind turbine to DC bus
3. DC to DC boost convertor 85 DC to DC boost convertor to
Invertor
4. Invertor 85 Invertor to AC load
5. Electrolyzer and DC to DC buck convertor 75 From DC bus to Hydrogen tank
6. Fuel cells and DC to DC boost convertor 50 From hydrogen to Invertor
27
3.5 Results and discussion
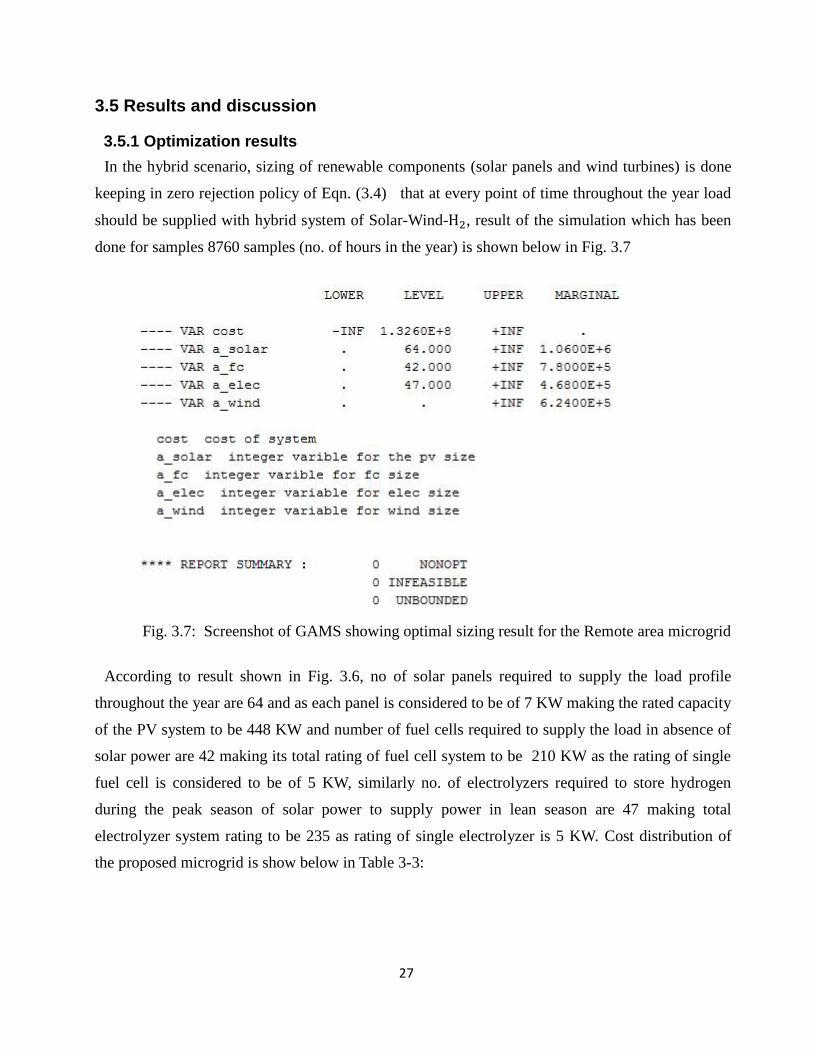
3.5.1 Optimization results
In the hybrid scenario, sizing of renewable components (solar panels and wind turbines) is done
keeping in zero rejection policy of Eqn. (3.4) that at every point of time throughout the year load
should be supplied with hybrid system of Solar-Wind-H2, result of the simulation which has been
done for samples 8760 samples (no. of hours in the year) is shown below in Fig. 3.7
Fig. 3.7: Screenshot of GAMS showing optimal sizing result for the Remote area microgrid
According to result shown in Fig. 3.6, no of solar panels required to supply the load profile
throughout the year are 64 and as each panel is considered to be of 7 KW making the rated capacity
of the PV system to be 448 KW and number of fuel cells required to supply the load in absence of
solar power are 42 making its total rating of fuel cell system to be 210 KW as the rating of single
fuel cell is considered to be of 5 KW, similarly no. of electrolyzers required to store hydrogen
during the peak season of solar power to supply power in lean season are 47 making total
electrolyzer system rating to be 235 as rating of single electrolyzer is 5 KW. Cost distribution of
the proposed microgrid is show below in Table 3-3:
28
Table-3.3: Cost distribution of the Remote area microgrid
Component Rating of single
module (KW)
No. of modules
required
Cost of single
component
Cost of total
component
Solar Panels 7 64 1060000 67840000
Wind turbine 10 0 624000 0
Fuel cell 5 42 780000 32760000
Electrolyzer 5 47 468000 21996000
Miscellaneous NA NA NA 10000000
Total cost
132596000 Rs.
In the table shown above other than the capital cost of the components of optimally sized
microgrid, miscellaneous cost has been also considered keeping in mind the cost of uncounted
components of microgrid.
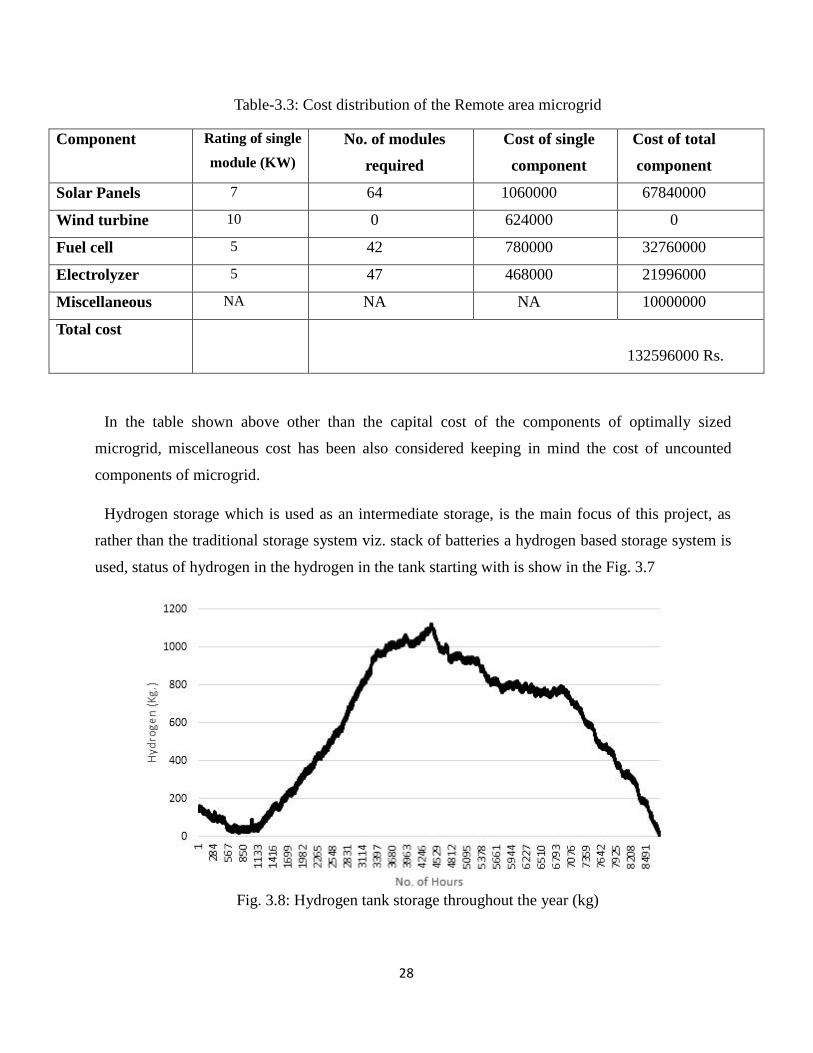
Hydrogen storage which is used as an intermediate storage, is the main focus of this project, as
rather than the traditional storage system viz. stack of batteries a hydrogen based storage system is
used, status of hydrogen in the hydrogen in the tank starting with is show in the Fig. 3.7
Fig. 3.8: Hydrogen tank storage throughout the year (kg)

29
Starting with a hydrogen storage of 150 kg as expected hydrogen storage goes up during the peak
months of solar irradiation, which are May, June and July as shown in Fig. 3.4 to compensate for
the poor supply of solar power in the months of October, November and December shown in the
Fig. 3.4. Thus keeping this in mind hybrid system generates extra hydrogen than required during
the night time and keeps increasing hydrogen storage to an optimal sufficient level without
oversizing the system to supply the deficit power generation in months of lean solar power
generation.
One of the most forcing result of the simulation is non-inclusion of the wind turbine in the final
optimal result despite having considerable wind speed throughout the year, answers to this question
can be answered after looking at the solar irradiation and wind speed data simultaneously as shown
in the Fig. 3.9
Fig. 3.9: Monthly data of wind speed (m/s) and Solar insolation (wh/m2)
Thing that should be noticed from the above shown graph is that wind power generation is
high at the same time when the solar insolation data is high, meaning that both solar panels and
wind turbine both are generating power at the same time, but as the 𝑔𝑒𝑛𝑒𝑟𝑎𝑡𝑖𝑜𝑛 (𝐾𝑤)
𝐶𝑜𝑠𝑡 (𝑅𝑠.) ratio of the
pv panels is lower than that of wind turbine module thus resulting in the optimal solution of
microgrid without any wind turbine.

30
3.5.2 Comparative study of different scenarios
To compare the two considered scenario for the longer period of the time following assumptions
have been made, which are shown below:
Table. 3.4: Operation and maintenance cost of various components of Microgrid
Fuel
cell
Electrolyser Photovoltaic
Panels
Diesel
generator
Capital cost (Rs) 32760000 21996000 67840000 NA
O&M cost/yr (Rs.) 4000 4000 12000 3000
Replacement cost
(Rs.)
32760000 21996000 64000000 1200000
Lifetime (year) 5 5 20 20
After calculating the project cost for both the scenarios, diesel only and hybrid system results of
the Project cost for a time period of 20 years are shown below in Fig. 3.10:
Fig. 3.10: Estimated cost of the project over the years

31
3.6 Summary
It can be concluded from the study that optimally sized microgrids can be used in India to supply
reliable power supply to remote areas where power supply via utility grid is not possible. Yearlong
operation of microgrid to supply the given load profile in Fig. 3.3 suggests that PV module of
rating 448 KW, fuel cell configuration of 210 KW and electrolyzer system of rating 235 is required
to supply the load with zero rejection policy throughout the year.
A comparative study has been done between standalone diesel based model and hybrid model to
compare the cost of the project for a lifetime of 20 years. It is easily visible from the Fig-3.10 that
in spite of low installation cost of diesel operated system after few initial years, difference between
costs of operation of hybrid system and diesel based system keeps widening.

32
Chapter 4
Industrial Microgrid
4.1 Introduction
Industrial Microgrid are typically formed by the corpoaration of power plant and distributed
energy resources. Industrial Microgrid differs from residential microgrid in various ways as already
discussed in chapter 2, few characteristics which sets them apart from residential and remote area
microgrid are:
1. Scale of operation of Industrial microgrid is much larger than residential and remote area
microgrid.
2. Industrial microgrid loads are considered critical in nature thus power supplied should not
intermittent in nature.
3. Under normal operation of Industrial microgrid major chunk of power is supplied via
conventional fuel based power plants.
In certain cases industrial microgrid can be connected or disconnected from the power grid,
during standalone operation IMGs must generate their own required energy to feed the electric
loads through the cooperation of DG unit.
4.1.1 PV generation system in IMGs
PV systems are being accepted as suitable alternatives to the conventional energy resources due to
environmental concerns and transmission congestion management issues. PV power currently
represents a low percentage of global electricity production. However, its application in industrial
networks is expected to grow rapidly since the peaks of most industrial loads coincide with
maximum power output of the power modules [22].

33
In this project it has been shown that industrial microgrid can utilize the energy generated by PV
plants to minimize the cost associated with the operation of fuel based power plants.
4.2 Case study 1: Only utility dependent Industrial grid
In utility dependent industrial grid transmission system is used for the delivery of bulk power
over considerable distances and a distribution system is used for local deliveries. The transmission
networks are interconnected through ties so that utilities can exchange power, share reserves and
render assistance to one another in times of need. For an interconnected system, the fundamental
problem is one of minimizing source expenses. The economic dispatching problem is to define the
production level of each plant so that the total cost of generation and transmission is minimum for
a prescribed schedule of loads.
The economic dispatch problem has been solved via many traditional optimization methods
including [20]:
Gradient based method
Newton methods
Linear programming
Quadratic programming, and
Dynamic Programming
Quadratic programming is a special type of mathematical optimization problem. It is a problem of
optimizing (minimizing or maximizing) a quadratic function of several variables subject to linear
constraints on these variables.

34
4.2.1 Problem formulation
The objective of the classical economic dispatch is to minimize the total system cost (Eqn. 5.1) by
adjusting the power output of each of the generators connected to the grid. The total system cost is
modeled as the sum of the cost function of each generator [21].
A. Objective formulation
𝑚𝑖𝑛 ∑ 𝐹𝑖(𝑃𝐺𝑖)
𝑁𝑔
𝑖=1 (5.1)
Where,
𝐹𝑖(𝑃𝐺𝑖) = Cost function of 𝑖𝑡ℎ generating unit,
𝑃𝐺𝑖 = Real power output of the 𝑖𝑡ℎ unit,
𝑁𝑔 = The total number of generators connected to the power system
The cost function of each generator establishes the relationship between the power injected to the
system by the generator and the cost incurred to load the machine to that capacity. Generators are
typically modeled by smooth quadratic functions such as Eqn. (5.2), in order to simplify the
corresponding optimization problem as well as to facilitate the application of classical techniques
𝐹𝑖(𝑃𝐺𝑖) = 𝑎𝑖 + 𝑏𝑖𝑃𝐺𝑖
+ 𝑐𝑖𝑃2
𝐺𝑖 (5.2)
Where,
𝑎𝑖, 𝑏𝑖 and 𝑐𝑖 are known as the cost coefficients of the 𝑖𝑡ℎ generating unit.

35
Fig. 4.1: Typical fuel cost function of a thermal generating unit
B. Equality constraint
The power balance is an equality constraint that reduces the power system to a basic principle of
equilibrium between total system generation and total system loads. Equilibrium is only met when
the total system generation ( ∑ 𝑃𝐺 ) equals the total system load (𝑃𝐷) plus the system losses (𝑃𝐿) as
it is stated in Eqn. (12)
∑ 𝑃𝐺𝑖= 𝑃𝐷 + 𝑃𝐿
𝑁𝐺𝑖=1 (5.3)
The exact value of the system losses can only be determined by means of a power flow solution.
The most popular approach for finding an approximate value of the losses is by the way of Kron’s
loss formula [21] Eqn (5.4), which represents the losses as a function of the output level of the
system generators.
𝑃𝐿 = ∑ ∑ 𝑃𝐺𝑖𝐵𝑖𝑗𝑃𝐺𝑗
+ 𝑁𝐺𝑗=1
𝑁𝐺𝑖=1 ∑ 𝑃𝐺𝑖
𝐵𝑖0𝑃𝐺𝑗+
𝑁𝐺𝑖=1 𝐵00 (5.4)
Where 𝐵𝑖𝑗, 𝐵𝑖0 and 𝐵00 are known as the loss or B-coefficients.

36
C. Inequality constraint
Generating units have lower (𝑃𝐺𝑖
𝑚𝑖𝑛) and upper (𝑃𝐺𝑖
𝑚𝑎𝑥) production limits, which are directly
related to the design of the machine. These bounds can be defined as a pair of inequality constraints
as follows:
𝑃𝐺𝑖
𝑚𝑖𝑛 ≤ 𝑃𝐺𝑖 ≤ 𝑃𝐺𝑖
𝑚𝑎𝑥, 𝑖 = 1,2…𝑁𝐺 (5.5)
To show the functioning of model of optimal dispatch developed in GAMS a standard problem
has been taken from the book, Power generation, operation and control by Allen J wood and B.F.
Wollenberg,
Fuel cost curve for the three units has been shown below
𝐹1(𝑃1) = 213.1 + 11.669𝑃1 + 0.00533𝑃12𝑅𝑠/ℎ
𝐹1(𝑃1) = 200.0 + 10.333𝑃1 + 0.00889𝑃22𝑅𝑠/ℎ
𝐹1(𝑃1) = 240.0 + 10.833𝑃1 + 0.00741𝑃32𝑅𝑠/ℎ
With unit dispatch limits
50.0 𝑀𝑤 ≤ 𝑃1 ≤ 200𝑀𝑤
37.5 𝑀𝑤 ≤ 𝑃1 ≤ 150𝑀𝑤
45.0 𝑀𝑤 ≤ 𝑃1 ≤ 180𝑀𝑤
And a load demand of 210 MW
Using Kron’s formula, Eqn (5.4) a model has been developed in GAMS for a three bus system for
which fuel cost curve, constraint on power generation and load demand are shown above and B
coefficients of which are already calculated and given in the problem which are shown below:
𝑃𝐺𝑖 = [1.079 0.5 0.6]
𝐵𝑖𝑗 = 0.0676 0.00953 −0.00507
0.00953 0.0521 0.00901−0.00507 0.00901 0.0294

37
𝑃𝐺𝑗 =
1.0790.50.6
𝐵𝑖0 = −0.0766 −0.00342 0.0189
𝐵00 = 0.0040357
Note: All 𝑃𝑖 values must be per unit on 100MW base which will result in 𝑃𝑙𝑜𝑠𝑠 in per unit on 100MW
base
4.2.2 Results
In the model developed in GAMS two optimal solutions have been obtained, 1st one based on
minimum cost of the fuel to suffice the demand.
Fig. 4-2: Screenshot result of GAMS showing power distribution between generators to achieve
minimum cost
As shown in the above result to achieve minimum cost of operation generator (𝑃1) should supply
50MW, generator (𝑃2) should supply 75.486MW and generator (𝑃3) should supply 93.262MW
which would leads to minimum cost of the system viz. 3155.288 Rs/hr.

38
Second optimal solution aims to achieve minimization of the losses in the system as shown in the
(Fig. 4.3).
Fig. 4-3: Screenshot of result of GAMS showing power distribution between generators to
achieve minimum losses
It can be observed from the above result that to achieve minimum loss viz. 7.955MW generator
(𝑃1) should supply 58.107MW, generator (𝑃2) should supply 38.155MW and generator (𝑃3) should
supply 121.692MW. Results obtained above have been summarized below in the Table 4.1:

39
Table-4.1: Summary of the different cases solved above
Aim 𝐏𝟏 (MW) 𝐏𝟐 (MW) 𝐏𝟑 (MW) Loss (MW) Cost(Rs/hr)
To minimize Cost 50 75.486 93.262 8.748 3155.288
To minimizes losses 58.107 38.155 121.692 7.955 3184.756
It can be observed from the above results that there is certain trade-off between achieving
minimum cost and minimum lossess in the system, as minimization of cost comes at a certain
expenses viz. increase in the lossess of the system and vice versa.
To understand the trade-off clearly, third part of the optimal dispatch model deals to achieve
different various intermediate solutions to see the change in loss values with respect to the cost of
the system and vice versa. The result of the trade-off are shown below in the Fig.4.4:
Fig. 4.4: Curve showing Inverse relation between Fuel Cost and Losses of the system
40
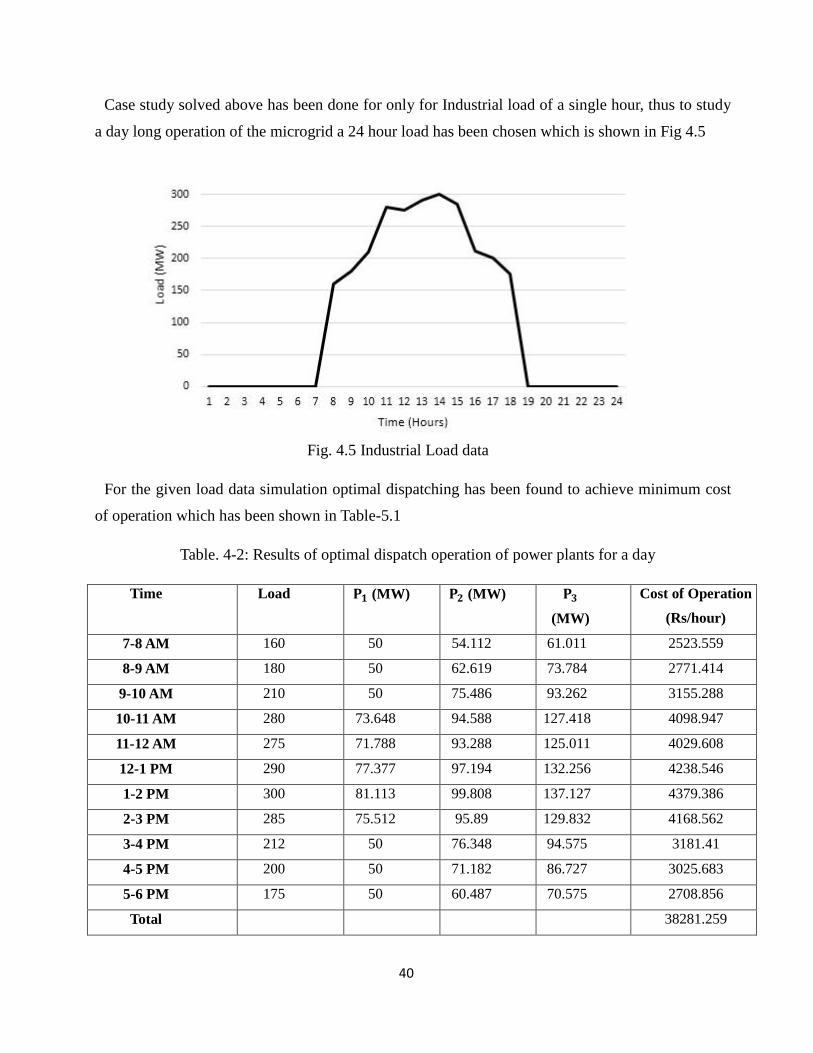
Case study solved above has been done for only for Industrial load of a single hour, thus to study
a day long operation of the microgrid a 24 hour load has been chosen which is shown in Fig 4.5
Fig. 4.5 Industrial Load data
For the given load data simulation optimal dispatching has been found to achieve minimum cost
of operation which has been shown in Table-5.1
Table. 4-2: Results of optimal dispatch operation of power plants for a day
Time Load 𝐏𝟏 (MW) 𝐏𝟐 (MW) 𝐏𝟑
(MW)
Cost of Operation
(Rs/hour)
7-8 AM 160 50 54.112 61.011 2523.559
8-9 AM 180 50 62.619 73.784 2771.414
9-10 AM 210 50 75.486 93.262 3155.288
10-11 AM 280 73.648 94.588 127.418 4098.947
11-12 AM 275 71.788 93.288 125.011 4029.608
12-1 PM 290 77.377 97.194 132.256 4238.546
1-2 PM 300 81.113 99.808 137.127 4379.386
2-3 PM 285 75.512 95.89 129.832 4168.562
3-4 PM 212 50 76.348 94.575 3181.41
4-5 PM 200 50 71.182 86.727 3025.683
5-6 PM 175 50 60.487 70.575 2708.856
Total 38281.259

41
4.3 Case study 2: Utility and DERs based Industrial grid: IMGs
In the case study 1 we have found cost of operation of industrial grid which is supplied by utility
power. In the case study 2 a part of industrial load will be supplied by DERs in our case viz. PV
module of 50 MW is used to supply the load. Solar power generation for a 50 MW solar plant near
Industrial area is shown in below Fig. 4.6
Fig. 4.6 Power generation of PV based Microgrid
As we can see that power supplied by PV based microgrid is correlated to peak demand of the
Industrial load. Net load which is yet to be supplied by the Utility grid is shown below in Fig. 4.7
Fig. 4.7 Net Industrial load

42
Net Industrial load calculated after subtracting power generated by 50 MW module of PV will be
supplied from power plants following optimal dispatching strategy to result in minimum cost of
operation while supplying the required load.
Results of model developed in GAMS using quadratic optimization are shown in Table-4.3
Table. 4.3. Net optimal dispatch operation of power plants
Time Net Load 𝐏𝟏 (MW) 𝐏𝟐 (MW) 𝐏𝟑
(MW)
Cost of Operation
(Rs/hour)
7-8 AM 155.09 50 52.032 57.901 2463.668
8-9 AM 165.27 50 56.348 64.361 2588.258
9-10 AM 186.43 50 65.366 77.926 3155.288
10-11 AM 250.58 62.728 86.964 113.373 3695.292
11-12 AM 243.53 60.121 85.147 110.049 3600.093
12-1 PM 256.88 65.06 88.591 116.357 3780.859
1-2 PM 260.26 66.313 89.465 117.963 3826.96
2-3 PM 258.66 65.72 89.05 117.203 3805.120
3-4 PM 194.36 50 68.761 83.059 2953.317
4-5 PM 192 50 67.75 81.529 2923.192
5-6 PM 174 50 60.061 69.935 2696.393
Total 35488.44
After calculating cost of operation for both cases viz. where industrial load is supplied only via
utility grid and in second case where it is supplied via utility grid in cooperation with PV module.
A decrease in cost of operation is clearly visible in case study 2 where PV module was employed in
cooperation with Utility. The reduction in cost of operation has been summarized in the Table-4.4
Table-4.4: Cost of operation comparison of Case studies 1 and 2
Utility based supply Utility and PV module based
supply
Cost of Operation/day (Rs.) 38281.259 35488.44
Reduction in cost (%) 7.3%

43
4.4 Summary
In case of Industrial load it can be observed that inclusion of distributed energy resources into the
main power grid supplied by fuel based power plants results in reduction in cost of operation upto a
significant amount as in the case study solved above we have observe a reduction in cost of
operation during for a day by 7.3% which is quite significant in nature considering the scale of cost
operation of such power plants.
Thus it can be concluded that a generation scheduling method coordinated with PV module
system can reduce the cost of operation of industrial microgrid and can also serve as a source
backup in case of blackout or brownout to supply the critical industrial load.

44
Chapter 5
Residential Microgrid
5.1 Introduction
Utility systems vulnerability to multiple failure is well known and chances of such failures will
increase as demand grows. Thus residential microgrids have the advantage of allowing better
recovery form disasters as well as to boost utility system performance. By being placed closed to
the load, residential microgrid can be switched into and out of transmission system. It can also
operate independently from the rest of the system for a period of time.
Residential microgrid developed in this project has been developed in both Optimization tools
GAMS and HOMER. A hydrogen based storage system has been developed with a zero rejection
policy in GAMS and a battery bank storage system has been developed in HOMER. Finally a grid
connected semi-autonomous residential has been developed for better understanding of functioning
of residential microgrids
5.2 Case study 1: Traditional Storage system (battery bank)
In this case to develop a traditional storage system HOMER has been used where and chosen
renewable energy sources are wind power and solar power and excess power generated throughout
the day will be stored to supply the load during non-availability of microsources during time
In order to simulate and study the behaviour of microgrid over a long period of time a yearlong
study has been done, the load profile of the area for the whole year is shown in Fig. 5.1
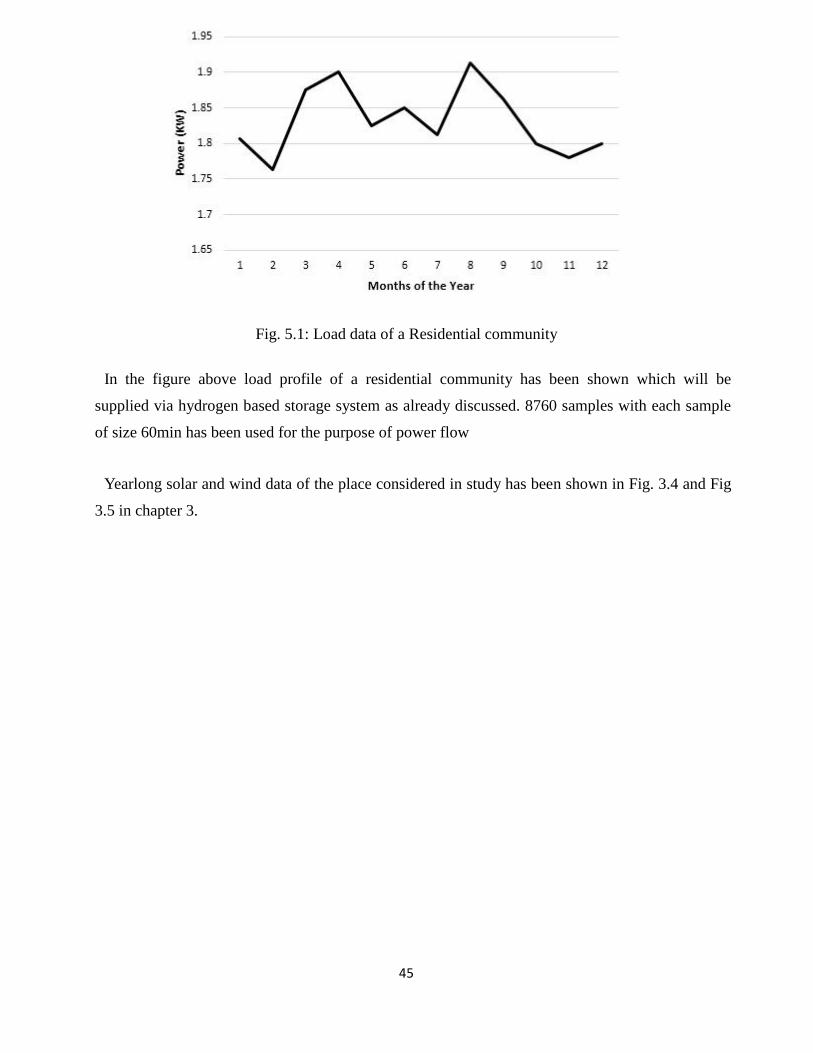
45
Fig. 5.1: Load data of a Residential community
In the figure above load profile of a residential community has been shown which will be
supplied via hydrogen based storage system as already discussed. 8760 samples with each sample
of size 60min has been used for the purpose of power flow
Yearlong solar and wind data of the place considered in study has been shown in Fig. 3.4 and Fig
3.5 in chapter 3.

46
Information regarding components of microgrid which has been use is given in the Table-5.1
shown below
Table-5.1: Residential Microgrid components specifications
Wind
Turbine 2
Wind
Turbine 2
Battery1 Battery 2 PV panel Power
Converter
Manufacture SW AIRX(8) Generic 3KW Trojan-105 Surrette
6CS25P
RS210
(Reliance)
Luminous
Rated output
power per
unit (kW)
0.55 KW 3 KW 225 7 KW 5 KW
Rated
capacity (ah)
NA NA 225 1156 NA NA
Output DC DC DC DC DC AC
Cut-in speed
(m/s)
2.5 4 NA NA NA NA
Cut-out
speed (m/s)
20 24 NA NA NA NA
Rated speed 14 (m/s) 12.5 (m/s) NA NA NA NA
Capital cost
(Rs)
40500 190000 7830 62000 1060000 35000
Replacement
Cost (RS)
35000 150000 7000 50000 100000 30000
O&M
cost/yr (Rs.)
800 5000 500 900 500 500
Efficiency
(%)
25 25 NA NA 12.5 85
Lifetime
(year)
15 15 10 (float
life)
12 (float
life)
20 5
As shown in table above different types of two type of batteries and wind turbine has been
considered such that resulting solution has best optimal solution

47
5.2.1 Results and discussion
After simulating the developed model sizing of the optimally viable solution has been shown
below in Table-5.2
Table-5.2: Residential Microgrid components cost distribution
Component Size of single
module
No. of modules
required
Cost of single
module
Replacement cost Total Capital
cost
Solar Panels capacity 7 kW 2 1060000 1000000 2120000
SW AIRX 0.55 KW 0 40500 40000 0
Generic Wind turbine 3 KW 0 624000 600000 0
Trojan-105 NA 0 7614 7500 0
Surrette6CS25P NA 25 62000 50000 1550000
Luminous Inv. 5 kW 1 35000 30000 35000
Miscellaneous NA NA NA NA 500000
Total cost (Rs.) 4205000
According to result shown in Table-5.2, no of solar panels required to supply the load profile
throughout the year are 2 which makes the total rating of the PV module system as 14 KW and no.
deep cycle batteries required for successful operation of the Microgrid are 25 and 1 Invertor is
required to convert the stored power in batteries to supply the AC load.

48
5.3 Case study 2: Hydrogen based storage system
In this model a solar array and wind turbine as the main source of energy, hydrogen storage
device including electrolyser to absorb the excess power from the wind source, a fuel cell to supply
the power deficit when the resources is not adequate to meet the demand, a hydrogen tank to store
the hydrogen generated by electrolyser, and a diesel generator as a back-up source.
This section presents the optimization model of Remote area microgrid. Problem formulation has
been done based on power dispatch algorithm presented in Fig-3.1. The mathematical formulation
is already described in (3.3)-(3.9). The model is formulated as MIP (mixed integer programming)
in GAMS environment and the solver is BDMPL.
In order to simulate and study the behaviour of microgrid over a long period of time a yearlong
study has been done, the load profile of the area for the whole year is shown in Fig-5.1 in the
earlier part of the this chapter.
Yearlong solar and wind data of the place considered in study has been shown in Fig. 3.4 and Fig
3.5 in the chapter 3. The information on microgrid components and their efficiencies including
wind turbine, fuel cell, electrolyser, hydrogen tank, has been already given in Table-3.1. And Table-
3.2 in chapter 3.

49
5.3.1 Results and discussion
In the hybrid scenario, sizing of renewable components (solar panels and wind turbines) is done
keeping in zero rejection policy of Eqn. (3.4) that at every point of time throughout the year load
should be supplied with hybrid system of Solar-Wind-H2, result of the simulation which has been
done for samples 8760 samples (no. of hours in the year) is shown below in Fig 5.2
Fig. 5.2: Screenshot of GAMS showing optimal sizing result for the residential microgrid
According to result shown in Fig.5.6, no of solar panels each with a rating of 7 KW required to
supply the load profile throughout the year are 3 and number of fuel cells required to supply the
load in absence of solar power are 3, similarly no. of electrolyzers required to store hydrogen
during the peak season of solar power to supply power in lean season are also 3. Cost distribution
of the proposed microgrid is show below in Table 5-3:
Table 5-3: Cost distribution of the hydrogen based residential Microgrid
Component Rating of single
component (KW)
No. of components
required
Cost of single
component
Cost of total
component
Solar Panels 7 3 1060000 3180000
Wind turbine 10 0 624000 0
Fuel cell 5 3 780000 2340000
Electrolyzer 5 3 468000 1404000
Invertor 5 1 35000 35000
Miscellaneous NA NA 500000
Total cost 7459000

50
Hydrogen storage which is used as an intermediate storage, is the main focus of this project, as rather
than the traditional storage system viz. stack of batteries a hydrogen based storage system is used, status
of hydrogen in the hydrogen in the tank starting with is show in the Fig. 5.3
Fig. 5.3: Hydrogen tank storage throughout the year (kg)
Starting with a hydrogen storage of 24 kg as expected hydrogen storage goes up during the peak
months of solar irradiation, which are May, June and July as shown in Fig. 3.4 to compensate for
the poor supply of solar power in the months of October, November and December shown in the
Fig. 3.4. Thus keeping this in mind hybrid system generates extra hydrogen than required during
the night time and keeps increasing hydrogen storage to an optimal sufficient level without
oversizing the system to supply the deficit power generation in months of lean solar power
generation.
51
5.4 Comparison: Hydrogen vs Traditional battery bank storage system
A comparative study has been done between traditional battery bank storage system and hydrogen
based storage system. Long term study has been done assuming the project life to be of 20 years
and pros and cons of each storage system has been discussed
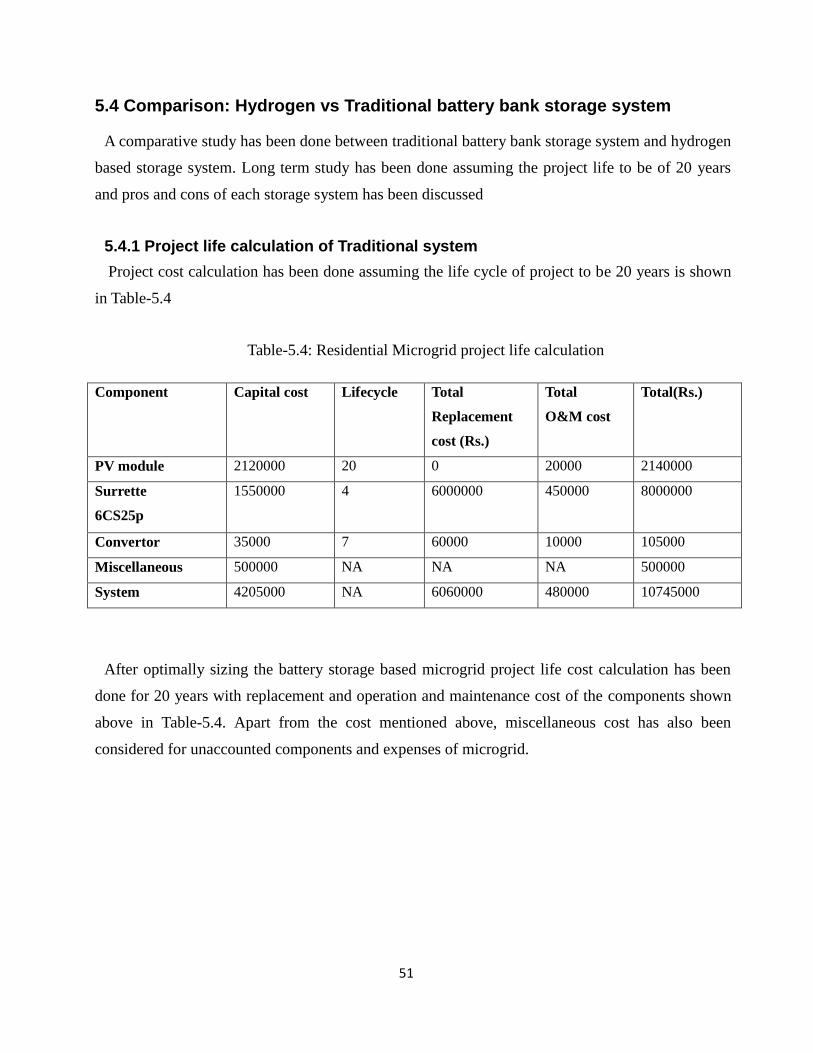
5.4.1 Project life calculation of Traditional system
Project cost calculation has been done assuming the life cycle of project to be 20 years is shown
in Table-5.4
Table-5.4: Residential Microgrid project life calculation
Component Capital cost Lifecycle Total
Replacement
cost (Rs.)
Total
O&M cost
Total(Rs.)
PV module 2120000 20 0 20000 2140000
Surrette
6CS25p
1550000 4 6000000 450000 8000000
Convertor 35000 7 60000 10000 105000
Miscellaneous 500000 NA NA NA 500000
System 4205000 NA 6060000 480000 10745000
After optimally sizing the battery storage based microgrid project life cost calculation has been
done for 20 years with replacement and operation and maintenance cost of the components shown
above in Table-5.4. Apart from the cost mentioned above, miscellaneous cost has also been
considered for unaccounted components and expenses of microgrid.

52
5.4.2 Project life calculation of Hydrogen based storage system
Project life calculation for hydrogen based hybrid has been done for 20 years of operation of
microgrid shown below in Table-5.5
Table-5.5: Hydrogen storage based project life calculation
Component Capital cost Lifecycle Total
Replacement
cost (Rs.)
Total
O&M cost
Total(Rs.)
PV module 3180000 20 0 30000 3210000
Fuel cell 2340000 5 6000000 240000 8580000
Electrolyzer 1404000 5 4062000 240000 5706000
Convertor 35000 7 60000 10000 105000
Miscellaneous 500000 NA NA NA 500000
System 7459000 NA 10122000 520000 18101000
After calculating project life of both systems for a period of 20 years, it can be seen that project
cost of battery based storage system is less than the hydrogen based storage system which is also
shown in Fig. 5.4
Fig. 5.4: Estimated cost of projects

53
5.5 summary
After calculating project life of both systems for a period of 20 years, it can be seen that project
cost of battery based project is less than the hydrogen based project by 7356000 Rs. Both type of
storage system has its own advantages and disadvantages which are discussed below in Table-5.6:
Table-5.6: Comparison between battery bank storage system and hydrogen based storage system
Advantages Disadvantages
Hydrogen based storage Hydrogen is easily portable in
case storage is low
No leakage energy
Smaller footprint
Environment friendly
Cost of increasing the size of
storage is low
Low round trip efficiency –
results in a higher number of PV
panels needed for a given load
Higher capital cost and project
life cost.
Battery bank storage High round trip efficiency
Lower installation and project
life cost
Adverse impact on the
environment
Increasing storage size is
expensive
It can be summarized from the results above that more no. of panels will be required to supply a
load profile to compensate for the losses in electrolyzer and fuel cell. In the case study solved in
this chapter that in case of battery based storage we have seen that solar module of total capacity 14
KW in combination of 24 batteries is required to supply the load profile but as the power losses are
higher in the hydrogen based storage system, solar module of total capacity 21 KW in combination
with fuel cells and electrolyzers is required to supply the load with zero rejection policy.
54
Chapter 6
Conclusions
6.1 Summary and conclusions
In this project operational optimization has been done for remote area, residential and industrial
microgrid. In case of remote area microgrid and residential microgrid aim was to supply reliable
power throughout the year with zero rejection of load and in case of industrial microgrid aim was
to reduce the cost of operation via distributed energy resources in this project viz. PV based power.
In Chapter 2 historical background and literature survey. This chapter introduces the current state
of renewable energy resources in India and their application in microgrid research keeping its
application in off-grid areas in mind. In this chapter, a brief history of integration of renewable
resources in traditional, systems is given. Optimization methods for unit-sizing purposes are
discussed; pros. and cons. of each method are mentioned. A brief introduction has also been given
regarding types of microgrid.
In Chapter 3 deals with the issues of remote area microgrid. After yearlong study of the model
developed in GAMS for remote hydrogen based microgrid it can be concluded that hydrogen based
storage can be used to supply to reliable power to the remote community at adequate cost of
operation.
Industrial loads are considered critical in nature thus in Chapter 4 a comparative study has been
done between only utility based power supply and utility in integration with renewable resources, a
significant reduction in price has been observed after optimally scheduling the power generation
and distribution of power from fuel based plants and supplying a part of industrial load via PV
module.
Chapter 5 is related to residential load where a comparative study has been performed between
traditional battery bank storage system and hydrogen based storage system. Cost figures of both
cases show a clear advantage of traditional battery storage based system, indicating a need for
research and technological advances in the hydrogen based storage system

55
6.2 Project contribution
In this project different operational optimization models have been developed for three types of
microgrid remote area, industrial and residential microgrid. Advanced mathematical model GAMS
is used to develop the model for a remote area microgrid which has been solved using MIP. In case
residential load both optimization tools GAMS and HOMER are used for comparative study of
traditional battery bank storage system and hydrogen based storage system.
In case of industrial load an optimal dispatch model of a fuel based power plant has been
developed using quadratic optimization in GAMS, where optimal generation and scheduling is
done to ensure minimum cost of operation of system. A comparative study has also been done to
analysis the impact of inclusion of renewable energy resources to supply a chunk of power via PV
module.
56
6.3 Suggestions for future work
• Alternate Renewable Resources
Biomass, hydropower, geothermal energy, and other renewable resources already discussed
in the chapter 2 need to be studied and implemented as some of them may be economically
viable for implementation in remote communities India. Technologies such as plastic micro
wind turbine should be included in future studies as their field trails has been very
promising due to their low capital cost and power generation even at very low speed which
is the case with India.
• Microgrid dynamics
To examine the dynamic behaviour of the microgrid, the system control algorithms could
be studied. The power flow analysis, the voltage and frequency stability analysis, the
islanding operating mode, and the response of the system when faults occur are all
challenging issues.
57
References
1. "All India region-wise generating installed capacity of power” Central Electricity Authority, Ministry of
Power, Government of India. February 2013.
2. “The potential of renewable energy in India” Gyan research and analytics 2011
3. M. A. Pedrasa, and T. Spooner, “A Survey of Techniques Used to Control Microgrid Generation and
Storage during Island Operation”.
4. http://www.mnre.gov.in/mission-and-vision-2/achievements/ - Ministry of Renewable Energy
5. http://thesolarity.wordpress.com/2010/09/25/status-of-solar-energy-in-inida-2010/ “Status of solar in
India -2010”
6. D. Edwards and M.Negnevitsky, “Designing a Wind-Diesel Hybrid Remote Area Power Supply
System”, senior member IEEE 2008.
7. Tapan K. Bose, Kodjo Agbossou, Mohan Kolhe, Jean Hamelin , “Stand-alone renewable energy system
based on hydrogen production” 2004 IEEE Transaction on Energy conversion
8. M.Vafaei, and M.Kazerani, Optimal Unit-Sizing of a Wind-Hydrogen-Diesel Microgrid System for a
Remote Community, IEEE, 2011
9. Z. Wei, and Y. Hongxing, “One optimal sizing method for designing hybrid solar-wind-diesel power
generation systems”, Proceeding of ISES Solar World Congress 2007: Solar Energy and Human
Settlement.
10. D.B. Nelson, M.H. Nehrir, and C. Wang, “Unit Sizing of Stand-Alone Hybrid Wind/PV/Fuel Cell Power
Generation Systems” PES.2005.1489286 pp.2116 - 2122 Vol. 3 In proceeding of: Power Engineering Society
General Meeting, 2005. IEEE
11. Aitor Milo, Haizea Gaztanaga, “Optimization of an experimental hybrid microgrid Operation:
Reliability and Economic Issues” 2009 IEEE Bucharest power tech conference June 28th – July 2nd
Romania.
12. http://www.motorwavegroup.com/new/motorwind/product.html

58
13. F. Katiraei, and C. Abbey, “Diesel plant sizing and performance analysis of a remote wind-diesel
microgrid”, Proceeding of the IEEE-PES 2007 General meeting.
14. Z. Wei, and Y. Hongxing, “One optimal sizing method for designing hybrid solar-wind-diesel power
generation systems”, Proceeding of ISES Solar World Congress 2007: Solar Energy and Human
Settlement.
15. J.A. Razak, K. Sopian, Y. Ali, M.A. Alghoul, A. Zaharim, and I. Ahmad, “Optimization of PV-Wind-
Hydro-Diesel Hybrid System by Minimizing Excess Capacity”, European Journal of Scientific Research,
Vol.25 No.4 2009.
16. H. Suryoatmojo, T.H. Member, A.A. Elbaset, and M. Ashari, “Optimal design of wind-PVdiesel-battery
system using genetic algorithm”, IEEJ Trans. PE, Vol.129 No.3, 2009.
17. R. Chedid, H. Akiki and Saifur Rahman, “A decision support technique for the design of hybrid solar-
wind power system” IEEE Transactions on Energy conversion, Vol. 13, No. 1, March 1998
18. Patel MR. Wind and solar power systems. Boca Raton: CRC Press; 1999.
19. Shin'ya Obaraand Abeer Galal El-Sayed: “Compound Micro-grid Installation Operation Planning of
PEFC and Photovoltaics with Prediction of Electricity Production using GA and Numerical Weather
Information“, International Journal of Hydrogen Energy, Vol. 34,No. 19,pp. 8213-8222, (2009).
20. Raul E. Perez-Guerrero and Jose R. Cedenio-Maldonado, “Economic Power dispatch with the Non-
smooth cost functions Using Differential Evolution” Member IEEE
21. A. Wood, B. Wollenberg, Power generation, Operational and control. New York: Wiley, 1996.
22. S.Y. Derakhshandeh, Amir S., Sara Deilami, Mohammad A. S. Masoum and M.E Hamedani
“Coordination of generation scheduling with PEVs Charging in Industrial Microgrids” IEEE
Transaction in Power system

59
Bio-data
NAME : Dilraj Meena
DATE OF BIRTH : 11th Dec 1990
ADDRESS : 62, MAHAVEER NAGAR, NEAR
HAMMIR BRIDGE, RANTHAMBHORE
ROAD, SAWAI MADHOPUR,
RAJASTHAN - 322001
EDUCATION : BTECH IN ELECTRICAL
ENGINEERING AND MTECH IN
POWER SYSTEMS AND POWER
ELECTRONICS
EMAIL : [email protected]

60