operating expenses remained at the previous year’s...
TRANSCRIPT

SAGA FURS OYJ
INTERIM REPORT FOR 1 November 2015 to 30 April 2016
Vantaa, 28 June 2016 at 4:00 p.m.
SAGA FURS OYJ REPORTS CLEAR LOSSES FOR FIRST HALF OF THE YEAR
The total value of sales in the financial period 1 November 2015–30 April 2016 decreased by 62 per cent and amounted to EUR 137 million (MEUR 360 for the
previous corresponding period). In the financial period, the company sold only 4.5 million fur pelts (5.4 million in
the previous corresponding period), as a large amount of fox pelts were left unsold
in the December and March auctions. The price level of both mink and fox pelts decreased over 50 per cent compared
with the previous corresponding period. Consolidated net turnover fell by 44 per cent year-on-year, standing at EUR 18.3
million (MEUR 32.9).
Operating expenses remained at the previous year’s level, EUR 30.0 million (MEUR 30.2).
Consolidated operating loss was EUR -11.0 million (MEUR +3.3). Consolidated net financial income decreased by half year-on-year and totalled EUR
1.5 million (MEUR 3.3).
Consolidated loss before taxes stood at EUR -9.4 million (MEUR 6.6). Consolidated operating loss for the first 6 months of the financial year was EUR -
9.5 million (MEUR +5.1). Earnings per share for the six-month period amounted to EUR -2.63 (EUR 1.41).
On 27 January 2016, Saga Furs Oyj issued a negative profit warning: the
consolidated result is expected to remain clearly lower than that of the previous
financial year and probably show loss.
On 19 April 2016, Saga Furs Oyj published a stock exchange release stating that
the company started statutory cooperation negotiations in Finland with the aim of
renewing its organisation and streamlining its operations in order to secure its
future competitiveness. The personnel savings targeted by the statutory
negotiations were around one million euros per year.
On 9 June 2016, Saga Furs Oyj issued a negative profit warning, according to
which the company expects its result for the financial year to show clear loss.
Consolidated key figures Nov/15–
Apr/16 Nov/14–
Apr/15 Nov/14–
Oct/15 6 mo 6 mo 12 mo
Total sales, MEUR 137.3 360.4 637.3 Number of skins sold, 1,000 pcs 4,520 5,359 11,138 Net turnover, MEUR 18.3 32.9 58.5 Operating profit/loss, MEUR -11.0 3.3 4.4 Profit before taxes, MEUR -9.4 6.6 9.4 Earnings per share, EUR -2.63 1.41 2.06 Return on equity (ROE), % -10.7% 5.6% 8.0% Return on investment (ROI), % -4.5% 3.8% 5.4%

Accounting principles
This interim report was prepared in accordance with the IAS 34 Interim Financial
Reporting. This report has been prepared in accordance with the same accounting principles as
the financial statements dated 31 October 2015.
The Securities Market Act no longer includes a requirement to present future prospects in interim reports. Future prospects are presented in the annual report in accordance with the Accounting Act. However, the company has decided to continue
to present future prospects in its interim reports for the time being. Any changes to this practice will be communicated separately.
The information presented in this interim report is unaudited.
Sales for the period 1 November 2015 – 30 April 2016
Saga Furs Oyj held the first auction of the financial year from 19 to 21 December 2015. Saga® fox and Finnraccoon pelts and Karakul lamb pelts were sold at this
auction. Unlike previous sales periods, mink pelts were not offered until the March auction. The downturn of the economic growth rate in China and the ongoing difficulties in the Russian economy were clearly reflected in the sales results, and only
a little over one-third of the pelts were sold at the auction. The company sold a total of little less than 100,000 fox pelts (190,000 at the corresponding auction in the
previous year), 100,000 Karakul lamb pelts (97,000) and 30,000 Finnraccoon pelts (18,000). The value of sales at the auction totalled EUR 12.4 million (EUR 49.5 million in December 2014, at the auction where also 490.000 mink pelts were sold).
Saga Furs Oyj held the second auction of the financial year from 8 to 18 March 2016,
in cooperation with the North American auction houses American Legend and Fur Harvesters. A total of 3.7 million mink pelts (3.6 million at the corresponding auction in the previous year), 490,000 fox pelts (780,000), 49,000 Karakul lamb pelts
(97,000) and 53,000 Finnraccoon pelts (45,000) were sold at the auction by Saga Furs Oyj. A little under 60 per cent of the offered Saga® blue fox pelts were sold. The
value of this auction’s sales was EUR 124 million (MEUR 308). The long-lasting fur trade boom has led to a situation in which the global supply of fur pelts exceeds demand. Even though fur is still in fashion, the economic challenges prevailing in key
market regions have reduced demand, and the price levels of both mink and fox pelts fell to one-half of the previous six-month period’s level.
Between November and April, a total of 3.7 million mink pelts (4.1 million in the previous corresponding period), 600,000 fox pelts (1.0 million), 150,000 Karakul lamb
pelts (190,000) and 83,000 Finnraccoon pelts (63,000) were sold by the company. Due to the 50% decrease in the price level and the lower amount of pelts sold, the
value of sales fell by 62 per cent, totalling EUR 137 million (360 MEUR).

Auction Sales Value Sales Value
1,000 pelts EUR 1,000 1,000 pelts EUR 1,000
2015/2016 2015/2016 2014/2015 2014/2015
December 229 12,433 795 49,480
March 4,273 123,971 4,540 307,985
Warehouse sales 18 936 24 2,896
Total 4,520 137,340 5,359 360,361
Financial performance
The strong decline of pelt prices and decrease in the amount of pelts sold were reflected in the consolidated net turnover, which decreased by 44 per cent during the first half of the financial year, amounting to EUR 18.3 million (MEUR 32.9). Of the net
turnover, 46 per cent was made up of commission fees collected from buyers, 27 per cent from those collected from producers and 22 per cent from sales of pelting
services and animals. Other operating income increased by 18 per cent and amounted to EUR 740,000 (EUR 630,000). Other operating income include EUR 560,000 of profits from sales of investments that were available for sale, whereas in
the previous year, this item included EUR 470,000 of recovered buyer credit losses.
Operating expenses for the six-month period remained at the previous year’s level and totalled EUR 30.0 million (MEUR 30.2). Expenses are emphasised during the first six months of the financial year due to the acquisition of pelts, logistics and grading.
Since unsold pelts are not included in the company’s inventories, the expenses incurred from pelt acquisition, logistics and grading impose a direct burden on
financial results. Operating expenses include credit losses of EUR 1.4 million recorded for receivables from buyers (EUR 5,800). Due to the market situation in Russia, a major customer of the company became insolvent, and the decrease in the value of
the pelts as security for receivables exceeds the value of the supplementary security received from the customer. Expenses related to international lobbying through IFF
and Fur Europe decreased from the previous year, totalling EUR 0.6 million (MEUR 1.7).
Due to the strong decline in prices and decrease of the amount of pelts sold, the consolidated operating result showed clear loss, EUR -11.0 million (MEUR +3.3).
Consolidated net financial income declined by 53 per cent, totalling EUR 1.5 million (3.3 MEUR). This was mainly due to a decrease in net interest income.
Consolidated loss was EUR -9.4 million (MEUR +6.6) before taxes and EUR -9.5
million (MEUR +5.1) after taxes. Return on equity was -10.7 per cent (+5.6 per cent), with earnings per share amounting to EUR -2.63 (+1.41).
The Group’s equity ratio at the end of the review period was 39.6 per cent (42.7 per cent at the end of April 2015 and 44.5 per cent on the closing date of 31 October
2015). The Group’s liquidity remained at a healthy level throughout the review period. The consolidated balance sheet total was EUR 223.7 million (MEUR 234.3 on 30 Apr
2015 and MEUR 227.8 on 31 October 2015). Equity per share was EUR 22.63 (EUR 25.71 on 30 Apr 2015 and EUR 26.38 on 31 October 2015).

On 27 January 2016, Saga Furs Oyj issued a negative profit warning, stating that the
consolidated result was expected to remain clearly lower than that of the previous financial year and probably show loss. According to the profit warning, the likely price
development of the financial year’s upcoming auctions was very difficult to estimate based on the first international auctions held in the sales season 2015–2016. However, it was estimated that the international prices of both mink and fox pelts
would remain below the previous year’s level.
As was announced in the stock exchange release published on 19 April 2016, Saga Furs Oyj started statutory cooperation negotiations in Finland with the aim of renewing its organisation and streamlining its operations in order to secure its future
competitiveness. The personnel savings targeted by the statutory negotiations throughout the Group, including the international organisation, were around one
million euros per year. Capital expenditure and development
Consolidated gross capital expenditure for November to April totalled EUR 1.7 million
(MEUR 5.2), or 10 per cent (16 per cent) of net turnover. The biggest investments were made in grading automation and equipment and IT applications, such as the
live.auction application supporting auctions, and the company’s new extranet application.
Shares and share performance
Saga Furs Oyj’s share capital totalled EUR 7,200,000 at the end of the review period and the number of shares stood at 3,600,000, of which 900,000 were Series A shares and 2,700,000 Series C shares.
The value of shares traded in November to April totalled EUR 4.8 million and the
volume was 290,000 shares, representing 11 per cent of the company’s Series C shares. The highest price of the share during the period was EUR 19.59 and the lowest price was EUR 14.23, with the average price being EUR 16.75. The shares
closed at EUR 15.05. The company’s market capitalisation stood at EUR 54.2 million on 30 April 2016.
A list of the company’s largest shareholders as of 30 April 2016 is available for viewing on the company’s website.
Personnel
The number of permanent Group staff in the review period averaged 169 (161 in the previous corresponding period) and fixed-term employees 350 (339). At the end of
the period, the Group employed 407 individuals (406).
Tia Matthews has been appointed Business Director for Fashion and member of Saga Furs Oyj’s management team as of 15 February 2016.
General Meetings
The Annual General Meeting of Saga Furs Oyj held on 21 April 2016 approved the financial statements for the financial year ending on 31 October 2015 and decided to

distribute a dividend of EUR 1.00/share, totalling EUR 3,600,000, and to transfer EUR
645,000 to the counter-cyclical budgetary fund.
Kenneth Ingman, Lasse Joensuu, Jorma Kauppila, Anders Kulp, Virve Kuusela, Pentti Lipsanen, Hannu Sillanpää and Rainer Sjöholm were elected to the Board of Directors. Following the AGM, Jorma Kauppila was elected Chair and Kenneth Ingman Deputy
Chair of the Board of Directors at the first meeting of the Board. Ernst & Young Oy will continue as the company’s auditor.
Seasonal variation
Saga Furs Oyj holds four auctions over the course of the 12-month sales period. The timing and volumes on sale at auctions vary from year to year. Consequently,
fluctuations in the value of sales, net turnover and costs relative to the comparative period may not provide an accurate picture of the development over an entire financial year.
Business risks and uncertainties
The most significant business risks and uncertainties are described in the Board of
Directors’ report for the financial year 1 November 2014 to 31 October 2015. Financial risk management is explained in Note 25 to the consolidated financial
statements.
Significant events after the review period
The statutory cooperation negotiations concerning Saga Furs Oyj’s personnel were concluded on 12 May 2016. The goal was to renew the organisational structure,
streamline operations and generate personnel savings of approximately one million euros per year throughout the Group, including the international organisation. Pursuant to the negotiations, the targeted savings were accomplished, and the
decisions affected the employment relationship of 17 employees throughout the Group. The savings impact will be fully effective in the financial year starting on 1
November 2016. During the current financial year, savings will be gained, as most of the Group’s Finnish employees decided to trade their holiday bonuses for extra time off and foreign employees decided to take unpaid leave.
Saga Furs Oyj arranged an auction in cooperation with the North American auction
house American Legend on 8–17 June 2016. The auction was mainly driven by buying from China, and the value of sales grew to nearly EUR 126 million (MEUR 220 at the corresponding auction in the previous year). Nearly 600 buyers attended the auction,
and a total of 2.9 million mink pelts (3.3 million), 830,000 fox pelts (650,000), 29,000 Finnraccoon pelts (31,000) and 24,000 Karakul lamb pelts (34,000) were sold at the
auction. On 9 June 2016, Saga Furs Oyj issued a negative profit warning, according to which
the company expects its result for the financial year to show clear loss. During the financial year 2015–2016, the supply of blue fox has clearly exceeded demand, and
the current market situation does not allow the company to offer all remaining blue fox pelts in the last auction of the financial year, which will be held in September.

Due to the heavy decline in fox pelt prices, the company’s sales profits will decrease
more than was estimated. In addition, the transfer of pelt sales to another financial period will also clearly deteriorate the company’s profits. Saga Furs Oyj does not own
the pelts sold by it, and therefore they are not included in the company’s inventories. For this reason, the expenses incurred from the acquisition, transportation, grading and storage of pelts will be reported for the current financial year, whereas the profits
from their sales will only be reported for the financial year during which they are sold.
Prospects for the rest of the financial year Saga Furs Oyj will arrange the final auction of the financial year in September. In this
auction, approximately 730,000 fox pelts and 1.2 million mink pelts, most of which representing a lower quality, will be offered. The development of the market
conditions depends, first and foremost, on the start of raw material and garment trade in China during the summer and the autumn. The Russian markets are not expected to pick up significantly in the short term.
Costs of the six last months of the financial year are estimated to remain lower than
those of the corresponding period last year. The advance breeding fees payable to producers in the spring and autumn are lower than a year ago, which has an impact
on consolidated net financial income. Consolidated results for the financial year are estimated to show a clear loss.

Consolidated statement of financial position, IFRS
EUR 1.000
ASSETS 30 Apr 2016 30 Apr 2015 31 Oct 2015
Non-current assets
Property, plant and equipment 38 663 40 524 39 479
Intangible assets 4 388 4 202 4 224
Available-for-sale investments 327 782 898
Long-term receivables from fur breeders 16 479 3 653 11 328
Non-current assets, total 59 858 49 160 55 929
Current assets
Inventories 2 129 2 653 2 701
Interest-bearing receivables from buyers 25 249 57 684 43 669
Interest-bearing receivables from fur breeders 84 244 46 262 84 047
Non-interest-bearing receivables 43 081 46 361 34 485
Tax assets based on taxable income for the period 930 1 167 702
Cash and cash equivalents 8 257 30 970 6 249
Current assets, total 163 890 185 098 171 855
Total assets 223 748 234 258 227 783
SHAREHOLDERS' EQUITY AND LIABILITIES 30 Apr 2016 30 Apr 2015 31 Oct 2015
Equity attributable to parent company's shareholders
Share capital 7 200 7 200 7 200
Share premium account 254 254 254
Other funds 20 385 19 740 19 740
Translation difference 57 55 54
Fair value reserve 0 333 426
Retained earnings 53 583 64 967 67 293
Shareholders' equity, total 81 479 92 550 94 968
Provisions for liabilities and charges 0 266 105
Non-current liabilities
Deferred tax liabilities 2 341 2 181 2 449
Current liabilities
Interest-bearing liabilities 101 266 103 218 104 447
Trade and other payables 38 578 35 931 25 686
Deferred taxes based on the taxable income 84 113 128
Current liabilities, total 139 928 139 262 130 261
Total liabilities 142 269 141 443 132 711
Total shareholders' equity and liabilities 223 748 234 258 227 783
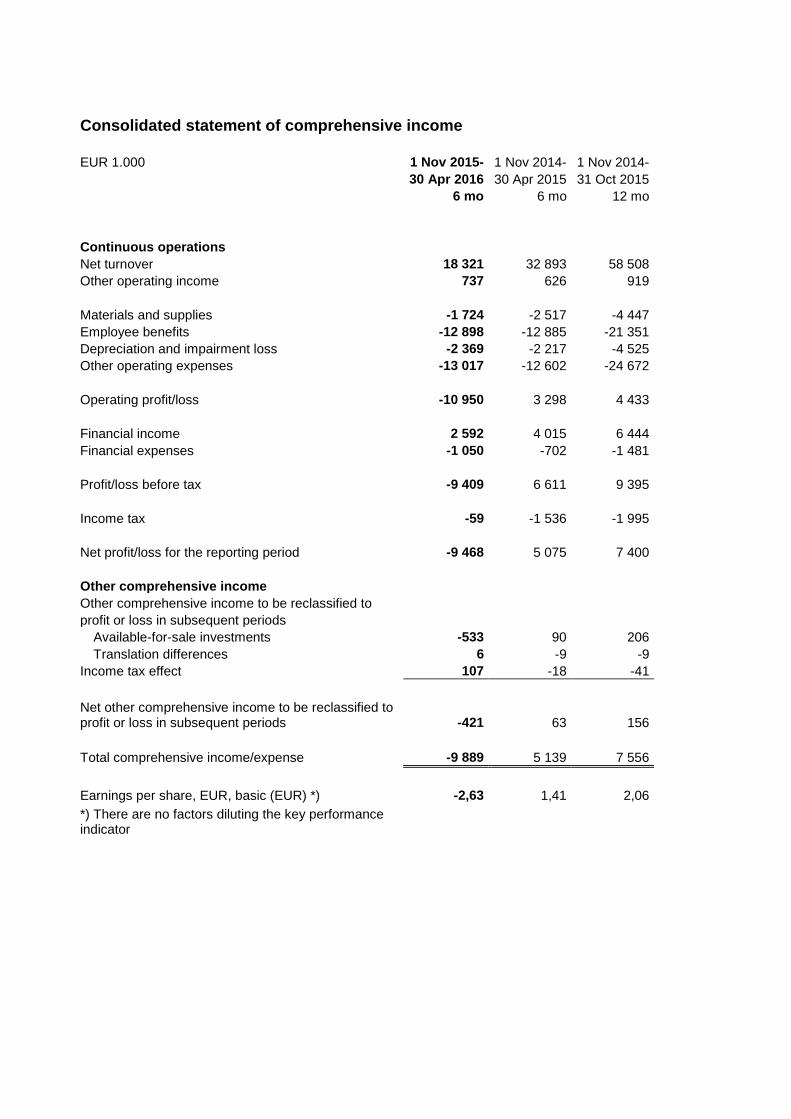
Consolidated statement of comprehensive income
EUR 1.000 1 Nov 2015- 1 Nov 2014- 1 Nov 2014-
30 Apr 2016 30 Apr 2015 31 Oct 2015
6 mo 6 mo 12 mo
Continuous operations
Net turnover 18 321 32 893 58 508
Other operating income 737 626 919
Materials and supplies -1 724 -2 517 -4 447
Employee benefits -12 898 -12 885 -21 351
Depreciation and impairment loss -2 369 -2 217 -4 525
Other operating expenses -13 017 -12 602 -24 672
Operating profit/loss -10 950 3 298 4 433
Financial income 2 592 4 015 6 444
Financial expenses -1 050 -702 -1 481
Profit/loss before tax -9 409 6 611 9 395
Income tax -59 -1 536 -1 995
Net profit/loss for the reporting period -9 468 5 075 7 400
Other comprehensive income
Other comprehensive income to be reclassified to
profit or loss in subsequent periods
Available-for-sale investments -533 90 206
Translation differences 6 -9 -9
Income tax effect 107 -18 -41
Net other comprehensive income to be reclassified to profit or loss in subsequent periods -421 63 156
Total comprehensive income/expense -9 889 5 139 7 556
Earnings per share, EUR, basic (EUR) *) -2,63 1,41 2,06
*) There are no factors diluting the key performance indicator

Consolidated statement of cash flows
EUR 1.000 1.11.2015- 1.11.2014- 1.11.2014-
30.4.2016 30.4.2015 31.10.2015
6 mo 6 mo 12 mo
Cash flow from operating activities
Payments received for selling on commission 147 890 337 359 629 178
Cash received from other operating income 175 152 338
Cash paid for other operating expenses -147 677 -306 813 -622 704
Cash flow from operating activities before
financial items and taxes 388 30 698 6 812
Interests, paid -771 -541 -954
Other financial expenses -277 -91 -454
Interest, received 3 222 3 768 5 042
Other financial income 300 412 564
Dividend income 0 22 22
Direct taxes paid -288 -3 059 -2 841
Net cash flow from operating activities (A) 2 575 31 210 8 191
Cash flow from investment activities
Investments in tangible and intangible assets -1 741 -5 191 -6 584
Proceeds from sale of tangible and intangible
assets 42 27 171
Investments in other assets 0 -8 -8
Proceeds from other investments 584 0 0
Net cash flow from investment activities (B) -1 115 -5 171 -6 421
Cash flow from financing activities
Proceeds from short-term borrowings 3 765 3 140 2 896
Dividends paid -3 217 -2 268 -2 476
Net cash flow from financing activities (C) 548 872 420
Change in cash flows (A+B+C) increase (+) /
decrease (-) 2 008 26 911 2 190
Cash and cash equivalents, 30 Apr / 31 Oct 8 257 30 970 6 249
./. Cash and cash equivalents, 1 Nov 6 249 4 059 4 059
Net change in cash and cash equivalents 2 008 26 911 2 190

Consolidated statement of changes in shareholders' equity 1.11.2014-30.4.2015
Share capital
Share premium account
Other funds
Translation difference
Fair value
reserve
Retained earnings
Before minority interests
Minority interests
Total
Shareholders' equity, 1 Nov 2014 7 200 254 19 590 60 262 62 565 89 931 0 89 931
Result for the reporting period 5 075 5 075 5 075
Other comprehensive income/expense -5 72 -4 63 63
Dividend -2 520 -2 520 -2 520
Transfer to counter-cyclical budgetary fund 150 -150 0 0
Shareholders' equity, 30 Apr 2015 7 200 254 19 740 55 333 64 967 92 550 0 92 550
Consolidated statement of changes in shareholders' equity 1.11.2015-30.4.2016
Shareholders' equity, 1 Nov 2015 7 200 254 19 740 54 426 67 293 94 968 0 94 968
Result for the reporting period -9 468 -9 468 -9 468
Other comprehensive income/expense 3 -426 3 -421 -421
Dividend -3 600 -3 600 -3 600
Transfer to counter-cyclical budgetary fund 645 -645 0 0
Shareholders' equity, 30 Apr 2016 7 200 254 20 385 57 0 53 583 81 479 0 81 479

Key performance indicators
2015/2016 2014/2015 2014/2015
6 mo 6 mo 12 mo
Total sales, EUR 1,000 137 340 360 361 637 349
Net turnover, EUR 1,000 18 321 32 893 58 508
Operating profit/loss, EUR 1,000 -10 950 3 298 4 433
% of net turnover -59,8% 10,0 % 7,6 %
Profit before taxes, EUR 1,000 -9 409 6 611 9 395
% of net turnover -51,4 % 20,1 % 16,1 %
Earnings per share, EUR -2,63 1,41 2,06
Equity per share, EUR 22,63 25,71 26,38
Return on equity (ROE)-% -10,7 % 5,6 % 8,0 %
Return on investment (ROI)-% -4,5 % 3,8 % 5,4 %
Equity-to-assets ratio, % 39,6 % 42,7 % 44,5 %
Gearing 1,14 0,78 1,03
Gross capital expenditure, EUR 1,000 1 741 5 198 6 592
% of net turnover 9,5 % 15,8 % 11,3 %
Average number of personnel 520 500 382
Principles for calculating key performance indicators:
Return on equity (ROE)-% = Profit/Loss for the financial period x 100 / shareholders' equity *)
Retun on investment (ROI)-% = (Profit/Loss before taxes + interests and other financial costs - credit losses) x 100 / (balance sheet total - non-interest-bearing short-term liabilities) *)
Equity-to-assets ratio, % = Shareholders' equity x 100 / (balance sheet total - advances received)
Gearing = (Interest-bearing borrowed capital - cash and securities and financial securities ) / shareholders' equity
Earnings per share, EUR = Profit/Loss for the financial period / adjusted average number of shares
Equity per share, EUR = Shareholders' equity / adjusted number of shares on the balance sheet date
*) The divisor applied to the key performance indicators is calculated as the average of the numbers in the balance sheet of the financial period and of the previous financial period.

Commitments and contingencies
EUR 1.000 30 Apr 2016 30 Apr 2015 31 Oct 2015
Mortgages given and receivables pledged in security for debt
Loans from financial institutions 73 173 66 512 68 443
Mortgages on property 54 071 54 071 54 071
Mortgages on company assets 2 691 2 691 2 691
Pledges given 791 791 791
Derivative contracts
Forward exchange agreements 30 167 34 119 43 916
Property investments
The group is obliged to check the VAT deductions made on real estate investments if taxable use of the real estate decreases during the inspection period. The maximum amount of liability is EUR 2,6 million and the last year of inspection is 2024.
Related Party Transactions
EUR 1.000 2015/2016 2014/2015 2014/2015
6 mo 6 mo 12 mo
Transactions with related parties:
Net turnover
- other related party 273 340 505
Other operating income
- parent company 24 24 48
Purchase of materials and supplies
- other related party -5 0 0
Other operating expenses
- parent company -14 -9 -17
Financial income
- other related party 32 32 45
Financial expenses
- parent company -2 -5 -20
- other related party -2 -7 -4
Related party receivables
- other related party 1 252 867 1 185

Related party liabilities
- parent company -1 992 -4 277 -1 992
- other related party -1 548 -1 541 -1 850
2015/2016 2014/2015 2014/2015
Management compensation 6 mo 6 mo 12 mo
Remuneration and other short-term employee benefits 881 749 1 376
Management consists of the Board of Directors, the Managing Director, the Managing Director's Deputy and the rest of the groups Management Group.
Vantaa, 28 June 2016
Board of Directors