open source business intelligencedownload.101com.com/pub/tdwi/files/102407_webcast... ·...
TRANSCRIPT
Rajeev Rawat
BI Results, LLC
October 24, 2007
The Ins and Outs of
Open Source Business Intelligence

www.BIResults.com. Copyright © 2007, BI Results, LLC. All Rights Reserved
Expensive
Locked-in
Complex
Business Intelligence Expensive
Locked-in
Complex
Traditional

www.BIResults.com. Copyright © 2007, BI Results, LLC. All Rights Reserved
Open
Source Open
Source
Dynamic
Innovative
Compelling
Dynamic
Innovative
Compelling
Business
Intelligence
www.BIResults.com. Copyright © 2007, BI Results, LLC. All Rights Reserved 4
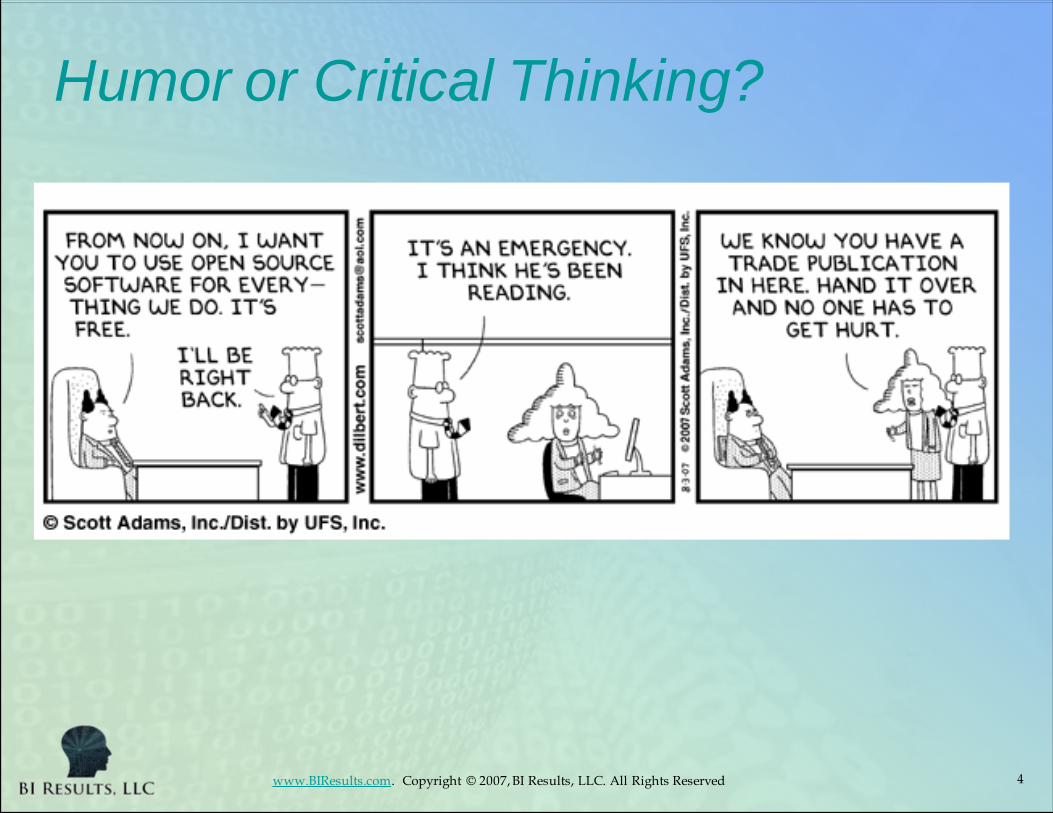
Humor or Critical Thinking?

www.BIResults.com. Copyright © 2007, BI Results, LLC. All Rights Reserved 5
Business Intelligence
What is BI
Why is BI Important
Example of BI at work
Decoupling the BI drive
train
The essence of BI
Does Open Source BI
work?
Proof points
Key factors
Critical perceptions
How to assess whether
An Open Source BI
solution fits your
needs?
Criteria

www.BIResults.com. Copyright © 2007, BI Results, LLC. All Rights Reserved
Generally Used DefinitionBusiness intelligence (BI) is a broad category of applications and technologies for gathering, storing, analyzing, and providing access to data to help enterprise users make better business decisions.
BI applications include the activities of decision support systems, query and reporting, online analytical processing (OLAP), statistical analysis, forecasting, and data mining.
Business intelligence applications can be:
Mission-critical and integral to an enterprise's operations or occasional to meet a special requirement, enterprise-wide or local to one division, department, or project centrally initiated or driven by user demand
www.BIResults.com. Copyright © 2007, BI Results, LLC. All Rights Reserved
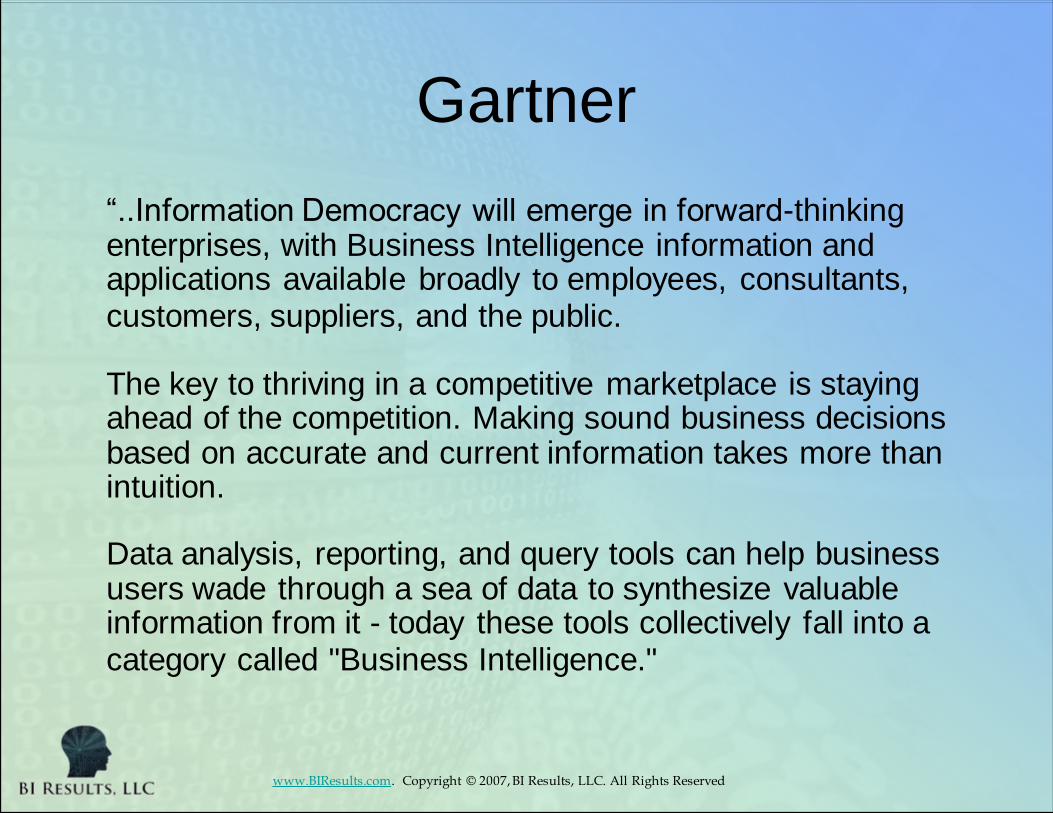
Gartner
―..Information Democracy will emerge in forward-thinking enterprises, with Business Intelligence information and applications available broadly to employees, consultants, customers, suppliers, and the public.
The key to thriving in a competitive marketplace is staying ahead of the competition. Making sound business decisions based on accurate and current information takes more than intuition.
Data analysis, reporting, and query tools can help business users wade through a sea of data to synthesize valuable information from it - today these tools collectively fall into a category called "Business Intelligence."

www.BIResults.com. Copyright © 2007, BI Results, LLC. All Rights Reserved
Business Process
RFID Tags on shipments
Tracking in motion
Delivery on shelf
Revenue per item
Inventory turns mapped
to profit per shelf foot
Turns faster or slower
Best Practices from HQ
or Replenishment
Operations
Logistics
Manuf. to Shipper
Shipper to Retail Warehouse
Warehouse to Retailer
Packaging, Promotion
Retailer to shelf profit plan (turns, customer, promos)
Turns
Sale, turns, overstock, or lost sales
BI ExamplesBusiness Results
Integrated business rules and IT tools
Customer experience.
Loyalty
Business insights to enable action
Excel to compete.
Competitive advantage
Business Process
RFID Tags on shipments
Tracking in motion
Delivery on shelf
Revenue per item
Inventory turns mapped
to profit per shelf foot
Turns faster or slower
Best Practices from HQ
or Replenishment
Operations
Logistics
Manuf. to Shipper
Shipper to Retail Warehouse
Warehouse to Retailer
Packaging, Promotion
Retailer to shelf profit plan (turns, customer, promos)
Turns
Sale, overstock, or lost sales
Business Results
Integrated business rules and IT tools
Customer experience.
Loyalty
Business insights to enable action
Excel to compete.
Competitive advantage
Systems Infrastructure
Connectivity
Manufacturer,
Shipper,
Retailer
POS systems,
Server,
Applications,
Networks,
Storage,
Compatibility for
analysis, reports,
triggers
Systems Infrastructure
Connectivity
Manufacturer,
Shipper,
Retailer
POS systems,
Server,
Applications,
Networks,
Storage,
Compatibility for
analysis, reports,
triggers

www.BIResults.com. Copyright © 2007, BI Results, LLC. All Rights Reserved
Typical BI Stack
Analysis sw accesses data for analysis and presents information insights for actions
Others…
Profile
Classify
Security
Authentication
Compatibility across the enterprise and collaborating systems
Data and data quality
Data formats and data models
Data is transferred to systems operating systems and applications to be stored in a structured form
Data is generated at diverse points by various applications running on a variety of platforms
www.BIResults.com. Copyright © 2007, BI Results, LLC. All Rights Reserved 10
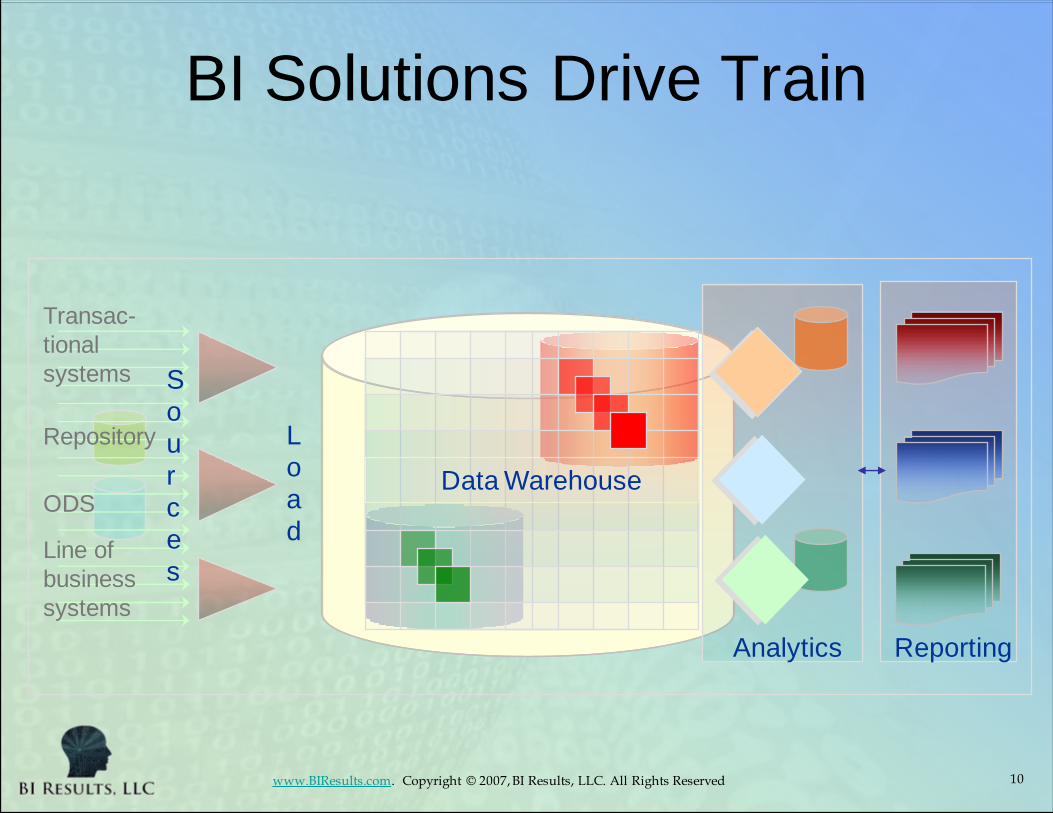
BI Solutions Drive Train
L
o
a
d
Analytics Reporting
Repository
ODS
Transac-
tional
systems
Line of
business
systems
S
o
u
r
c
e
s
Data Warehouse

www.BIResults.com. Copyright © 2007, BI Results, LLC. All Rights Reserved 11
Drive Train Compatibility
L
o
a
d
Analytics Reporting
Data Warehouse
Repository
ODS
Transac-
tional
systems
Line of
business
systems
S
o
u
r
c
e
s
Ab Initio
Erwin
IBM
Informatica
Business
Objects
Cognos
MicroStrategy
SAP
IBM
MicroSoft
Oracle
SAP
Teradata
CRM
ERP
GL
S/DCM
CRM
ERP
GL
S/DCM
Dash-
boards
Dash-
boards
ReportsReports
Score-
cards
Score-
cards
Fair Isaac
MicroSoft
Oracle
SAP
SAS
www.BIResults.com. Copyright © 2007, BI Results, LLC. All Rights Reserved 12
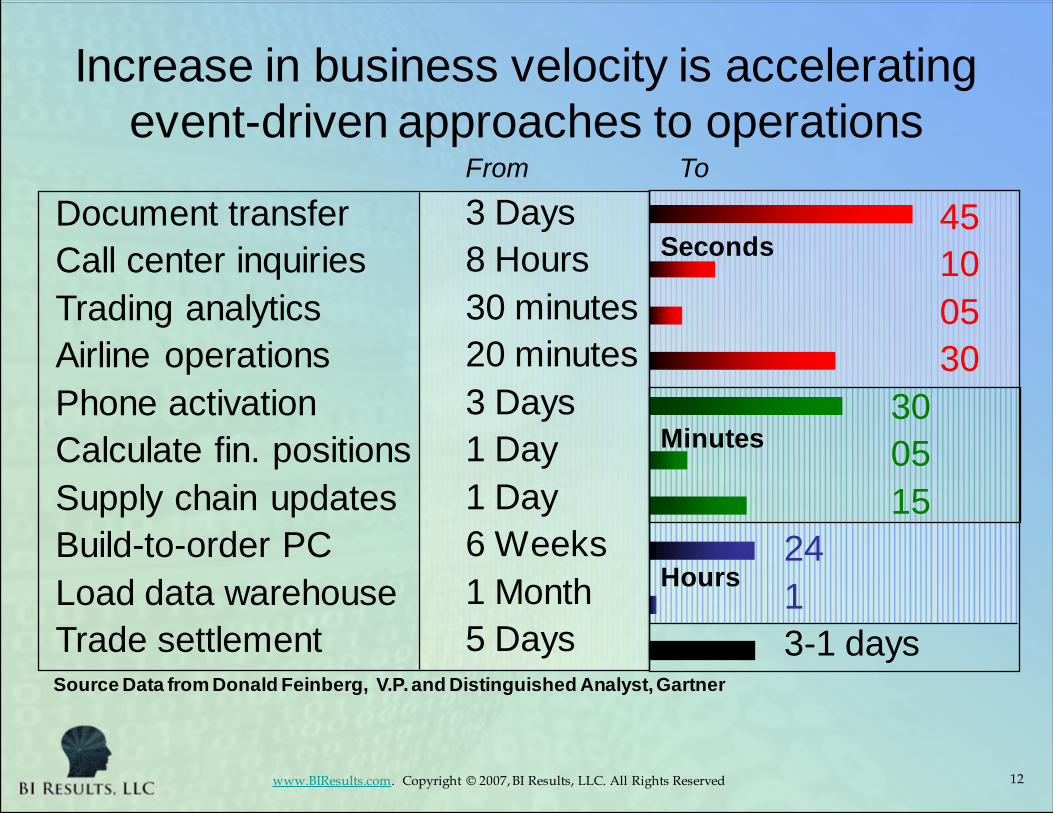
Increase in business velocity is accelerating
event-driven approaches to operations
3 Days
8 Hours
30 minutes
20 minutes
3 Days
1 Day
1 Day
6 Weeks
1 Month
5 Days
45
10
05
30
30
05
15
24
1
3-1 days
Document transfer
Call center inquiries
Trading analytics
Airline operations
Phone activation
Calculate fin. positions
Supply chain updates
Build-to-order PC
Load data warehouse
Trade settlement
Seconds
Minutes
Hours
Source Data from Donald Feinberg, V.P. and Distinguished Analyst, Gartner
From To

www.BIResults.com. Copyright © 2007, BI Results, LLC. All Rights Reserved 13
BI usage, a strategic advantage
Source: CIO Insight Oct 2007 Survey. http://www.cioinsight.com/slideshow_viewer/0,1205,l=&s=300&a=216891&po=3,00.asp
www.BIResults.com. Copyright © 2007, BI Results, LLC. All Rights Reserved 14
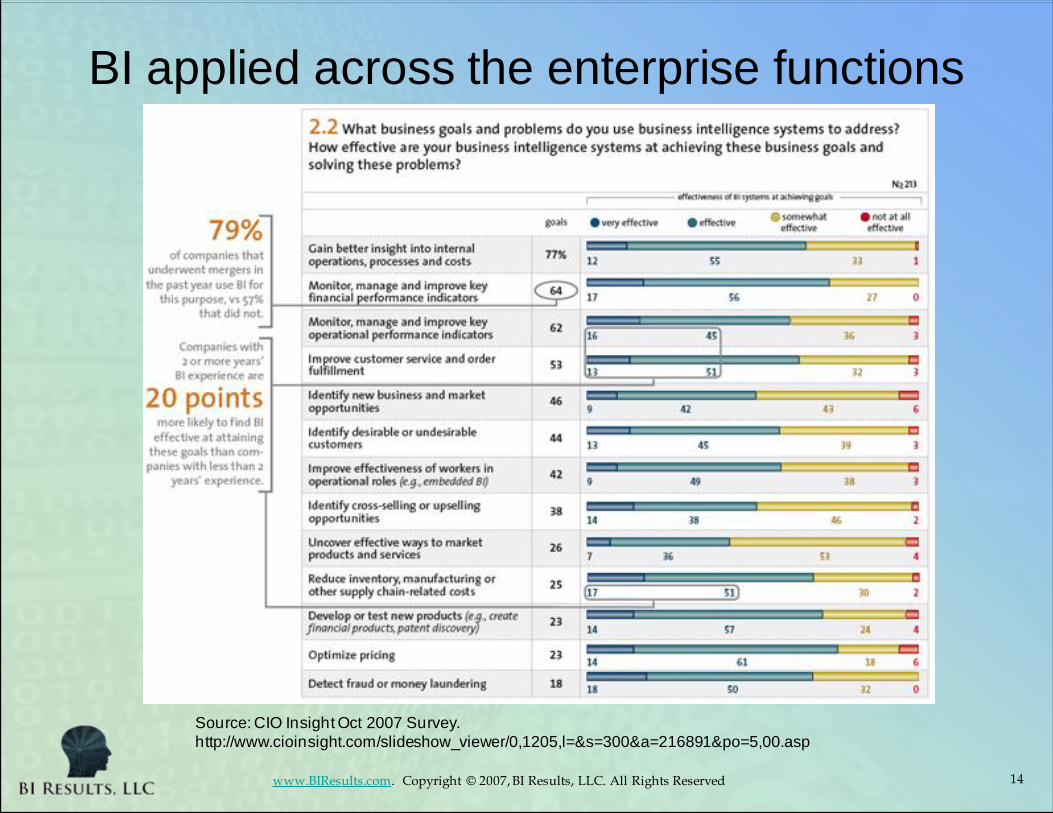
BI applied across the enterprise functions
Source: CIO Insight Oct 2007 Survey.
http://www.cioinsight.com/slideshow_viewer/0,1205,l=&s=300&a=216891&po=5,00.asp
www.BIResults.com. Copyright © 2007, BI Results, LLC. All Rights Reserved 15
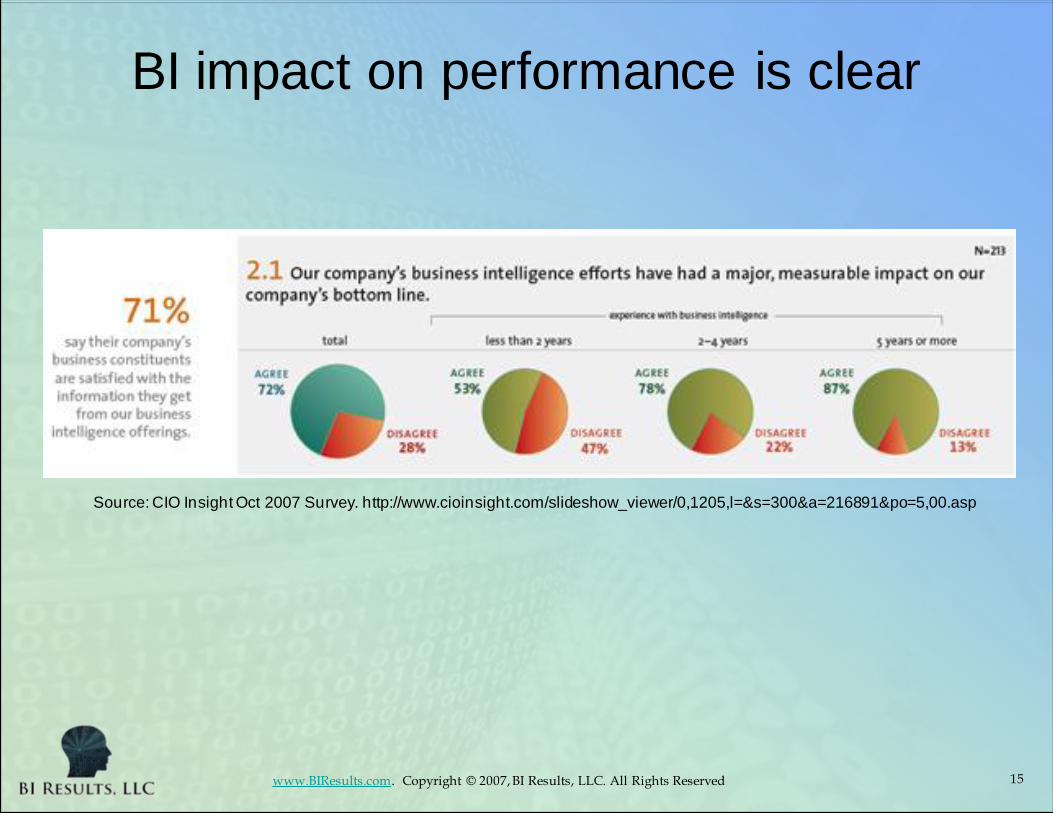
BI impact on performance is clear
Source: CIO Insight Oct 2007 Survey. http://www.cioinsight.com/slideshow_viewer/0,1205,l=&s=300&a=216891&po=5,00.asp

www.BIResults.com. Copyright © 2007, BI Results, LLC. All Rights Reserved 16
IDC: Market is growing
• IDC’s definition of the business analytics software market includes 11 data warehousing and performance management tools and applications segments.
• According to IDC, the business analytics software market reached $19.3 billion in 2006, representing a growth rate of 11.2 percent. The authors expect the worldwide business analytics software market to continue to grow at a healthy compound annual growth rate of 10.3 percent over the next five years. Furthermore, IDC has made the following predictions about the future of business analytics:
- Business analytics solutions will increasingly incorporate functionality
for unified access and analysis of structured data and unstructured content, business process management, collaboration and workflow management functionality.
- A broader set of organizations (in all geographic regions and of all sizes) is beginning to look at business analytics not just as a set of reporting functions, but as a means to gain competitive advantage through better decision management and process optimization.

www.BIResults.com. Copyright © 2007, BI Results, LLC. All Rights Reserved
Essence of BI
Pervasive
Infrastructure integration
Across the enterprise applications
All users benefit
Precise decisions faster
Faster execution
Competitive requirement

www.BIResults.com. Copyright © 2007, BI Results, LLC. All Rights Reserved
Traditional vs. Open Source BI
Typical concerns of traditional BI users
Key differentiators of Open Source BI
Expensive
Locked-in
Complex
Expensive
Locked-in
Complex
Dynamic
Innovative
Compelling
Dynamic
Innovative
Compelling

www.BIResults.com. Copyright © 2007, BI Results, LLC. All Rights Reserved
Traditional BI deployed CIO/BI/DW managers’
top concerns (Source: BI Results survey 2006)
BI education, awareness, and executive sponsorship
Disconnected business and IT visions
Cost to upgrade functions – scalability, performance, volume
Infrastructure and applications compatibility with silos
No simple path to creating enterprise-wide repository
User adoption and use of expensive functional capabilities
Skills and time to implement upgrades
High cost of switching to another vendor
Teamwork among vendors
Turnover on vendor technical team

www.BIResults.com. Copyright © 2007, BI Results, LLC. All Rights Reserved 20
Drive train connectivity,
a major BI issue
Source: CIO Insight Oct 2007 Survey. http://www.cioinsight.com/slideshow_viewer/0,1205,l=&s=300&a=216891&po=18,00.asp

www.BIResults.com. Copyright © 2007, BI Results, LLC. All Rights Reserved
Key differentiators of
Open Source BI
Cost
Flexibility
Standards based solutions
Ease of adoption
Faster functionality updates
Best of breed functionality from user community

www.BIResults.com. Copyright © 2007, BI Results, LLC. All Rights Reserved
Open Source BI adoption is growing
Source: CIO Insight Oct 2007 Survey. http://www.cioinsight.com/slideshow_viewer/0,1205,l=&s=300&a=216891&po=4,00.asp

www.BIResults.com. Copyright © 2007, BI Results, LLC. All Rights Reserved
Open Source BI: a compelling competitive forceGartner:
Open-source products accounted for a 13 percent share of the $92.7 billion software market in 2006, but should account for 27 percent of the market in 2011 when revenue is expected to be $169.2 billion
Of 295 respondents in the U.S. and Europe found that open source software usage stood at 23.6 percent, and this number is set to grow to 25.9 percent over the next year,
"Open-source software is going to erode proprietary sales revenue by offering less-expensive or free alternatives, expanding the total market potential by meeting the demands of SMBs for affordable solutions, and creating a new business model … to provide selection, customization and management services…―
Most commercial software products will include elements of open-source code by 2010.
The open-source software being used, 49.7 percent is used in mission-critical situations, with 50.3 percent being used in non-mission critical situations. That compared to 59 percent of commercial or proprietary software and 58.5 percent of internally developed software which is used in mission-critical situations.
..market accelerators to open source, the low barriers to entry and increased return on investment, the availability of high-quality solutions at low cost, the access to open standards and development processes, vendor independence and flexibility—resulting in investment protection—and faster procurement and a shorter development time.
Among the market inhibitors, many of which are perceptions rather than reality, are concerns about migration and skills transfer, internal development, support and maintenance costs, quality assurance, and the large number of license with conflicting terms.

www.BIResults.com. Copyright © 2007, BI Results, LLC. All Rights Reserved
Gartner: Ignoring Open Source not an option
Open source "the biggest change in corporate IT since distributed computing."
"Open source is not a niche, not a fad." And on the competitive front "competing against open source is tilting at windmills.―
- By 2011, Gartner predicts that at least 80% of all commercial software solutions will include substantive open source.
- Open source is being used equally for mission critical and non-mission critical applications. Gartner's survey shows 49.7% of open source usage is being done for "mission critical" applications, as compared to 59% for proprietary software and 58.5% for internal development.
-- Adoption is heading for more mainstream adoption by 2012 and that the priorities will be: cost and risk
-- Develop an open source policy saying that open source adoption "has to be managed" alongside existing software.
-- Open source has achieved dramatic success in the infrastructure layer: operating systems (Linux), application servers (JBoss, Tomcat), DBMS (MySQL), and security (Snort). The next wave of adoption will be at the application level: CRM, content management, supply chain management, e-learning, etc.
-- In most cases there is better quality and lower Total Cost of Ownership (TCO).
www.BIResults.com. Copyright © 2007, BI Results, LLC. All Rights Reserved 25
0
2
4
6
8
10Business Need
BI functionality
requirement
Risk profile
Skills match
Systems environment
Pricing
Vendor maturity
Solution maturity
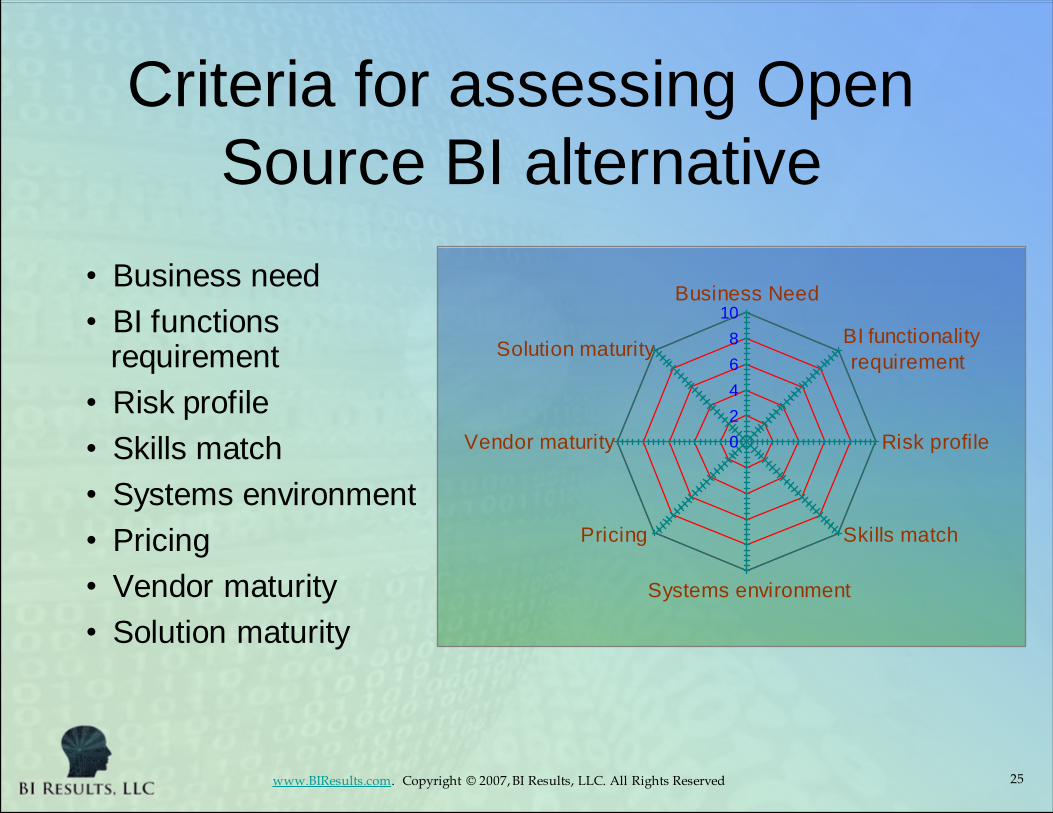
Criteria for assessing Open
Source BI alternative
• Business need
• BI functions requirement
• Risk profile
• Skills match
• Systems environment
• Pricing
• Vendor maturity
• Solution maturity

www.BIResults.com. Copyright © 2007, BI Results, LLC. All Rights Reserved 26
Criteria for assessing Open
Source BI alternativeBusiness Need
- Urgency- Sponsor- Users- Bottlenecks- Data sources- Data quality- Data owners- Business
needs
Risk Profile
- Financial- Operational- Performance- Skills gap
BI functionalityRequirement- Computations- Integration- Reporting- Time
- Embed-ability/SOA
- Repository
- Dashboard/portal
- OLAP UI
- OLAP Server
- ETL
- End-User Ad Hoc
- Alerts
- Semantic Layer
- Security
- Scheduling
- OSS Community
connection
www.BIResults.com. Copyright © 2007, BI Results, LLC. All Rights Reserved 27
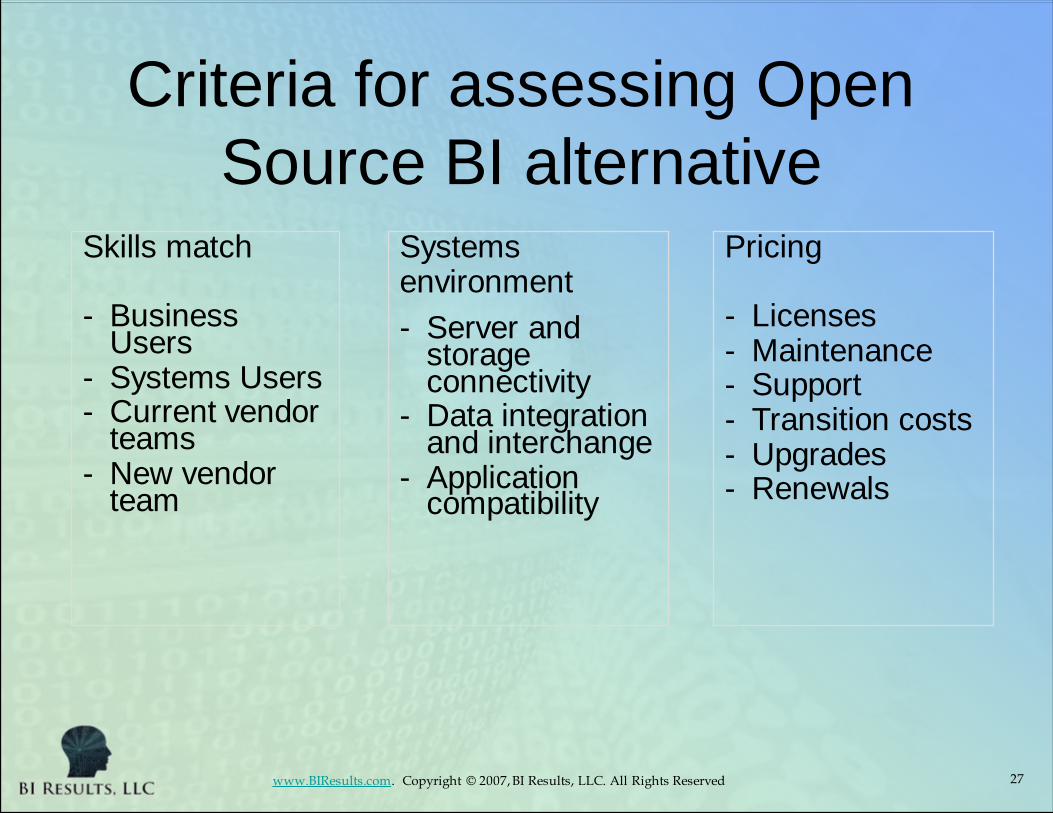
Criteria for assessing Open
Source BI alternativeSkills match
- Business Users
- Systems Users- Current vendor
teams- New vendor
team
Pricing
- Licenses- Maintenance- Support- Transition costs- Upgrades- Renewals
Systemsenvironment
- Server and storage connectivity
- Data integration and interchange
- Application compatibility
www.BIResults.com. Copyright © 2007, BI Results, LLC. All Rights Reserved 28
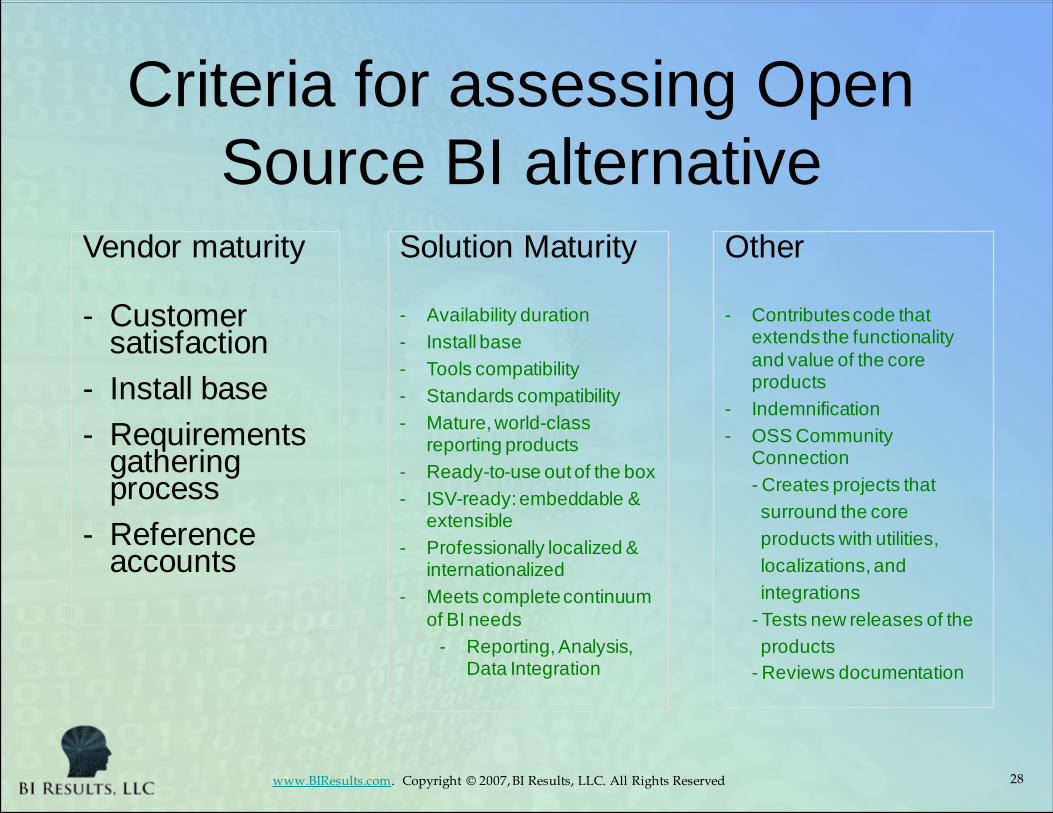
Criteria for assessing Open
Source BI alternativeVendor maturity
- Customer satisfaction
- Install base
- Requirements gathering process
- Reference accounts
Other
- Contributes code that extends the functionality
and value of the core products
- Indemnification
- OSS Community Connection
- Creates projects that
surround the core
products with utilities,
localizations, and
integrations
- Tests new releases of the
products
- Reviews documentation
Solution Maturity
- Availability duration
- Install base
- Tools compatibility
- Standards compatibility
- Mature, world-class reporting products
- Ready-to-use out of the box
- ISV-ready: embeddable & extensible
- Professionally localized & internationalized
- Meets complete continuum
of BI needs
- Reporting, Analysis, Data Integration

www.BIResults.com. Copyright © 2007, BI Results, LLC. All Rights Reserved 29
Consolidate Assessment for business and
systems convergence, consensus
Criteria
Urgency
Sponsors
Users
Bottlenecks
Sources
Data Quality
Data Owners
Computations
Integration
Reporting
Time
Risk: Fin
Risk: Oper.
Risk: Transac
Business BI functionality Risk Skills Systems Pricing Vendor SolutionNeed requirement profile match environ maturity maturity
0
2
4
6
8
10Business Need
BI functionality
requirement
Risk profile
Skills match
Systems environment
Pricing
Vendor maturity
Solution maturity
Shared

www.BIResults.com. Copyright © 2007, BI Results, LLC. All Rights Reserved 30
Open Source BI: What if…
…the CIO, CFO, CEO saved 5%-25% on
licensing costs at a previous company?
What will you be “RIGHT BACK” with?

www.BIResults.com. Copyright © 2007, BI Results, LLC. All Rights Reserved 31
Open Source BI: You’re on the ball!
YOUWE’VE FOUND THREE WAYS TO LEVERAGE OPEN SOURCE -
Criteria I II IIIROI PaybackSavingsScheduleRisk

www.BIResults.com. Copyright © 2007, BI Results, LLC. All Rights Reserved 32
Open Source BI: You have a plan
YOUWE’VE FOUND THREE WAYS TO LEVERAGE OPEN SOURCE -
Criteria I II IIIROI PaybackSavingsScheduleRisk
You can keep
your job
www.BIResults.com. Copyright © 2007, BI Results, LLC. All Rights Reserved 33
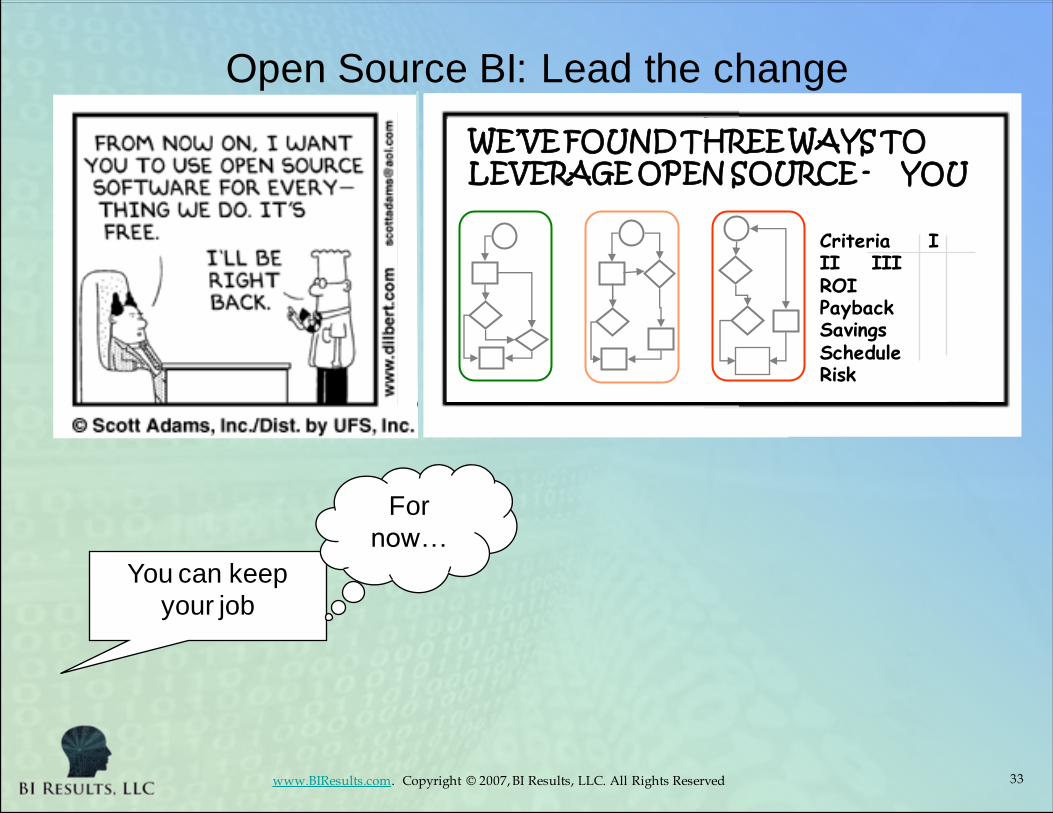
Open Source BI: Lead the change
YOUWE’VE FOUND THREE WAYS TO LEVERAGE OPEN SOURCE -
Criteria I II IIIROI PaybackSavingsScheduleRisk
You can keep
your job
For
now…

www.BIResults.com. Copyright © 2007, BI Results, LLC. All Rights Reserved
Open Source Business
IntelligenceOpen Source BI is a competitive differentiator.
It can reduce cost and provide incremental
functionality.
Learn whether or where it fits in your scope or
needs.
Leverage for competitive advantage.
Grow skills to advance your career.
Open Source BI is a competitive differentiator.
It can reduce cost and provide incremental
functionality.
Learn whether or where it fits in your scope or
needs.
Leverage for competitive advantage.
Grow skills to advance your career.
Your opportunity to shine

Customer Examples
Lance Walter, VP Marketing
Pentaho Introduction
World’s most popular enterprise open source BI Suite
2 million lifetime downloads, averaging 100K / month
Founded in 2004: Pioneer in professional open source BI
Management - proven BI and open source veterans
from Business Objects, Cognos, Hyperion, JBoss, Oracle, Red Hat, SAS
Board of Directors – deep expertise and proven success in open source
Larry Augustin - founder, VA Software, helped coin the phrase “open source”
New Enterprise Associates – investors in SugarCRM, Xensource, others
Index Ventures – investors in MySQL, Zend, others
Widely recognized as the leader in open source BI
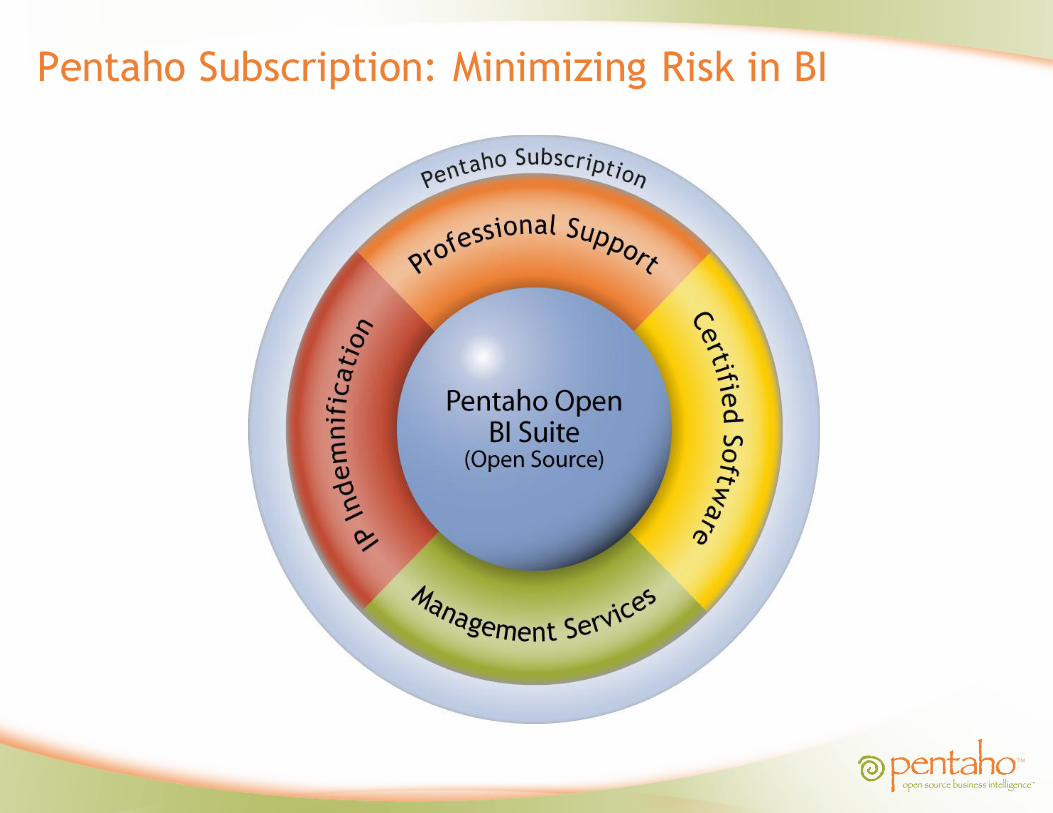
Pentaho Subscription: Minimizing Risk in BI

Pentaho Technology Fundamentals
Componentized and modular
Service-implemented architecture
Built “from the ground up” as a
set of services
Exposed via AJAX and Web
Services
100% Java EE server side
Scalable, standards-based
Web-based, thin-client end user
interfaces
Eclipse-based design interfaces
Embedded workflow / process
engine
Pentaho BI Platform at OrbitzOrbitz, Global Travel Services Company
Key Challenges
Self-service reporting for extranet application
serving travel agents
Pentaho Solution
Pentaho Reporting Server Professional Edition
Red Hat Enterprise Linux, JBoss Application
Server, MySQL database
2,500 users
Results
Integrated, self-service reporting
Application selected as 2006 JBoss Innovation
Award winner
4-year, $1.5M TCO reduction
Why Pentaho
Cost of ownership
Embeddability within custom web-based
applications (security, user interface, etc.)
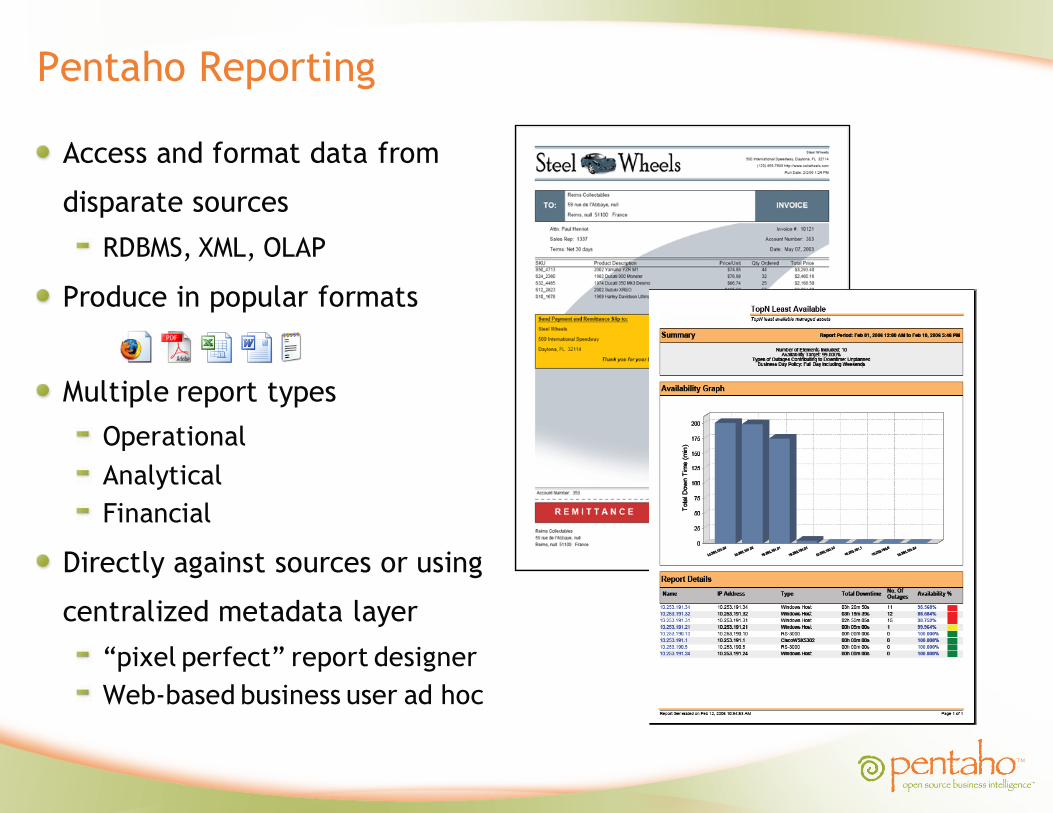
Pentaho Reporting
Access and format data from
disparate sources
RDBMS, XML, OLAP
Produce in popular formats
Multiple report types
Operational
Analytical
Financial
Directly against sources or using
centralized metadata layer
“pixel perfect” report designer
Web-based business user ad hoc
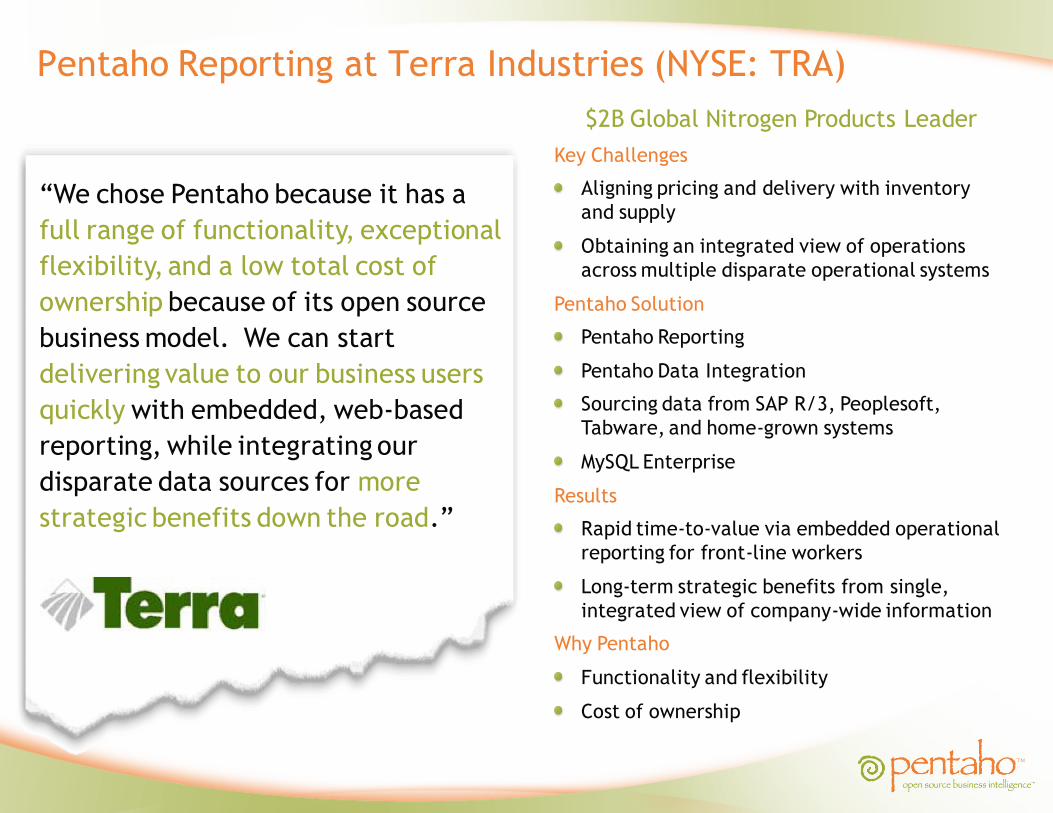
Pentaho Reporting at Terra Industries (NYSE: TRA)
$2B Global Nitrogen Products Leader
Key Challenges
Aligning pricing and delivery with inventory
and supply
Obtaining an integrated view of operations
across multiple disparate operational systems
Pentaho Solution
Pentaho Reporting
Pentaho Data Integration
Sourcing data from SAP R/3, Peoplesoft,
Tabware, and home-grown systems
MySQL Enterprise
Results
Rapid time-to-value via embedded operational
reporting for front-line workers
Long-term strategic benefits from single,
integrated view of company-wide information
Why Pentaho
Functionality and flexibility
Cost of ownership
“We chose Pentaho because it has a
full range of functionality, exceptional
flexibility, and a low total cost of
ownership because of its open source
business model. We can start
delivering value to our business users
quickly with embedded, web-based
reporting, while integrating our
disparate data sources for more
strategic benefits down the road.”

Pentaho Analysis
ROLAP architecture
Works with all popular open
source and proprietary DBs
View data “dimensionally”
i.e. Sales by region, by channel,
by time period
Navigate and explore
Ad Hoc analysis
“Drill-down” from year to quarter
Pivot
Select specific members for
analysis
Web-based or Excel front ends

Pentaho Analysis at Frontier Airlines (NASD: FRNT)Frontier Airlines
Key Challenges
Understanding and optimizing fares to ensure
Maximum occupancy (no empty seats)
Maximum profitability (revenue per seat)
Pentaho Solution
Pentaho Analysis (Mondrian)
BizGres MPP database (Greenplum)
500 GB of data, 6 server cluster
Results
Comprehensive, integrated analysis to set
strategic pricing
Improved per-seat profitability (amount not
disclosed)
Why Pentaho
Chose Greenplum and Mondrian over Oracle
Rich analytical and MDX functionality
Cost of ownership
“The competition is intense in the
airline industry and Frontier is
committed to staying ahead of the
curve by leveraging technology that
will help us offer the best prices and
the best flight experience…. [the
application] fits right in with our
philosophy of providing world-class
performance at a low price.”

Pentaho Dashboards
Tight business process integration
Embedded workflow
Can receive events from or trigger
events in external systems
Pentaho Open BI Suite Integration
Comprehensive auditing of user
activity, performance and data access
Context-sensitive drilling to reports or
analysis
Integrated security, scheduling, alerting, portal integration,
Modern, Standards-based Architecture
J2EE and AJAX providing scalability,
portability, and integration
All components exposed as web-services
JDBC 2.0 compliant

Pentaho Dashboards at Boyne ResortsNorth America’s Largest Family Run Four-
Season Resort Company
Key Challenges
Understanding customer behavior and customer
loyalty to drive marketing programs
Analyzing profitability of resorts, food service
Pentaho Solution
Pentaho Dashboards, Reporting, and Analysis.
replacing Crystal Reports from Business Objects
Pentaho integration with Google Maps
Microsoft Windows, SQL Server
Results
Critical insight into customer trends to maximize
results from marketing programs
Primary marketing dashboard delivered in less
than one day
Why Pentaho
Breadth of functionality in open source
Ability to deliver results quickly
Cost of ownership
“We’ve advanced a major step
forward for our business users by
leveraging Pentaho…With professional
support and a comprehensive BI
offering from Pentaho, we’ve
significantly upgraded our functional
capabilities for a fraction of the cost
of proprietary alternatives..”
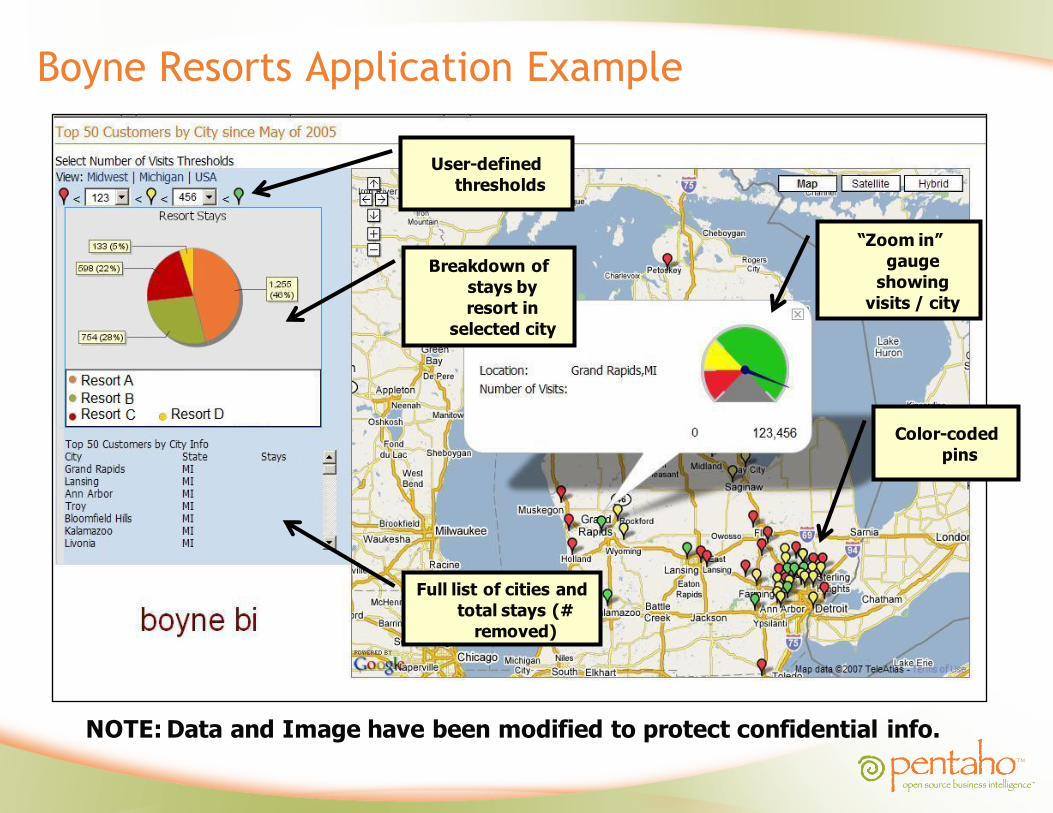
Boyne Resorts Application Example
NOTE: Data and Image have been modified to protect confidential info.
Color-coded
pins
User-defined
thresholds
Breakdown of
stays by
resort in
selected city
Full list of cities and
total stays (#
removed)
“Zoom in”
gauge
showing
visits / city

Pentaho Data Mining
Rich analytical capability
49 data preprocessing models
76 classification/regression
algorithms
8 clustering algorithms
15 attribute/subset evaluators +
10 search algorithms for feature
selection
Graphical interfaces
Exploratory data analysis
Experiment execution
Process / flow modeling

Pentaho Data Integration
Rich Feature Set
Enterprise-class performance and
scalability
Broad Database Support
100% Meta-data Driven
Graphical, model-driven design
Mature, 4th generation product

Pentaho Data Integration at ZipRealty (NASD: ZIPR)
National Real Estate Brokerage
Key Challenges
Measuring and optimizing agent performance,
customer satisfaction, and marketing ROI
Getting an integrated, strategic view across
multiple operational systems
Pentaho Solution
Pentaho Data Integration
Red Hat Enterprise Linux, MySQL database
Continued use of proprietary BI tools
(MicroStrategy)
Results
Three-fold performance increase, 8 hour
reduction in batch load times
Simplified maintenance and reduced costs
Why Pentaho
Functionality and flexibility
Professional support
“With professional support and
world-class ETL from Pentaho, we've
been able to simplify our IT
environment and lower our costs.
We were also surprised at how much
faster Pentaho Data Integration was
than our prior solution.”

50
Questions??

51
Contact Information
• If you have further questions or comments:
Rajeev Rawat, BI [email protected]
Lance Walter, [email protected]