open msu recommendation report - montana state university
TRANSCRIPT

N:\Ac_RecSub\Report\FinalReportFiles\OpenMSU_RecommendationReport_Final_Response.docx
Montana State University
OpenMSU Initiative Recommendation Phase Final Report
Anne Milkovich, Recommendation Subcommittee Chair Susan Alt, Recommendation Subcommittee Member
Laura Humberger, Recommendation Subcommittee Member Lynn Marlow, Recommendation Subcommittee Member Sandy Sward, Recommendation Subcommittee Member Daniel Adams, Recommendation Subcommittee Attaché
11/20/2012
This final report summarizes the deliverables of the Recommendation Phase Subcommittee: a model for intaking, evaluating, and prioritizing proposed solutions to identified problems; a portfolio of recommended solutions; and an ongoing model to sustain the process for continuous improvement.
OpenMSU Initiative | Anne Milkovich, Recommendation Subcommittee Chair | 11/20/2012 Page 1 of 99
N:\Ac_RecSub\Report\FinalReportFiles\OpenMSU_RecommendationReport_Final_Response.docx
Table of Contents OpenMSU Recommendation Phase Executive Summary ....................................................................................................... 3
Portfolio Dashboard ................................................................................................................................................................ 4
Explanation of Portfolio Dashboard Results ...................................................................................................................... 5
OpenMSU Roadmap: Building From the Ground Up .............................................................................................................. 6
1 Build the Foundation ...................................................................................................................................................... 6
2 Lay the Cornerstones..................................................................................................................................................... 6
3 Fix Process Pains .......................................................................................................................................................... 7
4 Add Finish Work ............................................................................................................................................................ 7
Cost Estimates .................................................................................................................................................................. 7
Estimated Timeline ........................................................................................................................................................... 8
OpenMSU Recommendation Phase Report Detail .................................................................................................................. 9
Introduction ....................................................................................................................................................................... 9
Methodology ........................................................................................................................................................................... 9
1. Review information ....................................................................................................................................................... 9
Categorized Pain Points ............................................................................................................................................ 10
2. Create a model ........................................................................................................................................................... 10
3. Propose solutions ....................................................................................................................................................... 11
Banner Payment Authorization Process Improvement (Original Proposed Solution) ................................................ 11
Creating a Culture of Customer Service (Original Proposed Solution) ...................................................................... 11
Eliminate Paper-based and Manual Processes (Original Proposed Solution) ........................................................... 11
HR Process Improvement: Electronic Personnel Action Form (Original Proposed Solution) .................................... 12
HR Process Improvement: Payroll (Original Proposed Solution) .............................................................................. 12
HR Process Improvement: Recruitment and Hiring (Original Proposed Solution) ..................................................... 12
Purchasing Process Improvement (Original Proposed Solution) .............................................................................. 13
Shared Services Model (Original Proposed Solution) ............................................................................................... 13
Service Provider Development (Original Proposed Solution) .................................................................................... 14
Service Provider Staffing and Turnover (Original Proposed Solution) ....................................................................... 14
Upper Administrator Evaluation (Open Forum Concept) ........................................................................................... 14
Financial Reporting Improvement (Open Forum Concept) ........................................................................................ 15
Front End Accounting System (Open Forum Concept) ............................................................................................. 15
4. Solicit feedback and communicate progress ............................................................................................................... 15
Open Forum Voting ................................................................................................................................................... 15
Communicating Progress .......................................................................................................................................... 17
Portfolio of Recommendations.............................................................................................................................................. 18
Portfolio Dashboard ........................................................................................................................................................ 18
OpenMSU Roadmap: Building From the Ground Up ............................................................................................................ 19
1 Build the Foundation .................................................................................................................................................... 19
2 Lay the Cornerstones................................................................................................................................................... 19
3 Fix Process Pains ........................................................................................................................................................ 20
4 Add Finish Work .......................................................................................................................................................... 20
Cost Estimates ................................................................................................................................................................ 20
Estimated Timeline ......................................................................................................................................................... 21

OpenMSU Initiative | Anne Milkovich, Recommendation Subcommittee Chair | 11/20/2012 Page 2 of 99
N:\Ac_RecSub\Report\FinalReportFiles\OpenMSU_RecommendationReport_Final_Response.docx
Appendices ............................................................................................................................................................................... 22
Appendix A: Bibliography of Portfolio Management Sources ............................................................................................... 23
Appendix B: Committee Members ........................................................................................................................................ 24
Recommendations Subcommittee .................................................................................................................................. 24
Evaluation Team ............................................................................................................................................................. 24
Information Gathering Team ........................................................................................................................................... 24
Information Gathering Subject Matter Experts ................................................................................................................ 24
Appendix C: Portfolio Management Model ........................................................................................................................... 26
Portfolio Management Process ................................................................................................................................. 26
Portfolio Management Tools ..................................................................................................................................... 26
Portfolio Management Teams ................................................................................................................................... 27
Portfolio Management Techniques ............................................................................................................................ 28
Appendix D: Post Phase Evaluation ..................................................................................................................................... 29
New leadership ......................................................................................................................................................... 29
Cost-Benefit Analysis ................................................................................................................................................ 29
Evaluation Techniques .............................................................................................................................................. 29
Recommendation Phase Lessons Learned .................................................................................................................... 30
Lessons to Repeat .................................................................................................................................................... 30
Lessons to Improve ................................................................................................................................................... 30
Appendix E: Business Case Template ................................................................................................................................. 33
Appendix F: Cost-Benefit Analysis Template ....................................................................................................................... 34
Appendix G: Evaluation Rubric ............................................................................................................................................. 38
Appendix H: Proposed Solution Detail .................................................................................................................................. 39
BPA................................................................................................................................................................................. 39
Customer Service ........................................................................................................................................................... 44
Eliminate Paper .............................................................................................................................................................. 49
HR-EPAFs ...................................................................................................................................................................... 56
HR-Payroll ...................................................................................................................................................................... 61
HR-Recruitment and Hiring ............................................................................................................................................. 66
Purchasing ...................................................................................................................................................................... 71
Shared Services Model ................................................................................................................................................... 77
Service Provider Development ....................................................................................................................................... 83
Service Provider Staffing and Turnover .......................................................................................................................... 85
Administrator Evaluations (Open Forum Concept) ......................................................................................................... 87
Financial Reporting Improvement (Open Forum Concept) ............................................................................................. 88
Front-End Accounting System (Open Forum Concept)................................................................................................... 89
Appendix I: Open Forum Feedback on Proposed Solutions ................................................................................................. 90
Proposed Solution Votes Tally ........................................................................................................................................ 90
Proposed Solution Votes Graph ..................................................................................................................................... 91
Appendix J: Open Forum Comments ................................................................................................................................... 92
Appendix K: Feedback Submitted through Website ............................................................................................................. 95
Appendix L: Open Forum Participation Photos ..................................................................................................................... 97
Appendix M: OpenMSU Roadmap Poster ............................................................................................................................ 98

OpenMSU Initiative | Anne Milkovich, Recommendation Subcommittee Chair | 11/20/2012 Page 3 of 99
N:\Ac_RecSub\Report\FinalReportFiles\OpenMSU_RecommendationReport_Final_Response.docx
OpenMSU Recommendation Phase Executive Summary
The Recommendation Phase of the OpenMSU initiative began on July 2, 2102 and concluded November 9. The
purpose of this phase was to:
Identify the problems discovered through information gathering activities
Apply subject matter expertise to ascertain solutions
Solicit input into problems and potential solutions
Evaluate and prioritize proposed solutions
Recommend solutions
The deliverables for this phase of the initiative were met by the Recommendation Subcommittee within the
allotted timeframe approved by the Steering Committee and Executive Sponsors:
A model for intaking, evaluating, and prioritizing solutions for the current phase and ongoing
A model for intaking, evaluating, and prioritizing solutions was adopted based on industry-recognized
portfolio management standards and refined for use at MSU, presented in Appendix C.
Recommendations for proposed solutions
Ten proposed solutions were initiated, developed, evaluated, voted on at an Open Forum and prioritized.
They are presented on the following page in the Portfolio Dashboard and detailed in the body of the
report. Additional solutions were also generated at the Open Forum and taken into consideration.
The Recommendation Subcommittee reviewed a range of information sources:
Service Provider and Service Customer surveys
Focus groups
Proposed solution summaries
Proposed solution detailed narratives and cost-benefit analyses
Website feedback
Open Forum feedback
Evaluation team scoring of proposed solutions (provided in the portfolio dashboard on the following page)
The Recommendation Subcommittee presented its findings to the OpenMSU Steering Committee, who developed
the recommendations that are summarized in the OpenMSU Roadmap included in the Executive Summary and
Conclusion sections of this report.
Note Regarding Recommendations and the Portfolio Dashboard The independent evaluation team rated the
proposed solutions, which generated the portfolio dashboard provided to the steering committee and included in
the report. The steering committee used that information as one of several inputs in determining their
recommendations. The most cost-effective solution is not automatically the best path to long-term success. Long-
term success for OpenMSU requires foundational solutions that in themselves are not necessarily cost-effective
but are necessary investments to a successful path, on which the rest of the solutions depend. Hence they were
recommended as the first steps in the roadmap in spite of seemingly lower cost-effectiveness in and of
themselves.

OpenMSU Initiative | Anne Milkovich, Recommendation Subcommittee Chair | 11/20/2012 Page 4 of 99
N:\Ac_RecSub\Report\FinalReportFiles\OpenMSU_RecommendationReport_Final_Response.docx
Portfolio Dashboard
The Evaluation Team evaluated and scored all proposed solutions with the results illustrated below. All proposed
solutions were evaluated predicated leadership commitment and fully resourcing the project. Without commitment
or adequate resources and funding, probability of success changes dramatically, changing evaluation results.
PROPOSAL ID ALIGNMENT
BIGGEST
BANG
PROBABILITY
OF SUCCESS
HORIZONTAL
PROBLEM
PROCESS /
SERVICE RECOMMENDATION
Upper Admin. Evaluation UAE 0% 0% 0% Other Employee Relations Return to Discovery
BPA Process Improvement BPA 50% 80% 75% Multiple Multiple Evaluate Further
Customer Service CS 0% 0% 0% Multiple Majority Return to Discovery
Elim Paper EDM 80% 90% 85% Majority Majority Implement
Finance Reporting FR 0% 0% 0% Redundancy Majority Return to Discovery
Front End Accounting FEA 65% 0% 0% Other Multiple Return to Discovery
HRPI: EPAF HRE 60% 75% 80% Multiple EPAF/payroll Implement
HRPI: Payroll HRP 65% 70% 70% Multiple EPAF/payroll Implement
HRPI: Recruiting/Hiring HRR 65% 75% 55% Multiple HR Recruiting Evaluate Further
Purchasing PUR 35% 70% 55% Multiple Purchasing Monitor
Shared Services Model SSM 100% 10% 10% Majority Majority Evaluate Further
SP Development SPD 80% 80% 70% Multiple Majority Implement
SP Staffing/Turnover SPS 100% 100% 5% Majority Majority Evaluate Further
BPA
EDM
HREHRPHRR
PUR
SPD
SPS SSM
ALI
GN
MEN
T
PROBABILITY OF SUCCESS Bubble size = Bang for the Buck
ImplementEvaluate Further
Monitor Evaluate Further
The Evaluation Team reviewed the dashboard’s graphical illustration of the scoring results and concluded:
Many proposed solutions have similar cost-effectiveness (bang for the buck) results, which includes time and effort savings. That is valid; these are solutions widely expected to improve efficiencies.
Most proposed solutions are clustered in the Implement quadrant, having high alignment and probability of success. That is valid; these solutions were generated from institutional knowledge and expertise.
Those that had low alignment typically had narrow impact on a relatively low number of people.
Those that had low probability of success do need to be evaluated further.
The Evaluation Team affirmed the portfolio dashboard as a valid illustration of their intent. Explanations of the
results are provided on the following page.

OpenMSU Initiative | Anne Milkovich, Recommendation Subcommittee Chair | 11/20/2012 Page 5 of 99
N:\Ac_RecSub\Report\FinalReportFiles\OpenMSU_RecommendationReport_Final_Response.docx
Explanation of Portfolio Dashboard Results
1. Implement
a. Eliminate paper (Electronic Document Management and Workflow [EDMW])
b. HR Process Improvement: EPAFs. This proposed solution is contingent on prior implementation
of EDMW.
c. HR Process Improvement: Payroll. This proposed solution is contingent on the project team
determining whether outside resources are needed, utilizing internal resources as much as
possible and external consultants as a last resort.
d. Service Provider Development. This proposed solution is contingent on collaboration between
the project/advisory team and the training organization in HR. Assuming full commitment of HR,
probability of success is high.
2. Evaluate Further
a. BPA Process Improvement. This proposed solution is dependent on a functional interface to
Banner as well as EDMW. The functional interface to Banner could be a front-end accounting
system or other interface improvement.
b. HR Process Improvement: Recruiting. This proposed solution did not have sufficient probability of
success to implement without further evaluation. Implementation would be dependent on a
project team determining the need for external assistance and on central/distributed collaboration.
Probability of software improving the process is undetermined.
c. Shared Services model. This proposed solution is fundamental to other solutions just as EDMW
is. It will only work if carefully and correctly designed and planned. A project team must be
assigned to investigate and design this program carefully and thoroughly and report frequently to
OpenMSU program management. This model needs to be adapted to different unit needs and
ensure the balance of embedded customer service and central expertise.
d. Service Provider Staffing/Turnover. Success of this proposed solution is dependent on
OCHE/BOR approval of salary adjustments, beyond the control of a project team. Probability of
success is too low to proceed.
3. Return to Discovery (need more information)
a. Upper Administration Evaluation. Needs clarification of scope and intent. Prioritize at the next
gate.
b. Customer Service. This proposed solution is a key idea, a set of foundational practices
fundamental to OpenMSU. Could be implemented in conjunction with EDMW as a
transformational change. Needs to be treated as a program and move into Discovery for
additional information and development. Prioritize at the next gate.
c. Finance Reporting. Needs further development to determine scope, alternatives, and costs.
Prioritize at the next gate.
d. Front-end Accounting. Needs further development to determine scope, alternatives, and costs.
Prioritize at the next gate.
4. Monitor
a. Purchasing. Alignment of this proposed solution is low because a relatively small number of
people deal directly with purchasing frustrations; it is a narrow solution. Probability of success is
low because much of the frustration is related to state laws which process improvements will not
address.

OpenMSU Initiative | Anne Milkovich, Recommendation Subcommittee Chair | 11/20/2012 Page 6 of 99
N:\Ac_RecSub\Report\FinalReportFiles\OpenMSU_RecommendationReport_Final_Response.docx
OpenMSU Roadmap: Building From the Ground Up
Shared Services Model Electronic Doc Mgt Workflow Customer Service Culture
HR Recruitment/
Hiring
Front End to
Banner
Service Provider
Development
HR EPAF
Process
Banner Payment
Authorization
& Purchasing
1
2
3
4
HR Payroll
Process
1 Build the Foundation
The root causes of the frustration and inefficiency must be solved before the symptoms can be cured. Shared
Services, Electronic Document Management and Workflow, and a Customer Service Culture solve the root
causes. They are broad-scale, critical to long-term success, and challenging to implement.
Critical Success Factor: Qualified, high-performing project teams reporting frequently to program management.
1. Create a project team for each foundational piece consisting of well-qualified, high-performing individuals
who work well together to carefully investigate, design, and vet the solution.
2. Assign a part-time, experienced project manager to lead each team, reporting to program management.
3. Establish a full-time, experienced program manager to oversee and guide the teams, ensure the
foundational pieces all work together, report to executive sponsors, communicate with stakeholders.
2 Lay the Cornerstones
Solutions to process frustrations and inefficiencies are dependent on the foundation and certain cornerstones.
Until those pieces are in place the processes can’t get fixed. The cornerstones can begin in parallel with
foundational work.
HR-Recruitment/Hiring includes classification of positions. This is the most commonly expressed pain point in
focus groups that absorbs a lot of HR time, and is facing an increase of volume in the central office. Anticipated
software purchase will automate tasks but not address root-cause practices. Problems here can be addressed in
parallel with foundational pieces for quick demonstrated wins.
Critical Success Factors: Qualified guidance and collaboration between central and distributed HR, Accounting,
Training functions.
4. Create a project team for each cornerstone consisting of well-qualified contributors from central and
distributed contributors in HR, Accounting, and contributors who can speak to training needs and
solutions.
5. Assign a project lead for each cornerstone, reporting to program management oversight.
6. Charge the team with evaluating needs and designing solutions, utilizing expert resources as needed.

OpenMSU Initiative | Anne Milkovich, Recommendation Subcommittee Chair | 11/20/2012 Page 7 of 99
N:\Ac_RecSub\Report\FinalReportFiles\OpenMSU_RecommendationReport_Final_Response.docx
3 Fix Process Pains
HR-Payroll and HR-EPAFs were specific processes noted as frustrating and inefficient that were prioritized in the
Implement quadrant. These are dependent on, and will change based on, the foundation pieces being in place
and to some extent the cornerstone pieces.
Critical Success Factors: Shared services, electronic document management and workflow, and a culture of
customer service, training, and front-end to Banner must be in place. The recruitment/hiring time-sink must be
reduced for capacity to invest in these processes.
7. Communicate to service providers and service customers that these processes are dependent on the
foundation and cornerstones.
8. Continually report progress on foundation and cornerstones to assure constituents that progress is being
made and these processes will be addressed.
4 Add Finish Work
Banner Payment Authorization and Purchasing processes were evaluated as lower in alignment because they are
narrow in scope, affecting relatively few service providers and customers. Purchasing has low probability of
success in addressing frustrations because much of the process is driven by law. Both processes are dependent
on Electronic Document Management and Workflow and a Front End to Banner; both will change based on
Shared Services Model; both are related to Service Provider Development. Both are less widely felt than HR-
Payroll, HR-EPAF, and HR-Recruitment/Hiring.
Critical Success Factors: Foundation and cornerstone pieces must be in place.
9. Include purchasing and BPA contributors in the foundation and cornerstone project teams.
10. Call a Summit of primary purchasing players to collaborate on a purchasing organization based on
foundation and cornerstones to identify and implement early wins and build future wins.
Cost Estimates
The following preliminary cost estimates are Rough Order of Magnitude (ROM) estimates, typically +/-
50%, with a confidence rating below 50%. To achieve a 90% confidence rating the ROM range should be
extended to +/- 150%. Cost estimate details are available in Appendix H.
PROJECT UPFRONT REAL
COST
UPFRONT T&E
COST
ONGOING REAL
COST
ONGOING T&E
COST
Shared Services Model 95,000 -- 110,000 --
Electronic DocMgt Wrkflow 309,000 15,300 -- 239,000
Customer Service Culture 39,300 24,700 -- 8,800
HR Recruitment/Hiring 7,200 8,600 -- --
Front End to Banner Undetermined, proposed solution still in concept stage.
Service Provdr Developmnt -- -- -- --
HR Payroll 14,400 17,300 -- --
HR EPAF -- 20,700 -- --
Banner Payment Authorztn -- 20,700 -- --
Purchasing -- Minimal -- --

OpenMSU Initiative | Anne Milkovich, Recommendation Subcommittee Chair | 11/20/2012 Page 8 of 99
N:\Ac_RecSub\Report\FinalReportFiles\OpenMSU_RecommendationReport_Final_Response.docx
Estimated Timeline
1/1/2014
Electronic Doc Mgt Workflow
Planning and Design Pilot Implementation Implementations 2 through n….
Shared Services Model
Planning and Design Pilot Implementation Implementations 2 through n….
Customer Service CulturePlanning and Design Implementation Evaluation Transition to Operations
HR Recruitment/Hiring
Planning and Design Implementation Evaluation Transition to Operations
Front End to Banner
Planning and Design Pilot Implementation Implementations 2 through n….Discovery Approval
Service Provider Development
Planning and Design Implementation Evaluation Transition to Operations
HR Payroll Process
Planning and Design Implementation Evaluation Transition to Operations
HR EPAF Process
Planning and Design Implementation Evaluation Transition to Operations
Banner Payment Authorization and Purchasing
Planning and Design ImplementationThis timeline represents gross estimates of time prior to planning and design, which will inform the actual schedule.
Timeline assumes reasonable and adequate resources are allocated. Lack of resources will lengthen timeline.
1/1/2013 12/31/2014

OpenMSU Initiative | Anne Milkovich, Recommendation Subcommittee Chair | 11/20/2012 Page 9 of 99
N:\Ac_RecSub\Report\FinalReportFiles\OpenMSU_RecommendationReport_Final_Response.docx
OpenMSU Recommendation Phase Report Detail
The mission of the OpenMSU Initiative is to empower staff and faculty to optimize mission support success
through long-term, sustainable changes based on thorough data collection and campus input. It can be summed
up as a long-term effort to improve work efficiency and job satisfaction. Specific goals are to:
Enrich Service Providers
Satisfy Service Customers
Increase Efficiency
Improve Effectiveness
Introduction
The Recommendation Phase of the OpenMSU initiative began on July 2, 2102 and concluded November 9. The
purpose of this phase was to:
Identify the problems discovered through information gathering activities
Apply subject matter expertise to ascertain solutions
Solicit input into problems and potential solutions
Evaluate and prioritize proposed solutions
Recommend solutions
The Recommendations Subcommittee (see Appendix A) was charged with designing and executing the phase in
a constituent-inclusive manner.
The deliverables for this phase are provided within this report:
DELIVERABLE REPORT SECTION
Model for intaking, evaluating, and prioritizing solutions for the current
phase and ongoing
Methodology
Recommendations for solutions to design Portfolio of Recommendations
Methodology
The Recommendation Subcommittee was charged with the following expectations:
1. Review surveys and other sources of information to determine sources of inefficiency and frustration.
2. Create a model for evaluating solutions according to prioritization criteria.
3. Propose solutions as Subject Matter Experts (SMEs) and in conjunction with other SMEs.
4. Solicit feedback, communicate and publish process and progress for transparency.
Each charge was executed as described in the following sections.
1. Review information
The subcommittee began by reviewing the Service Provider and Service Customer survey results to identify the
greatest pain points expressed by both the staff providing services and the staff consuming services. The pain
points were categorized as being Horizontal, Vertical, or Process related, defined as:

OpenMSU Initiative | Anne Milkovich, Recommendation Subcommittee Chair | 11/20/2012 Page 10 of 99
N:\Ac_RecSub\Report\FinalReportFiles\OpenMSU_RecommendationReport_Final_Response.docx
Horizontal: The most notable issues that cut across the organization, manifesting in multiple locations and processes.
Vertical: The functional areas of the organization where improvements would be felt most notably.
Process: The processes of the organization that most notably encounter the issues as work flows through the organization.
Categorized Pain Points
HORIZONTAL VERTICAL PROCESS
Paper-based processes, redundancy/duplication, lack of integration, manual processing, overall processes
Overwhelmed staff miss details
Lack of customer service and individualized attention
Lack of communication, coordination, training
Central-distributed model
Funding and prioritization
Compensation
Lack of IT resources, governance and vision
Human Resources
Finance
Purchasing
Information Technology
Recruitment
Payroll
Banner payment
Purchasing
2. Create a model
The Recommendation Subcommittee designed a model for evaluating and prioritizing proposed solutions,
leveraging the model created for the MSU Integration Initiative, which was adopted from industry-recognized
portfolio management standards. The industry portfolio management model consists of process, tools, teams, and
techniques and is presented in Appendix C.
For purposes of OpenMSU, the Recommendation Subcommittee:
1. Reviewed the problems identified in the surveys and focus groups.
2. Applied institutional knowledge and professional expertise to propose solutions.
3. Summarized proposed solutions as a business case with cost-benefit-risk-alignment information.
4. Assigned an independent team to evaluate proposed solutions against a defined rubric.
5. Plotted the proposed solutions in a dashboard of recommendation quadrants.
The prioritization criteria consisted of a cost-benefit-risk criteria using more user-friendly terminology for
common consumption:
Alignment (including benefit to institution and constituents as well as alignment to overarching objectives of improved work efficiency and job satisfaction)
Probability of success (expressing risk mitigation in positive terms)
Biggest bang for the buck (expressing cost-effectiveness more intuitively)
Detailed business cases with cost-benefit (ROI) analysis where warranted for each proposed solution are
provided in Appendix H.
The evaluation rubric is provided in Appendix G.

OpenMSU Initiative | Anne Milkovich, Recommendation Subcommittee Chair | 11/20/2012 Page 11 of 99
N:\Ac_RecSub\Report\FinalReportFiles\OpenMSU_RecommendationReport_Final_Response.docx
3. Propose solutions
After reviewing the Service Provider and Service Customer surveys and ranking the pain points, the
Recommendation Subcommittee proposed solutions to the identified problems as well as collected proposed
solutions from other Subject Matter Experts and constituents through direct solicitation, web-solicited feedback,
and an Open Forum.
Ten proposed solutions were developed and prioritized, listed below. See Appendix H for detailed information on
original proposed solutions including the business case, supplemental narrative, and cost-benefit analysis where
applicable.
Three additional solutions were proposed through the Open Forum and do not yet have detailed business cases.
Banner Payment Authorization Process Improvement (Original Proposed Solution)
Problem Statement: The BPA process had the second most survey comments for an activity that took
significantly longer than it should at MSU, and it was tied for the most comments as the process most critical to
change and/or streamline. The current BPA process involves duplicate entry of data and physical movement of
forms. About 36,750 BPA forms were processed in FY2011, which is a high volume of transactions at MSU.
The current BPA process involves duplicate entry of data and physical movement of forms as discussed in the following:
Data is entered onto BPA forms by departmental staff (often using programs such as Microsoft Access or other software such as the Facilities project accounting software)
BPA forms are then printed out and manually delivered to UBS
UBS then enters this data into the Banner system
Proposed Solution: Redesign the BPA process through the use of electronic document management & workflow
technology, including elimination of unnecessary paper and manual processes. This solution is dependent on
implementation of the Document Management and Workflow solution (EDMW).
Possible Alternatives:
Redesign the BPA process without automating it.
Implement shared services to provide BPA support to multiple units.
Hire an external consultant to evaluate the process and develop potential improvements.
Creating a Culture of Customer Service (Original Proposed Solution)
Problem Statement: According to the OpenMSU surveys there is significant campus demand for improved
customer service from administrative and technical functions at MSU.
Proposed Solution: Implement a culture of customer service throughout administrative support functions. Assign
a cross-functional project team to attend the Disney Institute’s program on quality service to “develop an
organizational culture that supports consistent delivery of quality service” and bring those strategies to MSU.
Possible Alternatives:
Use an alternative customer service training program. This alternative received a high number of votes at the Open Forum.
Implement a customer service culture without a training program.
Eliminate Paper-based and Manual Processes (Original Proposed Solution)
Problem Statement: Paper-based processes are inherently less efficient than automated processes, can
negatively impact customer service and generate costs associated with creating, storing and retrieving paper

OpenMSU Initiative | Anne Milkovich, Recommendation Subcommittee Chair | 11/20/2012 Page 12 of 99
N:\Ac_RecSub\Report\FinalReportFiles\OpenMSU_RecommendationReport_Final_Response.docx
documents. Paper-based processes negatively affect customer service due to the time lag associated with
processing them. Paper-based processes require workgroup proximity to physical files, impacting organizational
space requirements and impeding the university’s ability to focus the campus core on student-centric services.
Paper-based processes also impede four-campus integration as records cannot be easily shared across
campuses.
Proposed Solution: Assign a project team to assess, design, and implement Electronic Document Management
and Workflow (EDMW) functionality to replace many of the current paper-based approvals and notifications
currently performed manually by staff. Electronic document management allows documents to be filed and
processed as an electronic image. Workflow is a tool for automating and simplifying administrative processes.
HR Process Improvement: Electronic Personnel Action Form (Original Proposed Solution)
Problem Statement: According to the OpenMSU surveys, there is significant campus demand for improved HR
processes, ranking fourth in survey comments as the process most critical to improve. Responsibility for
conducting this process has been shifted from central to distributed service providers in recent years. According
to distributed service providers involved in OpenMSU focus groups, this shifting of duties appears to have led to
process inefficiencies.
Proposed Solution: Assign a qualified project team of relevant stakeholders, including central and distributed
service providers, to analyze the EPAF process. The project should include analysis of staffing and distribution of
labor and duties involved, potentially changing personnel responsibilities as needed, and should incorporate
workflow technology to address process issues.
Possible Alternatives:
Conduct an EPAF organizational improvement project without automating it through the use of workflow technology.
Include EPAF processing in a shared services center pilot to provide EPAF support to multiple units. This alternative received a high number of votes at the Open Forum.
HR Process Improvement: Payroll (Original Proposed Solution)
Problem Statement: According to the OpenMSU surveys, there is significant campus demand for improved
payroll processes.
Proposed Solution: Assign a project team of stakeholders, including central and distributed service providers, to
work with an external consultant to analyze and improve payroll processes. An external consultant is
recommended because HR processes are complex and we do not have the staff capacity or expertise to
adequately redesign HR processes.
Possible Alternatives:
Conduct a payroll process improvement project without the assistance of an external consultant. This alternative received a high number of votes at the Open Forum.
HR Process Improvement: Recruitment and Hiring (Original Proposed Solution)
Problem Statement: According to the OpenMSU surveys, there is significant campus demand for improved
recruiting/hiring processes. Eight out of twelve units participating in OpenMSU focus groups commented on
recruiting/hiring processes as needing improvement.
Although purchase of applicant tracking software is underway, technology enhancements must be accompanied
by process improvements to be effective.

OpenMSU Initiative | Anne Milkovich, Recommendation Subcommittee Chair | 11/20/2012 Page 13 of 99
N:\Ac_RecSub\Report\FinalReportFiles\OpenMSU_RecommendationReport_Final_Response.docx
Proposed Solution: Assign a project team of stakeholders, including central and distributed service providers, to
work with an external consultant to analyze and improve recruiting and hiring processes from classification
through onboarding. An external consultant is recommended because HR processes are inherently complex and
because MSU does not currently have the staff capacity or expertise to adequately redesign HR processes.
Possible Alternatives:
Conduct a recruiting/hiring process improvement project without the assistance of an external consultant. This alternative received a high number of votes at the Open Forum.
Purchasing Process Improvement (Original Proposed Solution)
Problem Statement: The OpenMSU Service Provider Survey indicates dissatisfaction with purchases that flow
through the central office in three main areas:
Paper-based systems
Compliance-driven rather than value-add
Personnel and staffing issues, including differing interpretations of law, policy, procedure, and preference
Proposed Solution: Assign a cross-functional project team to assess and design new purchasing processes.
Hold a purchasing summit to collaborate on processes and organizational structure, including appropriate staffing
level. Implement electronic workflow to alleviate paper-based delays.
Possible Alternatives:
Incorporate purchasing functions into shared services model for improved efficiency, specialized expertise, communication and coordination.
Shared Services Model (Original Proposed Solution)
Problem Statement: Administration is highly decentralized, with units independently covering a range of
duplicate functions. Unit-embedded functional support provides customer-centric knowledge at a cost of
institutional inefficiencies and organizational risk. Disparate software systems burden limited IT resources with
duplication.
Functional services are fragmented across departments creating challenges with training, coordination, communication, equitable allocation and overwhelmed staff. Lack of backup staff degrades service during absences and turnover and compounds risk.
Distributed specialist expertise is under-utilized by central offices.
Generalist staff report satisfaction with task variety, customers report satisfaction with embedded support, and space is not available to centralize; however, better balance can be achieved between centralized versus decentralized design.
Proposed Solution: Assign a project team of distributed and central stakeholders to build a Distributed Shared
Services model based on best practices and lessons learned from other institutions: Create an administrative
shared services center in A&F to support interested smaller units, funded by seed money and unit contributions.
Build the center over time as attrition occurs and units opt in. Integrate distributed functional specialists with
central functional specialists by defining workflows, roles and responsibilities to leverage their expertise, better
load-balance across existing resources, and reduce the bottlenecks in central offices.
Possible Alternatives:
Implement a shared service center among multiple units without a reporting line to Administration and Finance. This alternative received a high number of votes at the Open Forum.
OpenMSU Initiative | Anne Milkovich, Recommendation Subcommittee Chair | 11/20/2012 Page 14 of 99
N:\Ac_RecSub\Report\FinalReportFiles\OpenMSU_RecommendationReport_Final_Response.docx
Service Provider Development (Original Proposed Solution)
Problem Statement: MSU does not have a means to ensure that service providers are getting the training they
need, to track that training has been received, to assess that the right training is being provided or to ensure it is
of adequate quality.
Although some departments provide training on functional responsibilities for distributed service providers, much
of it is only provided a few times of year, and some functions provide none.
There are few training and professional development programs available to support a high-performance culture,
such as training in performance management and in using metrics to manage unit performance.
Proposed Solution: Implement a Professional Development and Training organization as part of the HR Office
as proposed by the Chief Human Resources Officer. Assign a project team to assist in the development of this
organization as it would apply to service providers for OpenMSU functions: finance & accounting, HR, IT,
purchasing, sponsored programs administration and Web development and content management.
Possible Alternatives:
Establish an administrative council of central and distributed staff to guide operations such as training, staffing, standardized processes.
Service Provider Staffing and Turnover (Original Proposed Solution)
Problem Statement: According to CUPA and O*net benchmarks, MSU staff are significantly underpaid. Certain
central functions, such as the HR Office, University Business Services and the Information Technology Center as
well as distributed administrative functions, experience high rates of turnover because of issues such as low pay
and heavy workloads.
High turnover costs the institution time and effort in training new hires and adversely affects customer satisfaction
and efficiency.
Proposed Solution: Assign a project team of qualified staff working with external consultants as needed to
develop a long-range staffing plan for functional areas across the university, including a classification and
compensation review with researched salary information to verify or establish new norms for salary basis
consistent with the goals of the MSU strategic plan.
Possible Alternatives:
Establish an administrative council of central and distributed staff to guide operations such as training, staffing, standardized processes. This alternative received a high number of votes at the Open Forum.
Shared services model may reduce workload and better load balance across available resources.
Upper Administrator Evaluation (Open Forum Concept)
Problem Statement: Faculty are regularly evaluated by their students. This allows faculty to identify improvement
opportunities and adjust their teaching style accordingly. Upper level administrators are only evaluated by their
supervisors, not those they supervise. Therefore, they do not have the opportunity to adjust their administrative
approach.
Proposed Solution: A project team will regularly provide anonymous surveys of upper level administration to the
employees that work directly below them. This is especially important during an administrator's first year in a new
position. The evaluators will be encouraged to only provide positive feedback.
Possible Alternatives:
Allow employees to provide feedback to upper level administration at annual open discussions conducted by each individual unit.

OpenMSU Initiative | Anne Milkovich, Recommendation Subcommittee Chair | 11/20/2012 Page 15 of 99
N:\Ac_RecSub\Report\FinalReportFiles\OpenMSU_RecommendationReport_Final_Response.docx
Financial Reporting Improvement (Open Forum Concept)
Problem Statement: The current report web, SAIS, is outdated. SAIS is also not user-friendly, which makes it
difficult for employees to perform their daily work.
Proposed Solution: Assign a project team to select and implement a web-based ad-hoc reporting tool to replace
SAIS. The team should work directly with those who use SAIS to determine the best replacement tool and to
accommodate individual unit needs.
Possible Alternatives:
Hire an external consultant to evaluate the current report web and develop potential improvements.
Front End Accounting System (Open Forum Concept)
Problem Statement: CatBooks is currently the front end accounting system that almost all departments use to
create BPAs and reconcile their Banner accounts, not to mention provide reports to department heads, deans,
directors, and PIs. However, there are several departments who use alternative systems. MSU needs a standard
system that does all this and more.
Proposed Solution: Assign a project team to determine and implement a permanent front end accounting
system that meets the needs of departments.
Possible Alternatives:
Hire an external consultant to analyze the current accounting needs of departments and suggest a system to implement.
4. Solicit feedback and communicate progress
The Recommendation Subcommittee solicited feedback on original proposed solutions and also solicited new
proposed solutions through multiple channels:
In-person meetings with Subject Matter Experts
An Open Forum interactive poster session (see Appendix J for Open Forum comments and Appendix L for participation photos)
Web site feedback (see Appendix K)
Open Forum Voting
Over 65 people participated in the Open Forum, casting votes for proposed solutions, commenting on proposed
solutions, and submitting new solutions. The table below shows the tally of votes for proposed solutions or their
alternative solutions.

OpenMSU Initiative | Anne Milkovich, Recommendation Subcommittee Chair | 11/20/2012 Page 16 of 99
N:\Ac_RecSub\Report\FinalReportFiles\OpenMSU_RecommendationReport_Final_Response.docx
Proposed Solutions and
Alternatives Detail # Votes
BPA BPA Process Improvement 48
Customer Service
Customer Service Improvement
Disney Institute 53
Customer Service Alternative 1
Customer Service Different
Customer Training Program 11
Customer Service Alternative 2
Customer Service No Customer
Training Program 4
Elim Paper
Eliminate Paper-based Processes
(Electronic Doc Mgt Workflow) 119
HR Process Improvement - EPAF Electronic Personnel Action Form 73
HRPI-EPAF Alternative 2 HRPI-EPAF With Shared Services 10
HR Process Improvement -
Payroll
Payroll Process Improvement
with External Consultant 32
HRPI-Payroll Alternative 1
HRPI-Payroll No External
Consultant 46
HR Process Improvement -
Recruitment Hire
Recruitment and Hiring Process
Improvement 27
HRPI-RecHire Alternative 1
HRPI-RecHire No External
Consultant 53
Purchasing Purchasing Process Improvement 39
Purchasing Alternative 1
Purchasing Process Improvement
With Shared Services 1
Shared Services Model
Shared Services Model with
reporting line to A&F 31
Shared Services Alternative 1
Shared Services Model without
reporting line to A&F 10
Service Provider Development
Central department responsible
for service provider development 51
SP Development Alternative 1
SP Development with
Administrative Council 2
Service Provider Staffing and
Turnover
Evaluate and solve staffing,
salary, and turnover issues 80
SP-Staffing Turnover Alternative 1
Solve staffing, salary, turnover
with Administrative Council 5
The same vote tally graphically illustrated appears below:
0
20
40
60
80
100
120
140
Nu
mb
er
of
Vo
tes
Proposal Votes by Solution
Alternative 2
Alternative 1
Proposed Solution

OpenMSU Initiative | Anne Milkovich, Recommendation Subcommittee Chair | 11/20/2012 Page 17 of 99
N:\Ac_RecSub\Report\FinalReportFiles\OpenMSU_RecommendationReport_Final_Response.docx
Communicating Progress
The subcommittee worked with the initiative communications team to provide information throughout the phase.
The most effective communication channels are in-person presentation at standing meetings. The first half of the
phase fell in the summer months when standing meetings were not available to engage. The subcommittee
prepared the website platform during the summer months and engaged constituents as soon as the Fall semester
was underway.
The website located at www.montana.edu/openmsu/recommendations published:
Sub-committee page providing contact information of committee members for constituents to communicate with in person
Subject Matter Experts page listing the SMEs for each functional area
Information Gathering page explaining how information was gathered and providing information gathering team contact information
Findings page summarizing the information and pain points gleaned from the service provider and service customer surveys
Progress page providing the approved timeline, deadlines, and monthly status reports
Proposals page listing and describing all the initial proposed solutions
Evaluation committee page providing contact information for the evaluation team
Prioritization model pages providing individual pages for:
Prioritization overview, explanation, and resources
Proposal template for constituents to suggest new proposals and understand how proposals are defined
The rubric by which proposed solutions are evaluated
An example of the portfolio model that charts prioritization of evaluated solutions
The list of guiding principles used to evaluate proposals
Communications page providing a means to request an in-person presentation and listing the in-person presentations conducted after Fall semester was underway:
Budget Council
Subject Matter Experts
HR Representatives
Faculty Senate
OSP Roundtable
President's Executive Council
Staff Senate
SuperUsers
University Council

OpenMSU Initiative | Anne Milkovich, Recommendation Subcommittee Chair | 11/20/2012 Page 18 of 99
N:\Ac_RecSub\Report\FinalReportFiles\OpenMSU_RecommendationReport_Final_Response.docx
Portfolio of Recommendations
As described in the Methodology section, a portfolio dashboard was created to summarize and chart the
evaluation results of the proposed solutions, presented below.
Portfolio Dashboard
PROPOSAL ID ALIGNMENT
BIGGEST
BANG
PROBABILITY
OF SUCCESS
HORIZONTAL
PROBLEM
PROCESS /
SERVICE RECOMMENDATION
Upper Admin. Evaluation UAE 0% 0% 0% Other Employee Relations Return to Discovery
BPA Process Improvement BPA 50% 80% 75% Multiple Multiple Evaluate Further
Customer Service CS 0% 0% 0% Multiple Majority Return to Discovery
Elim Paper EDM 80% 90% 85% Majority Majority Implement
Finance Reporting FR 0% 0% 0% Redundancy Majority Return to Discovery
Front End Accounting FEA 65% 0% 0% Other Multiple Return to Discovery
HRPI: EPAF HRE 60% 75% 80% Multiple EPAF/payroll Implement
HRPI: Payroll HRP 65% 70% 70% Multiple EPAF/payroll Implement
HRPI: Recruiting/Hiring HRR 65% 75% 55% Multiple HR Recruiting Evaluate Further
Purchasing PUR 35% 70% 55% Multiple Purchasing Monitor
Shared Services Model SSM 100% 10% 10% Majority Majority Evaluate Further
SP Development SPD 80% 80% 70% Multiple Majority Implement
SP Staffing/Turnover SPS 100% 100% 5% Majority Majority Evaluate Further
BPA
EDM
HREHRPHRR
PUR
SPD
SPS SSM
ALI
GN
MEN
T
PROBABILITY OF SUCCESS Bubble size = Bang for the Buck
ImplementEvaluate Further
Monitor Evaluate Further
OpenMSU Initiative | Anne Milkovich, Recommendation Subcommittee Chair | 11/20/2012 Page 19 of 99
N:\Ac_RecSub\Report\FinalReportFiles\OpenMSU_RecommendationReport_Final_Response.docx
OpenMSU Roadmap: Building From the Ground Up
Shared Services Model Electronic Doc Mgt Workflow Customer Service Culture
HR Recruitment/
Hiring
Front End to
Banner
Service Provider
Development
HR EPAF
Process
Banner Payment
Authorization
& Purchasing
1
2
3
4
HR Payroll
Process
1 Build the Foundation
The root causes of the frustration and inefficiency must be solved before the symptoms can be cured. Shared
Services, Electronic Document Management and Workflow, and a Customer Service Culture solve the root
causes. They are broad-scale, critical to long-term success, and challenging to implement.
Critical Success Factor: Qualified, high-performing project teams reporting frequently to program management.
1. Create a project team for each foundational piece consisting of well-qualified, high-performing individuals
who work well together to carefully investigate, design, and vet the solution.
2. Assign a part-time, experienced project manager to lead each team, reporting to program management.
3. Establish a full-time, experienced program manager to oversee and guide the teams, ensure the
foundational pieces all work together, report to executive sponsors, communicate with stakeholders.
2 Lay the Cornerstones
Solutions to process frustrations and inefficiencies are dependent on the foundation and certain cornerstones.
Until those pieces are in place the processes can’t get fixed. The cornerstones can begin in parallel with
foundational work.
HR-Recruitment/Hiring includes classification of positions. This is the most commonly expressed pain point in
focus groups that absorbs a lot of HR time, and is facing an increase of volume in the central office. Anticipated
software purchase will automate tasks but not address root-cause practices. Problems here can be addressed in
parallel with foundational pieces for quick demonstrated wins.
Critical Success Factors: Qualified guidance and collaboration between central and distributed HR, Accounting,
Training functions.
4. Create a project team for each cornerstone consisting of well-qualified contributors from central and
distributed contributors in HR, Accounting, and contributors who can speak to training needs and
solutions.
5. Assign a project lead for each cornerstone, reporting to program management oversight.
6. Charge the team with evaluating needs and designing solutions, utilizing expert resources as needed.

OpenMSU Initiative | Anne Milkovich, Recommendation Subcommittee Chair | 11/20/2012 Page 20 of 99
N:\Ac_RecSub\Report\FinalReportFiles\OpenMSU_RecommendationReport_Final_Response.docx
3 Fix Process Pains
HR-Payroll and HR-EPAFs were specific processes noted as frustrating and inefficient that were prioritized in the
Implement quadrant. These are dependent on, and will change based on, the foundation pieces being in place
and to some extent the cornerstone pieces.
Critical Success Factors: Shared services, electronic document management and workflow, and a culture of
customer service, training, and front-end to Banner must be in place. The recruitment/hiring time-sink must be
reduced for capacity to invest in these processes.
7. Communicate to service providers and service customers that these processes are dependent on the
foundation and cornerstones.
8. Continually report progress on foundation and cornerstones to assure constituents that progress is being
made and these processes will be addressed.
4 Add Finish Work
Banner Payment Authorization and Purchasing processes were evaluated as lower in alignment because they are
narrow in scope, affecting relatively few service providers and customers. Purchasing has low probability of
success in addressing frustrations because much of the process is driven by law. Both processes are dependent
on Electronic Document Management and Workflow and a Front End to Banner; both will change based on
Shared Services Model; both are related to Service Provider Development. Both are less widely felt than HR-
Payroll, HR-EPAF, and HR-Recruitment/Hiring.
Critical Success Factors: Foundation and cornerstone pieces must be in place.
9. Include purchasing and BPA contributors in the foundation and cornerstone project teams.
10. Call a Summit of primary purchasing players to collaborate on a purchasing organization based on
foundation and cornerstones to identify and implement early wins and build future wins.
Cost Estimates
The following preliminary cost estimates are Rough Order of Magnitude (ROM) estimates, typically +/-
50%, with a confidence rating below 50%. To achieve a 90% confidence rating the ROM range should be
extended to +/- 150%. Cost estimate details are available in Appendix H.
PROJECT UPFRONT REAL
COST
UPFRONT T&E
COST
ONGOING REAL
COST
ONGOING T&E
COST
Shared Services Model 95,000 -- 110,000 --
Electronic DocMgt Wrkflow 309,000 15,300 -- 239,000
Customer Service Culture 39,300 24,700 -- 8,800
HR Recruitment/Hiring 7,200 8,600 -- --
Front End to Banner Undetermined, proposed solution still in concept stage.
Service Provdr Developmnt -- -- -- --
HR Payroll 14,400 17,300 -- --
HR EPAF -- 20,700 -- --
Banner Payment Authorztn -- 20,700 -- --
Purchasing -- Minimal -- --

OpenMSU Initiative | Anne Milkovich, Recommendation Subcommittee Chair | 11/20/2012 Page 21 of 99
N:\Ac_RecSub\Report\FinalReportFiles\OpenMSU_RecommendationReport_Final_Response.docx
Estimated Timeline
1/1/2014
Electronic Doc Mgt Workflow
Planning and Design Pilot Implementation Implementations 2 through n….
Shared Services Model
Planning and Design Pilot Implementation Implementations 2 through n….
Customer Service CulturePlanning and Design Implementation Evaluation Transition to Operations
HR Recruitment/Hiring
Planning and Design Implementation Evaluation Transition to Operations
Front End to Banner
Planning and Design Pilot Implementation Implementations 2 through n….Discovery Approval
Service Provider Development
Planning and Design Implementation Evaluation Transition to Operations
HR Payroll Process
Planning and Design Implementation Evaluation Transition to Operations
HR EPAF Process
Planning and Design Implementation Evaluation Transition to Operations
Banner Payment Authorization and Purchasing
Planning and Design ImplementationThis timeline represents gross estimates of time prior to planning and design, which will inform the actual schedule.
Timeline assumes reasonable and adequate resources are allocated. Lack of resources will lengthen timeline.
1/1/2013 12/31/2014

OpenMSU Initiative | Anne Milkovich, Recommendation Subcommittee Chair | 11/20/2012 Page 22 of 99
N:\Ac_RecSub\Report\FinalReportFiles\OpenMSU_RecommendationReport_Final_Response.docx
Appendices

OpenMSU Initiative | Anne Milkovich, Recommendation Subcommittee Chair | 11/20/2012 Page 23 of 99
N:\Ac_RecSub\Report\FinalReportFiles\OpenMSU_RecommendationReport_Final_Response.docx
Appendix A: Bibliography of Portfolio Management Sources
Alberts, Randall, Georgia State University. “Managing the IT Project Portfolio: A Project Ranking Methodology.” Research Bulletin, Issue 3). Boulder, CO: EDUCAUSE Center for Applied Research, 2009, available from www.educause.edu/ecar.
Dickeson, Robert C. Prioritizing Academic Programs and Services: Reallocating Resources to Achieve Strategic Balance. John Wiley & Sons, Inc. San Francisco, CA. 2010.
Goldstein, Philip J. & Borreson Caruso, Judith. “Information Technology Funding in Higher Education”. (Roadmap, December 2004). Boulder, CO: EDUCAUSE Center for Applied Research, 2004, available from www.educause.edu/ecar.
IT Governance Institute. “Board Briefing on IT Governance” 2nd
Edition. 2003. Rolling Meadows, IL. Retrieved from www.isaca.org March 14, 2011.
IT Governance Institute. “Enterprise Value: Governance of IT Investments: The Business Case.” 2006. IT Governance Institute. Rolling Meadows, Illinois.
Kendall, Gerald I. & Rollins, Steven C. Advanced Project Portfolio Management and the PMO, Multiplying ROI at Warp Speed. J. Ross Publishing, Boca Raton, FL. 2003.
Krueger, Donald A. “Decentralized IT Governance and Policy in Higher Education” (Research Bulletin, Issue 5). Boulder, CO: EDUCAUSE Center for Applied Research, 2009, available from http://www.educasue.edu/ecar.
Maizlish, Bryan & Handler, Robert. IT Portfolio Management Step-by-Step: Unlocking the Business Value of Technology. John Wiley & Sons, Inc. Hoboken, New Jersey. 2005.
Mieritz, Lars et al. “Toolkit Best Practices: Program and Portfolio Management Maturity Model.” Gartner RAS Core Research Note G00141742. 13 July 2007. Stamford, CT.
Morris, Peter & Jamieson, Ashley. Translating Corporate Strategy into Project Strategy: Realizing Corporate Strategy through Project Management. Project Management Institute, Inc. Newtown Square, PA. 2004.
Morris, Peter W. G. & Pinto, Jeffrey K. The Wiley Guide to Project Program & Portfolio Management. John Wiley & Sons, Inc. Hoboken, NJ. 2007.
Pirani, Judith A. & Yanosky, Ronald. “Process and Politics: IT Governance in Higher Education”. (Roadmap, July 2008). Boulder, CO: EDUCAUSE Center for Applied Research, 2008, available from www.educasue.edu/ecar.
Project Management Institute. The Standard for Portfolio Management. Project Management Institute, Inc. Newtown Square, PA. 2006.
Project Management Institute. The Standard for Program Management Second Edition. Project Management Institute, Inc. Newtown Square, PA. 2008.
Rad, Parviz F. & Levin, Ginger. Project Portfolio Management Tools and Techniques. International Institute for Learning, Inc. New York, NY. 2006.
Sanghera, Paul. Fundamentals of Effective Program Management: A Process Approach Based on the Global Standard. J. Ross Publishing, Inc. Fort Lauderdale, Florida. 2008.
Spicer, Donald Z., & Pirani, Judith A. “Reforming IT Governance at Berkeley: Introducing an Enterprise Perspective to a Decentralized Organization” (Case Study 3). Boulder, CO: EDUCAUSE Center for Applied Research, 2008, available from http://www.educasue.edu/ecar.
Tjahjana, Lia, Dwyer, Paul, & Habib, Mohsin. The Program Management Office Advantage. AMACOM Books, a Division of American Management Association. New York, NY. 2009.
Treacy, Michael & Wiersema, Frederik D. Discipline of Market Leaders. Basic Books. Jackson, TN. 1997.
Voloudakis, John. “IT Organizations: Balancing Centralized Efficiencies with Localized Needs” (Research Bulletin 9, 2010). Boulder, CO: EDUCAUSE Center for Applied Research, 2010, available from http://www.educasue.edu/ecar.

OpenMSU Initiative | Anne Milkovich, Recommendation Subcommittee Chair | 11/20/2012 Page 24 of 99
N:\Ac_RecSub\Report\FinalReportFiles\OpenMSU_RecommendationReport_Final_Response.docx
Appendix B: Committee Members
Recommendations Subcommittee
The role of the Recommendations Subcommittee was to design and lead this phase of the initiative, functioning
as a program management team according to the portfolio management model.
Anne Milkovich, Chair Director of Business Administration, ITC
Susan Alt Employee Relations Officer
Laura Humberger Asst VP of Finance
Lynn Marlow Accounting Associate
Sandy Sward Director, Office of Sponsored Programs
Daniel Adams, Attaché Director, Institutional Audit & Advisory Services
Evaluation Team
The role of the Evaluation Team was to evaluate proposed solution statements. Members represented a range of
departments and positions across the university to provide breadth of experience and were individually selected
for their respected expertise and ability to contribute to the process meaningfully and objectively.
Tricia Cook Fiscal Director, Office of Sponsored Programs
David Court Finance Banner Team Lead
Adam Edelman Chief Security Officer
Carmen Fike Business Officer-BS, CRA
Ian Godwin Director, Administration & Finance
Becky McMillan Personnel Officer
Information Gathering Team
The role of the Information Gathering Team was to gather, analyze, and report information to ensure a data-
driven and valid process..
Daniel Adams Director, Institutional Audit and Advising Services
Ila Saunders Senior Auditor
Molly Martin Industrial Engineering Student
Information Gathering Subject Matter Experts
The role of the Information Gathering Team Subject Matter Experts was to provide detailed information about the
functional area they represented, to contribute new proposed solutions, and to give expert feedback on existing
proposed solutions.
Finance and Accounting
Dave Court, Finance Module Team Leader
Laura Humberger, Assistant Vice President for Financial Services
Lynn Marlow, Acct. Assoc. IV, College of Education, Health and Human Development
Kim Rehm, Asst. Director Finance & Administration, Extended University
Human Resources
Janell Barber, HR Officer, Human Resources | Affirmative Action
Kerry Evans, Personnel Officer, Facilities Services
Paul Lindsay, HR Module Team Leader
Sharon Stoneberger, HR Officer, Human Resources
Information Technology Rod Laakso, Supervisor, Help Desk and Computer Operations, IT Center
Pol Llovet, Associate Director of Cyberinfrastructure Research Computing Group

OpenMSU Initiative | Anne Milkovich, Recommendation Subcommittee Chair | 11/20/2012 Page 25 of 99
N:\Ac_RecSub\Report\FinalReportFiles\OpenMSU_RecommendationReport_Final_Response.docx
Matt Rognlie, IT Systems Coordinator, College of Agriculture/Montana AES
Purchasing Dave Court, Finance Module Team Leader
Mary Lou Wilson, Administrative Officer, Auxiliary Services
Sponsored Programs Administration
Jeralyn Brodowy, Assistant Director of Administration, Western Transportation Institute
Traci Miyakawa, Fiscal Manager, Office of Sponsored Programs
Web Development and Content Management
Jake Dolan, Director, MSU Web Communications
Levi Baker, Computer Software Engineer, Auxiliary Services

OpenMSU Initiative | Anne Milkovich, Recommendation Subcommittee Chair | 11/20/2012 Page 26 of 99
N:\Ac_RecSub\Report\FinalReportFiles\OpenMSU_RecommendationReport_Final_Response.docx
Appendix C: Portfolio Management Model
The portfolio management model consists of process, tools, teams, and techniques.
Portfolio Management Process
The portfolio management process has the following stages:
ConceptConcept
ClearanceDiscovery Prioritization Execute
Monitor for Future Opportunity
Monitor for Future Opportunity
Transition to Operations
Monitor and EvaluatePortfolio Intake
PlanPlan
Approval
1. The Concept stage generates and submits ideas as potential solutions to a business problem. If the
concept looks promising at face value, it is given clearance to go into Discovery.
2. The Discovery stage investigates the concept and summarizes a cost-benefit-risk assessment as a
business case. Discovery can involve considerable work and is not conducted unless the concept has
passed the Concept Clearance gate.
3. Business cases are evaluated and prioritized at the Prioritization gate. Approved cases move into
planning based on priority and resource availability, including program manager, project manager and
sponsor.
4. The Plan stage involves detailed design, project planning, and resource allocation.
5. When project plans pass the Plan Approval gate, they move into the project Execution stage.
6. Completed projects are transitioned into operations as standard procedure.
The Recommendation Phase of OpenMSU involved the first part of the process, referred to as portfolio intake.
The prioritization gate re-occurs regularly, meaning that portfolio contents (e.g. projects, programs, or initiatives)
are continually re-evaluated and can be re-prioritized at any time, resulting in projects being expedited, shelved or
abandoned as business needs change.
Typically in a portfolio management framework, a Program Management Office (PMO) supports and oversees
portfolio intake, facilitates prioritization, monitors execution to ensure intended benefits are realized and
institutional risk is managed, reports results and communicates with stakeholders.
Portfolio Management Tools
The tools to identify solutions consist of prioritization criteria, a cost-benefit analysis, an evaluation rubric, and a
portfolio dashboard.
The prioritization criteria consisted of cost-benefit-risk criteria using more user-friendly terminology for common
consumption:
Alignment (including benefit to institution and constituents as well as alignment to overarching objectives of improved work efficiency and job satisfaction)
Probability of success (expressing risk mitigation in positive terms)
Biggest bang for the buck (expressing cost-effectiveness more intuitively)
A business case template was created to summarize each proposed solution in a common format with sufficient
information to inform the decisions about alignment, probability of success, and biggest bang for the buck criteria
(see Appendix E).

OpenMSU Initiative | Anne Milkovich, Recommendation Subcommittee Chair | 11/20/2012 Page 27 of 99
N:\Ac_RecSub\Report\FinalReportFiles\OpenMSU_RecommendationReport_Final_Response.docx
A cost-benefit analysis template was used to provide a more detailed assessemnt return on investment. Prior to
detailed design and planning, costs can only be assessed on a Rough Order of Magnitude (ROM) basis of
typically +/- 50% (see Appendix F).
An evaluation rubric was developed to evaluate the business case of each proposed solution, rating the solution
on alignment, probability of success, and biggest bang for the buck (see Appendix G) using a standard set of
factors for each.
A portfolio dashboard was developed to provide a visual representation of the evaluation outcome. In this
dashboard the evaluated proposed solutions are displayed in a bubble chart where the X axis illustrates
probability of success, the Y axis illustrates alignment to goals, and the bubble size illustrates biggest bang for the
buck. A big bubble in the upper right quadrant indicates an obvious win, with high alignment, strong probability of
success, and big bang for the buck. Those can be expedited into planning as obvious wins; all other solutions
must be prioritized and recommended according to their placement on the chart.
Portfolio Management Teams
The teams used in this model consisted of a program management team, communications team, information
gathering team, evaluation team, and project teams.
Throughout the intake process, the Recommendations Subcommittee and Steering Committee chairs functioned
as a program management team. Their responsibility was to oversee the phase and ensure that intended
benefits were realized. They also functioned as the individual contributors and subject matter experts. In those
functions they:
Designed the phase and defined the deliverables
Managed the schedule
Evaluated information
Identified and ranked problems
Applied expert judgment to ideate solutions
Communicated with stakeholders and constituents
Solicited input into existing proposed solutions as well as ideas for new proposed solutions

OpenMSU Initiative | Anne Milkovich, Recommendation Subcommittee Chair | 11/20/2012 Page 28 of 99
N:\Ac_RecSub\Report\FinalReportFiles\OpenMSU_RecommendationReport_Final_Response.docx
Assigned an independent evaluation team to evaluate solutions
Reported to the primary stakeholders, the steering committee and chairs
A communications team was assigned by the Steering Committee to support the Recommendations
Subcommittee with constituent communication on a broad scale. The Recommendations Subcommittee
developed the content for the website and in-person meetings, and provided content to the communications team
for broad-scale messaging to constituents and detailed updates to the Steering Committee chairs for
communications with executive sponsors.
The information gathering team (see Appendix A) that was convened prior to the Recommendations Phase
continued to operate in this phase, conducting additional analyses, gathering information from focus groups, and
providing cost-benefit analysis.
The Recommendations Subcommittee assembled an independent evaluation team (see Appendix A) of
respected mission-support experts across the university to evaluate each business case using the predefined
rubric and arrive at a consensus scoring for each proposed solution. Because the Recommendations
Subcommittee was also acting as subject matter experts generating solutions to problems, an independent
evaluation team was important to ensure objectivity in the evaluation of proposed solutions.
The evaluation team:
Read through each proposed solution summary and supporting detail
Reviewed feedback from constituents participating in the Open Forum, including alternative and new proposals
Convened as a team to discuss all proposed solutions, contributing breadth and depth of expert knowledge
Arrived at a consensus scoring for each proposed solution
The Recommendations Subcommittee will also recommend project teams as part of the next OpenMSU phase
and ongoing model. Project teams consist of a qualified project manager, project sponsor, and individual
contributors. A program manager oversees multiple project teams to ensure progress, risk management, and
realization of intended benefits.
Portfolio Management Techniques
The techniques used in the model are woven throughout the process, tools, and team responsibilities,
summarized as:
Defined and documented process that can be explained to constituents for transparency
Portfolio intake that captures ideas and requests for solutions
Discovery that collects data on size and complexity of the solution for informed prioritization
Stage-gating, to check on progress before approving each subsequent stage, effectively managing risk
Cost-benefit-risk-alignment assessment
Rubric-based evaluation
Prioritization based on defined criteria
Portfolio dashboard
Program management
Communications planning
Data-driven solutions
Independent evaluation with consensus scoring
All of these techniques are elements of industry-standardized portfolio management that balances institutional
benefits and risk and that manages projects and programs to ensure realization of intended benefits.

OpenMSU Initiative | Anne Milkovich, Recommendation Subcommittee Chair | 11/20/2012 Page 29 of 99
N:\Ac_RecSub\Report\FinalReportFiles\OpenMSU_RecommendationReport_Final_Response.docx
Appendix D: Post Phase Evaluation
Throughout this phase, issues were encountered and resolved, including the impacts of new leadership at the
university and refinement of various techniques used in the model.
New leadership
In the months before and during the Recommendation Phase, new leaders took over the Human Resource
department and the Information Technology department, both of which were vertical areas identified through the
surveys. New leadership began addressing the problems noted. For example, the new CHRO re-organized the
HR department to include a central point of coordination and responsibility for training and professional
development, a noted pain point. The new CIO re-organized the IT department with new leadership, vision for the
future, and governance, all identified pain points. Proposed solutions had already been identified for these pain
points that the new leaders were busily implementing in parallel.
The Recommendations Subcommittee discussed how to handle this situation and decided to continue
recommending the proposed solutions although they were already in progress, for several reasons:
They were, in fact, still recommendations of OpenMSU regardless of who else might be recommending and implementing them.
OpenMSU’s job was in part to speak for the people and state their opinions and needs regardless of where else solutions might arise.
Lending OpenMSU’s voice in support of the improvements could add momentum and weight to their urgency.
Data and solutions provided by OpenMSU may support and benefit the goals of the initiatives begun by the new leadership.
The Recommendation Subcommittee therefore decided to complete the process to develop, evaluate, and
prioritize the proposed solutions that were already in progress under new leadership.
Cost-Benefit Analysis
Midway through the Recommendations Phase, President Cruzado indicated that she would like to see Return-on-
Investment analysis as part of prioritization to inform final recommendations. While cost-effectiveness and benefit
analysis were included in the business cases, true accounting ROI cannot be reasonably calculated until solutions
have been designed and planned; however, the Information Gathering Team resolved this issue by preparing
cost-benefit analyses based on Rough Order of Magnitude (ROM) estimation for proposed solutions where
sufficient data was available to do so.
Evaluation Techniques
Different techniques for evaluating proposed solutions were considered, namely a Delphi technique of
independent analysis iteratively compared and compiled into a single consensus and a collective discussion
technique of talking through each proposed solution as a group and arriving at a single consensus.
The Evaluation team resolved this issue by selecting the collective discussion technique that worked well for
everyone. Talking through the various perspectives and collectively considering the wealth of information
available added a dimension of quality expertise to the exercise that otherwise would have been lost.
The rubric template developed for the Evaluation exercise proved to be too granular, calling for ratings of several
factors in each of the three prioritization criteria categories (Alignment, Cost-effectiveness, Probability of Success)
then computing those factors into a single category rating. Given the variety of proposed solutions, a single pre-
determined set of factors did not capture all the information and perspective applicable to each proposed solution.
Had the evaluation activity been entirely quantifiable, computers could have conducted the evaluation. The fact

OpenMSU Initiative | Anne Milkovich, Recommendation Subcommittee Chair | 11/20/2012 Page 30 of 99
N:\Ac_RecSub\Report\FinalReportFiles\OpenMSU_RecommendationReport_Final_Response.docx
that humans were required was precisely due to the need for expert judgment in addition to quantifiable criteria.
At the same time, some measure of control needed to be applied to ensure consistency in the evaluation activity.
The Evaluation Team resolved this issue by refining the method and template. In the refined method, the factors
within each category are considered and a single rating is given for the category, rather than individual ratings for
each factor that compute into a single rating. This allowed for better discussion and application of expert judgment
that was valid but not necessarily accounted for using a single set of pre-determined factors for a variety of cases.
This rubric style also matches common rubrics used in evaluating student performance, and so was deemed
acceptable as a solution.
Recommendation Phase Lessons Learned
Lessons learned included both positive aspects that should be learned from and repeated and negative aspects
that should be learned from and improved on.
Lessons to Repeat
Leveraging the work of the MSU Integration Initiative saved time in developing the model for evaluation and prioritization of proposed solutions.
Having a small phase subcommittee enabled faster progress than expecting the entire Steering Committee to drive the phase.
The Recommendations Subcommittee contributed varied background and worked well together. Different perspectives were shared and considered and decisions were arrived at consensually.
Regular meetings between the Recommendations Subcommittee chair and the Steering Committee chair and Information Gathering team lead kept the initiative on track and collaborative.
The Evaluation Team contributed varied background and worked well together. The team members took their role seriously and contributed valuable input and perspective.
Having an objective and independent Evaluation Team added a richer dimension and better decision making than the Recommendations Subcommittee could have done, being too close to the process.
The Open Forum was successful, with positive feedback on the posters and the sticker voting and feedback mechanisms.
The web site provided comprehensive information and feedback mechanisms, although it was not as well published as it could have been (see Negative Lessons to Improve).
Lessons to Improve
LESSON LEARNED DETAILS AND RECOMMENDED IMPROVEMENTS
Communication was inadequate, as is
typical on almost any initiative During the summer months communication is especially
challenged without Monday Morning Memos, standing committees to visit, or regular MSU Today postings.
Summer channels need to be designed and utilized.
The responsibility for communication was shared among many people, with sometimes unclear responsibilities.
Roles, responsibilities, and a formal communication plan should be developed and adhered to.
Website availability was not pushed as
well as it could have been The web site contained a wealth of phase information but was
not adequately pushed to constituents. Constituents indicated they were not aware the information was available.
The web site should be pushed more to
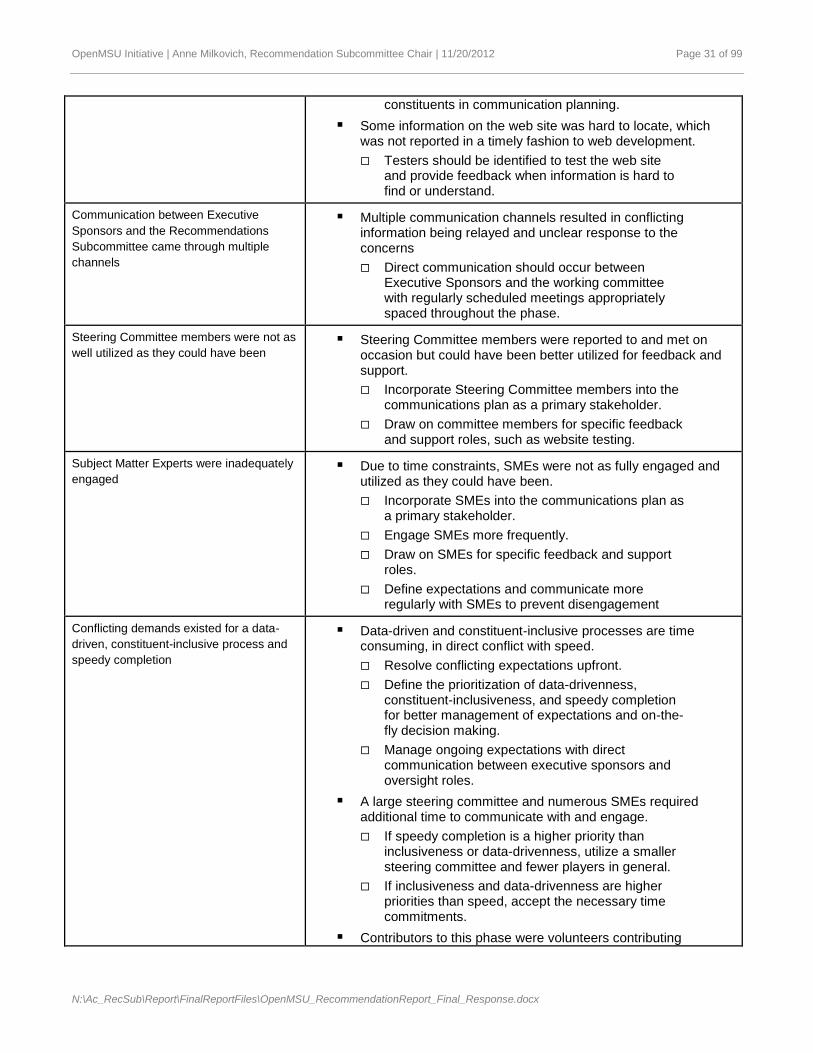
OpenMSU Initiative | Anne Milkovich, Recommendation Subcommittee Chair | 11/20/2012 Page 31 of 99
N:\Ac_RecSub\Report\FinalReportFiles\OpenMSU_RecommendationReport_Final_Response.docx
constituents in communication planning.
Some information on the web site was hard to locate, which was not reported in a timely fashion to web development.
Testers should be identified to test the web site and provide feedback when information is hard to find or understand.
Communication between Executive
Sponsors and the Recommendations
Subcommittee came through multiple
channels
Multiple communication channels resulted in conflicting information being relayed and unclear response to the concerns
Direct communication should occur between Executive Sponsors and the working committee with regularly scheduled meetings appropriately spaced throughout the phase.
Steering Committee members were not as
well utilized as they could have been Steering Committee members were reported to and met on
occasion but could have been better utilized for feedback and support.
Incorporate Steering Committee members into the communications plan as a primary stakeholder.
Draw on committee members for specific feedback and support roles, such as website testing.
Subject Matter Experts were inadequately
engaged Due to time constraints, SMEs were not as fully engaged and
utilized as they could have been.
Incorporate SMEs into the communications plan as a primary stakeholder.
Engage SMEs more frequently.
Draw on SMEs for specific feedback and support roles.
Define expectations and communicate more regularly with SMEs to prevent disengagement
Conflicting demands existed for a data-
driven, constituent-inclusive process and
speedy completion
Data-driven and constituent-inclusive processes are time consuming, in direct conflict with speed.
Resolve conflicting expectations upfront.
Define the prioritization of data-drivenness, constituent-inclusiveness, and speedy completion for better management of expectations and on-the-fly decision making.
Manage ongoing expectations with direct communication between executive sponsors and oversight roles.
A large steering committee and numerous SMEs required additional time to communicate with and engage.
If speedy completion is a higher priority than inclusiveness or data-drivenness, utilize a smaller steering committee and fewer players in general.
If inclusiveness and data-drivenness are higher priorities than speed, accept the necessary time commitments.
Contributors to this phase were volunteers contributing

OpenMSU Initiative | Anne Milkovich, Recommendation Subcommittee Chair | 11/20/2012 Page 32 of 99
N:\Ac_RecSub\Report\FinalReportFiles\OpenMSU_RecommendationReport_Final_Response.docx
fragmented time in addition to their regular jobs who had subject matter expertise but not necessarily program management or business analysis expertise.
Allocate dedicated resources for efforts of this magnitude
Realistically identify gaps in expertise and provision means to close the gaps.

OpenMSU Initiative | Anne Milkovich, Recommendation Subcommittee Chair | 11/20/2012 Page 33 of 99
N:\Ac_RecSub\Report\FinalReportFiles\OpenMSU_RecommendationReport_Final_Response.docx
Appendix E: Business Case Template

OpenMSU Initiative | Anne Milkovich, Recommendation Subcommittee Chair | 11/20/2012 Page 34 of 99
N:\Ac_RecSub\Report\FinalReportFiles\OpenMSU_RecommendationReport_Final_Response.docx
Appendix F: Cost-Benefit Analysis Template
1
2
3
4
5
6
Applicable
(Y, N
Probable,
Possible)
Upfront Real Costs
Hardware Purchase
Software Purchase
Consulting Services
Other:
Upfront T&E Costs
Functional
Project Management
Business Analysis
Electronic Document & Workflow
Training
Other:
Technical
Development & Implementation
Other:
Ongoing Annual Real Costs
Licensing
Systems Maintenance: New positions (3)
Other: Computer & Training
Ongoing Annual T&E Costs
Other:
QUALITATIVE BENEFITS
Additional Info
Additional Info
COSTS
Benefit

OpenMSU Initiative | Anne Milkovich, Recommendation Subcommittee Chair | 11/20/2012 Page 35 of 99
N:\Ac_RecSub\Report\FinalReportFiles\OpenMSU_RecommendationReport_Final_Response.docx
DISCLAIMER: Conceptual cost-benefit analysis with an estimation range between -xx% to +xx%.
Rate/Hr Hrs/Wk Year 1 1 Year 2 Year 3 Year 4 Year 5 Totals
$0
$0
$0 $0 $0 $0 $0 $0
$0 $0 $0 $0 $0 $0
$0 $0 $0 $0 $0 $0
Rate/Hr Total Hrs Year 1 1 Year 2 Year 3 Year 4 Year 5 Totals
$0
$0
$0
$0
Project Management $0 $0
Business Analysis $0 $0
Electronic Document and Workflow $0 $0
Training $0 $0
Other: $0 $0
Development & Implementation $0 $0
Other: $0 $0
Licensing $0 $0 $0 $0 $0 $0
Systems Maintenance: New positions $0 $0 $0 $0 $0 $0
Other: Computer & Training $0 $0 $0 $0 $0 $0
Other:
Totals $0 $0 $0 $0 $0 $0
Upfront Real Costs
Upfront T&E Costs
1
2
Increased Revenue
Materials Savings
Increased Time & Effort (T&E) Capacity
Totals
Functional
Consulting Services (input individual years)
Project Name COST-BENEFIT CASH FLOW
QUANTITATIVE BENEFITS
COSTS
Assumptions:
Ongoing Annual Real Costs
Ongoing Annual T&E Costs
Hardware Purchase (input individual years)
Software Purchase (input individual years)
Technical
Other (input individual years)

OpenMSU Initiative | Anne Milkovich, Recommendation Subcommittee Chair | 11/20/2012 Page 36 of 99
N:\Ac_RecSub\Report\FinalReportFiles\OpenMSU_RecommendationReport_Final_Response.docx
5-Yr Totals w/o BPA 5-Yr Totals for BPA 5-Yr Totals w/ BPA
$0 $0 $0
$0 $0 $0
Increased Distributed T&E Capacity $0 $0 $0
Increased Central T&E Capacity $0 $0 $0
$0 $0 $0
$0 $0 $0
$0 $0 $0
5-Yr Totals w/o BPA 5-Yr Totals for BPA 5-Yr Totals w/ BPA
$0 $0 $0
$0 $0 $0
$0 $0 $0
$0 $0 $0
Project Management $0 $0 $0
Business Analysis $0 $0 $0
Electronic Document and Workflow $0 $0 $0
Training $0 $0 $0
Other: $0 $0 $0
Development & Implementation $0 $0 $0
Other: $0 $0 $0
Licensing $0 $0 $0
Systems Maintenance: New positions (3) $0 $0 $0
Other: Computer (1) & Training (3) $0 $0 $0
Other: $0 $0
Totals $0 $0 $0
Ongoing Annual T&E Costs
2
3
Increased Time & Effort (T&E) Capacity
1
COSTS
Technical
Ongoing Annual Real Costs
Project Name
Consulting Services (input individual years)
Other (input individual years)
Upfront T&E Costs
Functional
Totals
Upfront Real Costs
Hardware Purchase (input individual years)
Software Purchase (input individual years)
DISCLAIMER: Conceptual cost-benefit analysis with an estimation range between -30% to +50%.
QUANTITATIVE BENEFITS
Increased Revenue
COST-BENEFIT CASH FLOW
Materials Savings
4

OpenMSU Initiative | Anne Milkovich, Recommendation Subcommittee Chair | 11/20/2012 Page 37 of 99
N:\Ac_RecSub\Report\FinalReportFiles\OpenMSU_RecommendationReport_Final_Response.docx
Year Annual Costs Annual Benefits Overall Cash Flow
1 $0 $0 $0
2 $0 $0 $0
3 $0 $0 $0
4 $0 $0 $0
5 $0 $0 $0
Totals $0 $0 $0
DISCOUNT RATE (%) : 5%
NET PV: $0.00
IRR: N/A for neg return
Break-Even Point =
In the following ratio formula, use the Annual and Overall Cash Flow values from the Break-Even Year, which is the first
year that Annual Cash Flow is a positive number.
Annual Cash Flow - Overall Cash Flow
Annual Cash Flow
Annual Cash Flow
Break-Even Year - 1 + Break Even Ratio
Break-Even Ratio =
Net PV (Net Present Value)
Calculation of the net present value of the project (or investment) is based on Annual Cash Flows and the above stated
Discount Rate. The net present value of an investment is today's value of each Annual Cash Flow (Annual Cost -
Annual Benefit), summed.
IRR (Internal Rate of Return)
IRR is the internal rate of return based on the Annnual Cash Flow. IRR requires an initial investment (negative value).
So, if the project pays for itself before the end of the first year, the IRR cannot be calculated (without a negative value
representing the initial investment). If all of the Annual Cash Flows are positive numbers (no apparent initial
investment), an error will result (i.e., #NUM!).
Break-Even Analysis
SUMMARY
$0
$0
$0
$0
Project Name COST-BENEFIT BOTTOM LINE
DISCLAIMER: Conceptual cost-benefit analysis with an estimation range between -30% to +50%.
User Note:
Complete yellow cell only.
The purpose of Break-Even Analysis is to discover when the project will pay for itself. The break even point can be
calculated using the Break-Even Ratio followed by the Break Even Point Formulas.
PERFORMANCE ANALYSIS (Values in this section reflect End of Period)
$0
$0

OpenMSU Initiative | Anne Milkovich, Recommendation Subcommittee Chair | 11/20/2012 Page 38 of 99
N:\Ac_RecSub\Report\FinalReportFiles\OpenMSU_RecommendationReport_Final_Response.docx
Appendix G: Evaluation Rubric
REF METRIC VALUE
A.1 Outcome aligns directly to support of MSU discovery, creativity, service mission.
A.2
A.3
A.4
A.5
A.6
A.7
A.8
C.1
C.2
C.3
C.4
C.5
C.6
P.1
P.2
P.3
P.4
P.5
P.6
P.7
P.8 Sustainability: Ongoing Support Ongoing support needed is minimal or readily available at low cost.
Planning: Stakeholders Stakeholders are identified; expectations are reasonable and manageable.
Scope: Complexity Complexity is minimal; scope is defined and manageable.
Planning: Training Training needed is minimal and has been adequately planned for.
Planning: Measurement Outcome performance is measurable and will be reported.
Institutional: Critical Success Factors CSFs are achievable with a high probability of occurring easily.
Institutional: Funding Availability Upfront and ongoing funding is sufficient for the life of the project.
Opportunity: Resource Availability Necessary FTE and other resources are available and underutilized.
Opportunity: Alternatives Availability Time & effort cannot be better spent on any possible alternative.
Enter Proposal Name
CATEGORY FACTOR
Fiscal: Cost Savings Outcome reduces cash outflow.
Cost: Ongoing Ongoing cost is minimal or none.
Cost: Upfront Upfront cost is minimal or none.
Cultural willingness The institutional culture is ready and willing to adopt this solution over alternatives.Institutional:
Outcome results in improved employee job satisfaction.
Constituents: Constituent reach Outcome directly addresses deepest identified constituent needs.
Constituents: Constituent span Outcome directly addresses needs of the widest number of constituents.
Outcome addresses all the identified horizontal problems of the organization
Outcome addresses all the identified process or service problems
Outcome addresses all of the functional area departments in the initiative scope
Scope:
Scope:
Scope:
ALIGNMENT
COST-EFFECTIVENESS
PROBABILITY OF SUCCESS
Outcome results in optimized process, productivity, and throughput.
Initiative: Improved satisfaction
Institutional: Mission
Horizontal problems
Processes/services
Functional areas
Initiative: Increased efficiency
Functional: Time Savings Outcome reduces time on process.

OpenMSU Initiative | Anne Milkovich, Recommendation Subcommittee Chair | 11/20/2012 Page 39 of 99
N:\Ac_RecSub\Report\FinalReportFiles\OpenMSU_RecommendationReport_Final_Response.docx
Appendix H: Proposed Solution Detail
BPA
50% 90% 75%
Initiative Objectives
*
Constituents Served
*
Estimated New Net
COST-EFFECTIVENESS
Processes / Services
Addressed
Problems Addressed
Departments Served
Benefits 409,000$
Upfront T&E Cost
-$
Key Performance
Indicators or
Outcome Measures
Upfront Real Cost
Ongoing Annual Cost Ongoing Annual T&E Cost
-$
-$ *
Alternative Solutions
• Redesign the BPA process without automating it.
• Implement shared services to provide BPA support to multiple units.
• Hire an external consultant to evaluate the process and develop potential improvements.
ALIGNMENT
Data Support
20,700$
* Estimated new net result is dependent on implementation of electronic document management and workflow. Upfront real
and ongoing annual costs associated with implementing this technology are captured in the Eliminate Paper-based
Processes and Inefficiencies proposal.
**This proposal is dependant on a functional interface to Banner as well as EDMW.
***Probability of success is dependent on leadership commitment & being fully resourced.
Alignment Rating Cost-Effectiveness Rating Probability of Success Rating
COMMENTS AND RECOMMENDATIONS
406-994-4311
Phone
Primary Contact
Proposed SolutionRedesign the BPA process through the use of electronic document management & workflow
technology, including elimination of unnecessary paper and manual processes.
DISCLAIMER: Conceptual cost-benefit analysis with an estimation range between -30% to +50%.
OpenMSU Proposal
STAGEBanner Payment Authorization (BPA) Process
Reduced time to process an invoice
Reduced cost per invoice
Employee satisfaction with ease of use
Reduction of physical paper storage
MEDIUM. Dependent on implementation of Doc Management and Workflow.
Exact figures to be determined upon Concept clearance. Moderate training, communication and
adoption management.
General Time & Effort
Required
Problem Statement
The current BPA process involves duplicate entry of data and physical movement of forms. About
36,750 BPA forms were processed in FY2011, which is a high volume of transactions at MSU. The
BPA process had the second most survey comments for an activity that took significantly longer than
it should, tied with recruiting/hiring as the process most critical to change and/or streamline.
Laura Humberger
Asst VP of Finance
Prioritization
Title/Department
PROPOSAL OVERVIEW
Cash Savings Incr. Capacity
Service Providers
Service Users
Surveys Focus Groups Professional Expertise
<100 100-500 >500
Operational Efficiency Employee Satisfaction
HR CentralAgenciesAcademic Depts
University Comm
Fin & Acct Central
Sponsored ProgramsPurchasing CentralIT Central
Paper process
Staff capacity
Lack of integration Comm/Coord
Redundancy
Customer service
Staff expertise Allocation/prioritization Compensation
BPAs
HR Recruiting IT SupportPurchasing Web Dev & Content
Budget/Finance EPAFs/Payroll Employee Relations
Central/Dist model
IT Governance
Sponsored Programs
<100 100-500 >500

OpenMSU Initiative | Anne Milkovich, Recommendation Subcommittee Chair | 11/20/2012 Page 40 of 99
N:\Ac_RecSub\Report\FinalReportFiles\OpenMSU_RecommendationReport_Final_Response.docx
OpenMSU Objectives Addressed
Reduce cycle times- reduce time to process an invoice.
Coordinate activities- implement a process that improves coordination between central and distributed service providers.
Increase capacity- implement processes that take less service provider time to create additional service provider capacity.
Improve allocation- enable shared services, which can improve the allocation of services among MSU units, through an automated accounts payable process.
Improve service provider satisfaction- meet campus demand for an improved BPA process.
Improve service customer satisfaction- meet campus demand for improved finance & accounting processes.
Supporting Data
In response to the OpenMSU Service Provider Survey:
o 18% of responses (84 comments) commented that the BPA process was an activity that took significantly longer than it should at MSU. This was the second most comments for any activity in response to this question.
o 12% of responses (45 comments) commented that the BPA process was the process most critical to change and/or streamline at MSU. This was tied (with recruiting/hiring) for the most comments for any process in response to this question.
In response to the OpenMSU Service Customer Survey, 31 out of 80 process overall (take too long, too difficult, duplicate effort, paper/manual) themed comments were about the finance & accounting function.
About 36,750 BPA forms were processed in FY2011, which is a high volume of transactions at MSU.
Detailed Problem Statement
According to the OpenMSU surveys (as can be seen in the supporting data section), there is significant campus demand for an improved BPA process. The current BPA process involves duplicate entry of data and physical movement of forms as discussed in the following:
Data is entered onto BPA forms by departmental staff (often using programs such as Microsoft Access or other software such as the Facilities project accounting software).
BPA forms are then printed out and manually delivered to University Business Services (UBS),
UBS then enters this data into the Banner system.
Detailed Solution Statement
Redesign the BPA process through the use of electronic document management & workflow technology, including elimination of unnecessary paper and manual processes. Automating the BPA process is dependent on implementation of the EDMW solution. A BPA process redesign has high-impact improvement opportunities with high transaction volume and will address the significant campus demand for manual process elimination and improvement. The project team should be comprised of relevant stakeholders, including central and distributed service providers, to ensure proper design. The project should also include a review, and if needed, a change in the duties of personnel and methods now used for preparing and/or authorizing and/or inputting documents into the Banner system. For example, larger departments with approval processes in place could choose to enter their own BPAs into Banner, attaching the imaged document for review by a central office, eliminating time and effort. Smaller departments could choose to use a different approach, such as having this work performed for them by the central office.

OpenMSU Initiative | Anne Milkovich, Recommendation Subcommittee Chair | 11/20/2012 Page 41 of 99
N:\Ac_RecSub\Report\FinalReportFiles\OpenMSU_RecommendationReport_Final_Response.docx
Alternative Solutions
Redesign the BPA process without automating it.
Implement shared services to provide BPA support to multiple units.
Hire an external consultant to evaluate the process and develop potential improvements.
COST-BENEFIT SUMMARY
DISCLAIMER: Conceptual cost-benefit analysis with an estimation range between -30% to +50%.
Applicable
(Y, N
Probable,
Possible)
Increased Revenue N
Materials Savings Y
Increased Labor Time & Effort (T&E) Capacity Y
Increased Distributed T&E Capacity
Increased Central T&E Capacity
1
2
3
4
5
6
Applicable
(Y, N
Probable,
Possible)
Upfront Real Costs
Hardware Purchase N
Software Purchase N
Consulting Services N
Other:
Upfront T&E Costs
Functional
Project Management Y
Business Analysis Y
Electronic Documents and Workflows Y
Training Y
Other:
Technical
Development & Implementation Y
Other:
Ongoing Annual Real Costs
Licensing N
Other:
Ongoing Annual T&E Costs
Systems Maintenance N
Other:
QUALITATIVE BENEFITS
Additional Info
Implement a process that improves coordination between central and distributed service
providers.
Enable shared services, which can improve the allocation of services among MSU units,
through an automated accounts payable process.
Improve service provider satisfaction
Increase capacity
Coordinate activities
Additional Info
QUANTITATIVE BENEFITS
BPA Process Improvement
Eliminate physical movement of documents. Eliminate redundant data entry.
Eliminate physical movement of documents.
Paper, toner, ink. Storage space.
1
2
Electronic document and workflow development led by MSU project leader (Banner MTL)
Additional Info
COSTS
Benefit
Improve allocation
Meet campus demand for an improved BPA process.
Meet campus demand for improved finance & accounting processes.
Implement processes that take less service provider time to create additional service
provider capacity.
Reduce cycle times Reduce time to process an invoice.
Improve service customer satisfaction
Electronic document and workflow development led by MSU project leader (Banner MTL)

OpenMSU Initiative | Anne Milkovich, Recommendation Subcommittee Chair | 11/20/2012 Page 42 of 99
N:\Ac_RecSub\Report\FinalReportFiles\OpenMSU_RecommendationReport_Final_Response.docx
DISCLAIMER: Conceptual cost-benefit analysis with an estimation range between -30% to +50%.
Rate/Hr Hrs/Wk Year 1 1 Year 2 Year 3 Year 4 Year 5 Totals
$0
$11,000 $11,000 $11,000 $11,000 $11,000 $55,000
Increased Distributed T&E Capacity 4 $26 $0 $0 $0 $0 $0 $0
Increased Central T&E Capacity 5 $26 69 $46,420.13 $95,625 $98,494 $101,449 $104,493 $446,481
$0 $0 $0 $0 $0 $0
$0 $0 $0 $0 $0 $0
$57,420 $106,625 $109,494 $112,449 $115,493 $501,481
Rate/Hr Total Hrs Year 1 1 Year 2 Year 3 Year 4 Year 5 Totals
$0
$0
$0
$0
Project Management $38 113 ($4,291) ($4,291)
Business Analysis $38 80 ($3,038) ($3,038)
Electronic Documents and Workflows $38 178 ($6,760) ($6,760)
Training $38 38 ($1,443) ($1,443)
Other: $0 $0
Development & Implementation $65 80 ($5,200) ($5,200)
Other: $0 $0
Licensing $0 $0 $0 $0 $0 $0
Other: $0 $0 $0 $0 $0 $0
Systems Maintenance 8 $0 $0 $0 $0 $0 $0
Other: $0 $0 $0 $0 $0 $0
Totals ($20,732) $0 $0 $0 $0 ($20,732)
Upfront Real Costs 9
Upfront T&E Costs 2
1
2
3
4
Increased Revenue
Materials Savings 3
Increased Labor Time & Effort (T&E) Capacity 2
Totals
Functional 6
Consulting Services (input individual years)
BPA Process Improvement COST-BENEFIT CASH FLOW
QUANTITATIVE BENEFITS
COSTS
Assumptions:1 Assumes a 6 month project process.2 Assumes a 3% T&E increase per year for existing employees for increased salary and benefits costs as determined by the MSU Budget Office.3 Extrapolated from the OpenMSU Recommendations Subcommittee Proposal Summary (BPAs in FY2012) as well as the MSU Business Process Review Invoice Payment Cost
Benefit Analysis in 2006 (cost of one paper with storage). $11,025 = $.30 cost of one paper with storage X 36,750 BPAs for FY2012.4 Hourly rate is extrapolated from OpenMSU service provider sample hourly rates. Hours per week are extrapolated from OpenMSU Functional Activity Analysis Unit Time
Estimates.5 Hourly rate is extrapolated from OpenMSU service provider sample hourly rates. Hours per week are extrapolated from the OpenMSU Recommendations Subcommittee
Proposal Summary (BPAs in FY2012) as well as the MSU Business Process Review Invoice Payment Cost Benefit Analysis in 2006 (decrease in processing cost per BPA). 69
hours per week = $2.55 ($12 MSU-Boz processing costs before process improvement - $9.45 MSU-Boz processing costs post process improvement) decrease in cost per BPA X
36,750 BPAs for FY2012 / $26 hourly rate / 52 weeks per year.6 Total hours are extrapolated from SunGuard Higher Education electronic document management and workflow proposal in 2009. Hourly rate is based on Banner Module Team
Leader rate and includes 35% benefits.7 Total hours are extrapolated from SunGuard Higher Education electronic document management and workflow proposal in 2009. Hourly rate is as determined by the ITC Director
of Business Administration and includes benefits.8 Assumes Ongoing Annual T&E Costs, such as systems maintenance, are provided by the 3 new hires included in the OpenMSU proposal to Eliminate Paper-Based Processes
and Inefficiencies.9 Assumes costs for hardware and software are included in the OpenMSU proposal to Eliminate Paper-Based Processes and Inefficiencies. Also assumes that the 3 new hires in
that proposal and existing project management related personnel (e.g., Banner Module Team Leads) will serve as internal consultants instead of using an external consultant.
Ongoing Annual Real Costs
Ongoing Annual T&E Costs 2
Hardware Purchase (input individual years)
Software Purchase (input individual years)
Technical 7
Other (input individual years)

OpenMSU Initiative | Anne Milkovich, Recommendation Subcommittee Chair | 11/20/2012 Page 43 of 99
N:\Ac_RecSub\Report\FinalReportFiles\OpenMSU_RecommendationReport_Final_Response.docx
Year Annual Costs Annual Benefits Overall Cash Flow
1 ($20,732) $57,420 $36,688
2 $0 $106,625 $143,314
3 $0 $109,494 $252,808
4 $0 $112,449 $365,257
5 $0 $115,493 $480,749
Totals ($20,732) $501,481 $480,749
DISCOUNT RATE (%) : 5%
NET PV: $409,242.28
IRR: 229%
Break-Even Point =
In the following ratio formula, use the Annual and Overall Cash Flow values from the Break-Even Year, which is the first
year that Annual Cash Flow is a positive number.
Annual Cash Flow - Overall Cash Flow
Annual Cash Flow
Annual Cash Flow
Break-Even Year - 1 + Break Even Ratio
Break-Even Ratio =
Net PV (Net Present Value)
Calculation of the net present value of the project (or investment) is based on Annual Cash Flows and the above stated
Discount Rate. The net present value of an investment is today's value of each Annual Cash Flow (Annual Cost -
Annual Benefit), summed.
IRR (Internal Rate of Return)
IRR is the internal rate of return based on the Annnual Cash Flow. IRR requires an initial investment (negative value).
So, if the project pays for itself before the end of the first year, the IRR cannot be calculated (without a negative value
representing the initial investment). If all of the Annual Cash Flows are positive numbers (no apparent initial
investment), an error will result (i.e., #NUM!).
Break-Even Analysis
SUMMARY
$480,749
$115,493
$112,449
$109,494
BPA Process Improvement COST-BENEFIT BOTTOM LINE
DISCLAIMER: Conceptual cost-benefit analysis with an estimation range between -30% to +50%.
The purpose of Break-Even Analysis is to discover when the project will pay for itself. The break even point can be
calculated using the Break-Even Ratio followed by the Break Even Point Formulas.
PERFORMANCE ANALYSIS (Values in this section reflect End of Period)
$106,625
$36,688
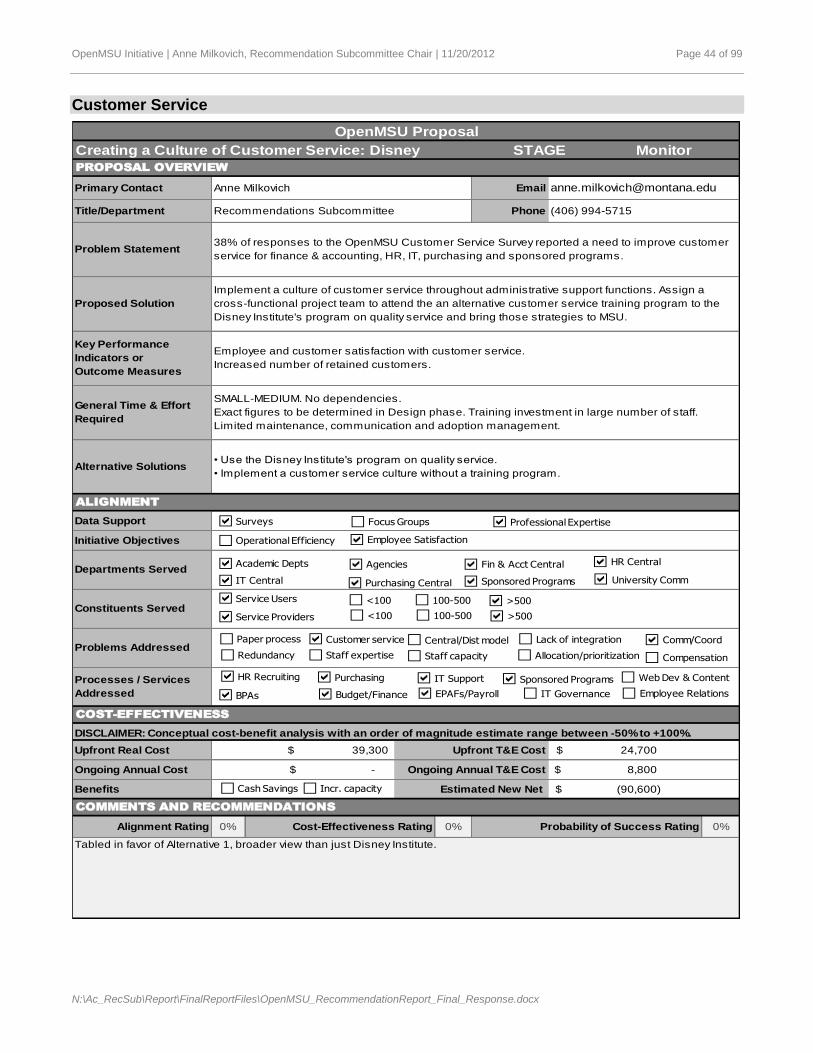
OpenMSU Initiative | Anne Milkovich, Recommendation Subcommittee Chair | 11/20/2012 Page 44 of 99
N:\Ac_RecSub\Report\FinalReportFiles\OpenMSU_RecommendationReport_Final_Response.docx
Customer Service
0% 0% 0%
Employee and customer satisfaction with customer service.
Increased number of retained customers.
SMALL-MEDIUM. No dependencies.
Exact figures to be determined in Design phase. Training investment in large number of staff.
Limited maintenance, communication and adoption management.
• Use the Disney Institute's program on quality service.
• Implement a customer service culture without a training program.
General Time & Effort
Required
ALIGNMENT
Data Support
Initiative Objectives
Departments Served
Problem Statement38% of responses to the OpenMSU Customer Service Survey reported a need to improve customer
service for finance & accounting, HR, IT, purchasing and sponsored programs.
Anne Milkovich
Recommendations Subcommittee
Monitor
Title/Department
PROPOSAL OVERVIEW
(406) 994-5715
Phone
Primary Contact
Creating a Culture of Customer Service: Disney
Tabled in favor of Alternative 1, broader view than just Disney Institute.
Alignment Rating Cost-Effectiveness Rating Probability of Success Rating
COMMENTS AND RECOMMENDATIONS
Benefits
Ongoing Annual T&E Cost
COST-EFFECTIVENESS
Ongoing Annual Cost 8,800$
Estimated New Net (90,600)$
24,700$ Upfront Real Cost Upfront T&E Cost39,300$
OpenMSU Proposal
STAGE
DISCLAIMER: Conceptual cost-benefit analysis with an order of magnitude estimate range between -50% to +100%.
-$
Constituents Served
Processes / Services
Addressed
Problems Addressed
Proposed Solution
Implement a culture of customer service throughout administrative support functions. Assign a
cross-functional project team to attend the an alternative customer service training program to the
Disney Institute's program on quality service and bring those strategies to MSU.
Key Performance
Indicators or
Outcome Measures
Alternative Solutions
Service Providers
Service Users
Surveys Focus Groups Professional Expertise
<100 100-500 >500
Operational Efficiency Employee Satisfaction
HR CentralAgenciesAcademic Depts
University Comm
Fin & Acct Central
Sponsored ProgramsPurchasing CentralIT Central
Paper process
Staff capacity
Lack of integration Comm/Coord
Redundancy
Customer service
Staff expertise Allocation/prioritization Compensation
BPAs
HR Recruiting IT SupportPurchasing Web Dev & Content
Budget/Finance EPAFs/Payroll Employee Relations
Central/Dist model
IT Governance
Sponsored Programs
<100 100-500 >500
Cash Savings Incr. capacity

OpenMSU Initiative | Anne Milkovich, Recommendation Subcommittee Chair | 11/20/2012 Page 45 of 99
N:\Ac_RecSub\Report\FinalReportFiles\OpenMSU_RecommendationReport_Final_Response.docx
OpenMSU Objectives Addressed
Improve service customer satisfaction- improve customer service Supporting Data
In response to the OpenMSU Service Provider Survey, there were 97 customer service themed
comments, placing customer service as the top comment theme area for this survey.
In response to the OpenMSU Service Customer Survey, 38% of comments responded that customer service improvement was needed in finance & accounting, HR, IT, purchasing and sponsored programs administration at MSU.
Detailed Problem Statement
According to the OpenMSU surveys there is significant campus demand for improved customer service from administrative and technical functions at MSU.
Detailed Solution Statement
Implement a culture of customer service throughout administrative support functions. Assign a cross-functional project team to attend the Disney Institute’s program on quality service to “develop an organizational culture that supports consistent delivery of quality service” and bring those strategies to MSU.
Alternative solution
Use an alternative customer service training program.
Implement a customer service culture without a training program.

OpenMSU Initiative | Anne Milkovich, Recommendation Subcommittee Chair | 11/20/2012 Page 46 of 99
N:\Ac_RecSub\Report\FinalReportFiles\OpenMSU_RecommendationReport_Final_Response.docx
COST-BENEFIT SUMMARY
DISCLAIMER: Conceptual cost-benefit analysis with an order of magnitude estimate range between -50% to +100%.
Applicable
(Y or N)
Increased Revenue N
Materials Savings N
Labor Time & Effort (T&E) Savings N
Reduced Distributed T&E
Reduced Central T&E
1
Applicable
(Y, N or
Maybe)
Upfront Real Costs
Hardware Purchase N
Software Purchase N
Consulting Services N
Other: Y
Upfront T&E Costs
Functional
Project Management Y
Business Analysis N
Training Y
Other:
Technical
Development & Implementation N
Other:
Ongoing Annual Real Costs
Licensing N
Other:
Ongoing Annual T&E Costs
Systems Maintenance N
Other:
1
2
Additional Info
QUALITATIVE BENEFITS
Additional Info
QUANTITATIVE BENEFITS
Creating a Culture of Customer Service
Attendance at quality service training program.
Additional Info
COSTS
Benefit
Improve customer serviceImprove service customer satisfaction

OpenMSU Initiative | Anne Milkovich, Recommendation Subcommittee Chair | 11/20/2012 Page 47 of 99
N:\Ac_RecSub\Report\FinalReportFiles\OpenMSU_RecommendationReport_Final_Response.docx
DISCLAIMER: Conceptual cost-benefit analysis with an order of magnitude estimate range between -50% to +100%.
Rate/Hr Hrs/Wk Year 1 Year 2 Year 3 Year 4 Year 5 Totals
$0
$0
$0 $0 $0 $0 $0 $0
$0 $0 $0 $0 $0 $0
$0 $0 $0 $0 $0 $0
Rate/Hr Total Hrs Year 1 Year 2 Year 3 Year 4 Year 5 Totals
$0
$0
($23,960) ($23,960)
($15,345) ($15,345)
Project Management4 $26 48 ($1,248) ($1,248)
Business Analysis $0 $0
Training5 $26 900 ($23,400) ($23,400)
Other: $0 $0
Development & Implementation $0 $0
Other: $0 $0
Licensing $0 $0 $0 $0 $0 $0
Other: $0 $0 $0 $0 $0 $0
Systems Maintenance6 $26 300 ($8,190) ($8,600) ($9,029) ($9,481) ($35,300)
Other: $0 $0 $0 $0 $0 $0
Totals ($63,953) ($8,190) ($8,600) ($9,029) ($9,481) ($99,253)
Upfront Real Costs
Upfront T&E Costs**
1
2
Increased Revenue
Materials Savings
Time & Effort (T&E) Savings**
Totals
Functional3
Consulting Services (input individual years)1
Creating a Culture of Customer Service COST-BENEFIT CASH FLOW
QUANTITATIVE BENEFITS
COSTS
Assumptions:1 Assume 8 MSU employees will attend (4 from central departments & 4 from distributed departments). Consulting cost is for a 3 1/2 training day program2 Includes travel costs- hotel rooms, flights to Orlando, and per diem meals for 8 people for 5 days3 Hourly rate is extrapolated from OpenMSU service provider sample hourly rates. 4 3 hours to schedule travel/training, 2 hours to select participants & determine funding source. Training development and implementation of 20 hours to discuss/schedule
training, compile information & prepare presentation; 18 hours of training (six 3 hour sessions); 5 hours evaluating training/receiving feedback 5 Three hour training provided for 300 attendess (about 500 service providers with a 60% attendance rate) 6 Supplemental three hour training for 100 attendees provided annually.
** Assumes a 3% T&E increase per year for existing employees for increased salary and benefits costs as determined by the MSU Budget Office.
Ongoing Annual Real Costs
Ongoing Annual T&E Costs**
Hardware Purchase (input individual years)
Software Purchase (input individual years)
Technical
Other (input individual years)2

OpenMSU Initiative | Anne Milkovich, Recommendation Subcommittee Chair | 11/20/2012 Page 48 of 99
N:\Ac_RecSub\Report\FinalReportFiles\OpenMSU_RecommendationReport_Final_Response.docx
Year Annual Costs Annual Benefits Overall Cash Flow
1 ($63,953) $0 ($63,953)
2 ($8,190) $0 ($72,143)
3 ($8,600) $0 ($80,743)
4 ($9,029) $0 ($89,772)
5 ($9,481) $0 ($99,253)
Totals ($99,253) $0 ($99,253)
DISCOUNT RATE (%) : 5%
NET PV: ($90,621.90)
IRR: NA for neg return
Break-Even Point =
In the following ratio formula, use the Annual and Overall Cash Flow values from the Break-Even Year, which is the first
year that Annual Cash Flow is a positive number.
Annual Cash Flow - Overall Cash Flow
Annual Cash Flow
Annual Cash Flow
Break-Even Year - 1 + Break Even Ratio
Break-Even Ratio =
Net PV (Net Present Value)
Calculation of the net present value of the project (or investment) is based on Annual Cash Flows and the above stated
Discount Rate. The net present value of an investment is today's value of each Annual Cash Flow (Annual Cost -
Annual Benefit), summed.
IRR (Internal Rate of Return)
IRR is the internal rate of return based on the Annnual Cash Flow. IRR requires an initial investment (negative value).
So, if the project pays for itself before the end of the first year, the IRR cannot be calculated (without a negative value
representing the initial investment). If all of the Annual Cash Flows are positive numbers (no apparent initial
investment), an error will result (i.e., #NUM!).
Break-Even Analysis
SUMMARY
($99,253)
($9,481)
($9,029)
($8,600)
Creating a Culture of Customer Service COST-BENEFIT BOTTOM LINE
DISCLAIMER: Conceptual cost-benefit analysis with an order of magnitude estimate range between -50% to
+100%.
The purpose of Break-Even Analysis is to discover when the project will pay for itself. The break even point can be
calculated using the Break-Even Ratio followed by the Break Even Point Formulas.
PERFORMANCE ANALYSIS (Values in this section reflect End of Period)
($8,190)
($63,953)

OpenMSU Initiative | Anne Milkovich, Recommendation Subcommittee Chair | 11/20/2012 Page 49 of 99
N:\Ac_RecSub\Report\FinalReportFiles\OpenMSU_RecommendationReport_Final_Response.docx
Eliminate Paper
80% 80% 85%
*
-$
Estimated New Net (5 year) (705,000)$
239,000$
OpenMSU Proposal
STAGEEliminate Paper-based and Manual Processes
Number of departments adopting imaging over paper
Reduced process cycle times
Employee satisfaction with ease of use
Reduction of physical paper storage
VERY LARGE.
Exact figures to be determined in Design phase. Significant IT implementation as well as large-
scale training, communication and adoption management throughout the functional business
areas.
Key Performance
Indicators or
Outcome Measures
Paper-based processes are inefficient and costly, negatively impact customer service, and impact
space allocation. 86% of respondents prefer electronic processes over paper-based. 53 survey
comments placed automation in the top 5 areas for improvement. All parts of the university spend a
significant amount of time and resources working with manual paper-based processes. Paper
documents are also costly to create, store and retrieve.
David Court
Finance Module Team Lead
Prioritization
Title/Department
PROPOSAL OVERVIEW
406-994-2704
Phone
• Implement multiple integrated electronic document management and workflow solutions to
support different business needs.
• Hire an outside consultant to implement EDMW and manage the organizational change process.
Initiative Objectives
Constituents Served
Processes / Services
Addressed
Problems Addressed
Departments Served
Alternative Solutions
ALIGNMENT
Ongoing Annual T&E Cost
COST-EFFECTIVENESS
Ongoing Annual Cost
Upfront Real Cost Upfront T&E Cost309,000$
DISCLAIMER: Conceptual cost-benefit analysis with an estimation range between -30% to +50%.
Primary Contact
Proposed Solution
Assign cross-functional project team to assess, design, and implement Electronic Doc Mgt Workfow
solution and manage organizational change. Document Management stores an external document
as an image rather than in a physical file. Worflow automates approval queues and administrative
processes.
* Note that this net is calculated if technology was applied to a single business process (Banner Payment Authorization),
however, the technology would be scalable to many processes from many functions (potentially including non-OpenMSU
functions such as the Registrar's Office). The estimated new net would improve as the technology is applied to additional
business processes.
**Probability of success is dependent on leadership commitment & fully resourced.
Alignment Rating Cost-Effectiveness Rating Probability of Success Rating
COMMENTS AND RECOMMENDATIONS
Data Support
15,300$
Benefits
General Time & Effort
Required
Problem Statement
Service Providers
Service Users
Surveys Focus Groups Professional Expertise
<100 100-500 >500
Operational Efficiency Employee Satisfaction
HR CentralAgenciesAcademic Depts
University Comm
Fin & Acct Central
Sponsored ProgramsPurchasing CentralIT Central
Paper process
Staff capacity
Lack of integration Comm/Coord
Redundancy
Customer service
Staff expertise Allocation/prioritization Compensation
BPAs
HR Recruiting IT SupportPurchasing Web Dev & Content
Budget/Finance EPAFs/Payroll Employee Relations
Central/Dist model
IT Governance
Sponsored Programs
<100 100-500 >500
Cash Savings Incr. capacity

OpenMSU Initiative | Anne Milkovich, Recommendation Subcommittee Chair | 11/20/2012 Page 50 of 99
N:\Ac_RecSub\Report\FinalReportFiles\OpenMSU_RecommendationReport_Final_Response.docx
OpenMSU Objectives Addressed
Reduce cycle times- implement automated processes that take less service provider time.
Coordinate activities- manual processes allow for greater process variation which leads to less coordination.
Increase capacity- implement automated processes that take less service provider time to create additional service provider capacity.
Improve service provider satisfaction- meet campus demand for elimination of paper-based processes and inefficiencies and implement more user-friendly processes.
Improve service customer satisfaction- meet campus demand for elimination of paper-based processes and inefficiencies and implement more user-friendly processes.
Improve allocation- enable shared services, which can improve the allocation of services among MSU units, through automated processes.
Supporting Data
In response to the OpenMSU Service Provider Survey:
o 86% of respondents stated that they would prefer to use electronic process in place of paper-based processes.
o There were 53 automation themed comments, placing automation in the top five of comment theme areas for this survey.
In response to the OpenMSU Service Customer Survey, there were 80 process overall (take too long, too difficult, duplicate effort, paper/manual) themed comments, placing processes overall in the top three of comment theme areas for this survey.
According to Gartner technology research consulting firm, the average accounts payable organization may incur costs associated with paper documents as follows:
o The average document is copied, either physically or electronically, nine to 11 times at a cost of about $18,
o Documents cost about $20 to file, o Retrieving a misfiled document costs about $120.
Detailed Problem Statement
Paper-based processes are inherently less efficient than automated processes, can negatively impact customer service and generate costs associated with creating, storing and retrieving paper documents. Manual paper-based processes inherently take longer to complete because of time associated with actions such as creating multiple copies of a document, physical delivery of documents to different approvers, entering the same data into both manual forms and electronic systems and correcting errors not detected when preparing paper documents. Paper-based processes can also negatively affect customer service. For example, “The Scholarship Authorization Form and Staff/Dependent Fee Waiver Form” often causes graduate students to receive a tuition and fee statement that is inaccurate because their departmental waivers have not been recorded in time for payment due dates because of the lengthy trip the form must take from the department to the Graduate School to OSP and finally to the Office of Financial Aid. Costs associated with creating, storing and retrieving paper documents include the following:
Costs to create paper documents include materials such as paper, toner, envelopes and postage.
Physical space is limited and expensive to rent or build and better utilized for offices or other workspace than for paper storage, and other costs for storage include file folders, labels and cabinets.
Retrieving paper documents can take significant amounts of time for actions such as locating mishandled paper documents and identifying, pulling and moving paper documents to relocate, archive or destroy.
Paper-based processes also impact organizational space requirements. Workgroups and support functions must be located in proximity to shared documents or inefficiencies are further exacerbated. This impedes the university’s ability to focus the campus core on student-centric services and move support services to the periphery.

OpenMSU Initiative | Anne Milkovich, Recommendation Subcommittee Chair | 11/20/2012 Page 51 of 99
N:\Ac_RecSub\Report\FinalReportFiles\OpenMSU_RecommendationReport_Final_Response.docx
Paper-based processes also impede four-campus integration as records cannot be easily shared across campuses. The human factor of “inconvenience” subtly prevents the already challenging integration of cultures and sub-cultures by putting nuisance obstacles in the way of least resistance. Finally, in addition to the campus demand for automation and improved processes demonstrated by the OpenMSU Service Provider survey, the departments of Financial Aid, Admissions, The Graduate School, Auxiliary Services, HR, University Business Services, Facilities Services, and Safety & Risk Management have all independently expressed interest in electronic document management and workflow services. Some MSU campuses and units have already implemented separate and different document imaging software applications and services, or are planning to do so, thereby impeding savings from shared licensing and maintenance of an enterprise solution. Detailed Solution Statement
Assign a project team to assess, design, and implement Electronic Document Management and Workflow functionality to replace many of the current paper-based approvals and notifications currently performed by our staff.
Document Management would allow an external document such as a student’s tax return, a vendor invoice, etc., to be filed as an image and attached within the Banner system, rather than in a physical file.
Time spent waiting for the physical re-location of documents to various campuses and offices would diminish to the time needed for electronic approval only, and no copies need be stored.
Administration has already set aside funding for the one-time costs of
servers, scanners, and other hardware,
professional services including project management, installation, technical training, functional training, system verification, onsite travel, post implementation review, and a needs analysis.
It is estimated that permanent funding for this solution requires at least 1 – 2 IT personnel and one functional position located in A&F to support all functional areas. Anticipated recurring costs include a junior-level programmer, a server administrator, and a system analyst.
Alternative Solution
Implement multiple integrated electronic document management and workflow solutions to support different business needs.

OpenMSU Initiative | Anne Milkovich, Recommendation Subcommittee Chair | 11/20/2012 Page 52 of 99
N:\Ac_RecSub\Report\FinalReportFiles\OpenMSU_RecommendationReport_Final_Response.docx
COST-BENEFIT SUMMARY
DISCLAIMER: Conceptual cost-benefit analysis with an estimation range between -30% to +50%.
Applicable
(Y, N
Probable,
Possible)
Increased Revenue N
Materials Savings Probable
Increased Labor Time & Effort (T&E) Capacity Probable
Increased Distributed T&E Capacity
Increased Central T&E Capacity
1
2
3
4
5
6
Applicable
(Y, N
Probable,
Possible)
Upfront Real Costs
Hardware Purchase N
Software Purchase N
Consulting Services Y
Other:
Upfront T&E Costs
Functional
Project Management Y
Business Analysis Y
Electronic Document & Workflow Y
Training Y
Other:
Technical
Development & Implementation Y
Other:
Ongoing Annual Real Costs
Licensing N
Systems Maintenance: New positions (3) Y
Other: Computer & Training Y
Ongoing Annual T&E Costs
Other:
For one process to be determined
For one process to be determined
Junior-level programmer, server administrator, system analyst
Computer and related supplies (1 @ $2,000) and travel to training (3 @ $2,000)
QUALITATIVE BENEFITS
Additional Info
$100K infrastructure/workstations (servers, scanners, etc.) already funded.
$100K infrastructure/workstations (servers, scanners, etc.) already funded.
Additional Info
COSTS
Benefit
Improve allocation
Meet campus demand for elimination of paper-based processes and inefficiencies and
implement more user-friendly processes.
Meet campus demand for elimination of paper-based processes and inefficiencies and
implement more user-friendly processes.
Implement automated processes that take less service provider time to create additional
service provider capacity.
Additional Info
QUANTITATIVE BENEFITS
Eliminate Paper-Based Processes and Inefficiencies
Initial process for workfllow has not been determined yet so not quantifiable.
Paper, toner, ink, envelopes, postage. Storage space. Not yet quantifiable.
1
2
Implement automated processes that take less service provider time. Technology could
potentially be applied to many paper processes for many functions.
Enable shared services, which can improve the allocation of services among MSU units,
through automated processes.
Improve service provider satisfaction
Improve service customer satisfaction
Increase capacity
Reduce cycle times
Coordinate activities Manual processes allow for greater process variation which leads to less coordination.

OpenMSU Initiative | Anne Milkovich, Recommendation Subcommittee Chair | 11/20/2012 Page 53 of 99
N:\Ac_RecSub\Report\FinalReportFiles\OpenMSU_RecommendationReport_Final_Response.docx
DISCLAIMER: Conceptual cost-benefit analysis with an estimation range between -30% to +50%.
Rate/Hr Hrs/Wk Year 1 1 Year 2 Year 3 Year 4 Year 5 Totals
$0
$0
$0 $0 $0 $0 $0 $0
$0 $0 $0 $0 $0 $0
$0 $0 $0 $0 $0 $0
Rate/Hr Total Hrs Year 1 1 Year 2 Year 3 Year 4 Year 5 Totals
$0
$0
($175,000) ($175,000)
$0
Project Management $38 47 ($1,785) ($1,785)
Business Analysis $38 48 ($1,823) ($1,823)
Electronic Document and Workflow $38 44 ($1,671) ($1,671)
Training $38 40 ($1,519) ($1,519)
Other: $38 225 ($8,550) ($8,550)
Development & Implementation $0 $0
Other: $0 $0
Licensing 5 $0 $0 $0 $0 $0 $0
Systems Maintenance: New positions (3) 6 $31 4160 ($130,000) ($218,900) ($228,094) ($234,936) ($241,984) ($1,053,914)
Other: Computer (1) & Training (3) 3 $8,000 ($4,000) ($8,000) ($8,000) ($8,000) ($8,000) ($36,000)
Other:
Totals ($324,348) ($226,900) ($236,094) ($242,936) ($249,984) ($1,280,262)
Ongoing Annual Real Costs
Ongoing Annual T&E Costs 2
Hardware Purchase (input individual years)
Software Purchase (input individual years)
Technical 4
Other (input individual years)
Assumptions:1 Assumes a 6 month Project Process.2 Assumes a 3% increase per year as determined by the MSU Budget Office. Quantitative Benefits for T&E Savings and Materials Savings were not estimated because initial
process for workfllow conversion has not yet been determined.3 Based on Sunguard Higher Education Banner Document Management and Workflow proposal from 2010.4 Total Hours are extrapolated from the MSU Investment Proposal for Institutional Priorities for Electronic Workflow and Document Management in December 2011. Assumes all
Client Task technical hours from that proposal are included in Ongoing Annual T&E Costs for New Hires instead of in Upfront T&E Costs that are Technical. Functional hourly
rate is based on Banner Module Team Leader rate and includes 35% benefits.5 Assumes Licensing is not applicable or is included with software costs that are already funded. 6 Assumes new position wage rates are unchanged from the MSU Investment Proposal for Institutional Priorities for Electronic Workflow and Document Management in
December 2011. Assumes 2,080 hours per full year. Two of three new positions would be hired in year one with the other in year two.
Eliminate Paper-Based Processes and Inefficiencies COST-BENEFIT CASH FLOW
QUANTITATIVE BENEFITS
COSTS
Upfront Real Costs
Upfront T&E Costs 2
1
2
Increased Revenue
Materials Savings
Increased Time & Effort (T&E) Capacity 2
Totals
Functional 4
Consulting Services (input individual years) 3
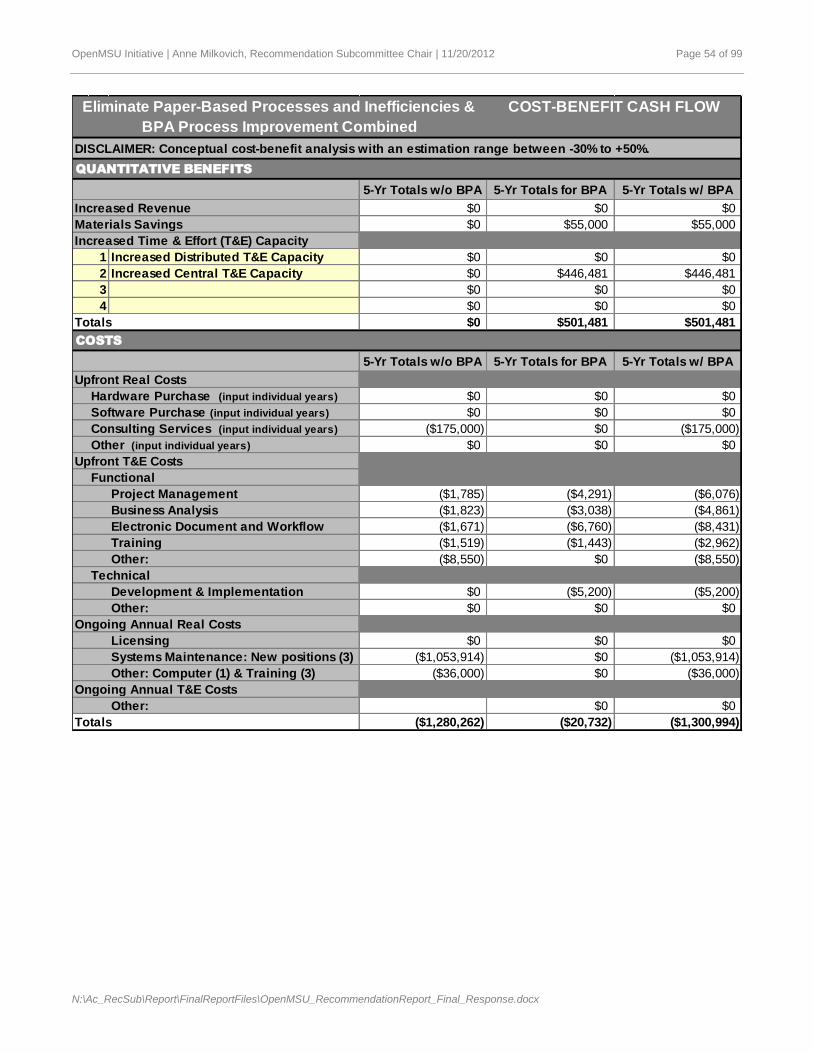
OpenMSU Initiative | Anne Milkovich, Recommendation Subcommittee Chair | 11/20/2012 Page 54 of 99
N:\Ac_RecSub\Report\FinalReportFiles\OpenMSU_RecommendationReport_Final_Response.docx
5-Yr Totals w/o BPA 5-Yr Totals for BPA 5-Yr Totals w/ BPA
$0 $0 $0
$0 $55,000 $55,000
Increased Distributed T&E Capacity $0 $0 $0
Increased Central T&E Capacity $0 $446,481 $446,481
$0 $0 $0
$0 $0 $0
$0 $501,481 $501,481
5-Yr Totals w/o BPA 5-Yr Totals for BPA 5-Yr Totals w/ BPA
$0 $0 $0
$0 $0 $0
($175,000) $0 ($175,000)
$0 $0 $0
Project Management ($1,785) ($4,291) ($6,076)
Business Analysis ($1,823) ($3,038) ($4,861)
Electronic Document and Workflow ($1,671) ($6,760) ($8,431)
Training ($1,519) ($1,443) ($2,962)
Other: ($8,550) $0 ($8,550)
Development & Implementation $0 ($5,200) ($5,200)
Other: $0 $0 $0
Licensing $0 $0 $0
Systems Maintenance: New positions (3) ($1,053,914) $0 ($1,053,914)
Other: Computer (1) & Training (3) ($36,000) $0 ($36,000)
Other: $0 $0
Totals ($1,280,262) ($20,732) ($1,300,994)
Eliminate Paper-Based Processes and Inefficiencies &
BPA Process Improvement Combined
Consulting Services (input individual years)
Other (input individual years)
Upfront T&E Costs
Functional
Totals
Upfront Real Costs
Hardware Purchase (input individual years)
Software Purchase (input individual years)
DISCLAIMER: Conceptual cost-benefit analysis with an estimation range between -30% to +50%.
QUANTITATIVE BENEFITS
Increased Revenue
COST-BENEFIT CASH FLOW
Materials Savings
4
Technical
Ongoing Annual Real Costs
Ongoing Annual T&E Costs
2
3
Increased Time & Effort (T&E) Capacity
1
COSTS

OpenMSU Initiative | Anne Milkovich, Recommendation Subcommittee Chair | 11/20/2012 Page 55 of 99
N:\Ac_RecSub\Report\FinalReportFiles\OpenMSU_RecommendationReport_Final_Response.docx
Year Annual Costs Annual Benefits Overall Cash Flow
1 ($345,080) $57,420 ($287,660)
2 ($226,900) $106,625 ($407,935)
3 ($236,094) $109,494 ($534,534)
4 ($242,936) $112,449 ($665,021)
5 ($249,984) $115,493 ($799,513)
Totals ($1,300,994) $501,481 ($799,513)
DISCOUNT RATE (%) : 5%
NET PV: ($705,145.70)
IRR: N/A for neg return
Break-Even Point =
Eliminate Paper-Based Processes and Inefficiencies &
BPA Process Improvement CombinedCOST-BENEFIT BOTTOM LINE
DISCLAIMER: Conceptual cost-benefit analysis with an estimation range between -30% to +50%.
The purpose of Break-Even Analysis is to discover when the project will pay for itself. The break even point can be
calculated using the Break-Even Ratio followed by the Break Even Point Formulas.
PERFORMANCE ANALYSIS (Values in this section reflect End of Period)
($120,275)
($287,660)
In the following ratio formula, use the Annual and Overall Cash Flow values from the Break-Even Year, which is the first
year that Annual Cash Flow is a positive number.
Annual Cash Flow - Overall Cash Flow
Annual Cash Flow
Annual Cash Flow
Break-Even Year - 1 + Break Even Ratio
Break-Even Ratio =
Net PV (Net Present Value)
Calculation of the net present value of the project (or investment) is based on Annual Cash Flows and the above stated
Discount Rate. The net present value of an investment is today's value of each Annual Cash Flow (Annual Cost -
Annual Benefit), summed.
IRR (Internal Rate of Return)
IRR is the internal rate of return based on the Annnual Cash Flow. IRR requires an initial investment (negative value).
So, if the project pays for itself before the end of the first year, the IRR cannot be calculated (without a negative value
representing the initial investment). If all of the Annual Cash Flows are positive numbers (no apparent initial
investment), an error will result (i.e., #NUM!).
Break-Even Analysis
SUMMARY
($799,513)
($134,491)
($130,487)
($126,600)

OpenMSU Initiative | Anne Milkovich, Recommendation Subcommittee Chair | 11/20/2012 Page 56 of 99
N:\Ac_RecSub\Report\FinalReportFiles\OpenMSU_RecommendationReport_Final_Response.docx
HR-EPAFs
60% 75% 80%
ALIGNMENT
Data Support
Initiative Objectives
Departments Served
Prioritization
Title/Department
PROPOSAL OVERVIEW
(406) 994-5715
Phone
Primary Contact
Alternative Solutions
Problem Statement
According to surveys, there is significant campus demand for improved EPAF processing. OpenMSU
focus groups indicate the shifting of EPAF processing from central to distributed personnel has led
to process inefficiencies. EPAF process was the only process that all 12 units participating in the
focus groups commented on as needing improvement.
Anne Milkovich
Recommendations Sub-Committee Chair
Reduced processing time
Reduced rework and error rates
Satisfaction with ease of use
MEDIUM. Exact figures to be determined in Design phase. Dependent on implementation of
Electronic Document Management and Workflow. Moderate training, communication and adoption
management.
• Conduct an EPAF organizational improvement project without workflow automation.
• Include EPAF processing in a shared services center pilot.
• Hire an outside consultant in conjunction with an internal project team.
General Time & Effort
Required
* Although it is probable that a process improvement project would lead to increased time & effort capacity, the estimated
percentage reduction to result from process improvement is unknown at this time.
** Dependent on implementation of electronic document management and workflow. Upfront real and ongoing annual costs
associated with implementing this technology are captured in the Eliminate Paper-based Processes and Inefficiencies
proposal.
***Probability of success is dependent on leadership commitment & being fully resourced.
Alignment Rating Cost-Effectiveness Rating Probability of Success Rating
COMMENTS AND RECOMMENDATIONS
Benefits
Ongoing Annual T&E Cost
COST-EFFECTIVENESS
Ongoing Annual Cost -$
Estimated New Net (19,700)$ *
20,700$ Upfront Real Cost Upfront T&E Cost-$ **
OpenMSU Proposal
STAGEHR Process Improvement: Electronic Personnel Actn Frm
DISCLAIMER: Conceptual cost-benefit analysis with an order of magnitude estimate range between -50% to +100%.
** -$
Constituents Served
Processes / Services
Addressed
Problems Addressed
Proposed Solution
Assign a qualified project team of relevant stakeholders, including central and distributed service
providers, to analyze the EPAF process. The project should include analysis of staffing and
distribution of labor and duties involved, potentially changing personnel responsibilities as needed,
and should incorporate workflow technology to address process issues.
Key Performance
Indicators or
Outcome Measures
Service Providers
Service Users
Surveys Focus Groups Professional Expertise
<100 100-500 >500
Operational Efficiency Employee Satisfaction
HR CentralAgenciesAcademic Depts
University Comm
Fin & Acct Central
Sponsored ProgramsPurchasing CentralIT Central
Paper process
Staff capacity
Lack of integration Comm/Coord
Redundancy
Customer service
Staff expertise Allocation/prioritization Compensation
BPAs
HR Recruiting IT SupportPurchasing Web Dev & Content
Budget/Finance EPAFs/Payroll Employee Relations
Central/Dist model
IT Governance
Sponsored Programs
<100 100-500 >500
Cash Savings Incr. capacity

OpenMSU Initiative | Anne Milkovich, Recommendation Subcommittee Chair | 11/20/2012 Page 57 of 99
N:\Ac_RecSub\Report\FinalReportFiles\OpenMSU_RecommendationReport_Final_Response.docx
OpenMSU Objectives Addressed
Reduce cycle times- implement processes that take less service provider time.
Coordinate activities- implement processes that improve coordination between central and distributed service providers.
Increase capacity- implement processes that take less service provider time to create additional service provider capacity.
Improve service provider satisfaction- meet campus demand for improved HR processes.
Improve service customer satisfaction- meet campus demand for improved HR processes.
Supporting Data
In response to the OpenMSU Service Provider Survey, 5% of responses (18 comments) commented that
HR processes overall were the processes most critical to change and/or streamline at MSU. This was the fourth most comments for any process in response to this question.
In response to the OpenMSU Service Customer Survey, 28 out of 80 process overall themed comments (processes take too long, too difficult, duplicate effort, paper/manual) were about the HR function.
Detailed Problem Statement
According to the OpenMSU surveys, there is significant campus demand for improved HR processes. Responsibility for conducting this process has been shifted from central to distributed service providers in recent years. According to distributed service providers involved in OpenMSU focus groups, this shifting of duties appears to have led to process inefficiencies. All twelve units participating in OpenMSU focus groups commented on the EPAF process as having opportunities for improvement. This was the only process that all focus groups commented on. Detailed Solution Statement
Conduct a process analysis of the EPAF process to reduce cycle times, increase the capacity of HR service providers and meet campus demand for improved HR processes. The project team should be comprised of relevant stakeholders, including central and distributed service providers, to ensure proper design. The project should include analysis of the appropriate staffing and distribution of labor and duties involved in the process, potentially changing the duties of the personnel involved as needed. The EPAF project should incorporate workflow technology to help address process issues involving reviews and approvals. Alternative Solution
Conduct an EPAF organizational improvement project without automating it through the use of workflow technology.
Include EPAF processing in a shared services center pilot to provide EPAF support to multiple units.

OpenMSU Initiative | Anne Milkovich, Recommendation Subcommittee Chair | 11/20/2012 Page 58 of 99
N:\Ac_RecSub\Report\FinalReportFiles\OpenMSU_RecommendationReport_Final_Response.docx
COST-BENEFIT SUMMARY
DISCLAIMER: Conceptual cost-benefit analysis with an order of magnitude estimate range between -50% to +100%.
Applicable
(Y, N
Probable,
Possible)
Increased Revenue N
Materials Savings N
Increased Labor Time & Effort (T&E) Capacity Probable
Increased Distributed T&E Capacity
Reduced Central T&E Capacity
1
2
3
4
5
Applicable
(Y, N
Probable,
Possible)
Upfront Real Costs
Hardware Purchase N
Software Purchase Possible
Consulting Services N
Other:
Upfront T&E Costs
Functional
Project Management Y
Business Analysis Y
Electronic Documents and Workflows Y
Training Y
Other:
Technical
Development & Implementation Y
Other:
Ongoing Annual Real Costs
Licensing N
Other:
Ongoing Annual T&E Costs
Systems Maintenance Possible
Other:
Implement processes that improve coordination between central and distributed service
providers.
Improve service provider satisfaction
Improve service customer satisfaction
Increase capacity
Reduce cycle times
1
2
Additional Info
QUANTITATIVE BENEFITS
HR Process Improvement: Electronic Personnel Action Form (EPAF)
OpenMSU Functional Activity Analysis preliminary results estimate the following as-is
distributed time: 5,074 EPAFs per year at about 21 minutes hands-on time per EPAF,
resulting in total annual time of about 1,776 hours or the equivalent of .85 FTE. The
estimated percentage reduction to result from process improvement is unknown and
depends on MSU's decision during this project as to whether to enhance or replace the
current EPAF system. One university that implemented EPAFs for PeopleSoft (university-
wide software application) reduced total FTE for EPAF processing by 75%, and another
university reduced central HR office overtime by 88%.
Estimated as-is central time could not be obtained and estimated percentage reduction to
result from process improvement is unknown.
QUALITATIVE BENEFITS
Additional Info
Depends on decision during this project as to whether to enhance/replace current system.
Additional Info
COSTS
Benefit
Coordinate activities
Meet campus demand for improved HR processes.
Meet campus demand for improved HR processes.
Implement processes that take less service provider time to create additional service
provider capacity.
Implement processes that take less service provider time. Some universities that
implemented EPAFs for PeopleSoft reduced processing time by at least 70% and reduced
error rates by at least 94%.
Depends on decision during this project as to whether to enhance/replace current system.
Electronic document and workflow development led by MSU project leader (Banner MTL)
Electronic document and workflow development led by MSU project leader (Banner MTL)

OpenMSU Initiative | Anne Milkovich, Recommendation Subcommittee Chair | 11/20/2012 Page 59 of 99
N:\Ac_RecSub\Report\FinalReportFiles\OpenMSU_RecommendationReport_Final_Response.docx
DISCLAIMER: Conceptual cost-benefit analysis with an order of magnitude estimate range between -50% to +100%.
Rate/Hr Hrs/Wk Year 1 1 Year 2 Year 3 Year 4 Year 5 Totals
$0
$0
Increased Distributed T&E Capacity $0 $0 $0 $0 $0 $0
Increased Central T&E Capacity $0 $0 $0 $0 $0 $0
$0 $0 $0 $0 $0 $0
$0 $0 $0 $0 $0 $0
$0 $0 $0 $0 $0 $0
Rate/Hr Total Hrs Year 1 1 Year 2 Year 3 Year 4 Year 5 Totals
$0
$0
$0
$0
Project Management $38 113 ($4,291) ($4,291)
Business Analysis $38 80 ($3,038) ($3,038)
Electronic Documents and Workflows $38 178 ($6,760) ($6,760)
Training $38 38 ($1,443) ($1,443)
Other: $0 $0
Development & Implementation $65 80 ($5,200) ($5,200)
Other: $0 $0
Licensing $0 $0 $0 $0 $0 $0
Other: $0 $0 $0 $0 $0 $0
Systems Maintenance 5 $0 $0 $0 $0 $0 $0
Other: $0 $0 $0 $0 $0 $0
Totals ($20,732) $0 $0 $0 $0 ($20,732)
Assumptions:1 Assumes a 6 month project process.2 Assumes a 3% T&E increase per year for existing employees for increased salary and benefits costs as determined by the MSU Budget Office.3 Total hours are extrapolated from SunGuard Higher Education electronic document management and workflow proposal in 2009. Hourly rate is based on Banner Module Team
Leader rate and includes 35% benefits.4 Total hours are extrapolated from SunGuard Higher Education electronic document management and workflow proposal in 2009. Hourly rate is as determined by the ITC Director
of Business Administration and includes benefits.5 Assumes Ongoing Annual T&E Costs, such as systems maintenance, are provided by the 3 new hires included in the OpenMSU proposal to Eliminate Paper-Based Processes
and Inefficiencies.6 Assumes costs for hardware and software are included in the OpenMSU proposal to Eliminate Paper-Based Processes and Inefficiencies. Also assumes that the 3 new hires in
that proposal and existing project management related personnel (e.g., Banner Module Team Leads) will serve as internal consultants instead of using an external consultant.
3
4
Other (input individual years)
Ongoing Annual Real Costs
Ongoing Annual T&E Costs 2
Hardware Purchase (input individual years)
Software Purchase (input individual years)
Technical 4
Functional 3
Consulting Services (input individual years)
Upfront Real Costs 6
Upfront T&E Costs 2
HR Process Improvement: Electronic Personnel Action Form (EPAF) COST-BENEFIT CASH FLOW
QUANTITATIVE BENEFITS
COSTS
1
2
Increased Revenue
Materials Savings
Increased Labor Time & Effort (T&E) Capacity 2
Totals

OpenMSU Initiative | Anne Milkovich, Recommendation Subcommittee Chair | 11/20/2012 Page 60 of 99
N:\Ac_RecSub\Report\FinalReportFiles\OpenMSU_RecommendationReport_Final_Response.docx
Year Annual Costs Annual Benefits Overall Cash Flow
1 ($20,732) $0 ($20,732)
2 $0 $0 ($20,732)
3 $0 $0 ($20,732)
4 $0 $0 ($20,732)
5 $0 $0 ($20,732)
Totals ($20,732) $0 ($20,732)
DISCOUNT RATE (%) : 5%
NET PV: ($19,744.74)
IRR: N/A for neg return
Break-Even Point =
In the following ratio formula, use the Annual and Overall Cash Flow values from the Break-Even Year, which is the first
year that Annual Cash Flow is a positive number.
Annual Cash Flow - Overall Cash Flow
Annual Cash Flow
Annual Cash Flow
Break-Even Year - 1 + Break Even Ratio
Break-Even Ratio =
Net PV (Net Present Value)
Calculation of the net present value of the project (or investment) is based on Annual Cash Flows and the above stated
Discount Rate. The net present value of an investment is today's value of each Annual Cash Flow (Annual Cost -
Annual Benefit), summed.
IRR (Internal Rate of Return)
IRR is the internal rate of return based on the Annnual Cash Flow. IRR requires an initial investment (negative value).
So, if the project pays for itself before the end of the first year, the IRR cannot be calculated (without a negative value
representing the initial investment). If all of the Annual Cash Flows are positive numbers (no apparent initial
investment), an error will result (i.e., #NUM!).
Break-Even Analysis
SUMMARY
($20,732)
$0
$0
$0
HR Process Improvement: Electronic Personnel Action
Form (EPAF)
COST-BENEFIT BOTTOM LINE
The purpose of Break-Even Analysis is to discover when the project will pay for itself. The break even point can be
calculated using the Break-Even Ratio followed by the Break Even Point Formulas.
PERFORMANCE ANALYSIS (Values in this section reflect End of Period)
$0
($20,732)
DISCLAIMER: Conceptual cost-benefit analysis with an order of magnitude estimate range between -50% to
+100%.

OpenMSU Initiative | Anne Milkovich, Recommendation Subcommittee Chair | 11/20/2012 Page 61 of 99
N:\Ac_RecSub\Report\FinalReportFiles\OpenMSU_RecommendationReport_Final_Response.docx
HR-Payroll
65% 70% 70%
ALIGNMENT
Data Support
Initiative Objectives
Departments Served
Prioritization
Title/Department
PROPOSAL OVERVIEW
(406) 994-5715
Phone
Primary Contact
Alternative Solutions
Problem Statement
Payroll had the fourth most survey comments for an activity that took significantly longer than it
should at MSU, and it had the third most comments as the process most critical to change and/or
streamline.
Anne Milkovich
Recommendations Sub-Committee Chair
Payees processed per payroll FTE
Percent off-cycle payments
Percent employee self service utilization
Payroll error rate
MEDIUM. Exact figures to be determined upon Concept clearance. Effort investment with consultant
to determine the current process state. Moderate training, communication and adoption
management throughout Human Resources central and distributed.
• Conduct a payroll process improvement project without the assistance of an external consultant.
General Time & Effort
Required
* Although it is probable that a process improvement project would lead to increased time & effort capacity, the estimated
percentage reduction to result from process improvement is unknown at this time.
**Probability of success is dependent on leadership commitment & being fully resourced.
This proposal is rated contingent on the project team determining what resources are needed to solve the problem, utilizing
internal resources as much as possible and only utilizing an external hired consultant if deemed necessary.
Alignment Rating Cost-Effectiveness Rating Probability of Success Rating
COMMENTS AND RECOMMENDATIONS
Benefits
Ongoing Annual T&E Cost
COST-EFFECTIVENESS
Ongoing Annual Cost -$
Estimated New Net (30,200)$ *
17,300$ Upfront Real Cost Upfront T&E Cost14,400$
OpenMSU Proposal
STAGEHR Process Improvement: Payroll
DISCLAIMER: Conceptual cost-benefit analysis with an order of magnitude estimate range between -50% to +100%.
-$
Constituents Served
Processes / Services
Addressed
Problems Addressed
Proposed Solution
Assign a project team including central and distributed service providers with an external consultant
to analyze and improve payroll processes. An external consultant is recommended because HR
processes are complex and we do not have the staff capacity or expertise to adequately redesign
HR processes.
Key Performance
Indicators or
Outcome Measures
Service Providers
Service Users
Surveys Focus Groups Professional Expertise
<100 100-500 >500
Operational Efficiency Employee Satisfaction
HR CentralAgenciesAcademic Depts
University Comm
Fin & Acct Central
Sponsored ProgramsPurchasing CentralIT Central
Paper process
Staff capacity
Lack of integration Comm/Coord
Redundancy
Customer service
Staff expertise Allocation/prioritization Compensation
BPAs
HR Recruiting IT SupportPurchasing Web Dev & Content
Budget/Finance EPAFs/Payroll Employee Relations
Central/Dist model
IT Governance
Sponsored Programs
<100 100-500 >500
Cash Savings Incr. capacity

OpenMSU Initiative | Anne Milkovich, Recommendation Subcommittee Chair | 11/20/2012 Page 62 of 99
N:\Ac_RecSub\Report\FinalReportFiles\OpenMSU_RecommendationReport_Final_Response.docx
OpenMSU Objectives Addressed
Increase capacity- implement processes that take less service provider time to create additional service provider capacity.
Reduce cycle times- implement processes that take less service provider time.
Coordinate activities- implement processes that improve coordination between central and distributed service providers.
Improve service provider satisfaction- meet campus demand for improved payroll processes.
Improve service customer satisfaction- meet campus demand for improved HR processes.
Supporting Data
In response to the OpenMSU Service Provider Survey:
o 8% of responses (28 comments) commented that payroll was the process most critical to change and/or streamline at MSU. This was the third most comments for any process in response to this question.
o 6% of responses (27 comments) commented that payroll was an activity that took significantly longer than it should at MSU. This was the fourth most comments for any activity in response to this question.
o 5% of responses (18 comments) commented that HR processes overall were the processes most critical to change and/or streamline at MSU. This was the fourth most comments for any process in response to this question.
In response to the OpenMSU Service Customer Survey, 28 out of 80 process overall themed comments (processes take too long, too difficult, duplicate effort, paper/manual) were about the HR function.
New York University’s benchmark for “Payees processed per Payroll FTE” is about 984 employees. As of October 12, 2012, MSU’s payees processed per payroll FTE was about 846 employees. Based on that benchmark, it appears MSU has room for improvement.
Detailed Problem Statement
According to the OpenMSU surveys, there is significant campus demand for improved payroll processes. Detailed Solution Statement
Assign a project team of relevant stakeholders, including central and distributed service providers, to work with an external consultant to analyze and improve payroll processes to reduce cycle times, increase the capacity of the HR Office and to meet campus demand for improved HR processes. An external consultant is recommended because HR processes are inherently complex and because MSU does not currently have the staff capacity or expertise to adequately redesign HR processes. Alternative Solution
Conduct a payroll process improvement project without the assistance of an external consultant.

OpenMSU Initiative | Anne Milkovich, Recommendation Subcommittee Chair | 11/20/2012 Page 63 of 99
N:\Ac_RecSub\Report\FinalReportFiles\OpenMSU_RecommendationReport_Final_Response.docx
COST-BENEFIT SUMMARY
DISCLAIMER: Conceptual cost-benefit analysis with an order of magnitude estimation range between -50% to +100%.
Applicable
(Y, N
Probable,
Possible)
Increased Revenue N
Materials Savings N
Increased Labor Time & Effort (T&E) Capacity Probable
Increased Distributed T&E Capacity
Reduced Central T&E Capacity
1
2
3
4
5
Applicable
(Y, N
Probable,
Possible)
Upfront Real Costs
Hardware Purchase N
Software Purchase Possible
Consulting Services Y
Other:
Upfront T&E Costs
Functional
Project Management Y
Business Analysis Y
Training Y
Other:
Technical
Development & Implementation Y
Other:
Ongoing Annual Real Costs
Licensing N
Other:
Ongoing Annual T&E Costs
Systems Maintenance Possible
Other:
Implement processes that improve coordination between central and distributed service
providers.
Improve service provider satisfaction
Improve service customer satisfaction
Increase capacity
Reduce cycle times
Additional Info
QUANTITATIVE BENEFITS
HR Process Improvement: Payroll
Estimated as-is central time could not be obtained and estimated percentage reduction to
result from process improvement is unknown.
OpenMSU Functional Activity Analysis preliminary results estimate the following as-is
distributed time: 86,844 timesheets per year (7,237 per month) at about 14 minutes hands-
on time to monitor each timesheet, resulting in total annual time of about 20,263 hours or
the equivalent of about 10 FTE. The estimated percentage reduction to result from process
improvement is unknown.
1
2
QUALITATIVE BENEFITS
Additional Info
80 hours at $180/hour
Depends on recommendations from external consultant during this project.
Additional Info
COSTS
Benefit
Coordinate activities
Meet campus demand for improved HR processes.
Meet campus demand for improved HR processes.
Implement processes that take less service provider time to create additional service
provider capacity. New York University’s benchmark for “Payees processed per Payroll
FTE” is about 984 employees. As of October 12, 2012, MSU’s payees processed per
payroll FTE was about 846 employees. Based on that benchmark, it appears MSU has
room for improvement.
Implement processes that take less service provider time.
Depends on recommendations from external consultant during this project.
80 hours of time to train HR Office employees on new process.
Four weeks of business analysis time.
Six weeks of a project managers time.

OpenMSU Initiative | Anne Milkovich, Recommendation Subcommittee Chair | 11/20/2012 Page 64 of 99
N:\Ac_RecSub\Report\FinalReportFiles\OpenMSU_RecommendationReport_Final_Response.docx
DISCLAIMER: Conceptual cost-benefit analysis with an order of magnitude estimate range between -50% to +100%.
Rate/Hr Hrs/Wk Year 1 1 Year 2 Year 3 Year 4 Year 5 Totals
$0
$0
Increased Distributed T&E Capacity $26 $0 $0 $0 $0 $0 $0
Increased Central T&E Capacity $24 $0 $0 $0 $0 $0 $0
$0 $0 $0 $0 $0 $0
$0 $0 $0 $0 $0 $0
$0 $0 $0 $0 $0 $0
Rate/Hr Total Hrs Year 1 1 Year 2 Year 3 Year 4 Year 5 Totals
$0
$0
($14,400) ($14,400)
$0
Project Management 3 $38 240 ($9,120) ($9,120)
Business Analysis 3 $38 160 ($6,080) ($6,080)
Training 4 $26 80 ($2,080) ($2,080)
Other: $0 $0
Development & Implementation $0 $0
Other: $0 $0
Licensing $0 $0 $0 $0 $0 $0
Other: $0 $0 $0 $0 $0 $0
Systems Maintenance $0 $0 $0 $0 $0 $0
Other: $0 $0 $0 $0 $0 $0
Totals ($31,680) $0 $0 $0 $0 ($31,680)
Upfront T&E Costs 2
Upfront Real Costs
Consulting Services (input individual years)
Hardware Purchase (input individual years)
Software Purchase (input individual years)
Other (input individual years)
1
2
3
4
Totals
HR Process Improvement: Payroll COST-BENEFIT CASH FLOW
QUANTITATIVE BENEFITS
COSTS
Increased Revenue
Materials Savings
Increased Labor Time & Effort (T&E) Capacity 2
Assumptions:1 Assumes a 6 month project process.2 Assumes a 3% T&E increase per year for existing employees for increased salary and benefits costs as determined by the MSU Budget Office.3 Total hours are extrapolated from SunGuard Higher Education electronic document management and workflow proposal in 2009. Hourly rate is based on Banner Module Team
Leader rate and includes 35% benefits.4 Total hours are extrapolated from SunGuard Higher Education electronic document management and workflow proposal in 2009. Hourly rate is extrapolated from OpenMSU
service provider sample hourly rates and includes 35% benefits.
Ongoing Annual T&E Costs 2
Functional
Ongoing Annual Real Costs
Technical

OpenMSU Initiative | Anne Milkovich, Recommendation Subcommittee Chair | 11/20/2012 Page 65 of 99
N:\Ac_RecSub\Report\FinalReportFiles\OpenMSU_RecommendationReport_Final_Response.docx
Year Annual Costs Annual Benefits Overall Cash Flow
1 ($31,680) $0 ($31,680)
2 $0 $0 ($31,680)
3 $0 $0 ($31,680)
4 $0 $0 ($31,680)
5 $0 $0 ($31,680)
Totals ($31,680) $0 ($31,680)
DISCOUNT RATE (%) : 5%
NET PV: ($30,171.43)
IRR: NA for neg return
Break-Even Point =
In the following ratio formula, use the Annual and Overall Cash Flow values from the Break-Even Year, which is the first
year that Annual Cash Flow is a positive number.
Annual Cash Flow - Overall Cash Flow
Annual Cash Flow
Annual Cash Flow
Break-Even Year - 1 + Break Even Ratio
Break-Even Ratio =
Net PV (Net Present Value)
Calculation of the net present value of the project (or investment) is based on Annual Cash Flows and the above stated
Discount Rate. The net present value of an investment is today's value of each Annual Cash Flow (Annual Cost -
Annual Benefit), summed.
IRR (Internal Rate of Return)
IRR is the internal rate of return based on the Annnual Cash Flow. IRR requires an initial investment (negative value).
So, if the project pays for itself before the end of the first year, the IRR cannot be calculated (without a negative value
representing the initial investment). If all of the Annual Cash Flows are positive numbers (no apparent initial
investment), an error will result (i.e., #NUM!).
Break-Even Analysis
SUMMARY
($31,680)
$0
$0
$0
HR Process Improvement: Payroll COST-BENEFIT BOTTOM LINE
The purpose of Break-Even Analysis is to discover when the project will pay for itself. The break even point can be
calculated using the Break-Even Ratio followed by the Break Even Point Formulas.
PERFORMANCE ANALYSIS (Values in this section reflect End of Period)
$0
($31,680)
DISCLAIMER: Conceptual cost-benefit analysis with an order of magnitude estimate range between -50% to
+100%.

OpenMSU Initiative | Anne Milkovich, Recommendation Subcommittee Chair | 11/20/2012 Page 66 of 99
N:\Ac_RecSub\Report\FinalReportFiles\OpenMSU_RecommendationReport_Final_Response.docx
HR-Recruitment and Hiring
65% 75% 55%
OpenMSU Proposal
STAGEHR Process Improvement: Recruiting/Hiring
DISCLAIMER: Conceptual cost-benefit analysis with an order of magnitude estimate range between -50% to +100%.
-$
Constituents Served
Processes / Services
Addressed
Problems Addressed
Proposed Solution
Assign a project team of stakeholders, including central and distributed service providers, to work
with an external consultant to analyze and improve recruiting processes from classification through
onboarding. An external consultant is recommended because HR processes are inherently complex
and because we do not have the staff capacity or expertise to adequately redesign HR processes.
Key Performance
Indicators or
Outcome Measures
Benefits
Ongoing Annual T&E Cost
COST-EFFECTIVENESS
Ongoing Annual Cost -$
Estimated New Net (15,100)$ *
8,600$ Upfront Real Cost Upfront T&E Cost7,200$
* Although it is probable that a process improvement project would lead to increased time & effort capacity, the estimated
percentage reduction to result from process improvement is unknown at this time.
**Probability of success is dependent on leadership commitment & being fully resourced.
This proposal is rated contingent on the project team determining what resources are needed to solve the problem, utilizing
internal resources as much as possible and only utilizing an external hired consultant if deemed necessary.
Alignment Rating Cost-Effectiveness Rating Probability of Success Rating
COMMENTS AND RECOMMENDATIONS
Alternative Solutions
Problem Statement
According to the OpenMSU surveys, there is significant campus demand for improved
recruiting/hiring processes. Eight out of twelve units participating in OpenMSU focus groups
commented on recruiting/hiring processes as needing improvement.
Anne Milkovich
Recommendations Sub-Committee Chair
Reduced time to hire
Employee satisfaction with ease of use.
MEDIUM. Exact figures to be determined in Design phase. Effort investment with consultant to
determine the current process state. Moderate training, communication and adoption management
throughout Human Resources central and distributed.
Conduct a recruiting/hiring process improvement project without the assistance of an external
consultant.
General Time & Effort
Required
Prioritization
Title/Department
PROPOSAL OVERVIEW
(406) 994-5715
Phone
Primary Contact
ALIGNMENT
Data Support
Initiative Objectives
Departments Served
Service Providers
Service Users
Surveys Focus Groups Professional Expertise
<100 100-500 >500
Operational Efficiency Employee Satisfaction
HR CentralAgenciesAcademic Depts
University Comm
Fin & Acct Central
Sponsored ProgramsPurchasing CentralIT Central
Paper process
Staff capacity
Lack of integration Comm/Coord
Redundancy
Customer service
Staff expertise Allocation/prioritization Compensation
BPAs
HR Recruiting IT SupportPurchasing Web Dev & Content
Budget/Finance EPAFs/Payroll Employee Relations
Central/Dist model
IT Governance
Sponsored Programs
<100 100-500 >500
Cash Savings Incr. capacity

OpenMSU Initiative | Anne Milkovich, Recommendation Subcommittee Chair | 11/20/2012 Page 67 of 99
N:\Ac_RecSub\Report\FinalReportFiles\OpenMSU_RecommendationReport_Final_Response.docx
OpenMSU Objectives Addressed
Reduce cycle times- implement processes that are completed over a shorter period of time and take less service provider time.
Coordinate activities- implement processes that improve coordination between central and distributed service providers.
Increase capacity- implement processes that take less service provider time to create additional service provider capacity.
Improve service provider satisfaction- meet campus demand for improved recruiting/hiring processes.
Improve service customer satisfaction- meet campus demand for improved HR processes.
Supporting Data
In response to the OpenMSU Service Provider Survey:
o 23% of responses (105 comments) commented that recruiting/hiring was an activity that took significantly longer than it should at MSU. This was the most comments for any activity in response to this question.
o 12% of responses (45 comments) commented that recruiting/hiring was the process most critical to change and/or streamline at MSU. This was tied (with BPA) for the most comments for any process in response to this question.
o 5% of responses (18 comments) commented that HR processes overall were the processes most critical to change and/or streamline at MSU. This was the fourth most comments for any process in response to this question.
In response to the OpenMSU Service Customer Survey, 28 out of 80 process overall themed comments (processes take too long, too difficult, duplicate effort, paper/manual) were about the HR function.
The University of California, San Diego’s benchmark for its average cycle time for “# Days Positions are Open until Hiring Offer is extend (work days)” is about 61 days. For FY 2011, MSU’s combined average # days to offer (for classified staff) or hire (for faculty and professional staff) was about 66 days.
Detailed Problem Statement
According to the OpenMSU surveys, there is significant campus demand for improved recruiting/hiring processes. Eight out of twelve units participating in OpenMSU focus groups commented on recruiting/hiring processes as needing improvement. Detailed Solution Statement
Assign a project team of stakeholders, including central and distributed service providers, to work with an external consultant to analyze and improve recruiting and hiring processes from classification through onboarding. An external consultant is recommended because HR processes are inherently complex and because MSU does not currently have the staff capacity or expertise to adequately redesign HR processes. Although purchase and implementation of applicant tracking software is currently underway that should improve recruiting/hiring processes, technology enhancements must be accompanied by process improvements to be effective. According to Bill Gates, founder of Microsoft, “The first rule of any technology used in a business is that automation applied to an efficient operation will magnify the efficiency. The second is that automation applied to an inefficient operation will magnify the inefficiency.” Alternative Solution
Conduct a recruiting/hiring process improvement project without the assistance of an external consultant.

OpenMSU Initiative | Anne Milkovich, Recommendation Subcommittee Chair | 11/20/2012 Page 68 of 99
N:\Ac_RecSub\Report\FinalReportFiles\OpenMSU_RecommendationReport_Final_Response.docx
COST-BENEFIT SUMMARY
DISCLAIMER: Conceptual cost-benefit analysis with an order of magnitude estimation range between -50% to +100%.
Applicable
(Y, N
Probable,
Possible)
Increased Revenue N
Materials Savings N
Increased Labor Time & Effort (T&E) Capacity Probable
Increased Distributed T&E Capacity
Reduced Central T&E Capacity
1
2
3
4
5
Applicable
(Y, N
Probable,
Possible)
Upfront Real Costs
Hardware Purchase N
Software Purchase N
Consulting Services Y
Other: Possible
Upfront T&E Costs
Functional
Project Management Y
Business Analysis Y
Training Y
Other:
Technical
Development & Implementation N
Other: Possible
Ongoing Annual Real Costs
Licensing N
Other: N
Ongoing Annual T&E Costs
Systems Maintenance N
Other: N
Implement processes that are completed over a shorter period of time and take less service
provider time. The University of California, San Diego’s benchmark for its average cycle time for
“# Days Positions are Open until Hiring Offer is extend (work days)” is about 61 days. For FY
2011, MSU’s combined average # days to offer (for classified staff) or hire (for faculty and
professional staff) was about 66 days. Based on that benchmark, it appears MSU has room for
improvement.
Implement processes that improve coordination between central and distributed service providers.
Improve service provider satisfaction
Improve service customer satisfaction
Increase capacity
Reduce cycle times
Additional Info
QUANTITATIVE BENEFITS
HR Process Improvement: Recruiting/Hiring
Estimated as-is central time could not be obtained and estimated percentage reduction to result
from process improvement is unknown.
OpenMSU Functional Activity Analysis preliminary results estimate the following as-is distributed
time: 349 new employees (from searches) per year and about 28 hours hands-on time per new
employee, resulting in total annual time of about 9,772 hours or the equivalent of about 5 FTE.
The estimated percentage reduction to result from process improvement is unknown.
1
2
QUALITATIVE BENEFITS
Additional Info
40 hours at $180/hour
Additional Info
COSTS
Benefit
Coordinate activities
Meet campus demand for improved recruiting/hiring processes.
Meet campus demand for improved HR processes.
Implement processes that take less service provider time to create additional service provider
capacity.
40 hours of time to train HR Office employees on new process.
Two weeks of business analysis time.
Three weeks of a project managers time.

OpenMSU Initiative | Anne Milkovich, Recommendation Subcommittee Chair | 11/20/2012 Page 69 of 99
N:\Ac_RecSub\Report\FinalReportFiles\OpenMSU_RecommendationReport_Final_Response.docx
DISCLAIMER: Conceptual cost-benefit analysis with an order of magnitude estimate range between -50% to +100%.
Rate/Hr Hrs/Wk Year 1 1 Year 2 Year 3 Year 4 Year 5 Totals
$0
$0
Increased Distributed T&E Capacity $26 $0 $0 $0 $0 $0 $0
Increased Central T&E Capacity $24 $0 $0 $0 $0 $0 $0
$0 $0 $0 $0 $0 $0
$0 $0 $0 $0 $0 $0
$0 $0 $0 $0 $0 $0
Rate/Hr Total Hrs Year 1 1 Year 2 Year 3 Year 4 Year 5 Totals
$0
$0
($7,200) ($7,200)
$0
Project Management 3 $38 120 ($4,560) ($4,560)
Business Analysis 3 $38 80 ($3,040) ($3,040)
Training 4 $26 40 ($1,040) ($1,040)
Other: $0 $0
Development & Implementation $0 $0
Other: $0 $0
Licensing $0 $0 $0 $0 $0 $0
Other: $0 $0 $0 $0 $0 $0
Systems Maintenance $0 $0 $0 $0 $0 $0
Other: $0 $0 $0 $0 $0 $0
Totals ($15,840) $0 $0 $0 $0 ($15,840)
Upfront Real Costs
Upfront T&E Costs 2
1
2
3
4
Increased Revenue
Materials Savings
Increased Labor Time & Effort (T&E) Capacity 2
Totals
Functional
Consulting Services (input individual years)
HR Process Improvement: Recruiting/Hiring COST-BENEFIT CASH FLOW
QUANTITATIVE BENEFITS
COSTS
Assumptions:1 Assumes a 6 month project process.2 Assumes a 3% T&E increase per year for existing employees for increased salary and benefits costs as determined by the MSU Budget Office.3 Total hours are extrapolated from SunGuard Higher Education electronic document management and workflow proposal in 2009. Hourly rate is based on Banner Module Team
Leader rate and includes 35% benefits.4 Total hours are extrapolated from SunGuard Higher Education electronic document management and workflow proposal in 2009. Hourly rate is extrapolated from OpenMSU
service provider sample hourly rates and includes 35% benefits.
Ongoing Annual Real Costs
Ongoing Annual T&E Costs 2
Hardware Purchase (input individual years)
Software Purchase (input individual years)
Technical
Other (input individual years)

OpenMSU Initiative | Anne Milkovich, Recommendation Subcommittee Chair | 11/20/2012 Page 70 of 99
N:\Ac_RecSub\Report\FinalReportFiles\OpenMSU_RecommendationReport_Final_Response.docx
Year Annual Costs Annual Benefits Overall Cash Flow
1 ($15,840) $0 ($15,840)
2 $0 $0 ($15,840)
3 $0 $0 ($15,840)
4 $0 $0 ($15,840)
5 $0 $0 ($15,840)
Totals ($15,840) $0 ($15,840)
DISCOUNT RATE (%) : 5%
NET PV: ($15,085.71)
IRR: #NUM!
Break-Even Point =
In the following ratio formula, use the Annual and Overall Cash Flow values from the Break-Even Year, which is the first
year that Annual Cash Flow is a positive number.
Annual Cash Flow - Overall Cash Flow
Annual Cash Flow
Break-Even Year - 1 + Break Even Ratio
Break-Even Ratio =
HR Process Improvement: Recruiting/Hiring COST-BENEFIT BOTTOM LINE
DISCLAIMER: Conceptual cost-benefit analysis with an order of magnitude estimate range between -50% to
+100%.
Net PV (Net Present Value)
The purpose of Break-Even Analysis is to discover when the project will pay for itself. The break even point can be
calculated using the Break-Even Ratio followed by the Break Even Point Formulas.
PERFORMANCE ANALYSIS (Values in this section reflect End of Period)
$0
($15,840)
($15,840)
$0
$0
$0
Annual Cash Flow
SUMMARY
Calculation of the net present value of the project (or investment) is based on Annual Cash Flows and the above stated
Discount Rate. The net present value of an investment is today's value of each Annual Cash Flow (Annual Cost -
Annual Benefit), summed.
IRR (Internal Rate of Return)
IRR is the internal rate of return based on the Annnual Cash Flow. IRR requires an initial investment (negative value).
So, if the project pays for itself before the end of the first year, the IRR cannot be calculated (without a negative value
representing the initial investment). If all of the Annual Cash Flows are positive numbers (no apparent initial
investment), an error will result (i.e., #NUM!).
Break-Even Analysis

OpenMSU Initiative | Anne Milkovich, Recommendation Subcommittee Chair | 11/20/2012 Page 71 of 99
N:\Ac_RecSub\Report\FinalReportFiles\OpenMSU_RecommendationReport_Final_Response.docx
Purchasing
35% 70% 55%
OpenMSU Proposal
STAGEPurchasing Process Improvement
DISCLAIMER: This solution requires minimal time and effort by staff, cost-benefit analysis was not conducted.
-$
Constituents Served
Processes / Services
Addressed
Problems Addressed
Proposed Solution
Hold a purchasing summit to collaborate on purchasing processes and organizational structure,
including appropriate level of support staff. Implement electronic workflow processes to alleviate
paper-based delays. Implement more collaborative shared purchasing contracts.
Key Performance
Indicators or
Outcome Measures
Benefits
Ongoing Annual T&E Cost
COST-EFFECTIVENESS
Ongoing Annual Cost -$
Estimated New Net -$
-$ Upfront Real Cost Upfront T&E Cost-$
*Probability of changing the state law is low, but the probability of improving the process to people's satisfaction (along with
education of compliance laws) is fairly high.
**Probability of success is dependent on leadership commitment & being fully resourced.
Alignment Rating Cost-Effectiveness Rating Probability of Success Rating
COMMENTS AND RECOMMENDATIONS
Alternative Solutions
Problem Statement
The OpenMSU Service Provider Survey indicates dissatisfaction with purchases that flow through the
central office in 3 categories: paper-based systems; compliance-driven rather than value-add;
personnel issues. A 100% turnover presents an opportunity to address both process and
organizational issues.
Brian O'Connor
Purchasing Director
SMALL-MEDIUM. Dependent on Doc Mgt and Workflow. Exact figures to be determined upon
Concept clearance. Moderate implementation and training on new software. Limited communication
and adoption management within the Purchasing Department and distributed purchasing on
campus.
Hire an external consultant to evaluate processes and recommend solutions.
Reduced time to approve a purchase
Employee satisfaction with ease of use
Increased savings from collaborative purchasing.
General Time & Effort
Required
Prioritization
Title/Department
PROPOSAL OVERVIEW
(406) 994-5016
Phone
Primary Contact
ALIGNMENT
Data Support
Initiative Objectives
Departments Served
Service Providers
Service Users
Surveys Focus Groups Professional Expertise
<100 100-500 >500
Operational Efficiency Employee Satisfaction
HR CentralAgenciesAcademic Depts
University Comm
Fin & Acct Central
Sponsored ProgramsPurchasing CentralIT Central
Paper process
Staff capacity
Lack of integration Comm/Coord
Redundancy
Customer service
Staff expertise Allocation/prioritization Compensation
BPAs
HR Recruiting IT SupportPurchasing Web Dev & Content
Budget/Finance EPAFs/Payroll Employee Relations
Central/Dist model
IT Governance
Sponsored Programs
<100 100-500 >500
Cash Savings Incr. capacity

OpenMSU Initiative | Anne Milkovich, Recommendation Subcommittee Chair | 11/20/2012 Page 72 of 99
N:\Ac_RecSub\Report\FinalReportFiles\OpenMSU_RecommendationReport_Final_Response.docx
OpenMSU Objectives Addressed
Reduce cycle times- reduce time for purchasing processes.
Coordinate activities- implement processes that improve coordination between central and distributed service providers.
Increase capacity- implement processes that take less service provider time to create additional service provider capacity.
Improve service provider satisfaction- meet campus demand for improved purchasing processes.
Improve service customer satisfaction- meet campus demand for improved purchasing processes.
Supporting Data
In response to the OpenMSU Service Provider Survey:
o 7% of responses (32 comments) commented that purchasing processes were activities that took significantly longer than they should at MSU. This was the third most comments for any activity in response to this question.
o 4% of responses (15 comments) commented that purchasing processes were the most critical processes to change and/or streamline at MSU. This was the fifth most comments for any process in response to this question.
In response to the OpenMSU Service Customer Survey, 21 out of 80 process overall (take too long, too difficult, duplicate effort, paper/manual) themed comments were about the purchasing function.
Purchasing at MSU is fragmented across about 11,400 vendors with spending of about $8,800 per vendor. According to UC Berkeley’s Operational Excellence Diagnostic Report, an external benchmark for university purchasing functions is 6,000 vendors with spending of about $140,000 per vendor.
Detailed Problem Statement
According to the OpenMSU surveys, there is significant campus demand for improved purchasing processes. There are two separate and distinct avenues for purchasing at MSU—those purchases that need to be approved by the central Purchasing Department and those that do not. Concerns voiced by in the OpenMSU Service Provider Survey indicate dissatisfaction with purchases that flow through the central office in three main areas:
Paper-based systems that lend themselves to version control issues, lost paperwork, lack of timeliness and inefficiency in general.
The Purchasing Departments is perceived as only a compliance office instead of a value-added office because of state guidelines that do not always align with the goals that MSU is looking to achieve.
Personnel and staffing issues, including difficulty interpreting varying levels of regulation (state law, policy, procedure, and preference).
100% turnover in Purchasing Department staff presents the opportunity for a fresh perspective. Furthermore, the large number of vendors that MSU uses (as can be seen in the supporting data section) is due to the decentralized nature of purchasing at MSU and is beyond the control of the Purchasing Department. This large number of vendors leads to inefficiencies such as time spent by MSU employees shopping for commonly purchased goods from multiple vendors and missed opportunities for university-wide, best priced strategic vendor contracts. Detailed Solution Statement
Assign a cross-functional project team to assess and design new purchasing processes, prior to investigating opportunities for more university-wide strategic purchasing.

OpenMSU Initiative | Anne Milkovich, Recommendation Subcommittee Chair | 11/20/2012 Page 73 of 99
N:\Ac_RecSub\Report\FinalReportFiles\OpenMSU_RecommendationReport_Final_Response.docx
Hold a purchasing summit to better identify the concerns of campus and collaborate on new purchasing processes and organizational structure, including appropriate level of support staff.
Implement electronic workflow processes to alleviate delays caused by paper-based processes.
Investigate a purchasing workflow module or alternative software to support the process.
As a secondary phase, investigate more university-wide strategic purchasing to decrease the number of vendors used for similar purchases through tactics such as making better use of purchasing cooperatives and master contracts.
Alternative solutions
Implement an e-procurement solution such as SciQuest prior to process evaluation. Emory University has realized a 6-to-1 return on its investment in SciQuest’s procurement automation software. It found that of the savings realized, approximately 45% was driven from process efficiencies and 55% from negotiated discounts and contract compliance.
Other ideas for improving purchasing can be found on the UC Berkeley Operational Excellence site at: http://oe.berkeley.edu/dpreports/documents/P_BusCase_050211_v11.pdf
Cost-Benefit Analysis
A cost-benefit analysis was not conducted for the primary solution because the project is less defined and therefore not quantifiable. The primary solution involves minimal time and effort of purchasing staff both central and distributed. A cost-benefit analysis was conducted for the secondary phase e-procurement solution.

OpenMSU Initiative | Anne Milkovich, Recommendation Subcommittee Chair | 11/20/2012 Page 74 of 99
N:\Ac_RecSub\Report\FinalReportFiles\OpenMSU_RecommendationReport_Final_Response.docx
COST-BENEFIT SUMMARY
DISCLAIMER: Conceptual cost-benefit analysis with an order of magnitude estimate range between -50% to +100%.
Applicable
(Y, N
Probable,
Possible)
Increased Revenue N
Materials Savings Possible
Labor Time & Effort (T&E) Savings Possible
Reduced Distributed T&E
Reduced Central T&E
1
2
3
4
5
Applicable
(Y, N
Probable,
Possible)
Upfront Real Costs
Hardware Purchase Possible
Software Purchase Possible
Consulting Services Y
Other:
Upfront T&E Costs
Functional
Project Management Probable
Business Analysis Probable
Training Probable
Other:
Technical
Development & Implementation Possible
Other:
Ongoing Annual Real Costs
Licensing Y
Other: N
Ongoing Annual T&E Costs
Systems Maintenance Possible
Other:
Reduce time for purchasing processes.
Implement processes that improve coordination between central and distributed service
providers.
Improve service provider satisfaction
Improve service customer satisfaction
Increase capacity
Reduce cycle times
1
2
Additional Info
QUANTITATIVE BENEFITS
Purchasing Process Improvement: e-Procurement
2% most conservative estimate in e-procurement industry relevant publications located.
2% most conservative estimate in e-procurement industry relevant publications located.
Paper, toner, ink. Storage space. Not yet quantifiable.
QUALITATIVE BENEFITS
Additional Info
Depends on e-procurement solution type (e.g., software as a service). Not yet quantifiable.
Depends on e-procurement solution type (e.g., software as a service). Not yet quantifiable.
Additional Info
COSTS
Benefit
Coordinate activities
Meet campus demand for improved purchasing processes.
Meet campus demand for improved purchasing processes.
Implement processes that take less service provider time to create additional service provider
capacity.
Depends on e-procurement solution type (e.g., software as a service). Not yet quantifiable.
Not yet quantifiable.
Not yet quantifiable.
Not yet quantifiable.
Depends on e-procurement solution type (e.g., software as a service). Not yet quantifiable.

OpenMSU Initiative | Anne Milkovich, Recommendation Subcommittee Chair | 11/20/2012 Page 75 of 99
N:\Ac_RecSub\Report\FinalReportFiles\OpenMSU_RecommendationReport_Final_Response.docx
DISCLAIMER: Conceptual cost-benefit analysis with an order of magnitude estimation range between -50% to +100%.
Rate/Hr Hrs/Wk Year 1 1 Year 2 Year 3 Year 4 Year 5 Totals
$0
$0
$304,819 $303,897 $302,978 $302,062 $301,149 $1,514,906
Distributed T&E 4 $26 0.46 $313 $645 $664 $684 $704 $3,010
Central T&E 5 $31 2 $1,934 $3,984 $4,103 $4,226 $4,353 $18,601
$0 $0 $0 $0 $0 $0
$0 $0 $0 $0 $0 $0
$307,066 $308,526 $307,746 $306,973 $306,206 $1,536,517
Rate/Hr Total Hrs Year 1 1 Year 2 Year 3 Year 4 Year 5 Totals
$0
$0
($176,000) ($176,000)
$0
Project Management $0 $0
Business Analysis $0 $0
Training $0 $0
Other: $0 $0
Development & Implementation $0 $0
Other: $0 $0
Licensing6 $145,000 1 ($72,500) ($145,000) ($145,000) ($145,000) ($145,000) ($652,500)
Other: $0 $0 $0 $0 $0 $0
Systems Maintenance $0 $0 $0 $0 $0 $0
Other: $0 $0 $0 $0 $0 $0
Totals ($248,500) ($145,000) ($145,000) ($145,000) ($145,000) ($828,500)
Upfront Real Costs6
Upfront T&E Costs 2
1
2
3
4
Increased Revenue
Materials Savings
Time & Effort (T&E) Capacity Increase 2
Totals
Functional
Consulting Services (input individual years)
Purchasing Process Improvement: e-Procurement COST-BENEFIT CASH FLOW
QUANTITATIVE BENEFITS
COSTS
Product Cost Savings 3
Assumptions:1 Assumes a 6 month Project Process.2 Assumes a 3% T&E increase per year for existing employees for increased salary and benefits costs as determined by the MSU Budget Office.3 Extrapolated as a percentage of purchasing dollar volume. Assumes a 4.8% cost reduction applied to 6.3% of total costs for FY11 in year one, continuing a similar
application to prior years in subsequent years. Total product costs are from a benchmarking analysis prepared for a recent MSU Responsible Purchasing project. Assumed
percentages were the most conservative in relevant industry publications located. ($304,819 = 4.8% X (6.3% X $100.8M)) 4 Hourly rate is extrapolated from OpenMSU service provider sample hourly rates. Hours per week are extrapolated from OpenMSU Functional Activity Analysis Unit Time
Estimates. Assumes a reduction percentage of 2% which was based on the most conservative rate in e-procurement industry relevant publications located.5 Hourly rate is extrapolated from average hourly rates for current MSU Purchasing Department personnel and includes 35% benefits. Hours per week are extrapolated from an
assumed reduction percentage of 2%, which was based on the most conservative rate in e-procurement industry relevant publications located.6 Costs are estimates provided by the University of Montana which recently implemented e-procurement. Costs listed above include all costs from that estimate.
Ongoing Annual Real Costs
Ongoing Annual T&E Costs 2
Hardware Purchase (input individual years)
Software Purchase (input individual years)
Technical
Other (input individual years)

OpenMSU Initiative | Anne Milkovich, Recommendation Subcommittee Chair | 11/20/2012 Page 76 of 99
N:\Ac_RecSub\Report\FinalReportFiles\OpenMSU_RecommendationReport_Final_Response.docx
Year Annual Costs Annual Benefits Overall Cash Flow
1 ($248,500) $307,066 $58,566
2 ($145,000) $308,526 $222,092
3 ($145,000) $307,746 $384,838
4 ($145,000) $306,973 $546,810
5 ($145,000) $306,206 $708,017
Totals ($828,500) $1,536,517 $708,017
DISCOUNT RATE (%) : 5%
NET PV: $604,250.67
IRR: 51%
Break-Even Point =
In the following ratio formula, use the Annual and Overall Cash Flow values from the Break-Even Year, which is the first
year that Annual Cash Flow is a positive number.
Annual Cash Flow - Overall Cash Flow
Annual Cash Flow
Annual Cash Flow
Break-Even Year - 1 + Break Even Ratio
Break-Even Ratio =
Net PV (Net Present Value)
Calculation of the net present value of the project (or investment) is based on Annual Cash Flows and the above stated
Discount Rate. The net present value of an investment is today's value of each Annual Cash Flow (Annual Cost -
Annual Benefit), summed.
IRR (Internal Rate of Return)
IRR is the internal rate of return based on the Annnual Cash Flow. IRR requires an initial investment (negative value).
So, if the project pays for itself before the end of the first year, the IRR cannot be calculated (without a negative value
representing the initial investment). If all of the Annual Cash Flows are positive numbers (no apparent initial
investment), an error will result (i.e., #NUM!).
Break-Even Analysis
SUMMARY
$708,017
$161,206
$161,973
$162,746
Purchasing Process Improvement: e-Procurement COST-BENEFIT BOTTOM LINE
DISCLAIMER: Conceptual cost-benefit analysis with an order of magnitude estimation range between -50%
to +100%.
The purpose of Break-Even Analysis is to discover when the project will pay for itself. The break even point can be
calculated using the Break-Even Ratio followed by the Break Even Point Formulas.
PERFORMANCE ANALYSIS (Values in this section reflect End of Period)
$163,526
$58,566

OpenMSU Initiative | Anne Milkovich, Recommendation Subcommittee Chair | 11/20/2012 Page 77 of 99
N:\Ac_RecSub\Report\FinalReportFiles\OpenMSU_RecommendationReport_Final_Response.docx
Shared Services Model
100% 10% 10%
OpenMSU Proposal
STAGEShared Services Model
110,000$
Constituents Served
Processes / Services
Addressed
Problems Addressed
Proposed Solution
Create an administrative shared services center in A&F to support interested smaller units, funded by
seed money and unit contributions. Build the center over time as attrition occurs and units opt in.
Integrate distributed functional specialists with central functional specialists by defining workflows,
roles and responsibilities to leverage their expertise, better load-balance across existing resources,
Key Performance
Indicators or
Outcome Measures
Benefits
Ongoing Annual T&E Cost
COST-EFFECTIVENESS
Ongoing Annual Cost -$
Estimated New Net (284,000)$
-$ Upfront Real Cost Upfront T&E Cost95,000$
*Probability of success is dependent on leadership commitment & being fully resourced as well as a formal customer service
program. THIS PROPOSAL IS PRIORITIZED CONTINGENT UPON: This solution is fundamental to other solutions just as EDMW
is. It will only work if carefully and correctly designed and planned. A project team must be assigned to investigate and design
this program carefully and thoroughly and report frequently to OpenMSU program management. This model needs to be
adapted to different unit needs and ensure the balance of embedded customer service and central expertise.
Alignment Rating Cost-Effectiveness Rating Probability of Success Rating
COMMENTS AND RECOMMENDATIONS
Alternative Solutions
Problem Statement
Administration is highly decentralized, with units independently covering a range of duplicate
functions. Unit-embedded functional support provides customer-centric knowledge at a cost of
inefficiencies and organizational risk. Distributed specialists are under-utilized by central offices.
Better balance can be achieved between centralized versus decentralized design.
Anne Milkovich
Recommendations Sub-Committee Chair
Reduced process cycle times Stable service provider satisfaction
Increased staff capacity Stable service user satisfaction
Improved allocation of services among units
Improved allocation of services among staff
VERY LARGE. Dependent on Doc Mgt Workflow for best success and ease of use, interdependent
with HR process improvements. Significant effort in development and implementation of the shared
services system pilot. Moderate training.
Implement a shared service center among multiple units without a reporting line to Administration
and Finance.
General Time & Effort
Required
Prioritization
Title/Department
PROPOSAL OVERVIEW
(406) 994-5715
Phone
Primary Contact
ALIGNMENT
Data Support
Initiative Objectives
Departments Served
Service Providers
Service Users
Surveys Focus Groups Professional Expertise
<100 100-500 >500
Operational Efficiency Employee Satisfaction
HR CentralAgenciesAcademic Depts
University Comm
Fin & Acct Central
Sponsored ProgramsPurchasing CentralIT Central
Paper process
Staff capacity
Lack of integration Comm/Coord
Redundancy
Customer service
Staff expertise Allocation/prioritization Compensation
BPAs
HR Recruiting IT SupportPurchasing Web Dev & Content
Budget/Finance EPAFs/Payroll Employee Relations
Central/Dist model
IT Governance
Sponsored Programs
<100 100-500 >500
Cash Savings Incr. capacity

OpenMSU Initiative | Anne Milkovich, Recommendation Subcommittee Chair | 11/20/2012 Page 78 of 99
N:\Ac_RecSub\Report\FinalReportFiles\OpenMSU_RecommendationReport_Final_Response.docx
OpenMSU Objectives Addressed
Increase capacity- through standardized processes, error reduction from greater specialization and reduction of transaction volume.
Reduce cycle times- standardize processes.
Coordinate activities- implement shared services with defined relationships to central functions to improve coordination between central and distributed service providers.
Improve allocation- share services to improve the allocation of services among MSU units.
Supporting Data
MSU-Bozeman has about 140 units supported by central and distributed service providers in different functional disciplines:
o Finance & accounting: about 130 total service providers with about 100 distributed (about 80%). o HR: about 30 total service providers with about 10 distributed (about 30%). o IT: about 140 total service providers with about 85 distributed (about 60%). o Administrative associates: Many of the about 190 service providers are providing finance &
accounting, HR and IT services.
Larger units have more specialized functional staff; however, many units have a small number of generalists providing a combination of finance & accounting, HR, IT, purchasing, sponsored program administration, Web development and content management services in addition to general administration and academic support (such as assistance with advising).
In response to the OpenMSU Service Provider Survey, the majority of respondents stated that they spend less than 50% of their time on any one function.
According to organizational management principles, different organizational designs have different strengths and weaknesses. An optimal fit exists between organizational design and business needs. Organizations evolve over time and may digress away from optimal fit, requiring conscious effort to refit the design to better support business needs. (Donaldson, Lex. 2001. The Contingency Theory of Organizations. Sage Publications, Inc.: Foundations for Organizational Science.)
A large land-grant university in the northwestern United States reported a significant decrease in routine errors from better trained, more specialized distributed staff. Centralized staff spent less time correcting and explaining and more time analyzing and directing (phone interview Spring of 2012). Other institutions report similar improvements with distributed shared services models.
Detailed Problem Statement
The MSU-Bozeman administrative organization has evolved into a highly decentralized structure, with units operating independently of each other covering a range of duplicate administrative functions. Unit-embedded functional support has the benefit of customer-centric knowledge at a cost of inefficiencies and organizational risk. Distributed specialist expertise could be leveraged to better support central offices. Better balance can be achieved between the trade-offs of centralized versus decentralized design. Administrative roles are not consistently allocated to units based on volume. For example, smaller units may not have the need for a full-time administrative person but employ one because the alternative would be to have faculty or academic staff performing administrative duties. To fill out the fulltime capacity, duties are performed by administrative staff that might be better performed by others. The result is an inequitable distribution of administrative staff across large and small units. Duplicating functions in each unit is inefficient for the institution overall. In smaller units, generalist staff must obtain more training to maintain the skills and knowledge necessary to cover a broader set of responsibilities. They perform many specialized tasks less frequently, with less expertise, and less efficiently than functional specialists. Functional services are fragmented across departments creating challenges with training, coordination, communication, equitable allocation and overwhelmed staff. Disparate software systems burden limited IT resources with duplication and prevent load sharing among functional staff. Lack of backup staff degrades service during absences and turnover and compounds risk.

OpenMSU Initiative | Anne Milkovich, Recommendation Subcommittee Chair | 11/20/2012 Page 79 of 99
N:\Ac_RecSub\Report\FinalReportFiles\OpenMSU_RecommendationReport_Final_Response.docx
In larger units, functional specialists have expertise that is often untapped by centralized departments. Lack of defined roles and collaboration between distributed specialists and centralized specialists causes duplication of effort. Additional specialized capacity is available that is not being leveraged, while limited capacity in the central offices causes bottlenecks and slow service. Finally, a highly decentralized approach to functional support creates operational and compliance risks for the campus. Work is developed in different ways to accomplish the same tasks without always following the same standards and protocols. Staff may be performing specialized functional tasks without proper oversight, they are often without peers to rely upon for consultation and support, best practices and lessons learned are not shared, and staff development is not fostered. Lack of backup during normal or unplanned absences creates both mission risks and delays in service provision. While a highly decentralized design is not optimal it has the advantage of customer-centric service and knowledge that would be lost in a fully centralized model. Generalist staff also report satisfaction with a variety of tasks to perform. For those reasons and for the practical lack of space, full centralization is not a good model for MSU but better balance can be achieved.
Detailed Solution Statement
Assign a project team of distributed and central stakeholders to build a Distributed Shared Services model based on best practices and lessons learned from other institutions:
Create an administrative shared services center in A&F to support smaller units currently interested in better coverage with more efficient use of funding for their vacant positions.
o Recruit a manager and 1-2 functional staff from internal or external candidates. o Build the shared services center over time as attrition occurs and units opt in. o Fund the center with initial seed money from A&F and from participating unit contributions at
lower cost than filling their vacancies independently.
Integrate distributed functional specialists with central functional specialists by defining workflows, roles and responsibilities to leverage their expertise, better load-balance across existing resources, and reduce the bottlenecks in central offices.
Alternative solutions
Implement a shared service center among multiple units without a reporting line to Administration and Finance.

OpenMSU Initiative | Anne Milkovich, Recommendation Subcommittee Chair | 11/20/2012 Page 80 of 99
N:\Ac_RecSub\Report\FinalReportFiles\OpenMSU_RecommendationReport_Final_Response.docx
COST-BENEFIT SUMMARY
DISCLAIMER: Hypothetical cost-benefit analysis. Estimates are only for demonstration purposes.
Applicable
(Y, N
Probable,
Possible)
Increased Revenue N
Materials Savings N
Labor Time & Effort (T&E) Savings
Reduced Distributed T&E Y
Reduced Central T&E N
1
2
2
3
Applicable
(Y, N
Probable,
Possible)
Upfront Real Costs
Hardware Purchase Y
Software Purchase Y
Furniture Purchase Y
Consulting Services N
Other:
Upfront T&E Costs
Functional
Project Management N
Business Analysis Possible
Training N
Other:
Technical
Development & Implementation Possible
Other:
Ongoing Annual Real Costs
Salaries & benefits: Director Y
Supplies, training & misc. opex Y
Office space Probable
Licensing N
Other:
Ongoing Annual T&E Costs
Salaries & benefits: Staff Possible
Systems Maintenance N
Other:
QUALITATIVE BENEFITS
Additional Info
Additional Info
QUANTITATIVE BENEFITS
Shared Services Center Pilot
Standardized processes. Error reduction from greater specialization. Reduction of
transaction volumes.1
2
Additional Info
COSTS
Benefit
Increase capacity through standardized processes, error reduction from greater
specialization and reduction of transaction volume.
Implement shared services with defined relationships to central functions to improve
coordination between central and distributed service providers.
Share services to improve the allocation of services among MSU units.
Increase capacity
Coordinate activities
Improve allocation
Reduce cycle times Standardize processes.
Not yet quantifiable
Not yet quantifiable
Administration & Finance Division new position
Not yet quantifiable
Ongoing costs would be shifting of current costs but not new costs.

OpenMSU Initiative | Anne Milkovich, Recommendation Subcommittee Chair | 11/20/2012 Page 81 of 99
N:\Ac_RecSub\Report\FinalReportFiles\OpenMSU_RecommendationReport_Final_Response.docx
Rate/Hr Hrs/Wk Year 1 1 Year 2 Year 3 Year 4 Year 5 Totals
$0
$0
Distributed T&E Capacity Increase 3 $26 32 $21,605 $44,506 $45,841 $47,216 $48,633 $207,800
$0 $0 $0 $0 $0 $0
$21,605 $44,506 $45,841 $47,216 $48,633 $207,800
Cost or
Cost/EeTotal Ees Year 1 1 Year 2 Year 3 Year 4 Year 5 Totals
$3,960 8 ($31,680) ($31,680)
$200 8 ($1,600) ($1,600)
Furniture Purchase (input individual years) 8 $1,250 8 ($10,000) ($10,000)
Project Management $0 $0
Business Analysis $0 $0
Training $0 $0
Other: $0 $0
Development & Implementation $0 $0
Other: $0 $0
Salaries & benefits: Director (new position) 4,2 $89,100 1 ($44,550) ($91,773) ($94,526) ($97,362) ($100,283) ($428,494)
Supplies, training & misc. opex 5 $14,000 ($7,000) ($14,000) ($14,000) ($14,000) ($14,000) ($63,000)
Office space9 $0 $0 $0 $0 $0 $0
Licensing $0 $0 $0 $0 $0 $0
Other: $0 $0 $0 $0 $0 $0
Systems Maintenance $0 $0 $0 $0 $0 $0
Other: $0 $0 $0 $0 $0 $0
Totals ($94,830) ($105,773) ($108,526) ($111,362) ($114,283) ($534,774)
Upfront Real Costs
1
2
Increased Revenue
Materials Savings
Totals
Functional
Upfront T&E Costs 2
Hardware Purchase (input individual years) 6
Software Purchase (input individual years) 7
Shared Services Center Pilot COST-BENEFIT CASH FLOW
QUANTITATIVE BENEFITS
COSTS
Labor Time & Effort (T&E) Capacity Increase 2
DISCLAIMER: Hypothetical cost-benefit analysis. Estimates are only for demonstration purposes.
Assumptions:1 Assumes a 6 month Project Process.2 Assumes a 3% T&E increase per year for existing employees for increased salary and benefits costs as determined by the MSU Budget Office.3 Hourly rate is extrapolated from OpenMSU service provider sample hourly rates (35% for benefits is included in the rate). Distributed T&E capacity hours/week increase is based on the
average workload (OpenMSU Functional Activity Analysis activity volumes and average estimated times per activity) for MSU's seven original colleges for the following activities ( Selected
activities are based on a NACUBO shared services webinar):
• Finance & Accounting: index monthly reconciliation (and corrections) and accounts payable by Banner Payment Authorization (BPA)
• HR: new hire forms and orientation, international hire employability verification, timesheet monitoring and Electronic Personnel Action Form (EPAF) processing
• Sponsored Programs Administration: monitoring compliance with sponsoring agency requirements, managing subawards, managing cost sharing and managing participant support.
The time for this average workload correlates to eight FTE. The Educational Advisory Board's "Making the Case for Shared Services" states that shared services typically result in cost
reductions of 10-30%. Distributed T&E capacity increase is based on a 10% reduction in the time currently needed to conduct the activities listed above.4 Educational Advisory Board Director of Shared Service Job Description range of $66,000-$112,000. Assumed low end of range plus 35% for benefit costs.5 Based on a small (3.5 FTE) MSU unit: 62100 ($1,400), 62225 ($250), 62290 ($3,500), 62300 ($1,500), 62400 ($2,000) and 62800 ($7,000), rounded to the nearest thousand.6 IT Store hardware pricing (10/3/12) for a Performance System with 22" Professional Display ($1,075) and a second 22" Professional Display ($187) for a total of 1,260/ee.
HP LaserJet Enterprise 500 color MFP M575f printer/scanner for $2,700.7 IT Store software pricing (10/5/12) for Acrobat X Pro ($75), Office 2012 ($55) and Visio Premium 2010 ($69), rounded to nearest hundred.8 Desk and chair cost based on recent actual purchase by two MSU departments.9 Costs were not assigned for office space, however, space resources should be considered.
Ongoing Annual T&E Costs 2
Ongoing Annual Real Costs
Technical

OpenMSU Initiative | Anne Milkovich, Recommendation Subcommittee Chair | 11/20/2012 Page 82 of 99
N:\Ac_RecSub\Report\FinalReportFiles\OpenMSU_RecommendationReport_Final_Response.docx
Year Annual Costs Annual Benefits Overall Cash Flow
1 ($94,830) $21,605 ($73,225)
2 ($105,773) $44,506 ($134,493)
3 ($108,526) $45,841 ($197,178)
4 ($111,362) $47,216 ($261,324)
5 ($114,283) $48,633 ($326,974)
Totals ($534,774) $207,800 ($326,974)
DISCOUNT RATE (%) : 5%
NET PV: ($283,671.10)
IRR: N/A for neg return
Break-Even Point =
In the following ratio formula, use the Annual and Overall Cash Flow values from the Break-Even Year, which is the first
year that Annual Cash Flow is a positive number.
Annual Cash Flow - Overall Cash Flow
Annual Cash Flow
Annual Cash Flow
Break-Even Year - 1 + Break Even Ratio
Break-Even Ratio =
Net PV (Net Present Value)
Calculation of the net present value of the project (or investment) is based on Annual Cash Flows and the above stated
Discount Rate. The net present value of an investment is today's value of each Annual Cash Flow (Annual Cost -
Annual Benefit), summed.
IRR (Internal Rate of Return)
IRR is the internal rate of return based on the Annnual Cash Flow. IRR requires an initial investment (negative value).
So, if the project pays for itself before the end of the first year, the IRR cannot be calculated (without a negative value
representing the initial investment). If all of the Annual Cash Flows are positive numbers (no apparent initial
investment), an error will result (i.e., #NUM!).
Break-Even Analysis
SUMMARY
($326,974)
($65,650)
($64,146)
($62,685)
Shared Services Center Pilot COST-BENEFIT BOTTOM LINE
The purpose of Break-Even Analysis is to discover when the project will pay for itself. The break even point can be
calculated using the Break-Even Ratio followed by the Break Even Point Formulas.
PERFORMANCE ANALYSIS (Values in this section reflect End of Period)
($61,267)
($73,225)
DISCLAIMER: Hypothetical cost-benefit analysis. Estimates are only for demonstration purposes.

OpenMSU Initiative | Anne Milkovich, Recommendation Subcommittee Chair | 11/20/2012 Page 83 of 99
N:\Ac_RecSub\Report\FinalReportFiles\OpenMSU_RecommendationReport_Final_Response.docx
Service Provider Development
80% 80% 70%
ALIGNMENT
Data Support
Initiative Objectives
Departments Served
Prioritization
Title/Department
PROPOSAL OVERVIEW
Email [email protected]
Phone
Primary Contact
Alternative Solutions
Problem Statement
MSU does not have a means to ensure that service providers are getting the training they need, to
track that training has been received, to assess that the right training is being provided or to ensure
it is of adequate quality. Minimal training is provided by some functional areas. Few programs are
available to support a high-performance culture, such as training in unit performance management.
Dennis DeFa
Chief Human Resource Officer
Employee satisfaction with quality and quantity of training
Availability of training records
LARGE. No known dependencies. Exact figures undetermined. Significant development of a
Professional Development and Training organization within the HR Office. Moderate communication
and adoption management across campus. Limited maintenance.
1. Establish an administrative council of central and distributed staff to guide operations such as
training, staffing, standardized processes.
2. Create a university-wide database to publish available training and track completion.
General Time & Effort
Required
*Probability of success is dependent on leadership commitment & being fully resourced. This solution proposes that a project
team be assigned to assist in shaping the development of the training program for service providers and is therefore low cost,
high cost-effectiveness. Probability of success is dependent on collaboration between project/advisory team and training
organization in HR. Assuming full commitment of HR, probability of success is high.
Alignment Rating Cost-Effectiveness Rating Probability of Success Rating
COMMENTS AND RECOMMENDATIONS
Benefits
Ongoing Annual T&E Cost
COST-EFFECTIVENESS
Ongoing Annual Cost -$
Estimated New Net -$
-$ Upfront Real Cost Upfront T&E Cost-$
OpenMSU Proposal
STAGEService Provider Development
A cost-benefit analysis was not conducted because the project is less defined and therefore not easily quantifiable.
-$
Constituents Served
Processes / Services
Addressed
Problems Addressed
Proposed Solution
Assign a project team to assist in the development of the training program currently underway in the
HR Office as it applies to OpenMSU service providers in finance, accounting, HR, IT, purchasing,
sponsored programs, Web development, content management.
Key Performance
Indicators or
Outcome Measures
Service Providers
Service Users
Surveys Focus Groups Professional Expertise
<100 100-500 >500
Operational Efficiency Employee Satisfaction
HR CentralAgenciesAcademic Depts
University Comm
Fin & Acct Central
Sponsored ProgramsPurchasing CentralIT Central
Paper process
Staff capacity
Lack of integration Comm/Coord
Redundancy
Customer service
Staff expertise Allocation/prioritization Compensation
BPAs
HR Recruiting IT SupportPurchasing Web Dev & Content
Budget/Finance EPAFs/Payroll Employee Relations
Central/Dist model
IT Governance
Sponsored Programs
<100 100-500 >500
Cash Savings Incr. capacity

OpenMSU Initiative | Anne Milkovich, Recommendation Subcommittee Chair | 11/20/2012 Page 84 of 99
N:\Ac_RecSub\Report\FinalReportFiles\OpenMSU_RecommendationReport_Final_Response.docx
OpenMSU Objectives Addressed
Enhance service provider development Supporting Data
In response to the OpenMSU Service Provider Survey, there were 79 training themed comments, placing training in the top two of comment theme areas for this survey.
Detailed Problem Statement
MSU does not have a means to ensure that service providers are getting the training they need, to track that training has been received, to assess that the right training is being provided or to ensure it is of adequate quality. Although some departments (UBS, Purchasing and OSP) regularly provide training on performing duties within their functions to distributed service providers, much of it is only provided a few times of year, and no training is provided to campus providers for some functions (such as for Web development and content management). Also, there are few training and professional development programs available that would support a high-performance culture, such as training in performance management and in using metrics to manage unit performance.
Detailed Solution Statement
Implement a Professional Development and Training organization as part of the HR Office as proposed by the Chief Human Resources Officer. Assign a project team to assist in the development of this organization as it would apply to service providers for OpenMSU functions (finance & accounting, HR, IT, purchasing, sponsored programs administration and Web development and content management).
Alternative solutions
Establish an administrative council composed of central and distributed staff to guide university-wide administrative operations such as:
Ensuring that service providers are adequately and equitably compensated and that appropriate staffing levels are maintained,
Ensuring that development and training of service providers is effective,
Standardizing administrative processes and technologies (including whether processes should be conducted by central or distributed service providers), and
Responding to emerging regulations that affect administrative practices.
Other ideas for improving training and professional development and instituting a high-performance culture can be found on the UC Berkeley Operational Excellence site at: http://oe.berkeley.edu/dpreports/documents/H_TargetedTalentDev_ResReqwithwatermark.pdf.
Cost-Benefit Analysis
A cost-benefit analysis was not conducted because the project is less defined and therefore not easily quantifiable.

OpenMSU Initiative | Anne Milkovich, Recommendation Subcommittee Chair | 11/20/2012 Page 85 of 99
N:\Ac_RecSub\Report\FinalReportFiles\OpenMSU_RecommendationReport_Final_Response.docx
Service Provider Staffing and Turnover
100% 100% 5%
ALIGNMENT
Data Support
Initiative Objectives
Departments Served
Problem Statement
According to CUPA and O*net benchmarks, MSU staff are significantly underpaid. Central and
distributed administrative functions experience high rates of turnover because of issues such as low
pay and heavy workloads. High turnover costs the institution time and effort in training new hires and
adversely affects customer satisfaction and efficiency.
Anne Milkovich
Recommendations Sub-Committee Chair
Prioritization
Title/Department
PROPOSAL OVERVIEW
(406) 994-5715
Phone
Primary Contact
Proposed Solution
Assign a project team of qualified staff working with external consultants as needed to develop a long-
range staffing plan for functional areas across the university, including a classification and
compensation review with researched salary information to verify or establish new norms for salary
basis consistent with the goals of the MSU strategic plan.
-$
Key Performance
Indicators or
Outcome Measures
Upfront Real Cost Upfront T&E Cost-$
Alternative Solutions
Central functions staffed at average levels in comparison to benchmarks
Reduced turnover
Increases service provider job satisfaction
MEDIUM. Exact figures to be determined in Design phase. Time and effort of project team with
external consultant costs as needed.
Establish an administrative council of central and distributed staff to guide operations such as
training, staffing, standardized processes.
General Time & Effort
Required
*Probability of success is dependent on leadership commitment & being fully resourced.
Alignment Rating Cost-Effectiveness Rating Probability of Success Rating
COMMENTS AND RECOMMENDATIONS
Estimated New Net -$
A cost-benefit analysis was not conducted because the project is less defined and therefore not easily quantifiable.
OpenMSU Proposal
STAGEService Provider Staffing & Turnover
Benefits
Ongoing Annual T&E Cost
COST-EFFECTIVENESS
Ongoing Annual Cost -$ -$
Constituents Served
Processes / Services
Addressed
Problems Addressed
Service Providers
Service Users
Surveys Focus Groups Professonal Expertise
<100 100-500 >500
Operational Efficiency Employee Satisfaction
HR CentralAgenciesAcademic Depts
University Comm
Fin & Acct Central
Sponsored ProgramsPurchasing CentralIT Central
Paper process
Staff capacity
Lack of integration Comm/Coord
Redundancy
Customer service
Staff expertise Allocation/prioritization Compensation
BPAs
HR Recruiting IT SupportPurchasing Web Dev & Content
Budget/Finance EPAFs/Payroll Employee Relations
Central/Dist model
IT Governance
Sponsored Programs
<100 100-500 >500
Cash Savings Incr. capacity

OpenMSU Initiative | Anne Milkovich, Recommendation Subcommittee Chair | 11/20/2012 Page 86 of 99
N:\Ac_RecSub\Report\FinalReportFiles\OpenMSU_RecommendationReport_Final_Response.docx
OpenMSU Objectives Addressed
Improve service provider satisfaction- address compensation and workload issues.
Improve service customer satisfaction- improve customer service through adequate staffing of experienced employees.
Improve allocation- improve allocation of services among MSU units by ensuring that central units, which serve all units, are adequately staffed with experienced employees. Improve allocation of workloads among service providers by ensuring that functions are adequately staffed.
Supporting Data
In comparison to the HR benchmarking metric used in UC Berkeley’s Operational Excellence Diagnostic Report, MSU-Bozeman’s Human Resources Office appears to be understaffed. MSU-Bozeman has 183 employees per HR Office employee while the average higher education institution has 127. Based on this metric, the HR Office would need to hire 9 additional employees to be staffed at the level of an average higher education institution. (Note that although the HR Office has 27 employees, payroll FTE is not typically included in this calculation. MSU’s HR Office has 6.5 FTE that are dedicated to payroll.)
Detailed Problem Statement
Administrative operations at MSU-Bozeman (MSU) are provided by a mix of central and distributed (unit-level) service providers. Some central functions, such as the HR Office, University Business Services and the Information Technology Center and administrative functions distributed in academic and other units experience high rates of turnover because of issues such as low pay and heavy workloads. According to CUPA and O*net benchmarks, MSU staff are significantly underpaid. Central functions provide services to the entire institution, and business processes that are initiated at the unit level often flow through to these central functions. Inadequate staffing levels and turnover negatively impact the efficiency and effectiveness of the institutions’ administrative operations. Turnover in distributed functions negatively impacts unit-level administrative operations because of time and effort associated with training new employees. Training new distributed service providers is challenging because of the breadth of knowledge needed and the lack of a mature training program for distributed service providers.
Detailed Solution Statement
Assign a project team of qualified staff working with external consultants as needed to develop a long-range staffing plan for functional areas across the university, including a classification and compensation review with researched salary information to verify or establish new norms for salary basis consistent with the goals of the MSU strategic plan.
Alternative solutions
Establish an administrative council composed of central and distributed staff to guide university-wide administrative operations such as:
Ensuring that service providers are adequately and equitably compensated and that appropriate staffing levels are maintained,
Ensuring that development and training of service providers is effective,
Standardizing administrative processes and technologies (including whether processes should be conducted by central or distributed service providers), and
Responding to emerging regulations that affect administrative practices.
Cost-Benefit Analysis
A cost-benefit analysis was not conducted because the project is less defined and therefore not easily quantifiable.

OpenMSU Initiative | Anne Milkovich, Recommendation Subcommittee Chair | 11/20/2012 Page 87 of 99
N:\Ac_RecSub\Report\FinalReportFiles\OpenMSU_RecommendationReport_Final_Response.docx
Administrator Evaluations (Open Forum Concept)
0% 0% 0%
Initiative Objectives
*
Constituents Served
*
Estimated New Net
COST-EFFECTIVENESS
Processes / Services
Addressed
Problems Addressed
Departments Served
Benefits
Upfront T&E Cost
-$
Key Performance
Indicators or
Outcome Measures
Upfront Real Cost
Ongoing Annual Cost Ongoing Annual T&E Cost
-$
-$ *
Alternative Solutions• Allow employees to provide feedback to upper level administration at annual open discussions
conducted by each individual unit.
ALIGNMENT
Data Support
Needs further development before clearing into Discovery, clarification of scope and intent.
Alignment Rating Cost-Effectiveness Rating Probability of Success Rating
COMMENTS AND RECOMMENDATIONS
(406) 994-5715
Phone
Primary Contact
Proposed Solution
A project team will regularly provide anonymous surveys of upper level administration to the
employees that work directly below them. This is especially important during an administrator's first
year in a new position. The evaluators will be encouraged to only provide positive feedback.
OpenMSU Proposal
STAGEUpper Administration Evaluation
Employee satisfaction with upper level administration
SMALL. No dependencies.
Exact figures to be determined upon Concept clearance. Low communication and adoption
management.
General Time & Effort
Required
Problem Statement
Faculty are regularly evaluated by their students. This allows faculty to identify improvement
opportunities and adjust their teaching style accordingly. Upper level administrators are only
evaluated by their supervisors, not those they supervise. Therefore, they do not have the opportunity
to adjust their administrative approach.
Anne Milkovich
Recommendations Sub-Committee Chair
Monitor
Title/Department
PROPOSAL OVERVIEW
Cash Savings Incr. Capacity
Service Providers
Service Users
Surveys Focus Groups Professional Expertise
<100 100-500 >500
Operational Efficiency Employee Satisfaction
HR CentralAgenciesAcademic Depts
University Comm
Fin & Acct Central
Sponsored ProgramsPurchasing CentralIT Central
Paper process
Staff capacity
Lack of integration Comm/Coord
Redundancy
Customer service
Staff expertise Allocation/prioritization Compensation
BPAs
HR Recruiting IT SupportPurchasing Web Dev & Content
Budget/Finance EPAFs/Payroll Employee Relations
Central/Dist model
IT Governance
Sponsored Programs
<100 100-500 >500

OpenMSU Initiative | Anne Milkovich, Recommendation Subcommittee Chair | 11/20/2012 Page 88 of 99
N:\Ac_RecSub\Report\FinalReportFiles\OpenMSU_RecommendationReport_Final_Response.docx
Financial Reporting Improvement (Open Forum Concept)
0% 0% 0%
Initiative Objectives
*
Constituents Served
*
Estimated New Net
COST-EFFECTIVENESS
Processes / Services
Addressed
Problems Addressed
Departments Served
Benefits
Upfront T&E Cost
-$
Key Performance
Indicators or
Outcome Measures
Upfront Real Cost
Ongoing Annual Cost Ongoing Annual T&E Cost
-$
-$ *
Alternative Solutions • Hire an external consultant to evaluate the current report web and develop potential improvements.
ALIGNMENT
Data Support
Needs further development before clearing into Discover, clarification of scope and intent.
Alignment Rating Cost-Effectiveness Rating Probability of Success Rating
COMMENTS AND RECOMMENDATIONS
(406) 994-5715
Phone
Primary Contact
Proposed Solution
A project team will select and implement a web-based ad-hoc reporting tool to replace SAIS. The
team will work directly with those who use SAIS to determine the best replacement tool and to
accommodate individual unit needs.
DISCLAIMER: Conceptual cost-benefit analysis with an estimation range between -30% to +50%.
OpenMSU Proposal
STAGEFinancial Reporting Process Improvement
Employee satisfaction with ease of use
MEDIUM. No dependencies.
Exact figures to be determined upon Concept clearance. Moderate training, communication and
adoption management.
General Time & Effort
Required
Problem StatementThe current report web, SAIS, is outdated. SAIS is also not user-friendly, which makes it difficult for
employees to perform their daily work.
Anne Milkovich
Recommendations Sub-Committee Chair
Monitor
Title/Department
PROPOSAL OVERVIEW
Cash Savings Incr. Capacity
Service Providers
Service Users
Surveys Focus Groups Professional Expertise
<100 100-500 >500
Operational Efficiency Employee Satisfaction
HR CentralAgenciesAcademic Depts
University Comm
Fin & Acct Central
Sponsored ProgramsPurchasing CentralIT Central
Paper process
Staff capacity
Lack of integration Comm/Coord
Redundancy
Customer service
Staff expertise Allocation/prioritization Compensation
BPAs
HR Recruiting IT SupportPurchasing Web Dev & Content
Budget/Finance EPAFs/Payroll Employee Relations
Central/Dist model
IT Governance
Sponsored Programs
<100 100-500 >500

OpenMSU Initiative | Anne Milkovich, Recommendation Subcommittee Chair | 11/20/2012 Page 89 of 99
N:\Ac_RecSub\Report\FinalReportFiles\OpenMSU_RecommendationReport_Final_Response.docx
Front-End Accounting System (Open Forum Concept)
Permanent Front End Accounting System
65% 0% 0%
OpenMSU Proposal
STAGE
DISCLAIMER: Conceptual cost-benefit analysis with an order of magnitude estimate range between -50% to +100%.
-$
Constituents Served
Processes / Services
Addressed
Problems Addressed
Proposed SolutionA project team will determine and implement a permanent front end accounting system that meets
the current needs of individual departments.
Key Performance
Indicators or
Outcome Measures
Alternative Solutions
Benefits
Ongoing Annual T&E Cost
COST-EFFECTIVENESS
Ongoing Annual Cost
Estimated New Net
Upfront Real Cost Upfront T&E Cost
* There is no cost-effectiveness or probability of success rating at this current time (11/02/12). Therefore, the recommendation
is to move this proposal into the Discovery phase
Alignment Rating Cost-Effectiveness Rating Probability of Success Rating
COMMENTS AND RECOMMENDATIONS
Problem Statement
CatBooks is currently the front end accounting system that almost all departments use to create
BPAs and reconcile their Banner accounts, not to mention provide reports to department heads,
deans, directors, and PIs. However, there are several departments who use alternative systems.
MSU needs a standard system that does all this and more.
Anne Milkovich
Recommendations Subcommittee
Discovery
Title/Department
PROPOSAL OVERVIEW
(406) 994-5715
Phone
Primary Contact
Employee satisfaction with ease of use
MEDIUM. No dependencies.
Exact figures to be determined upon Concept clearance. Moderate training, communication and
adoption management. Limited maintenance.
• Hire an external consultant to analyze the current accounting needs of departments and suggest a
system to implement.
General Time & Effort
Required
ALIGNMENT
Data Support
Initiative Objectives
Departments Served
Service Providers
Service Users
Surveys Focus Groups Professional Expertise
<100 100-500 >500
Operational Efficiency Employee Satisfaction
HR CentralAgenciesAcademic Depts
University Comm
Fin & Acct Central
Sponsored ProgramsPurchasing CentralIT Central
Paper process
Staff capacity
Lack of integration Comm/Coord
Redundancy
Customer service
Staff expertise Allocation/prioritization Compensation
BPAs
HR Recruiting IT SupportPurchasing Web Dev & Content
Budget/Finance EPAFs/Payroll Employee Relations
Central/Dist model
IT Governance
Sponsored Programs
<100 100-500 >500
Cash Savings Incr. capacity

OpenMSU Initiative | Anne Milkovich, Recommendation Subcommittee Chair | 11/20/2012 Page 90 of 99
N:\Ac_RecSub\Report\FinalReportFiles\OpenMSU_RecommendationReport_Final_Response.docx
Appendix I: Open Forum Feedback on Proposed Solutions
Proposed Solution Votes Tally
Proposed Solutions and
Alternatives Detail # Votes
BPA BPA Process Improvement 48
Customer Service
Customer Service Improvement
Disney Institute 53
Customer Service Alternative 1
Customer Service Different
Customer Training Program 11
Customer Service Alternative 2
Customer Service No Customer
Training Program 4
Elim Paper
Eliminate Paper-based Processes
(Electronic Doc Mgt Workflow) 119
HR Process Improvement - EPAF Electronic Personnel Action Form 73
HRPI-EPAF Alternative 2 HRPI-EPAF With Shared Services 10
HR Process Improvement -
Payroll
Payroll Process Improvement
with External Consultant 32
HRPI-Payroll Alternative 1
HRPI-Payroll No External
Consultant 46
HR Process Improvement -
Recruitment Hire
Recruitment and Hiring Process
Improvement 27
HRPI-RecHire Alternative 1
HRPI-RecHire No External
Consultant 53
Purchasing Purchasing Process Improvement 39
Purchasing Alternative 1
Purchasing Process Improvement
With Shared Services 1
Shared Services Model
Shared Services Model with
reporting line to A&F 31
Shared Services Alternative 1
Shared Services Model without
reporting line to A&F 10
Service Provider Development
Central department responsible
for service provider development 51
SP Development Alternative 1
SP Development with
Administrative Council 2
Service Provider Staffing and
Turnover
Evaluate and solve staffing,
salary, and turnover issues 80
SP-Staffing Turnover Alternative 1
Solve staffing, salary, turnover
with Administrative Council 5

OpenMSU Initiative | Anne Milkovich, Recommendation Subcommittee Chair | 11/20/2012 Page 91 of 99
N:\Ac_RecSub\Report\FinalReportFiles\OpenMSU_RecommendationReport_Final_Response.docx
Proposed Solution Votes Graph
0
20
40
60
80
100
120
140
Nu
mb
er
of
Vo
tes
Proposal Votes by Solution
Alternative 2
Alternative 1
Proposed Solution

OpenMSU Initiative | Anne Milkovich, Recommendation Subcommittee Chair | 11/20/2012 Page 92 of 99
N:\Ac_RecSub\Report\FinalReportFiles\OpenMSU_RecommendationReport_Final_Response.docx
Appendix J: Open Forum Comments
Below are comments on solutions and alternatives posted at the Open Forum. In some cases, participants added
stickers to the comment to indicate their vote for that comment. The number of votes cast for each comment is
included in parentheses.
BPA Process Improvement
● Making this process automated so it reduces the amount of data entry and thus errors will be great.
● Integrate CatBooks with Banner. (5 stickers)
● Permanent front end accounting system that does what CatBooks does and more.
● Sounds great, but short on details. Could CatBooks be utilized to help with this?
Creating a Culture of Customer Service
● I like this idea. I would like to learn more about it.
● Would everyone campus wide get to participate in this? I don't think this would solve the underlying problems.
● Give salary support to administrative staff.
● Do we pay people enough to expect good customer service? Are there negative consequences for bad customer service? (1 sticker)
● This needs to be encouraged for faculty, as well as staff.
● We need to address employees who've worked here forever with a bad attitude.
● Take a hard line on good customer service and replace employees.
● Expect customer service from faculty and all staff.
Eliminate Paper-Based Processes and Manual Processes
● Eliminate the multiple copies needed for travel, P-card and BPA processes. It's ridiculous. (1 sticker)
● All about less paper! Electronic.
● I am all for automation, but we'd need a system for checks and balances, like having authorizers similar to our EPAF system.
● Sounds good, but EPAF is an example of this and the EPAF is very difficult. Need to invest in a system that is user friendly.
● Love less paper. Hate having to do electronic work over again if one little error occurs.
● Reduce rework (e.g., Doing task over if error is found)! (1 sticker)
HR Process Improvement: EPAF
● Emails when an EPAF is returned! It should be an automatic thing! (1 sticker)
● Tired of "babysitting" EPAFs between the time I submit them and when they get approved-send me a confirmation.
● Highlight boxes that need entry.
● EPAFs have helped ease paperwork and some time, but as it is still in its initial form. It would be good to see how it can be improved.

OpenMSU Initiative | Anne Milkovich, Recommendation Subcommittee Chair | 11/20/2012 Page 93 of 99
N:\Ac_RecSub\Report\FinalReportFiles\OpenMSU_RecommendationReport_Final_Response.docx
● EPAF is very had for "occasional" users. Not user friendly or intuitive. Professional EPAFs must be linked to LOAs in some manner.
● Like EPAF, but the turnover with HR takes way too long, especially if an error occurs.
● The EPAF system should automatically determine an approval queue based on the type of EPAF, the funding distribution and the department submitting the EPAF. Leaving it up to departments to determine creates multiple errors and do-overs.
● When there is an error on an EPAF, it has to go through the entire list of approvers again. It shouldn't need to be that way! (1 sticker)
HR Process Improvement: Payroll
● Pay us twice a month, speed up the process of getting a raise request approved.
● This has been tried multiple times. Why hasn't it worked in the past? Need to figure that out before investing in another consultant.
● HR has had multiple consultants review operations with no changes implemented. Why not use the suggestions of the users who are unsatisfied with the service to help redesign the program to be customer-service oriented?
● Ask the new CHRO if any planned changes to come rather than hire another expert.
● Again, the external consultants- think we can re-read the 3-4 reports we already have.
● Not sure if an additional consultant is needed, but perhaps a tracking system to help streamline work.
● HR has been through at least 3 external reviews without any follow up!!! This wouldn't work without proper follow-up and support. (2 stickers)
HR Process Improvement: Recruiting/Hiring
● Faculty Hiring processes seem excessively resource intensive.
● Again, we have had more than 1 external consultant read the reports!!
● In recent years, 3 consultants have been employed for this same service. It doesn't seem to be the solution to the problem!
● Again, is there a system that could be put in place to help this process vs. a consultant?
● Ask new CHRO for planned ideas before hiring a consultant.
● I made the same comment on the HR-Payroll process improvement. Why haven't past consultants been beneficial? More money on consultants doesn't seem prudent.
● Same as other comment on HR-Payroll board. This has been tried without any results because there was no support or follow-up. (1 sticker)
Purchasing Process Improvement
● Purchasing can be such an involved process that I think training sessions would be valuable (just to clarify the process to help things move along more efficiently). Educate!
● Technology helps here, but needs an accompanying culture change at MSU. (1 sticker)
Shared Services Model
● Examples?
● Idea has potential, but implementation will be threatening to existing staff.
● Good idea, but hard to implement.

OpenMSU Initiative | Anne Milkovich, Recommendation Subcommittee Chair | 11/20/2012 Page 94 of 99
N:\Ac_RecSub\Report\FinalReportFiles\OpenMSU_RecommendationReport_Final_Response.docx
● I think different units have their individual processes necessary to function that this may not work effectively.
● Shared HR, Payroll and Travel services would be helpful.
● Provide the right tools to assist and automate. Change management!
● Very helpful to small departments.
● Ensure all impacted personnel participate in formulation. Attrition should not be the driving factor of sharing services, but rather logic about what makes the most sense and has the most benefit. (2 stickers)
Service Provider - Development
● I think training is one of our biggest needs for staff on campus. But it must be efficient, effective and made a priority.
● I don't see busy staff having time for this. Training sessions HR does this now and we can't find time to go.
Service Provider - Staffing Turnover
● Ask the overworked staff for solutions. With the 183:1 ratio, they know issues and how to get work done.
● We have had numerous external consultants all saying the same thing. Again???
● I think having a trainer on campus can help alleviate this issue a bit.
● Turnover isn't just about pay and workload. It's also about ineffective supervisors and administrators. Someone might be willing to be paid less if they work for a good supervisor who appreciates their efforts.

OpenMSU Initiative | Anne Milkovich, Recommendation Subcommittee Chair | 11/20/2012 Page 95 of 99
N:\Ac_RecSub\Report\FinalReportFiles\OpenMSU_RecommendationReport_Final_Response.docx
Appendix K: Feedback Submitted through Website
The Recommendation Phase web pages contained a mechanism for submitting feedback on individual proposed
solutions as well as general comments. Below are comments submitted on proposed solutions.
BPA Process Improvement
● I think CatBooks needs to be considered as part of this improvement process. Many departments across campus currently use CatBooks to create and track BPAs. I think we should take a hard look at what the CatBooks program does, and make a strategic decision about whether or not to embrace and support CatBooks (or something similar) as part of our normal processes.
● I'm concerned with the cost for departments to be set up to have adequate electronic document handling capabilities.
● I'm concerned with that we already have bottlenecks with Electronic Personnel Action Forms getting all the needed approvals and applied in a timely manner (sometimes longer than a month). What improvement will there be if it sits in someone's queue for two weeks or more instead of in a pile on their desk?
● There needs to be more cooperation OSP and UBS. Sometimes our staff doesn't know who to send BPA's to first because they won't agree. Will we still have the same power issues if the BPA's are done electronically?
Creating a Culture of Customer Service
● All too often customers think they are receiving poor customer service because we will not help them evade mandates made by Federal and State agencies. Perhaps a culture of teamwork towards doing what is right and ethical should also be promoted. Too often, a person is actually rewarded for unethical and unproductive behavior at MSU.
● The fact that central offices are preventing MSU from being sued, fined and receiving negative public relations should be recognized as good customer service.
● If HR would answer phones, it would be a big service improvement. For some reason they are allowed to ignore phone calls during “peak” periods and expect email rather than phone information to be provided.
● IT will not be able to improve service until they are fully staffed. They will not be fully staffed until their salaries are competitive outside of the “region.”
HR Process Improvement: EPAF
● I agree that something needs to be done to improve EPAFs. Required paper documents, such as LOAs, need to be attached or linked to the EPAF so they can be reviewed and approved together.
● The reduction of cycle times at the payroll level does not address the problem at the Originator and Approver levels (see bullet above).
● Having HR check for “technical” errors at the start of the process instead of after the approval process would be a significant improvement.
● Changes to the form itself should also be considered.
HR Process Improvement: Payroll
● Outside consultants have come and gone at MSU with no implementation as a result. Implementation is key. It is imperative that the people who are working in the ‘trenches’ have some say in how the processes work, or not. We have experience in the details and could have some very good input.
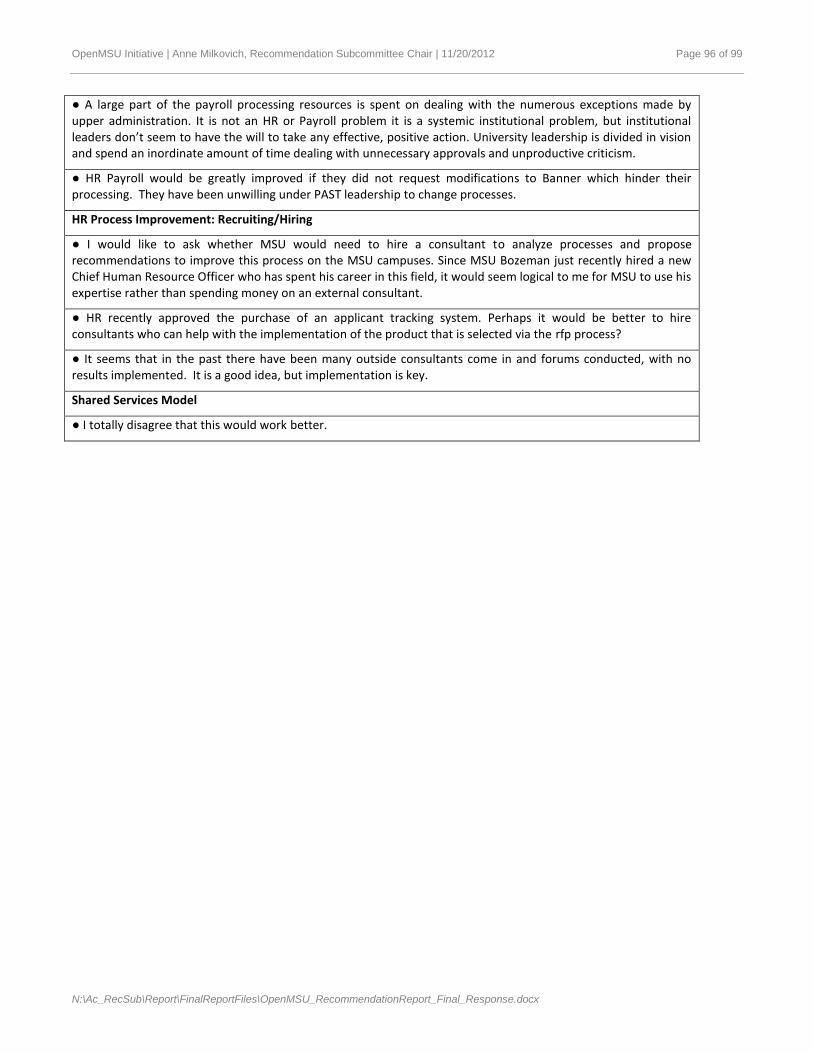
OpenMSU Initiative | Anne Milkovich, Recommendation Subcommittee Chair | 11/20/2012 Page 96 of 99
N:\Ac_RecSub\Report\FinalReportFiles\OpenMSU_RecommendationReport_Final_Response.docx
● A large part of the payroll processing resources is spent on dealing with the numerous exceptions made by upper administration. It is not an HR or Payroll problem it is a systemic institutional problem, but institutional leaders don’t seem to have the will to take any effective, positive action. University leadership is divided in vision and spend an inordinate amount of time dealing with unnecessary approvals and unproductive criticism.
● HR Payroll would be greatly improved if they did not request modifications to Banner which hinder their processing. They have been unwilling under PAST leadership to change processes.
HR Process Improvement: Recruiting/Hiring
● I would like to ask whether MSU would need to hire a consultant to analyze processes and propose recommendations to improve this process on the MSU campuses. Since MSU Bozeman just recently hired a new Chief Human Resource Officer who has spent his career in this field, it would seem logical to me for MSU to use his expertise rather than spending money on an external consultant.
● HR recently approved the purchase of an applicant tracking system. Perhaps it would be better to hire consultants who can help with the implementation of the product that is selected via the rfp process?
● It seems that in the past there have been many outside consultants come in and forums conducted, with no results implemented. It is a good idea, but implementation is key.
Shared Services Model
● I totally disagree that this would work better.

OpenMSU Initiative | Anne Milkovich, Recommendation Subcommittee Chair | 11/20/2012 Page 97 of 99
N:\Ac_RecSub\Report\FinalReportFiles\OpenMSU_RecommendationReport_Final_Response.docx
Appendix L: Open Forum Participation Photos

OpenMSU Initiative | Anne Milkovich, Recommendation Subcommittee Chair | 11/20/2012 Page 98 of 99
N:\Ac_RecSub\Report\FinalReportFiles\OpenMSU_RecommendationReport_Final_Response.docx
Appendix M: OpenMSU Roadmap Poster
Root causes of frustrations and inefficiency
must be solved with needed foundation.
Build the Foundation
Roadmap:
From the Ground Up
OpenMSU
Work Efficiency
Job Satisfaction
Lay the Cornerstones
Fix Process Pains Add Finish Work
Certain cornerstones are needed, based on
foundation, before processes can be solved.
HR-Payroll and HR-EPAFs are dependent on,
and could change with, foundation and
cornerstone pieces.
Begin immediately with qualified
project teams and program oversight.
Begin in parallel with foundation using
collaborative teams and oversight.
Continually report progress;
begin as soon as possible.
BPA and Purchasing improvements are more
narrow in scope, less widely felt, dependent
on foundation and cornerstones.
Include in project teams;
call purchasing summit.