open market operations during 2019
TRANSCRIPT

OPEN MARKET
A REPORT PREPARED FOR THE FEDERAL OPEN MARKET COMMITTEE BY THE MARKETS GROUP
OF THE FEDERAL RESERVE BANK OF NEW YORK
D U R I N G 2 0 2 0
M A Y 2 0 2 1
O P E R AT I O N S

CONTENTS
O P E N M A R K E T O P E R A T I O N S D U R I N G 2 0 2 0
Overview AppendixesOperational Flexibility & Resiliency
Selected Balance Sheet Developments
Counterparties Index of Charts & Tables
Contents Primary Credit Program &
Emergency Facilities
Open Market Operations
Financial Market Developments
& Policy Actions
Endnotes
This report, presented to the Federal Open Market Committee by Lorie Logan, Executive Vice President, Federal Reserve Bank of New York, and Manager of the System Open Market Account, describes open market operations of the Federal Reserve System and other policy actions related to monetary policy implementation for the calendar year 2020. Christina Getz, Julie Remache, Kathryn Chen, Lisa Stowe, Radhika Mithal, Karen Brifu, and Timothy Chu were primarily responsible for preparation of the report.
Overview ............................................................1Key Developments in 2020 .............................................. 1A Guide to This Report .................................................... 2
Financial Market Developments and Policy Actions Related to the COVID-19 Crisis ........................... 5
Open Market Operations ................................ 11The Federal Reserve’s Framework for Monetary Policy
Implementation ....................................................... 11Reverse Repurchase Agreements ...................................... 12Repurchase Agreements ................................................ 12Central Bank Liquidity Swaps .......................................... 14FIMA Repo Facility ....................................................... 16Treasury Securities Operations ......................................... 16Agency MBS and Agency CMBS Operations ..................... 20Foreign Reserves Management ........................................ 24
Primary Credit Program and Emergency Credit and Liquidity Facilities ..................................... 27
Primary Credit Program ................................................. 28Federal Reserve Emergency Credit and Liquidity Facilities ...... 29
Selected Balance Sheet Developments ................ 33
Selected Assets ........................................................... 33SOMA Domestic Securities Holdings ............................ 33
Portfolio Size and Composition ............................... 33
Portfolio Risk Metrics ............................................ 37
SOMA Repurchase Agreements .................................. 38
Central Bank Liquidity Swaps ..................................... 39
SOMA Foreign Currency–Denominated Holdings ............ 39
Primary Credit Program ............................................. 39
Federal Reserve Emergency Credit and Liquidity Facilities .. 40
Selected Liabilities........................................................ 40Reserve Balances .................................................... 41
Federal Reserve Notes ............................................. 41
Reverse Repurchase Agreements .................................. 42
Deposits .....................................................................43
Financial Results .......................................................... 45SOMA Income ............................................................45
Federal Reserve Remittances ...................................... 45
SOMA Unrealized Gains and Losses ........................... 45
Projections ...................................................................... 46
Counterparties .............................................. 53
Operational Flexibility and Resiliency ................. 57
Appendixes .......................................................61Appendix 1: Operational Approaches .............................. 61Appendix 2: Governing Documents .................................. 69Appendix 3: Operations Disclosures ................................. 70Appendix 4: Summary of Projection Assumptions ................. 72Appendix 5: Reference Web Pages ................................. 73
Endnotes ...........................................................75
Index of Charts and Tables............................... 79

1
OVERVIEW
O P E N M A R K E T O P E R A T I O N S D U R I N G 2 0 2 0
Overview AppendixesOperational Flexibility & Resiliency
Selected Balance Sheet Developments
Counterparties Index of Charts & Tables
Contents Primary Credit Program &
Emergency Facilities
Open Market Operations
Financial Market Developments
& Policy Actions
Endnotes
KEY DEVELOPMENTS IN 2020 At its January 2020 meeting, the Federal Open Market Committee (FOMC) maintained the target range for the federal funds rate in a range of 11/2 to 13/4 percent. The Committee continued to direct the Open Market Trading Desk at the Federal Reserve Bank of New York (the Desk) to conduct operations to maintain reserves at a level the Committee judged as supportive of effective control over the federal funds rate.
In early March, the global economy experienced an extraordinary shock, triggered by the COVID-19 pandemic, and asset prices adjusted sharply to reflect a significant deterioration in the economic outlook. To address these developments, the FOMC reduced the target range for the federal funds rate by 150 basis points over the course of two meetings in March; the Board of Governors made corresponding reductions to the rate of interest paid on excess reserves (IOER), and the FOMC reduced the offering rate for overnight reverse repurchase agreements (ON RRPs).
Meanwhile, pessimism and uncertainty about the economic outlook as large segments of the economy were shut down, combined with concerns about the ability of markets to keep functioning in a remote work environment, resulted in a strong desire for cash. The widespread demand for liquidity prompted severe disruptions in secured and unsecured U.S. dollar funding markets. Market functioning in the Treasury and agency mortgage-backed securities (MBS) markets deteriorated significantly. At the same time, concerns about the impact of the pandemic on economies around the world led to broader disruptions, including in various credit markets.
To address the deterioration in market functioning, the Desk conducted large-scale overnight and term repo operations. The Federal Reserve also lowered the primary credit rate and extended the term for discount window loans from overnight to periods of up to ninety days to support lending in the banking system, and eliminated reserve requirement ratios. The FOMC enhanced and expanded the provision of dollars to global funding markets via U.S. dollar liquidity swap lines and established a temporary repurchase agreement facility for foreign and international monetary authorities (FIMA Repo Facility) to enable FIMA customers to temporarily exchange Treasury securities for U.S. dollars. The FOMC directed the Desk to increase its holdings of Treasury securities and agency MBS and included agency commercial mortgage-backed securities (CMBS) in its purchases of MBS for the first time.
In addition, the Federal Reserve, in coordination with the U.S. Treasury, launched emergency credit and liquidity facilities to support the flow of credit to households, businesses, and state and local governments by providing backstops to key markets. Finally, the Federal Reserve implemented various supervisory and regulatory actions to support the flow of credit and liquidity and ease operational burdens.1
Supported by these actions, financial markets began to stabilize in May and June. During the rest of the year, record high levels of outstanding repos rolled off, and most outstanding central bank liquidity swaps matured. Although the pace of purchases of Treasury securities and agency MBS declined as conditions improved, the FOMC continued to direct the Desk to increase its holdings of these securities to sustain smooth market functioning and support accommodative financial conditions. Meanwhile,

2
O P E N M A R K E T O P E R A T I O N S D U R I N G 2 0 2 0
Overview AppendixesOperational Flexibility & Resiliency
Selected Balance Sheet Developments
Counterparties Index of Charts & Tables
Contents Primary Credit Program &
Emergency Facilities
Open Market Operations
Financial Market Developments
& Policy Actions
Endnotes
usage of the emergency credit and liquidity facilities generally declined. Overall usage of many of the facilities was low compared to their capacity due to the improvement in market functioning and the backstop nature of facility pricing relative to market pricing. Many of the facilities expired at year-end.
Over the course of the year, the size and composition of the Federal Reserve’s balance sheet evolved significantly as a result of the asset purchases conducted to support and sustain smooth market functioning and foster accommodative financial conditions. The overall size of the balance sheet increased to $7.4 trillion, the highest level on record, or 34 percent of nominal GDP. The level of reserves in the banking system rose rapidly, reaching as high as $3.3 trillion during the year, and representing 17 percent of nominal GDP. The impact of the purchases of Treasury securities and agency MBS on the level of reserves was partially offset by a substantial increase in the size of the Treasury General Account (TGA). Even as elevated market uncertainty receded and reserves increased to record levels, the federal funds rate remained very stable at a level slightly below the IOER rate.
In 2020, the Federal Reserve remitted a total of $88.5 billion to the Treasury, compared to $54.9 billion in 2019, driven primarily by lower funding costs as interest rates declined. The domestic portfolio ended the year in an unrealized gain position of $354 billion as a result of declines in interest rates; this compared to an unrealized gain position of $161 billion at the end of 2019.
The Desk did not conduct any foreign exchange intervention activity that would alter the size of the foreign currency reserve portfolio, which at the end of the year totaled $22.2 billion. Meanwhile, the Desk continued to manage the foreign currency reserve holdings in line with the portfolio’s investment objectives of liquidity, safety, and return.
In coming years, the size of the portfolio—and the balance sheet as a whole—will be driven by FOMC decisions regarding asset purchases and reinvestment policies. The Committee has not yet provided guidance on its plans for the management of the portfolio over the longer run. As such, the projections presented in this report are meant to be illustrative and to demonstrate a range of possibilities for the path of the
portfolio, reserve balances, income, and unrealized gains and losses. The size of the portfolio could increase through ongoing asset purchases or decline depending on choices made to manage the normalization of the portfolio. Under the assumed path of interest rates, the portfolio’s net income would be expected to remain roughly in line with recent levels. At the same time, as interest rates rise to assumed long-run levels, the portfolio could move to an unrealized loss position. Additional scenarios that consider alternate interest rate paths show that net income could be lower, but remain positive, even under higher interest rate scenarios; meanwhile, the unrealized gain or loss position of the portfolio could vary widely depending on the path of interest rates.
Operational resilience was a key focus throughout 2020. The Desk’s ongoing efforts regarding operational readiness and resiliency were key to its ability to swiftly launch a range of operations and execute a high volume of transactions with its staff primarily working from home. Also, the New York Fed announced initiatives aimed at diversifying its set of counterparties for certain facilities and agency MBS operations.
A GUIDE TO THIS REPORT This report is divided into six main sections.
1. Financial Market Developments and Policy Actions Related to the COVID-19 Crisis: The Federal Reserve’s response to the severe market disruptions precipitated by the COVID-19 pandemic determined policy actions for the greater part of the year. In light of the importance of these events, the first section of this report provides a closer look at the market disruptions that occurred during March and the related Federal Reserve policy actions. (pp. 5-10)
2. Open Market Operations: This section describes the Federal Reserve’s framework for monetary policy implementation and the steps taken by the Desk within that framework to implement the FOMC’s operating directives in money markets and securities markets during 2020. The Desk’s operations to maintain the Federal Reserve’s portfolio of foreign currency–denominated assets are also included in this section. (pp. 11-26)

3
O P E N M A R K E T O P E R A T I O N S D U R I N G 2 0 2 0
Overview AppendixesOperational Flexibility & Resiliency
Selected Balance Sheet Developments
Counterparties Index of Charts & Tables
Contents Primary Credit Program &
Emergency Facilities
Open Market Operations
Financial Market Developments
& Policy Actions
Endnotes
3. Primary Credit Program and Emergency Credit and Liquidity Facilities: This section describes the Federal Reserve primary credit program and emergency credit and liquidity facilities. The primary credit program is a long-standing policy tool that is directly linked to monetary policy implementation and as such, it is typically included in this report. The emergency credit and liquidity facilities were established in coordination with the U.S. Treasury and although they are not are not open market operations, they are included in this report because they were relevant for monetary policy implementation during 2020. (pp. 27-31)
4. Selected Balance Sheet Developments: This section examines the composition of the Federal Reserve’s balance sheet, reviews financial developments related to the domestic System Open Market Account (SOMA) portfolio, and discusses the purposes and recent trends in the Federal Reserve’s liabilities. It also presents an illustrative projection of the balance sheet under a set of simplifying assumptions (pp. 33-51)
5. Counterparties: This section reviews the trading counterparties that the Desk engages with to execute domestic and foreign open market operations. The counterparties described include primary dealers, reverse repurchase agreement counterparties, foreign exchange counterparties, and foreign reserve management
counterparties. This section also describes the counterparty expansion for select Federal Reserve emergency credit and liquidity facilities and agency CMBS operations. (pp. 53-55)
6. Operational Flexibility and Resilience: This final section highlights actions implemented to enhance cyber resilience and operational readiness exercises undertaken during the year. (pp. 57-59)
Appendix 1 provides reference information regarding the operational approach for different open market operations. Appendix 2 highlights and links to the governing documents for Desk operations. Appendix 3 summarizes the Desk’s public disclosures about its operations. Appendix 4 presents assumptions underlying the scenarios for the SOMA portfolio and the SOMA net income projections. Appendix 5 provides links to web pages where source material for Federal Reserve–related content can be found.
Underlying data for the charts shown in this report is provided on the New York Fed’s website to the extent that their release is permitted by data suppliers.2 3 Additional questions regarding this report and the underlying data can be addressed to [email protected].

4

5
FINANCIAL MARKET DEVELOPMENTS AND POLICY ACTIONS RELATED TO THE COVID-19 CRISIS
O P E N M A R K E T O P E R A T I O N S D U R I N G 2 0 2 0
Overview AppendixesOperational Flexibility & Resiliency
Selected Balance Sheet Developments
Counterparties Index of Charts & Tables
Contents Primary Credit Program &
Emergency Facilities
Open Market Operations
Financial Market Developments
& Policy Actions
Endnotes
The pandemic drove significant developments in financial markets in 2020, prompting numerous monetary policy actions by the Federal Reserve. At the beginning of the year, Desk operations were conducted to maintain short-term interest rate control in an environment of ample reserve balances in the banking system, reflecting a continuation of the monetary policy stance at the end of 2019. As developments unfolded around the COVID-19 pandemic, financial markets reacted sharply to concerns that the virus and the actions taken to contain it would have broad impact on economies throughout the world. The sharp worsening in the economic outlook and deterioration in financial market functioning prompted a significant policy response and dominated the Federal Reserve’s operational activity over the remainder of the year.
By early March 2020, the economic impact of what would become the COVID-19 pandemic reverberated across financial markets. As measures to contain the spread of COVID-19 were introduced, including travel bans, lockdowns, and school closures, widespread concerns about the economic impact of these actions, combined with concerns about the ability of markets to function in a remote work environment, intensified. Amid these developments, investors rapidly shifted investments toward safer and liquid assets like cash. During this time, many lenders became reluctant to extend term funding to borrowers due to increased uncertainty and volatility and term Treasury repo rates rose sharply. In unsecured funding markets, some prime money market mutual funds (MMMFs), which typically hold commercial paper and other short-term debt instruments, experienced historically large redemptions, as investors abruptly shifted from unsecured funding markets to funding markets
secured by high-quality collateral and government MMMFs.4 Overseas dollar funding markets were also severely disrupted and the foreign exchange swap basis spread, a key indicator of conditions in global U.S. dollar funding markets, increased sharply across major currency pairs.
Meanwhile, the functioning of Treasury and agency MBS markets became severely impaired as a result of extreme volatility across the financial system. A historically large surge in sales of Treasury securities occurred, driven by various institutions that sought to sell Treasury securities in favor of holding cash and cash-like instruments. The indicative bid-ask spreads for the 10-year on-the-run and first and second off-the-run Treasury securities increased sharply and other measures of market functioning deteriorated rapidly. In the MBS market, investors sold agency MBS to reduce leverage ratios, while others sold agency MBS to raise cash to fund redemptions. Conditions in the agency CMBS market also became severely disrupted. At the same time, the availability of funding for businesses, and state and local governments deteriorated, as the cost of borrowing rose sharply for those issuing corporate bonds, municipal debt, and asset-backed securities (ABS).
The Federal Reserve responded swiftly and with a range of policy actions to address the widespread disruptions across financial markets In light of these developments, the Federal Reserve responded by taking actions to ease the stance of monetary policy to address the sharply deteriorating economic outlook. Specifically, the FOMC reduced the target range for the federal funds rate to 0 to ¼ percent in increments of 50 and 100 basis points, on March 3 and March 15, respectively (Chart 1, Table 1). In

6
O P E N M A R K E T O P E R A T I O N S D U R I N G 2 0 2 0
Overview AppendixesOperational Flexibility & Resiliency
Selected Balance Sheet Developments
Counterparties Index of Charts & Tables
Contents Primary Credit Program &
Emergency Facilities
Open Market Operations
EndnotesFinancial Market Developments
& Policy Actions
addition, the FOMC emphasized that it was prepared to use its full range of tools to support the flow of credit to households and businesses, thereby promoting its maximum-employment and price-stability goals. The Board of Governors also made corresponding adjustments to the IOER rate, from 1.60 percent to 0.10 percent, and the FOMC adjusted the offering rate on ON RRPs from 1.50 percent to zero.
As market participants shifted to the most liquid investments, funding market conditions deteriorated sharply, threatening the flow of credit to the U.S. economy, so the Federal Reserve took actions to support the functioning of these markets. To support lending in the banking system, the Board of Governors reduced the primary credit rate by a total of 200 basis points to 25 basis points, narrowing the spread to the target range for the federal funds rate, and announced that primary credit loans may be granted for terms of up to ninety days, a significant extension from the primarily overnight terms offered up until that time. (Table 1)
To ensure that the supply of reserves remained ample and to support the smooth functioning of short-term U.S. dollar funding markets, the Desk increased the amount of term repo offerings and began offering one-month and three-month term repos sized at $500 billion, an amount that was sufficiently large to meet all demand at the minimum bid rate. The Desk then increased the size of overnight repo operations to $500 billion and increased the frequency of overnight repo operations from once per day to twice per day.
The Federal Reserve and five other standing swap line central banks took coordinated actions to enhance the provision of U.S. dollar liquidity through the central bank swap lines in order to ease strains in global U.S. dollar funding markets. The coordinated action lowered the pricing on the standing U.S. dollar liquidity swap arrangements by 25 basis points, added weekly three-month tenor operations, and increased the frequency of one-week tenor operations. The Federal Reserve then added temporary swap lines with nine additional central banks.
0.5
1.0
1.5
2.0
2.5
3.0
2017 2018 2019 2020
Federal funds target range Effective federal funds rateRate of interest on excess reserves
Chart 1FFederal Funds Target Range, Interest on Excess Reserves, and Effective Federal Funds Rate
Source: Federal Reserve Bank of New York.
Note: Figures are daily.
Percent
0

7
O P E N M A R K E T O P E R A T I O N S D U R I N G 2 0 2 0
Overview AppendixesOperational Flexibility & Resiliency
Selected Balance Sheet Developments
Counterparties Index of Charts & Tables
Contents Primary Credit Program &
Emergency Facilities
Open Market Operations
Financial Market Developments
& Policy Actions
Endnotes
In March, the Federal Reserve also established the FIMA Repo Facility, which served as an alternative source of U.S. dollars by allowing FIMA customers to temporarily exchange Treasury securities held in their accounts with the New York Fed for U.S. dollars. The facility also helped to support the smooth functioning of the market for Treasury securities by reducing the need of foreign central banks to sell these securities to raise U.S. dollar liquidity, as discussed further below.
The FOMC directed the Desk to support smooth market functioning in the U.S. Treasury and agency MBS markets. To address the highly unusual disruptions in the Treasury market, the FOMC responded quickly with a series of actions as market dynamics evolved: Pursuant to instruction from the Chair in consultation with the FOMC, the Desk shifted the maturity composition of purchases from Treasury bills to roughly match the composition of Treasury securities outstanding to support market functioning across sectors. The Desk then brought forward about half of the Treasury purchases previously scheduled for the mid-March to mid-April period into one day.5 Next, the FOMC directed the Desk to increase holdings of Treasury securities by at least $500 billion and agency MBS by at least $200 billion
to support the smooth functioning of these markets. Lastly, the FOMC then directed the Desk to purchase Treasury securities and agency MBS in the amounts needed to support the smooth functioning of markets and the effective transmission of monetary policy, and also directed the Desk to purchase agency CMBS.
The FOMC provided the Desk with flexibility to adjust the details of open market operations and respond to evolving market conditions. The level of daily purchases peaked during the second half of March when the Desk purchased $75 billion in Treasury securities and $41 billion in agency MBS, the largest amount of daily asset purchases ever conducted by the Desk. For more information on each policy announcement, see the Timeline of Select Policy Actions.
The Federal Reserve, with approval from the U.S. Treasury, established emergency credit and liquidity facilities to support the flow of credit to households, businesses, and state and local governments. The emergency credit and liquidity facilities provided backstops to key funding markets such as repo against non-Treasury and agency collateral, commercial paper, corporate debt, asset-backed
Table 1 Key Policy Rates Effective in 2020
FOMC Meetings Announcing Policy Rate Changes
Effective Date Range for
Policy Rates during 2020
Federal Funds Target Range
Interest Rate on Required and
Excess Reserve Balances (IOER)
Overnight Reverse Repo Offering (ON RRP) Rate
Spread between IOER and
ON RRP RatesPrimary Credit
Rate
Rate (Percent)
Change (Basis Points)
Rate (Percent)
Change (Basis Points)
Rate (Percent)
Change (Basis Points)
Level (Basis Points)
Rate (Percent)
Change (Basis Points)
October 2019 January 1 to January 29 1½ to 1¾ 0 1.55 0 1.45 0 10 2.25 0
January 2020 January 30 to March 3 1½ to 1¾ 0 1.60 +5 1.50 +5 10 2.25 0
March 2020 March 4 to March 15 1 to 1¼ -50 1.10 -50 1.00 -50 10 1.75 -50
March 2020 March 16 to December 31 0 to ¼ -100 0.10 -100 0.00 -100 10 0.25 -150
Sources: Federal Open Market Committee; Board of Governors of the Federal Reserve System.
8
O P E N M A R K E T O P E R A T I O N S D U R I N G 2 0 2 0
Overview AppendixesOperational Flexibility & Resiliency
Selected Balance Sheet Developments
Counterparties Index of Charts & Tables
Contents Primary Credit Program &
Emergency Facilities
Open Market Operations
EndnotesFinancial Market Developments
& Policy Actions
securities, and municipal debt. Some of the programs supported lending to small and medium-sized entities in the for-profit and non-profit sectors. The announcements of the emergency facilities prompted an improvement in financial market conditions by providing investors with confidence that the Federal Reserve would provide credit and liquidity if needed in those markets.6 These facilities were established with the approval of the U.S. Treasury, as required by law.7
The Federal Reserve’s actions contributed to a stabilization of conditions across markets, and the Desk continued operations to sustain smooth market functioning throughout the remainder of the year By June, market functioning stabilized across the wide range of markets affected by the COVID-19 pandemic. Record high levels of outstanding repos and central bank liquidity swaps
began to gradually roll off, reflecting the backstop pricing of these operations that were less economically attractive as markets stabilized and rates returned to more normal levels. Meanwhile, the FOMC directed the Desk to continue increasing SOMA holdings of Treasury and agency MBS securities to sustain smooth market functioning, thereby fostering effective transmission of monetary policy to broader financial conditions.
In September, the FOMC’s stated goal for asset purchases shifted from primarily addressing market functioning to fostering accommodative financial conditions, thereby supporting the flow of credit to households and businesses. At its December meeting, the FOMC stated that it would continue to increase its holdings of Treasury securities and agency MBS until substantial further progress has been made toward the Committee’s maximum employment and price stability goals.

9
O P E N M A R K E T O P E R A T I O N S D U R I N G 2 0 2 0
Overview AppendixesOperational Flexibility & Resiliency
Selected Balance Sheet Developments
Counterparties Index of Charts & Tables
Contents Primary Credit Program &
Emergency Facilities
Open Market Operations
Financial Market Developments
& Policy Actions
Endnotes
T IMEL INE OF SELECT POL ICY ACT IONS DURING 2020
Continued on page 10
Target Range for the Federal Funds Rate, IOER, ON RRP
Repo, Central Bank Liquidity Swaps, FIMA Repo Facility
Primary Credit Program, Emergency Facilities
Treasury Security and Agency MBS Purchases
Developments in financial markets and related monetary policy actions evolved significantly during 2020.
January and February. Desk conducts operations to maintain interest rate control in an environment of ample reserve balances, a continuation of the monetary policy stance at the end of 2019.
March and April. Federal Reserve responds to widespread disruptions across financial markets. Desk operations are unprecedented in size and scale. Emergency facilities are established.
May and June. Financial markets begin to stabilize. Desk operations begin to gradually reduce in size.
July to December. Ongoing stabilization of financial markets. Outstanding repo and central bank liquidity swaps decline while asset purchases continue. Many facilities expire at year-end.
January 29
In technical adjustments to administered rates, Board of Governors raises IOER rate from 1.55% to 1.60%, FOMC raises ON RRP offering rate from 1.45% to 1.50%.
February 4
Desk decreases 2-week term repo operation offering size from $35 billion to $30 billion.
February 13
Desk announces decrease in overnight (ON) repo operation offering size from $120 billion to $100 billion effective February 14 and decreases in 2-week term repo operation offering size from $30 billion to $25 billion effective February 18 and from $25 billion to $20 billion effective March 3.
March 3
FOMC holds unscheduled meeting, lowers target range for federal funds rate by 50 bps to 1 to 1 1/4%.
Board of Governors lowers IOER rate from 1.60% to 1.10%. FOMC lowers ON RRP offering rate from 1.50% to 1.00%.
Board of Governors approves 50 bp decrease in primary credit rate to 1.75%.
March 9
Desk increases ON repo operation offering size from $100 billion to $150 billion, increases 2-week term repo operation offering size from $20 billion to $45 billion.
March 11
Desk increases ON repo offering size to $175 billion, adds three 1-month repo operations of $50 billion.
March 12
Desk introduces 3-month term repo operations with offering sizes of $500 billion, and increases 1-month repo operation offering sizes to $500 billion.
Pursuant to instruction from the Chair in consultation with the FOMC, the Desk announces that beginning March 13, the maturity composition of reserve management purchases will shift from Treasury bills to a range of maturities that roughly match the composition of Treasury securities outstanding.
March 13
Desk purchases $37 billion of Treasury securities, out of $80 billion in planned monthly reserve management purchases.
March 15
FOMC holds unscheduled meeting, lowers target range for federal funds rate by 100 bps to 0 to 1/2%.
March 15 cont.
Board of Governors lowers IOER rate from 1.10% to 0.10%. FOMC lowers ON RRP offering rate from 1.00% to 0%.
Board of Governors approves 150 bp decrease in primary credit rate to 0.25%, narrowing the spread to the federal funds rate target range by 50 bps. Term loans extended up to 90 days.
Asset purchases begin as the FOMC directs Desk to increase holdings of Treasury securities and agency MBS by at least $500 billion and $200 billion, respectively. Desk is directed to roll over at auction all principal payments from Treasury securities and reinvest all principal payments from agency debt and agency MBS in agency MBS.
Federal Reserve and standing swap line central banks lower pricing on standing weekly U.S. dollar liquidity swap arrangements by 25 bps, add weekly 84-day swap operations.
March 16
Desk adds second daily ON repo operation with offering size of $500 billion.
March 17
Desk increases maximum offering size of morning ON repo operation to $500 billion; all ON repo operations conducted after this date have maximum offering sizes of $500 billion.
Federal Reserve, with approval from the U.S. Treasury, announces the PDCF and CPFF.

10
O P E N M A R K E T O P E R A T I O N S D U R I N G 2 0 2 0
Overview AppendixesOperational Flexibility & Resiliency
Selected Balance Sheet Developments
Counterparties Index of Charts & Tables
Contents Primary Credit Program &
Emergency Facilities
Open Market Operations
EndnotesFinancial Market Developments
& Policy Actions
TIMELINE OF SELECT POLICY ACTIONS DURING 2020 (cont.)
Continued from page 9
Notes: This timeline includes select Federal Reserve policy actions related to monetary policy implementation. For more information on each action, see related sections of the report. The timeline does not reflect Federal Reserve supervisory and regulatory policy actions.
CPFF is Commercial Paper Funding Facility; MLF is Municipal Liquidity Facility; MMLF is Money Market Mutual Fund Liquidity Facility; MSLP is Main Street Lending Program; PDCF is Primary Dealer Credit Facility; PMCCF is Primary Market Corporate Credit Facility; PPPLF is Paycheck Protection Program Liquidity Facility; SMCCF is Secondary Market Corporate Credit Facility; TALF is Term Asset-Backed Securities Loan Facility.
Target Range for the Federal Funds Rate, IOER, ON RRP
Repo, Central Bank Liquidity Swaps, FIMA Repo Facility
Primary Credit Program, Emergency Facilities
Treasury Security and Agency MBS Purchases
March 18
Federal Reserve, with approval from the U.S. Treasury, announces the MMLF.
March 19
Federal Reserve establishes temporary U.S. dollar liquidity swap arrangements with nine central banks.
March 20
Federal Reserve and standing swap line central banks increase frequency of 7-day swap operations from weekly to daily for standing swap line central banks.
March 23
FOMC directs Desk to increase holdings of Treasury securities and agency MBS in amounts needed to support smooth functioning of markets. FOMC also directs Desk to purchase agency CMBS.
Federal Reserve, with approval from the U.S. Treasury, announces the PMCCF, SMCCF, and TALF.
March 31
Federal Reserve announces FIMA Repo Facility.
April 9
Federal Reserve, with approval from the U.S. Treasury, announces the MLF, PPPLF, and MSLP.
June 10
FOMC directs Desk to increase holdings of Treasury securities and agency MBS at least at current pace—equivalent to approximately $80 billion per month and $40 billion per month, respectively—to sustain smooth market functioning.
June 16
Desk increases minimum bid rate on ON and 1-month term repo operations to the IOER rate plus a spread of 5 and 10 bps, respectively.
June 19
Standing swap line central banks, in consultation with Federal Reserve, reduce frequency of 7-day swap operations from daily to three times per week; 84-day operations continue weekly.
June 22
Desk eliminates daily morning ON repo operation, leaving one ON repo operation in the afternoon.
July 28
Federal Reserve Board extends the PDCF, MMLF, PMCCF, SMCCF, TALF, PPPLF, and MSLP from September 30 to December 31, 2020.
July 29
FOMC extends temporary U.S. dollar liquidity swap lines and FIMA Repo Facility through March 31, 2021.
August 20
Standing swap line central banks, in consultation with Federal Reserve, reduce frequency of 7-day swap operations from three times per week to one time per week; 84-day operations continue weekly.
September 16
FOMC expands objective of asset purchases to include fostering accommodative financial conditions. Reinvestment of principal payments from agency CMBS into agency CMBS ends.
November 30
Federal Reserve Board extends the CPFF, MMLF, PDCF, and PPLF to March 31, 2021.
December 16
FOMC directs Desk to increase holdings of Treasury securities by $80 billion per month and of agency MBS by $40 billion per month and indicates that holdings will increase until substantial further progress has been made toward the Committee's maximum employment and price stability goals. Desk is directed to purchase agency CMBS as needed to sustain smooth functioning of markets for these securities.
Federal Reserve announces extension of temporary U.S. dollar liquidity swap arrangements and FIMA Repo Facility through September 30, 2021.
December 31
The PMCCF, SMCCF, TALF, and MLF expire.

11
OPEN MARKET OPERATIONS
O P E N M A R K E T O P E R A T I O N S D U R I N G 2 0 2 0
Overview AppendixesOperational Flexibility & Resiliency
Selected Balance Sheet Developments
Counterparties Index of Charts & Tables
Contents Primary Credit Program &
Emergency Facilities
Open Market Operations
Financial Market Developments
& Policy Actions
Endnotes
In 2020, the Desk continued to execute open market operations in U.S. money markets and securities markets to support the implementation of monetary policy at the direction of the FOMC. The Desk also maintained its securities lending program to support smooth market functioning and continued operations related to the investment of SOMA foreign reserves. This section begins with a discussion of the Federal Reserve’s framework for monetary policy implementation and then reviews open market operations conducted by the Desk to implement monetary policy including reverse repurchase agreements, repurchase agreements, central bank liquidity swaps, the FIMA Repo Facility, and operations in the Treasury and agency MBS markets, followed by a discussion of operations related to foreign reserves management. Appendix 1 includes more detail on the operational approach for each Desk operation.
THE FEDERAL RESERVE’S FRAMEWORK FOR MONETARY POLICY IMPLEMENTATION
To promote the maximum employment and price stability goals prescribed by Congress, the Federal Reserve implements monetary policy in a framework that includes a short-term interest rate target to communicate the FOMC’s policy stance, a set of administered rates set by the Federal Reserve, and market operations directed by the FOMC and conducted by the Desk to promote money market conditions consistent with the FOMC’s target range for the policy rate. The FOMC can also employ forward guidance on the target range for the policy rate and alter the size and composition of its balance sheet as a mechanism for achieving its objectives. In 2020, the Committee
revised its Statement on Longer-Run Goals and Monetary Policy Strategy, which sets out goals for monetary policy and articulates the monetary policy strategy. The statement also serves as the foundation for the Committee’s policy actions, which result in directives to the Desk on the implementation of policy.
The money market tools used by the Federal Reserve for policy implementation were developed to maintain short-term interest rate control in an environment of ample reserve balances in the banking system.8 The FOMC’s policy rate is the federal funds rate, which is maintained within a target range set by the FOMC. The federal funds rate is the rate at which depository institutions and other eligible entities conduct overnight unsecured transactions in central bank balances.
Administered rates are the primary tool used by the Federal Reserve to control the level of the federal funds rate. The Federal Reserve sets administered rates—the interest rate paid on excess reserves that a bank holds at the Federal Reserve, supplemented by the interest rate at which ON RRPs are offered to a wide range of money market lenders—as a means to maintain the federal funds rate within the range without actively adjusting the supply of reserve balances.9 The IOER rate is the main tool used to influence overnight interest rates, while the ON RRP facility supports IOER by offering an alternative money market investment to a broader set of entities.10
Asset purchases can play different roles in the framework for monetary policy implementation. In some instances, asset purchases are employed to accommodate growth in the demand for Federal Reserve liabilities, such as reserves. In other instances, asset purchases are related to specific actions to increase holdings

12
O P E N M A R K E T O P E R A T I O N S D U R I N G 2 0 2 0
Overview AppendixesOperational Flexibility & Resiliency
Selected Balance Sheet Developments
Counterparties Index of Charts & Tables
Contents Primary Credit Program &
Emergency Facilities
Open Market Operations
Financial Market Developments
& Policy Actions
Endnotes
of securities. For example, asset purchases have been used when the federal funds rate was at its effective lower bound to exert downward pressure on longer-term interest rates, or in the case of agency MBS, to ease mortgage rates. In addition, asset purchases can be employed to support smooth functioning in U.S. Treasury and agency MBS markets.
At the start of the year, asset purchases were used as a tool to maintain an ample level of reserves in the banking system to ensure that control over the federal funds rate and other short-term interest rates was exercised primarily through the setting of the Federal Reserve’s administered rates. In March, the Federal Reserve responded to the severe disruption associated with the pandemic by purchasing Treasury securities and agency MBS to support market functioning. In September, in its post-meeting statement, the FOMC also acknowledged the role of its asset purchases in supporting accommodative financial conditions. Since the FOMC’s monetary policy implementation framework does not rely on precise adjustments to the supply of reserves in order to maintain short-term interest rates, the shift to operating at the much higher reserve levels resulting from these purchases was smooth, and the effective federal funds rate remained relatively close to the IOER rate during the year. (Chart 2)
REVERSE REPURCHASE AGREEMENTS The ON RRP facility helps establish a floor on overnight money market rates by offering an alternative investment to a broad range of money market lenders. The FOMC directed the Desk to conduct ON RRP operations at an offering rate that was set at or near the bottom of the target range for the federal funds rate. The ON RRP rate decreased along with changes in the target range, once by 0.50 percentage point and once by 1.00 percentage point, ultimately reaching zero percent, as shown in Table 1, and remained there until the end of the year.
Operational resultsIn 2020, average daily take-up in the ON RRP operations was $9 billion. This represented a small increase in the average level relative to 2019, but was driven entirely by a surge in participation in the second half of March, when take-up around
quarter-end rose to $285 billion, the highest participation since 2017 year-end (Chart 3). The increased take-up was driven by an increase in MMMF participation, as rates declined on alternative investments—including risk-free investments such as Treasury bills, which traded with negative interest rates at some tenors. For the remainder of the year, the take-up in the ON RRP was significantly lower than its peak in March as market repo rates were generally well above the ON RRP rate.
REPURCHASE AGREEMENTS Through early March, the Desk continued to conduct term and overnight repo operations to ensure that the supply of reserves remained ample and to mitigate the risk of money market pressures that could adversely affect policy implementation. Reserve levels had reached roughly $1.65 trillion in February, largely due to the Desk’s reserve management purchases of Treasury bills; therefore, the Desk had gradually reduced the maximum size of overnight repo offerings at that time. The maximum size of two-week term repo offerings had been similarly reduced in stages during that time.
-30
-20
-10
10
0
20
30
40
50
SOFR-IOER spreadEFFR-IOER spread
Chart 2Effective Federal Funds Rate and Secured Overnight Financing Rate Spreads to IOER
Source: Federal Reserve Bank of New York.
Basis points
Note: Shading highlights quarter-end dates.
Jan Apr Jul Oct2020

13
O P E N M A R K E T O P E R A T I O N S D U R I N G 2 0 2 0
Overview AppendixesOperational Flexibility & Resiliency
Selected Balance Sheet Developments
Counterparties Index of Charts & Tables
Contents Primary Credit Program &
Emergency Facilities
Open Market Operations
Financial Market Developments
& Policy Actions
Endnotes
In March, to address the onset of severe market disruptions related to the COVID-19 pandemic, the Desk announced a series of adjustments to repo operations to increase the size and frequency of offerings in order to ensure an ample supply of reserves and smooth functioning of short-term dollar funding markets, in accordance with the FOMC directives at that time. The Desk introduced one-month and three-month term repo operations and added a second daily overnight repo operation to the operation schedule. The offering size of all repo operations was incrementally increased to at least $500 billion, which effectively provided all operation participants with the full amount of funding, or full allotment, requested during each operation. These adjustments were made in accordance with the FOMC’s prevailing directive from March 3, 2020. Overall, the Desk’s offerings of term repo operations included two-week, one-month, and three-month tenor operations. For more information on each policy announcement, see the Timeline of Select Policy Actions.
Beginning in May, the Desk gradually scaled back the frequency of its repo operations to one overnight repo operation per day and one one-month operation per week, as market
conditions stabilized. In mid-June, the offering rates on overnight and one-month term repo operations were adjusted slightly higher to 5 and 10 basis points above the IOER rate, respectively. This adjustment positioned repo operations as a backstop given substantial improvements in U.S. dollar funding market conditions.
Operational resultsIn the first two months of the year, the aggregate outstanding amount of overnight and term repo operations was $184 billion, although this amount trended lower through the first half of February (Chart 4). All overnight repo operations were undersubscribed during this period while term repo operations, which were smaller in size than overnight operations, were frequently oversubscribed. The rates offered on Desk term repo operations were at times a few basis points lower than rates on comparable offerings in private markets.
As conditions in U.S. dollar funding markets began to deteriorate in the first week of March, the initial signs of stress were evident in the Desk’s repo operation as demand increased at
Government money market funds
Prime and tax-exempt money market funds Government-sponsored enterprises
Primary dealers Banks
Total RRP outstanding
Chart 3SOMA Reverse Repo Amounts Outstanding by Counterparty Type
Source: Federal Reserve Bank of New York.Notes: Figures are daily and include overnight and term operations. Money market fund categorizations through October 14, 2016, reflect staff estimates.
100
0
200
300
400
500
2016 2017 2018 2019 2020
Billions of U.S. dollars

14
O P E N M A R K E T O P E R A T I O N S D U R I N G 2 0 2 0
Overview AppendixesOperational Flexibility & Resiliency
Selected Balance Sheet Developments
Counterparties Index of Charts & Tables
Contents Primary Credit Program &
Emergency Facilities
Open Market Operations
Financial Market Developments
& Policy Actions
Endnotes
two overnight operations and the propositions submitted in both operations exceeded the offering sizes of $100 billion. At that time, there were also two two-week operations, each with an offering size of $20 billion, that had bid-to-cover ratios significantly higher than operations earlier in the year (Chart 5). The aggregate amount of term and overnight repos outstanding surged to nearly $500 billion on March 17, the highest level on record, after the Desk increased its repo offerings to provide liquidity in short-term U.S. dollar funding markets. The amount outstanding in overnight repo operations peaked at a record high of $153 billion on that day, when the Desk began to conduct overnight operations in both the morning and afternoon. Term repo outstanding peaked almost a week later at nearly $371 billion on March 23. Treasury and agency MBS collateral bids on average accounted for 52 percent and 47 percent of awards, respectively, for overnight and term operations, while agency debt was minimally used as collateral.
From July 3 to the end of the year, there was no participation in the Desk’s overnight and term repo operations as short-term U.S. dollar funding conditions had stabilized and market participants could access funding at rates lower than the Desk repo offering rate, particularly after the increase in the offering rates in mid-June. There were zero overnight and term repos outstanding at year-end, with the minimal demand reflecting stable funding market conditions supported by abundant liquidity.
CENTRAL BANK LIQUIDITY SWAPSIn 2020, the Desk continued to operate the standing U.S. dollar and foreign currency liquidity swap lines with a network of five other major central banks—the Bank of Canada, Bank of England, Bank of Japan, European Central Bank, and Swiss National Bank.11
The U.S. dollar liquidity swap lines, which involve a temporary exchange of currencies between two central banks, are designed
0
0.5
1.0
1.5
2.0
2.5
3.0
3.5
4.0Ratio
Chart 5
Source: Federal Reserve Bank of New York.
Notes: Diamonds represent the bid-to-cover ratio for each operation. Diamonds in gold represent operations that were oversubscribed during the first week of March 2020. Bars represent the averages for each operation tenor. The chart excludes all operations with an operation limit of $500 billion.
Overnight 1-week and 2-week
4-week
Bid-to-Cover Ratio by Repo Operation Tenor (January 2 to March 13)
Chart 4SOMA Repo Amounts by Tenor
Term repos outstanding Overnight repos outstanding
0
100
200
300
400
500
600
Jan Mar May Jul Sep Nov
Billions of U.S. dollars
Source: Federal Reserve Bank of New York.
Note: No term or overnight repos were outstanding from July 7, 2020, to December 31, 2020.
2020

15
O P E N M A R K E T O P E R A T I O N S D U R I N G 2 0 2 0
Overview AppendixesOperational Flexibility & Resiliency
Selected Balance Sheet Developments
Counterparties Index of Charts & Tables
Contents Primary Credit Program &
Emergency Facilities
Open Market Operations
Financial Market Developments
& Policy Actions
Endnotes
to provide a liquidity backstop to ease strains in global funding markets, thereby helping to mitigate the effects of such strains on the supply of credit to households and businesses, both domestically and abroad.12
In March, in response to disruptions in U.S. dollar funding markets, the FOMC in coordination with the Bank of Canada, Bank of England, Bank of Japan, European Central Bank, and Swiss National Bank made a number of changes to the standing swap lines to enhance the provision of U.S. dollar liquidity to global funding markets. On March 15, the pricing of the existing swap lines was reduced by 25 basis points to a new rate equal to the U.S. dollar overnight index swap (OIS) rate plus 25 basis points, and eighty-four-day U.S. dollar operations were added to existing standing swap line central bank seven-day U.S. dollar operations. On March 20, the frequency of standing swap line central bank seven-day U.S. dollar operations was increased from weekly to daily.
In addition, on March 19, the FOMC reintroduced temporary U.S. dollar liquidity arrangements with nine additional central banks: the Reserve Bank of Australia, Banco Central do Brasil, Danmarks Nationalbank (Denmark), Bank of Korea, Banco de México, Norges Bank (Norway), Reserve Bank of New Zealand, Monetary Authority of Singapore, and Sveriges Riksbank (Sweden).13 The temporary arrangements were initially put in place for at least six months and then extended twice in July and December; they are set to expire in September 2021.
Operational resultsThe total volume of U.S. dollar swap transactions was relatively low in early 2020, with daily aggregate outstanding amounts averaging slightly more than $500 million in the first two months, reflecting stable offshore U.S. dollar funding conditions.
In line with the broad market disruptions related to the COVID-19 pandemic in late March, the total volume of U.S. dollar swap transactions surged after conditions significantly deteriorated in the foreign exchange swap market. The increase in dollar swap transactions also occurred as the FOMC, in collaboration with other central banks, enhanced the swap line arrangements. By late May, the total dollar
volume of transactions related to standing and temporary swap lines peaked at $449 billion, the highest level since the global financial crisis.
Swap transactions across both standing and temporary arrangements were largely concentrated in three-month tenor operations, which accounted for more than 95 percent of the aggregate amount outstanding at peak usage in late May (Chart 6). Ten out of fourteen swap line central banks drew on the liquidity swap lines in 2020, with the highest levels of take-up by the Bank of Japan and the European Central Bank (Chart 7). Among temporary swap line central banks, the majority of take-up came from the Bank of Korea, Monetary Authority of Singapore, and Banco de México.
Source: Federal Reserve Bank of New York.
Notes: Figures are swaps outstanding each Wednesday from swap line central banks. Maturity ranges by tenor category are as follows: 14 days or less for 1-week swaps, between 21 and 35 days for 1-month swaps, and between 70 and 85 days for 3-month swaps.
Chart 6
U.S. Dollar Liquidity Swaps Outstanding by Tenor
1-week 1-month 3-month
50
0
100
150
200
250
300
350
400
450
500
Jan Apr Jul Oct
Billions of U.S. dollars
2020

16
O P E N M A R K E T O P E R A T I O N S D U R I N G 2 0 2 0
Overview AppendixesOperational Flexibility & Resiliency
Selected Balance Sheet Developments
Counterparties Index of Charts & Tables
Contents Primary Credit Program &
Emergency Facilities
Open Market Operations
Financial Market Developments
& Policy Actions
Endnotes
Against a backdrop of improving market conditions, the total dollar volume of swap transactions began to significantly decline after June and, as a result, aggregate outstanding amounts fell as large three-month transactions originated in March and April began to mature. The aggregate balance gradually declined over the remainder of the year, falling to $18 billion by year-end, reflecting improvements in the functioning of global dollar funding markets.
FIMA REPO FACILITYThe Federal Reserve established a new temporary repurchase agreement (repo) facility on March 31 for its foreign and international monetary authority account holders in order to help support the smooth functioning of financial markets, including the U.S. Treasury market, and thus maintain the supply of credit to U.S. households and businesses.14 The facility complemented the U.S. dollar liquidity swap lines as a backstop for dollar funding in a broader range of offshore jurisdictions, and provided a temporary source of U.S. dollar liquidity against Treasury securities, which
could help reduce foreign official sales of Treasury securities and support the functioning of the U.S. Treasury market.
Under the FIMA Repo Facility, FIMA account holders were able to sell Treasury securities held at the New York Fed to the SOMA with an agreement to repurchase the securities the following day. Transactions were conducted at a rate of IOER plus 25 basis points that was designed to generally be above market repo rates when the Treasury market was functioning well, therefore positioning the facility as a backstop. FIMA account holders enrolled in the facility represented a broad range of global regions, economic sizes, and levels of economic development, and accounted for a large share of foreign official ownership of outstanding U.S. Treasury securities. The facility was extended by the FOMC in July and December 2020, each time for an additional six months, providing backstop liquidity to sustain improvements in global U.S. dollar funding markets.
Operational resultsUsage of the facility was minimal throughout the year and largely reflected small-value exercises that took place as part of operational onboarding of approved account holders.
TREASURY SECURITIES OPERATIONSUntil mid-March, the Desk continued to conduct reserve management purchases of approximately $60 billion of Treasury bills per month in accordance with the FOMC directive starting in mid-October 2019. The objective of reserve management purchases was to maintain, over time, ample reserve balances at or above the level that prevailed in early September 2019—a level the Committee judged as supportive of effective control over the federal funds rate. In addition, during the same time period, the Desk continued to reinvest at auction all principal payments from the Federal Reserve’s Treasury securities holdings and to reinvest up to $20 billion of monthly principal payments from the Federal Reserve’s holdings of agency debt and agency MBS into Treasury securities through secondary market purchases across a range of maturities and security types.
To address the severe market disruptions that emerged in March, the Desk purchased Treasury securities at an unprecedented scale and speed, adjusting both the composition and pace of operations
50
0
100
150
200
250
Swiss National BankBank of Japan Bank of EnglandEuropean Central BankTemporary swap line central banks
Chart 7U.S. Dollar Liquidity Swaps Outstanding by Central Bank
Source: Federal Reserve Bank of New York.
Notes: Figures are swaps outstanding each Wednesday from swap line central banks. Temporary swap line central banks that had outstanding amounts include the Bank of Korea, Monetary Authority of Singapore, Banco de México, Reserve Bank of Australia, Danmarks Nationalbank, and Norges Bank.
Billions of U.S. dollars
Jan2020
Apr Jul Oct

17
O P E N M A R K E T O P E R A T I O N S D U R I N G 2 0 2 0
Overview AppendixesOperational Flexibility & Resiliency
Selected Balance Sheet Developments
Counterparties Index of Charts & Tables
Contents Primary Credit Program &
Emergency Facilities
Open Market Operations
Financial Market Developments
& Policy Actions
Endnotes
in accordance with FOMC directives to support smooth market functioning. These changes occurred in several stages in response to evolving developments. Initially, on March 12, the Desk announced that its reserve management purchases would be conducted across a range of Treasury maturities. The following day, the Desk purchased $37 billion of the $80 billion in Treasury reinvestments and reserve management purchases that had been scheduled for the mid-March to mid-April period. Subsequently, on March 15 the FOMC directed the Desk to increase its holdings of Treasury securities by at least $500 billion, while continuing to reinvest at auction all principal payments from Treasury securities holdings. By March 20, the Desk had purchased $272 billion of the $500 billion minimum of Treasury securities authorized by the FOMC. On March 23, the FOMC directed the Desk to increase its Treasury securities holdings in the amounts needed to support the smooth functioning of markets for these securities. For more information on each policy announcement, see the Timeline of Select Policy Actions.
By June, Treasury market functioning had improved markedly. At its meeting that month, the FOMC transitioned the objective of its purchases from supporting to sustaining smooth market functioning, and instructed the Desk to increase holdings of Treasury securities at least at the existing pace—equivalent to approximately $80 billion per month—to sustain smooth market functioning.15 In September, the FOMC expanded the objective of asset purchases to include helping to foster accommodative financial conditions, thereby supporting the flow of credit to households and businesses. At its December meeting, the FOMC instructed the Desk to increase its holdings of Treasury securities by at least $80 billion per month, and indicated that this would continue until substantial further progress has been made toward the Committee’s maximum employment and price stability goals.
OUTRIGHT PURCHASES OF TREASURY SECURITIESRESERVE MANAGEMENT PURCHASES
Operational results From early January through mid-March, the Desk conducted approximately $180 billion of reserve management purchases, including $37 billion of Treasury coupon securities purchased on March 13 as an initial response to the market disruptions at that time (Chart 8). The average offer-to-cover ratio, which measures
total offering amounts relative to purchase amounts in a given operation, was 3.3 on purchases through March 12.
REINVESTMENTS OF AGENCY SECURITY PRINCIPAL PAYMENTS
Operational results From January to March 15, the Desk reinvested $51 billion of principal payments from agency debt and agency MBS holdings into Treasury securities through secondary market purchases conducted across a range of maturities and security types16
(Chart 9). These purchases were in addition to the operations to conduct reserve management purchases described above.
TREASURY SECURITY ASSET PURCHASES
Operational results In response to unprecedented disruptions in market functioning, beginning in mid-March, the Desk purchased Treasury securities at an unparalleled scale and speed. The pace of asset purchases peaked at roughly $75 billion per day in late March, before being reduced in stages as various metrics of market functioning and liquidity conditions stabilized (Chart 8). By the June FOMC meeting, the pace of Treasury security asset purchases decreased to average amounts of around $4 billion per day, or roughly $80 billion per month. (See Box 1, “Metrics Used by the Desk to Assess Market Functioning and Liquidity Conditions,” page 25.) Cumulatively, the Desk purchased approximately $2 trillion of Treasury securities between March 15 and the end of 2020.
Between March and December, the Desk’s Treasury security asset purchase operations generally received offers with favorable pricing relative to market and theoretical prices. Offer-to-cover ratios, which measure total amounts offered by primary dealers relative to the amounts purchased, were robust. Specifically, offer-to-cover ratios averaged 1.9 even when purchases were sizable—generally exceeding $30 billion per day—during the period of severe market disruption from March 16 to April 15. Over the remainder of the year, as Treasury market liquidity improved and daily purchases declined, the offer-to-cover ratios gradually increased as a reflection of the reduced operation size, averaging 2.6 from mid-April through December.

18
O P E N M A R K E T O P E R A T I O N S D U R I N G 2 0 2 0
Overview AppendixesOperational Flexibility & Resiliency
Selected Balance Sheet Developments
Counterparties Index of Charts & Tables
Contents Primary Credit Program &
Emergency Facilities
Open Market Operations
Financial Market Developments
& Policy Actions
Endnotes
0
100
200
300
400
500
600
700
800
0-2¼ yrs 2¼-4½ yrs 4½-7 yrs 7-20 yrs 20-30 yrs FRNs TIPS Bills
Source: Federal Reserve Bank of New York.
Billions of U.S. dollars
Chart 9Distribution of SOMA Outright Treasury Purchases across Sectors in 2020
Reinvestment of agency security principal payments Treasury security asset purchases Reserve management purchases
0
100
200
300
400
500
600
700
800
900
1,000
Jan
2020
Feb Mar Apr May Jun Jul Aug Sep Oct Nov Dec
Reinvestment of Treasury securitiesTreasury security asset purchases
Reinvestment of principal payments on agency securitiesReserve management purchases
Chart 8SOMA Treasury Transactions
Notes: Monthly purchases are calculated on a calendar that starts on the tenth business day of the month and goes to the ninth business day of the following month. Monthly purchase amounts shown in the chart are aggregated by calendar month. Some $37 billion of purchases on March 13 are categorized as reserve management purchases.
Billions of U.S. dollars
Source: Federal Reserve Bank of New York.

19
O P E N M A R K E T O P E R A T I O N S D U R I N G 2 0 2 0
Overview AppendixesOperational Flexibility & Resiliency
Selected Balance Sheet Developments
Counterparties Index of Charts & Tables
Contents Primary Credit Program &
Emergency Facilities
Open Market Operations
Financial Market Developments
& Policy Actions
Endnotes
REINVESTMENTS REINVESTMENTS OF TREASURY SECURITY PRINCIPAL PAYMENTS
Operational resultsThe principal payments from maturing Treasury securities held by the SOMA were rolled over at auction into newly issued Treasury securities. In each case, the maturity date of the Treasury security coincided with the issuance date of the securities that were acquired at auction, such that all principal payments were immediately reinvested in full. Maturing Treasury coupons were rolled over into newly issued coupon securities and maturing Treasury bills were rolled over into newly issued Treasury bills. Maturing amounts were apportioned pro rata based on the issuance amounts of securities that settled on the matching maturity date (Chart 10).
The Desk rolled over $1.27 trillion of maturing Treasury securities holdings at auction in 2020, up from $265 billion in 2019; of the 2020 total, $806 billion were in Treasury bills, since the larger holdings of Treasury bills following the reserve management purchases in late 2019 and early 2020 resulted in larger and more frequent rollover operations.
SECURITIES LENDINGTo support the effective conduct of open market operations, the Desk continued to lend eligible Treasury and agency debt securities held in the SOMA to dealers on an overnight basis. These operations provide a secondary and temporary source of securities to the financing market to promote the smooth clearing of Treasury and agency securities. Lending Treasury securities may help mitigate periods of scarcity or elevated fails.
Operational resultsDuring 2020, SOMA securities lending volumes in Treasury securities averaged $30 billion per day, the highest daily average volume for any year since data collection began in 1999. Still, securities lending volumes as a proportion of SOMA holdings of Treasury securities and total marketable Treasury debt outstanding remained within recent historical ranges. In March and April, average daily volumes rose to $34 billion and $36 billion, respectively (Chart 11), as benchmark securities traded with a premium in the collateral market. This was partly a result of Treasury auction cycle dynamics, in which investor demand to borrow benchmark securities from the SOMA often becomes elevated ahead of new issuance or reopenings, and partly a factor of strong investor demand for bills beginning in mid-March against the backdrop of a marketwide move toward the most
Chart 10Distribution of Reinvestments at Treasury Auctions in 2020
0
100
200
300
400
500
600
700
800
900
100
20
30
40
50
60
70
80
90100
2-yr note 3-yr note 5-yr note 7-yr note 10-yr note 20-yr note 30-yr bond TIPS FRNs Bills(right scale)
Billions of U.S. dollars Billions of U.S. dollars
Source: Federal Reserve Bank of New York.
Note: Bars show the cumulative amount of Treasury securities acquired through reinvestments in 2020.

20
O P E N M A R K E T O P E R A T I O N S D U R I N G 2 0 2 0
Overview AppendixesOperational Flexibility & Resiliency
Selected Balance Sheet Developments
Counterparties Index of Charts & Tables
Contents Primary Credit Program &
Emergency Facilities
Open Market Operations
Financial Market Developments
& Policy Actions
Endnotes
liquid, cash-like instruments. These factors prompted specialness in borrowing for benchmark securities and an increase in SOMA lending of bills.
Elevated borrowing persisted until mid-April, when bill supply increased significantly and caused specialness to subside. Though volumes declined somewhat after April, they remained at relatively elevated levels compared to 2019. This was partly a result of the SOMA portfolio comprising a larger share of the outstanding issuance of Treasury securities than had been the case previously, including securities that are in high demand among market participants. Despite record average lending volumes during 2020, the volume-weighted average award rate on Treasury securities was around 8 basis points, somewhat lower compared to levels in 2019, as the notable increase in Treasury supply dampened scarcity and reduced specialness, particularly during the second half of 2020.
AGENCY MBS AND AGENCY CMBS OPERATIONS
At the start of the year, the Desk was redirecting principal payments received on agency MBS to purchases of Treasury securities, consistent with the FOMC’s intent to hold primarily Treasury securities in the long run. In order to ensure the gradual and predictable run-off of SOMA agency securities holdings, prepayments in excess of $20 billion per month were reinvested into agency MBS.
To address the severe market disruptions that emerged in March, the FOMC halted the run-off of its agency MBS holdings. On March 15, the FOMC directed the Desk to increase its holdings of agency MBS by at least $200 billion and to reinvest all principal payments from holdings of agency debt and agency MBS into agency MBS. On March 23, in conjunction with a similar directive for purchases of Treasury securities, the FOMC instructed the Desk to purchase agency MBS in the amounts needed to support smooth market functioning; the FOMC also directed the Desk to purchase agency CMBS. Under these directives, purchases were conducted at an unprecedented pace and adjustments were made to the timing of settlements to support market functioning. The FOMC also directed the Desk to conduct dollar rolls and coupon swaps as necessary to facilitate settlement of the Federal Reserve’s agency MBS transactions. For more information on each policy announcement, see the Timeline of Select Policy Actions.
By June, agency MBS market functioning had improved markedly. At its meeting that month, the FOMC transitioned the objective of its purchases from supporting to sustaining smooth market functioning and instructed the Desk to increase holdings of agency MBS at least at the current pace—equivalent to approximately $40 billion per month—to sustain smooth functioning of markets for these securities. The FOMC also continued to direct the Desk to reinvest all principal payments from holdings of agency debt and agency MBS in agency MBS. In September, the FOMC expanded the objective of asset purchases to include helping to foster accommodative financial conditions, thereby supporting the flow of credit to households and businesses. At its December meeting, the FOMC instructed the Desk to increase holdings of agency MBS by at least $40 billion per month, and indicated that this would continue until substantial further
10
20
30
40
5
0
10
15
20
25
30
35
5
0
15
25
35
40
2016 2017 2018 2019 2020
Securities lending (left scale)Weighted average award rate (right scale)
Chart 11SOMA Securities Lending in Treasuries
Source: Federal Reserve Bank of New York.
Note: Figures are monthly averages of daily lending results.
Billions of U.S. dollars Basis points

21
O P E N M A R K E T O P E R A T I O N S D U R I N G 2 0 2 0
Overview AppendixesOperational Flexibility & Resiliency
Selected Balance Sheet Developments
Counterparties Index of Charts & Tables
Contents Primary Credit Program &
Emergency Facilities
Open Market Operations
Financial Market Developments
& Policy Actions
Endnotes
progress has been made toward the Committee’s maximum employment and price stability goals.
During this time market functioning also improved for agency CMBS. At its June meeting, the FOMC instructed the Desk to continue to increase holdings of agency CMBS to sustain the smooth functioning of these markets. From September to the end of the year, the FOMC directed the Desk to purchase agency CMBS as needed to sustain smooth functioning of markets for these securities and to cease reinvestments of principal payments from agency CMBS into agency CMBS.
AGENCY MBSREINVESTMENTS OF PRINCIPAL PAYMENTS
Operational results From January to mid-March, the Desk reinvested $7.4 billion of agency MBS principal payments into agency MBS (Chart 12).17 Purchases were conducted in securities with coupons between
2.5 and 3.5 percent and spread across thirty- and fifteen-year Uniform MBS (UMBS) issued by Fannie Mae and Freddie Mac, and thirty-year Ginnie Mae.
AGENCY MBS ASSET PURCHASES
Operational results In response to unprecedented disruptions in market functioning, beginning in mid-March the Desk purchased agency MBS at an unparalleled scale and speed. In gross terms, the daily pace of asset purchases peaked at roughly $37 billion on average per day for the week of March 23, before being reduced in stages as various metrics of market functioning and liquidity showed signs of stabilization. (See Box 1, “Metrics Used by the Desk to Assess Market Functioning and Liquidity Conditions,” page 25.) The average gross monthly purchase amount from June to December was $112 billion; the steady declines in thirty-year primary mortgage rates during 2020 led to increased incentive for homeowners to refinance their mortgages, which in turn led to elevated paydowns on SOMA agency MBS holdings (Chart 12).
-50
50
0
100
150
200
400
450
500
2016 2017 2018 2019 2020
Agency MBS asset purchasesRedemptions
Reinvestments from principal payments on SOMA agency debtReinvestments from principal payments on SOMA agency MBS
Chart 12SOMA Agency MBS Transactions
Source: Federal Reserve Bank of New York.
Note: Reinvestment and agency MBS asset purchases occur from mid-month to the following mid-month.
Billions of U.S. dollars

22
O P E N M A R K E T O P E R A T I O N S D U R I N G 2 0 2 0
Overview AppendixesOperational Flexibility & Resiliency
Selected Balance Sheet Developments
Counterparties Index of Charts & Tables
Contents Primary Credit Program &
Emergency Facilities
Open Market Operations
Financial Market Developments
& Policy Actions
Endnotes
Cumulatively, the Desk purchased approximately $1.46 trillion of agency MBS from March 15 to the end of 2020, including reinvestments of principal payments.18 On net, settled SOMA holdings of agency MBS increased by $620 billion over the course of 2020.
The asset purchases during the peak period of market volatility in March were spread across securities with coupons between 2.0 and 4.5 percent. The agency MBS with these coupons had been produced in recent quarters, and they coincided with the coupons of the MBS that market participants sought to sell during that time period. As Treasury yields moved lower as a result of the shift in the economic outlook, lower primary mortgage rates drove a notable increase in the market’s production of lower-coupon agency MBS, including thirty-year MBS with a coupon as low as 1.5 percent. Therefore, on the year as a whole, the Desk purchased securities with lower coupons compared to the prior year. In 2020, purchases of thirty-year securities were concentrated in 2.0 and 2.5 percent coupons. Similarly, fifteen-year securities purchases were largely in 2.0 percent coupons in 2020, versus 2.5 percent in 2019. More than 89 percent of the Desk’s asset purchases in 2020 were of thirty-year UMBS (Fannie Mae and Freddie Mac), and Ginnie Mae securities, which make up the majority of issuance among the three agencies in the to-be-announced (TBA) market (Table 2). The remainder of the asset purchases consisted of fifteen-year Fannie Mae and Freddie Mac securities (Charts 13 and 14).
The Desk can settle agency MBS—that is, take delivery of purchased securities—up to three months after the trade date. During the severe market disruption in March, some securities were purchased with a specific settlement date that was within a few days of the transaction date, rather than the typical longer-dated settlement for a transaction in the TBA market (for example, two days forward as opposed to one month forward). The switch to earlier settlement dates was made in certain cases in order to address the surge in demand for cash that prevailed in mid- to late March.19
DOLLAR ROLLS AND AGENCY MBS MARKET FUNCTIONING
Operational results Given the forward-settling nature of the Desk’s agency MBS transactions in the TBA market, agency MBS can become scarce in the market during the time between a transaction’s trade date and its settlement date. In these instances, the Desk may conduct dollar roll sales, which effectively delay settlement to a future date.20 Dollar roll sales allow dealers more time to obtain securities required to settle transactions, in exchange for a market price that compensates the Federal Reserve for the delay in settlement. The Desk rolled $154.2 billion of settlements, representing an average of 10 percent of the Desk’s expected settlements during the year (Chart 15). With the record issuance volumes and Desk rolling activity, settlement of the Desk’s agency MBS purchases was smooth throughout 2020.
CUSIP AGGREGATION
In the first few months of 2020, the Desk continued an effort to consolidate many small, individual agency MBS into fewer and larger-value securities. Through this process, known as CUSIP aggregation, a number of existing agency MBS with similar characteristics were consolidated into one larger security in order to lower operational risk, simplify back-office portfolio administration, and trim custodial costs, which are assessed on a per-CUSIP basis. During this time period, 6,126 CUSIPs were consolidated into forty new agency MBS. As Desk activities shifted to address the severe market disruptions related to the COVID-19 pandemic and the Desk conducted substantial agency MBS purchases, no further CUSIP aggregation activity took place for the remainder of the year.
AGENCY CMBSAGENCY CMBS ASSET PURCHASES Operational results The Desk purchased $10.1 billion in agency CMBS from March to December, of which roughly $100 million represented reinvestment of principal payments. The asset purchases were composed of $7.2 billion of Fannie Mae Delegated Underwriting and Servicing (FNMA DUS) pools, $1 billion of Freddie Mac K

23
O P E N M A R K E T O P E R A T I O N S D U R I N G 2 0 2 0
Overview AppendixesOperational Flexibility & Resiliency
Selected Balance Sheet Developments
Counterparties Index of Charts & Tables
Contents Primary Credit Program &
Emergency Facilities
Open Market Operations
Financial Market Developments
& Policy Actions
Endnotes
series, and $1.9 billion of Ginnie Mae Project Loans. The pace of asset purchases averaged $859 million per operation during late March and early April, then declined throughout the rest of the year, averaging around $90 million per operation. Desk operations were concentrated in Fannie Mae securities, especially in the early stage of the program, reflecting significant disruptions in market functioning for those securities. Desk CMBS asset purchases averaged approximately 1.2 percent of the amount outstanding over the course of 2020 (Table 3).
Initially, the offer-to-cover ratio on CMBS operations was relatively high, peaking at 5.6 in late April. Subsequently, offer-to-cover ratios declined, and in the second half of the year were at or below 1 as market conditions improved.
20
0
40
60
80
100
1.5%
SOMA Purchases of Fifteen-Year Agency MBS by Coupon
Source: Federal Reserve Bank of New York.
Note: Figures are monthly and exclude purchases conducted for the purpose of testing operational readiness. a The Desk did not conduct reinvestment purchases of fifteen-year agency MBS from November 2018 through May 2019, as monthly principal payments of agency MBS were below the $20 billion reinvestment cap.
Percent
Chart 14
2.0% 2.5% 3.0% 3.5% 4.0%
20
40
60
80
100
0
2016 2017 2018 2019 2020
1.5% 2.0% 2.5% 3.0% 3.5% 4.0% 4.5%
Chart 13SOMA Purchases of Thirty-Year Agency MBS by Coupon
Source: Federal Reserve Bank of New York.
Note: Figures are monthly and exclude purchases conducted for the purpose of testing operational readiness. a The Desk did not conduct reinvestment purchases of thirty-year agency MBS from November 2018 through April 2019, as monthly principal payments of agency MBS were below the $20 billion reinvestment cap.
Percent
2016 2017 2018 2019 2020
a a
10
00
20
30
40
10
20
30
40
50
2016 2017 2018 2019 2020
PercentBillions of U.S. dollars
Chart 15SOMA Dollar Roll Sales
Total (left scale)Share of expected settlements (right scale)
Source: Federal Reserve Bank of New York.
Notes: Figures are monthly by settlement month. Share of expected settlements is calculated excluding purchases conducted for the purpose of testing operational readiness.
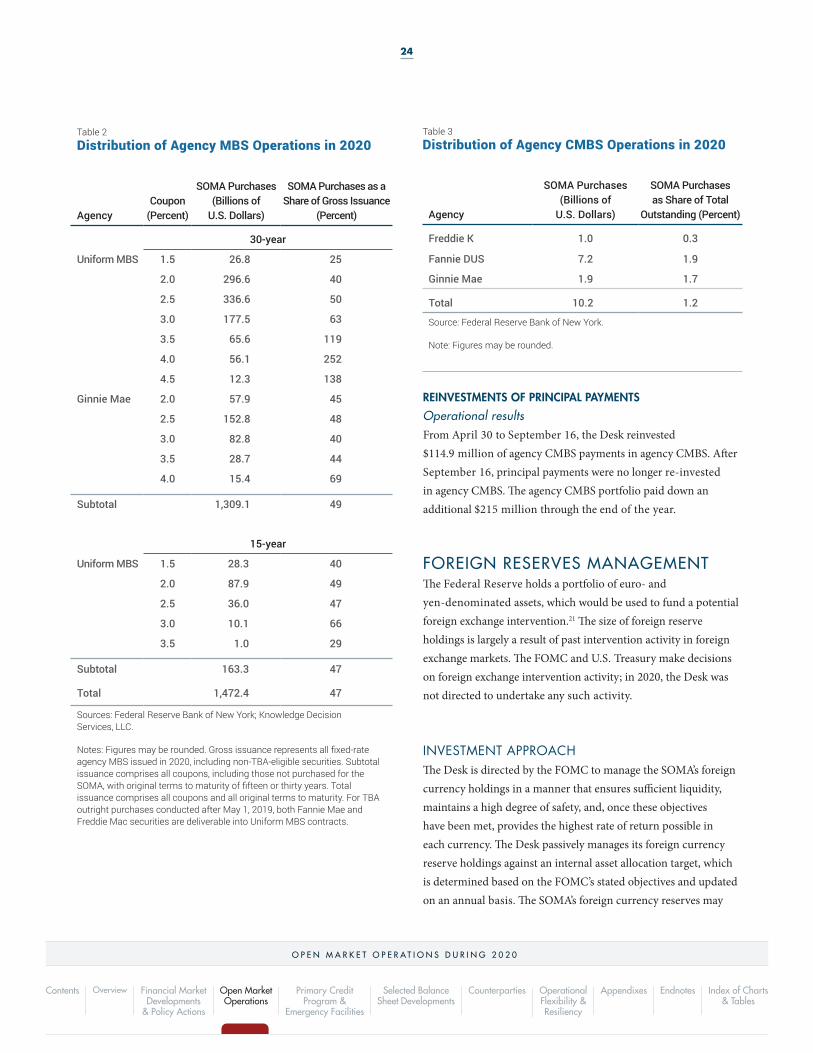
24
O P E N M A R K E T O P E R A T I O N S D U R I N G 2 0 2 0
Overview AppendixesOperational Flexibility & Resiliency
Selected Balance Sheet Developments
Counterparties Index of Charts & Tables
Contents Primary Credit Program &
Emergency Facilities
Open Market Operations
Financial Market Developments
& Policy Actions
Endnotes
REINVESTMENTS OF PRINCIPAL PAYMENTS
Operational results From April 30 to September 16, the Desk reinvested $114.9 million of agency CMBS payments in agency CMBS. After September 16, principal payments were no longer re-invested in agency CMBS. The agency CMBS portfolio paid down an additional $215 million through the end of the year.
FOREIGN RESERVES MANAGEMENT The Federal Reserve holds a portfolio of euro- and yen-denominated assets, which would be used to fund a potential foreign exchange intervention.21 The size of foreign reserve holdings is largely a result of past intervention activity in foreign exchange markets. The FOMC and U.S. Treasury make decisions on foreign exchange intervention activity; in 2020, the Desk was not directed to undertake any such activity.
INVESTMENT APPROACH The Desk is directed by the FOMC to manage the SOMA’s foreign currency holdings in a manner that ensures sufficient liquidity, maintains a high degree of safety, and, once these objectives have been met, provides the highest rate of return possible in each currency. The Desk passively manages its foreign currency reserve holdings against an internal asset allocation target, which is determined based on the FOMC’s stated objectives and updated on an annual basis. The SOMA’s foreign currency reserves may
Table 2 Distribution of Agency MBS Operations in 2020
AgencyCoupon
(Percent)
SOMA Purchases (Billions of
U.S. Dollars)
SOMA Purchases as a Share of Gross Issuance
(Percent)
30-year
Uniform MBS 1.5 26.8 25
2.0 296.6 40
2.5 336.6 50
3.0 177.5 63
3.5 65.6 119
4.0 56.1 252
4.5 12.3 138
Ginnie Mae 2.0 57.9 45
2.5 152.8 48
3.0 82.8 40
3.5 28.7 44
4.0 15.4 69
Subtotal 1,309.1 49
15-year
Uniform MBS 1.5 28.3 40
2.0 87.9 49
2.5 36.0 47
3.0 10.1 66
3.5 1.0 29
Subtotal 163.3 47
Total 1,472.4 47
Sources: Federal Reserve Bank of New York; Knowledge Decision Services, LLC.
Notes: Figures may be rounded. Gross issuance represents all fixed-rate agency MBS issued in 2020, including non-TBA-eligible securities. Subtotal issuance comprises all coupons, including those not purchased for the SOMA, with original terms to maturity of fifteen or thirty years. Total issuance comprises all coupons and all original terms to maturity. For TBA outright purchases conducted after May 1, 2019, both Fannie Mae and Freddie Mac securities are deliverable into Uniform MBS contracts.
Table 3 Distribution of Agency CMBS Operations in 2020
Agency
SOMA Purchases (Billions of
U.S. Dollars)
SOMA Purchases as Share of Total
Outstanding (Percent)
Freddie K 1.0 0.3
Fannie DUS 7.2 1.9
Ginnie Mae 1.9 1.7
Total 10.2 1.2
Source: Federal Reserve Bank of New York.
Note: Figures may be rounded.

25
O P E N M A R K E T O P E R A T I O N S D U R I N G 2 0 2 0
Overview AppendixesOperational Flexibility & Resiliency
Selected Balance Sheet Developments
Counterparties Index of Charts & Tables
Contents Primary Credit Program &
Emergency Facilities
Open Market Operations
Financial Market Developments
& Policy Actions
Endnotes
In response to the significant disruptions
in market functioning, beginning
in mid-March, the Desk purchased
Treasury securities and agency MBS
at an unprecedented scale and speed.
The design of the Treasury and agency
MBS purchase programs during 2020
was distinct from that of previous asset
purchase programs in both its purpose
—to address disruptions in market
functioning—and its pace and size.
The Desk employed a framework of
metrics on market functioning to inform
the pace and size of asset purchases.
Specifically, the Desk monitored market
functioning indicators in four separate
categories, and also took into account
a range of other information. Two
categories of indicators—liquidity
and relative value metrics—represent
direct measures of market functioning,
while the third and fourth categories—
measures of trading pressure and
results of open market operations—
assess market functioning in a more
indirect manner. These metrics
indicated a significant deterioration
in the functioning of Treasury and
agency MBS markets in mid-March.
Direct Metrics
Liquidity measures. These
measures reflect the ability of market
participants to execute transactions
at reasonable costs. They include
bid-ask spreads, which are a proxy
for the compensation that liquidity
providers require in exchange for
taking risk, such as the possibility
of adverse price moves. They also
include price impact measures,
which indicate the impact of trade
execution on prevailing market prices.
Relative value measures.
These measures indicate whether
closely related securities are priced
similarly, as is typically expected
in a smoothly functioning market.
Persistent divergences in the prices
of instruments with similar cash flows
can suggest that arbitrage between
markets is not functioning well.
Relative value measures include the
Treasury cash-futures basis, which
can indicate dislocations between the
cash market for Treasury securities
and the futures market; differences
in yields between on-the-run and
off-the-run Treasury securities,
which can show whether investors
are willing to pay an unusually large
premium for the enhanced liquidity
of more recently issued securities;
and spline errors, which demonstrate
differences in yield between Treasury
securities with very similar maturities.
Spreads between agency MBS and
Treasury yields are also a relative
value measure and may suggest a
preference for the liquidity of Treasury
securities, but can also reflect other
differences, such as prepayment
risk, that are unique to MBS.
Indirect Metrics
Measures of trading pressure.
These indicators may reveal forces
that can lead to dysfunction, but do
not directly show how well markets
are working. Such forces can include
imbalances between the volume
of sales and volume of purchases,
constraints at intermediaries, and
increases in investors’ demand for
market liquidity. The Desk’s measures
of trading pressure include dealer
inventories, holdings of foreign
official accounts (see chart), and
data on client-initiated transactions.
Results of open market
operations. Increased
offer-to-cover ratios in the Desk’s
operations can signal that market
participants have an intense desire
to sell securities, which may reflect
broader trading pressures or other
challenges to market functioning.
Each of the above market functioning
indicators in the Treasury and agency
MBS markets improved significantly
after the period of extreme stress
in mid-March, supported by asset
purchases and other policy measures.
For the remainder of the year, the Desk
continued to monitor various direct
and indirect measures of financial
market functioning and prepared
to adjust operations as needed.
Box 1 METR ICS USED BY THE DESK TO ASSESS MARKET FUNCT IONING AND L IQUID ITY CONDIT IONS
-60
-50
-40
-30
-20
-10
0
10
20
30
Jan Feb Mar Apr May Jun Jul SepAug Oct Nov Dec
Weekly Changes in Treasury Securities in Custody for Foreign Official Accounts
Source: Board of Governors of the Federal Reserve System.
Note: Reflects Treasury securities held in custody by the Federal Reserve for foreign official and international accounts.
Billions of U.S. dollars

26
O P E N M A R K E T O P E R A T I O N S D U R I N G 2 0 2 0
Overview AppendixesOperational Flexibility & Resiliency
Selected Balance Sheet Developments
Counterparties Index of Charts & Tables
Contents Primary Credit Program &
Emergency Facilities
Open Market Operations
Financial Market Developments
& Policy Actions
Endnotes
be invested on an outright basis in German, French, Dutch, and Japanese government securities, as well as in deposits at the Bank for International Settlements and at foreign central banks such as the Deutsche Bundesbank, Banque de France, and Bank of Japan.
INVESTMENT ACTIVITY In 2020, the Desk purchased foreign sovereign debt securities in the secondary market in order to meet the portfolio asset allocation target. The Desk also continued to maintain holdings of cash in various official accounts. As of year-end 2020, the
SOMA foreign currency portfolio, on an amortized cost basis, totaled $22.2 billion, compared with $20.7 billion at the end of 2019. Since no transactions associated with foreign exchange intervention were undertaken and the interest income received was minimal given the low interest rate environment in the euro area and Japan, changes in the portfolio’s U.S. dollar market value largely reflected the change in the foreign exchange value of the dollar against the euro and Japanese yen over the year.22 (Foreign currency–denominated holdings are described further in the “Selected Balance Sheet Developments” section of this report.)
27
PRIMARY CREDIT PROGRAM AND EMERGENCY CREDIT AND LIQUIDITY FACILITIES
O P E N M A R K E T O P E R A T I O N S D U R I N G 2 0 2 0
Overview AppendixesOperational Flexibility & Resiliency
Selected Balance Sheet Developments
Counterparties Index of Charts & Tables
Contents Primary Credit Program &
Emergency Facilities
Open Market Operations
Financial Market Developments
& Policy Actions
Endnotes
In unusual and exigent circumstances, the Federal Reserve, with approval of the Secretary of the Treasury, can take steps to support the flow of credit to households, businesses, and communities using authorities under Section 13(3) of the Federal Reserve Act. In 2020, severe dislocations arose in a number of financial markets and the Federal Reserve established a set of emergency credit and liquidity facilities to support the flow of credit throughout the economy. Continued disruptions across financial markets could quickly have made it more difficult for consumers to fund purchases, for businesses to fund their operations and pay their workers, and for state and local governments to pay for essential services. The Federal Reserve also made adjustments to the primary credit program—its long-standing discount window lending program—to encourage usage and support the ability of banks to make lower-cost, longer-term loans to households and businesses.
Collectively, these actions supported the flow of credit to households, businesses, and state and local governments by providing backstops to key funding markets and giving investors confidence that the Federal Reserve would provide liquidity and credit if needed in those markets. All emergency facilities were established with approval from the U.S. Treasury. Some of the emergency facilities had first been established during the global financial crisis in 2008 and were renewed to address disruptions related to the COVID-19 pandemic, while others were completely new.
Market functioning and liquidity conditions in the funding and credit markets targeted by the programs improved substantially after announcement of the facilities. In short-term money markets, the announcements of the Commercial Paper Funding
Facility (CPFF), Money Market Mutual Fund Liquidity Facility (MMLF), and Primary Dealer Credit Facility (PDCF) contributed to substantial improvement in market conditions as redemptions among prime money market mutual funds declined and spreads narrowed. These facilities were designed to provide funding at a rate that would be attractive in stressed market conditions, and less attractive as markets stabilized and market rates declined to more normal levels.
In the wake of the announcements of the Primary Market Corporate Credit Facility (PMCCF), Secondary Market Corporate Credit Facility (SMCCF), Municipal Liquidity Facility (MLF), and Term Asset-Backed Securities Loan Facility (TALF), conditions in corporate credit, municipal bond, and asset-backed securities markets improved substantially and spreads narrowed, which supported new issuance. The SMCCF’s purchases increased at a moderate pace after commencement and then tapered during the remainder of the year; the PMCCF did not conduct any purchases. The MLF was used by a few municipal debt issuers; however, overall usage remained well below the program’s total lending capacity. Lending under the TALF, a facility that supported the issuance of asset-backed securities, continued at low levels over the reminder of the year as pricing was marginally attractive for certain collateral types.
The Paycheck Protection Program Liquidity Facility (PPPLF) and Main Street Lending Program (MSLP) facilitated loans to small and medium-sized businesses and experienced ongoing activity after the programs launched until the end of the year. The PPPLF had the largest outstanding balances of all the facilities consistently throughout the year. The MSLP loan

28
O P E N M A R K E T O P E R A T I O N S D U R I N G 2 0 2 0
Overview AppendixesOperational Flexibility & Resiliency
Selected Balance Sheet Developments
Counterparties Index of Charts & Tables
Contents Primary Credit Program &
Emergency Facilities
Open Market Operations
Financial Market Developments
& Policy Actions
Endnotes
participation purchases accelerated in the final weeks of the program (Chart 16).
Authority for purchases or lending under the PMCCF, SMCCF, TALF, and MLF expired on December 31.23 The termination of authority for purchasing loan participations under the MSLP was extended from December 31 to January 8, 2021, to allow more time to process loan purchases submitted on or before December 14. The authorization for purchases or loans under the CPFF, MMLF, and PDCF expired on March 31, 2021.24 Authority for the PPPLF will continue until June 30, 2021.25
To promote transparency regarding the activities of the emergency facilities, the Federal Reserve Board published term sheets that describe the rules for the programs, FAQs explaining the
purpose, design, and operational details of the programs, and reports to Congress. All are available online at https://www.federalreserve.gov/funding-credit-liquidity-and-loan-facilities.htm.
PRIMARY CREDIT PROGRAMThe Federal Reserve’s primary credit program serves as a backup source of liquidity for depository institutions in generally sound financial condition and with appropriate collateral pledged to a Reserve Bank. Loans are initiated by depository institutions and approved by Reserve Banks. In March 2020, the Board of Governors announced numerous changes to the primary credit program to encourage usage and support the flow of credit to businesses and households. On March 4, the Board approved a decrease in the primary credit rate of 50 basis points to 1.75 percent, in conjunction
40
0
80
120
160
Feb 26 Mar Apr May Jun Jul Aug Sep Oct Nov Dec
PCP TALF MSLP MLF SMCCF PPPLF CPFF MMLF PDCF
Chart 16Usage of Primary Credit Program and Emergency Facilities
Billions of U.S. dollars
Sources: Board of Governors of the Federal Reserve System; Federal Reserve Bank of New York.
Notes: Data reflect the weekly Wednesday level for the Primary Credit Program (PCP), the Commercial Paper Funding Facility (CPFF), the Main Street Lending Program (MSLP), the Money Market Mutual Fund Liquidity Facility (MMLF), the Municipal Liquidity Facility (MLF), the Paycheck Protection Program Liquidity Facility (PPPLF), the Primary Dealer Credit Facility (PDCF), the Secondary Market Corporate Credit Facility (SMCCF), and the Term-Asset Backed Securities Loan Facility (TALF). The CPFF, MLF, and TALF include facility asset purchases in book value. The SMCCF includes corporate bonds at book value and ETFs at fair value. The MSLP includes loan participations, net of an allowance for loan losses, at face value. No transactions occurred under the Primary Market Corporate Credit Facility (PMCCF) during the period it was operational.
2020

29
O P E N M A R K E T O P E R A T I O N S D U R I N G 2 0 2 0
Overview AppendixesOperational Flexibility & Resiliency
Selected Balance Sheet Developments
Counterparties Index of Charts & Tables
Contents Primary Credit Program &
Emergency Facilities
Open Market Operations
Financial Market Developments
& Policy Actions
Endnotes
with the FOMC’s decision to lower the federal funds target range by 50 basis points. On March 16, the Board approved a further decrease in the primary credit rate, lowering it by another 150 basis points to 0.25 percent, in line with a 100 basis point decline in the federal funds target range and the elimination of the 50 basis point spread between the primary credit rate and the top end of the federal funds target range. The Board also announced on the same date that primary credit loans could be granted for terms of up to ninety days, a significant extension from primarily overnight terms offered up until that time. This extension remained in place for the rest of the year.
Borrowings under the primary credit program rose sharply from a near zero balance at the start of the year to a peak balance of $51.3 billion in late March, the highest level since 2009. During April, outstanding amounts of primary credit loans began to decline significantly, reaching a level of $3.9 billion by the end of July and then averaging $2.6 billion for the remainder of the year. At year-end, borrowings under the primary credit program totaled $1.6 billion, compared to an average year-end level of $58.6 million for the past three years. A total of 5,951 primary credit loans were granted in 2020, up sharply from 2,397 loans in 2019. Close to three-quarters of the loans were non-test loans, in contrast to previous years when test loans comprised the vast majority of loans.26 Term borrowing under primary credit was substantial, with a total of 1,323 term loans representing more than 40 percent of the total amount originated under the facility during the year. Small domestic banks accounted for the majority of the primary credit loan originations, both in number of loans and total amounts borrowed. Domestic global systemically important banks (G-SIBs) and foreign banking organizations also engaged in substantial borrowing, together accounting for more than 25 percent of the total amount of primary credit program loan originations.
FEDERAL RESERVE EMERGENCY CREDIT AND LIQUIDITY FACILITIES
PRIMARY DEALER CREDIT FACILITY The Primary Dealer Credit Facility was announced on March 17 to allow primary dealers to support smooth market functioning and facilitate the availability of credit to businesses and households.27 Through the PDCF, primary dealers could
access both overnight and term funding of up to ninety days from the New York Fed. The interest rate charged on the credit was the primary credit rate, and a broad range of investment grade securities were accepted as collateral. The relatively limited usage of the facility during the year reflected the improvement in market conditions and the design of the program to provide support only if market strains intensified, and not under less stressful conditions. The PDCF balance was $0.5 billion at year-end.
COMMERCIAL PAPER FUNDING FACILITY The Commercial Paper Funding Facility was announced on March 17 to support the flow of credit to households and businesses.28 Under the CPFF, the New York Fed provided financing to a special purpose vehicle (SPV) to purchase three-month, U.S. dollar–denominated commercial paper from eligible U.S. issuers of commercial paper, including municipal issuers and U.S. issuers with a foreign parent.29 The U.S. Treasury, using funds from the Exchange Stabilization Fund (ESF), provided a $10 billion equity investment in the SPV. The pricing was the three-month OIS rate plus 110 basis points or three-month OIS rate plus 200 basis points depending on the credit rating of the issuer. There was an initial facility fee of 10 basis points of the maximum amount of an issuer’s commercial paper the SPV could have purchased.
Usage of the facility was limited, peaking at $4.3 billion after about a month in operation. Market participants no longer used the facility as market functioning and liquidity conditions improved rapidly and the cost of funding in the commercial paper market remained at or below the CPFF’s purchase price. Outstanding holdings of commercial paper in the CPFF at the end of the year were zero.
MONEY MARKET MUTUAL FUND LIQUIDITY FACILITY The Money Market Mutual Fund Liquidity Facility was announced on March 18 as part of the program of support for the flow of credit to households and businesses by enhancing the liquidity and functioning of crucial money markets.30 Under the MMLF, the Federal Reserve Bank of Boston provided loans to eligible borrowers—including all U.S. depository institutions, U.S. bank

30
O P E N M A R K E T O P E R A T I O N S D U R I N G 2 0 2 0
Overview AppendixesOperational Flexibility & Resiliency
Selected Balance Sheet Developments
Counterparties Index of Charts & Tables
Contents Primary Credit Program &
Emergency Facilities
Open Market Operations
Financial Market Developments
& Policy Actions
Endnotes
holding companies (parent companies incorporated in the United States or their U.S. broker-dealer subsidiaries), or U.S. branches and agencies of foreign banks—to purchase certain types of assets from eligible MMMFs, including prime, single state, or other tax-exempt MMMFs. A broad range of high-quality securities were eligible as collateral. The U.S. Treasury, using funds from the ESF, provided $10 billion of credit support to the Boston Fed. The pricing of the MMLF was the primary credit rate plus up to 100 basis points, depending on the collateral pledged.
The most significant usage of the MMLF took place in the first three weeks of the facility’s launch, and then remained relatively low for the rest of the year as liquidity pressures moderated and MMMFs received inflows. The MMLF balance at the end of the year was $3.6 billion.
TERM ASSET-BACKED SECURITIES LOAN FACILITYThe Term Asset-Backed Securities Loan Facility was announced on March 23 to support the flow of credit to consumers and businesses.31 Under the TALF, the New York Fed provided financing to an SPV to make up to $100 billion of three-year non-recourse loans to holders of certain triple-A-rated ABS backed by student loans, auto loans, credit card loans, loans guaranteed by the Small Business Administration (SBA), commercial mortgages, leveraged loans, and certain other assets. The U.S. Treasury, using funds appropriated to the through the Coronavirus Aid, Relief, and Economic Security (CARES) Act, provided a $10 billion equity investment in the SPV. TALF loan interest rates were determined by the type of collateral securing the loan, and ranged from the OIS rate plus 75 basis points to 125 basis points, the secured overnight financing rate (SOFR) plus 150 basis points, or the top of the federal funds target range plus 75 basis points.
Loans outstanding under the TALF increased gradually during the second half of the year as borrowers requested loans at each TALF subscription. By the end of 2020, the TALF extended more than $4 billion in loans backed by non-agency CMBS, and by ABS secured by insurance premium finance loans, student loans, leveraged loans (collateralized loan obligations, or CLOs), and small business loans.
PRIMARY MARKET CORPORATE CREDIT FACILITY
The Primary Market Corporate Credit Facility was announced on March 23 to support credit to large employers for bond and syndicated issuance.32 The facility was authorized to purchase qualifying bonds and syndicated loans with maturities of up to four years. Under the PMCCF, the New York Fed provided financing to an SPV that houses the PMCCF as well as the Secondary Market Corporate Credit Facility (see below). The U.S. Treasury, using funds appropriated to the ESF through the CARES Act, made an initial equity investment of $37.5 billion in the SPV and committed to make up to a total of 75 billion in equity investment, of which $50 billion was initially allocated to the PMCCF. Pricing for the PMCCF was primarily market based and included a 100 basis point facility fee. Pricing varied depending on whether the PMCCF was the only investor in the transaction or participated alongside other investors. There was no usage of the PMCCF, given a significant improvement in the primary market for corporate credit—including for lower-rated issuers in COVID-19-affected sectors—following the facility’s announcement. While the PMCCF did not purchase any bonds, it served as a funding backstop for corporate debt issued by eligible issuers.
SECONDARY MARKET CORPORATE CREDIT FACILITYThe Secondary Market Corporate Credit Facility was announced on March 23 to support credit to large employers by providing liquidity for outstanding corporate bonds.33 Under the SMCCF, the New York Fed lent to an SPV (noted above) to purchase in the secondary market eligible corporate bonds and U.S.-listed exchange-traded funds (ETFs) that provide broad exposure to the market for U.S. corporate bonds. As noted above, the U.S. Treasury made an initial equity investment of $37.5 billion in the SPV and committed to make up to a total of $75 billion in equity investment, of which $25 billion was initially allocated to the SMCCF.
The pace of SMCCF purchases was designed to decline as market conditions improved based on an array of measures of corporate bond market functioning and other indicators including transaction cost estimates, bid-ask spreads, credit

31
O P E N M A R K E T O P E R A T I O N S D U R I N G 2 0 2 0
Overview AppendixesOperational Flexibility & Resiliency
Selected Balance Sheet Developments
Counterparties Index of Charts & Tables
Contents Primary Credit Program &
Emergency Facilities
Open Market Operations
Financial Market Developments
& Policy Actions
Endnotes
curve shape, spread levels and volatility, trading volumes, and dealer inventories, among other factors. The pace of purchases moderated as conditions in the corporate bond market improved. Additionally, the SMCCF reduced ETF purchases relative to purchases of corporate bonds beginning in June, and ceased ETF purchases on July 23.34
The SMCCF ETF purchases were primarily of investment grade ETFs. At year-end, the bond portion of the SMCCF portfolio had a weighted average maturity of 2.8 years, with 96 percent of the portfolio comprised of bonds rated investment grade. The SMCCF holdings at year-end were $14.3 billion, comprised of $8.8 billion of corporate bond ETFs and $5.5 billion of corporate bonds.
MUNICIPAL LIQUIDITY FACILITYThe Municipal Liquidity Facility was announced on April 9 to help state and local governments manage cash flow stresses caused by the coronavirus pandemic.35 The MLF purchased eligible short-term municipal securities directly from eligible issuers, through an SPV established by the New York Fed. The U.S. Treasury, using funds appropriated to the ESF through the CARES Act, made an initial equity investment of $17.5 billion in the SPV, and committed to make a total of $35 billion in equity investments in the SPV. The SPV had the ability to purchase up to $500 billion of short-term notes from state and local governments and certain revenue bond issuers. The pricing was a fixed interest rate based on the maturity-matched OIS rate plus a credit spread based on the long-term rating of the security. Issuers also paid an origination fee equal to 10 basis points of the principal amount of the issuer’s notes purchased by the SPV.
The MLF contributed to the recovery in municipal securities markets, which facilitated issuance of more than $474 billion in bonds during 2020, an increase of more than 15 percent from the same period the year prior. By the end of 2020, the MLF had purchased $6.6 billion across four issues, $6.3 billion of which remained outstanding as of the end of the year.
PAYCHECK PROTECTION PROGRAM LIQUIDITY FACILITY
On April 9, the Board of Governors announced the Paycheck Protection Program Liquidity Facility to bolster the effectiveness of the SBA’s Paycheck Protection Program (PPP) by supplying liquidity to participating financial institutions through term financing backed by PPP loans to small businesses.36 Under the PPPLF, all PPP lenders approved by the SBA, including non-depository institutions, could participate in the program. The pool of eligible collateral consisted of PPP loans, including those purchased from another PPP lender. The interest rate on PPPLF loans was set at 35 basis points, 10 basis points higher than the primary credit program rate.
Credit outstanding under the PPPLF totaled $50.4 billion as of December 31, 2020, with a total of 860 institutions having borrowed through that date, including sixty nonbank financial institutions. The vast majority of advances were made to smaller banks with assets of less than $50 billion. Although PPPLF lending was relatively broad-based, only about 16 percent of PPP lenders borrowed from the PPPLF in 2020.37
MAIN STREET LENDING PROGRAMThe Main Street Lending Program was announced on April 9 to ensure credit flows to small and medium-sized businesses.38 Under MSLP, the Boston Fed set up one SPV to manage and operate five facilities: three business loan facilities (for new loans, priority loans, and expanded loans) and two nonprofit facilities (for new loans and expanded loans). The SPV was authorized to purchase up to $600 billion in MSLP loan participations. The U.S. Treasury, using funds appropriated to the ESF through the CARES Act, provided a $37.5 billion equity investment in the SPV and committed to make up to a total of $75 billion in equity investments. All loans charge an interest rate of LIBOR (the London interbank offered rate) plus 300 basis points. Fees ranged from zero to 1 percent depending on the type, facility, and loan size. Loans outstanding under the MSLP increased gradually during the year, with the largest increase ahead of year-end. The MSLP outstanding balance at year-end was $16.5 billion.

32

33
SELECTED BALANCE SHEET DEVELOPMENTS
O P E N M A R K E T O P E R A T I O N S D U R I N G 2 0 2 0
Overview AppendixesOperational Flexibility & Resiliency
Selected Balance Sheet Developments
Counterparties Index of Charts & Tables
Contents Primary Credit Program &
Emergency Facilities
Open Market Operations
Financial Market Developments
& Policy Actions
Endnotes
During 2020, the size of the Federal Reserve’s balance sheet increased to the highest level on record, driven by substantial growth in the SOMA portfolio as a result of the Federal Reserve’s policy actions to address the economic impact of the COVID-19 pandemic. Over the year, the balance sheet increased from $4.17 trillion to $7.36 trillion, representing an increase from 19 percent of nominal GDP to 34 percent of nominal GDP, the largest share since 2014. From the beginning of the year to mid-March, growth in the balance sheet was driven by open market operations to maintain ample reserve balances at or above the level that prevailed in early September 2019. From mid-March to the end of the year, growth in the balance sheet was driven by the increase in assets stemming from the Federal Reserve’s policies to address the economic and financial market impact of the COVID-19 pandemic. The SOMA domestic securities portfolio, including commitments to purchase agency MBS and agency CMBS, increased by $3.18 trillion during 2020, compared to a decrease of $118 billion in 2019 (Chart 17). The Federal Reserve’s emergency credit and liquidity facilities had outstanding balances of $95 billion in total by the end of 2020.
SELECTED ASSETSThe Federal Reserve’s assets can be divided into SOMA and non-SOMA assets. The SOMA comprises the Federal Reserve’s domestic securities holdings, repos, and foreign portfolios, as well as the short-term credit that the Federal Reserve extends to foreign central banks through U.S. dollar liquidity swaps. The Federal Reserve also provides short-term credit to depository institutions through the primary credit program, which is not part of the SOMA. The attendant loans and
asset holdings from the emergency liquidity and credit facilities were assets of the Federal Reserve but were not part of the SOMA. (See the “Primary Credit Program and Emergency Credit and Liquidity Facilities” section of this report for further details on the facilities.) All else equal, an increase (decrease) in holdings of a particular asset leads to a corresponding increase (decrease) in reserve balances or other liability categories.
SOMA DOMESTIC SECURITIES HOLDINGSPORTFOLIO SIZE AND COMPOSITIONThe vast majority of the SOMA is composed of domestic securities holdings. The size of the domestic securities portfolio, which consists of Treasury and agency securities, increased moderately through mid-March 2020 due to reserve management purchases of Treasury bills. From mid-March to the end of the year, the SOMA domestic securities holdings increased substantially from $3.9 trillion to $6.9 trillion, with the most rapid growth from mid-March through April.
As of year-end 2020, the domestic securities portfolio was composed of Treasury securities totaling $4.69 trillion (68 percent), agency MBS totaling $2.22 trillion (32 percent), agency CMBS totaling $10 billion (0.14 percent), and agency debt totaling $2 billion (0.03 percent)39 (Chart 18). On net over the year, the share held in Treasury securities increased by about 5.5 percentage points, with a corresponding decrease of approximately equal magnitude in the share held in agency MBS.

34
O P E N M A R K E T O P E R A T I O N S D U R I N G 2 0 2 0
Overview AppendixesOperational Flexibility & Resiliency
Selected Balance Sheet Developments
Counterparties Index of Charts & Tables
Contents Primary Credit Program &
Emergency Facilities
Open Market Operations
Financial Market Developments
& Policy Actions
Endnotes
0
1,000
2,000
3,000
4,000
5,000
6,000
7,000
8,000
9,000Billions of U.S. dollars
Assets
Liabilities and Capital
Outstanding as of Dec 31, 2019 Outstanding as of Dec 31, 2020 Peak level in 2020
Changes and Peak Levels in Selected Federal Reserve Assets and LiabilitiesChart 17
Change 2,360.0
4,668.9Dec 31
2,089.0Dec 24
495.7Mar 17
448.9May 27 51.3
Mar 30107.6Jun 30
523.1Nov 13
7,412.3Dec 24
Change 630.8
Change (255.6) Change 14.2 Change 1.6 Change 95.1 Change 340.1
Change 3,186.2
Total assets
Other assets
Primary Credit P
rogram
Central bank liq
uidity
swaps outstanding
Repo outstanding
U.S. Treasury
securities
Emergency liquidity and credit
facility outstanding balances
0
1,000
2,000
3,000
4,000
5,000
6,000
7,000
8,000
9,000
Reserve balances
Federal Reserve notes
Treasury General Account
ON RRP
Foreign repo pool
Other liabiliti
es and capital
Total liabilit
ies
and capital
Change 1,446.1
Change 280.9
Change 1,324.7
Change (54.4) Change (66.2) Change 255.1
Change3,186.2
3,317.7May 27
2,040.3Dec 31 1,830.5
Jul 27
284.9Mar 31
290.1Apr 20
525.4Nov 24
7,412.3Dec 24
Billions of U.S. dollars
Agency MBS, agency
debt, and agency CMBSa
Sources: Federal Reserve Bank of New York; Board of Governors of the Federal Reserve System.
a Excludes unsettled agency MBS.

35
O P E N M A R K E T O P E R A T I O N S D U R I N G 2 0 2 0
Overview AppendixesOperational Flexibility & Resiliency
Selected Balance Sheet Developments
Counterparties Index of Charts & Tables
Contents Primary Credit Program &
Emergency Facilities
Open Market Operations
Financial Market Developments
& Policy Actions
Endnotes
TREASURY HOLDINGS
In 2020, the Treasury portfolio doubled from approximately $2.33 trillion to approximately $4.69 trillion, the largest annual increase of SOMA holdings of Treasury securities on record, largely driven by a surge of $1.46 trillion in holdings from mid-March through April as a result of the FOMC’s directives at that time. From January through mid-March, the Treasury portfolio increased by about $194 billion to $2.52 trillion, as the Desk rolled over maturing Treasury securities at auction, conducted reserve management purchases of Treasury bills, and reinvested some principal payments from agency debt and agency MBS into Treasury securities. In the second half of the year, holdings of Treasury securities increased at a steady pace of approximately $80 billion per month.
On net over the year, the shares of the Treasury portfolio held in Treasury bills and nominal coupons decreased slightly, while the share held in Treasury Inflation-Protected Securities (TIPS) increased (Chart 19). The composition of nominal coupon holdings shifted toward sectors with relatively shorter time to maturity. Nominal coupon securities with less than three years to
maturity continued to make up the largest share of the Treasury securities portfolio, followed by the share of nominal securities with ten to thirty years to maturity. The share of the portfolio held in Floating Rate Notes (FRNs) was minimal.
SOMA holdings of Treasury securities as a share of the outstanding Treasury market rose significantly during 2020, with notable increases in the nominal coupon and TIPS sectors. The SOMA held 22 percent of Treasury securities at the end of 2020, compared with 14 percent at the end of 2019. The overall size of the Treasury market increased by $4.3 trillion during the year but was outpaced in terms of percentage growth by the increase in the SOMA holdings of Treasury securities.40 The sectors with the largest share of Treasury securities outstanding held in the SOMA were securities with ten to thirty years remaining until maturity, at 38 percent, and coupon securities with up to three years remaining until maturity, at 30 percent (Chart 20). The SOMA’s share of Treasury bills outstanding decreased slightly to about 7 percent.
1,000
0
2,000
3,000
4,000
5,000
6,000
7,000
2016 2017 2018 2019 2020
Chart 18
Source: Board of Governors of the Federal Reserve System.Notes: Figures are weekly and include unsettled holdings. Agency CMBS are included in agency MBS amount.
Billions of U.S. dollars
Composition of SOMA Domestic Securities Holdings
Treasury securities Agency MBS Agency debt
20
0
40
60
80
100
2016 2017 2018 2019 2020
Percent
<3 years3 to <6 years
6 to <10 years10 to 30 years
FRNsa
TIPS
Bills
Source: Federal Reserve Bank of New York.Note: Figures are as of year-end.aLess than 1 percent of holdings in all years shown are Floating Rate Notes (FRNs).
Chart 19Distribution of SOMA Treasury Holdings

36
O P E N M A R K E T O P E R A T I O N S D U R I N G 2 0 2 0
Overview AppendixesOperational Flexibility & Resiliency
Selected Balance Sheet Developments
Counterparties Index of Charts & Tables
Contents Primary Credit Program &
Emergency Facilities
Open Market Operations
Financial Market Developments
& Policy Actions
Endnotes
Consistent with the SOMA’s concentrated holdings in longer-term securities, the weighted average maturity of the SOMA Treasury portfolio (7.3 years) was greater than that of the outstanding stock of Treasury debt (5.4 years) at the end of 2020. Relative to year-end 2019, the weighted average maturity of the SOMA Treasury portfolio decreased by 0.7 years. This decline was driven by the Desk’s reserve management purchases of Treasury bills and subsequent asset purchases, with the latter approximately matching the composition of the outstanding Treasury universe.
AGENCY MBS HOLDINGS
The SOMA’s holdings of agency MBS increased by $812 billion on net during 2020. From January to mid-March, SOMA agency MBS holdings decreased somewhat, stemming from the FOMC directive that MBS principal payments below the monthly cap of $20 billion be reinvested in Treasury securities, which was consistent with the FOMC’s intent to hold primarily Treasury securities in the long run. (For more information on agency MBS reinvestments, see “Agency MBS and Agency CMBS Operations” in the “Open Market Operations” section of this report.) Since mid-March, the composition of the SOMA MBS portfolio
evolved across various dimensions—including the agencies, terms, coupons, and vintages of the securities held—as a result of high prepayment activity, as well as the substantial amount of new purchases.
Given the Desk’s operational approach of purchasing agency MBS in the TBA market, specifically in TBA contracts with coupon rates consistent with current agency MBS origination, agency MBS delivered to the SOMA were generally concentrated in recently issued securities.
At the end of the year, 42 percent of the settled agency MBS portfolio was originated in 2020. Forty-three percent of the settled agency MBS portfolio was held in agency MBS guaranteed by Fannie Mae, 33 percent in agency MBS guaranteed by Freddie Mac, and 24 percent in agency MBS guaranteed by Ginnie Mae (Chart 21).41 Almost 90 percent of the settled portfolio was held in thirty-year MBS, with most of the remainder in fifteen-year MBS. As of the end of 2020, the weighted average life of the settled agency MBS portfolio was 3.1 years.42 Given the lower interest rate environment, the share of the settled agency MBS portfolio held in securities with coupons less than or equal to 2.5 percent increased significantly from 6 percent to 41 percent over the year. The shares of the settled agency MBS portfolio held in securities with 3.0, 3.5, and greater than or equal to 4.0 percent coupons decreased by 10, 16, and 10 percentage points, respectively. The weighted average coupon of the agency MBS held in the SOMA portfolio decreased to 2.9 percent at the end of 2020.
Settled SOMA holdings of agency MBS as a share of the outstanding stock of fixed-rate agency MBS increased during 2020 from 21 percent to 28 percent, as the size of agency MBS holdings increased more quickly than the outstanding stock. The characteristics of agency MBS holdings in the SOMA are broadly consistent with those of the outstanding agency MBS market, although the portfolio is slightly more concentrated in lower-coupon securities. At the end of 2020, the weighted average coupon rate of underlying mortgage loans in the settled SOMA holdings of agency MBS was 3.6 percent, slightly below the broader market’s weighted average coupon rate of 3.7 percent. Meanwhile, the weighted average age of loans in the settled agency
Chart 20SOMA Treasury Holdings as a Share of Outstanding Treasury Supply
10
0
20
30
40
50
TIPS FRNsBills
2018 2019 2020
Sources: Federal Reserve Bank of New York; U.S. Treasury.Note: Figures are as of year-end.
Percent
<3 years 3 to <6years
6 to <10years
10 to 30years

37
O P E N M A R K E T O P E R A T I O N S D U R I N G 2 0 2 0
Overview AppendixesOperational Flexibility & Resiliency
Selected Balance Sheet Developments
Counterparties Index of Charts & Tables
Contents Primary Credit Program &
Emergency Facilities
Open Market Operations
Financial Market Developments
& Policy Actions
Endnotes
MBS portfolio was 41 months, while the weighted average age of loans in the broader market was 40 months.
AGENCY CMBS HOLDINGS
The Federal Reserve began purchasing agency CMBS in late March of 2020, and SOMA agency CMBS holdings totaled $9.8 billion by the end of the year.43 SOMA agency CMBS holdings accounted for 0.4 percent of total SOMA agency MBS holdings and represented around 1.2 percent of outstanding agency CMBS. The composition of these holdings was approximately 73 percent in Fannie Mae securities, 17 percent in Ginnie Mae, and 10 percent in Freddie Mac securities by the end of 2020. The weighted average life of the SOMA CMBS portfolio ended the year at 8.8 years.
AGENCY DEBT HOLDINGS
SOMA agency debt holdings were unchanged at $2.3 billion during 2020. These holdings consist of the remainder of the
$172 billion of agency debt acquired by the Federal Reserve between 2008 and 2010 as part of its first asset purchase program. The remaining SOMA agency debt holdings were issued by Fannie Mae and Freddie Mac and will mature sporadically between 2029 and 2032 in small increments.
PORTFOLIO RISK METRICSDuration measures the sensitivity of a security’s price to changes in interest rates and may be thought of as the weighted average time to maturity of cash flows from the portfolio. The longer the duration of a security, the more sensitive it will be to changes in interest rates. Duration is generally greater for longer-maturity and lower-coupon securities. During 2020, the par-weighted average duration of the SOMA domestic securities portfolio declined slightly from 5.1 years to 4.9 years, primarily due to a 0.2 year decrease in the duration of the Treasury portfolio44 45 (Chart 22).
2.0% 2.5% 3.0% ≥ 4.0%3.5%
≤ 1.50%
Chart 21Distribution of SOMA Agency MBS Holdings
Notes: Figures are as of December 31, 2020. Holdings total $2.03 trillion and consist of settled holdings only.
Source: Federal Reserve Bank of New York.
aLess than 1 percent of holdings are ten- and twenty-year agency MBS, which may be delivered into fifteen- and thirty-year TBA contracts, respectively.
’11
Issuer
Terma
Coupon
Vintage
Fannie Mae Freddie Mac Ginnie Mae
30-year 15-year
Pre-2011 2012
2011
2013 2014 2015 2016 2017 2019 2020
0 10 20 30 40
Percent
50 60 70 80 90 100
2018

38
O P E N M A R K E T O P E R A T I O N S D U R I N G 2 0 2 0
Overview AppendixesOperational Flexibility & Resiliency
Selected Balance Sheet Developments
Counterparties Index of Charts & Tables
Contents Primary Credit Program &
Emergency Facilities
Open Market Operations
Financial Market Developments
& Policy Actions
Endnotes
The duration of Treasury securities held in the SOMA declined in the first quarter of 2020, first due to reserve management purchases and then due to asset purchases. The duration of SOMA Treasury holdings was roughly constant for the rest of the year, as the aging of the existing portfolio was offset by new purchases and rollovers.
The decrease in the effective duration of the SOMA’s holdings of agency MBS was driven by a decline in primary mortgage rates. The decline was partially offset by the lower coupons and longer duration of the Desk’s new agency MBS purchases, reflecting new net purchases and reinvestment purchases of newly originated securities as the loans underlying existing holdings in the SOMA portfolio were prepaid. The sensitivity of MBS duration to changes in interest rates highlights how prepayments impact the SOMA portfolio. (For more information, see Box 3, “Agency MBS Prepayment Uncertainty,” in Open Market Operations during 2017).46
Measures of the dollar value of duration risk held in the SOMA portfolio increased in 2020. One method of measuring dollar duration is in terms of ten-year equivalents—that is, the amount of ten-year Treasury securities that would be needed to match the duration risk of the portfolio. The SOMA portfolio’s ten-year equivalent measure increased from $2.12 trillion at the end of 2019 to $3.56 trillion at the end of 2020 (Chart 23), driven primarily by the increases in the size of Treasury and agency MBS holdings.
SOMA REPURCHASE AGREEMENTSThe aggregate amount of repo outstanding increased from $256 billion in January to a peak level of nearly $500 billion in mid-March, primarily concentrated in term repo offerings. From mid-March, the total amount of repo outstanding began to gradually decline and by early July fell to zero, amid improving conditions in
2016 2017 2018 2019 2020
Source: Federal Reserve Bank of New York.
Notes: Figures are as of month-end. Calculations are par-weighted. The rise in agency debt duration during 2018 is due to a maturity that left a small number of agency debt securities with longer tenors in the portfolio. Total SOMA and Agency MBS do not include agency CMBS.
2
0
4
6
8
10Years
Total SOMATreasury securities
Agency MBSAgency debt
Chart 22Average Duration of SOMA Domestic Securities Holdings
500
0
1,000
1,500
2,000
2,500
3,000
3,500
4,000
2016 2017 2018 2019 2020
Source: Federal Reserve Bank of New York.Notes: Figures are as of month-end. Calculations are par-weighted. Total SOMA and Agency MBS do not include agency CMBS. Agency debt is not shown owing to its minimal value.
Billions of U.S. dollars
Total SOMA Treasury securities Agency MBS
Chart 23SOMA Domestic Securities Holdings in Ten-Year Equivalents

39
O P E N M A R K E T O P E R A T I O N S D U R I N G 2 0 2 0
Overview AppendixesOperational Flexibility & Resiliency
Selected Balance Sheet Developments
Counterparties Index of Charts & Tables
Contents Primary Credit Program &
Emergency Facilities
Open Market Operations
Financial Market Developments
& Policy Actions
Endnotes
funding markets and the Desk’s increase of the repo operation offering rates. The total amount of repo outstanding remained at zero for the rest of the year. (For more information on repo operations, see the “Open Market Operations” section of this report.)
CENTRAL BANK LIQUIDITY SWAPS The aggregate outstanding balance of the U.S. dollar swap lines increased from about $4 billion in early January to a peak of $449 billion in late May, primarily in three-month terms with the European Central Bank and the Bank of Japan. The aggregate balance gradually declined over the remainder of the year, falling to $18 billion by year-end, reflecting improvements in the functioning of global dollar funding markets. (For more information on central bank liquidity swaps, see the “Open Market Operations” section of this report.)
SOMA FOREIGN CURRENCY–DENOMINATED HOLDINGSThe Federal Reserve holds foreign currency–denominated assets, which are invested to ensure adequate liquidity to meet anticipated foreign exchange intervention needs. (For more details, see the “Open Market Operations” section of this report.)
As of year-end 2020, the SOMA foreign currency portfolio totaled $22.2 billion, composed of $13.1 billion of euro-denominated assets and $9.1 billion of yen-denominated assets. The portfolio increased by $1.5 billion in U.S. dollar terms over the year, primarily owing to a 9 percent appreciation of the euro against the dollar and a 5 percent appreciation of the yen against the dollar. The share of government debt obligations increased in the euro-denominated portfolio, while the share of cash held on deposit at official institutions decreased; the reverse occurred in the yen-denominated portfolio (Chart 24).
For euro-denominated assets, the purchases of government debt obligations to manage against the targeted asset allocation contributed to an increased Macaulay duration, which rose from 19.8 months at year-end 2019 to 27.0 months at year-end 2020. Due to the increased share in cash of the yen-denominated assets,
the yen portfolio Macaulay duration decreased from 0.8 months at year-end 2019 to 0.2 months at year-end 2020.
PRIMARY CREDIT PROGRAMThe outstanding balance of the primary credit program, the discount window’s main lending program, totaled $1.6 billion at year-end, with an average loan maturity during the year of nine days. In late March, borrowing under the primary credit program increased to a peak of $51 billion, with an average maturity of fourteen days during that month. Beginning in April, the outstanding amounts of primary credit loans began to decline, as market conditions started to stabilize and many term loans matured. (For more information, see the “Primary
2016 2017 2018 2019 2020 2016 2017 2018 2019 2020
Chart 24Distribution of SOMA Foreign Currency Portfolio Holdings
Source: Federal Reserve Bank of New York.
Note: Figures reflect amortized cost.
5
0
10
15Billions of U.S. dollars
Euro portfolio Yen portfolio
Euro deposits at official institutionsFrench sovereign debt
German sovereign debtDutch sovereign debt
Yen deposits at official institutionsJapanese sovereign debt

40
O P E N M A R K E T O P E R A T I O N S D U R I N G 2 0 2 0
Overview AppendixesOperational Flexibility & Resiliency
Selected Balance Sheet Developments
Counterparties Index of Charts & Tables
Contents Primary Credit Program &
Emergency Facilities
Open Market Operations
Financial Market Developments
& Policy Actions
Endnotes
Credit Program and Emergency Credit and Liquidity Facilities” section of this report.)
FEDERAL RESERVE EMERGENCY CREDIT AND LIQUIDITY FACILITIES
The total outstanding amount of all loans and assets across the various emergency credit and liquidity facilities was $90 billion at the end of the year. The PPPLF had the largest outstanding balance at year-end of $50.4 billion, while the outstanding balance of the other facilities ranged from zero to $16 billion. About half of the outstanding amount is set to mature by 2022, with the full amount scheduled to mature by 2025 (Chart 25). These loans and assets will remain on the Federal Reserve balance sheet until they mature or are paid down. (For more information on each facility, see the “Primary Credit Program and Emergency Credit and Liquidity Facilities” section of this report.)
SELECTED LIABILITIES The Federal Reserve’s assets are funded by a variety of liabilities and capital; as explained further below, each of these liabilities provide safe and liquid assets for the public, the Treasury, and the banking system. Overall, the total level of liabilities and capital increased $3.186 trillion during 2020, driven by an increase in the level of reserves of roughly $1.4 trillion and growth in the Treasury General Account of $1.3 trillion (Chart 26). Reserves in the banking system grew dramatically, reaching levels well above the previous peak of $2.8 trillion in 2014, because of Federal Reserve actions to address the effects of the pandemic. The rise in the TGA to an average level of $1.2 trillion during 2020, nearly four times its average size during 2019, was related to actions by the U. S. Treasury to build cash balances in preparation for potential unprecedented outflows related to the pandemic response. Federal Reserve notes increased by $281 billion, well above the typical annual growth of $90 billion over the last decade, as precautionary and transactional demand for currency increased. All else equal, an increase (decrease) in non-reserve
0
5
10
15
20
25
30
35
40
45
2021 2022 2023 2024 2025
SMCCF PDCF MLF MMLF PPPLF MSLP TALF
Chart 25Maturity Profile of Emergency Facility Assets
Billions of U.S. dollars
Source: Federal Reserve Bank of New York.
Notes: Reflects positions as of December 31, 2020, for the Secondary Market Corporate Credit Facility (SMCCF), the Primary Dealer Credit Facility (PDCF), the Municipal Liquidity Facility (MLF), the Money Market Mutual Fund Liquidity Facility (MMLF), the Paycheck Protection Program Liquidity Facility (PPPLF), the Main Street Lending Program (MSLP), and the Term Asset-Backed Lending Facility (TALF). SMCCF and MLF include par value of maturing bond holdings; MMLF, TALF, and PPPLF include maturing loan principal (they do not reflect accrued interest); MSLP includes the maturing amount of loan participation when purchased by MSLP; PMCCF and CPFF have no outstanding holdings. No assumptions are made about PPP loan forgiveness. Roughly $8.8 billion in ETFs held at market value by the SMCCF have no maturity date.

41
O P E N M A R K E T O P E R A T I O N S D U R I N G 2 0 2 0
Overview AppendixesOperational Flexibility & Resiliency
Selected Balance Sheet Developments
Counterparties Index of Charts & Tables
Contents Primary Credit Program &
Emergency Facilities
Open Market Operations
Financial Market Developments
& Policy Actions
Endnotes
liabilities leads to a corresponding decrease (increase) in reserve balances.
RESERVE BALANCESReserve balances, which are deposits held by depository institutions at the Federal Reserve, represented the largest liability of the Federal Reserve during most of 2020.47 At the beginning of the year, reserve levels were generally steady, with declines in repo outstanding largely offset by reserve management purchases of Treasury bills. Starting in mid-March, the level of reserve balances was driven by the implementation of Federal Reserve actions to support market functioning and the flow of credit to households and business in response to the COVID-19 pandemic. Reserve balances rose rapidly, peaking at $3.3 trillion at the end of May, due to Treasury and agency MBS purchases, central bank swap draws, and facility loans and purchases. Beginning in June, reserves declined modestly due to the roll-off of outstanding central bank liquidity swaps and repurchase agreements. For
the remainder of the year, steady asset purchases to sustain smooth market functioning contributed to growth in reserves, although these effects were offset substantially by growth in the TGA, and to a lesser extent by growth in currency and other deposits (Chart 27). Reserve balances were $2.99 trillion at the end of the year.
FEDERAL RESERVE NOTESFederal Reserve notes, commonly known as currency in circulation (currency), increased by $281 billion during 2020 to a level of $2.04 trillion at the end of the year.48 To U.S. households and firms, currency is an asset they hold because they can exchange it for goods and services and because it provides a store of value. In addition to domestic demand, demand for U.S. currency can also originate from abroad. The rate of growth of currency outstanding has generally reflected the pace of expansion of economic activity in nominal terms. Heightened financial or political uncertainty can also drive growth in currency,
1,000
0
2,000
3,000
4,000
5,000
6,000
7,000
8,000
2016 2017 2018 2019 2020
Source: Board of Governors of the Federal Reserve System.Note: Figures are weekly.
Billions of U.S. dollars
Chart 26Federal Reserve Liabilities
Federal Reserve notesReserve balances
Treasury General Account balancesForeign repo poolRRPsTerm deposits
Other liabilities

42
O P E N M A R K E T O P E R A T I O N S D U R I N G 2 0 2 0
Overview AppendixesOperational Flexibility & Resiliency
Selected Balance Sheet Developments
Counterparties Index of Charts & Tables
Contents Primary Credit Program &
Emergency Facilities
Open Market Operations
Financial Market Developments
& Policy Actions
Endnotes
as during 2020 when the adverse outlook for the economy associated with the COVID-19 pandemic prompted investors to move rapidly toward cash and cash-like instruments.49
During March, currency outstanding increased by roughly 4 percent as a result of the public’s desire to hold cash during a period of heightened uncertainty, banks’ desire to hold cash in preparation for customer demand associated with stimulus-related outlays, and demand for U.S. dollars abroad (Chart 28). Currency growth during the rest of 2020 continued at higher rates than historical averages. Over 2020, Federal Reserve notes outstanding increased by about 16 percent, a pace roughly three times faster than the 5 percent increase in 2019 and notably above the range observed during the last decade.
REVERSE REPURCHASE AGREEMENTSOPEN MARKET OPERATIONS
The amount of ON RRP outstanding at the end of 2020 was $9.7 billion, compared to $64.1 billion at 2019 year-end. Participation in the ON RRP operations increased at the end of the first quarter to a peak of $284.9 billion, amid the heightened demand for safe assets and the decline in many money market rates, and then declined to remain near zero for the rest of the year. (For more information on ON RRP operations, see the “Open Market Operations” section of this report.)
FOREIGN REPO POOL
The New York Fed has long offered its foreign official and international account holders an overnight repo investment service, known as the foreign repo pool. At the end of each business day, account holders’ cash balances are swept into an overnight reverse repo secured by the Federal Reserve’s securities holdings.50 Upon maturity on the following business day, the securities are repurchased by the SOMA at a repurchase price that includes a return calculated at a rate generally equivalent to the New York Fed’s overnight reverse repurchase operations, although the New York Fed may vary the rate of return at any time without prior notice.

43
O P E N M A R K E T O P E R A T I O N S D U R I N G 2 0 2 0
Overview AppendixesOperational Flexibility & Resiliency
Selected Balance Sheet Developments
Counterparties Index of Charts & Tables
Contents Primary Credit Program &
Emergency Facilities
Open Market Operations
Financial Market Developments
& Policy Actions
Endnotes
This service addresses a strong preference by many central banks to hold significant dollar liquidity buffers at the Federal Reserve for policy purposes, and supports operational liquidity needs to clear and settle securities in these accounts. Like other reserve currency central banks, the Federal Reserve offers this service as part of a suite of banking and custody services to central banks, governments, and international official institutions.
Over the course of 2020, the weekly average size of the foreign repo pool fluctuated within a wider range relative to prior years. The aggregate balance continued to decline throughout the first quarter, as it had in late 2019. Beginning in mid-March, balances increased dramatically, reaching a weekly average high of $282 billion in April, below the previous year’s weekly average high of $299 billion. The increase in the size of the pool was primarily driven by a shift in FIMA customers’ preference toward liquid, safe holdings amid a highly uncertain period of increased volatility, dollar funding pressures, and Treasury market stress. Beginning in June, as market conditions stabilized, FIMA customers shifted funds back from the pool into Treasury securities, and the repo pool balance gradually declined for the rest of the year. The year-end balance in the foreign repo pool was $206 billion (Chart 29).
DEPOSITSTREASURY GENERAL ACCOUNT
By statute, the Federal Reserve acts as fiscal agent for the federal government. Consequently, the U.S. Treasury maintains a cash balance at the Federal Reserve—the Treasury General Account—to deposit corporate and individual taxes paid to the U.S. government and to disburse payments, pay interest on federal debt, and settle Treasury security transactions.51 TGA balances typically exhibit significant variation around Treasury auction settlement dates and debt limit–related deadlines, and they are also affected by the timing of the receipt of tax payments. In 2015, the Treasury announced that it would generally strive to maintain a TGA balance that was large enough to ensure that it could cover one week of payments and maturing debt, subject to a minimum of $150 billion.52
From January to mid-March, the TGA was relatively stable and remained below $500 billion, in line with Treasury’s prudent cash balance policy. In April, the TGA began to increase, and by summer reached over $1.8 trillion, more than three times its largest size prior to 2020, as the Treasury increased borrowing to fund the fiscal stimulus legislation passed in response to the COVID-19 pandemic. Treasury’s cash balance remained elevated
-2
-1
0
1
2
3
4
5
Jan Feb Mar Apr May Jun Jul Aug Sep Oct Nov Dec
Historical average from 2013 to 2019 2020
Chart 28Monthly Changes in Federal Reserve Notes
Source: Federal Reserve Bank of New York.
Percent
Note: Figures reflect the growth rate of month-end levels.

44
O P E N M A R K E T O P E R A T I O N S D U R I N G 2 0 2 0
Overview AppendixesOperational Flexibility & Resiliency
Selected Balance Sheet Developments
Counterparties Index of Charts & Tables
Contents Primary Credit Program &
Emergency Facilities
Open Market Operations
Financial Market Developments
& Policy Actions
Endnotes
throughout the year as the Treasury maintained a high level of liquidity given the uncertainty surrounding the future size and timing of potential fiscal outlays to support business and households. The average weekly TGA balance during 2020 was about $1.2 trillion, more than four times higher than the $290 billion average in 2019, and the weekly fluctuations in the balance were close to two times those in 2019 (Chart 30).
FOREIGN OFFICIAL AND OTHER DEPOSITS
The Federal Reserve has long offered deposit services to government-sponsored enterprises and international and multilateral organizations. More recently, it has offered deposit accounts to designated financial market utilities (DFMUs).53 Government-sponsored enterprises (GSEs) are financial intermediaries chartered by the federal government that primarily facilitate the flow of credit to housing and agriculture. DFMUs provide the infrastructure for transferring, clearing, and settling payments, securities, and other financial transactions among financial institutions. Access to deposit accounts at
the Federal Reserve enables these entities to store their cash in a safe and liquid facility. Unlike deposits held by FIMA customers at the New York Fed, deposits held by DFMUs may be remunerated at the rate paid on balances maintained by depository institutions or another rate determined by the Board from time to time, not to exceed the general level of short-term interest rates. Aggregate balances of these accounts more than doubled after all eight DFMUs were able to open accounts at the Federal Reserve in 2013.
In 2020, aggregate balances of foreign official and other deposits rose to record high levels, averaging about $187 billion, well above the average of roughly $80 billion observed since 2017. The increase was driven by a rise in DFMU account balances, which remained elevated throughout the year due to increased trading volume and margin requirements amid elevated volatility in financial markets. GSE balances continued to vary widely, temporarily shifting higher ahead of agency MBS principal and interest payment dates and reaching substantial peaks given the significant refinancing activity. In 2020, GSEs increased liquidity pools to support refinancing activity and future potential
0
0.5
1.0
1.5
2.0
2.5
3.0
50
0
100
150
200
250
300
350
2016 2017 2018 2019 2020
Weekly average balance (left scale)Quarterly average rate (right scale)
Chart 29Foreign Repo Pool
Sources: Board of Governors of the Federal Reserve System; Federal Reserve Bank of New York.
Billions of U.S. dollars Percent
200
0
400
600
800
1,000
1,200
1,400
1,600
1,800
2,000
2016 2017 2018 2019 2020
Chart 30Treasury General Account Balances
Source: Board of Governors of the Federal Reserve System.Note: Figures are averages of daily balances.
Billions of U.S. dollars
Weekly average Annual average

45
O P E N M A R K E T O P E R A T I O N S D U R I N G 2 0 2 0
Overview AppendixesOperational Flexibility & Resiliency
Selected Balance Sheet Developments
Counterparties Index of Charts & Tables
Contents Primary Credit Program &
Emergency Facilities
Open Market Operations
Financial Market Developments
& Policy Actions
Endnotes
liquidity needs as a result of the COVID-19 pandemic, including expectations of larger volumes of delinquent loan purchases from the MBS trusts.
FINANCIAL RESULTS SOMA portfolio net income increased in 2020, the first annual increase since 2013, due primarily to the decline in interest rates. As a result, the SOMA portfolio contributed to substantial levels of Federal Reserve income and remittances to the U.S. Treasury. Between 2014 and 2019, SOMA net income and remittances had declined due to higher funding costs associated with rising short-term interest rates and lower average SOMA domestic securities holdings.
SOMA INCOMEIn 2020, total SOMA income was $103 billion, primarily derived from interest income on domestic securities holdings. SOMA net income, which takes into account the costs of funding the portfolio, increased substantially to $95 billion from $62 billion in 2019 (Table 4). The $33 billion increase was the first increase in SOMA net income since 2014 and was driven by a decline in assumed funding cost associated with the decline in interest rates. SOMA net income declined on an annual consecutive basis from 2015 to 2019, primarily due to an increase in assumed funding costs.
FEDERAL RESERVE REMITTANCESThe Federal Reserve remits excess earnings to the U.S. Treasury on a weekly basis, after providing for the cost of operations, payment of dividends, and reservation of any amount necessary to maintain aggregate Reserve Bank capital surplus up to a specified limit. The Federal Reserve remitted a total of $89 billion to the Treasury during 2020, an increase from the $55 billion remitted in 2019. The $34 billion increase in remittances stemmed primarily from a rise in in SOMA net income (Chart 31).
SOMA UNREALIZED GAINS AND LOSSES The market value of the SOMA’s securities portfolio fluctuates with changes in the prevailing level of interest rates. During 2020, a decrease in interest rates resulted in the SOMA domestic portfolio moving from an unrealized gain position of $161 billion at the end of 2019 to an unrealized gain position of $354 billion at
Table 4 SOMA Net Income Billions of U.S. Dollars
2020 2019
Interest income
Repurchase agreements 0.7 1.0
Treasury securities 67.5 58.5
Agency debt 0.1 0.1
Agency MBS 32.3 43.1
Other 0.5 –
101.2 102.7
Interest expense
Reverse repurchase agreements
Overnight and term RRP 0.0 (0.1)
Foreign repo pool (0.7) (5.9)
Other 0.0 0.0
(0.7) (6.0)
Non-interest income (loss)
Foreign currency translation gains (losses) 1.5 (0.1)
Other 0.7 –
2.2 (0.1)
SOMA income 102.7 96.6
Assumed funding cost (7.9) (35.0)
SOMA net income 94.8 61.6
Sources: Federal Reserve Bank of New York; Board of Governors of the Federal Reserve System.
Notes: The assumed funding cost represents the interest expense on interest-bearing liabilities assumed to be associated with SOMA net assets. As shown in the table, the actual interest expense on all non-SOMA interest-bearing liabilities of the Federal Reserve, including reserves and term deposits, totaled $7.9 billion for 2020 and $35.0 billion for 2019. In actuality, these liabilities fund non-SOMA assets of the Federal Reserve in addition to SOMA net assets.

46
O P E N M A R K E T O P E R A T I O N S D U R I N G 2 0 2 0
Overview AppendixesOperational Flexibility & Resiliency
Selected Balance Sheet Developments
Counterparties Index of Charts & Tables
Contents Primary Credit Program &
Emergency Facilities
Open Market Operations
Financial Market Developments
& Policy Actions
Endnotes
the end of the year, the highest level on record (Chart 32). The Treasury portfolio’s unrealized gain position increased to roughly $299 billion from $139 billion at the end of 2019, and the agency MBS portfolio moved to a gain of roughly $54 billion at the end of 2020 from a gain of $21 billion at the end of 2019. Unrealized gains on the foreign portfolio increased to $170 million at the end of 2020 from $118 million at the end of 2019. Unrealized gains and losses are calculated as the difference between the market value of the portfolio and its book value (which reflects amortized cost).
The SOMA’s unrealized gain or loss position has no effect on net income or Federal Reserve remittances to the Treasury unless assets are actually sold and those gains or losses are realized. When securities are held to maturity, their unrealized gains or losses fall to zero over time as their price reverts to par at maturity. Unrealized gains and losses have no effect on the conduct of monetary policy.
PROJECTIONSThe SOMA portfolio grew substantially over the course of 2020 as a result of the FOMC’s asset purchases, which were conducted to support market functioning and foster accommodative financial conditions. In coming years, the size of the portfolio—and the balance sheet as a whole—will largely be determined by FOMC decisions regarding asset purchases and reinvestment policies. The Committee has provided outcome-based guidance on asset purchases, and the size of the balance sheet will evolve along with changes in economic conditions and progress toward the Committee’s goals. As such, the outlook for the balance sheet remains uncertain and the projections presented here are meant to be purely illustrative and to demonstrate a range of possibilities for the path of the portfolio, the size of the balance sheet, and income. As in prior annual reports, the assumptions underlying the projections largely reflect the expectations of market participants and are drawn from results of the Desk’s Surveys of Primary
-100
-50
50
0
100
150
200
250
300
350400
2015 2016 2017 2018 2019 2020
Source: Board of Governors of the Federal Reserve System.
Note: Figures are as of year-end.
Billions of U.S. dollars
Treasury securities
Agency MBS
Agency debt
Chart 32SOMA Domestic Portfolio Unrealized Gains and Losses
0
20
40
60
80
100
120
2015 2016 2017 2018 2019 2020
Billions of U.S. dollars
SOMA Net Income and Federal Reserve Remittances to the U.S. Treasury
Chart 31
SOMA net income
Earnings remittancesTransfer of capital surplusa
Sources: Federal Reserve Bank of New York; Board of Governors of the Federal Reserve System.aRepresents the transfer of capital to reduce the aggregate Reserve Bank surplus to the $10 billion limit required by the Fixing America's Surface Transportation Act (FAST Act), which amended the Federal Reserve Act.

47
O P E N M A R K E T O P E R A T I O N S D U R I N G 2 0 2 0
Overview AppendixesOperational Flexibility & Resiliency
Selected Balance Sheet Developments
Counterparties Index of Charts & Tables
Contents Primary Credit Program &
Emergency Facilities
Open Market Operations
Financial Market Developments
& Policy Actions
Endnotes
Dealers and Market Participants (Desk Surveys) as well as simple rules used to proxy the evolution of Federal Reserve liabilities.54
The exercise suggests that the SOMA portfolio could grow through ongoing asset purchases to reach $9.0 trillion by 2023, or 39 percent of GDP. The portfolio is then assumed to be held constant, with proceeds from maturing securities being reinvested. After that point, the path of the portfolio will depend on choices made regarding the portfolio as the FOMC normalizes the stance of monetary policy. In the projections, we show a range of potential outcomes, with the size of the portfolio staying steady at $9 trillion or reaching as low as $6.6 trillion.
These projections also indicate that, under an assumed path of interest rates that rises over the projection horizon, the portfolio’s net income could remain roughly in line with recent levels. At the same time, the market value of the portfolio could decline as interest rates reach assumed long-run levels, leading to the portfolio being held at an unrealized loss. Additional scenarios that consider alternate interest rate paths show that net income also could be lower, but remain positive, even under higher interest rate scenarios; meanwhile, the unrealized gain or loss position of the portfolio could vary widely depending on the path of interest rates.
ASSUMPTIONSThis section reviews the assumptions about asset purchases, liabilities, and interest rates that are used for the projections; a complete list of key assumptions can be found in Appendix 4.
BALANCE SHEET
AssetsThe projections assume that the portfolio will evolve in four phases: growth, reinvestment, normalization, and organic growth. Assumptions about the size and composition of asset purchases during the growth phase and the minimum length of the reinvestment phase are drawn from median responses to the Desk Surveys. According to these survey responses, Treasury and agency MBS purchases continue at the current pace through 2021 before gradually reducing to zero at the end of 2022. The
reinvestment phase, during which principal payments on Treasury securities and agency MBS are reinvested fully into Treasury securities and agency MBS, respectively, ends in the fourth quarter of 2025, consistent with Desk Survey responses.
The Committee has not provided guidance on its long-run approach to the size and composition of the balance sheet. In this projection exercise, we present a wide range of potential approaches to managing the portfolio during the period of monetary policy normalization. At one end of this range, principal payments continue to be fully reinvested, and normalization of the level of reserves occurs through growth in non-reserve liabilities. At the other end, principal payments are allowed to fully run off after 2025 to bring the portfolio—and reserve balances—to their long-run levels. A phased approach to reducing reinvestments could also be taken, representing any path between these two boundary approaches. The timing for the beginning of the normalization phase is drawn from the median response to a March Survey question about the expected timing for the first decline in the size of the SOMA portfolio. Once reserves reach a level assumed to represent the long-run level of reserves, the portfolio resumes organic growth to accommodate growth in demand for the Federal Reserve’s liabilities.
Liabilities and Capital Non-reserve liabilities and capital are assumed to begin at their average February 2021 levels and grow over the projection horizon in line with nominal GDP, whose rate of growth is set based on median responses to the March Surveys. The median projected growth rates of real GDP and headline personal consumption expenditures (PCE) price inflation in the long run were 1.95 percent and 2.0 percent, respectively, implying a long-run level of nominal GDP growth of 3.95 percent.55
The exception to this approach is the assumption used for projections of the Treasury General Account. The TGA is assumed to decline from its exceptionally high February 2021 level to $500 billion by the end of the second quarter of 2021, a level in line with the Treasury’s cash balance assumption in its February 2021 Quarterly Refunding Statement. Thereafter, the TGA is assumed to grow with nominal GDP, similar to all other liabilities.

48
O P E N M A R K E T O P E R A T I O N S D U R I N G 2 0 2 0
Overview AppendixesOperational Flexibility & Resiliency
Selected Balance Sheet Developments
Counterparties Index of Charts & Tables
Contents Primary Credit Program &
Emergency Facilities
Open Market Operations
Financial Market Developments
& Policy Actions
Endnotes
In addition, the long-run level of reserves represents the reserve level at which the portfolio is assumed to return to growth after the normalization phase. The long-run level of reserves is assumed to grow with nominal GDP, although the starting point is assumed to be the average level over December 2019, representing a level viewed by the FOMC to be consistent with effective and efficient monetary policy implementation; this approach abstracts from the expansion of the level of reserves that occurred during 2020 due to the various lending and purchase programs.
INTEREST RATES
The baseline paths for the federal funds rate and longer-term interest rates are drawn from responses to the March Surveys. The median expected level of the effective federal funds rate is assumed to be steady at 12.5 basis points through the third quarter of 2023, to rise to just over 2 percent by the end of 2026, and to reach 2.25 percent in the longer term. The ten-year Treasury yield and thirty-year fixed primary mortgage rate are assumed to rise to 2.5 percent and 4.1 percent, respectively, in the longer run. The projection exercise also considers a range of outcomes assuming lower and higher interest rates. Additionally, the IOER rate is assumed to be set 10 basis points above the bottom of the target range, and the ON RRP offering rate is assumed to be set at the bottom of the target range. These administered rate assumptions are consistent with the FOMC’s March 2021 Implementation Note.
PROJECTION RESULTS PATH OF PORTFOLIO HOLDINGS AND RESERVE BALANCES
Starting with the SOMA domestic securities portfolio as of February 2021 and incorporating the assumptions described above results in the projected path of the SOMA through 2025 shown in Chart 33. The portfolio grows through asset purchases to peak at $9.0 trillion by the end of 2022, or 39 percent of GDP (Chart 34), and then remains constant in size through 2025. Reserve balances (Chart 35) also peak by the end of 2022, at $6.2 trillion, but then begin to steadily decline due to growth in non-reserve liabilities as the portfolio is held constant through reinvestments.
Thereafter, the trajectory of the SOMA portfolio and reserve balances will be determined by the Committee’s approach to the normalization of monetary policy and the size of the SOMA portfolio; a range of possible portfolio and reserves outcomes resulting from these policies is shown in the blue shaded areas in the charts. The projections indicate that reserve balances could reach their long-run level before the end of 2029, at which point the portfolio would resume growth to ensure a sufficient supply of reserve balances. However, this could occur at a later date, depending on the approach taken to the normalization of the portfolio. By the end of the projection horizon, the size of the portfolio could be as low as $6.6 trillion or as high as $9.0 trillion, or between 21 percent and 28 percent of GDP.
PORTFOLIO COMPOSITION
As the composition of asset purchases during the growth phase remains roughly constant, and maturities and principal payments are reinvested into like securities, the composition of the portfolio
01,000
2,000
3,000
4,000
5,000
6,000
7,000
8,000
9,00010,000
2010 2014 2018 2022 2026 2030
Chart 33Projected SOMA Domestic Securities Holdings
Source: Federal Reserve Bank of New York.
Notes: Figures are as of year-end. Figures for 2010-20 are shaded and represent historical balances. The range after 2025 reflects outcomes for the portfolio between full reinvestment and full run-off. Assumptions for SOMA purchases, interest rates, length of the reinvestment phase, and the growth of key liabilities are based on the Survey of Primary Dealers and the Survey of Market Participants conducted by the New York Fed in March 2021. Projected figures are rounded.
Billions of U.S. dollars

49
O P E N M A R K E T O P E R A T I O N S D U R I N G 2 0 2 0
Overview AppendixesOperational Flexibility & Resiliency
Selected Balance Sheet Developments
Counterparties Index of Charts & Tables
Contents Primary Credit Program &
Emergency Facilities
Open Market Operations
Financial Market Developments
& Policy Actions
Endnotes
remains steady through 2025, with the portfolio composed of roughly 70 percent Treasury securities and 30 percent MBS. Thereafter, the composition of the portfolio would depend both on the Committee’s approach to normalization and the pace of agency MBS paydowns; in the projections shown in Chart 36, the share of MBS reaches as high as 35 percent. However, the exercise assumes that once the long-run level of reserves is reached, the portfolio resumes growth through purchases of Treasury securities only, and the share of MBS held in the portfolio would decline.
SOMA NET INCOME AND REMITTANCES
The Federal Reserve remits excess earnings to the U.S. Treasury after providing for the cost of operations, the payment of dividends, and any amount necessary to maintain aggregate Reserve Bank capital surplus up to a specified limit. SOMA net income—a measure that reflects income and expenses associated with the SOMA portfolio, including its assumed funding costs—is the primary driver of Federal Reserve remittances.
In this exercise, SOMA net income is projected to rise through 2023 (the blue line in Chart 37); with the IOER rate remaining near zero, funding costs are low while coupon income increases as longer-term rates gradually rise. Further, due to the assumed growth in non-reserve liabilities, many of which are remunerated at zero, funding costs rise at a slower pace than portfolio income. Then, in the reinvestment phase, net income starts to decline as the IOER rate begins to increase more than long-term rates, and funding costs grow more than portfolio coupon income. Net income then stabilizes due to a stable spread between the IOER rate and longer-term rates, and trends slightly positive due to growth in non-interest-bearing liabilities. During the normalization phase, there is a range of possible outcomes for net income (as shown by the blue shading in Chart 37), reflecting the range of outcomes for both portfolio size and composition. Regardless, net income remains in line with the average since 2010 through the end of the investment horizon.
0
10
20
30
40
50Percent
2010 2014 2018 2022 2026 2030
Source: Federal Reserve Bank of New York.
Notes: Figures are as of year-end. Figures for 2010-20 are shaded and represent historical data. The range after 2025 reflects outcomes for the portfolio between full reinvestment and full run-off. Assumptions for SOMA purchases, interest rates, length of the reinvestment phase, and the growth of key liabilities are based on the Survey of Primary Dealers and the Survey of Market Participants conducted by the New York Fed in March 2021. Projected figures are rounded.
Chart 34Projected SOMA Domestic Securities Holdings as a Share of GDP
0
1,000
2,000
3,000
4,000
5,000
6,000
7,000
8,000
2010 2014 2018 2022 2026 2030
Chart 35Projected Reserve Balances
Source: Federal Reserve Bank of New York.
Notes: Figures are as of year-end. Figures for 2010-20 are shaded and represent historical balances. The range after 2025 reflects outcomes for the portfolio between full reinvestment and full run-off. Assumptions for SOMA purchases, interest rates, length of the reinvestment phase, and the growth of key liabilities are based on the Survey of Primary Dealers and the Survey of Market Participants conducted by the New York Fed in March 2021. Projected figures are rounded.
Billions of U.S. dollars

50
O P E N M A R K E T O P E R A T I O N S D U R I N G 2 0 2 0
Overview AppendixesOperational Flexibility & Resiliency
Selected Balance Sheet Developments
Counterparties Index of Charts & Tables
Contents Primary Credit Program &
Emergency Facilities
Open Market Operations
Financial Market Developments
& Policy Actions
Endnotes
To illustrate the sensitivity of SOMA net income to alternative interest rate paths, Chart 37 also shows the ranges of outcomes for net income assuming interest rates that are 100 basis points higher and lower than in the baseline (red and green regions, respectively). In both alternative interest rate scenarios, net portfolio income is lower in the short run. When interest rates are higher, funding costs are immediately higher, while coupon income grows gradually as higher yielding securities are added to the portfolio. In comparison, when interest rates are lower, funding costs remain unchanged relative to the baseline as the IOER rate is bounded by zero, but coupon income declines as lower yielding securities are added to the portfolio. By the end of the projection horizon, the higher and lower interest rate scenarios show higher and lower net income, respectively. While the spread between longer- and shorter-term interest rates and the size of the portfolio at the end of the projection horizon are similar in both scenarios, the portfolio in the lower interest
rate scenario is composed of lower yielding assets, resulting in less coupon income.
SOMA UNREALIZED GAINS AND LOSSES
The market value of securities holdings—and, accordingly, the portfolio’s unrealized gains or losses—fluctuates with changes in the prevailing level of interest rates. Importantly, the SOMA portfolio’s unrealized position has no effect on the ability of the Federal Reserve to meet its financial obligations and pursue its statutory goals of price stability and maximum employment; in addition, it has no implications for the evolution of the Federal Reserve’s earnings remittances to the U.S. Treasury or, ultimately, for U.S. taxpayers when, as expected, securities are held to maturity. Assuming the baseline path of interest rates, the current unrealized gain on the portfolio, calculated as the difference between the market value of the portfolio and its book
0
20
40
60
80
100
120
140
160
180200
2010 2014 2018 2022 2026 2030
Baseline Baseline - 100 bps Baseline + 100 bps
Chart 37Projected SOMA Net Income
Source: Federal Reserve Bank of New York.
Notes: Figures are as of year-end. Figures for 2010-20 are shaded and represent historical data. The range after 2025 reflects outcomes for the portfolio between full reinvestment and full run-off. Assumptions for SOMA purchases, interest rates, length of the reinvestment phase, and the growth of key liabilities are based on the Survey of Primary Dealers and the Survey of Market Participants conducted by the New York Fed in March 2021. Projected figures are rounded.
Billions of U.S. dollars
0
1,000
2,000
3,000
4,000
5,000
6,000
7,000
2010 2014 2018 2022 2026 2030
Agency MBS Treasury securities
Chart 36Projected SOMA Domestic Securities Holdings by Asset Class
Source: Federal Reserve Bank of New York.
Notes: Figures are as of year-end. Figures for 2010-20 are shaded and represent historical balances. The range after 2025 reflects outcomes for the portfolio between full reinvestment and full run-off. Assumptions for SOMA purchases, interest rates, length of the reinvestment phase, and the growth of key liabilities are based on the Survey of Primary Dealers and the Survey of Market Participants conducted by the New York Fed in March 2021. Projected figures are rounded.
Billions of U.S. dollars

51
O P E N M A R K E T O P E R A T I O N S D U R I N G 2 0 2 0
Overview AppendixesOperational Flexibility & Resiliency
Selected Balance Sheet Developments
Counterparties Index of Charts & Tables
Contents Primary Credit Program &
Emergency Facilities
Open Market Operations
Financial Market Developments
& Policy Actions
Endnotes
value (which reflects amortized cost), declines to an unrealized loss by the time the portfolio peaks in size in 2023, as shown in the blue series in Chart 38. This pattern follows the path of interest rates, which rise through 2023, and rise more slowly thereafter. Toward the end of the horizon, as interest rates reach their long-run levels, the unrealized loss begins to reverse due to the aging of the portfolio. The range of outcomes for gains and losses in the blue region reflects the range of outcomes for both portfolio size and composition in the long run.
To illustrate the sensitivity of this outcome to interest rates, Chart 38 also illustrates a range of outcomes for the SOMA’s unrealized gains and losses assuming interest rates 100 basis points higher and lower than in the baseline (red and green regions, respectively). The projections show that there is a wide range of potential outcomes for the unrealized gain or loss position of the portfolio depending on the trajectory of interest rates. Under higher and lower interest rates, the portfolio experiences unrealized losses and gains, respectively, as high as over 5 percent. In each interest rate scenario, the range of outcomes for unrealized gains and losses beyond 2025 reflects the range of outcomes for both portfolio size and composition in the long run.
-10
-5
0
5
10Percent
2010 2014 2018 2022 2026 2030
Chart 38Projected SOMA Unrealized Gains and Losses as a Share of the SOMA Portfolio
Source: Federal Reserve Bank of New York.
Notes: Figures are as of year-end. Figures for 2010-20 are shaded and represent historical data. The range after 2025 reflects outcomes for the portfolio between full reinvestment and full run-off. Assumptions for SOMA purchases, interest rates, length of the reinvestment phase, and the growth of key liabilities are based on the Survey of Primary Dealers and the Survey of Market Participants conducted by the New York Fed in March 2021. Projected figures are rounded.
Baseline Baseline - 100 bps Baseline + 100 bps

52

53
COUNTERPARTIES
O P E N M A R K E T O P E R A T I O N S D U R I N G 2 0 2 0
Overview AppendixesOperational Flexibility & Resiliency
Selected Balance Sheet Developments
Counterparties Index of Charts & Tables
Contents Primary Credit Program &
Emergency Facilities
Open Market Operations
Financial Market Developments
& Policy Actions
Endnotes
The New York Fed relies on a robust network of trading counterparties to supply the necessary operational capacity to execute domestic and foreign open market operations. This network of counterparties is diverse (see Box 2, “Counterparty Expansion for Select Facilities and Agency CMBS”) and geographically dispersed to ensure that the New York Fed can continue to conduct open market operations in a range of scenarios.56
PRIMARY DEALERSPrimary dealers are trading counterparties of the New York Fed in its implementation of monetary policy, and are expected to participate consistently and competitively in open market operations. They are also expected to make markets for the New York Fed on behalf of its official account holders as needed, and to bid on a pro rata basis in all Treasury auctions at reasonably competitive prices.57 The New York Fed also expects primary dealers to provide ongoing insight into market developments in the daily market monitoring activities that the Desk conducts to support the formulation and implementation of monetary policy. As of December 31, 2020, there were twenty-four primary dealers.
REVERSE REPURCHASE AGREEMENT COUNTERPARTIESTo enhance its ability to support the monetary policy objectives of the FOMC, the New York Fed has arrangements with an expanded set of counterparties with which the Desk can conduct reverse repo transactions. These RRP counterparties—which include money market funds, government-sponsored enterprises, and banks—augment the existing set of primary dealer counterparties with which the New York Fed can
conduct reverse repos. As of December 31, 2020, there were 122 expanded RRP counterparties, comprising ninety money market funds from twenty-seven investment management firms, fifteen government-sponsored enterprises, and seventeen banks.
FOREIGN EXCHANGE COUNTERPARTIES Foreign exchange counterparties are trading counterparties of the New York Fed in its foreign exchange operations conducted on behalf of the Federal Reserve and the U.S. Treasury. These counterparties are also expected to make reasonable markets for Desk transactions that relate to the currency needs of the New York Fed’s official account holders and agencies of the U.S. government. In addition, the New York Fed relies on its foreign exchange counterparties for ongoing insight into global financial market developments as it conducts daily market monitoring activities to support the formulation and implementation of policy by U.S. monetary authorities. Foreign exchange counterparties are expected to provide competitive two-way pricing, as needed, to support the Desk’s periodic foreign exchange operations. As of December 31, 2020, there were twenty-one foreign exchange counterparties.
FOREIGN RESERVES MANAGEMENT COUNTERPARTIESThe New York Fed transacts with foreign reserves management counterparties to invest the foreign currency reserves of the Federal Reserve and the U.S. Treasury. These counterparties are expected to participate consistently and competitively in the Desk’s periodic investment operations. As of December 31, 2020, there were twenty-four foreign reserves management counterparties, representing sixteen parent financial firms.

54
O P E N M A R K E T O P E R A T I O N S D U R I N G 2 0 2 0
Overview AppendixesOperational Flexibility & Resiliency
Selected Balance Sheet Developments
Counterparties Index of Charts & Tables
Contents Primary Credit Program &
Emergency Facilities
Open Market Operations
Financial Market Developments
& Policy Actions
Endnotes
In July 2020, the New York Fed announced
initiatives aimed at expanding the set of
counterparties for certain transactions in order to
increase both its operational capacity and its reach
into certain financial markets, and to support equal
opportunity and diversity in market operations and
facilities. Specifically, the New York Fed expanded
its counterparties and agents for three emergency
credit and liquidity facilities—the Commercial
Paper Funding Facility (CPFF), the Secondary
Market Corporate Credit Facility (SMCCF), and
the Term Asset-Backed Securities Loan Facility
(TALF).a In addition, in early September 2020,
the New York Fed announced plans to expand
counterparties for agency CMBS purchases.
Box 2
COUNTERPARTY EXPANSION FOR SELECT FACIL I T IES AND AGENCY CMBS
Expanded Counterparties and Agents by Program in 2020
Firm Name Agency CMBS CPFF SMCCF TALF
Academy Securities, Inc. ü ü ü
BNY Capital Markets LLC ü
Brean Capital LLC ü
CastleOak Securities, L.P. ü ü
FHN Financial Securities Corp. ü
Flow Traders U.S. Institutional Trading LLC ü
Great Pacific Securities ü
Guzman & Company ü
Imperial Capital, LLC ü
Jane Street Execution Services, LLC ü
Loop Capital Markets LLC ü ü ü ü
MarketAxess Corporation ü
Mischler Financial Group, Inc. ü ü
MUFG Securities Americas Inc. ü ü
PNC Capital Markets LLC ü
R. Seelaus & Co., LLC ü ü
Samuel A. Ramirez & Co., Inc. ü ü
SMBC Nikko Securities Americas, Inc. ü
SumRidge Partners, LLC ü
Tradeweb Direct LLC ü
U.S. Bancorp Investments, Inc. ü
Source: Federal Reserve Bank of New York.
Notes: Programs shown are the agency commercial mortgage-backed securities program (Agency CMBS), the Commercial Paper Funding Facility (CPFF), the Secondary Market Corporate Credit Facility (SMCCF), and the Term Asset-Backed Securities Loan Facility (TALF). In 2021, the New York Fed announced the selection of additional counterparties to support, as applicable, the CPFF and agency CMBS purchases. The agency CMBS counterparties added were Great Pacific Securities, Robert W. Baird & Co. Incorporated, and Raymond James & Associates, Inc. The additional dealer for the CPFF was Bancroft Capital, LLC.

55
O P E N M A R K E T O P E R A T I O N S D U R I N G 2 0 2 0
Overview AppendixesOperational Flexibility & Resiliency
Selected Balance Sheet Developments
Counterparties Index of Charts & Tables
Contents Primary Credit Program &
Emergency Facilities
Open Market Operations
Financial Market Developments
& Policy Actions
Endnotes
This expansion marked one of the largest
and most rapidly implemented counterparty
expansions undertaken by the New York Fed in
recent years, and encompassed a diverse set of
firms by size, business model, and ownership
profile. In order to implement the expansion,
key changes were made to counterparty criteria,
including lowering minimum net regulatory
capital requirements. The result of these initiatives
was that by year-end 2020, the New York
Fed onboarded a diverse set of twenty-one
new counterparties—including eight minority-,
woman-, or veteran-owned broker-dealers, three
G-SIB–affiliated broker-dealers, three regional
bank–affiliated broker-dealers, three electronic
market makers, two independent broker-dealers,
and two electronic trading platformsb (see table).
In 2020, these newly onboarded counterparties
transacted with the New York Fed in facilities
and market operations according to their
respective counterparty designations and began
providing market intelligence insights to the Desk
consistent with counterparty expectations.
Box 2 (cont.)
COUNTERPARTY EXPANSION FOR SELECT FACIL I T IES AND AGENCY CMBS
a The scope of this expansion was limited to these three 13(3) facilities, which started operating with a counterparty base limited to the New York Fed’s primary dealers. The Primary Dealer Credit Facility was open to primary dealers only. The Primary Market Corporate Credit Facility and the Municipal Liquidity Facility were both open to a wide range of issuers and underwriters, including small firms and minority-, women-, and veteran-owned business enterprises (MWVBEs), by design. For more information on the counterparty expansion program, see the FAQs, https://www.newyorkfed.org/markets/13-3-facility/13-3-facility-counterparty-expansion-program-faq.
b For more information, see the Federal Reserve Bank of New York’s Office of Minority and Women Inclusion (OMWI) 2020 Congressional Report, https://www.newyorkfed.org/medialibrary/media/aboutthefed/pdf/2020-omwi-annual-report-congress.pdf.

56
57
OPERATIONAL FLEXIBILITY AND RESILIENCY
O P E N M A R K E T O P E R A T I O N S D U R I N G 2 0 2 0
Overview AppendixesOperational Flexibility & Resiliency
Selected Balance Sheet Developments
Counterparties Index of Charts & Tables
Contents Primary Credit Program &
Emergency Facilities
Open Market Operations
Financial Market Developments
& Policy Actions
Endnotes
In 2020, the New York Fed continued to enhance its operational flexibility and resiliency by undertaking operational readiness exercises and a variety of initiatives to enhance cyber resiliency. Through significant efforts made by the Markets and Technology Groups of the Federal Reserve Bank of New York, all Desk staff were able to work from home beginning in mid-March, which ensured that the Desk was able to conduct operations to implement monetary policy in accordance with FOMC directives throughout the year. The testing exercises and resiliency planning conducted by the Desk over the course of many years also prepared the Desk to operate in a work from home posture.
OPERATIONAL READINESS Over the course of 2020, the Desk continued to conduct small-value exercises in both domestic and foreign financial markets for the purpose of ensuring operational readiness. During these exercises, transactions are conducted end-to-end, from trade execution through settlement, and are modest in size. The purpose of these exercises is to maintain the operational capability to execute a range of operation types that may be required to effectively implement future policy directives; however, conducting these operations should not be interpreted as a signal about the future timing or direction of changes in policy.
The benefit of conducting small-value exercises to maintain operational readiness was evident this year as the Desk was able to expeditiously implement policy directives to address market stress related to the COVID-19 pandemic. For example, conducting regular small-value U.S. dollar liquidity
swap exercises prepared the Desk to execute an expanded swap schedule with standing swap line central banks, while operational planning work supported the Desk’s ability to establish temporary swap lines with additional foreign central banks in March 2020.
The Desk also conducts small-value exercises using back-up tools for certain critical operations. This practice tests the Desk’s ability to conduct operations if the FedTrade platform were unavailable and is a key aspect of the Desk’s contingency preparedness efforts. In 2020, testing of the back-up tool was expanded to include overnight reverse repurchase agreement operations, in addition to overnight repurchase agreements and securities lending operations which the Desk has tested in previous years.
Consistent with the limits in the Authorization for Domestic and Foreign Open Market Operations approved by the FOMC, the aggregate par value of domestic outright operations conducted for the purpose of testing operational readiness did not exceed the limit of $5 billion per calendar year, and the outstanding amount of repo and reverse repo transactions conducted for this purpose did not exceed $5 billion at any given time. Domestic small-value exercises were announced in advance and the operation results were posted on the New York Fed’s website (Table 5). The aggregate amount of foreign currency operations conducted for the purpose of testing operational readiness did not exceed the limit of $2.5 billion per calendar year (Table 6). The results of small-value liquidity swap transactions were posted on the New York Fed’s website.

58
O P E N M A R K E T O P E R A T I O N S D U R I N G 2 0 2 0
Overview AppendixesOperational Flexibility & Resiliency
Selected Balance Sheet Developments
Counterparties Index of Charts & Tables
Contents Primary Credit Program &
Emergency Facilities
Open Market Operations
Financial Market Developments
& Policy Actions
Endnotes
OPERATIONAL AND CYBER RESILIENCY The Federal Reserve, its counterparties, and its customers operate in an increasingly complex environment in which trading and payment systems and an information infrastructure of growing sophistication open up new opportunities to obtain and manage information, conduct business, and communicate. During 2020, the impact of the COVID-19 pandemic presented significant operational challenges as it prompted the Federal Reserve, the majority of its counterparties, and its customers to transition to a work from home posture. The Desk staff transitioned to remote work beginning in mid-March and conducted operations from home for the rest of the year. This transition was made possible through enormous effort and collaboration across the Federal Reserve System. In addition, the Desk’s operational readiness exercises conducted over the
course of many years and lessons learned from previous crises contributed to the rapid crisis response.
As part of a long-standing commitment to proactively manage security risks, the Federal Reserve has continually invested in initiatives to improve physical and information security while also enhancing operational resilience, including collecting and analyzing threat intelligence, implementing defensive measures, and augmenting its detective and reactive capabilities. In recent years, the New York Fed has enhanced the resiliency of its operational infrastructure through a number of initiatives that have added protections for key transactional systems to address risks posed by cyber threats. Relatedly, the New York Fed continues to annually attest to the SWIFT Customer Security Programme (CSP) rolled out in 2017. Cyber
Table 5 Small-Value Exercise Results in 2020: Domestic Operations
Operation Type Time Frame Operation Amount
(Millions of U.S. Dollars)
Treasury outright salesFirst half 25
Second half 25
Agency MBS TBA purchases First half —
Second half 13
Agency MBS outright salesFirst half 167
Second half 84
Agency MBS coupon swapsFirst half 20
Second half 20
Overnight repurchase agreement with back-up toolFirst half 53
Second half 59
Overnight reverse repurchase agreement with back-up toolFirst half 95
Second half 103
Securities lending with back-up toolFirst half 68
Second half 82
Source: Federal Reserve Bank of New York.
Notes: Figures may be rounded. Further details for each small-value exercise are available on the Federal Reserve Bank of New York's website.

59
O P E N M A R K E T O P E R A T I O N S D U R I N G 2 0 2 0
Overview AppendixesOperational Flexibility & Resiliency
Selected Balance Sheet Developments
Counterparties Index of Charts & Tables
Contents Primary Credit Program &
Emergency Facilities
Open Market Operations
Financial Market Developments
& Policy Actions
Endnotes
resilience remained at the forefront of risk management during 2020 with media reporting numerous cyber events at a range of institutions and industries. The New York Fed created a 2020-2022 Cyber Security Strategy that articulates the Bank’s strategic choices and prioritizes investments to make the Bank more resilient against cyber attacks.
GEOGRAPHIC RESILIENCY In the event of wide-scale disruptions in large metropolitan areas (in particular, the New York region, where many market participants are located), the Federal Reserve must continue to conduct open market operations and settlement activities. In 2020, the Desk continued to reinforce its operational flexibility
and resiliency with a robust, geographically dispersed network of counterparties and Desk operations.
To maintain the resiliency of the Desk’s operations, the New York Fed continued to operate alternative sites for trading and settlement of open market operations in other Reserve Bank locations across the Federal Reserve System. These arrangements ensure that the Desk would have the resources needed to carry out critical operational and analytical activities should a contingency scenario affect the greater New York area. Similarly, all primary dealers have established and regularly tested geographically dispersed primary and secondary locations to ensure that robust end-to-end participation in open market operations would occur amid any wide-scale disruption.
Table 6 Small-Value Exercise Results in 2020: Foreign Operations
Operation Type Time Frame Operation Amount
Euro-denominated repurchase agreementsFirst half €7.5 million
Second half €3.0 million
Euro-denominated sovereign debt salesFirst half €2.3 million
Second half €1.1 million
Euro-denominated sovereign debt purchasesFirst half €2.3 million
Second half €1.1 million
Yen-denominated sovereign debt salesFirst half ¥600 million
Second half ¥300 million
Yen-denominated sovereign debt purchasesFirst half ¥600 million
Second half ¥300 million
U.S. dollar liquidity swaps with standing swap line central banks Second half $222,000
Foreign currency liquidity swaps
Swiss National Bank First half CHF 51,000
Bank of Canada Second half CAD 51,000
Bank of England Second half £51,000
Bank of Japan Second half ¥51,000
Source: Federal Reserve Bank of New York.
Notes: Figures may be rounded. Further details for each small-value exercise are available on the Federal Reserve Bank of New York’s website.

60

61
O P E N M A R K E T O P E R A T I O N S D U R I N G 2 0 2 0
Overview AppendixesOperational Flexibility & Resiliency
Selected Balance Sheet Developments
Counterparties Index of Charts & Tables
Contents Primary Credit Program &
Emergency Facilities
Open Market Operations
Financial Market Developments
& Policy Actions
Endnotes
The following tables summarize key components of the operational approaches for open market operations during 2020. For more information on each open market operation, including
frequently asked questions (FAQs), visit the Markets and Policy Implementation page of the New York Fed’s website, at https://
www.newyorkfed.org/markets.
Operational Approaches
APPENDIX 1:
Reverse Repurchase AgreementsFor more information, visit the FAQs at https://www.newyorkfed.org/markets/rrp_faq.
Maturity Overnight
Frequency Daily
Counterparties A broad set of money market participants, including primary dealers, money market funds, government-sponsored enterprises (GSEs), and banks
Operation size Limited by the value of Treasury securities held outright in the SOMA that was available for such operations
Per counterparty limit One proposition in a size not to exceed $30 billion
Offering rate • January 1 to March 2: 1.50 percent • March 3 to March 14: 1.00 percent • March 15 to December 31: 0 percent
Execution platform FedTrade, the Desk’s proprietary trading platform
How results were determined If the total amount of propositions received was less than or equal to the amount of avail-able securities, awards were made at the specified offering rate to all counterparties that submitted propositions.

62
O P E N M A R K E T O P E R A T I O N S D U R I N G 2 0 2 0
Overview AppendixesOperational Flexibility & Resiliency
Selected Balance Sheet Developments
Counterparties Index of Charts & Tables
Contents Primary Credit Program &
Emergency Facilities
Open Market Operations
Financial Market Developments
& Policy Actions
Endnotes
Repurchase AgreementsFor more information, visit the FAQs at https://www.newyorkfed.org/markets/repo-agreement-ops-faq.
Maturity Overnight and term including 14-day, 28-day, and 84-day
Frequency Overnight: once per day to twice per dayTerm: periodically during each monthly calendar period
Counterparties Primary dealers
Operation size Overnight: offering amounts of $100 billion to $500 billionTerm: offering amounts of $20 billion to $500 billion
Per counterparty limit Two propositions per collateral type
Proposition size limit $20 billion
Offering rate Overnight: Minimum bid rate was IOER rate until June 16, when it was raised to the IOER rate + 0.05 percent.
Term: Minimum bid rate on term operations was based on prevailing market rates until June 16, when it was set at the IOER rate + 0.10 percent for the 28-day operation.
Execution platform FedTrade, the Desk’s proprietary trading platform
Collateral type Treasury, agency debt, and agency MBS
How results were determined Awards were made based on competitive auctions that were fixed-quantity, multiple price. If the total volume bid in an individual operation was less than the maximum operation size, all bids were accepted.
Calendar publication practices The Desk published the planned schedule and amount of overnight and term repo operations on a monthly basis, for a one-month period.
From mid-March to June, the Desk published repo operation calendars on a daily, or near-daily basis, and in some cases, altered the repo operation schedule on the same day as operation parameters changed.
From June to the end of the year, the planned schedule of overnight and term repo operations was published on a monthly basis for a one-month period.

63
O P E N M A R K E T O P E R A T I O N S D U R I N G 2 0 2 0
Overview AppendixesOperational Flexibility & Resiliency
Selected Balance Sheet Developments
Counterparties Index of Charts & Tables
Contents Primary Credit Program &
Emergency Facilities
Open Market Operations
Financial Market Developments
& Policy Actions
Endnotes
Central Bank Liquidity Swaps For more information, visit the FAQs at https://www.federalreserve.gov/newsevents/pressreleases/swap-lines-faqs.htm.
Maturity Up to 88 days
Frequency The liquidity swap line central banks hold U.S. dollar liquidity-providing operations according to a schedule pre-approved by the Chair of the FOMC.
For participating standing swap central banks, the frequency of one-week maturity operations ranged from daily to weekly, and three-month maturity operations were conducted weekly.
Operation results for standing and temporary swap line central banks are published weekly on the New York Fed’s website at https://apps.newyorkfed.org/markets/autorates/fxswap.
Swap line central banks • Foreign central banks with standing swap line arrangements
• Foreign central banks with temporary swap line arrangements
Per counterparty limit • Standing swap central banks: no per counterparty limit is specified• Temporary swap central banks: up to $60 billion each for the Reserve Bank of Australia,
the Banco Central do Brasil, the Bank of Korea, the Banco de México, the Monetary Authority of Singapore, and the Sveriges Riksbank; $30 billion each for the Danmarks Nationalbank, the Norges Bank, and the Reserve Bank of New Zealand
Price For pricing details of liquidity swap operations for standing and temporary swap central banks, see https://apps.newyorkfed.org/markets/autorates/fxswap.
Treasury Securities Operations For more information, visit the FAQs at https://www.newyorkfed.org/markets/treasury-reinvestments-purchases-faq.html.
Reserve Management Purchases and Reinvestment Purchases of Agency Security Principal Payments
Frequency Generally between 0 and 2 times per day
Counterparties Primary dealers
SOMA holdings limits and purchase limits
SOMA holdings were limited to a maximum of 70 percent of the total outstanding amount of any individual Treasury security.
For nominal coupons, TIPS, and FRNs, the Desk allowed the share of SOMA holdings of an individual Treasury security to rise above 35 percent in modest increments. For bills, the Desk allowed the share of SOMA holdings of an individual security to rise above 17.5 percent in modest increments.
Operation size Varied depending on the maturity range and security being purchased
Excluded securities Securities trading with heightened scarcity value in the repo market for specific collateral, newly issued nominal coupon securities, and securities that were cheapest to deliver into active Treasury futures contracts. Securities with four weeks or less to maturity were also excluded.
Execution platform FedTrade, the Desk’s proprietary trading platform

64
O P E N M A R K E T O P E R A T I O N S D U R I N G 2 0 2 0
Overview AppendixesOperational Flexibility & Resiliency
Selected Balance Sheet Developments
Counterparties Index of Charts & Tables
Contents Primary Credit Program &
Emergency Facilities
Open Market Operations
Financial Market Developments
& Policy Actions
Endnotes
cont. from page 63
Maturity range of purchases Between January and mid-March, the maturity ranges of purchases for nominal coupon securities were 0-0.75 years, 0.75-1.5 years, 1.5-2.25 years, 2.25-3 years, 3-4.5 years, 4.5-7 years, 7-20 years, and 20-30 years.
Also between January and mid-March, the Desk alternated between transacting in shorter-dated (1-7.5 year) and longer-dated (7.5-30 year) maturity ranges in TIPS from month to month. During 2020, the Desk did not purchase TIPS with one year or less to maturity.
How results were determined Offers were evaluated based on their proximity to prevailing market prices at the close of the operation, as well as measures of relative value. Relative value measures were calculated using the Federal Reserve Bank of New York’s proprietary model.
Calendar publication practices The Desk published a tentative schedule of operations each month, which included the maturity range and planned purchase amount for each operation, along with operation dates and times.
Asset Purchases
Frequency Generally between 0 and 7 times per day
Counterparties Primary dealers
SOMA holdings limits and purchase limits
SOMA holdings were limited to a maximum of 70 percent of the total outstanding amount of any individual Treasury security.
For nominal coupons, TIPS, and FRNs, the Desk allowed the share of SOMA holdings of an individual Treasury security to rise above 35 percent in modest increments. For bills, the Desk allowed the share of SOMA holdings of an individual security to rise above 17.5 percent in modest increments.
Operation size Varied depending on the maturity range and security being purchased
Excluded securities Securities trading with heightened scarcity value in the repo market for specific collateral, newly issued nominal coupon securities, and securities that were cheapest to deliver into active Treasury futures contracts, with the exception of the period noted below. Securities with four weeks or less to maturity were also excluded.
From March 13 to April 17: securities that were cheapest to deliver into active Treasury futures contracts were considered eligible for purchase in order to support smooth market functioning.
Execution platform FedTrade, the Desk’s proprietary platform
Maturity range of purchases Beginning in mid-March, in order to conduct asset purchases at the pace and scale required, purchases of nominal securities were consolidated into fewer but larger maturity ranges. These ranges for each purchase operation were 0-2.25 years, 2.25-4.5 years, 4.5-7 years, 7-20 years, and 20-30 years. This approach provided a larger universe of eligible securities within certain purchase ranges, and enabled the Desk to conduct larger operations.
In some sectors, multiple operations per day were sometimes conducted to spread out the amount of duration risk primary dealers would face in each operation.
Purchases of TIPS were conducted in two maturity ranges of 1-7.5 years and 7.5-30 years. During 2020, the Desk did not purchase TIPS with one year or less to maturity.

65
O P E N M A R K E T O P E R A T I O N S D U R I N G 2 0 2 0
Overview AppendixesOperational Flexibility & Resiliency
Selected Balance Sheet Developments
Counterparties Index of Charts & Tables
Contents Primary Credit Program &
Emergency Facilities
Open Market Operations
Financial Market Developments
& Policy Actions
Endnotes
cont. from page 64
How results were determined Offers were evaluated based on their proximity to prevailing market prices at the close of the operation, as well as measures of relative value. Relative value measures were calcu-lated using the Federal Reserve Bank of New York’s proprietary model.
Calendar publication practices From mid-March through mid-April, the Desk published tentative planned upcoming purchase amounts, along with operation dates, times, and security types, on a daily, or near-daily, basis.
From April through June 10, planned upcoming purchase amounts, along with operation dates, times, and security types, were published in a tentative weekly schedule.
From June 11 through year-end, planned monthly purchase amounts were published monthly, and tentative schedules of purchase operations including dates, times, security types, maturities, and maximum purchase amounts were published twice per month.
Reinvestments of Treasury SecuritiesFor more information, visit the FAQs at https://www.newyorkfed.org/markets/treasury-rollover-faq.html.
Frequency Dependent on Treasury securities maturing in the SOMA portfolio and Treasury auction calendar
Counterparties U.S. Treasury
Reinvestment amount Equal to the value of maturing Treasury securities held in the SOMA
SOMA holdings limit A maximum of 70 percent of the total outstanding amount of any individual Treasury security
Execution platform Treasury Automated Auction Processing System (TAAPS)
Offer submission Noncompetitive bids were placed at Treasury auctions equal in par amount to the value of SOMA holdings maturing on the issue date of the securities being auctioned. These bids were treated as add-ons to announced auction sizes.
How results were determined Noncompetitive bidders received the stop-out rate, yield, or discount margin determined by the competitive auction process.

66
O P E N M A R K E T O P E R A T I O N S D U R I N G 2 0 2 0
Overview AppendixesOperational Flexibility & Resiliency
Selected Balance Sheet Developments
Counterparties Index of Charts & Tables
Contents Primary Credit Program &
Emergency Facilities
Open Market Operations
Financial Market Developments
& Policy Actions
Endnotes
Securities LendingFor more information, visit the FAQs at https://www.newyorkfed.org/markets/sec_faq.html.
Maturity Overnight
Frequency Daily
Counterparties Primary dealers
Operation size Limited by the value of Treasury and agency debt securities held outright in the SOMA that was available for such operations
Aggregate lending limit Ninety percent of each Treasury and agency security owned by the SOMA with a maturity of greater than thirteen days was available for lending each day (the “theoretical amount” available to borrow).
Per counterparty limit A maximum of 25 percent of the theoretical amount available to borrow per issue and $5.0 billion total par in outstanding loans at any one time
Per issue bid limit Up to two bids per issue
Execution platform FedTrade, the Desk’s proprietary trading platform
Collateral type Treasury securities
Lending fee rate 5 basis points
How results were determined Loans were awarded based on competitive bidding in a multiple price auction for each security.

67
O P E N M A R K E T O P E R A T I O N S D U R I N G 2 0 2 0
Overview AppendixesOperational Flexibility & Resiliency
Selected Balance Sheet Developments
Counterparties Index of Charts & Tables
Contents Primary Credit Program &
Emergency Facilities
Open Market Operations
Financial Market Developments
& Policy Actions
Endnotes
Agency MBSAsset Purchases and Reinvestments For more information, visit the FAQs at https://www.newyorkfed.org/markets/ambs-treasury-faq.
Frequency The frequency of operations generally ranged between 0 and 6 times per day.
• Zero to once per day during January and February
• As many as six times per day during March, decreasing to a more consistent three times per day in the second half of the year
Counterparties Primary dealers that transact in the agency MBS market
Eligible securities MBS guaranteed by Fannie Mae, Freddie Mac, and Ginnie Mae
How results were determined Offers were evaluated based on their proximity to prevailing market prices at the close of the operation.
Execution platform FedTrade, the Desk’s proprietary trading platform
Calendar publication practices From mid-March to mid-April, the Desk published the tentative schedule of planned purchase amounts on a daily, or near-daily, basis.
From mid-April through the beginning of June, planned upcoming purchase amounts, along with operation dates, times, and security types, were published in a tentative weekly schedule.
From mid-June through year-end, planned monthly purchase amounts were published monthly, and tentative schedules of purchase operations including dates, times, security types (including agency, term, and coupon), and maximum purchase amounts were published twice per month.
Dollar RollsFor more information, visit the FAQs at https://www.newyorkfed.org/markets/ambs-treasury-faq.
Frequency Throughout the month, but no later than the morning of two business days before TBA settlement dates—also known as “Notification Day.” The amount of dollar rolls conducted may vary throughout the month depending on movements in implied financing rates.
Counterparties Primary dealers that transact in agency MBS markets
Execution platform Tradeweb, a commercial trading platform

68
O P E N M A R K E T O P E R A T I O N S D U R I N G 2 0 2 0
Overview AppendixesOperational Flexibility & Resiliency
Selected Balance Sheet Developments
Counterparties Index of Charts & Tables
Contents Primary Credit Program &
Emergency Facilities
Open Market Operations
Financial Market Developments
& Policy Actions
Endnotes
Agency CMBSAsset Purchases and Reinvestments For more information, visit the FAQs at https://www.newyorkfed.org/markets/domestic-market-operations/monetary-policy-implementation/agency-commercial-mortgage-backed-securities/agency-commercial-mortgage-backed-securities-faq.
Frequency Generally between 0 and 2 times per week
Counterparties Primary dealers and other broker-dealers including: Brean Capital LLC, PNC Capital Markets LLC, Academy Securities, Inc., Loop Capital Markets LLC, Mischler Financial Group, Inc. and Samuel A. Ramirez & Co., Inc.
Eligible securities Those secured primarily by multifamily home mortgages that were guaranteed fully as to the principal and interest by Fannie Mae, Freddie Mac, and Ginnie Mae
Execution platform The Desk employed an investment manager to transact with market participants on behalf of the Federal Reserve Bank of New York.
How results were determined Offers were evaluated based on their value relative to market prices. Relative value mea-sures were calculated by evaluating risk characteristics and competitiveness of offers compared to market pricing.
Calendar publication practices The Desk published a tentative schedule of operations on Fridays following the completion of the last previously scheduled operation, which included the agency, collateral type, settlement date, minimum lot size, and maximum purchase amount for each operation, along with operation dates and times.
Foreign Reserves Management For more information, https://www.newyorkfed.org/markets/international-market-operations/foreign-reserves-management.
Counterparties Foreign Reserves Management counterparties
Eligible securities The SOMA’s foreign currency reserves may be invested on an outright basis in German, French, Dutch, and Japanese government securities, as well as in deposits at the Bank for International Settlements and at foreign central banks such as the Deutsche Bundesbank, Banque de France, and Bank of Japan.
Platform Tradeweb and Bloomberg, commercial trading platforms, and voice trading

69
O P E N M A R K E T O P E R A T I O N S D U R I N G 2 0 2 0
Overview AppendixesOperational Flexibility & Resiliency
Selected Balance Sheet Developments
Counterparties Index of Charts & Tables
Contents Primary Credit Program &
Emergency Facilities
Open Market Operations
Financial Market Developments
& Policy Actions
Endnotes
AUTHORIZATION FOR DOMESTIC OPEN MARKET OPERATIONS
On January 28, 2020, by unanimous vote, the FOMC voted to reaffirm the Authorization for Domestic Open Market Operations.
https://www.federalreserve.gov/monetarypolicy/files/FOMC_RulesAuthPamphlet_202001.pdf
See page 50: Authorization for Domestic Open Market Operations
By notation vote concluded on March 31, 2020, the FOMC amended the Authorization for Domestic Open Market Operations to authorize, and adopted a resolution to approve, the establishment of a temporary repo facility for foreign and international monetary authorities (FIMA Repo Facility).
[Authorizations are archived on the website on an annual basis.]
https://www.federalreserve.gov/monetarypolicy/files/FOMC_RulesAuthPamphlet_202101.pdf
See page 50: Authorization for Domestic Open Market Operations
GUIDELINES FOR THE CONDUCT OF SYSTEM OPEN MARKET OPERATIONS IN FEDERAL-AGENCY ISSUES
The Guidelines for the Conduct of System Open Market Operations in Federal-Agency Issues, which were temporarily suspended on January 27, 2009, remained suspended throughout 2020.
DOMESTIC POLICY DIRECTIVES ISSUED TO THE FEDERAL RESERVE BANK OF NEW YORK
In 2020, the FOMC authorized and directed the Open Market Desk at the Federal Reserve Bank of New York to execute transactions in the SOMA in accordance with domestic
policy directives. The following is a list of links to the domestic policy directives issued by the FOMC from January 1 to December 31.
Open Market Operations from January 1 to January 29The FOMC issued the following domestic policy directive on December 11, 2019.
https://www.federalreserve.gov/newsevents/pressreleases/monetary20191211a1.htm
Open Market Operations from January 30 to March 3The FOMC issued the following domestic policy directive on January 29, 2020.
https://www.federalreserve.gov/newsevents/pressreleases/monetary20200129a1.htm
Open Market Operations from March 4 to March 15The FOMC issued the following domestic policy directive on March 3, 2020.
https://www.federalreserve.gov/newsevents/pressreleases/monetary20200303a1.htm
Open Market Operations from March 16 to April 29The FOMC issued the following domestic policy directive on March 15, 2020.
https://www.federalreserve.gov/newsevents/pressreleases/monetary20200315a1.htm
Open Market Operations from April 30 to June 10The FOMC issued the following domestic policy directive on April 29, 2020.
https://www.federalreserve.gov/newsevents/pressreleases/monetary20200429a1.htm
Governing Documents
APPENDIX 2:

70
APPENDIX 3:Operations Disclosures
O P E N M A R K E T O P E R A T I O N S D U R I N G 2 0 2 0
Overview AppendixesOperational Flexibility & Resiliency
Selected Balance Sheet Developments
Counterparties Index of Charts & Tables
Contents Primary Credit Program &
Emergency Facilities
Open Market Operations
Financial Market Developments
& Policy Actions
Endnotes
The following table summarizes the types of information disclosed by the Desk about various SOMA operations. To access the data listed in the table, visit the Markets Data Dashboard on the
New York Fed’s website, at https://www.newyorkfed.org/markets/
data-hub. For U.S. Treasury data, see htpps://www.treasurydirect.
gov/instit/annceresult/annceresult_query.htm.
Open Market Operations from June 11 to July 29The FOMC issued the following domestic policy directive on June 10, 2020.
https://www.federalreserve.gov/newsevents/pressreleases/monetary20200610a1.htm
Open Market Operations from July 30 to September 16The FOMC issued the following domestic policy directive on July 29, 2020.
https://www.federalreserve.gov/newsevents/pressreleases/monetary20200729a1.htm
Open Market Operations from September 17 to November 5The FOMC issued the following domestic policy directive on September 16, 2020.
https://www.federalreserve.gov/newsevents/pressreleases/monetary20200916a1.htm
Open Market Operations from November 6 to December 16The FOMC issued the following domestic policy directive on November 5, 2020.
https://www.federalreserve.gov/newsevents/pressreleases/monetary20201105a1.htm
Open Market Operations from December 17 to December 31The FOMC issued the following domestic policy directive on December 16, 2020.
https://www.federalreserve.gov/newsevents/pressreleases/monetary20201216a1.htm
FIMA DESK RESOLUTIONThe FOMC issued the following Desk Resolution regarding the FIMA Repo Facility on December 15, 2020.
https://www.federalreserve.gov/monetarypolicy/files/FOMC_FIMADeskResolution.pdf
AUTHORIZATION FOR FOREIGN CURRENCY OPERATIONS AND FOREIGN CURRENCY DIRECTIVE
On January 28, 2020, by unanimous vote, the FOMC voted to reaffirm without change the Authorization for Foreign Currency Operations and the Foreign Currency Directive.
https://www.federalreserve.gov/monetarypolicy/files/FOMC_RulesAuthPamphlet_202001.pdf
See: Page 52: Authorization for Foreign Currency Operations Page 56: Foreign Currency Directive
By notation vote concluded on March 19, 2020, the FOMC approved amendments to the Authorization for Foreign Currency Operations and to the Foreign Currency Directive and authorized the establishment of temporary U.S. dollar liquidity arrangements (swap lines). The Foreign Directive was amended to direct the Federal Reserve Bank of New York to establish and maintain temporary dollar liquidity arrangements with nine central banks.
[Authorizations are archived on the website on an annual basis.]
https://www.federalreserve.gov/monetarypolicy/files/FOMC_
RulesAuthPamphlet_202101.pdf
See: Page 52: Authorization for Foreign Currency Operations Page 56: Foreign Currency Directive

71
O P E N M A R K E T O P E R A T I O N S D U R I N G 2 0 2 0
Overview AppendixesOperational Flexibility & Resiliency
Selected Balance Sheet Developments
Counterparties Index of Charts & Tables
Contents Primary Credit Program &
Emergency Facilities
Open Market Operations
Financial Market Developments
& Policy Actions
Endnotes
Operations Disclosures
Operation Type Operation Schedule Operation ResultsAdditional
Operations Dataa Transaction Datab
Domestic open market operations
Overnight repo ü ü ü üTerm repo ü ü ü üOvernight RRP c ü ü üTreasury outright purchases ü ü ü üTreasury rollovers üd
Treasury rollovers with bills üd
Treasury securities lending c ü ü üAgency MBS outright purchases ü ü ü üAgency MBS dollar rolls ü üAgency CMBS purchases ü ü ü ü
Foreign open market operations
Foreign sovereign debt purchases üCentral bank liquidity swaps üe
Small-value exercises
Repurchase agreements ü ü ü üReverse repurchase agreements ü ü ü üTreasury outright sales ü ü ü üSecurities lending ü ü üAgency MBS TBA purchases ü ü ü ü
Agency MBS outright sales ü ü ü ü
Agency MBS coupon swaps ü ü ü üForeign sovereign debt sales üForeign sovereign debt purchases üForeign currency reposf ü
Central bank liquidity swaps üe
Source: Federal Reserve Bank of New York.aAdditional data could include details about types of counterparties, pricing, and higher-frequency transaction data.bThe New York Fed discloses transaction data with market counterparties on a quarterly basis with a two-year lag, in accordance with the Dodd-Frank Act. Details include: the date and amount of the transaction; the counterparty to the transaction; the price, interest rate, or exchange rate at which the transaction was conducted; other relevant terms; and for certain types of transactions, information about the collateral. cSince overnight RRP and Treasury securities lending are daily facilities, a regular calendar is not released; schedule changes are typically announced at least one business day prior to the operation.dSOMA awards are released by the U.S. Treasury after each auction.eTransactions between the New York Fed and foreign central bank counterparties are reported weekly by the New York Fed; foreign central banks' operation results are reported immediately after the completion of their respective auctions.fIn the Dodd-Frank Act transaction data disclosures for foreign currency repos and foreign currency reverse repos, the transaction category is reclassified to match the perspective of the New York Fed's counterparty.

72
The assumptions underlying the scenarios for the SOMA portfolio and the SOMA net income projection exercise are presented below. Sources for these assumptions include the March 2021 Survey of Primary Dealers and the March 2021 Survey of Market Participants.
INTEREST RATE ASSUMPTIONS: ◆ A combined set of responses to the March 2021 Surveys of
Primary Dealers and Market Participants for:■ the effective federal funds rate, ■ the ten-year Treasury yield, and ■ the thirty-year fixed primary mortgage rate.
◆ The IOER rate is assumed to be set 10 basis points above the bottom of the target range.
◆ The ON RRP offering rate is assumed to be set at the bottom of the target range.
◆ In alternate interest rate scenarios, the interest rate is bounded below by 0 percent.
BALANCE SHEET ASSUMPTIONS: ◆ Projections start with the Federal Reserve balance sheet as of
February 26, 2021.
◆ Asset-related assumptions:■ A combined set of responses to the March 2021 Surveys
of Primary Dealers and Market Participants for:• Treasury and MBS purchases (net of reinvestments)• The minimum length of the reinvestment phase
■ Once reserve balances reach their assumed long-run level (see below), organic growth purchases are conducted in Treasury securities to keep up with the organic growth in liabilities and capital, while principal payments on MBS are reinvested into Treasury securities. If the portfolio is held constant at $9 trillion through ongoing reinvestment of maturing securities, the long-run level of reserves is not reached by the end of the projection horizon in 2030.
◆ Liability-related assumptions:■ Longer-run levels of non-reserve liabilities and
capital (excluding the TGA) are based on their average February 2021 level and grow over the projection horizon in line with nominal GDP, where the nominal GDP growth is based on combined responses to the March 2021 Surveys of Primary Dealers and Market Participants.
■ The long-run level of reserves begins at the December 2019 average reserves level and grows with nominal GDP to $2.4 trillion by the end of 2030.
■ The TGA falls to $500 billion by the end of the second quarter of 2021 and grows with nominal GDP starting in the fourth quarter of 2021 to $715 billion by the end of 2030.
■ Currency grows to $3.9 trillion by the end of 2030.■ Foreign repo pool grows to $303 billion by
the end of 2030.■ DFMU balances grow to $250 billion by the end of 2030.
APPENDIX 4:Summary of Projection Assumptions
O P E N M A R K E T O P E R A T I O N S D U R I N G 2 0 2 0
Overview AppendixesOperational Flexibility & Resiliency
Selected Balance Sheet Developments
Counterparties Index of Charts & Tables
Contents Primary Credit Program &
Emergency Facilities
Open Market Operations
Financial Market Developments
& Policy Actions
Endnotes

73
Policies, communications, and data discussed in this document can be found online at the websites for the Board of Governors of the Federal Reserve System and the Federal Reserve Bank of New York. Below, we provide the primary web pages where this source material can be found.
FEDERAL RESERVE BOARDFOMC Rules and Authorizations
https://www.federalreserve.gov/monetarypolicy/rules_authorizations.htm
FOMC statements, implementation notes, minutes, and information about policy normalization
http://www.federalreserve.gov/monetarypolicy/fomccalendars.htm
https://www.federalreserve.gov/monetarypolicy/policy-normalization.htm
Background on reserve requirements, interest on reserves, and IOER
https://www.federalreserve.gov/monetarypolicy/reservereq.htm
http://www.federalreserve.gov/monetarypolicy/reqresbalances.htm
Detailed transaction information about discount window lending to depository institutions and historical open market operations
https://www.federalreserve.gov/regreform/discount-window.htm
https://www.newyorkfed.org/markets/omo_transaction_data
Federal Reserve System financial reports
https://www.federalreserve.gov/monetarypolicy/bst_fedfinancials.htm
Operational results, announcements, and other details regarding the Term Deposit Facility
https://www.federalreserve.gov/monetarypolicy/tdf.htm
Federal Reserve System COVID-19 Resources
https://www.federalreserve.gov/covid-19.htm
FEDERAL RESERVE BANK OF NEW YORKMarkets and Policy Implementation
https://www.newyorkfed.org/markets/index.html
Electronic version of this report and the underlying data for the charts and tables
https://www.newyorkfed.org/markets/annual_reports.html
OPERATIONAL POLICIES, FAQS, OPERATION RESULTS, AND OTHER DETAIL REGARDING:
Domestic market operations
https://www.newyorkfed.org/markets/domestic-market-operations
Repurchase and reverse repurchase agreements
https://www.newyorkfed.org/markets/rrp_op_policies.html
https://apps.newyorkfed.org/markets/autorates/temp
Treasury open market and securities lending operations
https://www.newyorkfed.org/markets/domestic-market-operations/monetary-policy-implementation/treasury-securities
APPENDIX 5:Reference Web Pages
O P E N M A R K E T O P E R A T I O N S D U R I N G 2 0 2 0
Overview AppendixesOperational Flexibility & Resiliency
Selected Balance Sheet Developments
Counterparties Index of Charts & Tables
Contents Primary Credit Program &
Emergency Facilities
Open Market Operations
Financial Market Developments
& Policy Actions
Endnotes

74
O P E N M A R K E T O P E R A T I O N S D U R I N G 2 0 2 0
Overview AppendixesOperational Flexibility & Resiliency
Selected Balance Sheet Developments
Counterparties Index of Charts & Tables
Contents Primary Credit Program &
Emergency Facilities
Open Market Operations
Financial Market Developments
& Policy Actions
Endnotes
http://nyapps.newyorkfed.org/markets/pomo/operations/index.html
https://www.newyorkfed.org/markets/domestic-market-operations/monetary-policy-implementation/securities-lending
Agency MBS open market operations
https://www.newyorkfed.org/markets/domestic-market-operations/monetary-policy-implementation/agency-mortgage-backed-securities
https://www.newyorkfed.org/markets/ambs/operations/results
Agency CMBS open market operations
https://www.newyorkfed.org/markets/domestic-market-operations/monetary-policy-implementation/agency-commercial-mortgage-backed-securities
https://www.newyorkfed.org/markets/domestic-market-operations/monetary-policy-implementation/agency-commercial-mortgage-backed-securities/agency-commercial-mortgage-backed-securities-operations
International market operations
https://www.newyorkfed.org/markets/international-market-operations
Foreign currency operations, including foreign reserves management, central bank liquidity swaps, and foreign exchange quarterly reports
https://www.newyorkfed.org/markets/international-market-operations/foreign-reserves-management
https://www.newyorkfed.org/markets/international-market-operations/central-bank-swap-arrangements
https://www.newyorkfed.org/markets/quar_reports.html
New York Fed counterparties for market operations
https://www.newyorkfed.org/markets/counterparties
System Open Market Account holdings
https://www.newyorkfed.org/markets/soma-holdings
Consolidated list of statements and operating policies across all Desk open market operations
https://www.newyorkfed.org/markets/op_policies.html
Desk statement regarding small-value exercises
https://www.newyorkfed.org/markets/operational-readiness
Desk Surveys of primary dealers and market participants
https://www.newyorkfed.org/markets/primarydealer_survey_questions
https://www.newyorkfed.org/markets/survey_market_participants
FR 2420 Report of Selected Money Rates
https://www.newyorkfed.org/markets/reference-rates
https://apps.newyorkfed.org/markets/autorates/obfr
https://www.newyorkfed.org/markets/obfrinfo
https://www.newyorkfed.org/medialibrary/media/markets/EFFR-technical-note-070815.pdf
Services for central banks and international institutions
https://www.newyorkfed.org/markets/central-bank-and-international-account-services
New York Fed actions related to COVID-19
https://www.newyorkfed.org/markets/new-york-fed-actions-related-to-covid-19

75
ENDNOTES
O P E N M A R K E T O P E R A T I O N S D U R I N G 2 0 2 0
Overview AppendixesOperational Flexibility & Resiliency
Selected Balance Sheet Developments
Counterparties Index of Charts & Tables
Contents Primary Credit Program &
Emergency Facilities
Open Market Operations
Financial Market Developments
& Policy Actions
Endnotes
1 In response to the events related to the COVID-19 pandemic, the Federal Reserve issued statements, guidance, and rules to support financial institutions and the economy. These measures included but were not limited to: temporarily changing the supplementary leverage ratio to increase banking organizations’ ability to support credit to households and businesses by permitting exclusion of U.S. Treasury securities and deposits at Federal Reserve Banks; temporarily reducing the community bank leverage ratio; neutralizing the regulatory capital and liquidity coverage ratio effects of participating in the Federal Reserve liquidity facilities; delaying the impact of the “current expected credit loss,” or CECL, accounting standard in regulatory capital; and encouraging banks to use their capital and liquidity buffers. All of these measures were intended to support the flow of credit and liquidity and ease operational burdens. The Federal Reserve also offered regulatory reporting relief to small financial institutions and encouraged banks, savings associations, and credit unions to offer responsible small-dollar loans to consumers and small businesses. For more information on the Federal Reserve’s supervisory and regulatory actions in response to COVID-19, see https://www.federalreserve.gov/supervisory-regulatory-action-response-covid-19.htm.
2 All dollar values of total balance sheet size reflect inflation compensation and net unamortized premiums and discounts. All dollar values of securities held in the domestic SOMA portfolio refer to inflation-adjusted par (face) values and reflect unsettled agency MBS and agency CMBS purchase amounts. Values of agency MBS and agency CMBS refer to the remaining principal balance of the securities. Unless otherwise noted, the dollar values of securities held in the foreign SOMA portfolio are provided on an amortized cost basis. The Federal Reserve reports SOMA securities holdings at par (face) value, inflation compensation, and any unamortized premiums or discounts separately in its weekly statistical release on the balance sheet. Note that elsewhere, for purposes of financial accounting, SOMA securities holdings are reported at amortized cost, and gains and losses resulting from sales of securities are determined based on the average cost of each purchased and sold security.
3 Annual reports on open market operations and accompanying data can be found at https://www.newyorkfed.org/markets/
annual_reports.html. In preparing the material presented in this report, the Federal Reserve Bank of New York used data and other information from various third-party sources. The New York Fed’s information suppliers are not responsible for the content of this report, and they do not warrant or guarantee the accuracy, timeliness, or completeness of information presented in the report.
4 For detailed descriptions of developments in money markets, see the “Overview of Recent Events and Potential Reform Options for Money Market Funds,” Report of the President’s Working Group on Financial Markets, https://home.treasury.gov/system/files/136/PWG-MMF-report-final-Dec-2020.pdf.
5 At the beginning of the year, the Desk was engaged in a program to conduct $60 billion of reserve management purchases of Treasury bills per month to maintain, over time, reserves at or above the level that prevailed in early September 2019. Also, the Desk was reinvesting principal payments from agency debt and agency MBS of up to $20 billion per month in Treasury securities; principal payments in excess of $20 billion per month were reinvested in agency MBS.
6 For detailed descriptions of Federal Reserve actions and facilities to support households, businesses, and municipalities during the COVID-19 crisis, see the Federal Reserve Financial Stability report, November 2020. https://www.federalreserve.gov/publications/2020-november-financial-stability-report-overview.htm.
7 The Dodd-Frank Act mandates that any emergency lending programs and facilities authorized by the Federal Reserve under Section 13(3) of the Federal Reserve Act must have broad-based eligibility and must be approved by the Secretary of the Treasury.
8 For more information on FOMC communications related to policy normalization, see https://www.federalreserve.gov/monetarypolicy/policy-normalization.htm.
9 The Federal Reserve also sets the rate of interest paid on required reserves (IORR), which at the time of this report is the same as the IOER rate.

76
O P E N M A R K E T O P E R A T I O N S D U R I N G 2 0 2 0
Overview AppendixesOperational Flexibility & Resiliency
Selected Balance Sheet Developments
Counterparties Index of Charts & Tables
Contents Primary Credit Program &
Emergency Facilities
Open Market Operations
Financial Market Developments
& Policy Actions
Endnotes
10 In years past when excess reserves were very elevated, IOER served only as a soft rather than firm floor on overnight interest rates as a result of certain institutional features of the U.S. money market. These features include bank-only access to IOER, which makes key cash lenders in U.S. money markets, such as government-sponsored enterprises and money market mutual funds, ineligible to earn the IOER rate. To support a firmer floor under overnight interest rates, the Federal Reserve uses an ON RRP facility through which it offers a daily risk-free overnight investment with same-day settlement to a wide range of active nonbank lenders in addition to banks.
11 The Desk also maintains reciprocal currency arrangements of $2 billion with the Bank of Canada and $3 billion with Banco de México. These arrangements were established in 1994 under the North American Framework Agreement to promote orderly currency exchange markets.
12 In a U.S. dollar liquidity swap, a foreign central bank (FCB) transfers a specified amount of its currency to the New York Fed in exchange for U.S. dollars at the prevailing market exchange rate. At the same time, the New York Fed and the FCB agree that the transfer will unwind on a specified future date at the same exchange rate as the initial transaction. At the conclusion of the second transaction, the FCB compensates the New York Fed at a market-based interest rate. The foreign currency liquidity swap lines also provide the Federal Reserve with the capacity to offer liquidity in foreign currencies to U.S. financial institutions should the FOMC judge that such actions are appropriate.
13 The Federal Reserve established temporary swap lines with these nine central banks during the global financial crisis of 2008.
14 For more details on the FIMA Repo Facility including FAQs and related press releases, see https://www.federalreserve.gov/monetarypolicy/fima-repo-facility.htm.
15 In May 2020, the Desk began to include the newly issued nominal twenty-year U.S. Treasury bond in Treasury security operations in a manner similar to other nominal Treasury securities for SOMA operations. This included the Desk’s rollovers of maturing Treasury security holdings at auction, purchases of Treasury securities, securities lending programs, repurchase agreements, and reverse repurchase agreements.
16 Between August 1, 2019, and March 15, 2020, the Desk, as directed by the FOMC, reinvested principal payments from agency debt and agency MBS holdings into Treasury securities, subject to a maximum amount of $20 billion per month.
17 The Desk calculated the reinvestment amount by subtracting the $20 billion cap amount from the amount of principal payments on agency debt and agency MBS expected to be received during each calendar month. The monthly cap was related to the FOMC’s balance sheet normalization principles and plans, in which the Committee set monthly caps on redemptions to ensure a gradual and predictable runoff in SOMA securities holdings.
18 Although the principal received is based on agency MBS payments received during each calendar month, the reinvestment and redemption figures are based on reinvestment cycle periods, which occur on a mid-month to mid-month basis.
19 The TBA market is a forward market built on a trading convention that enables market participants to efficiently trade agency MBS backed by millions of individual mortgages. The market uses only a few standardized contracts, which are grouped by key characteristics such as the agency, term, coupon, and settlement date of the security that will be delivered. The standardized nature of TBA contracts helps make a large segment of the agency MBS market effectively homogeneous and thus highly liquid. Under a TBA contract, the buyer is notified by the seller of the specific securities that will be delivered (that is, the securities are “announced”) two days prior to settlement.
20 A dollar roll sale is a transaction that involves the sale of agency MBS for delivery in one month with the simultaneous agreement to purchase substantially similar securities in a later month. The FOMC directive in place in 2020 allows the Desk to conduct dollar rolls and coupon swaps to facilitate settlement, although the Desk has not conducted a coupon swap since 2010.
21 The New York Fed is authorized by the FOMC to intervene in the foreign exchange market by executing foreign exchange transactions for the SOMA as directed by the FOMC and, in its capacity as fiscal agency of the United States, for the Treasury’s Exchange Stabilization Fund. This report covers the SOMA’s foreign currency holdings.
22 Further details can be found in the New York Fed’s Treasury and Federal Reserve Foreign Exchange Operations quarterly reports. See https://www.newyorkfed.org/markets/quar_reports.html.
23 On November 19, 2020, the U.S. Treasury Secretary sent a letter to the Chair of the Federal Reserve requesting that the Federal Reserve approve an extension of the two facilities that used core Exchange Stabilization Fund funding (CPFF and MMLF) and the two facilities that did not require Treasury funding (PDCF and PPPLF) for an additional ninety days. The letter also stated that facilities that used CARES Act funding (PMCCF, SMCCF, MLF,

77
O P E N M A R K E T O P E R A T I O N S D U R I N G 2 0 2 0
Overview AppendixesOperational Flexibility & Resiliency
Selected Balance Sheet Developments
Counterparties Index of Charts & Tables
Contents Primary Credit Program &
Emergency Facilities
Open Market Operations
Financial Market Developments
& Policy Actions
Endnotes
MSLP, and TALF) would expire on December 31, 2020, meaning they no longer had authority to originate new loans or purchase new assets (either directly or indirectly). The facilities still existed in order to manage loans and assets acquired during their active phase. The letter can be found at https://home.treasury.gov/system/files/136/letter11192020.pdf.
24 For more details on this announcement, see https://www.federalreserve.gov/newsevents/pressreleases/monetary20201229a.htm.
25 See https://www.federalreserve.gov/newsevents/pressreleases/monetary20210308a.htm.
26 Test loans are actual loans requested by institutions to ensure readiness to borrow from the Federal Reserve should a true funding need arise. The number of test loans is estimated and includes any loan that the borrowing institution indicated was a test as well as any loan for an amount less than or equal to $10,000.
27 For more details on the PDCF including FAQs, term sheets, reports to Congress, and related press releases, see https://www.federalreserve.gov/monetarypolicy/pdcf.htm.
28 For more details on the CPFF including FAQs, term sheets, reports to Congress, and related press releases, see https://www.federalreserve.gov/monetarypolicy/cpff.htm.
29 Eligible issuers generally had to hold top-tier credit ratings, with an exception allowing limited program usage for issuers that were downgraded subsequent to the program’s announcement.
30 For more details on the MMLF including FAQs, term sheets, reports to Congress, and related press releases, see https://www.federalreserve.gov/monetarypolicy/mmlf.htm.
31 For more details on the TALF including FAQs, term sheets, reports to Congress, and related press releases, see https://www.federalreserve.gov/monetarypolicy/talf.htm.
32 For more details on the PMCCF including FAQs, term sheets, reports to Congress, and related press releases, see https://www.federalreserve.gov/monetarypolicy/pmccf.htm.
33 For more details on the SMCCF including FAQs, term sheets, reports to Congress, and related press releases, see https://www.federalreserve.gov/monetarypolicy/smccf.htm.
34 With respect to ETF purchases, ETF-specific measures such as premium or discount to net asset value (NAV) and creation/
redemption volumes were considered. For more details on SMCCF purchases, see the FAQs, https://www.newyorkfed.org/markets/primary-and-secondary-market-faq/corporate-credit-facility-faq.
35 For more details on the MLF including FAQs, term sheets, reports to Congress, and related press releases, see https://www.federalreserve.gov/monetarypolicy/muni.htm.
36 For more details on the PPPLF including FAQs, term sheets, reports to Congress, and related press releases, see https://www.federalreserve.gov/monetarypolicy/ppplf.htm.
37 PPPLF transaction-specific disclosures are available on the Federal Reserve Board website here, https://www.federalreserve.gov/monetarypolicy/ppplf.htm
38 For more details on the MSLP announcement, see https://www.federalreserve.gov/newsevents/pressreleases/monetary20200409a.htm
39 Since agency MBS purchases are conducted in the TBA market, a gap exists between the purchase date and the settlement date; there is a similar but shorter such gap between purchase and settlement dates for agency CMBS. Figures for domestic portfolio size include unsettled agency MBS and agency CMBS purchase amounts, unless otherwise stated. As of the end of 2020, net unsettled commitments to purchase agency MBS totaled $195 billion, while for agency CMBS this value was $0.
40 As of December 31, 2020, the U.S. Treasury had approximately $20.96 trillion in marketable debt held by the public (inclusive of SOMA holdings) outstanding. Further information can be found at https://www.treasurydirect.gov/govt/reports/pd/mspd/2020/opds122020.pdf.
41 As a result of the UMBS program, some securities held in the SOMA consisted of mortgages guaranteed by both Fannie Mae and Freddie Mac; however, for the purposes here, such mortgages are counted as being guaranteed by their most recent guarantor.
42 The weighted average life of an MBS refers to the expected time outstanding until the mortgage principal is repaid. This calculation is dependent on a model of future prepayments and is therefore subject to some uncertainty and model sensitivity.
43 The SOMA portfolio included three Fannie Mae DUS securities that entered COVID-19 forbearance subsequent to being purchased. Additionally, one Fannie Mae DUS security owned by the SOMA entered hurricane-related forbearance subsequent to being purchased. These securities account for less than 1 percent of the overall dollar value of the agency CMBS portfolio.

78
O P E N M A R K E T O P E R A T I O N S D U R I N G 2 0 2 0
Overview AppendixesOperational Flexibility & Resiliency
Selected Balance Sheet Developments
Counterparties Index of Charts & Tables
Contents Primary Credit Program &
Emergency Facilities
Open Market Operations
Financial Market Developments
& Policy Actions
Endnotes
44 “Modified duration” is used to calculate the duration of Treasury and agency debt securities, while “effective duration” is employed to measure the duration of MBS. Modified duration approximates the percentage change in the price of a fixed-income security given a 100 basis point parallel shift in the yield curve and is most applicable to securities with fixed cash flows, such as Treasury and agency debt securities. Effective duration, which accounts for the potential alterations in cash flows as interest rates change, is suitable for capturing the duration of MBS because it is affected by mortgage borrowers’ decisions to exercise or forgo their prepayment option. Duration measures of the portfolio throughout this report are calculated on a par-weighted average basis.
45 Due to the relatively small size of CMBS holdings, they are excluded from summary risk statistics.
46 Homeowners’ option to prepay their mortgage at any time without penalty adds uncertainty to the agency MBS holder’s expected cash flows. In general, lower mortgage rates encourage homeowners to refinance their loans, thereby shortening the duration of the MBS securitizing these loans, while higher mortgage rates discourage homeowners from refinancing, thereby lengthening the duration of MBS.
47 Reserve balances are composed of balances held by banks to fulfill any reserve requirements as well as reserves held in excess of these requirements to meet intraday payments, to manage liquidity risk and meet associated regulatory ratios, and to earn interest on their balances.
48 In this discussion, Federal Reserve notes outstanding are net of the holdings of Federal Reserve Banks. The Federal Reserve pays no interest on notes; however, Reserve Banks pay expenses incidental to the issuance and retirement of currency (such as costs related to manufacturing, shipping, educational services, and research and development). These expenses do not vary with the level of interest rates, unlike those associated with some other liabilities. Currency costs were $831 million in 2020.
49 For a detailed discussion of factors affecting the amount of currency outstanding, see Thomas Haasl, Sam Schulhofer-Wohl, and Anna Paulson, “Understanding the Demand for Currency at Home and Abroad,” Chicago Fed Letter 396, 2018, https://www.chicagofed.org/publications/chicago-fed-letter/2018/396.
50 Upon initiation of the transaction, each participant has an undivided interest, proportional to its investment, in a pool of securities from the SOMA that has been allocated toward this purpose.
51 For a detailed discussion of the evolution of Treasury cash management, see Paul J. Santoro, “The Evolution of Treasury Cash Management during the Financial Crisis,” Federal Reserve Bank of New York Current Issues in Economics and Finance 18, no. 3, 2012, https://www.newyorkfed.org/research/current_ issues/ci18-3.html.
52 For details, see U.S. Department of the Treasury, “Quarterly Refunding Statement of Acting Assistant Secretary for Financial Markets Seth B. Carpenter,” May 6, 2015, https://www.treasury.gov/press-center/press-releases/pages/jl10045.aspx.
53 A financial market utility may be designated as systemically important by the Financial Stability Oversight Council under Title VIII of the Dodd-Frank Wall Street Reform and Consumer Protection Act of 2010 (Dodd-Frank Act). Title VIII of the Dodd-Frank Act also allows these designated financial market utilities to establish and maintain Reserve Bank accounts.
54 For Open Market Operations during 2020, assumptions are drawn from the March 2021 Surveys of Primary Dealers and Market Participants.
55 This assumes that GDP and PCE prices evolve similarly, and that both PCE inflation and the growth rate of the GDP deflator imply an equivalent rate of growth of nominal GDP.
56 For details about the New York Fed policy on counterparties for market operations, see https://www.newyorkfed.org/markets/counterparties/policy-on-counterparties-for-market-operations.
57 Treasury promulgates rules and provides guidelines for Treasury auctions that are applicable to primary dealers and other bidders. Primary dealers are expected to bid their pro rata share of each auction, an amount that is determined as the total amount auctioned divided by the number of primary dealers at the time of the auction.

79
O P E N M A R K E T O P E R A T I O N S D U R I N G 2 0 2 0
Overview AppendixesOperational Flexibility & Resiliency
Selected Balance Sheet Developments
Counterparties Index of Charts & Tables
Contents Primary Credit Program &
Emergency Facilities
Open Market Operations
Financial Market Developments
& Policy Actions
Endnotes
Charts1. Federal Funds Target Range, Interest on Excess Reserves, and
Effective Federal Funds Rate .............................................6
2. Effective Federal Funds Rate and Secured Overnight Financing Rate Spreads to IOER ....................................................12
3. SOMA Reverse Repo Amounts Outstanding by Counterparty Type ........................................................13
4. SOMA Repo Amount by Tenor .........................................14
5. Bid-to-Cover Ratio by Repo Operation Tenor ........................14
6. U.S. Dollar Liquidity Swaps Outstanding by Tenor .................15
7. U.S. Dollar Liquidity Swaps Outstanding by Central Bank .......16
8. SOMA Treasury Transactions ...........................................18
9. Distribution of SOMA Outright Treasury Purchases across Sectors in 2020 ...........................................................18
10. Distribution of SOMA Reinvestments at Treasury Auctions in 2020 ..............................................19
11. SOMA Securities Lending in Treasuries ...............................20
12. SOMA Agency MBS Transactions ....................................21
13. SOMA Purchases of Thirty-Year Agency MBS by Coupon .......23
14. SOMA Purchases of Fifteen-Year Agency MBS by Coupon .....23
15. SOMA Dollar Roll Sales .................................................23
Box 1 Chart: Weekly Changes in Treasury Securities in Custody for Foreign Official Accounts .............................25
16. Usage of Primary Credit Program and Emergency Facilities ......28
17. Changes and Peak Levels in Selected Federal Reserve Assets and Liabilities ..............................................................34
18. Composition of SOMA Domestic Securities Holdings .............35
19. Distribution of SOMA Treasury Holdings .............................35
20. SOMA Treasury Holdings as a Share of Outstanding Treasury Supply ............................................................36
21. Distribution of SOMA Agency MBS Holdings .......................37
22. Average Duration of SOMA Domestic Securities Holdings .......38
23. SOMA Domestic Securities Holdings in Ten-Year Equivalents ......................................................38
24. Distribution of SOMA Foreign Currency Portfolio Holdings .........................................................39
25. Maturity Profile of Emergency Facility Assets .........................40
26. Federal Reserve Liabilities ..............................................41
27. Annual Source of Changes in Reserve Balances ....................42
28. Monthly Changes in Federal Reserve Notes ........................43
29. Foreign Repo Pool ........................................................44
30. Treasury General Account Balances ...................................44
31. SOMA Net Income and Federal Reserve Remittances to the U.S. Treasury ..............................................................46
32. SOMA Domestic Portfolio Unrealized Gains and Losses .........................................................46
33. Projected SOMA Domestic Securities Holdings ....................48
34. Projected SOMA Domestic Securities Holdings as a Share of GDP ..............................................................49
35. Projected Reserve Balances .............................................49
36. Projected SOMA Domestic Securities Holdings by Asset Class .................................................50
37. Projected SOMA Net Income ..........................................50
38. Projected SOMA Unrealized Gains and Losses as a Share of the SOMA Portfolio ...........................................51
Tables1. Key Policy Rates Effective in 2020 ......................................7
2. Distribution of Agency MBS Operations in 2020 ..................24
3. Distribution of Agency CMBS Operations in 2020 ................24
4. SOMA Net Income .......................................................45
Box 2: Expanded Counterparties and Agents by Program in 2020 .........................................................54
5. Small-Value Exercise Results in 2020: Domestic Operations .....58
6. Small-Value Exercise Results in 2020: Foreign Operations .......59
Appendix 1 Table: Operational Approaches .......................61
Appendix 3 Table: Operations Disclosures ..........................71
INDEX OF CHARTS AND TABLES

FEDERAL RESERVE BANK OF NEW YORK
33 LIBERTY STREET
NEW YORK, N.Y. 10045