open access research pregnancy diet and offspring...
TRANSCRIPT

1Viljoen K, et al. BMJ Open 2018;8:e017013. doi:10.1136/bmjopen-2017-017013
Open Access
Pregnancy diet and offspring asthma risk over a 10-year period: the Lifeways Cross Generation Cohort Study, Ireland
Karien Viljoen,1 Ricardo Segurado,1,2 John O'Brien,1 Celine Murrin,1 John Mehegan,1 Cecily C Kelleher,1 DMed on behalf of the Lifeways Cross Generation Cohort Study Steering Group
To cite: Viljoen K, Segurado R, O'Brien J, et al. Pregnancy diet and offspring asthma risk over a 10-year period: the Lifeways Cross Generation Cohort Study, Ireland. BMJ Open 2018;8:e017013. doi:10.1136/bmjopen-2017-017013
► Prepublication history and additional material for this paper are available online. To view these files, please visit the journal online (http:// dx. doi. org/ 10. 1136/ bmjopen- 2017- 017013).
Received 5 May 2017Revised 5 December 2017Accepted 9 January 2018
1School of Public Health, Physiotherapy and Sport Science, University College Dublin, Dublin, Ireland2Centre for Support and Training in Analysis and Research, University College Dublin, Dublin, Ireland
Correspondence toDr Karien Viljoen; karien. viljoen@ ucdconnect. ie
Research
AbstrACtObjective The association of maternal pregnancy diet with offspring asthma risk have been reported. However, literature on longitudinal patterns of asthma risk relative to intrauterine nutrient exposure is limited. We aimed to establish whether vegetable, oily fish and vitamin D intake during pregnancy are associated with childhood asthma risk over a 10-year period in the Irish Republic.Design Mother–child pairs (n=897) from the Lifeways prospective birth cohort, with data on nutrient intake during pregnancy and asthma status, respectively, were eligible for inclusion in the analysis. Data on socioeconomic and morbidity indicators over 10 years of follow-up on mothers and the index child were collected through self-administered questionnaires. Asthma status as diagnosed by the general practitioner at any time point over 10 years was related to maternal vegetable, oily fish and vitamin D intake during pregnancy, while adjusting for gestational age, socioeconomic status, smoking at delivery, breast feeding, season of birth and supplement use. Data were modelled with a marginal model on correlated observations over time within individuals.results In the fully adjusted model, asthma was inversely associated with higher daily average intake of oily fish (OR 0.23 per serving/day, 95% CI 0.04 to 1.41) and of vegetables (OR 0.96 per serving/day, 95% CI 0.88 to 1.05), but the confidence limits overlapped 1. A higher daily vitamin D intake was associated with reduced odds of asthma (OR 0.93 per μg/day, 95% CI 0.89 to 0.98).Conclusion This analysis suggests higher daily average intake of vitamin D in pregnancy is associated with asthma risk in offspring over the first 10 years of life.
IntrODuCtIOnAsthma is the most common chronic disease of childhood1 2; reports indicate a continuous and consistent increase in worldwide prev-alence, especially in westernised societies. Prevalence rates in the UK and Ireland are among the highest in Europe.3 4 According to the Centres for Disease Control and Prevention, between 2001 and 2010, asthma prevalence in children in the USA increased 1.4% each year.5 This increase is most likely multifactorial, with complex interactions of
genetic, immunological and environmental factors, leading to the phenotypic expression of disease.6 Recently, multiple studies have attempted to deconstruct this multifacto-rial relationship, focusing on the change in dietary habits over recent decades.7–13 The progressive trend in early presentation of allergic disease in childhood, with the impli-cation of possible exposure in utero, has placed an emphasis on maternal pregnancy diet as a prominent factor in the develop-ment of offspring asthma.14 15 As allergen-spe-cific immune responses are established in fetal life, maternal nutrient intake during pregnancy is pivotal; intake may potentially influence the development of both the innate
strengths and limitations of this study
► The prospective design of this study is with an a priori purpose of examining intergenerational transmission of risk.
► As there is a strong social gradient applied to diet in pregnancy, confounding by sociodemographic factors and lifestyle was a concern. We controlled for a comprehensive range of sociodemographic factors.
► The marginal model enabled us to take advantage of repeated measurements over time for participants.
► Limitations were differential follow-up, leading to varied numbers of missing data for certain variables, potentially introducing bias to follow-up data. Countering this, it is notable that the same associations were found separately at the three different time points.
► The authors recognise that asthma in childhood is a heterogeneous phenotype and that grouping of the three time points could potentially mask different phenotypes; however, our study was not powered to differentiate asthma on phenotype at various follow-up. In addition to this, data on familial atopy and fetal growth parameters were not available; General Practitioner's criteria to diagnose asthma could be diverse, with potential for variability.
on 23 August 2018 by guest. P
rotected by copyright.http://bm
jopen.bmj.com
/B
MJ O
pen: first published as 10.1136/bmjopen-2017-017013 on 20 F
ebruary 2018. Dow
nloaded from

2 Viljoen K, et al. BMJ Open 2018;8:e017013. doi:10.1136/bmjopen-2017-017013
Open Access
and acquired immune responses, predisposing to atopy in later life.16
A growing body of persuasive epidemiological evidence suggests that deficiency of maternal vitamin D intake prenatally has an inverse relationship with atopic disease in childhood.17–22 Observational studies on the asso-ciation of maternal serum and/or infant cord blood 25-hydroxy-vitamin D3 (25(OH)D3) levels with atopic markers are conflicting. Some demonstrated similar inverse associations23–30; others demonstrated direct31–33 and null34–42 associations. U-shaped associations were suggested by both Rothers et al43 and Maslova et al.44 Most recently, intervention studies exploring pregnancy vitamin D supplementation and asthma risk at 3 years of age also suggested an inverse association (statistically non-significant). The authors suggested that longer follow-up of children is needed to determine the clinical importance of findings.45 46
The Lifeways study has previously reported the asso-ciation between pregnancy intake of oily fish and vege-tables and general practitioner (GP) diagnosed asthma in offspring at age 3 years; a higher daily mean intake suggested a significant inverse effect.47 Literature on preg-nancy consumption of fish with subsequent atopic risk in offspring is mostly consistent with our findings, indicating an inverse effect.7 48–54 Our current aim was twofold: first is to build on the aforementioned Lifeways findings and test the hypothesis that a higher pregnancy intake of vegetables and oily fish might be inversely associated with asthma risk at any stage over 10 years follow-up; second, as suggested in the literature, to explore the association
of pregnancy vitamin D intake and offspring asthma risk within our cohort at any stage over 10 years of follow-up.
MethODsstudy design and sample selectionThe Lifeways study was established 2001–2003 as a prospective birth cohort in Ireland. The a priori purpose was to examine determinants of health status in children, including diet and lifestyle and to establish patterns and links across generations. Recruitment, data collection and study instruments have previously been discussed in detail.55 In brief, mothers were recruited at first antenatal visit (14–16 weeks gestation) in one of two regional mater-nity hospitals in the more rural West (Galway) and the more industrialised East (Dublin). Of 1124 mothers recruited, 1082 gave birth resulting in 1096 live mother–child pairs. Analysis was limited to current live mother–child pairs, where data on the proband’s asthma status were available for at least one time point. Babies with congenital anoma-lies and delivery <34 weeks gestational age56 were excluded from analysis. Due to attrition over time, participants had differential patterns of follow-up through phases; 614 mother–child pairs were included in the year 3 anal-yses, 511 in year-5 and 432 in year-10 follow-up. The sample for this analysis of 897 mother–child pairs comprised respondents for whom at least one follow-up point of asthma health status was recorded (figure 1). Ethical approval for all phases of the study was granted by the Human Research Ethics Committee, University College Dublin, Ireland. Written informed consent was obtained
Figure 1 Numbers through analysis. A total of 1096 mothers had a pregnancy which resulted in a live birth at cohort initiation. Mothers with a null FFQ and missing asthma data saw 897 mother–child pairs with asthma data at any time point of follow-up included in the final multivariable analysis. Attrition over time led to 614 mother–child pairs at year 3 follow-up, 511 at year 5 follow-up and 432 at year 10 follow-up.
on 23 August 2018 by guest. P
rotected by copyright.http://bm
jopen.bmj.com
/B
MJ O
pen: first published as 10.1136/bmjopen-2017-017013 on 20 F
ebruary 2018. Dow
nloaded from

3Viljoen K, et al. BMJ Open 2018;8:e017013. doi:10.1136/bmjopen-2017-017013
Open Access
from all adult participants at each follow-up phase of the study. Parental consent was obtained for child subjects at each follow-up phase; additional assent was obtained from all child subjects at the year-10 follow-up phase.
Assessment of pregnancy dietData on maternal nutrient intake during pregnancy were captured by a semiquantitative Food Frequency Question-naire (FFQ) as part of a self-administered questionnaire to the mother at her first antenatal visit. The FFQ was devel-oped from the international version used in the European Prospective Investigation in Cancer studies by the National Nutritional Surveillance Centre and extensively validated for use in an Irish population by the National Univer-sity of Ireland, Galway.57 The main food groups regularly consumed in the Irish diet were included and consisted of 149 food items.47 58 The questionnaire focused on maternal dietary intake since pregnancy. Intake as a medium serving (detailed in the FFQ for relevant food items) was recorded on a 9-grade scale, with categories subsequently trans-formed to continuous daily portion averages for all 149 food items. To arrive at distinct food groups, the continuous intake of various food items were summed and reported as total portions per day (see online supplementary table S1). The daily average intake of energy and nutrients, that is, ingested portions/day of food containing vitamin D, was calculated by linking frequency selections from the FFQ with food equivalents in McCance and Widdowson’s nutri-tional composition database, sixth edition,59 using software developed specifically for the Lifeways database.60 An esti-mation of the intake of Vitamin D in micrograms per day (μg/day) and energy in kilocalories (kCal/day) were made.
Assessment of outcomeData on doctor diagnosed asthma in offspring were collected at three time points up to year 10 of follow-up: ages 3, 5 and 9 years old. Various studies have used doctor diagnosed asthma/parental report of doctor diagnosed asthma to ascer-tain diagnosis.30 45 Questions to ascertain asthma diagnosis were adapted from the validated International Study on Asthma and Allergies in Childhood questionnaire.61 62 Diag-nosis from age 3 and 9 follow-ups were reported by the general practitioner (GP), information on GP diagnosed asthma at age 5 was obtained from the mother. For the univariate anal-ysis, asthma as a dichotomous outcome variable (‘yes’ vs ‘no’) at each of the three time points were analysed separately. For the multivariable analysis, the effect of dietary intakes during pregnancy on doctor diagnosed asthma in the child at the three time points over a period of 10 year follow-up was examined controlling for different prevalence at each age but assuming protective factors would have the same effect at each age.63
statistical analysisDefinite doctor diagnosed asthma in offspring at any time point over 10-year follow-up was related to maternal preg-nancy intake of oily fish, vegetables, expressed in servings per day and vitamin D expressed in microgram per day.
Univariate analysis and covariatesVariables that could potentially confound the diagnosis of asthma were identified from the literature and screened in our cohort for association with an asthma diagnosis at the specific time point using unadjusted binomial logistic regression or the independent samples t-test. Predictors with P<0.1 were identified as being potential confounders and selected for inclusion in the multivariable models and are discussed below.
Total energy intakeTo control for variance in accuracy of maternal energy reporting, total energy intake (kCal) was adjusted for in all models. Nutrients were adjusted for total energy intake using the residual method.64 65 To account for mothers who potentially over-reported or under-reported energy intake, the ratio of energy intake (EI) to basal metabolic rate in the first trimester of pregnancy (BMRpreg) was calculated to identify extreme outliers.63 66 67 BMRpreg was calculated using the prepregnancy BMI and Schofield equations.67 Mothers were asked to report their prepreg-nancy weight at consultation during the first antenatal visit.
Gestational ageGestational age in weeks.
Socioeconomic statusWe used eligibility for the general medical scheme (GMS) as an indicator of socioeconomic status. Ireland has a two-tiered healthcare system, where certain indi-viduals are eligible for different levels of free healthcare dependent on their income and certain medical condi-tions. GMS is thus a robust means tested indicator.68–70 As maternal and offspring GMS eligibility are strongly correlated, only the maternal predictor was used in the models.63 71
SmokingSmoking status at time of delivery; hospital delivery records.
Breast feedingData from the self-administered maternal questionnaire, ‘Was your Lifeways child ever breastfed?’
Season of birthSeasons were composed as follows: summer (May, June, July), autumn (August, September, October), winter (November, December, January), spring (February, March, April). This follows the grouping suggested by the Irish Randomised cOntrol trial of LOw (ROLO) glycaemic index diet study with data on maternal serum 25(OH)D levels.72 Summer and autumn were collapsed to form ‘summer’, with spring and winter collapsed to form ‘winter’, making up the final dichotomous variable, ‘summer’ vs ‘winter’.
on 23 August 2018 by guest. P
rotected by copyright.http://bm
jopen.bmj.com
/B
MJ O
pen: first published as 10.1136/bmjopen-2017-017013 on 20 F
ebruary 2018. Dow
nloaded from

4 Viljoen K, et al. BMJ Open 2018;8:e017013. doi:10.1136/bmjopen-2017-017013
Open Access
Supplement useData on supplement use were generic: ‘Have you taken any vitamins, minerals or food supplements?’ ‘Yes’ or ‘no’ and did not allow for specification on supplement type or content quantification.
Multivariable analysisThe associations with the three aforementioned dietary intakes were analysed in multivariable models to assess their independent association with asthma and verify the extent of confounding in a stepwise manner. Vege-tables, oily fish and vitamin D intakes were analysed as continuous predictor variables. Multivariable analysis was run using the full sample of 897 mother–child pairs in a marginal model (or Generalised Estimating Equation model) with repeated measures of asthma over time with an unstructured variance–covariance matrix to allow unequal variances and residual correlations. Covariates were entered into the model sequentially as fixed factors based on their univariate association with asthma, up to the cut-off of P=0.1. Time was consistently included as a fixed factor. Predictor variables were regarded as signifi-cant if the 95% CIs for the ORs did not include 1. SPSS V.20 was used to conduct univariate analysis; multivari-able analysis was run with SAS V.9.3.
Sensitivity analysisConsidering that non-response (attrition or sparse point-wise) bias may be introduced by residual socioeconomic or educational factors which correlate with diet and with asthma diagnosis, we applied a sensitivity analysis to explore how robust the observed associations were.73 We assume no or a smaller effect in the full sample and that non-response arises in a subgroup with elevated asthma prevalence and decreased quality of dietary intake and noted under which conditions false associations exist in the responders.
resultsstudy subjects’ characteristics and asthma prevalenceIn the final sample, 66.9% of the mother–child pairs were resident in the Dublin area and 33.1% in the Galway area, proportionate to recruitment patterns. Mothers with a third-level education were marginally higher (51.9%) than those with none/primary/secondary school educa-tion (48.1%); 19.4% of mothers were smokers at the time of giving birth. The mean (SD) age of mothers at time of giving birth was 30.2 (5.9) years and the mean (SD) prepregnancy body mass index of mothers were 23.7 (4.0). The offspring sex distribution was about equal; 48.8% were male and 51.2% were female. The mean (SD) birth weight was 3515.3 (568.6) g, with a mean (SD) gesta-tional age of 39.9 (1.9) weeks. Just under half (45.8%) of probands were the first-born and 86.20% were deliv-ered vaginally. Doctor diagnosed asthma in offspring at the three phases of follow-up, respectively, increased from 10.90% at 3 years to 14.33% at 5 years and 23.10%
at 10 years. In general, the literature suggests a down-ward trend in prevalence with increasing age. There are, however, cohorts that noted an increase of prevalence with age.74–76 Maternal socioeconomic and biological characteristics relative to food group intake are presented in table 1. Maternal and child characteristics as related to asthma diagnosis are further presented in supplemental material (online supplementary tables S2 and S3).
Univariate associations of background variables with childhood asthma from the cross-sectional data for the three follow-up phases, respectively, have previously been discussed in detail.47 62 63
Within-time representativeness of responders versus non-responders that contributed to the final sample is presented in table 2.
Pregnancy dietary intakeReported intake of vegetables and oily fish were directly and significantly associated with the maternal social gradient (table 1). Mean (SD) daily intake of oily fish and vegetables were 0.06 (0.12) and 2.93 (2.04) portions per day, respectively. The Food Safety Authority of Ireland (FSAI) recommends that pregnant women should have one portion of oily fish weekly (ie, 0.1 portions/day) and six to seven portions of vegetables daily.77 The mean intake of Lifeways mothers did not reach this recommen-dation. Data captured by the FFQ detailed intake as a medium portion (90–100 g of fish; a piece of fish about the size of a woman’s palm).
Vitamin D intake during pregnancy between those mothers with consistent follow-up and those with attri-tion did not differ significantly. A social gradient for pregnancy vitamin D intake in the final sample was not observed. The distribution of mean vitamin D intake was investigated according to the EI:BMRpreg ratio; no marked difference in the distribution of vitamin D was observed.63 Energy adjusted mean (SD) intake of vitamin D in mothers was 4.3 (4.1) μg/day. The FSAI recommends a daily allowance of 10 μg/day vitamin D for Irish pregnant women78 (see online supplementary tables S4 and S5). At baseline, 327 (36.9%) mothers from the final sample reported using supplements.
Pregnancy dietary associations with offspring asthmaVegetable intake was negatively associated with offspring asthma, although not significantly so in the fully adjusted model (OR 0.96 per serving/day, 95% CI 0.88 to 1.05) (model 8) (table 3).
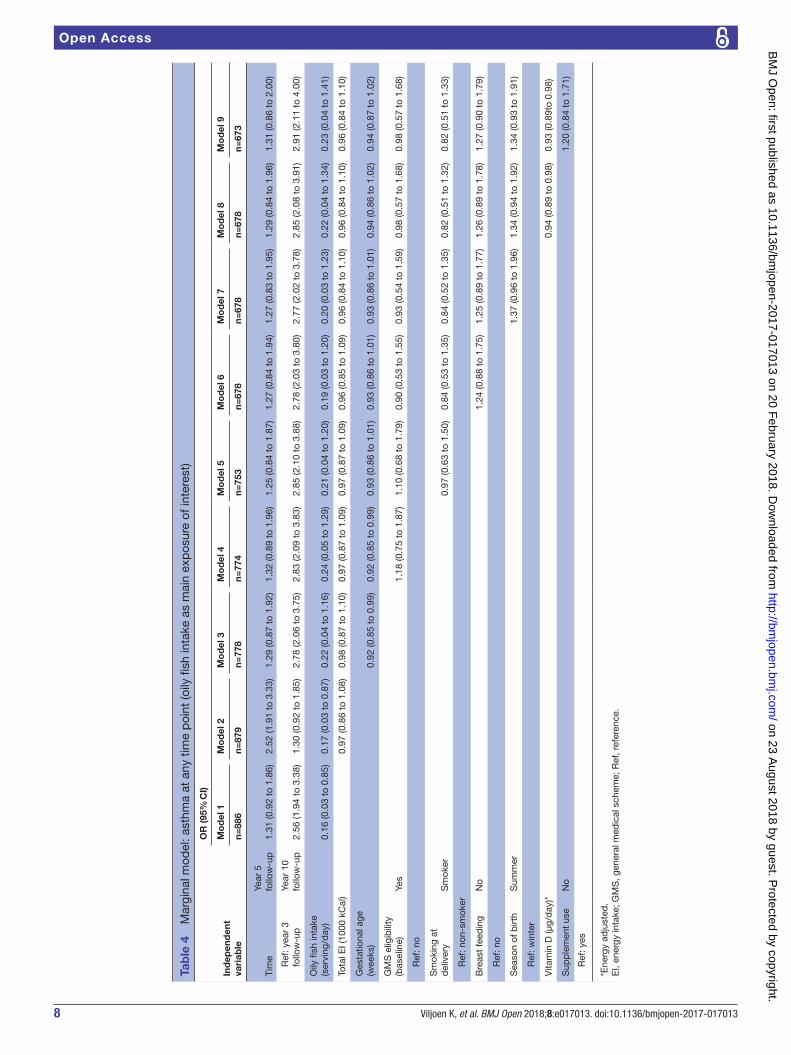
Oily fish intake was inversely associated with offspring asthma in the first two models, with an increase in daily average serving of oily fish demonstrating lower odds at any time point over the 10-year follow-up period (model 2 OR 0.17 per serving/day, 95% CI 0.03 to 0.87) (table 4). Change in the ORs across models suggested that gesta-tional age may have been a confounder (model 2 vs model 3), and all models up to the fully adjusted (OR 0.23 per serving/day, 95% CI 0.04 to 1.41) were not signif-icant, despite a substantial magnitude of the OR.
on 23 August 2018 by guest. P
rotected by copyright.http://bm
jopen.bmj.com
/B
MJ O
pen: first published as 10.1136/bmjopen-2017-017013 on 20 F
ebruary 2018. Dow
nloaded from

5Viljoen K, et al. BMJ Open 2018;8:e017013. doi:10.1136/bmjopen-2017-017013
Open Access
All models suggested vitamin D had a significant inverse association, including the fully adjusted analysis (model 9 OR 0.93 μg/day, 95% CI 0.89 to 0.98) with offspring asthma at any time-point of follow-up (table 5). Adjust-ment for breast feeding in particular increased the OR for vitamin D (model 5 vs model 6) in part due to the loss of 85 women with no data on breastfeeding habits.
Results of a sensitivity analysis on the Vitamin D asso-ciation indicated that if the true association was null, a false association of this magnitude could be generated by high missing data in a subgroup with higher asthma prevalence (by approximately 5%) and lower vitamin D intake (by 10% at the median), but only if the non-re-sponders had an association in the opposite direction (high vitamin D associated with increased asthma risk). An inflation of a true but small effect could also occur in scenarios where non-responders have lower vitamin D intake, similar or lower asthma rates and a weaker associ-ation between intake and asthma than responders. The hypothetical scenarios consistent with our expectations of missing data patterns suggest our observed OR of 0.93 may be attenuated relative to the true effect.
DIsCussIOnBirth cohort studies with follow-up of 6 years or more on the association of maternal pregnancy diet and childhood asthma are limited.79 This analysis suggests that higher vitamin D intake during pregnancy is associated with reduced likelihood of asthma in offspring at any point during 10 years follow-up. An interesting inverse association with oily fish consumption was also demonstrated initially but with significance lost early in model progression. Vege-table intake, however, showed a very small inverse associa-tion not statistically distinguishable from zero at a 5% level. Literature on the association with vegetable intake is scarce and inconsistent, with both an increased risk80 and no effect reported.81 Literature on the association of oily fish intake in pregnancy with offspring atopic disease is consistent with findings from the current analysis.49 51 80 81 Analyses from all of these studies were limited to children in the age range 2–6 years; to our knowledge there are no studies with find-ings extending up to 10 years of age follow-up. A systematic review82 concluded that there is little evidence to recom-mend supplementation/modification of diet to include fish oil for children or adults with established asthma. They
Table 1 Maternal food group intake during pregnancy in relation to socioeconomic factors (n=897)
Food group
n*
Oily fish
P value n*
Vegetables
P value
(Portion/day) (Portion/day)
Mean (SD) Mean (SD)
Education <0.001† <0.001†
None/primary/secondary school 416 0.05 (0.10) 420 2.61 (1.88)
Third-level education 451 0.07 (0.13) 451 3.26 (2.16)
Marital status (baseline) 0.01† <0.001†
Lone 179 0.04 (0.09) 180 2.51 (2.06)
Cohabiting 701 0.06 (0.12) 703 3.05 (2.03)
GMS eligibility (baseline) <0.001† <0.001†
No 750 0.06 (0.12) 754 3.02 (2.06)
Yes 131 0.03 (0.07) 131 2.43 (1.91)
Smoking status at delivery 0.07† <0.001†
Non-smoker 693 0.06 (0.12) 695 3.04 (2.10)
Smoker 167 0.04 (0.11) 169 2.39 (1.61)
Region 0.04† <0.001†
Galway 292 0.07 (0.13) 294 3.21 (2.17)
Dublin 594 0.05 (0.10) 596 2.79 (1.96)
Age group at delivery (years) <0.001‡ <0.001‡
Under 18 16 0.02 (0.04) 16 2.52 (1.51)
18 to 29 373 0.03 (0.07) 377 2.56 (1.92)
30+ 491 0.08 (0.14) 492 3.22 (2.09)
*Numbers do not always add up to 897 because of varied numbers of missing data for some variables. †Independent samples t-test. ‡Analysis of variance. GMS, general medical scheme.
on 23 August 2018 by guest. P
rotected by copyright.http://bm
jopen.bmj.com
/B
MJ O
pen: first published as 10.1136/bmjopen-2017-017013 on 20 F
ebruary 2018. Dow
nloaded from

6 Viljoen K, et al. BMJ Open 2018;8:e017013. doi:10.1136/bmjopen-2017-017013
Open Access
Table 2 Within-time representativeness of final sample (n=897)
Characteristics Responders‡ (n=614) Non-responders‡ (n=283)
Year 3 follow-up
Maternal educational attainment†
None/primary/secondary school, n (%) 290 (48.6) 130 (47.1)
Some/completed third-level education, n (%) 307 (51.4) 146 (52.9)
Maternal GMS eligibility at baseline†
Not eligible, n (%) 512 (84.3) 244 (87.1)
Eligible, n(%) 95 (15.7) 36 (12.9)
Region†
West, n. (%) 217 (35.3) 80 (28.3)
East, n (%) 397 (64.7) 203 (71.7)
Maternal age at birth of proband, mean (SD), year† 30.35 (5.9) 29.75 (5.9)
Maternal oily fish intake in pregnancy, mean (SD), servings/day† 0.06 (0.1) 0.05 (0.1)
Maternal vegetable intake in pregnancy, mean (SD), servings/day† 2.95 (1.9) 2.88 (2.2)
Maternal vitamin D intake in pregnancy, mean (SD), µg/day† 4.70 (4.8) 5.60 (10.2)
Year-5 follow-up n=511 n=386
Maternal educational attainment†
None/primary/secondary school, n (%) 241 (48.7) 179 (47.4)
Some/completed third-level education, n (%) 254 (51.3) 199 (52.6)
Maternal GMS eligibility at baseline†
Not eligible, n (%) 429 (85.0) 327 (85.6)
Eligible, n (%) 76 (15.0) 55 (14.4)
Region†
West, n (%) 165 (32.3) 132 (34.2)
East, n (%) 346 (67.7) 254 (65.8)
Maternal age at birth of proband, mean (SD), year† 30.10 (5.8) 30.24 (5.9)
Maternal oily fish intake in pregnancy, mean (SD), serving/day† 0.06 (0.1) 0.06 (0.1)
Maternal vegetable intake in pregnancy, mean (SD), serving/day† 2.93 (2.1) 2.94 (1.9)
Maternal vitamin D intake in pregnancy, mean (SD), µg/day† 4.70 (6.1) 5.30 (7.9)
Year 10 follow-up n=432 n=465
Maternal educational attainment*
None/Primary/Secondary school, n (%) 174 (40.7) 246 (55.2)
Some/Completed third-level education, n (%) 253 (59.3) 200 (44.8)
Maternal GMS eligibility at baseline*
Not eligible, n (%) 385 (89.7) 371 (81.0)
Eligible, n (%) 44 (10.3) 87 (19.0)
Region*
West, n (%) 166 (38.4) 131 (28.2)
East, n (%) 266 (61.6) 334 (71.8)
Maternal age at birth of proband, mean (SD), year* 31.55 (5.2) 28.86 (6.1)
Maternal oily fish intake in pregnancy, mean (SD), servings/day† 0.06 (0.1) 0.06 (0.1)
Maternal vegetable intake in pregnancy, mean (SD), servings/day† 3.11 (2.1) 2.76 (2.0)
Maternal vitamin D intake in pregnancy, mean (SD), µg/day† 5.00 (7.5) 4.90 (6.4)
*P<0.001.†Non-significant.‡Numbers do not always add up to total as varied numbers at missing data at certain variables.GMS, general medical scheme.
on 23 August 2018 by guest. P
rotected by copyright.http://bm
jopen.bmj.com
/B
MJ O
pen: first published as 10.1136/bmjopen-2017-017013 on 20 F
ebruary 2018. Dow
nloaded from

7Viljoen K, et al. BMJ Open 2018;8:e017013. doi:10.1136/bmjopen-2017-017013
Open Access
Tab
le 3
M
argi
nal m
odel
: ast
hma
at a
ny t
ime
poi
nt (v
eget
able
inta
ke a
s m
ain
exp
osur
e of
inte
rest
)
Ind
epen
den
t va
riab
le
OR
(95%
CI)
Mo
del
1M
od
el 2
Mo
del
3M
od
el 4
Mo
del
5M
od
el 6
Mo
del
7M
od
el 8
n=89
0n=
883
n=78
1n=
777
n=75
6n=
682
n=68
2n=
677
Tim
eYe
ar 5
fo
llow
-up
1.31
(0.9
2 to
1.8
6)1.
30 (0
.92
to 1
.84)
1.28
(0.8
7 t
o 1.
90)
1.31
(0.8
8 to
1.9
4)1.
25 (0
.84
to 1
.86)
1.27
(0.8
3 to
1.9
2)1.
27 (0
.83
to 1
.93)
1.29
(0.8
4 to
1.9
6)
R
ef: y
ear
3 fo
llow
-up
Year
10
follo
w-u
p2.
59 (1
.97
to 3
.41)
2.56
(1.9
4 to
3.3
7)2.
81 (2
.09
to 3
.78)
2.86
(2.1
1 to
3.8
6)2.
88 (2
.13
to 3
.90)
2.81
(2.0
7 to
3.8
3)2.
80 (2
.06
to 3
.82)
2.84
(2.0
8 to
3.8
8)
Vege
tab
le in
take
(ser
ving
/d
ay)
0.94
(0.8
7 to
1.0
1)0.
94 (0
.87
to
1.01
)0.
94 (0
.86
to 1
.03)
0.95
(0.8
8 to
1.0
3)0.
96 (0
.88
to 1
.04)
0.96
(0.8
8 to
1.0
5)0.
96 (0
.88
to 1
.05)
0.96
(0.8
8 to
1.0
5)
Tota
l EI (
1000
kC
al)
0.96
(0.8
5 t
o 1.
08)
0.97
(0.8
6 to
1.0
9)0.
97 (0
.86
to 1
.09)
0.97
(0.8
6 to
1.0
9)0.
96 (0
.84
to 1
.09)
0.95
(0.8
3 to
1.0
9)0.
95 (0
.83
to 1
.09)
Ges
tatio
nal a
ge (w
eeks
)0.
92 (0
.85
to 0
.99)
0.92
(0.8
5 to
0.9
9)0.
93 (0
.86
to 1
.01)
0.93
(0.8
6 to
1.0
1)0.
93 (0
.85
to 1
.01)
0.93
(0.8
6 to
1.0
1)
GM
S e
ligib
ility
(bas
elin
e)Ye
s1.
20 (0
.76
to 1
.91)
1.13
(0.6
9 to
1.8
4)0.
93 (0
.54
to 1
.59)
0.94
(0.5
5 to
1.3
4)0.
95 (0
.55
to 1
.63)
R
ef: n
o
Sm
okin
g at
del
iver
yS
mok
er0.
96 (0
.62
to 1
.49)
0.84
(0.5
2 to
1.3
4)0.
83 (0
.52
to 1
.34)
0.83
(0.5
2 to
1.3
4)
R
ef: n
on-s
mok
er
Bre
ast
feed
ing
No
1.27
(0.9
0 to
1.7
9)1.
28 (0
.91
to 1
.81)
1.28
(0.9
1 to
1.8
1)
R
ef: y
es
Sea
son
of b
irth
Sum
mer
1.36
(0.9
5 to
1.9
4)1.
35 (0
.95
to 1
.94)
R
ef: w
inte
r
Sup
ple
men
t us
eN
o1.
17 (0
.82
to 1
.66)
R
ef: y
es
EI,
ener
gy in
take
; GM
S, g
ener
al m
edic
al s
chem
e; R
ef, r
efer
ence
.
on 23 August 2018 by guest. P
rotected by copyright.http://bm
jopen.bmj.com
/B
MJ O
pen: first published as 10.1136/bmjopen-2017-017013 on 20 F
ebruary 2018. Dow
nloaded from
8 Viljoen K, et al. BMJ Open 2018;8:e017013. doi:10.1136/bmjopen-2017-017013
Open Access
Tab
le 4
M
argi
nal m
odel
: ast
hma
at a
ny t
ime
poi
nt (o
ily fi
sh in
take
as
mai
n ex
pos
ure
of in
tere
st)
Ind
epen
den
t va
riab
le
OR
(95%
CI)
Mo
del
1M
od
el 2
Mo
del
3M
od
el 4
Mo
del
5M
od
el 6
Mo
del
7M
od
el 8
Mo
del
9
n=88
6n=
879
n=77
8n=
774
n=75
3n=
678
n=67
8n=
678
n=67
3
Tim
eYe
ar 5
fo
llow
-up
1.31
(0.9
2 to
1.8
6)2.
52 (1
.91
to 3
.33)
1.29
(0.8
7 to
1.9
2)1.
32 (0
.89
to 1
.96)
1.25
(0.8
4 to
1.8
7)1.
27 (0
.84
to 1
.94)
1.27
(0.8
3 to
1.9
5)1.
29 (0
.84
to 1
.96)
1.31
(0.8
6 to
2.0
0)
R
ef: y
ear
3 fo
llow
-up
Year
10
follo
w-u
p2.
56 (1
.94
to 3
.38)
1.30
(0.9
2 to
1.8
5)2.
78 (2
.06
to 3
.75)
2.83
(2.0
9 to
3.8
3)2.
85 (2
.10
to 3
.88)
2.78
(2.0
3 to
3.8
0)2.
77 (2
.02
to 3
.78)
2.85
(2.0
8 to
3.9
1)2.
91 (2
.11
to 4
.00)
Oily
fish
inta
ke
(ser
ving
/day
)0.
16 (0
.03
to 0
.85)
0.17
(0.0
3 to
0.8
7)0.
22 (0
.04
to 1
.16)
0.24
(0.0
5 to
1.2
9)0.
21 (0
.04
to 1
.20)
0.19
(0.0
3 to
1.2
0)0.
20 (0
.03
to 1
.23)
0.22
(0.0
4 to
1.3
4)0.
23 (0
.04
to 1
.41)
Tota
l EI (
1000
kC
al)
0.97
(0.8
6 to
1.0
8)0.
98 (0
.87
to 1
.10)
0.97
(0.8
7 to
1.0
9)0.
97 (0
.87
to 1
.09)
0.96
(0.8
5 to
1.0
9)0.
96 (0
.84
to 1
.10)
0.96
(0.8
4 to
1.1
0)0.
96 (0
.84
to 1
.10)
Ges
tatio
nal a
ge
(wee
ks)
0.92
(0.8
5 to
0.9
9)0.
92 (0
.85
to 0
.99)
0.93
(0.8
6 to
1.0
1)0.
93 (0
.86
to 1
.01)
0.93
(0.8
6 to
1.0
1)0.
94 (0
.86
to 1
.02)
0.94
(0.8
7 to
1.0
2)
GM
S e
ligib
ility
(b
asel
ine)
Yes
1.18
(0.7
5 to
1.8
7)1.
10 (0
.68
to 1
.79)
0.90
(0.5
3 to
1.5
5)0.
93 (0
.54
to 1
.59)
0.98
(0.5
7 to
1.6
8)0.
98 (0
.57
to 1
.68)
R
ef: n
o
Sm
okin
g at
d
eliv
ery
Sm
oker
0.97
(0.6
3 to
1.5
0)0.
84 (0
.53
to 1
.35)
0.84
(0.5
2 to
1.3
5)0.
82 (0
.51
to 1
.32)
0.82
(0.5
1 to
1.3
3)
R
ef: n
on-s
mok
er
Bre
ast
feed
ing
No
1.24
(0.8
8 to
1.7
5)1.
25 (0
.89
to 1
.77)
1.26
(0.8
9 to
1.7
8)1.
27 (0
.90
to 1
.79)
R
ef: n
o
Sea
son
of b
irth
Sum
mer
1.37
(0.9
6 to
1.9
6)1.
34 (0
.94
to 1
.92)
1.34
(0.9
3 to
1.9
1)
R
ef: w
inte
r
Vita
min
D (μ
g/d
ay)*
0.94
(0.8
9 to
0.9
8)0.
93 (0
.89t
o 0.
98)
Sup
ple
men
t us
eN
o1.
20 (0
.84
to 1
.71)
R
ef: y
es
*Ene
rgy
adju
sted
.E
I, en
ergy
inta
ke; G
MS
, gen
eral
med
ical
sch
eme;
Ref
, ref
eren
ce.
on 23 August 2018 by guest. P
rotected by copyright.http://bm
jopen.bmj.com
/B
MJ O
pen: first published as 10.1136/bmjopen-2017-017013 on 20 F
ebruary 2018. Dow
nloaded from

9Viljoen K, et al. BMJ Open 2018;8:e017013. doi:10.1136/bmjopen-2017-017013
Open Access
Tab
le 5
M
argi
nal m
odel
: ast
hma
at a
ny t
ime
poi
nt (v
itam
in D
inta
ke a
s m
ain
exp
osur
e of
inte
rest
)
Ind
epen
den
t va
riab
le
OR
(95%
CI)
Mo
del
1M
od
el 2
Mo
del
3M
od
el 4
Mo
del
5M
od
el 6
Mo
del
7M
od
el 8
Mo
del
9
n=89
0n=
890
n=78
7n=
779
n=75
8n=
683
n=68
3n=
678
n=67
3
Tim
eYe
ar fi
ve
follo
w-u
p1.
33 (0
.94
to 1
.89)
1.33
(0.9
3 to
1.8
9)1.
29 (0
.87
to 1
.92)
1.32
(0.8
9 to
1.9
7)1.
26 (0
.84
to 1
.89)
1.28
(0.8
4 to
1.9
5)1.
28 (0
.84
to 1
.95)
1.29
(0.8
4 to
1.9
6)1.
31 (0
.86
to 2
.00)
R
ef: Y
ear-
3 fo
llow
-up
Year
10
follo
w-u
p2.
57 (1
.96
to 3
.38)
2.57
(1.9
5 to
3.3
8)2.
84 (2
.11
to 3
.82)
2.89
(2.1
4 to
3.9
0)2.
92 (2
.16
to 3
.95)
2.89
(2.1
2 to
3.9
5)2.
88 (2
.11
to 3
.92)
2.85
(2.0
8 to
3.9
1)2.
91 (2
.11
to 4
.00)
Vita
min
D (μ
g/d
ay)*
0.96
(0.9
3 to
0.9
9)0.
96 (0
.93
to 0
.99)
0.96
(0.9
2 to
0.9
9)0.
96 (0
.92
to 0
.99)
0.96
(0.9
2 to
0.9
9)0.
93 (0
.89
to 0
.98)
0.93
(0.8
9 to
0.9
8)0.
94 (0
.89
to 0
.98)
0.93
(0.8
9 to
0.9
8)
Tota
l EI (
1000
kC
al)
0.95
(0.8
4 to
1.0
8)0.
97 (0
.86
to 1
.10)
0.97
(0.8
6 to
1.0
9)0.
97 (0
.86
to 1
.10)
0.96
(0.8
4 to
1.1
0)0.
95 (0
.83
to 1
.10)
0.96
(0.8
4 to
1.1
0)0.
96 (0
.84
to 1
.10)
Ges
tatio
nal a
ge
(wee
ks)
0.92
(0.8
5 to
0.9
9)0.
92 (0
.85
to 0
.99)
0.93
(0.8
6 to
1.0
1)0.
93 (0
.86
to 1
.01)
0.93
(0.8
6 to
1.0
1)0.
94 (0
.86
to 1
.02)
0.94
(0.8
7 to
1.0
2)
GM
S e
ligib
ility
(b
asel
ine)
Yes
1.29
(0.8
1 to
2.0
4)1.
22 (0
.75
to 1
.98)
1.00
(0.5
9 to
1.7
1)1.
02 (0
.60
to 1
.75)
0.98
(0.5
7 to
1.6
8)0.
98 (0
.57
to 1
.68)
R
ef: n
o
Sm
okin
g at
d
eliv
ery
Sm
oker
0.98
(0.6
4 to
1.5
2)0.
83 (0
.52
to 1
.33)
0.83
(0.5
2 to
1.3
3)0.
82 (0
.51
to 1
.34)
0.82
(0.5
1 to
1.3
3)
R
ef: n
on-
smok
er
Bre
ast
feed
ing
No
1.32
(0.9
4 to
1.8
5)1.
33 (0
.95
to 1
.87)
1.26
(0.8
9 to
1.7
8)1.
27 (0
.90
to 1
.79)
R
ef: y
es
Sea
son
of b
irth
Sum
mer
1.34
(0.9
4 to
1.9
1)1.
34 (0
.94
to 1
.92)
1.34
(0.9
3 to
1.9
1)
R
ef: w
inte
r
Oily
fish
inta
ke (s
ervi
ng/d
ay)
0.22
(0.0
4 to
1.3
4)0.
23 (0
.04
to 1
.41)
Sup
ple
men
t us
eN
o1.
20 (0
.84
to 1
.71)
R
ef: y
es
*Ene
rgy
adju
sted
.E
I, en
ergy
inta
ke; G
MS
, gen
eral
med
ical
sch
eme.
on 23 August 2018 by guest. P
rotected by copyright.http://bm
jopen.bmj.com
/B
MJ O
pen: first published as 10.1136/bmjopen-2017-017013 on 20 F
ebruary 2018. Dow
nloaded from

10 Viljoen K, et al. BMJ Open 2018;8:e017013. doi:10.1136/bmjopen-2017-017013
Open Access
found no evidence of improvement or increased risk relative to fish oil and established asthma. This is likely evident that the window period for fish oil to have an effect on immune regulation is most relevant in fetal life, with limited poten-tial for effect once immune responses are established.81 The proinflammatory mediators leukotriene B4 (LTB4) and tumour necrosis factor alpha increase airway inflam-mation and hyper-responsiveness.83 84 A protective effect of oily fish could possibly be mediated via eicosapentaenoic acid and docosahexaenoic acid. Competitive binding with cyclooxygenase and lipoxygenase reduce LTB4 and prosta-glandin E2 production.49 85–87
Our findings suggest a significant inverse association of pregnancy vitamin D consumption with childhood asthma, which in sensitivity analyses appears robust to bias arising from a reasonable range of missing data patterns. Results are consistent with the main body of literature on the asso-ciation of pregnancy vitamin D intake and offspring atopic disease.17–22 Miyake et al21 reported that increased vitamin D consumption in pregnancy was associated with less wheeze and eczema in offspring aged 16–24 months. A follow-up paper from the same cohort reported higher intake of maternal vitamin D with an increased risk of eczema in offspring, now 23–29 months old.88 More recently, a signif-icant increase in the risk of asthma in 20–25 years old offspring of mothers who had high concentrations of serum 25(OH)D antenatally was reported.89 We speculate that the long-term effect of prenatal vitamin D exposure differs from the initial, mostly protective, effect. Findings from vitamin D status studies are less consistent and at times not in agree-ment with intake studies. Lack of concordance in findings may be an indication that intake data are a surrogate for the intake of other important nutrients.15 The possible mecha-nism of action in the relationship of vitamin D and asthma could relate to T helper 2 cell (Th2) differentiation. Litera-ture is conflicting; one immunological study reported that vitamin D supplementation (in vitro) promoted Th2 cell differentiation.90 It has been proposed that the increased vitamin D supplementation in European and high lati-tude countries to prevent rickets led to the current high prevalence of asthma.9 91 Contrary to this, the proposal is that vitamin D inhibits Th2 differentiation, thus having a protective effect.92 Vitamin D intervention studies are under way; results from a randomised controlled trial in the UK failed to find any association between prenatal vitamin D supplementation and wheezing in offspring 3 years of age.93 Litonjua et al45 found a lower incidence (non-significant) of recurrent wheeze and asthma in 3-year-old offspring of mothers who received higher vitamin D supplementation in pregnancy. An Aberdeen cohort demonstrated an in vivo anti-inflammatory effect of maternal serum 25(OH)D3 on interleukin 10 secretion from the airway epithelial cells of cultured neonatal nasal samples.94 Dick et al95 suggested that a specific exposure might act in a different manner in different population groups and demographic areas, as the genetic and epigenetic factors are likely to be differential. Inconsistencies in findings from the association between pregnancy nutrition and offspring asthma may furthermore
relate to interactions between specific nutrients or addi-tional interactions with the human microbiome and envi-ronment.96 Strengths of this study and analysis were the prospective design with an a priori purpose of examining intergenerational transmission of risk. As there is a strong social gradient applied to diet in pregnancy,97 confounding by sociodemographic factors and lifestyle was a concern; we controlled for a comprehensive range of sociodemographic factors. The marginal model enabled us to control for repeated measurements over time for participants. Limita-tions were differential follow-up, leading to varied numbers of missing data for certain variables, potentially introducing bias to follow-up data. Although a sensitivity analysis was encouraging, it remains possible that unknown, unobserved factors driving non-response have generated bias in an unex-pected direction, and there is a dearth of literature to guide exploration of such effects. The fact that the associations found in this analysis were between maternal food intake and doctor diagnosed asthma raised the possibility of ascer-tainment bias; more health conscious mothers were more likely to follow good pregnancy diets and were more likely to take their ill children to the doctor to receive a formal diagnosis. However, we propose that an ascertainment bias would be more likely to demonstrate the opposite finding, that is, that an increase in healthy eating was adversely asso-ciated with doctor-diagnosed asthma.
Countering this, it is notable that the same associations were found separately at the three different time points.47 63 A more comprehensive adjustment (for maternal age, educa-tion and region of residence) also did not substantially alter the conclusions and estimates and we feel we have adjusted as thoroughly as possible for potential socioeconomic factors and their influence on bias.
The authors recognise that asthma in childhood is a heterogeneous phenotype and that grouping of the three time points could potentially mask different pheno-types98 99; however, our study was not powered to differen-tiate asthma on phenotype at various follow-up. Data on familial atopy or asthma were not available; it is possible that the suggested relationships between maternal diet and offspring asthma have been confounded by the pres-ence or absence of familial predisposition. Data on fetal growth parameters were not available; the effect of fetal growth on childhood asthma could not be controlled for.100 The calculation of vitamin D (μg/day) and energy (kCal/day) intake was a surrogated calculation obtained from an estimated daily intake (portion/day) of food groups/nutrients.59 As no data on serum 25(OH)D3were collected, it was not possible to correlate vitamin D intake with that of serum levels.
COnClusIOnThis analysis suggests that higher intakes of oily fish and vitamin D in the maternal pregnancy diet are inversely associated with childhood asthma. This is consistent with the developmental origins of health and disease hypoth-esis, suggesting that certain exposures of the fetus in
on 23 August 2018 by guest. P
rotected by copyright.http://bm
jopen.bmj.com
/B
MJ O
pen: first published as 10.1136/bmjopen-2017-017013 on 20 F
ebruary 2018. Dow
nloaded from

11Viljoen K, et al. BMJ Open 2018;8:e017013. doi:10.1136/bmjopen-2017-017013
Open Access
utero can affect the development of allergic diseases in childhood by modulating immune response.101 As there is no anticipated cure for asthma in the near future, adjustment of the environment as early as possible, for example, in utero and in infancy, might provide the best way to achieve a reduction in the asthma burden.95 102
Acknowledgements The participation of families in the various sweeps of the study is highly appreciated. We are grateful to the reviewers of the manuscript for their assistance in refining the analysis and reporting, in particular Professor Charles E McCulloch (UCSF).
Collaborators Lifeways Cross Generation Cohort Study Steering Committee: Professor Gerard Bury, Professor Leslie Daly,Professor Sean Daly, Dr Orla Doyle, Dr Una B Fallon, Dr Frances B Hannon, Dr Howard Johnson, Dr Lucy J Jessop, Professor CCK, Professor Gerard Loftus, Professor John J Morrison, Professor Andrew W Murphy, Dr Celine Murrin,Professor Helen Roche, Dr Mary Rose Sweeney, Professor Richard Tremblay.
Contributors The Principal Investigator of the Lifeways Study, CCK, conceptualised the design of the study and supervised the overall project, including data analysis and interpretation. KV drafted the manuscript and undertook data collection, analyses and interpretation as part of her PhD. CM assisted with data collection, analyses and interpretation. RS provided statistical input relating to analyses and interpretation of data. JO’B and JM assisted with data management and data interpretation. All contributors reviewed and revised the manuscript and approved the final version as submitted.
Funding All stages of this study were funded by the Health Research Board of Ireland.
Competing interests None declared.
Patient consent Obtained.
ethics approval Human Research Ethics Committee, University College Dublin, Ireland.
Provenance and peer review Not commissioned; externally peer reviewed.
Data sharing statement Additional unpublished data from the Lifeways study relating to cardiovascular risk/mortality and healthcare utilisation are available. Data can be accessed by collaborators or peers via written request to the principal investigator, CCK, ( cecily. kelleher@ ucd. ie) and the study data manager, JM ( john. mehegan@ ucd. ie).
Open Access This is an Open Access article distributed in accordance with the Creative Commons Attribution Non Commercial (CC BY-NC 4.0) license, which permits others to distribute, remix, adapt, build upon this work non-commercially, and license their derivative works on different terms, provided the original work is properly cited and the use is non-commercial. See: http:// creativecommons. org/ licenses/ by- nc/ 4. 0/
© Article author(s) (or their employer(s) unless otherwise stated in the text of the article) 2018. All rights reserved. No commercial use is permitted unless otherwise expressly granted.
reFerenCes 1. Proimos J, Klein JD. Noncommunicable diseases in children and
adolescents. Pediatrics 2012;130:379–81. 2. Torpy JM. Chronic diseases of children. JAMA 2010;303:682. 3. Kabir Z, Manning PJ, Holohan J, et al. Prevalence of symptoms
of severe asthma and allergies in Irish school children: an ISAAC protocol study, 1995-2007. Int J Environ Res Public Health 2011;8:3192–201.
4. Shamssain M. Trends in the prevalence and severity of asthma, rhinitis and atopic eczema in 6- to 7- and 13- to 14-yr-old children from the north-east of England. Pediatr Allergy Immunol 2007;18:149–53.
5. Moorman J, Akinbami L, Bailey C. National Surveillance of Asthma: United States, 2001-2010. Vital and Health Stat 2012;35.
6. Russell G. The childhood asthma epidemic. Thorax 2006;61:276–7. 7. Lumia M, Luukkainen P, Tapanainen H, et al. Dietary fatty acid
composition during pregnancy and the risk of asthma in the offspring. Pediatr Allergy Immunol 2011;22:827–35.
8. Shaheen SO, Northstone K, Newson RB, et al. Dietary patterns in pregnancy and respiratory and atopic outcomes in childhood. Thorax 2009;64:411–7.
9. Allan K, Devereux G. Diet and asthma: nutrition implications from prevention to treatment. J Am Diet Assoc 2011;111:258–68.
10. Nagel G, Weinmayr G, Kleiner A, et al. Effect of diet on asthma and allergic sensitisation in the International Study on Allergies and Asthma in Childhood (ISAAC) Phase Two. Thorax 2010;65:516–22.
11. Fogarty A, Britton J. The role of diet in the aetiology of asthma. Clin Exp Allergy 2000;30:615–27.
12. Nurmatov U, Devereux G, Sheikh A. Nutrients and foods for the primary prevention of asthma and allergy: systematic review and meta-analysis. J Allergy Clin Immunol 2011;127:724–33.
13. Shaheen SO. Prenatal nutrition and asthma: hope or hype? Thorax 2008;63:483–5.
14. Prescott S, Allen KJ. Food allergy: riding the second wave of the allergy epidemic. Pediatr Allergy Immunol 2011;22:155–60.
15. Miles EA, Calder PC. Maternal diet and its influence on the development of allergic disease. Clin Exp Allergy 2015;45:63–74.
16. Prescott SL, Macaubas C, Holt BJ, et al. Transplacental priming of the human immune system to environmental allergens: universal skewing of initial T cell responses toward the Th2 cytokine profile. J Immunol 1998;160:4730–7.
17. Devereux G, Litonjua AA, Turner SW, et al. Maternal vitamin D intake during pregnancy and early childhood wheezing. Am J Clin Nutr 2007;85:853–9.
18. Camargo CA, Rifas-Shiman SL, Litonjua AA, et al. Maternal intake of vitamin D during pregnancy and risk of recurrent wheeze in children at 3 y of age. Am J Clin Nutr 2007;85:788–95.
19. Erkkola M, Kaila M, Nwaru BI, et al. Maternal vitamin D intake during pregnancy is inversely associated with asthma and allergic rhinitis in 5-year-old children. Clin Exp Allergy 2009;39:875–82.
20. Nwaru BI, Ahonen S, Kaila M, et al. Maternal diet during pregnancy and allergic sensitization in the offspring by 5 yrs of age: a prospective cohort study. Pediatr Allergy Immunol 2010;21:29–37.
21. Miyake Y, Sasaki S, Tanaka K, et al. Dairy food, calcium and vitamin D intake in pregnancy, and wheeze and eczema in infants. Eur Respir J 2010;35:1228–34.
22. Anderson LN, Chen Y, Omand JA, et al. Vitamin D exposure during pregnancy, but not early childhood, is associated with risk of childhood wheezing. J Dev Orig Health Dis 2015;6:308–16.
23. Camargo CA, Ingham T, Wickens K, et al. Cord-blood 25-hydroxyvitamin D levels and risk of respiratory infection, wheezing, and asthma. Pediatrics 2011;127:e180–7.
24. Mullins RJ, Clark S, Wiley V, et al. Neonatal vitamin D status and childhood peanut allergy: a pilot study. Ann Allergy Asthma Immunol 2012;109:324–8.
25. Jones AP, Palmer D, Zhang G, et al. Cord blood 25-hydroxyvitamin D3 and allergic disease during infancy. Pediatrics 2012;130:e1128–35.
26. Baïz N, Dargent-Molina P, Wark JD, et al. Cord serum 25-hydroxyvitamin D and risk of early childhood transient wheezing and atopic dermatitis. J Allergy Clin Immunol 2014;133:147–53.
27. Maslova E, Hansen S, Jensen CB, et al. Vitamin D intake in mid-pregnancy and child allergic disease: a prospective study in 44,825 Danish mother–child pairs. BMC Pregnancy Childbirth 2013;13:199–212.
28. Chiu CY, Huang SY, Peng YC, et al. Maternal vitamin D levels are inversely related to allergic sensitization and atopic diseases in early childhood. Pediatr Allergy Immunol 2015;26:337–43.
29. Vijayendra Chary A, Hemalatha R, Seshacharyulu M, et al. Reprint of "Vitamin D deficiency in pregnant women impairs regulatory T cell function". J Steroid Biochem Mol Biol 2015;148:194–201.
30. Gazibara T, den Dekker HT, de Jongste JC, et al. Associations of maternal and fetal 25-hydroxyvitamin D levels with childhood lung function and asthma: the Generation R Study. Clin Exp Allergy 2016;46:337–46.
31. Gale CR, Robinson SM, Harvey NC, et al. Maternal vitamin D status during pregnancy and child outcomes. Eur J Clin Nutr 2008;62:68–77.
32. Weisse K, Winkler S, Hirche F, et al. Maternal and newborn vitamin D status and its impact on food allergy development in the German LINA cohort study. Allergy 2013;68:220–8.
33. Chi A, Wildfire J, McLoughlin R, et al. Umbilical cord plasma 25-hydroxyvitamin D concentration and immune function at birth: the Urban Environment and Childhood Asthma study. Clin Exp Allergy 2011;41:842–50.
34. Cremers E, Thijs C, Penders J, et al. Maternal and child's vitamin D supplement use and vitamin D level in relation to childhood lung function: the KOALA Birth Cohort Study. Thorax 2011;66:474–80.
on 23 August 2018 by guest. P
rotected by copyright.http://bm
jopen.bmj.com
/B
MJ O
pen: first published as 10.1136/bmjopen-2017-017013 on 20 F
ebruary 2018. Dow
nloaded from

12 Viljoen K, et al. BMJ Open 2018;8:e017013. doi:10.1136/bmjopen-2017-017013
Open Access
35. Morales E, Romieu I, Guerra S, et al. Maternal vitamin D status in pregnancy and risk of lower respiratory tract infections, wheezing, and asthma in offspring. Epidemiology 2012;23:64–71.
36. Pike KC, Inskip HM, Robinson S, et al. Maternal late-pregnancy serum 25-hydroxyvitamin D in relation to childhood wheeze and atopic outcomes. Thorax 2012;67:950–6.
37. Wills AK, Shaheen SO, Granell R, et al. Maternal 25-hydroxyvitamin D and its association with childhood atopic outcomes and lung function. Clin Exp Allergy 2013;43:1180–8.
38. Magnus MC, Stene LC, Håberg SE, et al. Prospective study of maternal mid-pregnancy 25-hydroxyvitamin D level and early childhood respiratory disorders. Paediatr Perinat Epidemiol 2013;27:532–41.
39. Chawes BL, Bønnelykke K, Jensen PF, et al. Cord blood 25(OH)-vitamin D deficiency and childhood asthma, allergy and eczema: the COPSAC2000 birth cohort study. PLoS One 2014;9:e99856.
40. Liu X, Wang G, Hong X, et al. Gene-vitamin D interactions on food sensitization: a prospective birth cohort study. Allergy 2011;66:1442–8.
41. Wegienka G, Zoratti E, Johnson CC. The role of the early-life environment in the development of allergic disease. Immunol Allergy Clin North Am 2015;35:1–17.
42. Bunyavanich S, Rifas-Shiman SL, Platts-Mills TA, et al. Prenatal, perinatal, and childhood vitamin D exposure and their association with childhood allergic rhinitis and allergic sensitization. J Allergy Clin Immunol 2016;137:1063–70.
43. Rothers J, Wright AL, Stern DA, et al. Cord blood 25-hydroxyvitamin D levels are associated with aeroallergen sensitization in children from Tucson, Arizona. J Allergy Clin Immunol 2011;128:1093–9.
44. Maslova E, Hansen S, Thorne-Lyman AL, et al. Predicted vitamin D status in mid-pregnancy and child allergic disease. Pediatr Allergy Immunol 2014;25:706–13.
45. Litonjua AA, Carey VJ, Laranjo N, et al. Effect of prenatal supplementation with vitamin D on asthma or recurrent wheezing in offspring by age 3 years: the VDAART Randomized Clinical Trial. JAMA 2016;315:362–70.
46. Chawes BL, Bønnelykke K, Stokholm J, et al. Effect of Vitamin D3 supplementation during pregnancy on risk of persistent wheeze in the offspring: a randomized clinical trial. JAMA 2016;315:353–61.
47. Fitzsimon N, Fallon U, O'Mahony D, et al. Mothers' dietary patterns during pregnancy and risk of asthma symptoms in children at 3 years. Ir Med J 2007;100:27–32.
48. Olsen SF, Østerdal ML, Salvig JD, et al. Fish oil intake compared with olive oil intake in late pregnancy and asthma in the offspring: 16 y of registry-based follow-up from a randomized controlled trial. Am J Clin Nutr 2008;88:167–75.
49. Salam MT, Li YF, Langholz B, et al. Maternal fish consumption during pregnancy and risk of early childhood asthma. J Asthma 2005;42:513–8.
50. Nwaru BI, Erkkola M, Lumia M, et al. Maternal intake of fatty acids during pregnancy and allergies in the offspring. Br J Nutr 2012;108:720–32.
51. Romieu I, Torrent M, Garcia-Esteban R, et al. Maternal fish intake during pregnancy and atopy and asthma in infancy. Clin Exp Allergy 2007;37:518–25.
52. Willers SM, Devereux G, Craig LC, et al. Maternal food consumption during pregnancy and asthma, respiratory and atopic symptoms in 5-year-old children. Thorax 2007;62:773–9.
53. Prescott SL, Barden AE, Mori TA, et al. Maternal fish oil supplementation in pregnancy modifies neonatal leukotriene production by cord-blood-derived neutrophils. Clin Sci 2007;113:409–16.
54. Furuhjelm C, Warstedt K, Larsson J, et al. Fish oil supplementation in pregnancy and lactation may decrease the risk of infant allergy. Acta Paediatr 2009;98:1461–7.
55. O'Mahony D, Fallon UB, Hannon F, et al. The Lifeways Cross-Generation Study: design, recruitment and data management considerations. Ir Med J 2007;100:3–6.
56. Jaakkola JJ, Ahmed P, Ieromnimon A, et al. Preterm delivery and asthma: a systematic review and meta-analysis. J Allergy Clin Immunol 2006;118:823–30.
57. Harrington J. Validation of a food frequency questionnaire as a tool for assessing nutrient intake. Galway, Ireland: National University of Ireland, Galway, 1997.
58. Murrin C, Fallon UB, Hannon F, et al. Lifeways Cross Generation Cohort Study Steering Group. Dietary habits of pregnant women in Ireland. Ir Med J 2007;100:12–15.
59. Food Standards Agency. McCance and Widdowson's The Composition of Foods. Cambridge, United Kingdom: Royal Society of Chemistry, Her Majesty’s Stationary Office, 2002.
60. Murrin C. Maternal factors during pregnancy contributing to early life risk of childhood obesity. Dublin, Ireland: University College Dublin, 2010.
61. Asher MI, Keil U, Anderson HR, et al. International Study of Asthma and Allergies in Childhood (ISAAC): rationale and methods. Eur Respir J 1995;8:483–91.
62. Fitzsimon N, Fallon U, O'Mahony D, et al. Predictors of asthma in children in Ireland: a multivariate analysis of deprivation and social support. J Epidemiol Community Health 2006;60:A12–13.
63. Viljoen K. Longitudinal follow-up of morbidity, healthcare utilisation and mortality patterns in the Lifeways Cross-Generation Cohort Study. Dublin, Ireland: University College Dublin, 2014.
64. Willett WC, Howe GR, Kushi LH. Adjustment for total energy intake in epidemiologic studies. Am J Clin Nutr 1997;65(4 Suppl):1220S–8.
65. Willett W, Stampfer MJ. Total energy intake: implications for epidemiologic analyses. Am J Epidemiol 1986;124:17–27.
66. Prentice AM, Spaaij CJ, Goldberg GR, et al. Energy requirements of pregnant and lactating women. Eur J Clin Nutr 1996;50(suppl 1):S10S82.
67. Department of Health. Dietary reference values for energy and nutrients for the United Kingdom. London, UK: London Stationary Office, 1999.
68. Kelleher CC, Friel S, Nic Gabhainn S, et al. Socio-demographic predictors of self-rated health in the Republic of Ireland: findings from the National Survey on Lifestyle, Attitudes and Nutrition, SLAN. Soc Sci Med 2003;57:477–86.
69. Niedhammer I, Murrin C, O'Mahony D, et al. P1-454 Explanations for social inequalities in preterm delivery in the lifeways cohort. J Epidemiol Community Health 2011;65(Suppl 1):A193.
70. Kelleher CC, Tay J, Gabhainn SN. Influence on self-rated health of socio-demographic, lifestyle and affluence factors: an analysis of the Irish and International Health Behaviours Among School-Aged Children (HBSC) datasets 1998. Ir Med J 2007;100:47–52.
71. Fallon UB, Murphy AW, Majawit E, et al. Primary care utilisation rates in pre-school children. Ir Med J 2007;100:23–7.
72. Horan MK, McGowan CA, Gibney ER, et al. The association between maternal dietary micronutrient intake and neonatal anthropometry: secondary analysis from the ROLO study. Nutr J 2015;14:1.
73. Greenland S. Basic methods for sensitivity analysis of biases. Int J Epidemiol 1996;25:1107–16.
74. Mölter A, Agius R, de Vocht F, et al. Effects of long-term exposure to PM10 and NO2 on asthma and wheeze in a prospective birth cohort. J Epidemiol Community Health 2014;68:21–8.
75. Mölter A, Simpson A, Berdel D, et al. A multicentre study of air pollution exposure and childhood asthma prevalence: the ESCAPE project. Eur Respir J 2015;45:610–24.
76. Tariq SM, Matthews SM, Hakim EA, et al. The prevalence of and risk factors for atopy in early childhood: a whole population birth cohort study. J Allergy Clin Immunol 1998;101:587–93.
77. Food Safety Authority of Ireland. Scientific recommendations for healthy eating guidelines in Ireland. Dublin, Ireland: Food Safety Authority of Ireland, 2011.
78. Food Safety Authority of Ireland. Recommended Dietary Allowances for Ireland 1999. Dublin, Ireland: Food Safety Authority of Ireland, 1999.
79. Allan KM, Prabhu N, Craig LC, et al. Maternal vitamin D and E intakes during pregnancy are associated with asthma in children. Eur Respir J 2015;45:1027–36.
80. Sausenthaler S, Koletzko S, Schaaf B, et al. Maternal diet during pregnancy in relation to eczema and allergic sensitization in the offspring at 2 y of age. Am J Clin Nutr 2007;85:530–7.
81. Willers SM, Wijga AH, Brunekreef B, et al. Maternal food consumption during pregnancy and the longitudinal development of childhood asthma. Am J Respir Crit Care Med 2008;178:124–31.
82. Woods RK, Thien FC, Abramson MJ, et al. Dietary marine fatty acids (fish oil) for asthma in adults and children. Cochrane Database Syst Rev 2002;2:CD0011283.
83. Thomas PS, Yates DH, Barnes PJ. Tumor necrosis factor-alpha increases airway responsiveness and sputum neutrophilia in normal human subjects. Am J Respir Crit Care Med 1995;152:76–80.
84. Christie PE, Barnes NC. Leukotriene B4 and asthma. Thorax 1996;51:1171–3.
85. Kremer JM, Jubiz W, Michalek A, et al. Fish-oil fatty acid supplementation in active rheumatoid arthritis. A double-blinded, controlled, crossover study. Ann Intern Med 1987;106:497–502.
86. Lee TH, Hoover RL, Williams JD, et al. Effect of dietary enrichment with eicosapentaenoic and docosahexaenoic acids on in vitro neutrophil and monocyte leukotriene generation and neutrophil function. N Engl J Med 1985;312:1217–24.
on 23 August 2018 by guest. P
rotected by copyright.http://bm
jopen.bmj.com
/B
MJ O
pen: first published as 10.1136/bmjopen-2017-017013 on 20 F
ebruary 2018. Dow
nloaded from

13Viljoen K, et al. BMJ Open 2018;8:e017013. doi:10.1136/bmjopen-2017-017013
Open Access
87. Calder PC. N-3 polyunsaturated fatty acids and immune cell function. Adv Enzyme Regul 1997;37:197–237.
88. Miyake Y, Tanaka K, Okubo H, et al. Maternal consumption of dairy products, calcium, and vitamin D during pregnancy and infantile allergic disorders. Ann Allergy Asthma Immunol 2014;113:82–7.
89. Hansen S, Maslova E, Strøm M, et al. The long-term programming effect of maternal 25-hydroxyvitamin D in pregnancy on allergic airway disease and lung function in offspring after 20 to 25 years of follow-up. J Allergy Clin Immunol 2015;136:169–76.
90. Lemire JM, Archer DC, Beck L, et al. Immunosuppressive actions of 1,25-dihydroxyvitamin D3: preferential inhibition of Th1 functions. J Nutr 1995;125:1704S–8.
91. Wjst M, Dold S. Genes, factor X, and allergens: what causes allergic diseases? Allergy 1999;54:757–9.
92. Litonjua AA, Weiss ST. Is vitamin D deficiency to blame for the asthma epidemic? J Allergy Clin Immunol 2007;120:1031–5.
93. Goldring ST, Griffiths CJ, Martineau AR, et al. Prenatal vitamin d supplementation and child respiratory health: a randomised controlled trial. PLoS One 2013;8:e66627.
94. Miller DR, Turner SW, Spiteri-Cornish D, et al. Maternal vitamin D and E intakes during early pregnancy are associated with airway epithelial cell responses in neonates. Clin Exp Allergy 2015;45:920–7.
95. Dick S, Friend A, Dynes K, et al. A systematic review of associations between environmental exposures and development of asthma in children aged up to 9 years. BMJ Open 2014;4:e006554.
96. Yang HJ, Lee SY, Suh DI, et al. The Cohort for Childhood Origin of Asthma and allergic diseases (COCOA) study: design, rationale and methods. BMC Pulm Med 2014;14:109–20.
97. Northstone K, Emmett P, Rogers I. Dietary patterns in pregnancy and associations with socio-demographic and lifestyle factors. Eur J Clin Nutr 2008;62:471–9.
98. Stein RT, Martinez FD. Asthma phenotypes in childhood: lessons from an epidemiological approach. Paediatr Respir Rev 2004;5:155–61.
99. Bacharier LB, Guilbert TW. Diagnosis and management of early asthma in preschool-aged children. J Allergy Clin Immunol 2012;130:287–96.
100. Turner SW, Campbell D, Smith N, et al. Associations between fetal size, maternal {alpha}-tocopherol and childhood asthma. Thorax 2010;65:391–7.
101. Warner JA, Jones CA, Jones AC, et al. Prenatal origins of allergic disease. J Allergy Clin Immunol 2000;105(2 Pt 2):S493–6.
102. Devereux G. The increase in the prevalence of asthma and allergy: food for thought. Nat Rev Immunol 2006;6:869–74.
on 23 August 2018 by guest. P
rotected by copyright.http://bm
jopen.bmj.com
/B
MJ O
pen: first published as 10.1136/bmjopen-2017-017013 on 20 F
ebruary 2018. Dow
nloaded from