open access research how smoking affects the...
TRANSCRIPT
How smoking affects the proportion ofdeaths attributable to obesity: assessingthe role of relative risks and weightdistributions
Andrew Stokes,1 Samuel H Preston2
To cite: Stokes A,Preston SH. How smokingaffects the proportion ofdeaths attributable to obesity:assessing the role of relativerisks and weightdistributions. BMJ Open2016;6:e009232.doi:10.1136/bmjopen-2015-009232
▸ Prepublication historyand additional material isavailable. To view please visitthe journal (http://dx.doi.org/10.1136/bmjopen-2015-009232).
Received 29 June 2015Revised 10 December 2015Accepted 16 December 2015
1Department of Global Healthand Center for Global Healthand Development,Boston University School ofPublic Health, Boston,Massachusetts, USA2Department of Sociologyand Population StudiesCenter, University ofPennsylvania, Philadelphia,Pennsylvania, USA
Correspondence toDr Andrew Stokes;[email protected]
ABSTRACTObjective: Although ever-smokers make up themajority of the older adult population in the USA, theyare often excluded from studies examining the impactof obesity on mortality. Understanding how smokingand obesity interact is critical to assessing theproportion of deaths attributable to obesity.Setting: Nationally representative sample of the non-institutionalised population of the USA. Baseline datawere drawn from the National Health and NutritionExamination Survey, 1988–1994 and 1999–2004.Participants: US adults aged 50–74 (n=9835).Primary outcome measure: We used Cox modelsto estimate the mortality risks of obesity by smokingstatus. All-cause mortality was assessed prospectivelythrough 31 December 2006 (n=1243 deaths).Maximum body mass index (BMI) was specified as thekey exposure variable. We also calculated populationattributable fractions (PAFs) by smoking status andinvestigated differences in PAFs in a decompositionanalysis.Results: The HR associated with a one-unit incrementin BMI beyond 25.0 kg/m2 was 1.057 for never-smokers (95% CI 1.033 to 1.082; p<0.001), 1.036 forformer smokers (95% CI 1.015 to 1.059; p<0.01) and1.024 for current smokers (95% CI 0.997 to 1.052).We estimated that 19.8% of deaths were attributable
to excess weight. The PAFs were 31.9, 20.4 and 11.3for never-smokers, former and current smokers,respectively. The difference in PAFs between never-smokers and current smokers was almost entirelyexplained by the difference in HRs.Conclusions: The proportion of deaths attributable toobesity is nearly 3 times as high among never-smokers compared with current smokers. This findingis consistent with the fact that smokers are subject tosignificant competing risks. Analyses that excludesmokers are likely to substantially overestimate theproportion of deaths attributable to obesity in the USA.
INTRODUCTIONSmoking and obesity are leading causes ofpremature mortality in the USA.1 How these
risk factors interact has not been thoroughlyinvestigated. In this paper, we focus on theimpact of smoking on the proportion ofdeaths attributable to obesity in the contem-porary USA.The mortality risks of obesity are often esti-
mated after eliminating ever-smokers andpeople with chronic conditions from thesample and assuming that the estimated risksfor never-smokers and healthy people applyto the entire population.2–4 These restric-tions generally strengthen associationsbetween obesity and mortality, in some casesgreatly. However, the restrictions can excludeup to 80% of deaths, leading some research-ers to question the external validity of theresults.5
Proponents of strict exclusion criteriaargue that such measures are necessary forobtaining valid estimates of the mortalityrisks of obesity.6 Smoking is thought to be so
Strengths and limitations of this study
▪ Using high-quality nationally representative data,this study considers in greater detail than previ-ous studies how two leading causes of prema-ture mortality in the USA interact.
▪ We use a novel indicator of obesity, an indivi-dual’s maximum body mass index, which per-tains to the life cycle rather than simply tobaseline circumstances.
▪ Compared with body mass index measured atthe time of survey, maximum body mass indexis less affected by reverse causality—a majorsource of bias in observational studies of theassociation between obesity and mortality.
▪ In contrast to many studies, we do not excludemajor subgroups from the attributable risk calcu-lation, so that it pertains to the population as awhole, including sick people and smokers.
▪ A limitation of the study is that maximum bodymass index is self-reported and may be subjectto measurement error.
Stokes A, Preston SH. BMJ Open 2016;6:e009232. doi:10.1136/bmjopen-2015-009232 1
Open Access Research
on 12 July 2018 by guest. Protected by copyright.
http://bmjopen.bm
j.com/
BM
J Open: first published as 10.1136/bm
jopen-2015-009232 on 25 February 2016. D
ownloaded from

strongly related to obesity and mortality that it is difficultto avoid residual confounding even when using typicaladjustments for smoking status and intensity. However,by removing smokers, a major source of risk that com-petes with obesity is removed, leading to the falseimpression that obesity is associated with a larger relativeburden than it is.7 8
Smokers may have a lower proportion of deaths attrib-utable to obesity than non-smokers for two reasons.First, smoking changes the body mass index (BMI) distri-bution of the population. Many smokers lose weight, orfail to gain weight, because of smoking. A review of epi-demiological and biomedical studies of the effect ofsmoking on weight suggests that US smokers weigh, onaverage, 4–5 kg less than non-smokers.9 When smokersquit, they gain, on average, 4.5 kg within 6–12 monthsafter quitting, and their weight returns to the sameweight trajectory over age as that observed in non-smokers. Smoking increases 24 h energy expenditure byabout 10%. Nicotine’s effects on the brain also leads tosuppression of appetite, and smoking per se can serve asa behavioural alternative to eating.A second reason why smokers may have a lower frac-
tion of deaths attributable to obesity than non-smokersis that the relative risks of death associated with obesitymay be lower among smokers. When one major expos-ure is added to the environment in which anotherexposure is operative, a high fraction of deaths may becaused by the additional exposure, reducing the fractionof deaths that remain to be ‘caused’ by the originalexposure.Whether the mortality risks associated with obesity are
different for smokers and non-smokers has been investi-gated in four large American cohort studies rangingfrom 78 000 to 1.2 million participants. All found thatthe risk of death associated with obesity was greateramong non-smokers or never-smokers than amongcurrent smokers or ever-smokers.10–13 The ProspectiveStudies Collaboration pooled data on the mortality risksof obesity from 57 studies including 895 000 partici-pants.14 This study concluded that the excess risks forBMI and smoking were ‘roughly additive’ rather thanmultiplicative. They demonstrate that the death rate,when graphed as a function of linear BMI, was displacedupwards by a nearly constant amount for smokers rela-tive to non-smokers above the minimum-risk BMI inter-val of 22.5–25 kg/m2. Such a displacement implies alower relative risk of death associated with obesityfor smokers than for non-smokers (see onlinesupplementary appendix 1, which develops an additivemodel of relations between two exposures).This paper builds on this literature by providing esti-
mates of the proportion of deaths attributable toobesity for the entire population of the USA and forpopulation subgroups distinguished by smoking status.We use a summary measure of weight history, themaximum weight an individual has achieved, in con-structing our exposure variable.15 16 Relative to baseline
BMI, maximum weight may better capture potentialcumulative effects of past obesity status and has theadvantage of being less affected by reverse causality, thedownward bias in the estimated mortality effects ofobesity that results from weight loss among those whoare seriously ill.
METHODSThe data for this analysis were drawn from the NationalHealth and Nutrition Examination Survey (NHANES).We combined the NHANES III (1988–1994)17 and con-tinuous NHANES cohorts (1999–2004)18 and linkedthese to mortality status in the National Death Indexthrough 2006.19 NHANES is a nationally representativesurvey of the non-institutionalised population of theUSA that combines interviews and clinical measurement.A unique feature of NHANES is that it asks questionsabout weight histories, including an individual’smaximum weight (exclusive of weight during preg-nancy). This information, along with height measured atthe time of survey, was used to construct the key expos-ure variable in our analysis, maximum BMI. This vari-able was chosen to represent the effects of BMI as acumulative process20 21 and to minimise the effect ofreverse causation, which biases downwards the estimatedrelative risk of death from obesity.15 22 This effect isexpected to be especially powerful among smokersbecause of the high incidence of illness and death inthat group.Cox models were used to investigate the mortality risks
of obesity among individuals aged 50–74. We began witha relatively older age in order that individuals have accu-mulated substantial weight trajectories that can be suit-ably summarised by maximum BMI. Observations afterindividuals reach age 75 were censored. The parametersof hazards models were estimated separately for thethree smoking groups. We distinguished those whonever smoked (defined as having smoked fewer than100 cigarettes in one’s lifetime), those who currentlysmoke, and those who formerly smoked but who havequit.The key independent variable in the analysis,
maximum BMI, was specified as units of BMI above 25.Using this variable linearly in a hazard model impliesthat risks increase exponentially above a BMI of 25 (ie,they increase linearly in the log of the hazard). Strongempirical support for such a shape emerged from theProspective Studies Collaboration.14 Those in the BMIrange of 18.5–24.9 were assigned a value of 0 on thismeasure and those with BMIs below 18.5 were droppedfrom the analysis (nine observations). In a preliminaryanalysis, we tested quadratic models to investigate non-linearities in the relation between BMI and the log ofmortality. Coefficients on the quadratic terms were insig-nificant and thus dropped in subsequent modelling.The Cox models were adjusted for sex, age, race/eth-
nicity (Hispanics, black non-Hispanic and other), and
2 Stokes A, Preston SH. BMJ Open 2016;6:e009232. doi:10.1136/bmjopen-2015-009232
Open Access
on 12 July 2018 by guest. Protected by copyright.
http://bmjopen.bm
j.com/
BM
J Open: first published as 10.1136/bm
jopen-2015-009232 on 25 February 2016. D
ownloaded from
educational attainment (less than high school graduate,high school graduate and more than high school). Forcurrent and former smokers, we additionally adjustedfor smoking intensity using the following categories: <1,1–2, 2 or more packs/day. Smoking intensity for formersmokers was determined based on a question that askedabout the number of cigarettes smoked per day at thetime of quitting.The proportion of deaths attributable to obesity
(population attributable fraction (PAF)) was calculatedas the weighted average of PAFs in different strata, withthe appropriate weights being the number of deaths inthe various strata.23 The formula used to assess the PAFwithin each smoking category is the following:
PAF =XKi¼0
pdiHRi � 1HRi
� �ð1Þ
where pdi refers to the proportion of decedents in BMIcategory i and HRi refers to the HR with respect to mor-tality for an individual in category i. Individuals inthe normal weight category were assigned a HR of 1.0.
The HRs used in this analysis are derived from multivari-ate Cox models. To apply equation (1), we use three-unitwide BMI intervals beyond 25 and employ the HR pre-dicted for the mid-point of each interval. The BMI distri-bution for the different smoking groups can be found inonline supplementary appendix 2. While we describethe results of applying equation (1) as providing esti-mates of the proportion of deaths attributable to obesity,it is most precisely described as the proportion of deathsattributable to having a BMI above 25.0, a range thatincludes overweight individuals.We used a two-step process to attribute the difference
in PAFs between current smokers and never-smokers todifferences in BMI distributions versus differences in themortality risks of obesity. The approach is based onequation (1). To estimate how much of the difference inPAFs between current smokers and never-smokers iscaused by differences in their BMI distributions, werecalculated the PAF combining the HRs of never-smokers with the BMI distribution of current smokers toproduce a hypothetical distribution of deaths by BMIstatus. This process produces an estimate of what thePAF would be for never-smokers if they maintained their
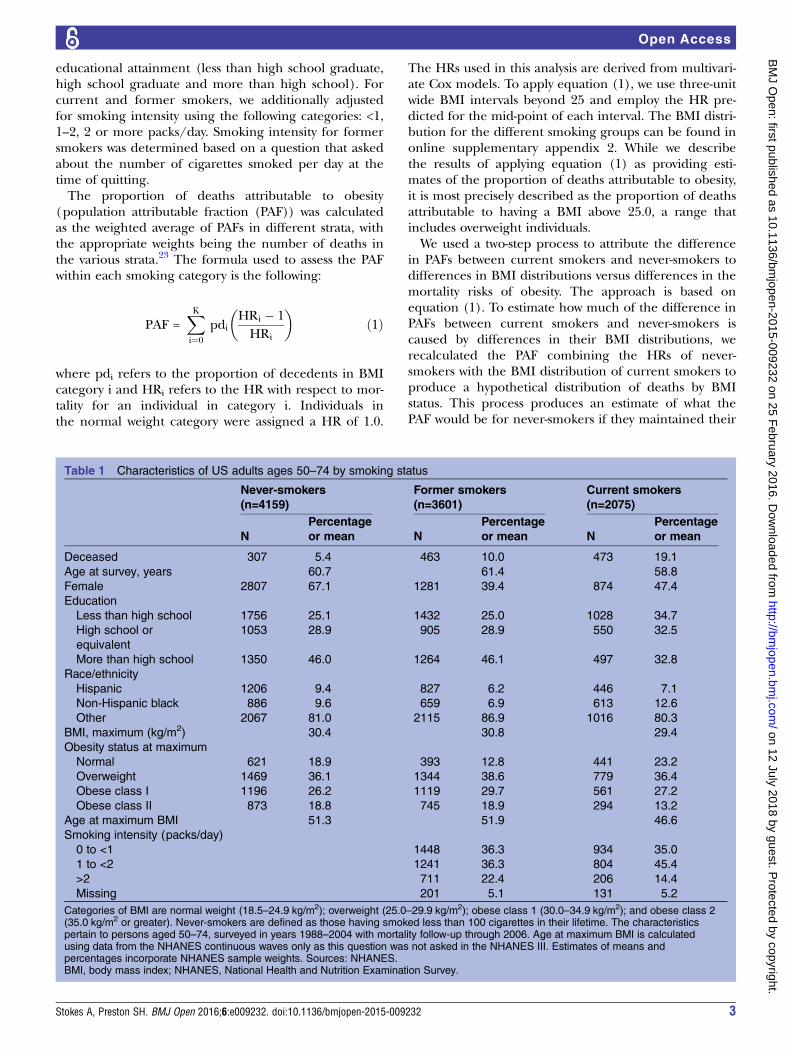
Table 1 Characteristics of US adults ages 50–74 by smoking status
Never-smokers
(n=4159)
Former smokers
(n=3601)
Current smokers
(n=2075)
N
Percentage
or mean N
Percentage
or mean N
Percentage
or mean
Deceased 307 5.4 463 10.0 473 19.1
Age at survey, years 60.7 61.4 58.8
Female 2807 67.1 1281 39.4 874 47.4
Education
Less than high school 1756 25.1 1432 25.0 1028 34.7
High school or
equivalent
1053 28.9 905 28.9 550 32.5
More than high school 1350 46.0 1264 46.1 497 32.8
Race/ethnicity
Hispanic 1206 9.4 827 6.2 446 7.1
Non-Hispanic black 886 9.6 659 6.9 613 12.6
Other 2067 81.0 2115 86.9 1016 80.3
BMI, maximum (kg/m2) 30.4 30.8 29.4
Obesity status at maximum
Normal 621 18.9 393 12.8 441 23.2
Overweight 1469 36.1 1344 38.6 779 36.4
Obese class I 1196 26.2 1119 29.7 561 27.2
Obese class II 873 18.8 745 18.9 294 13.2
Age at maximum BMI 51.3 51.9 46.6
Smoking intensity (packs/day)
0 to <1 1448 36.3 934 35.0
1 to <2 1241 36.3 804 45.4
>2 711 22.4 206 14.4
Missing 201 5.1 131 5.2
Categories of BMI are normal weight (18.5–24.9 kg/m2); overweight (25.0–29.9 kg/m2); obese class 1 (30.0–34.9 kg/m2); and obese class 2(35.0 kg/m2 or greater). Never-smokers are defined as those having smoked less than 100 cigarettes in their lifetime. The characteristicspertain to persons aged 50–74, surveyed in years 1988–2004 with mortality follow-up through 2006. Age at maximum BMI is calculatedusing data from the NHANES continuous waves only as this question was not asked in the NHANES III. Estimates of means andpercentages incorporate NHANES sample weights. Sources: NHANES.BMI, body mass index; NHANES, National Health and Nutrition Examination Survey.
Stokes A, Preston SH. BMJ Open 2016;6:e009232. doi:10.1136/bmjopen-2015-009232 3
Open Access
on 12 July 2018 by guest. Protected by copyright.
http://bmjopen.bm
j.com/
BM
J Open: first published as 10.1136/bm
jopen-2015-009232 on 25 February 2016. D
ownloaded from
BMI-specific death rates but had the BMI distribution ofsmokers. Second, we used an analogous process of sub-stitution to calculate what the PAF would be for never-smokers if they had the HRs of current smokers whilemaintaining their own BMI distribution.We adjusted for unequal probabilities of selection and
non-response using sample weights and accounted forthe complex survey design of NHANES.24 Analyses wereperformed using STATA V.12 (StataCorp) and varianceswere estimated with the SVY routine, which uses Taylorseries linearisation. This study was based on anonymoussecondary data and thus did not require approval froman ethics committee.
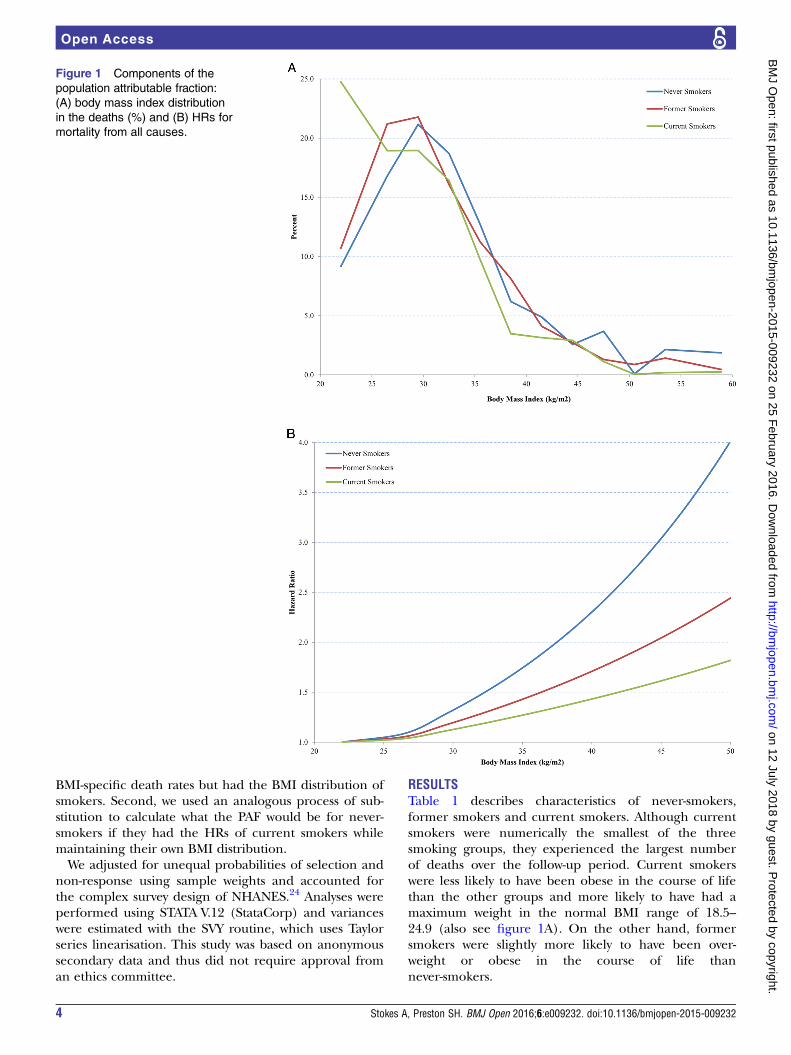
RESULTSTable 1 describes characteristics of never-smokers,former smokers and current smokers. Although currentsmokers were numerically the smallest of the threesmoking groups, they experienced the largest numberof deaths over the follow-up period. Current smokerswere less likely to have been obese in the course of lifethan the other groups and more likely to have had amaximum weight in the normal BMI range of 18.5–24.9 (also see figure 1A). On the other hand, formersmokers were slightly more likely to have been over-weight or obese in the course of life thannever-smokers.
Figure 1 Components of the
population attributable fraction:
(A) body mass index distribution
in the deaths (%) and (B) HRs for
mortality from all causes.
4 Stokes A, Preston SH. BMJ Open 2016;6:e009232. doi:10.1136/bmjopen-2015-009232
Open Access
on 12 July 2018 by guest. Protected by copyright.
http://bmjopen.bm
j.com/
BM
J Open: first published as 10.1136/bm
jopen-2015-009232 on 25 February 2016. D
ownloaded from

Table 2 and figure 1B present the estimated HRsamong the three smoking groups. The HR associatedwith a one-unit increment in BMI beyond 25.0 was 1.057(95% CI 1.033 to 1.082; p<0.001) for never-smokers,1.036 (95% CI 1.015 to 1.059; p<0.01) for former
smokers and 1.024 (95% CI 0.997 to 1.052) for currentsmokers. Thus, higher levels of BMI are a survival threatamong all smoking groups, but the threat is more thantwice as great among never-smokers as current smokers,with former smokers intermediate. The predicted
Table 2 HRs for mortality from all causes
Never-smokers Former smokers Current smokers
HR 95% CI HR 95% CI HR 95% CI
Sex
Women 1.000 1.000 1.000
Men 1.135 0.827 to 1.557 1.320 0.981 to 1.775 1.195 0.928 to 1.540
Race/ethnicity
Other 1.000 1.000 1.000
Hispanic 1.058 0.676 to 1.656 0.857 0.544 to 1.351 0.953 0.558 to 1.628
Non-Hispanic black 1.512* 1.066 to 2.145 1.839*** 1.334 to 2.536 1.513** 1.190 to 1.923
Education level
Less than high school 1.000 1.000 1.000
High school 0.785 0.543 to 1.134 1.172 0.803 to 1.712 0.875 0.666 to 1.149
More than high school 0.539* 0.334 to 0.868 1.012 0.728 to 1.407 0.693** 0.546 to 0.881
Smoking intensity
0 to <1 1.000 1.000
1 to <2 1.002 0.738 to 1.361 1.251 0.922 to 1.699
≥2 1.471* 1.049 to 2.064 1.383 0.951 to 2.013
BMI-25 1.057*** 1.033 to 1.082 1.036** 1.015 to 1.059 1.024 0.997 to 1.052
***p<0.001; **p<0.01; *p<0.05.Never-smokers are defined as those having smoked less than 100 cigarettes in their lifetime. The sample includes persons ages 50–74. Entryyears are 1988–2004 with mortality follow-up through 2006. HRs are derived from Cox proportional hazards models that adjust for gender,race/ethnicity (non-Hispanic black, Hispanic, other) and educational attainment (less than high school, high school, some college or greater).Age is specified as analysis time. BMI-25 is calculated by subtracting 25 from each person’s maximum BMI. Individuals with BMI valuesbetween 18.5 and 25 kg/m2 constitute the reference category and are assigned a value of 0. All estimates are weighted and account forcomplex survey design. Sources: National Health and Nutrition Examination Survey.BMI, body mass index.
Figure 2 Population attributable fractions (PAFs) for US adults ages 50–74, total and by smoking category.
Stokes A, Preston SH. BMJ Open 2016;6:e009232. doi:10.1136/bmjopen-2015-009232 5
Open Access
on 12 July 2018 by guest. Protected by copyright.
http://bmjopen.bm
j.com/
BM
J Open: first published as 10.1136/bm
jopen-2015-009232 on 25 February 2016. D
ownloaded from

hazard ratio associated with a BMI of 40 was1.05715=2.30 among never-smokers and 1.02415=1.43among current smokers.Figure 2 shows estimates of the PAF for obesity among
the three smoking groups based on equation 1. It usesthe HRs associated with obesity that are shown in table 2,in combination with the actual distribution of deaths byBMI in three-unit wide categories of BMI. Among never-smokers, 31.9% of deaths in this cohort were attributableto high BMI. Among current smokers, the proportionwas only 11.3%. Former smokers were located abouthalfway between the other two groups at 20.4%. The PAFfor the entire population is the death-weighted mean ofthese figures, or 19.8%.Why is the fraction of deaths attributable to obesity
lower among current smokers? One reason is that theBMI distribution of current smokers is shifted to the leftrelative to that of never-smokers. If the BMI distributionof current smokers were combined with the relative risksof never-smokers, table 3 shows that the PAF for never-smokers would be 29.9%, compared with its actual valueof 31.9%. Thus, of the original difference in PAFs of20.6 percentage points between never-smokers andcurrent smokers, approximately 2.0 percentage points,or 10%, would be eliminated if never-smokers had thesame BMI distribution as current smokers. If the relativerisks for current smokers were combined with the BMIdistribution of never-smokers, the PAF would be 14.0%,a reduction of 18.0 percentage points compared withthe original PAF of never-smokers of 31.9%. This reduc-tion represents 87% of the original difference in PAFsbetween the groups (note that the two hypotheticalchanges add to 97% rather than 100% of the originaldifference because of interactions between the twofactors). Thus, these two exercises are consistent inshowing that the low relative risks associated with BMIamong current smokers are the dominant reason whytheir PAF is far below that of never-smokers.
DISCUSSIONIt is clear that current smokers have a much lower frac-tion of deaths attributable to obesity than those whonever smoked. It is also clear that the principal sourceof this difference is that the relative risks associated withobesity are much lower among current smokers thanamong never-smokers.One explanation of the lower relative risks among
smokers is that competing risks of death are much moreprominent among them. Another explanation is thatresidual confounding by smoking is biasing downwardsthe relative risks among smokers. However, we intro-duced detailed information on smoking intensity amongcurrent and former smokers into the mortality models,reducing the likelihood that residual confounding is theprincipal explanation for the lower relative risks amongsmokers.
Table
3Decompositionofdifferencein
populationattributable
fractionsbetweennever-smokers
andcurrent-smokers
PAFs
CounterfactualPAFs
Decomposition
Never-smokers
Current
smokers
Differencein
PAFs
Never-smokers
HR
withBMIofcurrent
smokers
Changein
PAF
producedbyΔBMI
Never-smokers
BMI
withHRofcurrent
smokers
Changein
PAF
producedbyΔHR
Contribution
ofBMI(%
)
Contribution
ofHR
(%)
31.90
11.26
20.64
29.89
2.01
13.95
17.95
9.8
87.0
BMI,bodymassindex;PAF,populationattributable
fraction.
6 Stokes A, Preston SH. BMJ Open 2016;6:e009232. doi:10.1136/bmjopen-2015-009232
Open Access
on 12 July 2018 by guest. Protected by copyright.
http://bmjopen.bm
j.com/
BM
J Open: first published as 10.1136/bm
jopen-2015-009232 on 25 February 2016. D
ownloaded from

Is the disparity between their PAFs consistent with themortality risk from smoking itself? Two studies based ondata from the National Health Interview Survey and theNHANES estimated mortality risks of smoking in therange of 2.8–3.2 compared with never-smokers.25 26 Ifthe risk of death of current smokers relative to never-smokers was approximately 3, then approximatelytwo-thirds of deaths among smokers would be attribut-able to smoking itself. That leaves only the remainingone-third of deaths to be attributable to obesity andother factors. As a result, the PAF for obesity would beapproximately one-third as great for smokers as fornever-smokers. In fact, the PAFs for the two groups of32.0% and 11.3% correspond closely to that expectation.The online supplementary appendix includes a moreprecise illustration of how the proportion of deathsattributable to one exposure should be expected tochange when a new exposure is added.A similar correspondence also prevails among former
smokers. The risk of death among former smokers rela-tive to never-smokers is approximately 1.5.26 27 So aboutone-third of the deaths among former smokers areattributable to smoking. If the remaining two-thirds hadthe same PAF as never-smokers, then the PAF amongformer smokers would be about 0.67×0.32=0.21, similarto its actual value.The implication of these findings is that when the PAF
for obesity is calculated by excluding groups that aresubject to other very significant health risks—not onlysmokers but also people with diagnosed illnesses orhealth impairments and very old people—then theattributable fraction will increase. When such exclusionsare extensive, they can raise the estimated attributablefraction for obesity well above that pertaining to thepopulation as a whole.We believe that the strategy pursued in this paper pro-
vides a useful approach to dealing with this dilemma.We exclude no one from the attributable risk estimation,so that it pertains to the population as a whole, includ-ing sick people and smokers. On the other hand, we usean indicator of obesity, an individual’s maximum BMI,which pertains to the life cycle rather than simply tobaseline circumstances. An advantage of this indicator isthat it has the potential to capture the effects of pastobesity status. Also, health problems that may havereduced weight at baseline should have a smaller impacton an individual’s maximum lifetime BMI. As a result,the use of maximum BMI should produce less bias inestimating the mortality effects of obesity.A potential weakness of the paper is the possibility of
error in self-reported maximum weight. However, priorstudies suggest self-reported past weight is highly correlatedwith measured weight.28–31 Furthermore, maximum weightmay be identified more accurately than weight at a speci-fied earlier age (or point in time) since it does not requireestablishing a correspondence between one’s age andone’s weight trajectory. Distortions in estimates of the asso-ciation between obesity and mortality are much smaller
when a continuous, linear version of BMI is employed, asin this paper, rather than a categorical version.32
The estimated fraction of deaths attributable toobesity is higher than most previous estimates in theUSA.7 11 Prior studies suggest that the associationbetween obesity and mortality declines with age,33 thusexclusion of older individuals from the sample may bepartly responsible for these findings. A second reason isthat we use maximum BMI rather than baseline BMI asour indicator of adiposity. The relative risks associatedwith maximum BMI are substantially greater than thoseassociated with baseline BMI.15 We believe that the rela-tive risks that we use are a more accurate representationof the hazards of adiposity than those associated withbaseline BMI because maximum BMI better capturesrisks associated with past obesity status and is lessaffected by reverse causality.The higher fraction of deaths attributable to obesity
among never-smokers has implications for the set offuture death risks facing Americans. Declines insmoking that have already occurred and that may keepoccurring are likely to increase the proportion of deathsattributable to obesity. In the extreme, if no one eversmoked we could anticipate that the proportion of deathattributable to obesity in the age interval 50–74 wouldrise from 19.8%, the value for the contemporary USpopulation, to something closer to 31.9%, the PAF forcontemporary never-smokers.In conclusion, the proportion of deaths attributable to
obesity among US adults ages 50–74 is nearly threetimes as high among never-smokers as among currentsmokers. The principal reason for this discrepancy isthat current smokers have a lower relative risk of deathassociated with obesity than non-smokers. Such a reduc-tion is consistent with the fact that smokers are subjectto a major risk that is ‘competing’ with obesity and thatis itself responsible for many deaths. Former smokershave a PAF that is roughly halfway between that ofcurrent smokers and that of never-smokers.
Acknowledgements The authors thank Irma T Elo, Doug Ewbank, Neil KMehta and Lucia Tiererova for their comments and suggestions.
Contributors AS and SHP contributed to all aspects of this article, includingconceptualisation, data analysis and writing.
Funding This project was supported by the National Institute on Aging[R01AG040212].
Disclaimer The content is solely the responsibility of the authors and doesnot necessarily represent the official views of the National Institutes on Agingor the National Institutes of Health.
Competing interests None declared.
Provenance and peer review Not commissioned; externally peer reviewed.
Data sharing statement No additional data are available.
Open Access This is an Open Access article distributed in accordance withthe Creative Commons Attribution Non Commercial (CC BY-NC 4.0) license,which permits others to distribute, remix, adapt, build upon this work non-commercially, and license their derivative works on different terms, providedthe original work is properly cited and the use is non-commercial. See: http://creativecommons.org/licenses/by-nc/4.0/
Stokes A, Preston SH. BMJ Open 2016;6:e009232. doi:10.1136/bmjopen-2015-009232 7
Open Access
on 12 July 2018 by guest. Protected by copyright.
http://bmjopen.bm
j.com/
BM
J Open: first published as 10.1136/bm
jopen-2015-009232 on 25 February 2016. D
ownloaded from
REFERENCES1. Murray CJL, Abraham J, Ali MK, et al. U.S. Burden of Disease
Collaborators. The state of US health, 1990–2010: Burden ofdiseases, injuries, and risk factors. JAMA 2013;310:591–608.
2. Allison D, Fontaine K, Manson J, et al. Annual deaths attributable toobesity in the United States. JAMA 1999;282:1530.
3. Calle EE, Rodriguez C, Walker-Thurmond K, et al. Overweight,obesity, and mortality from cancer in a prospectively studied cohortof US adults. N Engl J Med 2003;348:1625–38.
4. Mokdad AH, Marks JS, Stroup DF, et al. Actual causes of death inthe United States, 2000. JAMA 2004;291:1238–45.
5. Flegal KM, Graubard BI, Williamson DF, et al. Impact of smokingand preexisting illness on estimates of the fractions of deathsassociated with underweight, overweight, and obesity in the USpopulation. Am J Epidemiol 2007;166:975–82.
6. Berrington de Gonzalez A, Hartge P, Cerhan JR, et al. Body-massindex and mortality among 1.46 million White adults. N Engl J Med2010;363:2211–19.
7. Flegal KM. Bias in calculation of attributable fractions using relativerisks from nonsmokers only. Epidemiology 2014;25:913–16.
8. Stokes A. Body-mass index and mortality among white adults.N Engl J Med 2011;364:781–3.
9. Audrain-McGovern J, Benowitz NL. Cigarette smoking, nicotine, andbody weight. Clin Pharmacol Ther 2011;90:164–8.
10. Calle EE, Thun MJ, Petrelli JM, et al. Body-mass index and mortalityin a prospective cohort of U.S. adults. N Engl J Med1999;341:1097–105.
11. Koster A, Leitzmann M. The combined relations of adiposity andsmoking on mortality. Am J Clin Nutr 2008;88:1206–12.
12. Ma J, Jemal A, Flanders WD, et al. Joint association of adiposityand smoking with mortality among U.S. adults. Prev Med (Baltim)2013;56:178–84.
13. van Dam R, Li T, Spiegelman D, et al. Combined impact of lifestylefactors on mortality: prospective cohort study in US women. BMJ2008;337:a1440.
14. Whitlock G, Lewington S, Sherliker P, et al. Prospective StudiesCollaboration. Body-mass index and cause-specific mortality in900,000 adults: collaborative analyses of 57 prospective studies.Lancet 2009;373:1083–96.
15. Stokes A. Using maximum weight to redefine body mass indexcategories in studies of the mortality risks of obesity. Popul HealthMetr 2014;12:6.
16. Mehta NK, Stenholm S, Elo IT, et al. Weight histories and mortalityamong Finnish adults: the role of duration and peak body massindex. Epidemiology 2014;25:707–10.
17. National Center for Health Statistics. Plan and operation of the thirdNational Health and Nutrition Examination Survey, 1988–94. Series 1:programs and collection procedures. Vital Health Stat 1994;1:1–407.
18. Zipf G, Chiappa M, Porter KS, et al. National Health and NutritionExamination Survey: plan and operations, 1999–2010. Vital HealthStat 2010;1:1–37.
19. National Center for Health Statistics. Office of Analysis andEpidemiology. The Third National Health and NutritionExamination Survey (NHANES III) Linked Mortality File, mortalityfollow-up through 2006: matching methodology. Hyattsville, MD,2009.
20. Abdullah A, Wolfe R, Stoelwinder JU, et al. The number of yearslived with obesity and the risk of all-cause and cause-specificmortality. Int J Epidemiol 2011;40:985–996.
21. Preston SH, Mehta NK, Stokes A. Modeling obesity histories incohort analyses of health and mortality. Epidemiology2013;24:158–66.
22. Joshy G, Korda RJ, Bauman A, et al. Investigation of methodologicalfactors potentially underlying the apparently paradoxical findings onbody mass index and all-cause mortality. PLoS ONE 2014;9:e88641.
23. Benichou J. A review of adjusted estimators of attributable risk. StatMethods Med Res 2001;10:195–216.
24. Johnson C, Paulose-Ram R, Ogden CL, et al. NationalHealth and Nutrition Examination Survey: analytic guidelines,1999–2010. National Center for Health Statistics. Vital Health Stat2013;1:1–24.
25. Jha P, Ramasundarahettige C, Landsman V, et al. 21st-centuryhazards of smoking and benefits of cessation in the United States.N Engl J Med 2013;368:341–50.
26. Thun MJ, Carter BD, Feskanich D, et al. 50-year trends insmoking-related mortality in the United States. N Engl J Med2013;368:351–64.
27. Mehta N, Preston S. Continued increases in the relative risk of deathfrom smoking. Am J Public Health 2012;102:2181–6.
28. Casey A, Dwyer T, Berkey C, et al. Long-term memory of bodyweight and past weight satisfaction: a longitudinal follow-up study.Am J Clin 1991;53:1493–8.
29. Perry G, Byers T, Mokdad A, et al. The validity of self-reportsof past body weights by US adults. Epidemiology 1995;6:61–6.
30. Stevens J, Keil JE, Waid LR, et al. Accuracy of current, 4-year, and28-year self-reported body weight in an elderly population. Am JEpidemiol 1990;132:1156–63.
31. Rhoads G, Kagan A. The relation of coronary disease, stroke, andmortality to weight in youth and in middle age. Lancet1983;321:492–5.
32. Preston SH, Fishman E, Stokes A. Effects of categorization andself-report bias on estimates of the association between obesity andmortality. Ann Epidemiol 2015;25:907–11.e2.
33. Wang Z. Age and the impact of obesity on mortality. Am J PublicHealth 2014;104:3–6.
8 Stokes A, Preston SH. BMJ Open 2016;6:e009232. doi:10.1136/bmjopen-2015-009232
Open Access
on 12 July 2018 by guest. Protected by copyright.
http://bmjopen.bm
j.com/
BM
J Open: first published as 10.1136/bm
jopen-2015-009232 on 25 February 2016. D
ownloaded from