health selection and the effect of smoking on mortalityftp.iza.org/dp6206.pdf · health selection...
TRANSCRIPT

DI
SC
US
SI
ON
P
AP
ER
S
ER
IE
S
Forschungsinstitut zur Zukunft der ArbeitInstitute for the Study of Labor
Health Selection and the Effect of Smoking on Mortality
IZA DP No. 6206
December 2011
Jérôme AddaValérie Lechene

Health Selection and the
Effect of Smoking on Mortality
Jérôme Adda European University Institute
and IZA
Valérie Lechene University College London
Discussion Paper No. 6206 December 2011
IZA
P.O. Box 7240 53072 Bonn
Germany
Phone: +49-228-3894-0 Fax: +49-228-3894-180
E-mail: [email protected]
Any opinions expressed here are those of the author(s) and not those of IZA. Research published in this series may include views on policy, but the institute itself takes no institutional policy positions. The Institute for the Study of Labor (IZA) in Bonn is a local and virtual international research center and a place of communication between science, politics and business. IZA is an independent nonprofit organization supported by Deutsche Post Foundation. The center is associated with the University of Bonn and offers a stimulating research environment through its international network, workshops and conferences, data service, project support, research visits and doctoral program. IZA engages in (i) original and internationally competitive research in all fields of labor economics, (ii) development of policy concepts, and (iii) dissemination of research results and concepts to the interested public. IZA Discussion Papers often represent preliminary work and are circulated to encourage discussion. Citation of such a paper should account for its provisional character. A revised version may be available directly from the author.
IZA Discussion Paper No. 6206 December 2011
ABSTRACT
Health Selection and the Effect of Smoking on Mortality* We show that individuals who are in poorer health, independently from smoking, are more likely to start smoking and to smoke more cigarettes than those with better non-smoking health. We present evidence of selection, relying on extensive data on morbidity and mortality. We show that health based selection into smoking has increased over the last fifty years with knowledge of its health effects. We show that the effect of smoking on mortality is higher for high educated individuals and for individuals in good non-smoking health. JEL Classification: I12 Keywords: life expectancy, tobacco, confounding Corresponding author: Jérôme Adda Department of Economics European University Institute Via della Piazzuola 43 50133 Firenze Italy E-mail: [email protected]
* We are grateful for comments by Orazio Attanasio, Alan Beggs, Andrew Chesher, Christian Dustmann, John Flemming, Pierre-Yves Geoffard, Michael Grossman, Hide Ichimura, Gabor Kezdi, Michael Marmot, Paul Schultz, two anonymous referees, and to seminar participants at CEPR health workshop, CEMFI, CEU, DELTA, ESPE, Minneapolis Fed, SED, Tinbergen Institute, iHEA, ESEM, UCL and Copenhagen.

I Introduction
According to the World Health Organization, there are currently 1.25 billion smokers in the
world; among those, there are each year 4 million deaths from tobacco-related diseases and
it is forecast that there will be 10 million such deaths yearly by 2030. Altogether, tobacco
causes more deaths than malaria, tuberculosis and major childhood conditions combined. A
crucial policy question is whether preventing these deaths would lead to substantial gains in
life expectancy. To answer this question, the life expectancy of smokers is often compared
to that of non smokers, adjusting for some individual characteristics. This comparison has
formed, since the sixties, the basis of government policies designed to curb smoking on the
grounds of the detrimental effect of smoking on health. The effect of tobacco on health can
only be inferred by comparing the health of smokers to that of non smokers if smoking is
a random choice so that individuals do not self select into smoking on the basis of some
omitted unobserved factor which affects smoking and also has a direct effect on health and
morbidity.
If omitted factors jointly influence smoking and health, the comparison of smokers and
non smokers yields biased estimates of the effect of tobacco on health and mortality. Two
simple mechanisms can lead to a bias in this relationship. In both cases, the choice to smoke
is rational, and made by weighing short run gains against long run risks, and in both cases
individuals select into smoking on the basis of a characteristic correlated with mortality.
The first mechanism is based on heterogeneity in life expectancy. For individuals with worse
health independently from smoking, and, hence, lower life expectancy, the expected costs of
smoking are lower, because they are less likely to live long enough to get smoking-related
diseases. Therefore, according to this argument, individuals with worse health would tend
to self-select into smoking. The second mechanism is based on heterogeneity in preferences
such as risk aversion or myopia. Individuals who are less risk-averse are more likely to chose
to smoke and also more likely to do things which lead to worse health. In both cases, there
is a correlation between mortality and the health of the individual if they had not smoked,
as well as between smoking and the health of the individual if they had not smoked. From
2

now on, we will refer to the counter-factual health of the individual had they not smoked
as non-smoking related health, or NSH. Moreover, in both cases, the effect of smoking on
mortality, calculated without controlling for NSH, will be overestimated because smokers
would have had a higher mortality even if they had not smoked.1
The theoretical contribution of the paper is to develop a simple stylised model of smok-
ing and mortality featuring these mechanisms and leading to a health based selection into
smoking.
The empirical contribution of the paper consists in constructing a measure for non smok-
ing health, as well as documenting the correlations between smoking and NSH and between
mortality and NSH. The novelty of our approach is to combine data on smoking behaviour
on the one hand with detailed information on individual morbidity and mortality, and on
the other hand with medical and epidemiological knowledge on morbidity. We use the ad-
ditional information from the medical and epidemiological sciences to construct a proxy for
the (counter-factual) non smoking health of the individual.2 One important concern is that
the NSH proxy might be caused by smoking. We provide evidence that this is not the case
by examining the evolution of its value through time. We find that it changes at similar
rates for smokers and non smokers, so that we rule out that the value it takes is causally
determined by smoking. The NSH proxy reflects both exogenous health conditions (think
for instance of young age diabetes) and consequences of risk taking behaviour (think for
instance sexually transmitted diseases) so that the correlation between smoking and NSH
proxy can be interpreted as reflecting selection into smoking on the basis of both exogenous
health differences and health differences resulting from different degrees of risk aversion.
Using smoke-free morbidity to proxy for NSH is similar to using test scores to proxy for
ability in wage equations; where duration to death plays the same role as the wage, smoking
plays the same role as education and the smoke-free morbidity plays the same role as the test
1The estimated effects of smoking on the probability of getting a particular disease given that death has
not occurred from another cause are not being questioned.2We discuss in section III why instrumental variable or natural experiments are not possible in this
context.
3

score. It is also close in spirit to Farell and Fuchs (1982) who discuss the connection between
schooling and smoking and propose that it could be due to ”a third variable”. Although
Farell and Fuchs are not specific about this variable, it could be the life expectancy or horizon
of investment.
We use an extensive data set, where about 29000 Swedish individuals are followed for up
to eighteen years, recording their smoking behavior, other risky behaviors, mortality, a range
of morbidity indicators and information on individual and family characteristics. The results
show that smokers come from a population with poorer NSH, even when conditioning on a
number of observed characteristics. For given gender, age and education, Swedish individuals
who are in the bottom 25 percent of the distribution of NSH are up to 6 percent more likely
to smoke than those in the top 25 percent. This is comparable in magnitude to the effect of
almost four years of schooling. The existence of the former correlation suggests selection into
smoking on the part of the individuals in worse NSH. Note that our estimates do not reflect
the effect of smoking on mortality conditional on any selection, but only on selection based on
health. We also present some empirical evidence to disentangle between life expectancy (or
discount rate) and risk aversion (or myopia) as the structural mechanisms which could give
rise to selection, but we do not present a full structural analysis of the different restrictions
generated by the two hypothesis, as our data does not allow for this. While interesting, this
question has to be left for further research on even richer data. Documenting the existence
of selection into smoking on the basis of a measure of non smoking health is novel and of
interest in itself.
We also show that there is a strong cohort effect: the selection effect is important for
younger cohorts, who started smoking when the information on the effect of tobacco on
health was widely publicized, but not so much for previous cohorts. This is aligned to
results obtained by Fertig (2010) on British data. These results further suggest that the
conclusions reached in the past by epidemiological studies are not far off the mark for the
generations considered but that future studies comparing smokers and non smokers will
spuriously reveal a worsening effect of tobacco on health if they fail to control for selection.
4

Finally, we show that there is heterogeneity in the effect of tobacco on mortality. In
terms of years of life lost, the effect of tobacco is lower for individuals with poorer NSH
(and hence with lower life expectancy as a non smoker) than for individuals with better
NSH. Individuals with poor NSH (in the sense of being in the bottom 25 percent of the
distribution) lose about three years by smoking, while individuals with good NSH (in the
top 25 percent of the distribution) lose about five years. These results confirm the theoretical
hypothesis we put forward to justify the possibility of selection. The effect of smoking on
mortality is measured in a model of duration to death, where we control for selection by
conditioning on NSH. To our knowledge, these are the first results showing disparity of life
expectancy as a function of NSH and smoking. 3
Section II presents the theoretical framework. Section III discusses the econometric
specification. Section IV presents the data and discusses the construction of the non smoking
health proxies. Section V presents evidence of selection into smoking and documents the
increase in selection over time. Section VI presents estimates of the effect of tobacco on
mortality controlling for selection and documents the heterogeneity in the effect of smoking
on mortality. Section VII concludes.
II A model of smoking and mortality
To explore the possible selection bias into smoking, we develop a simple stylised model of
smoking decision and mortality. In this stylised model, the choice to smoke can be due
to heterogeneity in life expectancy or in risk aversion. Suppose that smoking is a life-time
decision, taken at the first period. We denote by u the instantaneous payoff of a non smoker
3There have been few empirical investigations of selection into smoking, except to study the link between
maternal smoking and birth weight. Rosenzweig and Schultz (1983), Evans and Ringel (1999) consider the
effect of maternal smoking on birth weight, allowing for endogeneity and both show that endogeneity is
important and should be accounted for. More recently Abrevaya (2006), Almond, Chay, and Lee (2005),
Lien and Evans (2005) and Fertig (2010) obtain mixed results when examining the same question using a
variety of techniques.
5
and by u + ε the pay off for a smoker, where ε is a random variable reflecting difference in
taste across the population. Denote by F (.) the cumulative distribution function of ε. We
assume that the payoffs are constant through time. If individuals lived for one period, the
decision to smoke would be made by comparing instantaneous pay-offs, so that individuals
with ε < 0 would not engage in smoking. 4 However, the situation is complicated by the
fact that individuals live for several periods, and moreover, the number of periods they live
depends on whether they smoke or not. Individuals with a positive draw of ε may choose to
smoke, if the health consequences are not too large. We denote by β the discount factor.
A non-smoker lives TNS periods, where TNS is a random variable, known to the agent. 5 A
smoker lives T = min(TNS, TS) periods, where TS is the age of tobacco related fatal diseases,
which we take as constant for simplicity. Hence, we model life expectancy as a competing
risk model. When deciding to smoke or not, an individual compares the flow of utility in
both cases over different life horizons.
We denote the flow of utility for an individual who opts not to smoke as:
V (NS) =
TNS∑t=1
βt−1u =1− βTNS
1− βu. (1)
The inter-temporal flow of utility for this same individual as a smoker is:
V (S) =T∑
t=1
βt−1(u+ ε) =1− βT
1− β(u+ ε). (2)
For individuals characterized by TNS and TS, the probability to smoke is therefore:
Prob(Smoke) = Prob(V (S) > V (NS)) (3)
= Prob
(1− βT
1− β(u+ ε) >
1− βTNS
1− βu
)= Prob
(ε >
βT − βTNS
1− βTu
)= 1− F
(βT − βTNS
1− βTu
),
4Note that we abstract from explicitly modeling the addictiveness of tobacco as we are mainly interested
in the life-time decision of whether to smoke or not.5Hurd and McGarry (1995), Hurd et al. (2001) and Hurd and McGarry (2002) document the fact that
individuals are able to forecast their own life expectancy.
6

where F () is the cumulative distribution function of the random taste shock ε. For individuals
with a short life expectancy as non-smokers (T = TNS), the probability to smoke simplifies
to Prob(Smoke) = 1−F (0) and is therefore independent of the health effect of tobacco and
depends only on the distribution of the taste shock. When individuals live long enough to
be affected by tobacco related diseases, smoking prevalence depends on the relative cost of
smoking in terms of loss of life-expectancy (which also includes the discount factor), and the
joint distribution of the taste shock and TNS in the population.
Straightforward algebra shows that∂Prob(S|TNS > TS)
∂TNS≤ 0. Hence, the model predicts
that individuals with longer non-smoking life expectancy are less likely to become smokers.
However, this is not the only reason for a correlation between smoking and life expectancy.
The second mechanism leading to selection into smoking on the basis of health which we
outlined in the introduction is based on heterogeneity in risk aversion. It is possible that
cov(ε, TNS) < 0, meaning that preferences for tobacco are correlated with non-smoking life
expectancy. This can arise if smokers are more likely to take risks and more likely to die
of non-tobacco related causes (such as accidents for instance). Barsky et al. (1997) show
that risk aversion is (negatively) correlated with smoking. Similar evidence is provided in
Dohmen et al. (2011). Hersch (1996) shows that smokers are also more prone to be heavy
drinkers or to drive without a seat-belt. Farrell and Fuchs (1982) also discuss the existence
of a ”third variable” - some characteristics of preferences such as the discount factor or risk
aversion- which could explain the correlation between schooling and smoking.
In the remainder of the paper, we propose to test whether∂Prob(S|X)
∂TNS≤ 0, where X is a
vector of observable characteristics. Given the data at hand, it is difficult to fully separate the
reason for selection into tobacco. However, we are able to control for some health behavior
such as drinking, the consumption of other drugs or risk on the job. If controlling for these
characteristics changes the marginal effect of TNS substantially, we would conclude that the
main channel goes through a correlation between preferences and life-expectancy.
Empirically, the problem is difficult to address because TNS is not observed for individuals
who are still alive, and for those who die from a tobacco-related disease. The novelty of our
7

approach is to construct an empirical counterpart for TNS, based on morbidity indicators
not thought to be causally related to tobacco, which are observed for each individual in our
sample.
III Econometric specification
In the absence of selection, measuring the effect of smoking on health or on mortality consists
in measuring the statistical association between some health outcome, say age at death T ,
and smoking S, controlling for observed individual characteristics X and allowing for unob-
served characteristics ε : T = f(X,S, ε). Under the assumption that ε is uncorrelated with
the observed elements of the problem X and S, it is straightforward to obtain a measure
of the effect of smoking on mortality. However, the theoretical arguments developed above
indicate that it is not possible to rule out the existence of a correlation between the observed
characteristics X and the unobserved characteristics ε, where the unobserved characteris-
tics may be non smoking health, NSH, in which case it is necessary to adopt a different
approach to measure the association between smoking and the outcome. We discuss in turn
instrumenting smoking and using a proxy for the unobserved variable.
Instrumenting smoking
The economic and econometric literatures usually deal with endogeneity by using an in-
strumental variables approach. 6 In this context, an instrument must be correlated with
smoking but uncorrelated with the unobservables driving mortality. Any individual charac-
teristic could arguably figure as an explanatory variable for smoking. Indeed, epidemiologists
have argued that education levels, occupation, income, or stress have a direct effect on health
and mortality, whilst economists would also argue that they also have an effect on smoking.
Another candidate as an instrument could be prices, to the extent that they influence smok-
6Other approaches include functional form identification as in Lahiri and Song (2000), Contoyannis and
Jones (2004) or Balia and Jones (2004) who find positive selection using a recursive model of mortality and
life-style with British data.
8

ing behavior. 7 However, when relating mortality or long term health outcomes and smoking,
what is usually thought to influence the outcome is a measure of smoking over the entire
life cycle. Using time series variation in prices would not be satisfactory, as prices would
mainly pick up cohort effects. Younger cohorts would have faced higher prices than older
ones. However, at any point in time, health outcomes and mortality are directly explained
by cohort effects. Finally, spatial variations in prices are not very big and it has been argued
that these are endogenous too. The announcement of a link between smoking and health in
the nineteen sixties could be seen as an exogenous event, but it would also be linked with
the date of birth. Moreover, the medical literature had started incriminating smoking well
before the announcement of the Surgeon General in the US in 1964 and the Royal College
of Physicians in the UK in 1962, so it might be possible that more educated individuals
had already curbed their smoking behavior. Empirical evidence for the US presented in de
Walque (2004) suggest that this was the case. All in all, it is difficult to think of a good
instrument for smoking patterns over the life cycle.
Proxying for Non Smoking Health
Given the difficulty to find a credible instrument in this context, we propose to follow a
different route, namely to use a proxy to control for the unobserved characteristic according
to which the individuals select into smoking. Contrarily to an instrument, which should
be correlated with the endogenous variable, smoking (S,) and uncorrelated with the unob-
servables of the problem ε, a proxy should be correlated with ε and can be correlated with
the endogenous variable S. 8 Let age at death, T be related to individual characteristics
7This approach has been used by Evans and Ringel (1999) to study the effect of smoking on birth weights
and by Auld (2005) to study the effect of smoking on wages. Adda and Cornaglia (2006) show that smokers
compensate fewer cigarettes by smoking more intensively when faced with higher prices, so that the health
effects of higher excise taxes are dubious.8The proxy for non observed determinants of smoking must not caused by smoking, otherwise this intro-
duces a bias in the estimated effect of smoking on the outcome. In the context of wage equations, the wage
is a function of education which is observed and ability which is unobserved, and test scores which are used
to proxy for ability are also correlated with education.
9

X, including smoking behaviour S, and to the individual’s unobserved non smoking health
NSH, and to a random shock u. Assume further that individuals select into smoking on the
basis of non smoking health, so that cov(S,NSH) 6= 0. Assume an additive structure to the
problem9:
T = Xβ +NSHγ + u︸ ︷︷ ︸, (4)
ε : unobserved
where NSH is not observed, but a proxy for it, NSHproxy is observed, and the relationship
between NSH and NSHproxy is given by: NSHproxy = NSHθ + e, with cov(e,NSH) = 0.
Wickens (1972) shows that in terms of asymptotic bias, it is always preferable to condition on
a proxy, even if it is poor (in the sense of having low explanatory power for the unobserved
characteristic), rather than omitting it from the equation of interest. The assumptions
under which this holds are captured in the last equation. The first assumption is that the
observed health score, NSHproxy is random, whilst the individual’s NSH is fixed. This is a
standard, innocuous assumption. The second assumption needed to obtain the result that
conditioning by the proxy is always better than not conditioning is that the proxy is the sum
of two uncorrelated elements, the fixed unobservable NSH, and a random shock e. This is
the key identifying assumption of the approach, and as such it is untestable. This assumption
could fail for example because the health shock were correlated with the unobservable NSH
of the individual. In this case, conditioning on the proxy might not lead to a decrease in the
bias. We illustrate the proof of Wickens’s result in the case of smoking, age at death and
non smoking health proxy in appendix A. We also show in the appendix that if the proxy
were in fact caused by the endogenous variable it is correlated to, this would lead to a bias
in the estimated coefficient, whose direction is not clear a priori. However, it is possible here
to show that the proxy is not caused by smoking. Indeed, individuals are observed through
time, and it is possible to construct repeated measures of the proxy for their NSH at different
9We estimate a model of duration to death under an index restriction so that T = exp(Zγ), and the
argument above regarding the use of the proxy for a linearly additive model applies to log(T ).
10

dates. If the proxy were caused by smoking, then the rate of change of the proxy would be
different for non smokers and for smokers. We show in section IV that this is not the case.
IV The Data
We use data from the Swedish Survey of Living Condition, (Undersokningen av Levnads-
Forhallanden (ULF)). Approximately 6000 individuals, representative of the whole popula-
tion, are surveyed each year. The ULF reports information on quantities smoked, smoking
history, education, occupation, family composition, income as well as many health measures.
The data set has been merged with the Record of Deaths in 1999, so that we observe whether
a given individual is alive up to the end of 1998, and if not, the date and cause of death.
We use the 1980-81, 1988-89 and 1996-97 cross sections, as in these years the survey has a
special section on health. In total, the data set includes 28822 individuals and we observe
6593 deaths. Within this large data set, Statistic Sweden has constructed a smaller panel
data set which follows individuals for two or three interviews (about 5000 individuals which
we use for robustness checks).
Table 1 displays the characteristics of the data set. About half of the individuals in
the sample are or have been smokers. Men are more likely to be or to have been smokers.
Smoking prevalence is around 25 percent, with similar proportion for men and women. The
number of cigarettes consumed per day is low compared to other countries (15.5 in the UK,
24 in the US 10, where these are the averages for smokers).
Regarding smoking behaviour, we observe the quantities smoked, the duration of the
smoking habit, and for some individuals the age at which they start smoking. However,
individuals are not asked complete histories, but rather they answer questions from which it
is possible to construct histories under the assumption that they have smoked continuously
since they started smoking (until quitting if they have done so). This is a drawback of this
data, in that it does not allow the analysis of multiple smoking spells.
10Sources, UK: British Household Panel Survey, 1995, US: World Health Organization, 2000.
11

The survey records traditional individual outcomes and characteristics, such as education,
occupation, family composition, or income. It is important to note that other risk taking
behaviour, such as consumption of alcohol or of snuss (a variety of chewing tobacco) are
recorded, as well as risky occupations.
We first present the morbidity information content of the data, before turning to the
construction of the proxy for NSH.
Measuring health
The data set contains an extensive set of health questions, including self-assessed health,
body mass index, hospital visits, ability to run, walk or climb stairs. The survey also
recorded extensive information on any specific health problems which were coded according
to the International Classification of Diseases (ICD 8 and 9) by nurses. Each individual can
report up to six different health problems. In addition to all this information, we also have
information on the severity of the disease (coded in 4 modalities) and an indication of the
onset, so we can distinguish acute from chronic problems. These health problems range from
relatively minor problems such as skin problems to life threatening such as specific cancers,
ischemic heart problems or diabetes. In total, there are 155 variables to describe the health
of an individual.
To summarize the information contained in this large number of variables, we construct
a general morbidity index, using principal components analysis. We use indicators of general
health, of perceived state of health relative to one’s cohort, an indicator of the existence of
long term illness, indicators for the range of body mass index in 3 modalities, indicators of
whether the individual can run, walk up a flight of stairs, and board a bus. We also use
information on the presence of heart conditions, of insomnia, anxiety, of taking antibiotics,
of coughing, having a skin condition, having been to the hospital in the past two weeks, of
being diabetic, having a neoplasm, hypertension, asthma, ischemic problems, cerebral prob-
lems, problems with arteries, veins, pulmonary obstructive diseases, stomach illness, hernia,
cirrhoses. We use the result of the principal component analysis to summarise morbidity
12
into an individual index. The morbidity index is found to be increasing with age, indicating
worsening of health with age. Its variance is also increasing with age until around 85 years
old, after which it decreases. However, there is considerable heterogeneity even at young
ages. 11 The index is evidently correlated with smoking as we have included all observed
conditions, some of them being directly caused by smoking. 12 We turn next to the construc-
tion of several tobacco-free morbidity indices, which will be used to proxy for non smoking
health.
NSH proxies
As in the context of wage equations, where one way to control for selection into education
is to obtain a proxy for ability, the method employed here consists in constructing a proxy
for the NSH status of the individual, the equivalent in this context of innate ability. We rely
on medical and epidemiological knowledge to isolate medical conditions of which it is known
that they are not caused by tobacco, and the proxy for NSH is constructed using variability
in diseases for which this is the case. We use different sets of non tobacco related diseases
to construct the NSH proxy NSHproxy which we denote NSH1, NSH2 and NSH3 below.
The first proxy we use to control for an individual’s background health, NSH1, is the
individual’s height. 13 Conditional on starting smoking after growth is finished (around age
16 for girls and 17 for boys 14), height is unequivocally not caused by tobacco 15. We discuss
11From the panel dimension, health appears to be very persistent through time. Individuals in poorer
health in one period are very likely to be in poor health eight years later. In fact, at the individual level,
health appears to be a random walk.12There are dangers as well as benefits of collapsing health into a single index see for instance the discussion
in Currie (2009).13Height is adjusted for gender. Furthermore, for this and other variables, to control for the fact that
there are substantial cohort effects, we use the individual’s rank in the distribution within age groups.14See for instance the growth charts at http://www.cdc.gov/growthcharts15While maternal smoking leads to low birth weight, the rate of growth of these children in subsequent
years compensates the initial handicap, so that, at puberty, there is no impact of maternal smoking, see for
instance Ong et al. (2002). From a purely technical point of view, note that if low birth weight did lead to
shorter adult height, height could nonetheless be used as a proxy for non smoking health, provided it is not
13

further this point below. Height is also known to be correlated with mortality (Steckel
(1995)). However, as we will show below, the correlation between height and mortality in
the cross section is not very strong, which means that there is not much power in the proxy.
We use the medical and epidemiological information to construct two alternative proxies,
which include more health information than height. A list of the morbidity indicators is
given in Table 2. To establish whether a disease should be included or excluded from the
proxy, we check the medical and epidemiological literature whether the disease has been
linked to smoking. On this basis, we disregard a number of diseases which have been linked
to tobacco consumption including a number of cancers (eg cancers of the lung or of the
oral cavity), all cardiovascular diseases (including ischemic heart disease and hypertension),
respiratory diseases and diseases of the oesophagus (which includes stomach ulcers). We
also disregard general health measures such as self-assessed health, body mass index and a
number of variables describing the ability to walk or climb stairs, which could be caused by
smoking. While it is easy to exclude well researched diseases such as cancers and cardiovas-
cular problems, some diseases are more difficult to classify. It may be that no link is known
because the medical profession has not yet established a link between smoking and morbid-
ity or mortality. Furthermore, drawing the line between diseases is also made more difficult
given the frequent confusion in the literature between correlation and causation. We adopt
a conservative position and include only diseases for which it is established that they are not
caused by smoking. The other two proxies we use, NSH2 and NSH3, respectively contain
information about 19 and 29 health conditions; they are constructed with the factor analysis
discussed above and selecting only the relevant diseases (cf table 2 for the list of conditions
included). We rank the individual’s NSH within age groups (using 10 years bands) to con-
trol for cohort effects and we classify individuals who are in the lowest 25 percent quantile as
being in good non smoking health. Similarly, we classify individuals in the upper 25 percent
quantile as being in poor non smoking health. Without loss of generality, each of the health
proxies has been normalized between 0 (for the individual with best health) and 100 (worst
caused by the individual’s smoking.
14

health).16
To check whether the health proxies are correlated with subsequent mortality, we esti-
mate the effect of being in poor versus good NSH on the duration to death using a Cox
proportional hazard model. The results are displayed in Table 3. The hazard ratio for poor
health compared to good health is equal to 1.26 for NSH3, 1.16 for NSH2 and 1.09 for
NSH1. The three hazard ratios are statistically significant at the conventional 5 percent
level. This indicates that the probability to die, conditional on having survived up to the
date considered, is at all duration higher for individuals whose health is worse as measured
by the proxy. All three proxies predict mortality, although not surprisingly, the effect is
stronger the more health conditions are included.
Before we consider selection into smoking, we provide evidence that the variation in
health captured by the proxies is not caused by smoking behaviour.
Absence of causation from smoking to NSH proxy
To be valid proxies for NSH, the proxies must not be caused by smoking. For NSH2 and
NSH3, in order to establish that this is the case, we investigate the extent to which the
change in the proxies is related to smoking. If we found that the value of the proxies changes
with quantities smoked or duration of the habit, one would be suspicious that some of the
morbidity indicators used to construct the proxies might be causally related to smoking.
We therefore check that this is not the case. Cross-sectional regressions of these proxies on
smoking status may be biased because of selection, as argued above, so exploiting panel data
is important, allowing to eliminate individual fixed effects. Our dataset contains a smaller
number of individuals who are followed across waves, eight years apart. This long time span
ensures that we have variation in smoking status and allows investigating long run trends in
health. We postulate an evolution of the proxy for individual i of age t as:
NSHproxyit = a0i + a1Sit + a2Xit + eit, (5)
16Regarding height adjusted for sex and cohort (Proxy1), high values of the proxy correspond to short
height (adjusted for sex and cohort) and vice-versa.
15

where a0i is an individual fixed effect capturing fixed differences across individuals such as
gender or education but also unobserved individual traits correlated both with health and
smoking. We denote by Sit a variable capturing different dimensions of smoking (smoking
status, duration of habit, quantities...) and by Xit other characteristics that may influence
the evolution of the proxy. We focus on the parameter a1 which captures differential effects
for smokers. We estimate (5) in first differences to eliminate the fixed effect. We cannot
use NSH1 as height is a fixed characteristic of the individual and we address the issue of
reverse causality for this proxy in a different way which is detailed below. The results are
displayed in Table 4. The first panel shows the effect of quantities smoked on the proxy.
The point estimates are small and never significant. The results are similar when we look
at the duration of habit in the second panel. The third panel uses an indicator variable for
ever smoking (fixed at individual level) interacted with age. It captures differential trends
in the health proxies for individual who are smokers or have smoked. There is no evidence
that the NSHproxy of smokers deteriorates faster than that of individuals who have never
smoked, even for individuals older than 40. We conclude from these results that the proxies
are picking up health problems not caused by smoking.
The strategy for checking the absence of reverse causality with our proxy NSH1 (ad-
justed adult height) is different as it is constant over time. We checked the epidemiology
literature on links between smoking and growth. The literature produces mixed evidence
on this link (see Rona et al. (1985) or Fried et al. (1999)), and there is an issue of estab-
lishing causality based on observational data. Wilkins et al. (1982) show using an exper-
imental set up that nicotine increases circulating levels of growth hormone. To assess the
robustness of our results, we also restricted our sample to individuals who started smok-
ing after reaching adult height, taken to be 16 for girls and 17 for boys (see for instance
http://www.cdc.gov/growthcharts). Although this sample selection leaves out a number of
individuals from the analysis, we got similar results. 17
17Results available upon request. We also show in table 8 that for the older cohort, smokers are actually
taller than non smokers. Assuming that smoking inception has remained the same for the different cohorts,
16

V Determinants of smoking
We first present results relating smoking to individual characteristics. We then turn to the
evidence of selection into smoking. We finally show that selection is greater for younger
cohorts.
Smoking and individual characteristics
We first examine the relationship between individual characteristics and smoking, where
smoking is captured in three dimensions: smoking status, smoking intensity, and duration
of the smoking habit. Smoking status is the probability to be a smoker, current or former.
The sample size is 28069 individuals, of which about 13560 current or former smokers.
Among current smokers, we contrast heavy smokers (who consume more than 20 cigarettes
per day) and other smokers. Although there are about 13560 current and former smokers,
quantities smoked are recorded only for current smokers, of which 1375 are heavy smokers.
The results are displayed in the first column of Tables 5 to 7. For the probability to
smoke, the probability to be a heavy smoker and the duration of the smoking habit, each
table displays marginal effects and robust standard errors. Smoking is related to education
levels, a polynomial in age, sex (1 is male), risk taking behaviors and log income. Risk is
a binary variable that takes the value of one if the individual works in a risky occupation.
Moderate alcohol indicates that the individual consumes between zero and 0.1 litres of pure
alcohol per week. The omitted category represents a consumption in excess of 0.1 liter per
week. Less than 20 percent of individuals in our sample are categorized as heavy drinkers.
The effects are qualitatively similar to those obtained in other studies of the determinants
of smoking. Table 5, column (1) displays the results for the determinants of ever smoking.
About half our sample are smokers or former smokers, but this proportion decreases with the
number of years of education. Men and older individuals are more likely to have smoked. In-
dividuals in risky occupation, consumers of other tobacco product (snus) and heavy drinkers
are also more likely to smoke or have smoked. Finally, income is positively associated with
this provides indirect evidence of the validity of using height to proxy for NSH.
17
smoking or having smoked. A doubling of income increases the prevalence by about four
percentage points.18
Table 6, column (1) displays the determinants of heavy smoking, defined as smoking a
pack a day or more. The prevalence of heavy smoking is about five percent in Sweden.
Heavy smoking is more prevalent among older individuals, males, heavy drinkers and richer
individuals.
Table 7, column (1) displays the determinants of the duration of smoking. We estimate
a Cox model of the duration until quitting and we report the marginal effect on the hazard
of quitting. On average, the hazard is equal to 0.745. More educated individuals are more
likely to abandon the habit. We do not find any significant differences between men and
women. Individuals in risky occupations or consuming snus are less likely to quit.
To summarize, we find that higher educated individuals are less likely to smoke, whereas
individuals who engage in risky behavior are more likely to smoke and less likely to give up
smoking. This is in accordance with previous findings in the literature (see Chaloupka and
Warner (2000)). These results form the benchmark for what follows, where we investigate
whether smoking is affected by the individuals background health, given all the characteris-
tics we already control for.
Selection into smoking
Table 5, columns (2) to (4) relate the probability to smoke to individual characteristics
including non smoking health, using the three NSH proxies defined above. Poor health
is defined as being in the lower quarter of the distribution of NSH (within an age group).
Medium health indicates that the individual’s NSH lies between the lower and upper quarter
of the distribution. Note first that introducing the additional health proxies does not change
substantially the effects of the other explanatory variables. Using NSH1, the crudest of hte
three proxies (column (2)), we cannot find evidence that individuals in poorer health are
18The relationship between income and the smoking appears to be best captured by controlling for the log
of income.
18

more likely to smoke or have smoked. Using NSH2or NSH3, however, it appears that the
probability to be a smoker (current or former) is about three percentage point higher among
individuals in poorer health (or 6 percent higher, given that 50 percent of the population is
or has been a smoker). Compared to the effect of education, the magnitude of being in poor
health is equivalent to the difference associated with almost four years of education. Note
that the difference is small as compared to that existing between men and women, with men
more likely to be ever smokers. Having a risky job, consuming snus and alcohol are also
associated with a higher probability to be a smoker.
Similarly, in Table 6, columns (2) to (4), individuals in poorer health are more likely
to be heavy smokers. Here the effect of being in poor health is, ceteris paribus, about two
percentage points, but since the prevalence of heavy smoking is only about 5 percent, the
effect is, in comparison with ever smoking, much larger, as it corresponds to an almost 50
percent increase, as opposed to a 6 percent percent increase in the case of the probability to
be a smoker.
Finally, Table 7 displays the effect of health on the duration of smoking. Individuals
in poor health are less likely to quit smoking. The hazard of quitting for individuals in
poor health is between 0.12 to 0.20 points lower than for individuals in good health (the
average hazard of quitting is 0.75). Here, again, the effect is equivalent to about two years
of education.
Interestingly, the epidemiological literature often finds significant beneficial effects of
quitting smoking (see for instance Doll and Hill (1956), Hammond and Horn (1958), Doll
and Peto (1976), Kawachi et al. (1993), Kawachi et al. (1997), Hrubec and McLaughlin
(1997)). The results presented here do not dispute the fact that quitting may result in
lower rates of lung cancers or any other tobacco related diseases. But they indicate that the
overall benefit of quitting smoking is probably somewhat lower than what has been indicated
in the literature, given that these studies do not control for the background health of the
individuals.
19

The results presented above show evidence of selection into smoking based on health. We
find consistent evidence across many dimension of smoking. We also find remarkably similar
results across the three different NSH proxies we constructed. Not surprisingly, the effects
are somewhat stronger and more precise for the health proxies which contain more health
outcomes. We will now turn to the evidence of the pattern of selection for different cohorts.
Selection and cohort effects
So far, we presented the evidence of selection for individuals of all ages. The oldest individuals
in the sample are born before 1900, so that they reach adulthood at a time when information
on the effect of smoking was non existent. If the selection mechanism involves a choice of
smoking based on the individual’s health and available health information, it would be
surprising to find a correlation between tobacco-free health and the use of tobacco for those
birth cohorts. For younger groups of smokers, we would expect selection to be present. We
will show that it is the case that selection is present for the younger but not for the older
cohorts.
Figure 1 displays the excess poor health (using NSH3) for smokers (current and former)
compared to never smokers, by cohort. The graph tracks several cohorts as they age. The
youngest cohort is born around 1977 and is about nineteen years old in the last wave, so
we only observe this group once. The oldest cohort is born around 1905 and there are no
individuals from this group in the last wave of the survey. The other cohorts are followed
over the three waves. For the cohort born around 1977, the average NSH score is about
24 percent higher for smokers than for non smokers, which indicates that young smoking
individuals are in poorer health. Those born around 1969 have an average NSH about 14
percent worse than non smokers of the same birth cohort. As we look into older cohorts,
the difference in NSH between smokers and non smokers disappears. In fact for the very
oldest, smokers are in better health than non-smokers. This last fact can be interpreted in
two ways: a healthy survivor effect or an inverse selection. In the first case, smokers who are
still alive at an old age may be of better background health than non smokers. In the latter
20

case, it may be that smokers born in the beginning of the twentieth century were drawn from
a better health population. In that period, mostly affluent and well-off people (who are also
in better health) smoked. 19 This evidence is in agreement with the findings of Fertig (2006)
using UK data.
To further document the relationship between selection and cohort effects, in Table 8,
we examine the relation between the probability to be a smoker and NSH for different birth
cohorts. The table displays the marginal effects of being in poor NSH as opposed to good
NSH, controlling for sex, education level, interview year effects and risk taking behaviors
(on the job risk, snus consumption, alcohol consumption). The explanatory variables are
all interacted with birth cohort. We group individuals by year of birth into three groups,
those born before 1950, those born between 1950 and 1969 and those born after 1970. The
first group would not have been informed about the link between smoking and health, at
least when they started smoking. The second and third group have been exposed to media
coverage about the effect of smoking on health, with increasing intensity.
The first panel of Table 8 shows that poor NSH is a significant determinant of ever
smoking only for the latest cohort. Depending on the health proxy we use, the probability
to be a smoker is between seven and ten percentage points higher for poor NSH individuals.
The second panel displays the results for heavy smoking. In contrast to the previous results,
there are no clear differences between birth cohorts.
The third panel reports the results for the duration of the habit. Individuals in poor
NSH, born between 1950 and 1970 are less likely to quit smoking, whereas we do not find
that effect for those born before 1950. For the later cohort, the results are not precise or
stable. This is expected as these individuals are at most 27 years old in the last wave of the
survey, and very few smokers would have stopped at such a young age.
Overall, the results provide evidence that there is a significant correlation between smok-
ing and NSH, except for older individuals, even when one controls for other risky behaviors. 20
19This effect is clearly apparent for both Proxy3 and Proxy2 and to a lesser extent for Proxy1. It is also
robust to the adjustment for sex and education.20The fact that there is a higher correlation between poor NSH and smoking in young individuals is further
21
This pattern seems to indicate that the selection based on health started when information
on the health effect of cigarettes was released. Those with the best health may have decided
that smoking was not worth the risk, so that prevalence among this group decreases through
time. 21 The results are not significant for heavy smoking or for duration because both
variables capture aspects of current smoking.
These findings have two important consequences for the measurement of the effect of
tobacco on health. Firstly, note that studies which investigate the effect of smoking on
mortality rely mainly on elderly individuals for identification (as individuals who die are
essentially drawn from the eldest cohorts of both smokers and non smokers), and we have
seen that this is a population for which there is a minimal selection bias. This means that
previous epidemiology studies probably do not miss much by ignoring selection on the basis
of non smoking health. The second consequence is that, as time passes, the gain from
preventing a smoker from smoking will decrease. With time, epidemiological studies will
conclude to a worsening effect of tobacco on health, when what is happening is increased
selection. Indeed, from 2010-2020 onwards, the generations born in the nineteen fifties and
nineteen sixties will start to face an increased likelihood of death and studies that use data
on mortality and smoking alone will spuriously reveal a worsening effect of tobacco, as these
studies will increasingly compare smokers with poor non smoking health with non smokers
in better non smoking health.
Next section investigates the effect of tobacco on mortality with these caveat in mind.
evidence that the tobacco-free proxies do not contain some illness related to tobacco. If the proxies were
contaminated by illnesses caused by tobacco, the estimated effect of the proxy on smoking would be stronger
as age increases, since older smokers are more likely to develop tobacco-related diseases as they have been
exposed to tobacco for a longer period.21Viscusi (1990), Kenkel (1991) and Antonanzas et al. (2000) show that smokers are aware of the risks
associated with smoking, and sometimes over-estimate the risks.
22

VI The effect of tobacco on mortality
In this section, we present estimates of the number of years of life lost by smoking when
health based selection is accounted for.
We have shown in section V that smokers are more likely to be drawn from a population
with worse smoke-free health status. We have also shown (in section IV) that smoke-free
health status, as measured by the proxies, is correlated with subsequent mortality, which
implies that comparing the life expectancy of smokers to that of non smokers will not give an
accurate measure of the effect of smoking on mortality. This is true even when conditioning
on usual observed characteristics such as sex, education levels and even other risk taking
behaviors. The correct way to proceed is to compare the life expectancy of individuals,
smokers and non smokers, who would have the same life expectancy if they did not smoke.
This is what we propose to do using the smoke-free morbidity proxies, which are constructed
to capture the health of the individual independently from smoking. It is possible to do this
because we have shown that smoke-free morbidity proxies do not appear to be caused by
tobacco and therefore constitute valid proxies for smoke-free health status.
We estimate duration models to death, using a Weibull distribution. It allows the mor-
tality rate to be a power function of age and is commonly used in the context of analyzing
time to death. We use as covariates, indicator variables for education levels, for non smoking
health levels, an indicator variable for smoking (or heavy smoking in some specification) as
well as interaction terms between these variables, to capture non proportional effects. We
concentrate on males only. The results for women are not robust given the smaller number
of women smoking and observed dying.
Using the estimated survivor functions from these models, we compute the median life
expectancy of smokers and non smokers, as well as the loss of life expectancy due to tobacco.
The results are displayed in Table 9, where we display the life expectancy of non smokers,
of smokers and of heavy smokers. The last two columns present the loss in life expectancy
due to smoking or to heavy smoking (defined as a pack a day or more). The first panel does
not control for non-smoking health, whereas the second panel includes our proxy (proxy3)
23

in the regressions. We also display the results by education or health group to illustrate the
heterogeneity in the effect of tobacco. The first line of the Table shows that smoking leads
to a loss of 3.4 years, and that heavy smokers lose 8.3 years of life expectancy. Comparing
the first row of each panel, one can note the effect of including health as a covariate has
a minimal effect. As discussed in the previous section, there is only limited selection into
smoking for the birth cohorts for which we observe deaths. The next three rows of the
first panel shows the heterogeneity across education groups. Life expectancy is increasing
in education for non smokers, and weakly so for smokers. Life expectancy is only weakly
associated with education for heavy smokers. As a result, the loss of life expectancy from
smoking is increasing with education. It varies from 3 years for low educated individuals to
3.4 years for individuals in the highest education group. The effect is more dramatic when
we look at heavy smokers, where loss of life expectancy varies from 7.3 to 10.1 years.
Turning now to the results where we control for health, we see that at all levels of
education, the loss in life expectancy is greater for individuals whose NSH is better. The
loss ranges from only 2.3 years for the low educated and poor health group, to 5.2 for the
most advantaged group. The loss from heavy smoking follow the same pattern, ranging from
5.6 years to about 10 years.
These results give an indication of how selection in younger cohorts will affect the esti-
mation of the effect of smoking on mortality when these cohorts face a higher likelihood of
death. Note that we are able to capture differences in the parameters for good and poor
health individuals because we are exploiting data from all age groups, so that even though
there are few deaths among the younger cohorts, and little selection among the older cohorts,
put together, there is enough variation that differences can be made apparent.
These results may offer an explanation for differences in smoking behavior across edu-
cation groups, and, more tentatively, to the long-run decline in smoking as life expectancy
increases. It also means that the selection effect will have some consequences on policies
which try to reduce smoking prevalence. The effect of tobacco on mortality estimated on a
population born at the beginning of the twentieth century will be misleading to predict the
24

benefit of not smoking for a younger population. The real gain from not smoking will be
declining over time due to the increased selection.
VII Conclusion
This paper considers the effect of tobacco on mortality allowing smoking to be endogenous.
If smoking and background health are correlated, most estimates found in the literature are
biased. We discuss the identification of the effect of tobacco allowing for endogeneity and we
propose a way to get a consistent estimate of this effect under weaker assumptions than are
usually made in this literature. Our approach is to use a proxy for the unobservable element
which causes the endogeneity bias. We use extensive data on date of death and morbidity,
together with a model of duration to death to obtain estimates of the effect of tobacco on
health which correct for health based selection. Our main findings are:
• There is evidence of selection into smoking. Everything else being equal, smokers come
from a population in poorer health independently from smoking than non smokers.
In other words, individuals with shorter potential life expectancy smoke more than
individuals with longer potential life expectancy.
• The effect of smoking on life expectancy differs by types of individuals, with individuals
with longer potential expectancy having more to loose in terms of years of life by
smoking. The variation in terms of years of life lost is quite important, going from
three to over seven years.
• This implies that the gains from reducing smoking are not as large as they would
be thought to be without accounting for selection into smoking, given that health
influences potential life expectancy. Moreover, because of the increased selection of
smokers, the gains will decrease over time.
• There is a strong cohort effect. The selection effect is important for the cohorts who
started smoking when the information on the effect of tobacco on health was widely
25
publicized, but not so much for previous cohorts. Previous studies have found that
smokers are forward looking and understand the risks linked with smoking (see Viscusi
(1990), Antonanzas et al. (2000) or Khwaja et al. (2007)).
• The existence of the cohort effect means that the results obtained in the past by
epidemiological studies are not far off the mark for the generations considered but that
future studies comparing smokers and non smokers will spuriously reveal a worsening
effect of tobacco on health if they fail to control for selection.
A number of factors could explain a correlation between smoking choices and mortality,
above the sheer medical effect. For instance, both mortality and smoking decision could be
influenced by other factors such as stress, neighborhood effects or social norms. It is also
possible that smoking and mortality are linked through a trade-off between smoking and
longer life expectancy. In this trade-off, individuals with longer potential life expectancy
might have incentives to smoke less. Finally, smokers and non smokers may have different
discount factors. Whatever the reasons, it is important to try to separate out the true effect
of tobacco from the selection effect, which is what we do here. Future work will examine the
question of the structural mechanisms which can lead to the observed evidence.
References
Abrevaya, J. (2006). “Estimating The Effect Of Smoking On Birth Outcomes Using A MatchedPanel Data Approach.” Journal of Applied Econometrics, 21(4), 489–519.
Adda, J. and F. Cornaglia (2006). “Taxes, Cigarette Consumption and Smoking Intensity.”American Economic Review , 96(4), 1013–1028.
Almond, D., K. Chay, and D. Lee (2005). “The Costs Of Low Birth Weight.” QuarterlyJournal of Economics, 120(3), 1031–1083.
Antonanzas, F., W. K. Viscusi, J. Rovira, F. J. Braa, F. Portillo, and I. Carvalho(2000). “Smoking Risks in Spain: Part I Perception of Risks to the Smoker.” Journal of Riskand Uncertainty , 21(2/3), 161–186.
Auld, C. (2005). “Smoking, Drinking and Income.” Journal of Human Resources, 40(2), 505–518.
Balia, S. and A. Jones (2004). “Mortality, Lifestyle and Socio-Economic Status.” working paper2004/16, University of York.
26
Barsky, R. B., F. T. Juster, M. S. Kimball, and M. D. Shapiro (1997). “Preference Param-eters and Behavioral Heterogeneity: An Experimental Approach in the Health and RetirementStudy.” The Quarterly Journal of Economics, 112, 537–579.
Chaloupka, F. J. and K. E. Warner (2000). “The Economics of Smoking.” In Handbook ofHealth Economics, edited by J. Newhouse and A. Cuyler.
Contoyannis, P. and A. Jones (2004). “Socio-Economic Status, Health and Life-Style.” Journalof Health Economics, 23(5), 965–995.
Currie, J. (2009). “Healthy, Wealthy, and Wise? Socioeconmic Status, Poor Health in Childhood,and Human Capital Devleopment.” Journal of Economic Literature, 47(1), 87–122.
de Walque, D. (2004). “Education, information and smoking decisions: evidence from smokinghistories, 1940-2000.”
Dohmen, T., A. Falk, D. Huffman, U. Sunde, J. Schupp, and G. Wagner (2011). “Indi-vidual Risk Attitudes: Measurement, Determinants, and Behavioral Consequences.” Journal ofthe European Economic Association, pages 1542–4774.
Doll, R. and A. B. Hill (1956). “Lung Cancer and Other Causes of Death in Relation toSmoking. A Second Report on the Mortality of British Doctors.” British Medical Journal , ii,1071–1076.
Doll, R. and R. Peto (1976). “Mortality in Relation to Smoking: 20 years’ Observations onMale British Doctors.” British Medical Journal , ii, 1525–1536.
Evans, W. and J. Ringel (1999). “Can Higher Cigarette Taxes Improve Birth Outcomes?”Journal of Public Economics, 72(1), 135–154.
Farrell, P. and V. Fuchs (1982). “Schooling and Health: the Cigarette Connection.” Journalof Health Economics, 1, 217–230.
Fertig, A. (2010). “Selection and the Effect of Prenatal Smoking.” Health Economics, 19, 209–226.
Fried, P. A., B. Watkinsona, and R. Graya (1999). “Growth from Birth to Early Adolescencein Offspring Prenatally Exposed to Cigarettes and Marijuana.” Neurotoxicology and Teratology ,21, 513–525.
Hammond, E. C. and D. Horn (1958). “Smoking And Death Rates. Part I. Total Mortality.Part II. Death Rates By Cause.” Journal of the American Medical Association, 166, 1159–1172.
Hersch, J. (1996). “Smoking, Seat Belts and Other Risky Consumer Decisions: Differences byGender and Race.” Managerial and Decision Economics, 17, 471–481.
Hrubec, Z. and J. K. McLaughlin (1997). “Former Cigarette Smoking and Mortality AmongVeterans: A 26-Year Followup, 1954 to 1980.” In Monograph 8: Changes in Cigarette-RelatedDisease Risks and Their Implications for Prevention and Control , volume 8 of Smoking andTobacco Control Monographs, chapter 7, pages 501–529. National Cancer Institute.
27
Hurd, M., D. MacFadden, and A. Merrill (2001). “Predictions of Mortality Among theElderly.” In Themes in the Economics of Aging , edited by D. Wise, pages 171–197. Universityof Chicago Press.
Hurd, M. D. and K. McGarry (1995). “Evaluation of the Subjective Probabilities of Survivalin the Health and Retirement Study.” Journal of Human Ressources, 30(0), S268–292.
Hurd, M. D. and K. McGarry (2002). “The Predictive Validity Of Subjective Probabilities OfSurvival.” Economic Journal , 112(482), 966–985.
Kawachi, I., G. A. Colditz, M. J. Stampfer, W. C. Willet, J. E. Manson, B. Rosner,D. J. Hunter, C. H. Hennekens, and F. E. Speizer (1993). “Smoking Cessation In RelationTo Total Mortality Rates In Women. A Prospective Cohort Study.” Annals of Internal Medicine,119, 992–1000.
Kawachi, I., G. A. Colditz, M. J. Stampfer, W. C. Willett, J. E. Manson, B. Rosner,D. J. Hunter, C. H. Hennekens, and F. E. Speizer (1997). “Smoking Cessation and De-creased Risks Of Total Mortality, Stroke, and Coronary Heart Disease Incidence Among Women:A Prospective Cohort Study.” In Monograph 8: Changes in Cigarette-Related Disease Risksand Their Implications for Prevention and Control , edited by D. M. Burns, L. Garfinkel, andJ. M. Samet, volume 8 of Smoking and Tobacco Control Monographs, chapter 8, pages 531–565.National Cancer Institute.
Kenkel, D. S. (1991). “Health Behavior, Health Knowledge, and Schooling.” Journal of PoliticalEconomy , 99(2), 287–305.
Khwaja, A., F. Sloan, and S. Chung (2007). “The Relationship Between Individual Expecta-tions and Behaviors: Mortality Expectations and Smoking Decisions.” forthcoming, Journal ofRisk and Uncertainty.
Lahiri, K. and J. G. Song (2000). “The effect of smoking on health using a sequential self-selection model.” Health Economics, 9(6), 491–511.
Lien, D. S. and W. N. Evans (2005). “Estimating the Impact of Large Cigarette Tax Hikes:The Case of Maternal Smoking and Infant Birth Weight.” Journal of Human Resources, 40(2),373–392.
Ong, K., M. Preece, P. Emmett, M. Ahmed, and D. Dunger (2002). “Size At Birth AndEarly Childhood Growth In Relation To Maternal Smoking, Parity And Infant Breast-Feeding:Longitudinal Birth Cohort Study And Analysis.” Pediatric Research, 52(6), 863–867.
Rona, R. J., S. Chinn, and C. D. Florey (1985). “Exposure to cigarette smoking and childrensgrowth.” International Journal of Epidemiology , 14, 402409.
Rosenzweig, M. and P. Schultz (1983). “Estimating a Household Production Function: Het-erogeneity, the Demand for Health Inputs, and Their Effects on Birth Weight.” JPE , 91(5),723–746.
Steckel, R. H. (1995). “Stature and the Standard of Living.” Journal of Economic Literature,33, 1903–1940.
28

Viscusi, W. K. (1990). “Do Smokers Underestimate Risks?” Journal of Political Economy , 98(6),1253–1269.
Wickens, M. (1972). “A note on the Use of Proxy Variables.” Econometrica, 40, 759–761.
Wilkins, J. N., H. E. Carlson, H. Van Vunakis, M. A. Hill, E. Gritz, and M. E. Jarvik(1982). “Nicotine from Cigarette Smoking Increases Circulating Levels of Cortisol, GrowthHormone, and Prolactin in Male Chronic Smokers.” Psychopharmacology , 78, 305– 308.
Figure 1: Excess Poor Health in Smokers Compared to Never Smokers, by Age and Year of
Birth
19051905
1920
19201920
1938 1938
1938
19501950
19501960
1960
1960
19691969
1977
.91
1.1
1.2
1.3
Exc
ess
Poo
r (T
obac
co−
Fre
e) H
ealth
in S
mok
ers
15 30 45 60 75 90Age
Year of birth indicated on the graph
29
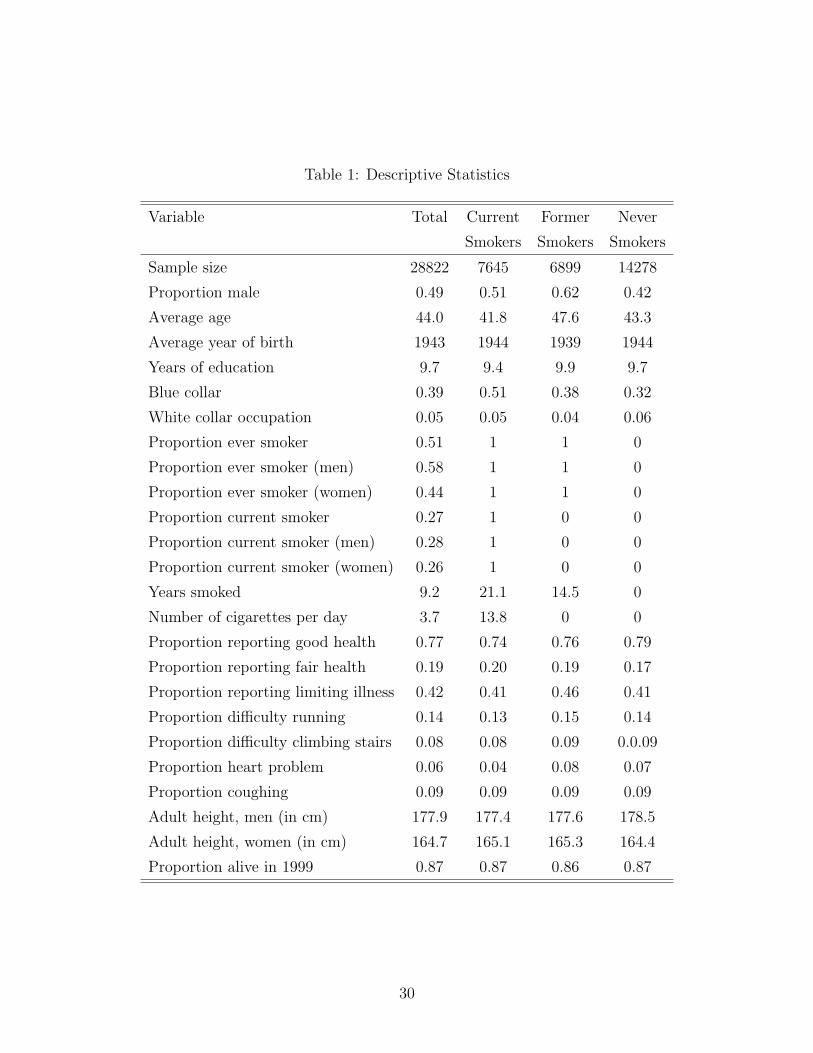
Table 1: Descriptive Statistics
Variable Total Current Former Never
Smokers Smokers Smokers
Sample size 28822 7645 6899 14278
Proportion male 0.49 0.51 0.62 0.42
Average age 44.0 41.8 47.6 43.3
Average year of birth 1943 1944 1939 1944
Years of education 9.7 9.4 9.9 9.7
Blue collar 0.39 0.51 0.38 0.32
White collar occupation 0.05 0.05 0.04 0.06
Proportion ever smoker 0.51 1 1 0
Proportion ever smoker (men) 0.58 1 1 0
Proportion ever smoker (women) 0.44 1 1 0
Proportion current smoker 0.27 1 0 0
Proportion current smoker (men) 0.28 1 0 0
Proportion current smoker (women) 0.26 1 0 0
Years smoked 9.2 21.1 14.5 0
Number of cigarettes per day 3.7 13.8 0 0
Proportion reporting good health 0.77 0.74 0.76 0.79
Proportion reporting fair health 0.19 0.20 0.19 0.17
Proportion reporting limiting illness 0.42 0.41 0.46 0.41
Proportion difficulty running 0.14 0.13 0.15 0.14
Proportion difficulty climbing stairs 0.08 0.08 0.09 0.0.09
Proportion heart problem 0.06 0.04 0.08 0.07
Proportion coughing 0.09 0.09 0.09 0.09
Adult height, men (in cm) 177.9 177.4 177.6 178.5
Adult height, women (in cm) 164.7 165.1 165.3 164.4
Proportion alive in 1999 0.87 0.87 0.86 0.87
30

A Appendix: Bias Reduction with a Proxy Variable
Age at death, T is related to individual characteristics X, including smoking behaviour S, and
to the individual’s unobserved non smoking health NSH, and to a random shock u. Assume
further that individuals select into smoking on the basis of health, so that cov(S,NSH) 6= 0.
Assume an additive structure to the problem22:
T = Xβ +NSHγ + u︸ ︷︷ ︸, (6)
unobserved
where NSH is not observed, but a proxy for it, NSHproxy is observed, and the relationship
between NSH and NSHproxy is given by: NSHproxy = NSHθ + e, with cov(e,NSH) = 0.
If we estimate the equation omitting the proxy, we have: T = Xb2 + v, so that
p lim(b2 − β
)= γM−1
xx MXT
where MAB = p limA′B. If we estimate the equation conditioning on the proxy, we have:
T = Xb3 +NSHproxyδ + µ,
so that
p lim(b3 − β
)=
σ2e
σ2e + θ2(1−R2
TX)MTT
p lim(b2 − β
)≤ p lim
(b2 − β
),
where R2TX is the correlation coefficient of the regression of T on X.
If the proxy is in fact caused by smoking, then
NSHproxy = NSHθ + Sα + w,
and in this case
p lim(b3 − β
)=
σ2e
σ2e + θ2(1−R2
TX)MTT
(p lim
(b2 − β
)+ αδ
),
and the comparison of the asymptotic biases arising when omitting the proxy as opposed to
conditioning on the proxy depends on the particular values of the parameters.
22We estimate a model of duration to death under an index restriction so that T = exp(Zγ),
and the argument above regarding the use of the proxy for a linearly additive model applies
to log(T ).
31
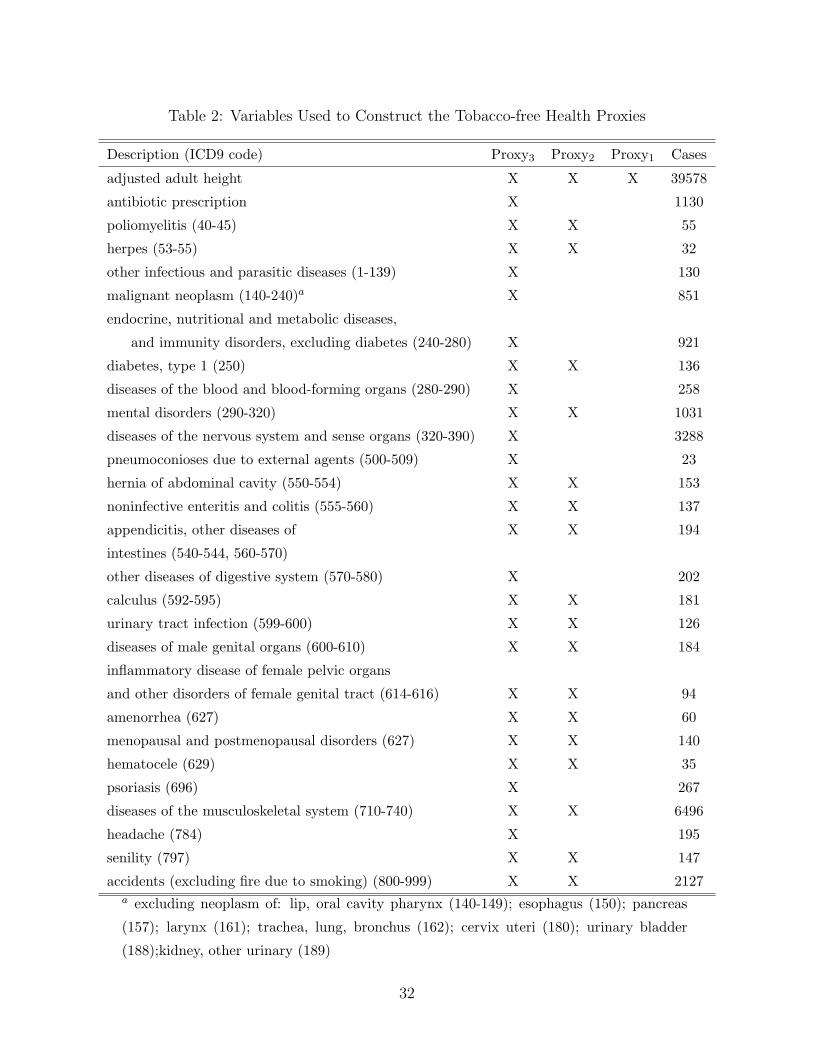
Table 2: Variables Used to Construct the Tobacco-free Health Proxies
Description (ICD9 code) Proxy3 Proxy2 Proxy1 Cases
adjusted adult height X X X 39578
antibiotic prescription X 1130
poliomyelitis (40-45) X X 55
herpes (53-55) X X 32
other infectious and parasitic diseases (1-139) X 130
malignant neoplasm (140-240)a X 851
endocrine, nutritional and metabolic diseases,
and immunity disorders, excluding diabetes (240-280) X 921
diabetes, type 1 (250) X X 136
diseases of the blood and blood-forming organs (280-290) X 258
mental disorders (290-320) X X 1031
diseases of the nervous system and sense organs (320-390) X 3288
pneumoconioses due to external agents (500-509) X 23
hernia of abdominal cavity (550-554) X X 153
noninfective enteritis and colitis (555-560) X X 137
appendicitis, other diseases of X X 194
intestines (540-544, 560-570)
other diseases of digestive system (570-580) X 202
calculus (592-595) X X 181
urinary tract infection (599-600) X X 126
diseases of male genital organs (600-610) X X 184
inflammatory disease of female pelvic organs
and other disorders of female genital tract (614-616) X X 94
amenorrhea (627) X X 60
menopausal and postmenopausal disorders (627) X X 140
hematocele (629) X X 35
psoriasis (696) X 267
diseases of the musculoskeletal system (710-740) X X 6496
headache (784) X 195
senility (797) X X 147
accidents (excluding fire due to smoking) (800-999) X X 2127a excluding neoplasm of: lip, oral cavity pharynx (140-149); esophagus (150); pancreas
(157); larynx (161); trachea, lung, bronchus (162); cervix uteri (180); urinary bladder
(188);kidney, other urinary (189)
32

Table 3: Hazard of Death and Tobacco-free Morbidity Proxies
Proxy1 Proxy2 Proxy3
Poor health 1.09** 1.16** 1.26**
95% CI [1.01,1.17] [1.08, 1.26] [1.17,1.36]
Medium health 1.03 1.03 1.10**
95% CI [0.96,1.10] [0.97, 1.10] [1.03,1.18]
Number of observations 28708
Number of deaths 5076Note: Regressions stratified by sex, education level and group of year of birth.
Robust standard errors were computed. ** significant at 5 percent level. Poor
health indicates health proxy is in lower quarter of distribution within age
group. Medium health indicates that health proxy is between the 25th and
75th quantile within age group.
Table 4: Changes in Tobacco-free Morbidity and Smoking
Proxy3 Proxy2 Number
of Obs.
Effect of Quantities Smoked, Conditional on Smoking
All Ages .025 (.03) 0.01 (0.03) 4578
Age>40 .024 (.04) 0.01 (0.04) 3095
Effect of Duration of Habit, Conditional on Ever Smoker
All Ages 0.025 (0.024) 0.037 (0.025) 2544
Age>40 0.005 (0.026) 0.019 (0.026) 1823
Smokers (current and former) compared to Never Smokers
All Ages 0.34 (0.26) 0.21 (0.18) 4578
Age>40 0.33 (0.25) 0.34 (0.33) 3095
Note: Robust standard errors clustered by individuals are dis-
played. Regressions control for age, sex, education levels, income,
risk taking behavior, snus consumption and alcohol consumption.
33
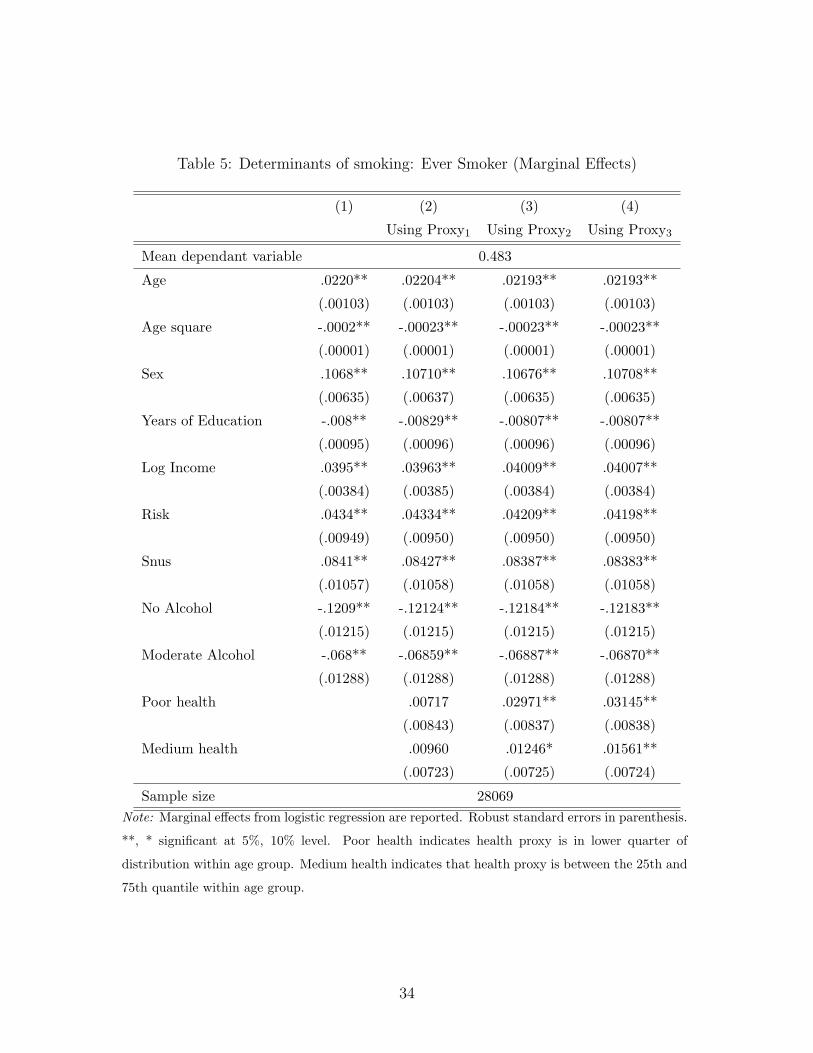
Table 5: Determinants of smoking: Ever Smoker (Marginal Effects)
(1) (2) (3) (4)
Using Proxy1 Using Proxy2 Using Proxy3
Mean dependant variable 0.483
Age .0220** .02204** .02193** .02193**
(.00103) (.00103) (.00103) (.00103)
Age square -.0002** -.00023** -.00023** -.00023**
(.00001) (.00001) (.00001) (.00001)
Sex .1068** .10710** .10676** .10708**
(.00635) (.00637) (.00635) (.00635)
Years of Education -.008** -.00829** -.00807** -.00807**
(.00095) (.00096) (.00096) (.00096)
Log Income .0395** .03963** .04009** .04007**
(.00384) (.00385) (.00384) (.00384)
Risk .0434** .04334** .04209** .04198**
(.00949) (.00950) (.00950) (.00950)
Snus .0841** .08427** .08387** .08383**
(.01057) (.01058) (.01058) (.01058)
No Alcohol -.1209** -.12124** -.12184** -.12183**
(.01215) (.01215) (.01215) (.01215)
Moderate Alcohol -.068** -.06859** -.06887** -.06870**
(.01288) (.01288) (.01288) (.01288)
Poor health .00717 .02971** .03145**
(.00843) (.00837) (.00838)
Medium health .00960 .01246* .01561**
(.00723) (.00725) (.00724)
Sample size 28069Note: Marginal effects from logistic regression are reported. Robust standard errors in parenthesis.
**, * significant at 5%, 10% level. Poor health indicates health proxy is in lower quarter of
distribution within age group. Medium health indicates that health proxy is between the 25th and
75th quantile within age group.
34
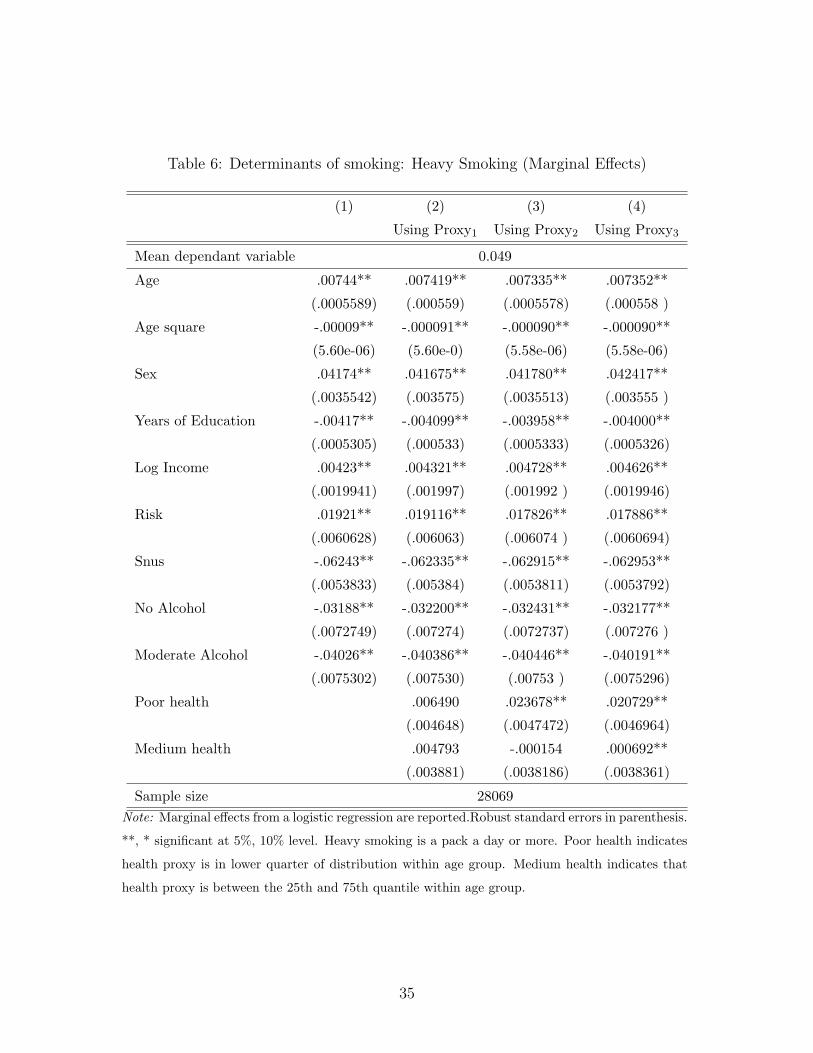
Table 6: Determinants of smoking: Heavy Smoking (Marginal Effects)
(1) (2) (3) (4)
Using Proxy1 Using Proxy2 Using Proxy3
Mean dependant variable 0.049
Age .00744** .007419** .007335** .007352**
(.0005589) (.000559) (.0005578) (.000558 )
Age square -.00009** -.000091** -.000090** -.000090**
(5.60e-06) (5.60e-0) (5.58e-06) (5.58e-06)
Sex .04174** .041675** .041780** .042417**
(.0035542) (.003575) (.0035513) (.003555 )
Years of Education -.00417** -.004099** -.003958** -.004000**
(.0005305) (.000533) (.0005333) (.0005326)
Log Income .00423** .004321** .004728** .004626**
(.0019941) (.001997) (.001992 ) (.0019946)
Risk .01921** .019116** .017826** .017886**
(.0060628) (.006063) (.006074 ) (.0060694)
Snus -.06243** -.062335** -.062915** -.062953**
(.0053833) (.005384) (.0053811) (.0053792)
No Alcohol -.03188** -.032200** -.032431** -.032177**
(.0072749) (.007274) (.0072737) (.007276 )
Moderate Alcohol -.04026** -.040386** -.040446** -.040191**
(.0075302) (.007530) (.00753 ) (.0075296)
Poor health .006490 .023678** .020729**
(.004648) (.0047472) (.0046964)
Medium health .004793 -.000154 .000692**
(.003881) (.0038186) (.0038361)
Sample size 28069Note: Marginal effects from a logistic regression are reported.Robust standard errors in parenthesis.
**, * significant at 5%, 10% level. Heavy smoking is a pack a day or more. Poor health indicates
health proxy is in lower quarter of distribution within age group. Medium health indicates that
health proxy is between the 25th and 75th quantile within age group.
35

Table 7: Determinants of smoking: Duration of Habit (Marginal Effects)
(1) (2) (3) (4)
Using Proxy1 Using Proxy2 Using Proxy3
Mean hazard of quitting 0.745
Sex -.07702** -.06792* -.07484** -.07629**
(.0393) (.03673) (.0361) (.0363)
Years of Education .09801** .09004** .08795** .08864**
(.0169) (.01587) (.0154) (.0155)
Log Income -.15112** -.14468** -.14481** -.14433**
(.0195) (.01846) (.0181) (.0181)
Risk .11097* .10774** .11542** .11260**
(.0585) (.0549 ) (.0547) (.0546)
Snus 1.297** 1.2074** 1.1916** 1.1969**
(.2307) (.21769) (.2143) (.2152)
No Alcohol .03865 .03988 .04051 .04208
(.0712) (.06677) (.0655) (.0660)
Moderate Alcohol .08931 .08718 .08303 .08447
(.0756) (.07083) (.0691) (.0696)
Poor health -.12322** -.19920** -.1646**
(.04583) (.0500) (.0480)
Medium health -.07039** -.03681 -.0575
(.03928) (.0384) (.0390)
Sample size 14406Note: Marginal effects from a Cox duration model are reported. Robust standard errors in paren-
thesis. **, * significant at 5%, 10% level. Poor health indicates health proxy is in lower quarter
of distribution within age group. Medium health indicates that health proxy is between the 25th
and 75th quantile within age group.
36

Table 8: Selection into Smoking and Cohort Effects
(1) (2) (3)
Using Proxy1 Using Proxy2 Using Proxy3
Ever Smoker. (Mean dep var: 0.483)
Poor health -.0330* (.0184 ) .0197 (.0179 ) .0143 (.0179 )
Poor health * born 1950-1969 .0399 (.0285 ) -.0012 (.0276 ) -.0049 (.0275 )
Poor health * born after 1970 .1030** (.0362 ) .0737** (.0361 ) .0702** (.0358 )
Heavy Smoking. (Mean dep var: 0.049)
Poor health -.0056 (.0102 ) .0077 (.0126 ) .0144 (.0200 )
Poor health * born 1950-1969 .0089 (.0182 ) .0175 (.0275 ) -.0002 (.0117 )
Poor health * born after 1970 -.0179** (.0308 ) -.0098 (.0189 ) -.0147 (.0196 )
Duration of Habit. (Mean dep var: 0.745)
Poor health -.1039 (.2312 ) -.3261 (.2271) -.2667 (.2290)
Poor health * born 1950-1969 -.7116* (.4341 ) -.7780* (.4314) -.7636* (.4440)
Poor health * born after 1970 .4275 (.7632 ) .5054 (.7431) -.2751 (.6398)Note: Marginal effects from logistic models are reported. Robust standard errors in parenthesis.
All regressions controlled for education level, age, age square, sex, log income, use of snus and
alcohol consumption. **, * significant at 5%, 10% level. Poor health indicates health proxy is
in lower quarter of distribution within age group. Medium health indicates that health proxy is
between the 25th and 75th quantile within age group.
37

Table 9: Life Expectancy: Smokers versus Non Smokers
Life Expectancy Loss in Life Expectancy
Non Smoker Smoker Heavy Smoker Smoker Heavy Smoker
No health controls in regressions
All individuals 80.0 76.6 71.7 3.4 ** (0.5) 8.3** (0.7)
Low educ 79.9 76.9 72.7 3.0** (0.6) 7.2** (1.0)
Med educ 80.1 77.0 71.4 3.2** (0.6) 8.7** (0.8)
High educ 83.1 79.7 73.0 3.4** (1.0) 10.1** (1.4)
Controlling for health, Proxy3
All individuals 80.0 76.7 71.8 3.3 ** (0.5) 8.2** (0.7)
Low educ Poor health 78.2 75.9 72.6 2.3** (1.0) 5.6** (1.6)
Good health 80.9 77.1 74.0 3.8** (1.1) 6.9** (1.9)
Med educ Poor health 77.4 74.7 70.4 2.7** (1.0) 7.0** (1.7)
Good health 82.5 78.1 74.1 4.3** (1.2) 8.4** (1.8)
High educ Poor health 79.3 75.9 71.1 3.4** (1.4) 8.2** (2.2)
Good health 87.0 81.8 77.1 5.2** (1.7) 9.9** (2.3)Note: **: significant at 5%, * significant at 10%. Poor (good) health is defined as being in the lower
(upper) quartile of the distribution of the health score, within age groups. Regression includes males only.
Estimates of life expectancies computed using a Weibull model interacting education, smoking status and
health. Standard errors computed using 500 bootstrap replications.
38