op en data b ar o m ete r data barometer... · 3 about the open data barometer the open data...
TRANSCRIPT

1
Open Data Barometer
Global ReportSecond Edition

2
Open Data Barometer – Second Edition
January 2015
The World Wide Web Foundation
Enabled by funding from:
Part of the Web Index project, funded by UK aid from the UK
Government.
Part of the ODDC research programme:
www.opendataresearch.org

3
About the Open Data Barometer
The Open Data Barometer aims to uncover the true prevalence and impact of open data initiatives around the world. It analyses global trends, and provides comparative data on countries and regions via an in-depth methodology combining contextual data, technical assessments and secondary indicators to explore multiple dimensions of open data readiness, implementation and impact. This is the second edition of the Open Data Barometer, completing a two-year pilot of the Barometer methodology and providing data for comparative research. This report is just one expression of the Barometer, for which full data is also available, supporting secondary research into the progression of open data policies and practices across the world. The Open Data Barometer forms part of the World Wide Web Foundation’s work on common assessment methods for open data. You can contact the Barometer team by emailing: [email protected]
About the World Wide Web Foundation
The World Wide Web Foundation was established in 2009 by Web inventor, Sir Tim Berners-Lee. Our mission? To advance the open Web as a public good and a basic right. Thanks to the Web, for the first time in history we can glimpse a society where everyone, everywhere has equal access to knowledge, voice and the ability to create. In this future, vital services such as health and education are delivered efficiently, access to knowledge unlocks economic value, and access to information enhances transparency and strengthens democracy. To achieve this vision, the Web Foundation operates at the confluence of technology, research and development, targeting three key areas: Access, Rights and Participation. Our work on open data connects across these themes, working to support inclusive approaches to open data impact across the globe. Our work on open data covers:
Research - As part of the Open Data for Development Network, we support research and research capacity building across three continents. From 2013–2015 the Open Data in Developing Countries project has been exploring use and impacts of open data, and a new phase of this project will commence in early 2015, supporting regional research agendas in Africa and Asia.
Innovation - including building the first Open Contracting Data Standard, aimed at putting the $9 trillion that governments spend annually on procurement into the public domain. The project puts our values and research into practice, developing the standard through an open an inclusive approach, and keeping a focus on the participatory potential of open contracting data.
Training & capacity building - The Web Foundation’s Open Data Labs are experimenting with how open data can make a real difference in the Global South. By trying out new approaches, we want to accelerate progress and ensure open data rapidly becomes a vital tool to tackle practical problems in developing and emerging economies. Our first Open Data Lab is now open in Jakarta, and we will be announcing more soon.
Engagement - To encourage and support more governments to open up their data to citizens, we are co-chairing the Open Data Working Group of the Open Government Partnership, which brings together 80 governments and 120 civil society organisations to share practical know-how and promote good practices.

4
Contents:
About the Open Data Barometer ....................................................................................................... 3 About the World Wide Web Foundation ............................................................................................ 3
Contents: .............................................................................................................................................. 4 Key Findings ......................................................................................................................................... 6
In detail ............................................................................................................................................. 6 Country-by-country analysis .............................................................................................................. 8 Moving forward ................................................................................................................................. 9
Introduction ......................................................................................................................................... 11 The Open Data Barometer .............................................................................................................. 11 Defining open data .......................................................................................................................... 12 Key facts: methodology ................................................................................................................... 12
Data & analysis: clusters .................................................................................................................... 15 G7 and G20: Commitments vs. Reality ........................................................................................... 17
Context and readiness ........................................................................................................................ 19 Sustaining leadership & strengthening foundations ......................................................................... 22 Taking it local .................................................................................................................................. 22 Connecting readiness and impact: areas for further investigation .................................................... 23
Implementation: data availability ......................................................................................................... 24 Degrees of openness ...................................................................................................................... 24 Applying the open definition? .......................................................................................................... 26 The need for more timely data ........................................................................................................ 26 Formats & standards ....................................................................................................................... 27 Dataset details ................................................................................................................................ 27
Impact ................................................................................................................................................ 31 Areas of impact ............................................................................................................................... 31 Influences on impact ....................................................................................................................... 31
Global rankings ................................................................................................................................... 34 Analysis .......................................................................................................................................... 35
Rankings by cluster ............................................................................................................................ 43 Rankings by region ............................................................................................................................. 45 Conclusions ........................................................................................................................................ 47 Methodology ...................................................................................................................................... 48
Overview ......................................................................................................................................... 49 Structure ......................................................................................................................................... 49 Sub-indices ..................................................................................................................................... 50 Computation.................................................................................................................................... 55 Changes: first and second edition ................................................................................................... 56
Get the data ........................................................................................................................................ 57 Research handbooks ...................................................................................................................... 57 Quantitative datasets ...................................................................................................................... 58 Qualitative data ............................................................................................................................... 58
Acknowledgements ............................................................................................................................ 60
Access the interactive online version of this report at www.opendatabarometer.org
The Open Data Barometer Global Report – Second Edition: World Wide Web Foundation This work is licensed under a Creative Commons Attribution 4.0 Unported License Accompanying data licensed under Open Data Commons Attribution License

5
Key findings

6
Key Findings
A global movement to make government “open by default” picked up steam in 2013, when the G8 leaders signed an Open Data Charter — promising to make public sector data openly available, without charge and in re-useable formats. In 2014, the G20 largest industrial economies followed up by pledging to advance open data as a weapon against corruption, and the UN recognised the need for a “Data Revolution” to achieve global development goals.
However, this second edition of the Open Data Barometer shows that there is still a long way to go to put the power of data in the hands of citizens. Core data on how governments are spending our money and how public services are performing remain inaccessible or paywalled in most countries. Information critical to fight corruption and promote fair competition, such as company registers, public sector contracts, and land titles, is even harder to get. In most countries, proactive disclosure of government data is not mandated in law or policy as part of a wider right to information, and privacy protections are weak or uncertain.
Our research suggests some of the key steps needed to ensure the “Data Revolution” will lead to a genuine revolution in the transparency and performance of governments:
High-level political commitment to proactive disclosure of public sector data, particularly the data most critical to accountability;
Sustained investment in supporting and training a broad cross-section of civil society and entrepreneurs to understand and use data effectively;
Contextualising open data tools and approaches to local needs, by, for example, making data visually accessible in countries with lower literacy levels;
Support for city-level open data initiatives as a complement to national-level programmes;
Legal reform to ensure that guarantees of the right to information and the right to privacy underpin open data initiatives.
Over the next six months, world leaders have several opportunities to agree these steps, starting with the United Nation’s high-level data revolution in Africa conference in March, Canada’s International Open Data Conference in May and the G7 summit in Germany this June. It is crucial that these gatherings result in concrete actions to address the political and resource barriers that threaten to stall open data efforts.
In detail
From our sample of 86 countries, representing a wide range of political, social and economic circumstances, we find that: • Open data initiatives that receive both senior-level government backing and sustained resources
are much more likely to achieve impact. This demonstrates that Open Government Data (OGD) initiatives, as they become established, can provide a clear return on effort and investment.
• Much more needs to be done to support data-enabled democracy around the world. There has been very limited expansion of transparency and accountability impacts from OGD over the last year. Of the countries included in the Barometer, just 8% publish open data on government spending, 6% publish open data on government contracts, and a mere 3% publish open data on the ownership of companies. Citizens have a similarly difficult time accessing data on the performance of key public services — just 7% of countries release open data on the performance of health services, and 12% provide corresponding figures on education.
• To maximise impact, open data needs go local. Political impacts from open data are greater in countries that have city-level open data activities. Widespread availability of data skills training is also correlated with higher political impact.
7
• Global progress towards embedding open data policies stalled in 2014. While many countries with moderate or strong OGD initiatives in 2013 have seen steady growth in the availability and impacts of OGD, a number of countries have slipped backwards over the last 12 months. Many of the countries that made initial steps with OGD in 2012/13 have not sustained their OGD commitments and activities. Government that is “open by default” is a long way off for most of the world's citizens.
• A small number of countries are moving towards requiring proactive disclosure of government data as part of their Right to Information (RTI) laws — effectively establishing a Right to Data. This should be welcomed. However, the open data policies of most countries continue to lack legislative backing. The continued weakness of data protection laws — particularly in light of continued revelations and concerns about data mining by corporations and states — is a cause for concern.
• For data to be considered truly open, it must be published in bulk, machine-readable formats, and under an open license. This year, just over 10% of the 1,290 different datasets surveyed for the Barometer met these criteria — a small but significant increase from 2013, when 7% of datasets were published in full open data format. Thirty-one countries have at least one open dataset, and just over 50% of the datasets surveyed among the 11 top-ranked countries qualified as fully open.

8
Country-by-country analysis
Based on a cluster analysis of our OGD readiness and impact variables, we have divided the countries studied into four groups:
High-capacity These countries all have established open data policies, generally with strong political backing. They have extended a culture of open data out beyond a single government department, with open data practices adopted in different government agencies, and increasingly at a local government level. These countries tend to adopt similar approaches to open data, incorporating key principles of the open definition, and emphasising issues of open data licensing. They have government, civil society, and private sector capacity to benefit from open data. Countries included in this cluster, in ODB rank order, are: UK, US, Sweden, France, New Zealand, Netherlands, Canada, Norway, Denmark, Australia, Germany, Finland, Estonia, Korea, Austria, Japan, Israel, Switzerland, Belgium, Iceland and Singapore. While this year’s top five includes three of the signatories of the 2013 G8 Open Data Charter (UK, US and France), the rest of the G8 languish much lower in the rankings, with Japan, Italy and Russia not even making the top ten.
Emerging & advancing These countries have emerging or established open data programmes — often as dedicated initiatives, and sometimes built into existing policy agendas. Many of these countries are innovating in the delivery of open data policy, contextualising open data for their populations by, for example, focussing on the need for governments to make data visually accessible in contexts of limited literacy and data literacy, such as India, or by exploring the linkages between RTI laws and open data, as in the Philippines. The countries in this cluster have a variety of different strengths and have great potential to develop innovative approaches to open data. However, many still face challenges to mainstreaming open data across government and institutionalising it as a sustainable practice. Countries included in this cluster, in ODB rank order, are: Spain, Chile, Czech Republic, Brazil, Italy, Mexico, Uruguay, Russia, Portugal, Greece, Ireland, Hungary, Peru, Poland, Argentina, Ecuador, India, Colombia, Costa Rica, South Africa, Tunisia, China, the Philippines and Morocco.
Capacity constrained The countries in this cluster all face challenges in establishing sustainable open data initiatives as a result of: limited government, civil society or private sector capacity; limits on affordable widespread Internet access; and weaknesses in digital data collection and management. A small number of the countries in this cluster, such as Kenya, Ghana and Indonesia, have established open data initiatives, but these remain highly dependent upon a small network of leaders and technical experts. Without sustained leadership and investment, moves towards open data are difficult to make sustainable, as Kenya's dramatic fall in the Barometer rankings demonstrates.
9
Limited availability of relevant training and technical capacity for working with open data presents an extra challenge for these countries to overcome in developing the availability and use of open data. There is an urgent need for more appropriate models of education and capacity building that can support nascent community and government-led open data initiatives. These countries are most in need of a comprehensive data revolution, including, in many countries, attention to basics of Internet connectivity and data literacy. Countries included this cluster, in ODB rank order, are: Indonesia, Turkey, Ghana, Rwanda, Jamaica, Kenya, Mauritius, Ukraine, Thailand, Vietnam, Mozambique, Jordan, Nepal, Egypt, Uganda, Pakistan, Benin, Bangladesh, Malawi, Nigeria, Tanzania, Venezuela, Burkina Faso, Senegal, Zimbabwe, Namibia, Botswana, Ethiopia, Sierra Leone, Zambia, Yemen, Cameroon, Mali, Haiti and Myanmar.
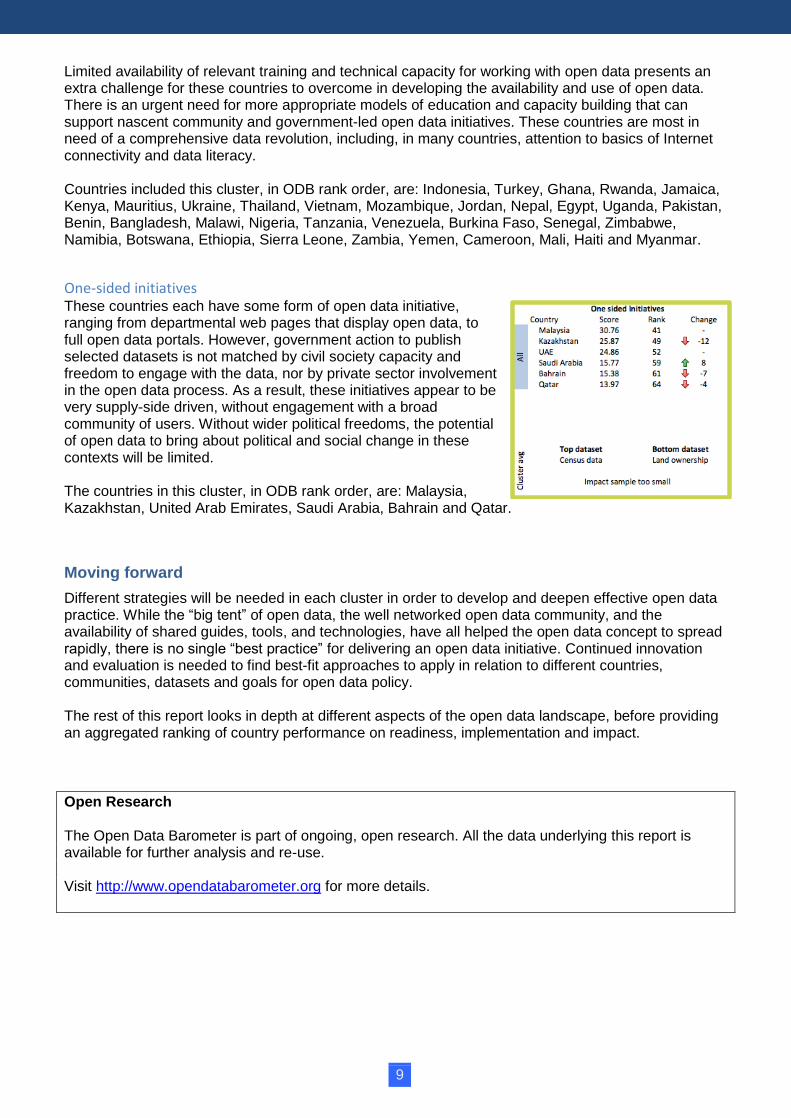
One-sided initiatives These countries each have some form of open data initiative, ranging from departmental web pages that display open data, to full open data portals. However, government action to publish selected datasets is not matched by civil society capacity and freedom to engage with the data, nor by private sector involvement in the open data process. As a result, these initiatives appear to be very supply-side driven, without engagement with a broad community of users. Without wider political freedoms, the potential of open data to bring about political and social change in these contexts will be limited. The countries in this cluster, in ODB rank order, are: Malaysia, Kazakhstan, United Arab Emirates, Saudi Arabia, Bahrain and Qatar.
Moving forward
Different strategies will be needed in each cluster in order to develop and deepen effective open data practice. While the “big tent” of open data, the well networked open data community, and the availability of shared guides, tools, and technologies, have all helped the open data concept to spread rapidly, there is no single “best practice” for delivering an open data initiative. Continued innovation and evaluation is needed to find best-fit approaches to apply in relation to different countries, communities, datasets and goals for open data policy. The rest of this report looks in depth at different aspects of the open data landscape, before providing an aggregated ranking of country performance on readiness, implementation and impact.
Open Research The Open Data Barometer is part of ongoing, open research. All the data underlying this report is available for further analysis and re-use. Visit http://www.opendatabarometer.org for more details.

10
Introduction

11
Introduction
The core idea behind Open Government Data (OGD) is a simple one: public data should be a shared resource. Making data open is valuable not only for the government departments that collect and release the data, but also for citizens, entrepreneurs and other parts of the public sector. The implementation of OGD takes dedicated and sustained policy attention. Affecting widespread impact through the release of OGD relies not only upon the supply of high-quality data, but also upon the capacity of users to work with the data, and the ability of government to engage proactively with those users. In our complex world, access to OGD has the power to secure enhanced government accountability, empower coordinated action to improve public services and civil society, and inspire new business ideas. Yet far too often, access to data, along with the skills to understand and make use of it, are distributed unequally, and would-be users frequently encounter unnecessary technical and legal restrictions that prevent data re-use. Calls for a “Data Revolution” — led by the United Nations — have placed renewed attention on ensuring the collection and management of high-quality data around the world through strengthened statistical capacity, and are driving a focus on the use of new “big data” resources in policy making. Against this backdrop, questions concerning who has access to data, and whether citizens have the capability and freedoms to create, access, and analyse data about their own communities and concerns, become ever more important for securing a fair balance of power in our societies.
The Open Data Barometer
This report brings together the results of expert survey research, technical assessments of data supply, and secondary data, in order to contribute to a deeper understanding of the global landscape of open data. Specifically, the report scores countries on: • Readiness to secure benefits from open data, including the legal, political, economic, social,
organisational, and technical foundations that can support the supply and use of open data.
• Implementation of open data practice, measured through the availability of data across 15 key categories, and the adoption for those datasets of the common practices set out in the Open Definition and the Open Government Data Principles.
• Impacts of open data, measured through media and academic mentions of data use and impact.
This second edition of the Open Data Barometer replicates the core methodology used in the 2013 edition of the report, while drawing on updated research inputs covering the 2013-2014 period, and adding nine new countries to the sample. The methodological annex describes minor adjustments between the first and second editions. Repeating the methodology used in the first edition of the ODB allows for comparisons to be made between the 2013 and 2014 data, and supports both an assessment of global and local trends, as well as the development of key learnings to improve future open data measurement activities. As the open data field — and with it the Open Data Barometer — continues to develop in future years, we will increasingly draw upon the common assessment framework for open data, developed by the Web Foundation, the GovLab, and other partners, and will place greater emphasis on evidence of open data impact and use (as an important mediating variable between readiness, and data availability and impact). The following sections of this report present selected statistics and commentary based on our data collection, as well as a composite ranking of countries. However, this report is just one part of the Open Data Barometer. By providing the underlying data gathered during the project, we encourage other advocates, scholars, and practitioners to draw upon it to ask further research questions, and to refine shared understanding of how to achieve positive impacts from open data.

12
Defining open data
The last year has witnessed growing concern, and confusion, about the boundaries between personal or private data, and open data. Public trust in government data handling has been undermined as citizens have grown more aware of the ways in which surveillance agencies and corporations have abused their personal data, or have seen mistakes made by government in publishing inappropriately anonymised data.1 Meanwhile, as governments have sought to make better use of the records they hold on individual citizens, or to engage with big data, they have often clouded the distinction between “data sharing” (where there can still be restrictions on who can use the data, and for what purposes) and “open data”, which should be accessible for anyone to re-use for any purpose. It is important, therefore, to draw clear definitions and distinctions. When we discuss open data in this report, we are discussing data that is: • Accessible: Proactively published, and available free of charge.
• Machine-readable: Published in file formats and structures that allow computers to extract and
process the data for easy sorting, filtering and content searching.
• Re-usable: Available under legal regimes or explicit terms that place a minimum of restrictions on how the data may be used; at most, the publisher can specify how the source should be acknowledged.
These principles are conventionally operationalised by checking whether data is online, in specified file formats, and provided with explicit license terms. In assessing whether datasets qualify as “open data” we follow this approach, but we also collect other important variables about the timeliness, sustainability, and discoverability of datasets, recognising that there are important social, technical, and legal aspects of openness.
Private data and public records By definition, open data should not include private data. Private data should have a limited distribution; any restrictions on distribution go against the re-usability terms of open data. In general, this means that the records government holds on individuals should not be made available as open data unless these records are understood to be part of the public record. For example, the names of company directors may be part of the public record, and so could be released as open data. Providing public records as open data, including records that contain information about individuals, does not invalidate other obligations on potential users of the data to abide by existing legal frameworks for data protection. This highlights the importance of linking open data regulations and laws designed to increase transparency with privacy protection laws and frameworks that can restrict certain abusive uses of the data. Even with these frameworks in place, there are some datasets where the risk of the data being re-identified, or personal information contained within it abused, is such that it cannot be “open by default”. The Open Data Barometer explicitly surveys the existence of data protection laws in each country, and considers their existence and strength as a component of open data readiness.
Key facts: methodology
The Open Data Barometer is based upon three kinds of data: • A peer reviewed expert survey carried out between May and September 2014, which asked
researchers to provide a score from 0–10 in response to a range of questions about open data contexts, policy, implementation and impacts. Scores were normalised (using z-scores) prior to inclusion in the Barometer.
1 For example, New York provided GPS logs of taxi journeys in response to a Freedom of Information Law request, but failed
to adequately anonymise the data allowing the journeys and identities of drivers to be extracted from the data.

13
• Detailed dataset survey completed by a team of technical experts. These assessments were based on a 10-point checklist, completed for 15 kinds of data in each country, which touched on issues of data availability, format, license, timeliness and discoverability. Initial source information for locating datasets, and the agencies responsible for their production, were provided by the expert survey, and then validated and expanded upon by the technical experts. Validation was carried out between August and October 2014, and incorporates evidence up until the end of October 2014. Each answer in the 10-point checklist is supported by qualitative information and detailed hyperlinks. Checklist responses are combined in a weighted aggregation to provide a 0–100 score for each dataset. These are presented in their original form to allow comparison between datasets, and are averaged to give a dataset implementation sub-index. This sub-index is normalised (using z-scores) prior to inclusion in the overall Barometer calculations.
• Secondary data selected to complement our expert survey data. This is used in the readiness section of the Barometer, and is taken from the World Economic Forum, United Nations e-Government Survey and Freedom House. The data is normalised (using z-scores) prior to inclusion in the Barometer.
The list of countries included in the 2014 Barometer is based upon the Web Index sample, which was designed to represent a broad range of regions, political systems, and levels of development; as such, there should be no selection bias in the sample towards countries with OGD policies. You can read more about the detailed research process in the methodology section.

14
Data & analysis

15
Data & analysis: clusters
The Open Data Barometer provides a snapshot of the state of open data around the world. It is designed to help advocates, policy makers and researchers understand and ask questions about how the development of an “open by default” approach to government data is progressing, and how impacts from open data can best be secured.
The immediate potential of open data, the strategies to secure impact, and the key challenges faced by data suppliers and users each vary across countries. While the Open Data Barometer provides a global benchmark, it also enables more localised comparisons. To support this, we have used hierarchical cluster analysis to identify a set of country clusters. Hierarchical cluster analysis is a method to look for similarities and differences between entries in a dataset, by working out the “distance” between them on the basis of a set of variables. A statistical cluster analysis performed over the full Open Data Barometer expert survey and secondary data for readiness and impact provides a heuristic for identifying different patterns of engagement with open data around the world. We don't include implementation (levels of dataset publication) in this analysis in order to focus more on the broad capacity, potential, and policy progress of countries, rather than having the clusters influenced by which countries have co-published particular datasets. Selecting the number of clusters to use in an analysis involves both the properties of the data and a judgement as to the explanatory power of the clusters. Based on an evaluation of a number of models, we selected a four-cluster analysis and, based on a detailed review of qualitative and quantitative data in each cluster, labelled them: (1) High-capacity; (2) Emerging & advancing; (3) Capacity constrained: and (4) One-sided initiatives.

16
Table 1 - Country clusters (based on readiness and impact variables)
Cluster Countries
High capacity UK, US, Sweden, France, New Zealand, Netherlands, Canada, Norway, Denmark, Australia, Germany, Finland, Estonia, Korea, Austria, Japan, Israel, Switzerland, Belgium, Iceland and Singapore
Emerging and advancing
Spain, Chile, Czech Republic, Brazil, Italy, Mexico, Uruguay, Russia, Portugal, Greece, Ireland, Hungary, Peru, Poland, Argentina, Ecuador, India, Colombia, Costa Rica, South Africa, Tunisia, China, Philippines and Morocco
Capacity constrained Indonesia, Turkey, Ghana, Rwanda, Jamaica, Kenya, Mauritius, Ukraine, Thailand, Vietnam, Mozambique, Jordan, Nepal, Egypt, Uganda, Pakistan, Benin, Bangladesh, Malawi, Nigeria, Tanzania, Venezuela, Burkina Faso, Senegal, Zimbabwe, Namibia, Botswana, Ethiopia, Sierra Leone, Zambia, Yemen, Cameroon, Mali, Haiti, Myanmar
One sided initiative Malaysia, Kazakhstan, UAE, Saudi Arabia, Bahrain and Qatar
The clusters can be described as follows: • High-capacity - These countries all have established open data policies, generally with strong
political backing. They have extended a culture of open data out beyond a single government department with open data practices adopted in different government agencies, and increasingly at a local government level. These countries tend to adopt similar approaches to open data, incorporating key principles of the open definition, and emphasising issues of open data licensing. They have government, civil society and private sector capacity to benefit from open data.
• Emerging & advancing - These countries have emerging or established open data programmes, often as dedicated initiatives, but sometimes through linking open data into existing policy agendas. Many of these countries are innovating in the delivery of open data policy, contextualising open data for their populations: for example, by focussing on the need for governments to make data accessible through visualisation in contexts of limited literacy and data literacy, as in India, or exploring the linkages between Right to Information laws and open data, as in the Philippines. The countries in this cluster have a variety of different strengths - and have great potential to innovate in developing best-fit approaches to open data. However, many still face challenges before open data is mainstreamed across government and institutionalised as a sustainable practice.
• Capacity constrained - The countries in this cluster all face challenges in establishing sustainable open data initiatives as a result of limited government, civil society or private sector capacity, limits on affordable widespread Internet access, and weaknesses in digital data collection and management. A small number of the countries in this cluster, such as Kenya, Ghana and Indonesia, have established open data initiatives, but these remain highly dependent upon a small network of leaders and technical experts. Without sustained leadership and investment, moves towards open data are difficult to make sustainable, as Kenya's dramatic fall in the Barometer rankings demonstrates. Limited availability of relevant training and technical capacity for working with open data presents an extra challenge for these countries to overcome in developing the availability and use of open data.
• One-sided initiatives - These countries each have some form of open data initiative, ranging from departmental web pages listing open data, to full open data portals. However, government action to publish selected datasets is not matched by civil society capacity and freedom to engage with the data, nor by private sector involvement in the open data process. As a result, these initiatives appear to be very supply-side driven, without engagement with a broad community of users. Without wider political freedoms, the potential of open data to bring about political and social change in these contexts will be limited.
17
The rankings section provides an analysis of country performance and changes in each cluster.
G7 and G20: Commitments vs. Reality
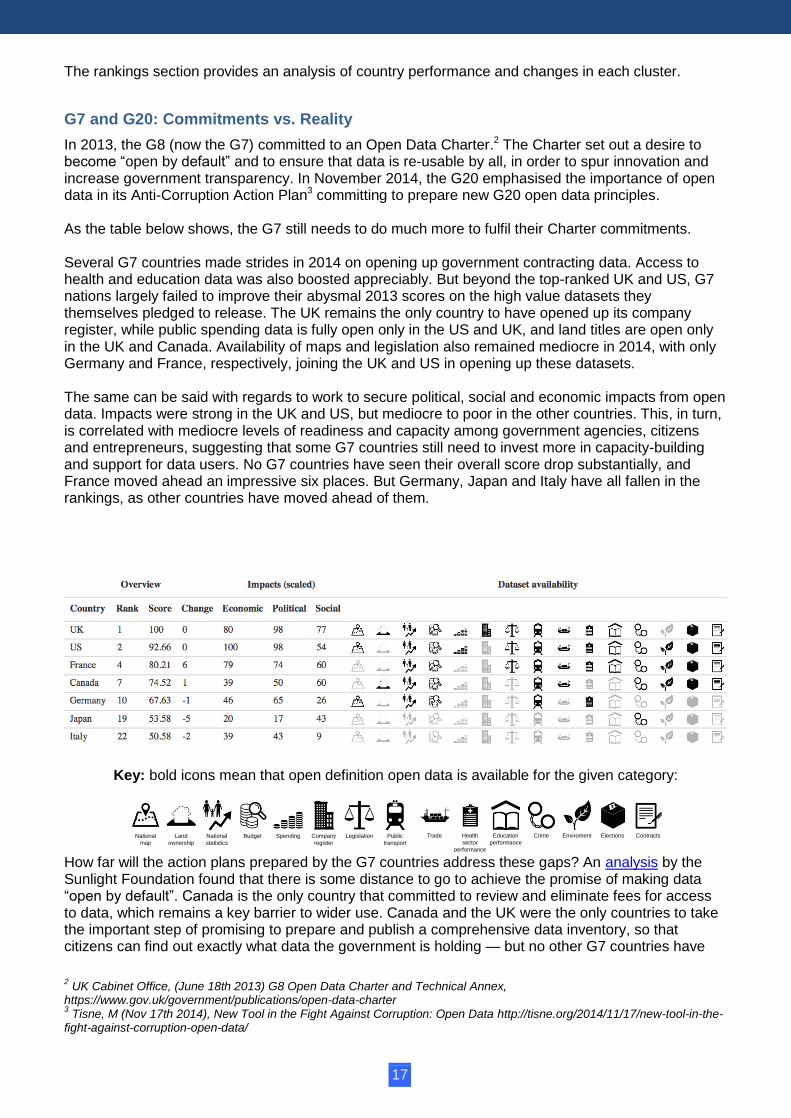
In 2013, the G8 (now the G7) committed to an Open Data Charter.2 The Charter set out a desire to become “open by default” and to ensure that data is re-usable by all, in order to spur innovation and increase government transparency. In November 2014, the G20 emphasised the importance of open data in its Anti-Corruption Action Plan3 committing to prepare new G20 open data principles. As the table below shows, the G7 still needs to do much more to fulfil their Charter commitments. Several G7 countries made strides in 2014 on opening up government contracting data. Access to health and education data was also boosted appreciably. But beyond the top-ranked UK and US, G7 nations largely failed to improve their abysmal 2013 scores on the high value datasets they themselves pledged to release. The UK remains the only country to have opened up its company register, while public spending data is fully open only in the US and UK, and land titles are open only in the UK and Canada. Availability of maps and legislation also remained mediocre in 2014, with only Germany and France, respectively, joining the UK and US in opening up these datasets. The same can be said with regards to work to secure political, social and economic impacts from open data. Impacts were strong in the UK and US, but mediocre to poor in the other countries. This, in turn, is correlated with mediocre levels of readiness and capacity among government agencies, citizens and entrepreneurs, suggesting that some G7 countries still need to invest more in capacity-building and support for data users. No G7 countries have seen their overall score drop substantially, and France moved ahead an impressive six places. But Germany, Japan and Italy have all fallen in the rankings, as other countries have moved ahead of them.
Key: bold icons mean that open definition open data is available for the given category:
How far will the action plans prepared by the G7 countries address these gaps? An analysis by the Sunlight Foundation found that there is some distance to go to achieve the promise of making data “open by default”. Canada is the only country that committed to review and eliminate fees for access to data, which remains a key barrier to wider use. Canada and the UK were the only countries to take the important step of promising to prepare and publish a comprehensive data inventory, so that citizens can find out exactly what data the government is holding — but no other G7 countries have
2 UK Cabinet Office, (June 18th 2013) G8 Open Data Charter and Technical Annex,
https://www.gov.uk/government/publications/open-data-charter 3 Tisne, M (Nov 17th 2014), New Tool in the Fight Against Corruption: Open Data http://tisne.org/2014/11/17/new-tool-in-the-
fight-against-corruption-open-data/
National
map
Land
ownership
National
statistics
Budget Spending Company
register
Legislation Public
transport
Trade Health
sector
performance
Education
performance
Crime Enviroment Elections Contracts

18
done so. Only three countries so far are taking steps to making the open publication of data mandatory for all government agencies. In the wake of their pathbreaking 2014 commitment to harness open data as a tool against corruption, G20 countries have even further to go before key accountability facts, such as corporate registers, details of government budgets and spending, and public contracts, will be readily available to all online. However, with the exception of Saudi Arabia, all G20 countries have observed some form of political (accountability or efficiency) impact from existing open data efforts.

19
Context and readiness
The readiness of states, citizens and entrepreneurs to secure the benefits of open data has progressed little over the last year, and the data divide between countries with strong open data initiatives, and those without, has grown. Effective open data policies require a degree of collaboration between the state, private sector and civil society. A balance is needed between governments with the capacity to create, manage, and publish data, and third parties with the technical skills, freedoms, and resources to use data as a tool for change. Governments that focus solely on increasing the supply of open data — without exploring ways to extend access to data literacy and skills, developing approaches to stimulate innovation, or putting in place foundations for data to be trusted — are likely to miss out on many of the benefits of open data. The maps below illustrate a number of the key readiness variables in the Barometer. They show the existence and strength of support for open data initiatives, engagement with open data from outside government, legislative frameworks that support open data (e.g., Right to Information and Data Protection laws), and the existence of training and support for data use and innovation. Darker colours indicate a higher score on the 0–10 scale.
Open Data Initiatives

20
Right to Information legislation
Data protection legislation

21
Support for innovation
Civil society engagement

22
Sustaining leadership & strengthening foundations
In comparing expert assessments of the strength of open data initiatives in countries covered by both the 2013 and 2014 ODB, it is striking that, among the capacity constrained countries, early leadership and progress towards open data has not been sustained. Countries such as Kenya and Ghana have failed thus far to institutionalise their open data initiatives, with progress stalling or moving backwards when key leaders or instigators move on. There is growing recognition of the need for open data to rest upon reforms to the wider data infrastructures of the state, as well as upon strong legal foundations. Writing about the Kenya Open Data Initiative that he instigated, Dr Bitange Ndemo, former Permanent Secretary to Kenya’s Ministry of Information and Communications, argued that to revive the initiative, Kenya must "digitise all of our registries and enact two critical bills that are in Parliament, the Freedom of Information (FOI) and the Data Protection Bills."4 Table 2: Mean score change between 2013 and 2014 on question: "To what extent is there a well-resourced open government data initiative in this country?" (n=77) separated by cluster.
High capacity Emerging and advancing One sided initiative Capacity constrained
+0.810 +0.043 -0.600 -0.786
The cluster of high-capacity countries has seen continued support for data innovation; funding programmes, challenge funds, roundtables, and innovation incubators have become part of business-as-usual for government, creating spaces for collaboration around datasets and stimulating data re-use. However, among countries with emerging and advancing open data practices, support for innovation with data remains ad hoc. In a number of countries where we found evidence of hackathons or other events to stimulate data use in 2013, our researchers could not locate follow-up activities in 2014. As evidence from the iHub evaluation of the Code for Kenya initiative suggests5, open data hackathons or incubators do not automatically result in scalable products or services, but they can provide a space for re-imagining how government services could be delivered. Governments need capacity to absorb the innovative ideas that are prototyped with open data, and to create an enabling environment where social and economic innovations can scale. In the countries of the one-sided initiative cluster, limited political freedoms and the low capacity of civil society are joined with low publication rates of the datasets relevant to transparency and accountability, leaving very limited space for the transformative potential of open data. Countries here may have a form of an open data initiative, with portals and some datasets, but little of the functionality of open data as a tool to unlock innovation and create space for civic dialogue.
Taking it local
Many of the day-to-day decisions and actions that could enhance citizen quality of life take place at the local level. Our expert survey explored the existence of sub-national open data initiatives. As the map above shows, local initiatives are much more evident in Europe, North America and Australia than elsewhere in the world. A linear regression analysis of expert survey readiness variables against the social and political impact sub-components of the Open Data Barometer indicates that the existence of city-level initiatives is significantly correlated with perceptions of impact.6 This highlights an important area for future
4 Ndemo, B. (2014). Open contracting format can clean up government procurement. Daily Nation 24th November 2014.
http://www.nation.co.ke/oped/blogs/dot9/ndemo/-/2274486/2532264/-/1wpu9kz/-/ 5 Mutuku, Leonida, and Christine Mahihu (2014) Understanding the Impacts of Kenya Open Data Applications and Services.
iHub Research. http://opendataresearch.org/sites/default/files/publications/ODDC%20Report%20iHub.pdf. 6 n = 86. Based on "fit<-lm(Impact_Political ~ WB.NetUsers + FH + WEF.GCI.9.02 + WEF.GITR.8.01 + ODB.2013.C.INIT +
ODB.2013.C.CITY + ODB.2013.C.RTI + ODB.2013.C.CSOC + ODB.2013.C.SUPIN + ODB.2013.C.DPL + ODB.2013.C.TRAIN,data=scaled_scores)" which indicates a loading of 0.331785 on ODB.2013.C.CITY at a significance level of 0.01, and and "fit<-lm(Impact_Social ~ FH + WEF.GCI.9.02 + WEF.GITR.8.01 + ODB.2013.C.INIT + ODB.2013.C.CITY + ODB.2013.C.RTI + ODB.2013.C.CSOC + ODB.2013.C.SUPIN + ODB.2013.C.DPL + ODB.2013.C.TRAIN,data=scaled_scores)" which indicates a loading of 0.29795 on ODB.2013.C.CITY at a significance level of 0.01, and a loading of 0.46919 on ODB.2013.C.SUPIN with a significance level of 0.001. See the methods section for

23
research and action, identifying the extent to which government can and should create enabling environments for open data activities at the sub-national level. In the UK, for example, the local open data incentive scheme provides cash payments to local authorities for publishing key datasets, including planning applications, premises licences, and details of public toilets.
Connecting readiness and impact: areas for further investigation
There is a strong correlation (0.75) between GDP per capita and overall readiness as ranked by the Open Data Barometer. The correlation is strongest in terms of entrepreneurial readiness and weakest for citizen/civil society readiness. Drawing on data from the 2013 Barometer, Meng has suggested that “political capital”, as distinct from associational social capital also plays an important role in the readiness of countries to gain social impacts from open data. Political capital is defined as "attitudes supportive of democratic norms and behaviour that engage citizens with the state and each other in channelled ways, conveying interests, preferences, and demands to the regime".7 The first two editions of the Open Data Barometer do not provide a measure of political capital, but this may be an important dimension to consider in future work, and in assessing the potential to secure social change through open data initiatives. Similarly, the open data literature frequently points to the importance of intermediaries in translating data availability into social change activity. While both the existence of civil society engaging with open data and the presence of technical capacity in firms within a country can act as proxies for the likelihood of intermediaries emerging, further work is needed to track and understand the different kinds of intermediaries and the roles they play in readiness to secure different impacts from open data.
further details. (Note - the variable name indicates that a question is drawn from the 2013 study, although the data comes from 2014.) 7 Meng, A. (2014). Investigating the Roots of Open Data’s Social Impact. Journal of eDemocracy and Open Government,
6(1), 1–13. http://www.jedem.org/article/view/288
24
Implementation: data availability
Effective open government data initiatives should provide access to a wide range of data. Although there have been small gains in the availability of open data this year, all too often governments are still publishing only selected datasets, with limited data published on important areas such as public sector performance and expenditure. In addition, the widespread lack of timely data is a major barrier to wider open data use.
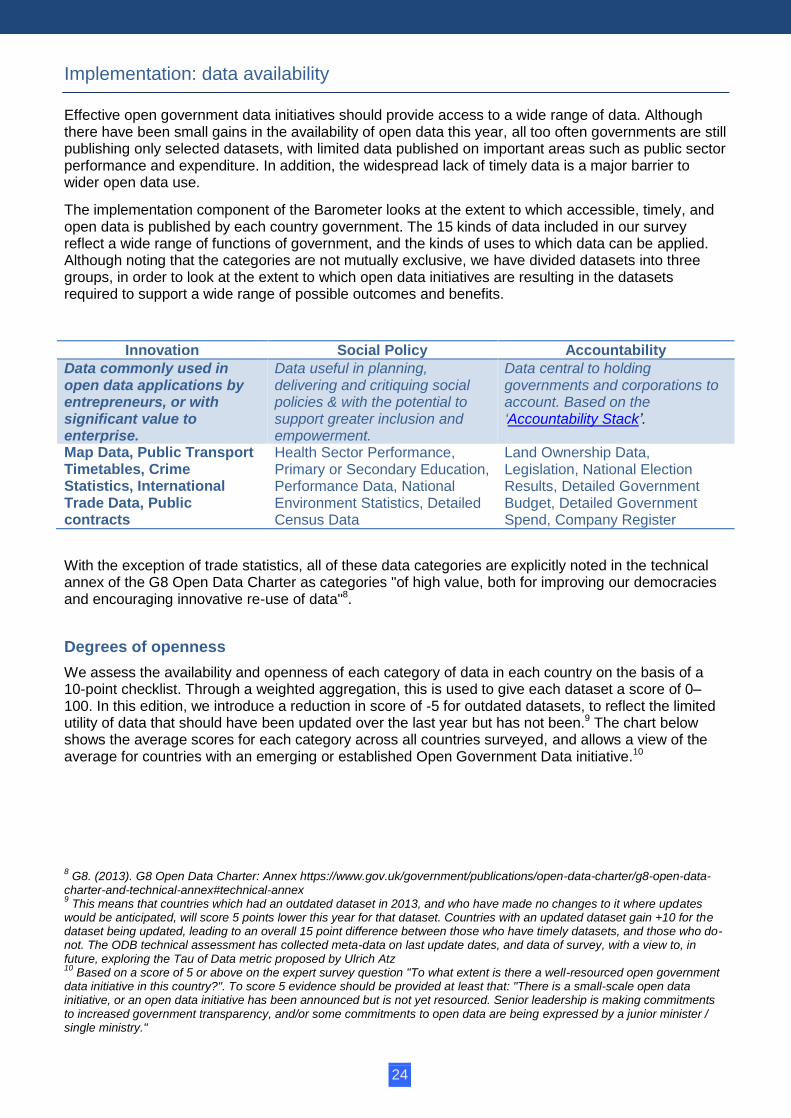
The implementation component of the Barometer looks at the extent to which accessible, timely, and open data is published by each country government. The 15 kinds of data included in our survey reflect a wide range of functions of government, and the kinds of uses to which data can be applied. Although noting that the categories are not mutually exclusive, we have divided datasets into three groups, in order to look at the extent to which open data initiatives are resulting in the datasets required to support a wide range of possible outcomes and benefits.
Innovation Social Policy Accountability
Data commonly used in open data applications by entrepreneurs, or with significant value to enterprise.
Data useful in planning, delivering and critiquing social policies & with the potential to support greater inclusion and empowerment.
Data central to holding governments and corporations to account. Based on the ‘Accountability Stack’.
Map Data, Public Transport Timetables, Crime Statistics, International Trade Data, Public contracts
Health Sector Performance, Primary or Secondary Education, Performance Data, National Environment Statistics, Detailed Census Data
Land Ownership Data, Legislation, National Election Results, Detailed Government Budget, Detailed Government Spend, Company Register
With the exception of trade statistics, all of these data categories are explicitly noted in the technical annex of the G8 Open Data Charter as categories "of high value, both for improving our democracies and encouraging innovative re-use of data"8.
Degrees of openness
We assess the availability and openness of each category of data in each country on the basis of a 10-point checklist. Through a weighted aggregation, this is used to give each dataset a score of 0–100. In this edition, we introduce a reduction in score of -5 for outdated datasets, to reflect the limited utility of data that should have been updated over the last year but has not been.9 The chart below shows the average scores for each category across all countries surveyed, and allows a view of the average for countries with an emerging or established Open Government Data initiative.10
8 G8. (2013). G8 Open Data Charter: Annex https://www.gov.uk/government/publications/open-data-charter/g8-open-data-
charter-and-technical-annex#technical-annex 9 This means that countries which had an outdated dataset in 2013, and who have made no changes to it where updates
would be anticipated, will score 5 points lower this year for that dataset. Countries with an updated dataset gain +10 for the dataset being updated, leading to an overall 15 point difference between those who have timely datasets, and those who do-not. The ODB technical assessment has collected meta-data on last update dates, and data of survey, with a view to, in future, exploring the Tau of Data metric proposed by Ulrich Atz 10
Based on a score of 5 or above on the expert survey question "To what extent is there a well-resourced open government data initiative in this country?". To score 5 evidence should be provided at least that: "There is a small-scale open data initiative, or an open data initiative has been announced but is not yet resourced. Senior leadership is making commitments to increased government transparency, and/or some commitments to open data are being expressed by a junior minister / single ministry."

25
The overall trend is generally a positive one, with slight increases in the openness of most datasets, even when the timeliness score reduction that affects many datasets is taken into account. But progress is slow. At the current rate of improvement, it will be decades before the datasets we survey are provided as open data across the world. The difference between openness of data in countries with an open data initiative and those without, while establishing correlation rather than causation, does point toward open data initiatives working to bring about greater supply of open data, and the strength and pace at which initiatives translate into increased data supply invites further investigation. However, as the previous edition of the Barometer noted, a large gap remains between the availability of different categories of data, with a gulf between the high provision of statistical datasets, like the census, and limited provision of important infrastructural and accountability datasets. Researchers particularly noted the limited scope of education and health performance data in many countries. While basic statistical information is often available through national statistical agencies to qualify against the category definitions used in our survey, the granularity and detail of performance information was very limited. For an effective data revolution that empowers citizens to hold services to account, increased direct flows of open data from line ministries to citizens — rather than solely mediated through statistical agencies — may be required. In some countries, independent agencies, or projects run in partnership with the state, mediated access to high quality health or education statistics, acting as a bridge between data producers and users. However, few of these institutions have yet to embrace open data practices. The year-to-year drop in the average spending data score can be accounted for, in part, by use of a stricter definition of the category in this edition of the Barometer — where yearly data was previously accepted, this year’s report asked for transaction-level spending, or at least reasonably disaggregated quarterly reports. However, even with this noted, a substantial difference between the publication of budget data and spending data is evident. Governments are much more likely to make available data on plans, rather than on their implementation. This reflects the gap that Andrews has noted, when analysing the Open Budget Index datasets, between “Transparency in Formulation” of policy, and “Transparency in Execution”11, and highlights the importance of examining both the technical capabilities of governments to publish information on execution of policy, and the incentive structures and strategic choices shaping the data that is actually posted online. Data on the delivery of policy and public services, as opposed to plans for provision, are vitally important for many transparency and accountability open data use cases.
11
Andrews, Matthews (2013), How Transparent Are Open Budgets? http://matthewandrews.typepad.com/the_limits_of_institution/2013/10/how-transparent-are-open-budgets.html

26
Applying the open definition?
Although governments are increasingly providing machine-readable copies of datasets for download, practices of making bulk downloads available (rather than only making sub-sets of data accessible through online query interfaces — a practice particularly common among statistical agencies) and of providing a clear, unambiguous license statement that permits unlimited re-use of public data, remain relatively rare. Many datasets are provided with no clear licensing information, leaving users uncertain about whether they can use the data to build businesses, and technical intermediaries unclear as to their rights to redistribute the data. Of the 1,290 datasets surveyed for this study, just 10% were available in forms that meet the Open Definition. Only 31 countries had one or more open datasets, and even among the Barometer’s top-ranked countries, the number of open datasets provided just tops 52%.12 Transport datasets were the most likely to be provided in machine-readable formats and with open licenses. This indicates a clear recognition of the importance of licensing for data to be re-used and to support the emergence of an app economy. By contrast, contracting information, company registries, and land ownership data are the least likely to meet the open definition. Although in most cases, governments do have online systems that hold this data, these systems are frequently designed to limit public access to key information, or to only make information available for a fee. It is notable that in developing countries, these systems are often funded by donor money, providing a leverage point for donors to increase the sustainable provision of open data in the future.
The need for more timely data
A major theme identified in this year’s study, as we compared dataset assessments from 2013 and 2014, was the prevalence of datasets, which have not been updated. In many cases, datasets hosted on open data portals were from previous years; in other cases, the original source data from departments showed no signs of recent update.13 Timeliness and sustainability are particularly important factors for both accountability and entrepreneurship. Without being able to trust that data will be updated regularly, civil society and private firms are less likely to rely upon, and build tools and services on top of open datasets.
12
Based on the top 11 countries by rank (top 11, rather than top 10 used due to tied 10th place). 13
Our technical survey asks for an assessment of dataset timeliness, based on how often updates would be anticipated for the particular category of data (e.g. Census data might only be updated every 10 years, whilst trade records are often updated monthly, or at least yearly). It also asks researchers to make a judgement on the sustainability of a dataset, based on evidence of whether open data appears to be a one-off publication, or whether there is evidence of regular, sustained and resourced open data publishing in a given category.

27
The largest problems with sustainability of publishing were seen for environmental and crime data, with just 53% and 61%, respectively, of machine-readable datasets in these categories judged to be sustainably published. In the case of environmental data, many countries appeared to lack strong environment data portals — many websites were found hosting significantly outdated data, and a number appeared to have been created with aid funding, but not sustained after that funding ended. This again illustrates a number of the challenges ahead for the data revolution: a need to embed local capacity to keep data updated, and a need to invest not just in technical platforms, but also in skill-building so that tools can be maintained and sustained, even when outside support ends.
Formats & standards
Out of the 1,090 distinct download options identified in the technical survey, 385 files were provided in XLS format, 215 in CSV format, and 84 as XML. Just 21 JSON files were identified. In general, with the exception of transportation data (where the GTFS standard was used in 11 of the cases examined), there was very little evidence of the use of global standards to represent key datasets. This is due, in part, to the limited availability of reference standards to use. The absence of clear standards for representing key datasets, such as budgets, has two consequences. Firstly, it provides no standard of measurement by which adequate or good quality publication of certain kinds of data can be assessed. Secondly, it means that users of data seeking to link up data from different countries, or to transfer an application developed in one context for use in another, have to re-learn and re-code their data uses country-by-country. The Open Contracting Data Standard, launched in November 2014, is one experiment with providing both a technical interoperability standard, and a standard for assessing good contracting data publication. Work is needed in the open data field to establish and develop other standards, ensuring these are created in inclusive ways.
Dataset details
Although the overall picture of open data implementation shows that there is a long way yet to go, some countries continue to move towards “open by default”. The chart below offers a full view of all the datasets assessed for this edition of the Barometer. The size of each bubble is relative to the overall weighted dataset score. A thick outline indicates a dataset that meets the Open Definition criteria.
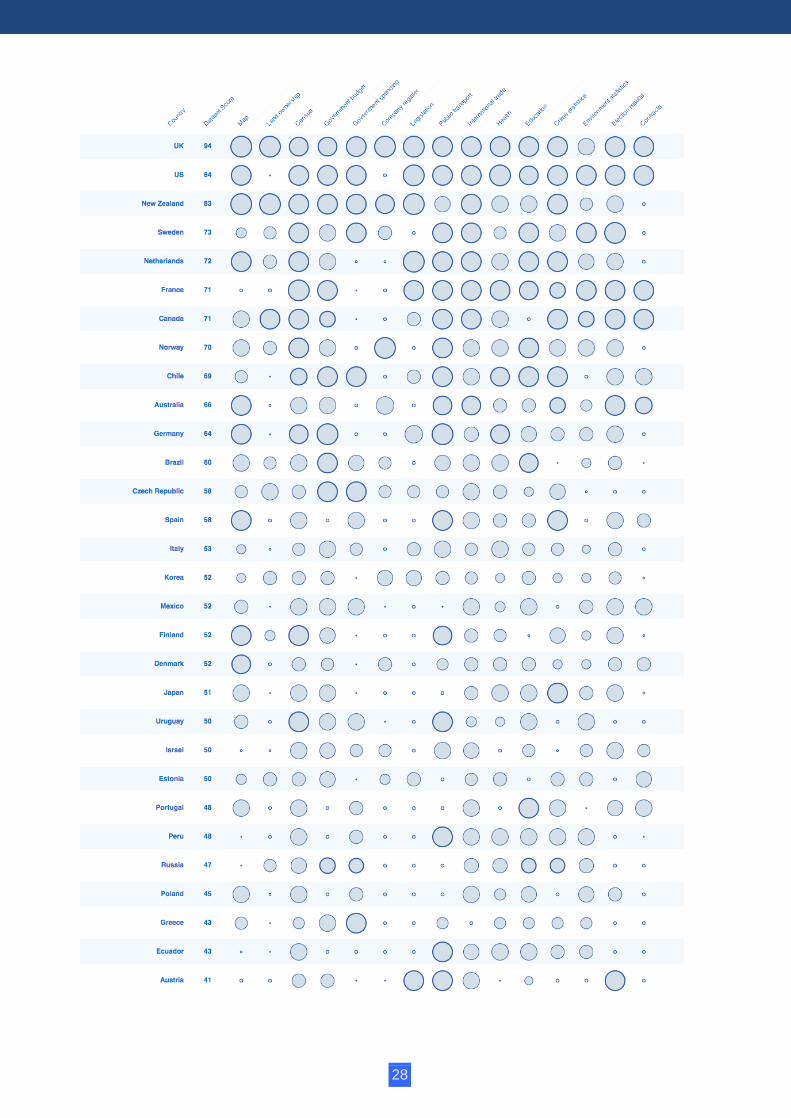
28

29

30

31
Impact
Entrepreneurial open data use has overtaken accountability as the most observed impact from OGD initiatives. Transparency and accountability impacts are the second most observed impact, though within “emerging and advancing” countries, transparency and accountability impacts come top. The effective use of open data to increase environmental sustainability and support greater inclusion of marginalised groups remains extremely limited. Many different outcomes and impacts are anticipated from OGD. Our research finds that impacts cannot be attributed to datasets alone, but instead rely upon a constellation of practices in a country that make up open data initiatives as a whole. As a proxy measure for impact, the Open Data Barometer asks researchers to identify case studies in media or academic literature, from the last twelve months, of open data being used to create various kinds of impacts. The maximum scores are available for cases of strong peer-reviewed evidence. In general, most evidence of open data impact remains anecdotal or captured in journalistic rather than academic reviews, and stories initially cited in research often describe outputs rather than outcomes and impacts. This influences the relatively low average scores in this section of the Barometer report.
Areas of impact
When countries without an open data initiative, or those with weaker and earlier stage initiatives, are removed from the sample, there is a clear trend towards greater perceived impact. Over the last year there has been an increase in the perceived use of open data by entrepreneurs to build new products and services. By contrast, there has been relatively little change in the perceived use of data to address environmental issues, or to increase inclusion. It is also notable that evidence proving the economic growth returns on open data — and which could be used to back up the strong claims that have been made based on theoretical arguments — is not yet forthcoming.
Influences on impact
There is a strong correlation between open data readiness and open data impact, as measured by the Barometer. The scatter plot below shows the readiness sub-index plotted against the impact sub-index. The colour coding by region indicates clearly that both readiness and impact remain unevenly distributed across the world.

32
The correlation between the readiness and impact sub-indexes is between 0.8 and 0.9, indicating a strong connection between a country’s readiness and the impact that expert researchers observe.

33
Rankings

34
Global rankings
To create a global ranking, we aggregated the sub-indexes of the Open Data Barometer. Comparing scores and ranks in the second edition with those in the first can help to identify countries making progress, and those where progress has stalled. As this year’s Barometer covers 86 countries (compared with the 77 countries covered in 2013), a change in rank position may result both from new countries entering the assessment above or below the score of a previously included country, as well as from substantial changes to that country’s score. The table below presents the global rankings of the Open Data Barometer, including the overall Barometer score, as well as comparisons between the first and second editions of the Barometer. You can sort and filter this table and group by various facets, including country clusters, region and income level. Scaled country scores are rounded to the nearest whole number before ranks are assigned, meaning a number of countries receive tied rankings.

35
At the end of this chapter you will find rankings tables by region and cluster.
Analysis
In this section, we analyse the rankings and the changes between the first and second editions of the Open Data Barometer. The purpose here is not to provide an exhaustive account of all changes, but to identify notable trends, and to explore the extent to which the Barometer can act as a useful heuristic for understanding the changing landscape of open data around the world. Just 16 of the 77 countries (20%) included in the 2013 Open Data Barometer saw a reduction in their scaled ODB score in this 2014 edition. In general, the trend is towards steady, but not outstanding, growth in open data readiness and implementation. However, the picture varies substantially across the different country clusters.
Capacity constrained In the capacity constrained cluster, Indonesia and Nigeria saw the strongest growth in ODB score and rank; Kenya experienced the largest fall in rank. In countries with civil society-led activities, such as

36
Nepal and Uganda, the continued limits on government engagement with their open data initiatives caused minor score reductions.
Indonesia’s role as lead chair of the Open Government Partnership in 2013/14 focussed both domestic and international attention on the development of open data policy and practice in the country. There has been growing civil society engagement around open data, particularly in urban centres like Jakarta, and some increase in the availability of capacity building training and support for innovation. In Nigeria, the Minister of Communication Technology launched an OGD initiative in January 2014, with a series of engagement activities designed to involve stakeholders in shaping the country's policies, and to provide training and capacity building for potential data users.14 This federal-level initiative, supported by the World Bank and the UK Department for International Development (DFID), followed on from the first state-level initiative in Africa launched in the state of Edo
in September 2013.15 A number of civil society organisations in Nigeria have sought to develop information- and advocacy-based work with open data, including BudgIT, which works to simplify and communicate the Nigerian budget, and Follow The
Money, which has developed a series of campaigns tracking aid and government finance, including a successful and ongoing campaign to secure the distribution of funds pledged to clean up lead-poisoned land in Zamfara state.16 The University of Ilorin in Nigeria has also been exploring ways to build student capacity to engage with open data — the Computer Science Department has hosted hackathons and, following participation in the Web Foundation's Open Data in Developing Countries project, established an Open Data Research Group. At the other end of the table, Kenya has fallen 27 places in the overall rankings, and has seen a reduction in scaled ODB score from 43 to 26. While many hoped that the high-profile launch of an open data portal in 2011 would be followed by ongoing commitment and a policy framework for open data, no such framework has come into force, and few updates have been made to the data on the portal over recent years. The stagnation of Kenya's open data activities has been the topic of much discussion, including by some of the lead architects of its open data movement, who argue for a renewed commitment to open data that builds on legislative foundations in the country’s Right to Information and Data Protection Laws.17 Kenya has also gone through a process of constitutional reform, devolving power to local governments. While this presents an important opportunity to design new infrastructures of administrative data management which apply “open by default” principles, there is little evidence that this is happening. The failure of Kenya to sustain the supply of timely and
14
Punch NG, (Jan 31st 2014), Govt commences open data initiative http://www.punchng.com/business/business-economy/govt-commences-open-data-initiative/ ; Government of Nigeria, (Jan 29th 2014), FG Kicks Off Open Data Initiative http://commtech.gov.ng/index.php/videos/news-and-event/128-fg-kicksoff-opendata-initiative 15
Channels Television (Sept 13th 2013), Edo Launches First Open Data Portal In Nigeria, http://www.channelstv.com/2013/09/13/edo-launches-first-open-data-portal-in-nigeria/ 16
The #SaveBagega campaign addressed delays in allocating pledged funds to the clean-up of lead poisoning in Northern Nigeria. Through budget data visualisation and mobilising popular attention, the campaign sought to pressure the government to disburse pledged funds, and has maintained ongoing tracking of spending on the clean-up operation. http://followthemoneyng.org/savebagega.html 17
NDemo, Bitange (Nov 24th 2014), Open contracting format can clean up government procurement http://www.nation.co.ke/oped/blogs/dot9/ndemo/-/2274486/2532264/-/1wpu9kz/-/
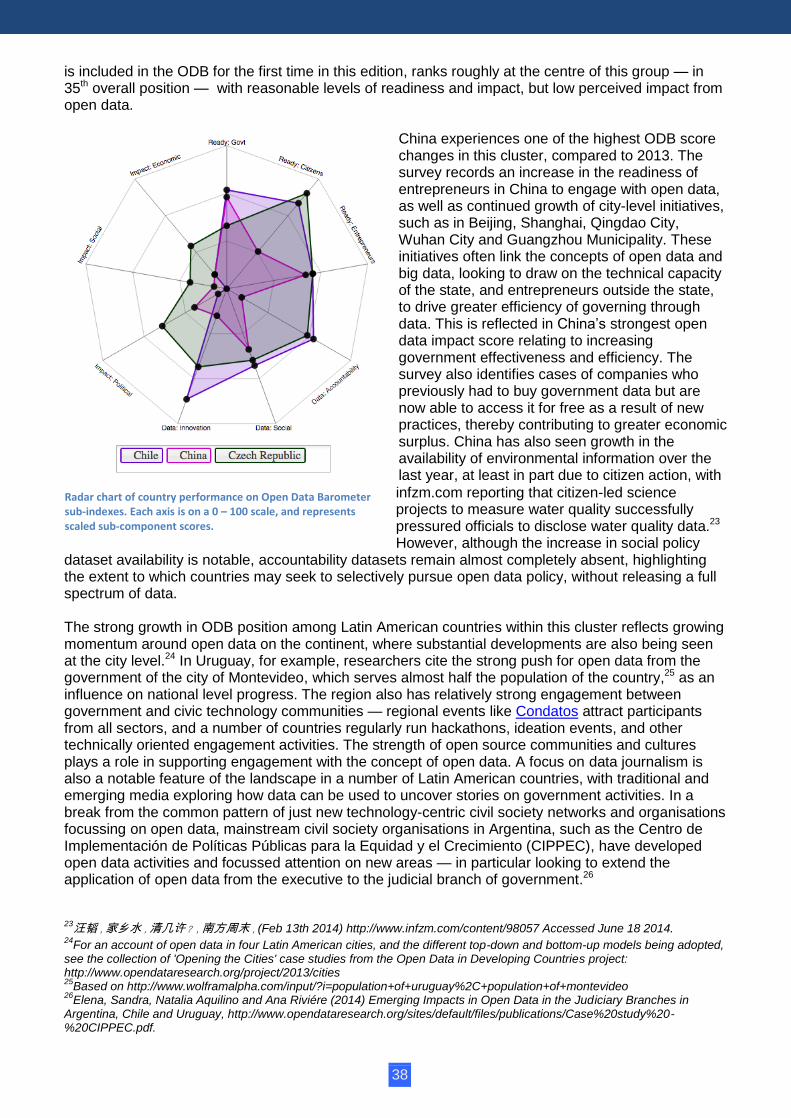
Radar chart of country performance on Open Data Barometer sub-indexes. Each axis is on a 0 – 100 scale, and represents scaled sub-component scores. An interactive version to compare any set of countries is available at opendatabarometer.org/report/analysis/rankings.html

37
relevant open data, and the limited sustainability and scalability of applications built by local developer communities using government data,18 should raise significant questions about the appropriate design of open data initiatives in capacity constrained countries. There are considerable similarities in the readiness levels of Nigeria, Indonesia and Kenya. Whether the open data initiatives adopted in Nigeria and Indonesia can be sustained beyond initial donor investments and interest may depend on whether the models used can shift from simply transplanting practice from higher capacity countries, to developing open data practices that respond to the local availability of technical intermediaries, the capacities of different parts of government, and the local social dynamics of information access and trust.19 Ghana also provides a useful point of comparison — open data supply has increased, but the impacts of this data availability are yet to be seen. Ghana experienced a minor drop in readiness in this year’s Barometer, primarily as a result of limited attention to open data following the country’s 2012 launch of an open data initiative. While the last year has seen steady growth in open data availability from data.gov.gh, there is little evidence of community engagement at present, and the Barometer records no evidence of impacts from open data use in Ghana. Two countries that have been exploring alternative models for open data are Nepal and Uganda. Both countries have created civil society networks — Open Nepal and Open Development Uganda — and have created their own data portals independent of government.20 The Open Data Barometer’s current focus on government data activities does not fully capture these efforts in the quantitative scoring, though there have been efforts to engage with government in each country, including through technical agencies and specific ministries. These initiatives points towards one possible future for an inclusive data revolution — one in which open data initiatives are developed as equal multi-stakeholder partnerships between civil society, government, donors, and social entrepreneurs, cooperatively working to increase the quantity and quality of data available to improve decision making by all parties. However, the extent to which current models of support and financing for open data activities are set up to enable growth of such models is unclear. Countries to watch in the coming year in this cluster include Botswana, where an open data readiness assessment was recently undertaken21, although it currently lacks a Right to Information law; and Sierra Leone, who also has the potential to develop open data activities over the coming year — the country recently passed a Right to Information law and is exploring ways to integrate open data into the roll out of the new RTI processes, and to make data accessible in both digital and non-digital formats.22
Emerging and advancing The last year has seen considerable growth in the availability of data, as well as minor growth in impacts and gains in readiness, among emerging and advancing economies. All the countries in this cluster should have the domestic resources to institutionalise OGD practices, but need to continue to build broad-based political and civil society support in order to effectively embed open data. In this cluster, Chile, Uruguay, China, Peru, Brazil, Czech Republic, Ecuador, Greece, Hungary, Spain, South Africa, and Mexico all saw growth in terms of readiness and implementation. Progress was more moderate in Colombia, Ireland, Italy, the Philippines, Portugal, Russia and Tunisia, and changes in Argentina, Costa Rica and India are within the margin of error of the study. Poland, which
18
Mutuku, Leonida, and Christine Mahihu. (2014) Understanding the Impacts of Kenya Open Data Applications and Services. http://opendataresearch.org/sites/default/files/publications/ODDC%20Report%20iHub.pdf. 19
See for example Chiliswa, Zacharia. (2014) Open Government Data for Effective Public Participation: Findings of a Case Study Research Investigating The Kenya's Open Data Initiative in Urban Slums and Rural Settlements, http://opendataresearch.org/sites/default/files/publications/JHC%20Publication%20April%202014%20-%20ODDC%20research.pdf. which explores patterns of information access and use in rural and urban slums in Kenya, and which raises important considerations for 20
E.g. http://data.opennepal.net/datasets and http://catalog.data.ug/dataset 21
Botswana Innovation Hub (June 10th 2014) The Open Data Readiness Assessment - http://www.bih.co.bw/detail.php?id=220 22
Abdulai, E (May 26th 2014) Connecting Open Data and the Right to Information in Sierra Leone http://www.opendataresearch.org/content/2014/642/connecting-open-data-and-right-information-sierra-leone
38
is included in the ODB for the first time in this edition, ranks roughly at the centre of this group — in 35th overall position — with reasonable levels of readiness and impact, but low perceived impact from open data.
China experiences one of the highest ODB score changes in this cluster, compared to 2013. The survey records an increase in the readiness of entrepreneurs in China to engage with open data, as well as continued growth of city-level initiatives, such as in Beijing, Shanghai, Qingdao City, Wuhan City and Guangzhou Municipality. These initiatives often link the concepts of open data and big data, looking to draw on the technical capacity of the state, and entrepreneurs outside the state, to drive greater efficiency of governing through data. This is reflected in China’s strongest open data impact score relating to increasing government effectiveness and efficiency. The survey also identifies cases of companies who previously had to buy government data but are now able to access it for free as a result of new practices, thereby contributing to greater economic surplus. China has also seen growth in the availability of environmental information over the last year, at least in part due to citizen action, with
infzm.com reporting that citizen-led science projects to measure water quality successfully pressured officials to disclose water quality data.23 However, although the increase in social policy
dataset availability is notable, accountability datasets remain almost completely absent, highlighting the extent to which countries may seek to selectively pursue open data policy, without releasing a full spectrum of data. The strong growth in ODB position among Latin American countries within this cluster reflects growing momentum around open data on the continent, where substantial developments are also being seen at the city level.24 In Uruguay, for example, researchers cite the strong push for open data from the government of the city of Montevideo, which serves almost half the population of the country,25 as an influence on national level progress. The region also has relatively strong engagement between government and civic technology communities — regional events like Condatos attract participants from all sectors, and a number of countries regularly run hackathons, ideation events, and other technically oriented engagement activities. The strength of open source communities and cultures plays a role in supporting engagement with the concept of open data. A focus on data journalism is also a notable feature of the landscape in a number of Latin American countries, with traditional and emerging media exploring how data can be used to uncover stories on government activities. In a break from the common pattern of just new technology-centric civil society networks and organisations focussing on open data, mainstream civil society organisations in Argentina, such as the Centro de Implementación de Políticas Públicas para la Equidad y el Crecimiento (CIPPEC), have developed open data activities and focussed attention on new areas — in particular looking to extend the application of open data from the executive to the judicial branch of government.26
23汪韬,家乡水,清几许?,南方周末,(Feb 13th 2014) http://www.infzm.com/content/98057 Accessed June 18 2014.
24For an account of open data in four Latin American cities, and the different top-down and bottom-up models being adopted,
see the collection of 'Opening the Cities' case studies from the Open Data in Developing Countries project: http://www.opendataresearch.org/project/2013/cities 25
Based on http://www.wolframalpha.com/input/?i=population+of+uruguay%2C+population+of+montevideo 26
Elena, Sandra, Natalia Aquilino and Ana Riviére (2014) Emerging Impacts in Open Data in the Judiciary Branches in Argentina, Chile and Uruguay, http://www.opendataresearch.org/sites/default/files/publications/Case%20study%20-%20CIPPEC.pdf.
Radar chart of country performance on Open Data Barometer sub-indexes. Each axis is on a 0 – 100 scale, and represents scaled sub-component scores.

39
Brazil is one of a number of governments that is working to create a “National Infrastructure for Open Data (INDA)” by setting out clear processes for the institutionalisation of open data policy. Much like the open approach of Project Open Data in the USA, the Brazilian INDA project has established an open collaboration space, oriented towards the involvement of technical communities in setting meta-data standards, building out open data technologies, and modelling data. In reviewing Open Data Barometer scores across Latin America, it is notable that limited use of open licenses acts as a downward pressure on the implementation scores achieved for countries in the region. Qualitative research into the supply and use of budget data in Brazil has noted the low levels of awareness of licensing issues amongst data publishers and users, raising questions as to how important license issues are to open data within the Brazilian, and wider regional, context.27 Tunisia, Morocco and South Africa are the only African countries to feature in this cluster. In spite of the potential resources to support an OGD initiative in South Africa — both in terms of government capacity and civil society and private sector capacity — the country has not yet established a national project, nor does it include commitments to open data in its Open Government Partnership National Action Plan.28 However, the Western Cape provincial government is working on a provincial open data policy — potentially providing foundations for future national efforts — and the City of Cape Town adopted an open data policy in September 2014.29 These developments were cautiously welcomed by
civil society, although some expressed concerns around licensing and review mechanisms.30
Tunisia established an open data portal in 2012, and has continued to maintain the site. However, research suggests there is limited engagement with civil society users, and that the open data user community has not expanded substantially over the last year, leading to only moderate growth in Tunisia's overall score. Perceived political impacts of the Tunisian OGD initiative have also fallen in this year’s Barometer, suggesting a widening gap between the hope for the portal as part of building a transparent democratic state, and the current reality. Morocco's ODB score has also fallen in this edition. Though Morocco was the first country in Africa to establish a data portal, the quality, timeliness, and relevance of the datasets currently being made available is limited. There is some evidence of community engagement between government and groups, such as the local Open Knowledge Foundation, but an evaluation of the initiative noted that "despite its innovative nature, the Moroccan open data initiative did not enjoy the interest it deserved; the released datasets are/have remained very limited. This situation is certainly related to the fact that the initiative has been led by a governmental entity ... in a very isolated fashion, without being inscribed in any true governmental strategy and [promoted] through a very insufficient communication".31
The European countries included in this cluster include, in rank order, are Spain, Czech Republic, Italy, Russia, Portugal, Greece, Ireland, Hungary and Poland. Common across all these countries, with the exception of Russia, is a greater level of civil society readiness vis-a-vis the readiness of government or entrepreneurs, and a lower level of perceived social impact from open data. This low level of government readiness may reflect the absence of a substantive OGD initiative, as in Poland, or may identify contexts where initiatives are established, but are progressing relatively slowly when compared to the rest of Europe, such as in Spain. In this group, the Czech Republic has seen the
27
Beghin, Nathalie, and Carmela Zigoni (2014). Measuring Open Data’s Impact of Brazilian National and Sub-National Budget Transparency Websites and Its Impacts on People’s Rights, http://opendataresearch.org/sites/default/files/publications/Inesc_ODDC_English.pdf. 28
South Africa OGP National Action Plan (2013) http://www.opengovpartnership.org/sites/default/files/OPG%20booklet%20final%20single%20pages.pdf 29
City of Cape Town Open Data Policy (2014) http://www.capetown.gov.za/en/Policies/All%20Policies/Open%20Data%20Policy%20-%20%28Policy%20number%2027781%29%20approved%20on%2025%20September%202014.pdf 30
Eyal, A. Cape Town’s Open Data Policy, Time to Celebrate? (2014) http://code4sa.org/2014/09/27/capetown-opendata-policy.html 31
Maghreb Digital (2013) Rapport Open Data : a libération des données publiques au service de la croissance et de la connaissance http://www.maghreb-digital.com/projet/wp-content/uploads/2013/07/Open-Data-Maroc.pdf
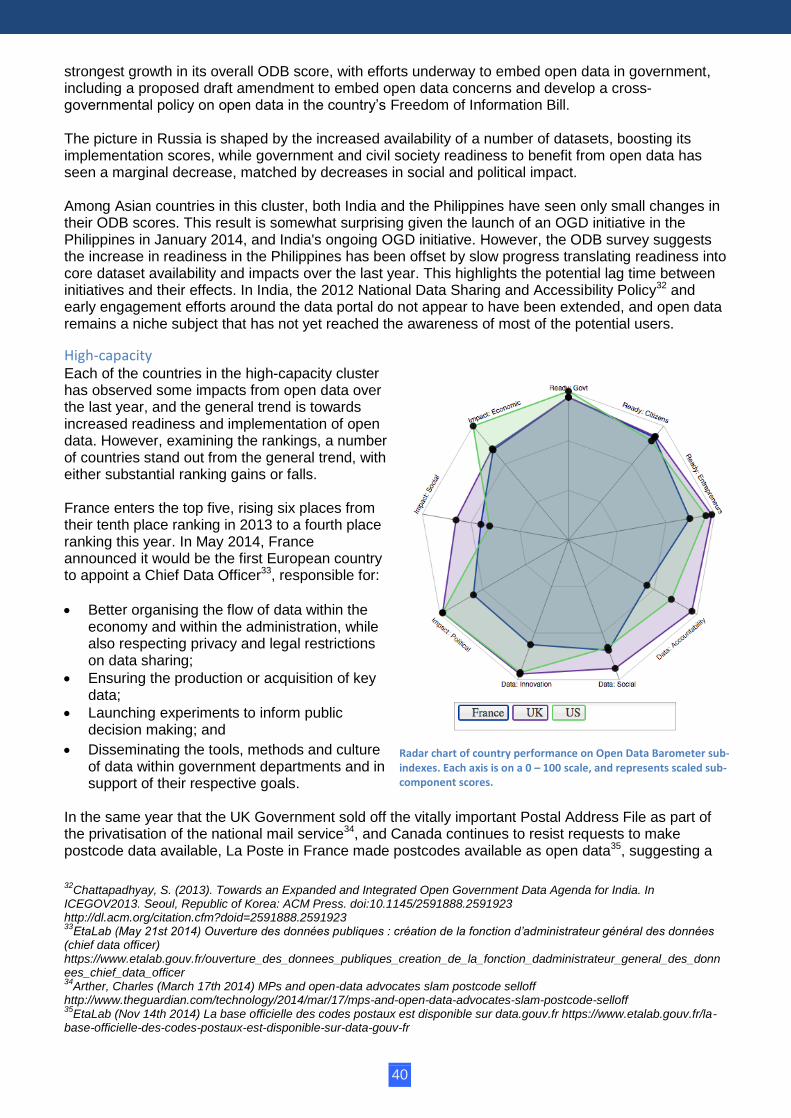
40
strongest growth in its overall ODB score, with efforts underway to embed open data in government, including a proposed draft amendment to embed open data concerns and develop a cross-governmental policy on open data in the country’s Freedom of Information Bill. The picture in Russia is shaped by the increased availability of a number of datasets, boosting its implementation scores, while government and civil society readiness to benefit from open data has seen a marginal decrease, matched by decreases in social and political impact. Among Asian countries in this cluster, both India and the Philippines have seen only small changes in their ODB scores. This result is somewhat surprising given the launch of an OGD initiative in the Philippines in January 2014, and India's ongoing OGD initiative. However, the ODB survey suggests the increase in readiness in the Philippines has been offset by slow progress translating readiness into core dataset availability and impacts over the last year. This highlights the potential lag time between initiatives and their effects. In India, the 2012 National Data Sharing and Accessibility Policy32 and early engagement efforts around the data portal do not appear to have been extended, and open data remains a niche subject that has not yet reached the awareness of most of the potential users.
High-capacity Each of the countries in the high-capacity cluster has observed some impacts from open data over the last year, and the general trend is towards increased readiness and implementation of open data. However, examining the rankings, a number of countries stand out from the general trend, with either substantial ranking gains or falls. France enters the top five, rising six places from their tenth place ranking in 2013 to a fourth place ranking this year. In May 2014, France announced it would be the first European country to appoint a Chief Data Officer33, responsible for:
Better organising the flow of data within the economy and within the administration, while also respecting privacy and legal restrictions on data sharing;
Ensuring the production or acquisition of key data;
Launching experiments to inform public decision making; and
Disseminating the tools, methods and culture of data within government departments and in support of their respective goals.
In the same year that the UK Government sold off the vitally important Postal Address File as part of the privatisation of the national mail service34, and Canada continues to resist requests to make postcode data available, La Poste in France made postcodes available as open data35, suggesting a
32
Chattapadhyay, S. (2013). Towards an Expanded and Integrated Open Government Data Agenda for India. In ICEGOV2013. Seoul, Republic of Korea: ACM Press. doi:10.1145/2591888.2591923 http://dl.acm.org/citation.cfm?doid=2591888.2591923 33
EtaLab (May 21st 2014) Ouverture des données publiques : création de la fonction d’administrateur général des données (chief data officer) https://www.etalab.gouv.fr/ouverture_des_donnees_publiques_creation_de_la_fonction_dadministrateur_general_des_donnees_chief_data_officer 34
Arther, Charles (March 17th 2014) MPs and open-data advocates slam postcode selloff http://www.theguardian.com/technology/2014/mar/17/mps-and-open-data-advocates-slam-postcode-selloff 35
EtaLab (Nov 14th 2014) La base officielle des codes postaux est disponible sur data.gouv.fr https://www.etalab.gouv.fr/la-base-officielle-des-codes-postaux-est-disponible-sur-data-gouv-fr
Radar chart of country performance on Open Data Barometer sub-indexes. Each axis is on a 0 – 100 scale, and represents scaled sub-component scores.

41
willingness to focus on the availability of high value datasets. Considerable outreach activities and a growth of well-resourced municipal open data initiatives have also contributed to France's rise in the Barometer tables. The challenge ahead for France — which received relatively low impact scores on the social and environmental benefits of open data, and is preparing to deliver its first Open Government Partnership National Action Plan in early 2015 — will be to further broaden open data out beyond administrative and technical communities, and to translate open data availability into diverse uses and impacts. Austria, Belgium and the Netherlands have each moved three or more places up the Barometer rankings. After the federal election in late 2013, Austria’s new government included open data in its coalition agreement36, but researchers reported that, as of August 2014, no member of the cabinet could be identified as in charge of the subject. In general, the Austrian open data agenda appears to be driven by several major cities and regions; in centres such as Vienna, start-up activity around open data is generating social, economic and environmental returns. The application Solarize, for example, available for Upper Austria and based on open datasets, is designed to help people understand the benefits of having their own solar or photovoltaic generation.37 In both Belgium and the Netherlands, open data policy is supported by a strong push from organised civil society groups, as well as support from those groups to stimulate the use of open data through hackathons and other activities. Researchers identified a much greater rate of open data publication in the Netherlands, where almost 50% of datasets surveyed qualified as open under the open definition. However, there was greater optimism about the potential impacts of open data in Belgium, albeit a decrease in perceived impacts of open data on accountability. Finland has also experienced substantial growth in its overall Barometer score. As the host of the 2012 Open Knowledge Festival, strong links appear to have been built in Finland between civil society, government, and businesses, establishing broad awareness of open data in the media, among civil society actors, and among certain sections of the business community. This second edition of the Barometer also indicates increased impact of open data in Finland, although as yet there has not been an in-depth evaluation of the open data policy’s impacts to verify anecdotal evidence. Israel, Japan, Korea, Norway, Germany and Australia all have seen more modest changes in their overall scores, although in a number of cases, as other countries move ahead faster, this has led to drops in their overall ranking. Denmark and Iceland both experienced modest reductions in their scores and rankings — mostly as a result of weaker implementation — which appear to be in part correcting for some over-scoring of dataset openness in these countries in 2013. As the rankings table above shows, countries towards the top of the Open Data Barometer have very similar readiness, implementation, and impact scores, making the highest rankings open to just about any country in the high-capacity cluster. In future editions of the Barometer, new variables may be required to better discriminate between high-capacity countries, and to identify the key areas for further attention and progress. The UK, USA and Sweden remain at the top of this cluster, and at the top of the Barometer overall. Each country has placed an emphasis on the economic growth potential of open data and, over the last year, each has continued to develop mechanisms for engaging with private sector data users — from the Open Data User Group in the UK, to the Open Data Forum convened by the Ministry of Enterprise and Innovation in Sweden, and the Open Data Roundtables series convened by the GovLab at NYU in partnership with the US Federal Government. They have also focussed on gathering stories of business re-use of open data, contributing to strong economic impact scores. Some fears have been raised that this emphasis comes at the cost of a focus on the social and environmental impacts of data. While an analysis across our data suggests support for innovation in general is correlated with social and political impacts, these can also be more explicitly designed for, with specific attention paid to including diverse actors in shaping data supply, and benefiting from capacity building.
36
Austrian Federal Chancellery (Dec 2013) Work programme of the Austrian Federal Government 2013–2018 https://www.bka.gv.at/DocView.axd?CobId=53588 37
https://www.data.gv.at/anwendungen/solarize/ / http://solarize.at/en/

42
There remain many issues for Barometer leaders to work on. For example, open data licensing in Sweden is still applied inconsistently, and in the UK, flagship datasets, such as transactional level spending for government departments, is often — according to the government's own dashboard — out of date, limiting the utility of this for scrutiny of government.38 Over the last year, the US website data.gov has been re-launched with a stronger slant towards developer communities, suggesting that early efforts at broad community engagement have not taken root, and highlighting a need for sustained activity to take open data beyond the technical and developer communities to reach out to the full community of potential users.
One-sided initiatives The small number of countries clustered under “one-sided initiatives” all have high levels of Internet penetration, high or upper-middle income status, and strong government capacity. All lack Right to Information laws. In most cases there is also a reasonable level of government capacity. However, civil society freedoms and capacity are very limited in this cluster, as is the breadth of data published by governments. The outlier in this group may be Malaysia, which is the highest ranked country in this cluster (and perhaps the weakest fit in the cluster, as the Freedom House measure of civil society freedoms used in the readiness component scores of the Barometer scores Malaysia almost 100% higher than others in the cluster). The Malaysian open data initiative currently provides over 100 datasets from 11 different ministries. However, researchers note that there has been very little outreach to engage users with the data, or to prioritise the publication of those datasets most in demand. The lack of a Right to Information law further undermines space for the
initiative to be demand-driven, rather than implemented top-down by government. The UAE scores highest on readiness in this cluster,
in part because of policy commitments that have been made to open data within the framework of well-funded e-government reforms. This equation of open data with an e-government, rather than an open government paradigm, is characteristic of engagement with open data within the Gulf States, and is reflected in the fact that even though the countries in this cluster have reasonable levels of readiness among entrepreneurs to engage with data, few economic impacts have yet been identified, and social impact is very weak. A broader framing of open data as associated with "[supporting] the ... National Development Strategy 2011-2016’s call for Transparency, Efficiency and Participation of its people" was present in a March 2014 consultation on open data policy in Qatar39, though the translation of this into the availability of key transparency, accountability and social policy datasets remains to be seen.
38
http://data.gov.uk/data/openspending-report/index 39
ICT Qatar (2014) Public Consultation on draft Open Data Policy http://www.ictqatar.qa/en/documents/document/public-consultation-draft-open-data-policy
Radar chart of country performance on Open Data Barometer sub-indexes. Each axis is on a 0 – 100 scale, and represents scaled sub-component scores.
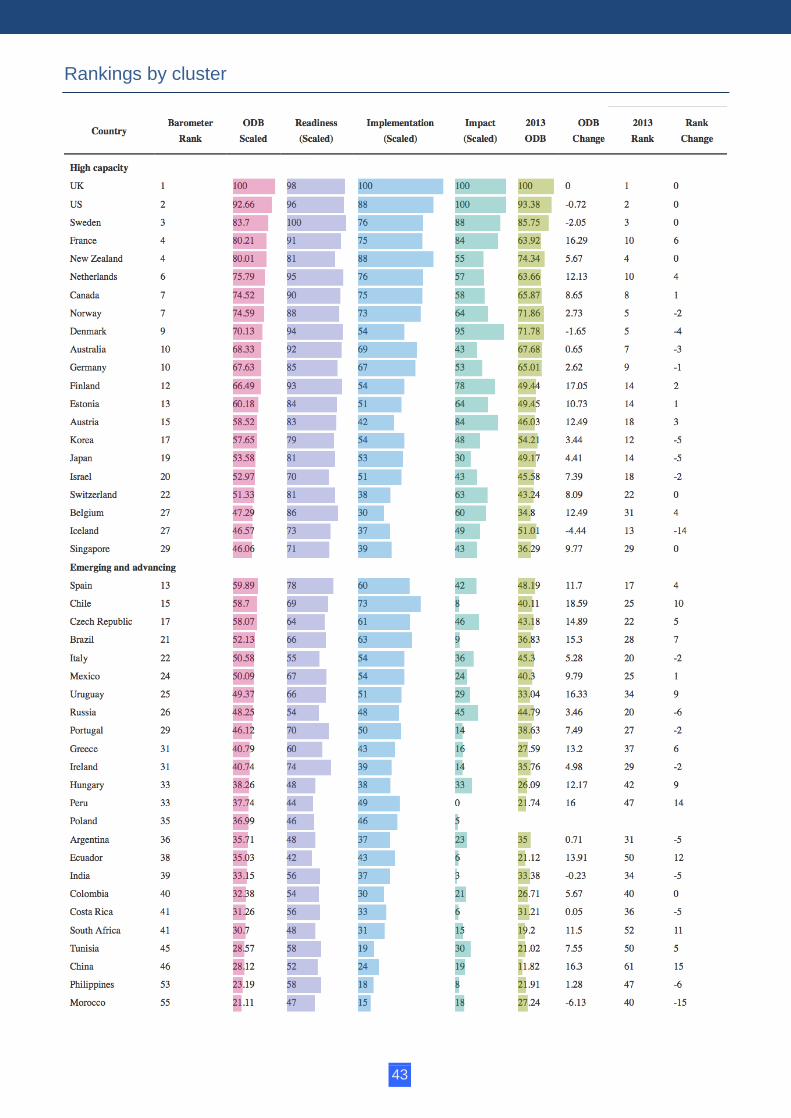
43
Rankings by cluster
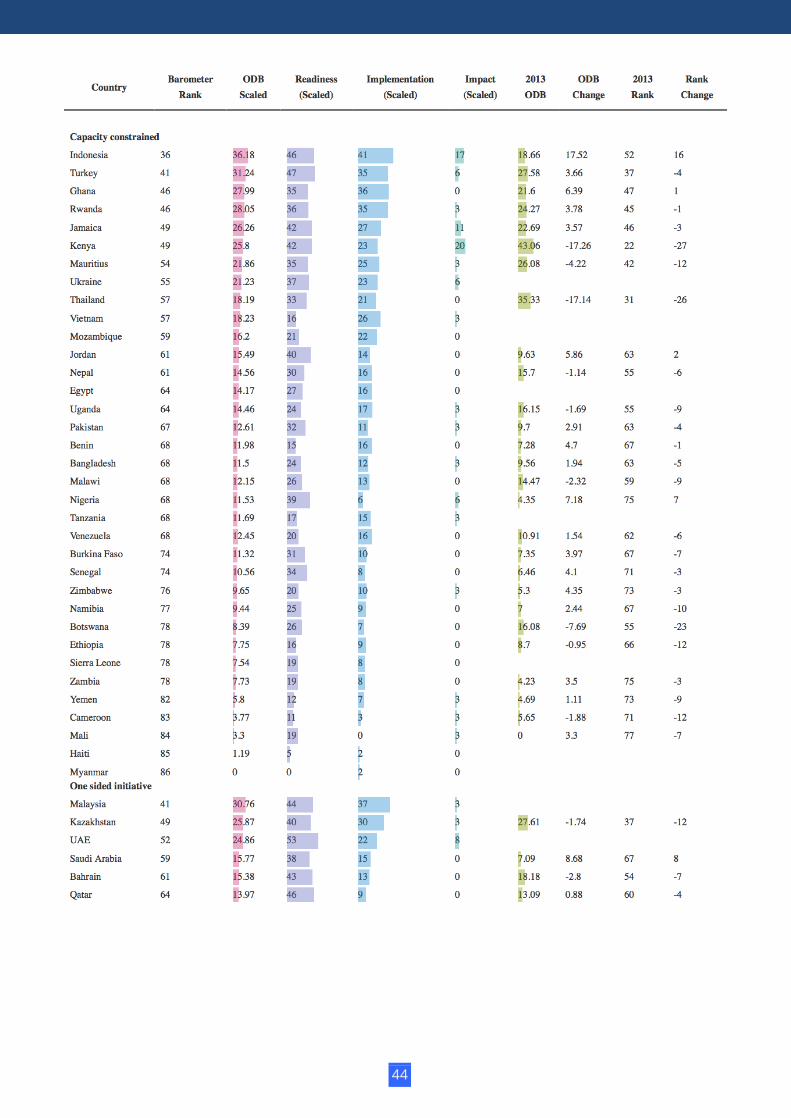
44

45
Rankings by region

46

47
Conclusions
In this report we have only been able to explore a small fraction of the data captured by our surveys. While high-income, high-capacity countries are continuing to embed open data policies, albeit with increasing focus on economic rather than civic aspects, across the rest of the world, the picture that emerges is one of a widening gap between those able to establish and sustain open data programmes, and those countries where open data activities have stalled, moved backwards, or not yet begun. As data becomes ever more important in shaping policy debates, the importance of citizens having effective access to data grows; yet without dedicated efforts, the unfolding “data revolution” risks leaving many behind. Our findings also suggest that the answers do not lie in taking models and “best practices” from high-capacity countries alone — there are many lessons to be learned from countries with emerging and advancing open data initiatives, and critical lessons to learn from successes and failures in capacity constrained countries. If we trust that the idea of “open by default” is becoming widely established, then the challenge we face now is to innovate, building towards a second wave of focussed and intentional open data initiatives, and to invest time and energy in putting the idea of “open by default” on firm foundations. This requires not only developments in open data practice, but also developments in how it is measured and monitored. Effectively capturing the potential of open data initiatives to reduce corruption, improve public services and governance, and empower citizens will require world leaders to take a series of concrete actions to address the political and resource barriers that threaten to stall open data efforts. High-level political commitment is essential to guaranteeing the proactive and disclosure of fully open government data — that is, data that can be freely used, modified and shared by anyone, and that is available free of charge. The requirement to disclose and regularly update this data should be mandated in law or policy as part of a wider right to information, and governments at the same time should guarantee that strong privacy protections are in place and respected. Governments will further need to ensure that investment in and support of both city- and national-level programmes is consistent and sustained beyond initial open data efforts. In addition to mandating the supply of OGD, governments must work to enhance the ability of civil society and entrepreneurs to understand and use the data effectively; this can be accomplished through trainings, as well as the contextualisation of open data tools approaches to local needs. Through this two-year pilot of the Open Data Barometer we have established a corpus of data that can support further in-depth research to understand the dynamics of open data. By going beyond counting datasets and recognising that openness has many dimensions, our hope is that this work contributes to dialogue about the kinds of openness citizens want, and to critical activity that helps build better and more inclusive open data initiatives.

48
Annex: Detailed methodology

49
Methodology
This section outlines in detail the construction of the Open Data Barometer rankings, including details of the primary and secondary data used. The methodology used in this second edition of the Open Data Barometer broadly replicates that used in 2013. However, as part of work towards Common Assessment Methods on Open Data, future versions of the Barometer are likely to include additional components to look further at data use and impacts.
Overview
The sub-indexes, components and overall ranking in the ODB draw on three kinds of data:
Peer-reviewed expert survey responses - between June and September 2014 we included a series of questions in the Web Index expert survey, asking country specialists to respond to a number of detailed questions about the open data situation in a specific country (see below for the list of questions in the survey). Each question invited a response on a 0 - 10 scale, with detailed scoring guidance provided. Researchers also provided detailed citations for all scores. Responses were peer-reviewed, re-scored by researchers where required, and cross-checked by the research coordination team. For the construction of sub-components and sub-indexes, scores were normalised using z-scores for each question. This converts the 0 - 10 score into a measure of how far above or below the mean (in standard deviations) any given answer is. Normalisation gives us the ability to compare how well countries are doing relative to one another, and makes the measurements more robust to marginal alterations in scoring guidance year-on-year. The mean and standard deviation values from 2013 were used, in order that the z-scores are comparable between the two years of data.
Detailed dataset assessments - between August and October 2013 a team of technical specialists investigated the availability of 15 kinds of data within each country, and answered a 10-point checklist with respect to the qualities of data provided. This small group of technical experts each assessed one or more countries, drawing upon source material provided by country experts in the expert survey. These assessments were peer-reviewed and subjected to a detailed review by a team of three technical reviewers. For the Barometer Ranking, an aggregation logic and weightings were applied to the checklist results (see below) to generate a score between 0 and 100. These scores were not individually normalised, to allow clear comparison between the different datasets in the Barometer, but the aggregated index of dataset availability (the Implementation Sub-Index) was normalised using z-scores to bring it onto the same scale as other questions prior to inclusion in overall Index calculations.
Secondary data - in order to complement the expert survey data for the ODB in the Readiness section of the Barometer, we draw on five secondary indicators, each selected on the basis of theory and their ability to measure important aspects of readiness not covered in our survey. Four of these are based on independent expert surveys (by the World Economic Forum; Freedom House and the United Nations Department of Economic and Social Affairs) and one is based on World Bank collated data on Internet penetration.
For the Barometer Rankings, these variables are each normalised using the same approach as for our peer-reviewed expert survey data (z-scores based on 2013 mean and standard deviation).
Structure
The Barometer builds upon tri-partite structure with three sub-indexes, each containing three components. The weightings of these in the aggregated Open Data Barometer score and ranking are shown in brackets.

50
Readiness (1/4) (Primary & secondary data)
Implementation (2/4) (Dataset assessments)
Impacts (1/4) (Primary data)
Government (1/3)
Entrepreneurs & business
(1/3)
Citizens & civil
society (1/3)
Accountability dataset cluster (1/3)
Innovation dataset cluster (1/3)
Social policy
dataset cluster (1/3)
Political (1/3)
Economic (1/3)
Social (1/3
This structure is based on the idea that:
Effective OGD initiatives requires involvement of Government, Civil Society and the Private Sector;
OGD has a range of potential impacts, and the choices made in implementing an OGD policy may affect which of these impacts are realised;
The first edition Barometer incorrectly reported the sub-indexes as equally weighted on page 37. The first edition weights were: Readiness (1/5); Implementation (3/5); Impact (1/5) (i.e. 60% of the overall ranking was based on implementation). In the second edition 50% of ranking is based on implementation, with the rest split 25% to readiness, and 25% to impact. The higher weighting of implementation in the first two editions of the Open Data Barometer reflects the focus, in this pilot phase of the project, on exploring progress towards open data implementation and impact over time, and judgements on the relative strength of the primary data collected in each year. The small reduction in weighting of implementation from the first to second editions reflects the direction of travel in the Barometer in future towards assessing use and impact, whilst seeking to maintain comparability of rankings between first and second editions.
Sub-indices
Readiness sub-index: primary and secondary data The Open Data Barometer measures readiness through three components focussing on: Government; Citizens and Civil Society; and Entrepreneurs and Business. We are not measuring readiness to start an open government data initiative, but rather readiness to secure positive outcomes from such an initiative. As such, we include measures relating to the existence of open data, and a range of interventions that support engagement with and re-use of open data. Each of the groups is important for a successful OGD initiative. As Tim Berners-Lee has observed, open data “has to start at the top, it has to start in the middle and it has to start at the bottom”40. Policies and portals are just one component of an effective open data agenda. In carrying out qualitative Open Data Readiness assessment across a number of countries from 2010 to 2013, the Web Foundation developed a six-dimensional framework for looking at the Political, Organisational, Legal, Social, Economic and Technical context within a country in order to understand factors that may facilitate or inhibit the development of an OGD initiative, and the successful use of open data41. These six dimensions have informed the selection of indicators in the readiness section of the Open Data Barometer. In selecting indicators we have also drawn upon findings from the Open Data in Developing Countries (ODDC) research project which highlighted the important relationship between open data policies and the Right to Information, and the importance of complementing open data release with robust protections for citizen personal data. These two issues are represented in the Barometer by indicators on Right to Information and Data Protection laws. The experience of the Open Data Institute in delivering training and capacity building for the economic re-use of data also informed the design of
40
Hogge, B. (2010). Open Data Study. Transparency and Accountability Initiative. Transparency and Accountability Initiative. http://www.transparency-initiative.org/wp-content/uploads/2011/05/open_data_study_final.pdf 41
Grewal, A., Iglesias, C., Alonso, J. M., Boyera, S., & Bratt, S. (2011). Open Government Data - Feasability Study in Ghana; Alonso, J. M., Boyera, S., Grewal, A., Iglesias, C., & Pawelke, A. (n.d.). Open Government Data: Readiness Assessment Indonesia.

51
our indicator on training availability. There were a number of further aspects of readiness we would have liked to include in this section, such as quality of government record keeping42, and the statistical capacity of governments. However, we could not locate comprehensive secondary indicators, nor design simple expert survey questions adequate to capture these. We continue to seek approaches to be able to include these in future Barometer studies. The variables used in the readiness sub-index, along with their variable names43, are: Government
ODB.2013.C.INIT (Expert survey question): To what extent is there a well-resourced open government data initiative in this country?
ODB.2013.C.CITY (Expert survey question): To what extent are city or regional governments running their own open data initiatives?
WEF.GITR.8.01 (Secondary data): Importance of ICT to government vision (World Economic Forum Global Information Technology Report 2014; Variable 8.01; Taken from WEF expert survey)
UN.OSI (Secondary data): UN E-Government Survey, Government online services index (2014 edition)
Entrepreneurs and businesses
ODB.2013.C.TRAIN (Expert survey question): To what extent is training available for individuals or businesses wishing to increase their skills or build businesses to use open data?
ODB.2013.C.SUPIN (Expert survey question): To what extent is government directly supporting a culture of innovation with open data through competitions, grants or other support?
WEF.GCI.9.02 (Secondary data): Firm-level technology absorption (World Economic Forum Global Competitiveness Index, 2014/15; Variable 9.02; Taken from WEF expert survey)
WB.NetUsers (Secondary data): Internet users per 100 people (World Bank indicator IT.NET.USER.P2)
Citizen and Civil Society
ODB.2013.C.RTI (Expert survey question): To what extent does the country have a functioning right-to-information law?
ODB.2013.C.DPL (Expert survey question): To what extent does the country have a functioning right-to-information law?
ODB.2013.C.CSOC (Expert survey question): To what extent are civil society and information technology professionals engaging with the government regarding open data?
FH (Secondary Data): Freedom House Political Freedoms and Civil Liberties Index (2014) To ensure variables collected on different scales are comparable, and that the ODB second edition data is comparable to 2013 data, all variables in the readiness sub-index are normalised using z-scores with the 2013 mean and standard deviations prior to aggregation. For presentation, variables are scaled on a 0 – 100 scale.
Implementation sub-index: dataset questions and aggregation The 2012 Web Index asked researchers ‘To what extent are there government data on [X] on the web in your country?’, covering trade data, budget and spend, health sector performance, educational performance, transport data and schedules, census, national map, tax return, government service contact details, and crime, followed by a separate question on the extent of accessibility of these datasets (taken together) as open data. In the 2013 Open Data Barometer expert survey we modified this approach, asking researchers to complete a detailed checklist for each of 15 categories of data. This method is maintained for this second edition of the Open Data Barometer. The 10 checklist
42
Thurston, A. C. (2012). Trustworthy Records and Open Data. The Journal of Community Informatics, 8(2). http://ci-journal.net/index.php/ciej/article/view/951/952 43
Primary data variable names reflect the year they were first introduced to the study. E.g. ODB.2013.C.INIT reflects that this variable was first introduced in 2013.

52
questions are show below, along with details of the qualitative data researchers were asked to provide in justification for each answer. We refined this process further in 2014 as described in the changes section below. In many cases where machine-readable open data was not available (question c), researchers provided additional answers with respect to the non-machine-readable data published by governments (e.g. providing details on whether PDF census information is up to date or not). This information is valuable for building an understanding of different patterns of information and data management within governments, but should not generally feature in a score that measures the availability of open data. Therefore, we apply a validation logic to the original survey data gathered from the Barometer survey to ensure that, after questions a and b, we are measuring only the properties of machine-readable datasets. The exception to this is timeliness data (g), where in the event that even the non-machine-readable data is out of date, in this edition we deduct 5 points from the dataset score. This is to ensure that instances where there have been no updates to the data, and where updates may have been reasonable anticipated, in whatever format, since 2013, are suitably downgraded in the overall score. Following validation, we weight the checklist responses, awarding the value in the weight column of the table below for answers of ‘Yes’. The weighting is designed to emphasise the four questions (c, d, e, f) which pick out key aspects of the Open Definition (OKF, 2006). A positive score on these variables is also used to calculate a binary ‘Is Open Data’ variable, which is used in presenting dataset listings and in selected summary statistics.
Q Question Weight Chaining Logic Qualitative data collected
a Does the data exist? 5 Description of data; Agency
responsible; Reasons for non-
collection
b Is it available online from
government in any form?
10 If a = No THEN 0 ELSE (IF b =
Yes THEN 10 ELSe 0)
URL; Limits on data published;
Policies preventing publication
c Is the dataset provided in
machine-readable formats?
15 IF b = No THEN 0 ELSE (IF c =
Yes THEN 15 ELSE 0)
URL; File formats;
d Is the machine-readable data
available in bulk?
15 IF c = No THEN 0 ELSE (IF d =
Yes THEN 15 ELSE 0)
URL
e Is the dataset available free
of charge?
15 IF c = No THEN 0 ELSE (IF e =
Yes THEN 15 ELSE 0)
Details of charging regimes
f Is the data openly licensed? 15 IF c = No THEN 0 ELSE (IF f =
Yes THEN 15 ELSE 0)
URL; License details
g Is the dataset up to
date? Logic: lose 5 points if
any form of data is the data
is outdated. Gain 10 points
if the machine-readable
data is timely.
10 IF (g = No) THEN -5 ELSE IF(c =
Yes AND g = YES THEN 10)
ELSE 0
Last update date; Frequency of
updates
h Is the publication of the
dataset sustainable?
5 IF c = No THEN 0 ELSE (IF h =
Yes THEN 5 ELSE 0)
Evidence of sustainability
i Was it easy to find
information about this
dataset?
5 IF c = No THEN 0 ELSE (IF i =
Yes THEN 5 ELSE 0)
Notes on discoverability

53
j Are (linked) data URIs
provided for key elements
of the data?
5 IF c = No THEN 0 ELSE (IF j =
Yes then 5 ELSE 0)
URL of linked data publication
The following table shows the categories of data covered in the technical survey, along with a brief definition of each. These definitions were carefully designed to avoid creating a strong bias against states that have less advanced internal systems for managing data, and to be able to capture cases where states are making an effort to share the data that they do have. We also sought to gather information about where data is managed federally rather than nationally, to avoid penalising countries with a federal system, although recognising that from the perspective of a data re-user, nationally aggregated data may be much more useful than separate non-standardised federal datasets. By putting forward categories of data, rather than specific named datasets, we allowed researchers to exercise judgement as to the extent to which countries were making data of this kind available, whilst also sourcing specific examples of datasets that fit into these categories in different countries, and generating a rich collection of qualitative information about the reasons that certain data may or may not be available in different countries, and the extent to which certain datasets tend to exist at national or federal levels. This qualitative data will feed into future iterations of the Open Data Barometer design. The wording of a number of definitions in 2014 were refined to align more closely with those used in the separate Open Data Index project undertaken by Open Knowledge, which uses an alternative crowdsourced methodology to gather data on 10 datasets across a number of countries. As a number of the operational definitions of variables, and categories, are lined up across these two independent data sources, this should allow for cross-validation and work to assess how far definitive judgements of dataset openness can be rendered through the methodologies adopted in both studies. The aligned definitions are indicated with *.
Variable
name
Short Name Long name Description
ODB.2013.D1 Map * Mapping data A detailed digital map of the country provided by a national mapping agency
and kept updated with key features such as official administrative borders,
roads and other important infrastructure. Please look for maps of at least a
scale of 1:250,000 or better (1cm = 2.5km).
ODB.2013.D2 Land Land ownership
data
A dataset that provides national level information on land ownership. This will
usually be held by a land registration agency, and usually relies on the
existence of a national land registration database.
ODB.2013.D4 Stats * National
statistics
Key national statistics such as demographic and economic indicators (GDP,
unemployment, population, etc.), often provided by a National Statistics
Agency. Aggregate data (e.g. GDP for whole country at a quarterly level, or
population at an annual level) is considered acceptable for this category.
ODB.2013.D5 Budget * Detailed budget
data
National government budget at a high level (e.g. spending by sector,
department etc.). Budgets are government plans for expenditure, (not details of
actual expenditure in the past which is covered in the spend category).
ODB.2013.D6 Spend Government
spend data
Records of actual (past) national government spending at a detailed
transactional level; at the level of month to month government expenditure on
specific items (usually this means individual records of spending amounts
under $1m or even under $100k). Note: A database of contracts awarded or
similar is not sufficient for this category, which refers to detailed ongoing data
on actual expenditure. [In final review, this category was extended to allow
cases where detailed quarterly data was provided, as very few cases of
transaction level spending data were located. This varies from the Open Data
Census which maintained a tight definition on transactional level spending.]

54
ODB.2013.D7 Company * Company
registration data
A list of registered (limited liability) companies in the country including name,
unique identifier and additional information such as address, registered
activities. The data in this category does not need to include detailed financial
data such as balance sheet etc.
ODB.2013.D8 Legislation Legislation data The constitution and laws of a country.
ODB.2013.D9 Transport Public transport
timetable data
Details of when and where public transport services such as buses and rail
services are expected to run. Please provide details for both bus and rail
services if applicable. If no national data is available, please check and provide
details related to the capital city.
ODB.2013.D10 Trade International
trade data
Details of the import and export of specific commodities and/or balance of
trade data against other countries.
ODB.2013.D11 Health Health sector
performance
data
Statistics generated from administrative data that could be used to indicate
performance of specific services, or the healthcare system as a whole. The
performance of health services in a country has a significant impact on the
welfare of citizens. Look for ongoing statistics generated from administrative
data that could be used to indicate performance of specific services, or the
healthcare system as a whole. Health performance data might include: Levels
of vaccination; Levels of access to health care; Health care outcomes for
particular groups; Patient satisfaction with health services.
ODB.2013.D12 Education Primary and
secondary
education
performance
data
The performance of education services in a country has a significant impact on
the welfare of citizens. Look for ongoing statistics generated from
administrative data that could be used to indicate performance of specific
services, or the education system as a whole. Performance data might include:
Test scores for pupils in national examinations; School attendance rates;
Teacher attendance rates. Simple lists of schools do not qualify as education
performance data.
ODB.2013.D13 Crime Crime statistics
data
Annual returns on levels of crime and/or detailed crime reports. Crime
statistics can be provided at a variety of levels of granularity, from annual
returns on levels of crime, to detailed real-time crime-by-crime reports
published online and geolocated, allowing the creation of crime maps.
ODB.2013.D14 Environment National
environmental
statistics data
Data on one or more of: carbon emissions, emission of pollutants (e.g. carbon
monoxides, nitrogen oxides, particulate matter etc.), and deforestation. Please
provide links to sources for each if available.
ODB.2013.D15 Elections * National election
results data
Results by constituency / district for the most all national electoral contests
over the last ten years.
ODB.2013.D16 Contracting Public
contracting data
Details of the contracts issued by the national government.
To generate three sub-components in the Implementation sub-index we cluster these datasets into three groups, based on a qualitative analysis of the common ways in which these categories of data are used. As previously discussed, these clusters are not mutually exclusive. It is within the nature of open data that a dataset can be used for multiple purposes – and a single dataset might have applications across innovation, improving policy, and increasing accountability. However, for simplicity of presentation and analysis we place each dataset in only one cluster. Further work is needed to refine these clusters in future analysis, and readers are encouraged to explore different groupings of datasets in remixing our research.

55
Innovation Social Policy Accountability
Data commonly used in open data applications by entrepreneurs, or with significant value to enterprise.
Data useful in planning, delivering and critiquing social policies & with the potential to support greater inclusion and empowerment.
Data central to holding governments and corporations to account. Based on the ‘Accountability Stack’.
Map Data, Public Transport Timetables, Crime Statistics, International Trade Data, Public Contracts
Health Sector Performance, Primary or Secondary Education, Performance Data, National Environment Statistics, Detailed Census Data
Land Ownership Data, Legislation, National Election Results, Detailed Government Budget, Detailed Government Spend, Company Register
In order to maintain the ability to compare scores from one dataset to another, individual variables in this sub-index are not normalised prior to aggregation. However, the implementation sub-index score is z-score normalised prior to calculation of the final Barometer score, and then rescaled to 0 – 100 for presentation.
Impacts sub-index: Recognising the early stage of open data developments around the world, we sought to develop an approach to capture stories of impact, and to be able to compare the relative strength of impact these indicated across different categories of impact, and across different countries. Our approach was to treat online, mainstream media and academic publications about open data impacts as a proxy for existence of impacts, with researchers asked to score the extent of impact on a 0 – 10 scale. Scoring guidance outlined that the highest scores should only be given for peer-reviewed studies showing impact, and emphasised the importance of sources making a direct connection between open data and observed impacts. For scores over 5 researchers were asked to cite at least two separate examples in the given category. The six questions asked in this section, organised by sub-component, were: Political
ODB.2013.I.GOV (Expert survey question): To what extent has open data had a noticeable impact on increasing government efficiency and effectiveness?
ODB.2013.I.ACCOUNT (Expert survey question): To what extent has open data had a noticeable impact on increasing transparency and accountability in the country?
Social
ODB.2013.I.ENV (Expert survey question): To what extent has open data had a noticeable impact on environmental sustainability in the country?
ODB.2013.I.INC (Expert survey question): To what extent has open data had a noticeable impact on increasing the inclusion of marginalised groups in policy making and accessing government services?
Economic
ODB.2013.I.ECON (Expert survey question): To what extent has open data had a noticeable positive impact on the economy?
ODB.2013.I.ENTR (Expert survey question): To what extent are entrepreneurs successfully using open data to build new businesses in the country?
These variables are all normalised using z-scores prior to aggregation.
Computation
To calculate each component an average of the variables in that component is taken. The average of components is used to generate each sub-index. The weighted average of the sub-indexes is used to generate the overall Open Data Barometer score. For consistency, the normalised scores for all the sub-indexes, and the readiness and impacts components, have been rescaled to a 0 - 100 range using the formula [(x - min)/(max - min)]*100 prior

56
to presentation. This means that a score of 100 on these components and sub-indexes illustrates the highest scoring country across the 86 included in the Barometer Global ranking. It does not mean that a score of 100 is perfect. All scores in a study of this kind are subject to a margin of error. To offer an indicative comparison between countries we offer a ranking based on rounding each countries overall ODB score to its integer value (no decimal places), and placing countries in order of score. This ranking, and each of the other scores, should be treated as the starting point for exploration, rather than a definitive judgement on each countries open data readiness, implementation and impacts.
Index weightings Whilst the ultimate goal of the Open Data Barometer is to understand and increase open data impact, at present our methods offers only a rough proxy measure of impact, through the publication of media or academic stories on impact. An analysis of the data in, and between, years, suggests this method offers a useful heuristic for extent of impact, but does have a relatively high risk of false-negative results, when research does not locate stories of impact, and false-positives, when media incorrectly attribute impacts to open data, or report arguments for potential benefits as actual impacts and benefits. Scores on the impact variables also lack a normal distribution, being heavily skewed towards zero. As a result, we judged it was not yet possible to give impact the highest weight in our overall rankings. Similarly, on theoretical grounds, whilst some variables within the readiness sub-index do reflect explicit actions on open data, such as those addressing the presence of initiatives, and support for innovation, other variables within this sub-index are capturing elements of wider context in the country. In seeking to measure progress towards being able to secure impacts of open data, having readiness alone is not enough: this readiness should be translated into action. This is the basis for the 25-50-25 (Readiness-Implementation-Impact) weightings in the final Open Data Barometer score. Future editions will draw upon updated indicators and methodologies in order to further the robustness of impact measurement, and to introduce a stronger focus on data use. This provides the basis for a gradual shift in this edition towards a marginally lower weighting of implementation, creating space for new variables, whilst offering the opportunity to keep some degree of comparability across indexes in future years also.
Changes: first and second edition
When making comparisons between 2013 and 2014 data it is important to be aware of minor methodological changes. Whilst we have made every effort to keep indicators consistent, learning from the 2013 process has led to a number of minor adaptations.
Primary data collection In 2013, a dedicated survey took place for the Open Data Barometer, combining context, impact and technical dataset assessment questions in one, and taking place between July and October 2013. Learning from this process suggested that different skill sets were required for the context and impact assessment, and the technical assessment, and so these processes were split in 2014. In 2014, data collection for context and impact was included within the Web Index 2014 Expert Survey (which uses exactly the same methodology for expert survey as the Barometer), with data extracted following the Web Index peer-review process, and subjected to additional independent validation by the Open Data Barometer research team. Data collection for this component of the study took place from June to September 2014, with validation in September 2014. The assessments focussed on events in the 12 months to June 2014. The full detailed dataset technical assessment was carried out by a separate small team of assessors, based on initial information provided through the 2014 Web Index survey about likely national data sources. Three members of the core Open Data Barometer research team reviewed and validated all

57
technical assessments. Data collection for this component of the study took place from August to October 2014, with judgements focussing on data available up until the end of October 2014. The 2014 survey also included a number of additional requests for supporting information, and effort was made to ensure these were provided in ways suitable for public release.
Indicator changes One additional dataset was added to the technical assessment (Public Contracts), bringing the total number of datasets assessed to 15. Public Contracts is included in the ‘Innovation & Economic Growth’ implementation sub-component, based on the potential role of transparent contracting data in creating a more competitive landscape in public procurement. The operational definitions for a number of datasets in the technical assessment were updated to align, or maintain alignment, with those used in the separate and independent Open Data Index produced by Open Knowledge. The datasets affected included: Mapping, National Statistics, Detailed budget, Detailed data on government spend, Company Registration and Elections. The definitions for the Environment and Public Transportation categories are partially aligned, but with some minor differences. The changes were minor in each case, but took place to support a move towards common assessment methods, and to support third-party comparisons of the two datasets. Whilst the Open Data Barometer uses paid expert researchers, Open Knowledge’s Index adopts a crowdsourced method.
Aggregation changes In 2014, datasets which are available in any forms, but which are judged not to be up-to-date will have 5 points subtracted from their 0 - 100 score. Datasets which are judged to be updated will still receive +10 points on this score. This change is to reflect the fact that a number of datasets which were out of date in 2013 remain so in this year’s survey, and to offer the same score in 2014 would not reflect the further drops in the timeliness of this data. The weightings were adjusted as described above.
Get the data
The Open Data Barometer draws on over 14,000 different data points, captured as quantifiable data and backed by qualitative source information. The data is made available at http://www.opendatabarometer.org under a Creative Commons Attribution 4.0 License, and we encourage you to explore, re-use and remix the data. Please cite any uses of the data as: World Wide Web Foundation, Open Data Barometer Global Report (Second Edition), 2015 and include a link to http://www.opendatabarometer.org. The following resources are provided.
Research handbooks
Details of the questions addressed by researchers, the scoring thresholds applied during research and review, and information on the research process can be found in the Web Index and Technical Survey research handbooks.
Web Index Handbook (Open Data Barometer sections) (PDF)
Open Data Barometer Technical Survey Handbook (PDF)

58
Quantitative datasets
ODB-2014-Rankings.csv contains the full Open Data Barometer score, as well as sub-index and sub-component values, country classifications and other contextual information. This is the file used to drive most of the tables and graphs in the report.
ODB-2014-Datasets-Scored.csv contains a row for each dataset assessed during the technical survey, with the overall dataset score, and score values for each data openness checklist item.
ODB-2014-Survey-Ordered.csv contains the raw survey responses given through the expert research and technical survey processes.
For comparison, updated 2013 datasets have also been prepared using the same variable names, and incorporating 2-digit ISO codes, as some country labels have changed between years due to the Web Index production process:
ODB-2013-Rankings.csv
ODB-2013-Datasets-Scored.csv
Labels and details of each of the variables in the Rankings and Survey files are provided in:
indicators.csv
Qualitative data
In addition, for this second edition, we are providing the main qualitative source information provided by researchers. This information was collected in order to justify and validate the quantitative scores given, and is not designed to provide a comprehensive review in response to each question.
primary_data_context_impact.csv - contains question responses for each country on context and impact questions.
primary_data_datasets.csv - contains the detailed dataset assessments, including links to datasets, file formats and timeliness information. At present this is uncleaned data from the survey tool. Please read the notes below.
We are continuing to explore ways to improve the provision of qualitative data alongside the Open Data Barometer, but hope this year’s initial release is a useful resource for other researchers.

59
Acknowledgements

60
Acknowledgements
The Open Data Barometer is only possible thanks to the contributions of a wide network of contributors. Our thanks to the following: Lead Author: Tim Davies, with Raed M. Sharif and Jose M. Alonso. (Correspondence to [email protected]) Research Coordination: Carlos Iglesias, Raed M. Sharif, Ginette Law, Aman Grewal, Jose M. Alonso and Laura M. James Bromwich Visualisation: Dave Tarrant, Tim Davies, Alvaro Graves and Miska Knapek Research Design Advisor: Hania Farhan The process for collecting new primary data was based on an expert researcher assessment survey. The work of scorers was supported by peer reviewers for each country (the scorer and the peer reviewer did their work independently of each other), in order to validate or otherwise question and improve the scorers results. A group of technical reviewers and regional reviewers also examined the scores for each indicator. A final level of checking and validation was conducted by the project team. The World Wide Web Foundation would like to thank the following participants, who were instrumental in fulfilling and completing the assessment surveys for the Web Index and the Open Data Barometer. (Note: Some participants asked to remain anonymous.) Technical assessors: Alvaro Graves, John Bosco Mubiru, Michael Hoerz, Rayna Stamboliyska, Nisha Thompson, Pierre Chrzanowski, Oleg Lavrosky, Carlos Iglesias, Josef Hardi, Mor Rubinstein, Norhidayah Azman, Miska Knapek and Atif Abdul Rahman Context & Impact Researchers: Mariana Mas, Michael Hoerz, Rayna Stamboliyska, Caroline Gans Combe, Gisele Craviero, Pierre Chrzanowski, Vincent Manzerolle, Alberto Cerda, Q.Z., Carlos Andres Barahona, Israel Aragon, Michal Kuban, Thorhildur Jetzek, Nadesha Montalvo, Soha Farouk, Askur Alas, Leena Kylmanen, Caroline Gans Combe, Michael Hoerz, Zsuzsanna Vári Kovács, John Bosco Mubiru, Ehud Assaf, Ernesto Belisario, Richard John Smart, Baria Ahmar, Judith Ogutu, Geoffrey Cain, Patrick Semphere, Pierre Chrzanowski, Dessalegn Mequanint Yehuala, Emilene Martinez Morales, Abderahman Zohry, Dessalegn Mequanint Yehuala, Htaike Htaike Aung, Kersti Ruth Wissenbach, Kostas Antypas, Pablo Pérez Álvarez, Analisa V. Puod, Frederico Cavazzini, Rayna Stamboliyska, Dessalegn Mequanint Yehuala, Rayna Stamboliyska, Zsuzsanna Vari-Kovacs, Soenke Ziesche, Jose María Álvarez Rodriguez, Andreas Kuehn, Leonida Mutuku, Suluck Lamubol, Sofiane Bouhdiba, Igbal Safarov, Wes Schwalje, Fiona Namutebi, Nikhil Agarwal, Volodymyr Shemayev, Mariana Mas, Maximilian Heimstädt, Iria Puyosa, Walid Al-Saqaf, Glory Mushinge, Denboy Kudejira. Reviewers: Julieta Valente, Keisha Taylor, Frederike Kaltheuner, Leonida Mutuku, Daphnee Iglesias, Frank Hangler, Hieke van der Vaart, Gerard Walsh, Johan de Aguas, Caroline Burle, Kim Bach, Israel Aragon, Tarmo Vahter, Daniel Schildt, Petrovic Liliane, Frederike Kaltheuner, Andras Loke, Askur Alas, Nikhil Agarwal, Mor Rubinstein, Angela Corrias, Maurice MacNaughton, Soha Farouk, Bonfas Owinga, Haklae Kim, Dessalegn Mequanint, Jankee Kheswar, Claudia Munaiz, Rayna Stamboliyska, Aquinaldo Célio Tomás, Deepak Adhikari, Keisha Taylor, Mariana Mas, Daphnee Iglesias, Nathanael Hategekimana, Atif Abderahman, Juan José Méndez, Maximilian Heimstädt, Jamal Msami, Mustapha Chouikha, Mark Townsend, John Bosco, Amanda Meng, Raisa Urribarri, Marianne Brown, Boniface Dulani. Data sources: We are thankful to the following organisations whose data we draw upon in the secondary data portion of the Barometer: • World Economic Forum • World Bank Group • Freedom House
61
Report developed using: R, Jekyll, bootstrap, d3, nvd3, jquery, radarChart, jquery csv, jquery dataTables, databars, datamaps, pandoc Survey platform: Ben Doherty, Oomph Inc. Icons from the Noun Project With thanks to Anton Gajdosik, Simple Icons, Jorge Calvo García, OCHA Visual Information Unit, Gilbert Bages, Hunotika, Lil Squid, Jaime Carrion, Douglas Nash, NAS Funding: Support for the Open Data Barometer report was provided through IDRC Grant 107075 (www.idrc.ca). The 2013 report, and much of the methodological development, was also supported by the Open Data Institute. This report also draws upon content from The Web Index, funded by UK Aid.

62
Acknowledgements
www.opendatabarometer.org