oop onnaal pl an - hse.ie · ust 2015 an. 2 care compassion trust learning values we will try to...
TRANSCRIPT
P
O2
Prim
Op20
Hea
ma
pe016
PrimalthOpe
ry
era6
marh Seerat
Ca
ati
ry Cerviction
are
on
Carece E
nal P
Di
na
e DiExePlan
Templa
vis
al
ivisecutn 20ate Augu
sion
Pl
iontive016ust 2015
n
lan
n
2
Care Compassion Trust Learning
Values
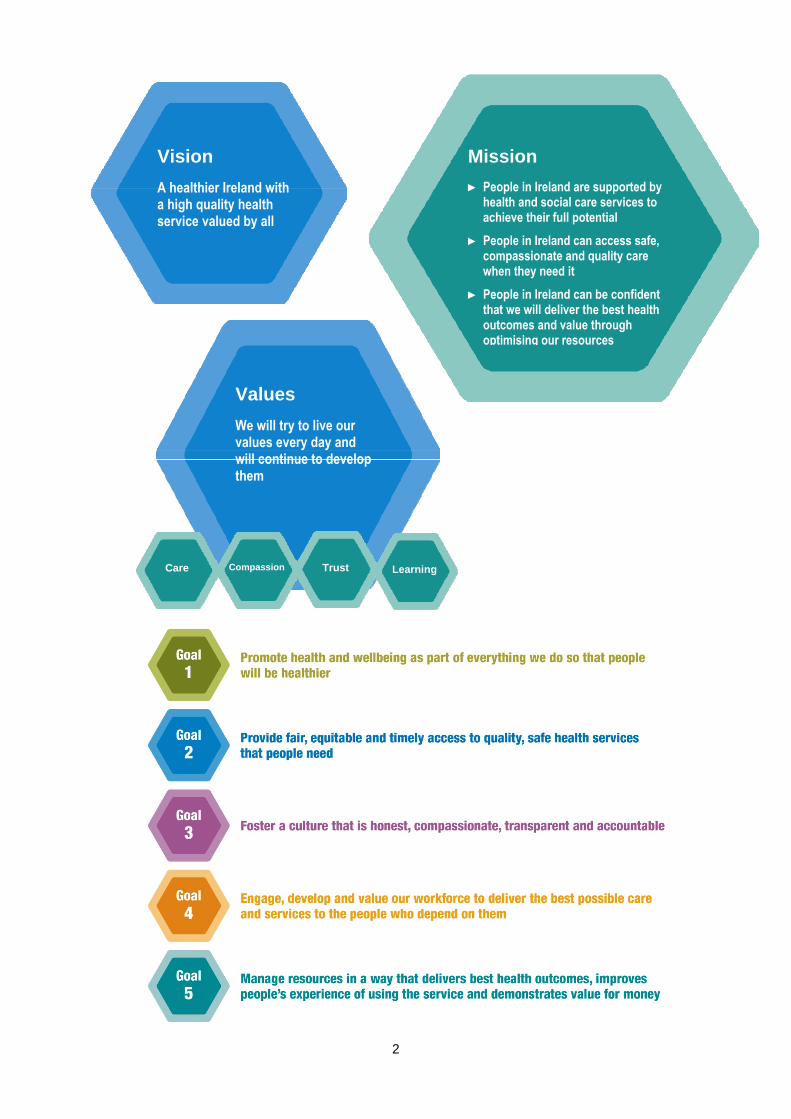
We will try to live our values every day and will continue to develop them
Vision
A healthier Ireland with a high quality health service valued by all
Mission
► People in Ireland are supported by health and social care services to achieve their full potential
► People in Ireland can access safe, compassionate and quality care when they need it
► People in Ireland can be confident that we will deliver the best health outcomes and value through optimising our resources
3
Contents Executive Summary ....................................................................................................................................... 4 Operational Framework ................................................................................................................................ 11 Financial Plan Workforce Plan Health Service Reform .................................................................................................................................. 15 Delivery of Services ..................................................................................................................................... 16
Delivery of Services in relation to Primary Care, Primary Care Reimbursement Services, Social Inclusion and Palliative Care
Balanced Scorecard ..................................................................................................................................... 41
Appendices ................................................................................................................................................... 44
Appendix 1: Financial Tables .................................................................................................................... 44 Appendix 2: HR Information ...................................................................................................................... 48 Appendix 3: Performance Indicator Suite ................................................................................................. 49 Appendix 4: Capital Infrastructure ............................................................................................................. 76
Accountability Framework ........................................................................................................................... 79

4
Primary Care Division
Executive Summary The development of primary care services is a key element of the overall Health Reform programme. The core objective is to achieve a more balanced health service by ensuring that the vast majority of patients and clients who require urgent or planned care are managed within primary and community based settings, while ensuring that services are: Safe and of the highest quality Responsive and accessible to patients and clients Highly efficient and represent good value for money Well integrated and aligned with the relevant specialist services.
Primary Care services include primary care teams (PCTs) and general practice, schemes reimbursement, social inclusion and palliative care services. A key priority for 2016 is the continued implementation of the recommendations of Community Healthcare Organisations – Report and Recommendations of the Integrated Service Area Review Group, 2014. There will be a continued emphasis on integrated care and accountability for primary care services. This will strengthen the Accountability Framework and outline explicit responsibilities for staff at all levels.
Primary Care Over the last number of years work has been underway to realise the vision for primary care services whereby the health of the population is managed, as far as possible, within a primary care setting with people very rarely requiring admission to hospital. This approach is now aligned with the Healthy Ireland framework, noting the importance of primary care to the delivery of health improvement gains. Primary care can play a central role in co-ordinating and delivering a wide range of integrated services in collaboration with other service areas. The primary care team is the central point for service delivery which actively engages to address the medical and social care needs of the population in conjunction with a wider range of Health and Social Care Network (HSCN) services.
PCRS The Primary Care Schemes are the means of delivery for a significant proportion of primary care services. Scheme services are delivered by over 7,000 primary care contractors e.g. GPs, pharmacists, dentists, optometrists and/or ophthalmologists. The schemes include: General Medical Services (GMS) – Medical Card Scheme, including GP Visit Cards Drug Payment Scheme Long Term Illness Scheme Dental Treatment Services Scheme (DTSS) High Tech Drug Arrangements Primary Childhood Immunisation Scheme Community Ophthalmic Scheme Certain services under Health (Amendment) Act 1996 and Redress for Women Resident in Certain
Institutions Act 2015 Methadone Treatment Scheme.
5
Social Inclusion The core objective of social inclusion services is the improvement of health outcomes for the most vulnerable in society. This includes provision of targeted interventions for people from traditionally marginalised groups who experience health inequalities, have difficulties accessing services and present with multiple, complex health and support needs. Vulnerable people and communities falling within the remit of social inclusion include Irish Travellers and Roma, asylum seekers, refugees and Lesbian, Gay, Bisexual, Transgender (LGBT) service users. Issues of addiction, substance misuse, homelessness and domestic, sexual and gender based violence are overarching themes within the service user groups. Social inclusion services work with mainstream services and voluntary sectors to ensure accessibility for disadvantaged service users. Social inclusion services are developing appropriate activity metrics to more accurately reflect the health needs and outcomes of vulnerable groups. These metrics will be aligned with the objectives of the Healthy Ireland implementation plan.
Palliative Care Palliative care is an approach that improves the quality of life of patients and their families facing the problems associated with life-limiting illness. This is achieved through the prevention and relief of suffering by means of early identification, high quality assessment and management of pain and other physical, psychosocial and spiritual problems. In recent years, the scope of palliative care has broadened and includes not only cancer related diseases but supporting people through non-malignant and chronic illness also. A new plan involving a stakeholder representative working group is being prepared which will provide direction for palliative care services for the next three years; this will be published early in 2016. The plan is being developed in collaboration with the Clinical Programme for Palliative Care. In 2016 engagement will continue with voluntary service providers to ensure that emerging needs and related solutions can be identified and addressed. Palliative Care recognises the potential of the five Integrated Care Programmes (ICPs) to improve integration, access and outcomes and will actively support the development and implementation of the priority work streams in 2016.
Improving Quality and Safety Quality improvement and patient safety is everybody’s business and is embedded in all work-practices across primary care services. The Primary Care Division is committed to promoting a “”quality and safety” culture by ensuring effective governance, clear accountability and robust leadership. In accordance with the National Framework for Quality the following are the 5 key drivers for the Primary Care Quality & Safety programme in 2016: Governance: The National Director will ensure that the division has structures in place to ensure
accountability for the quality and safety of services within Primary Care. Safe care and support: The Division will ensure that there are structures and processes in place to avoid,
prevent and minimise harm to patients/service users and to learn from situations when things go wrong. Person centre care and support: The service user will at all times be at the centre of the delivery of care. Effective care and support: The primary care services will deliver best achievable outcomes for
patients/service users. Measuring and learning for improvement: Systems and structures will be put in place to measure
performance in relation to quality and safety and to ensure learning is shared across primary care.
Ensuring the Provision of Integrated Care and Clinical Care Programmes The provision of care, which is provided through CHOs, Hospital Groups and the National Ambulance Service will be person centred and coordinated, providing better and easier access to services which are close to where people live. This is a long term programme of improvement and change and will involve people at every level of the health services working together to create improved experiences and outcomes for the people in their care, in a way which puts them at the centre of all services. In 2016 the clinical and integrated care programmes will lead a number of priority programmes to design, develop and progressively implement models of care which will incorporate cross
6
service, multi-disciplinary care and support and which will facilitate the delivery of high quality evidence based and coordinated care. The Primary Care Division will collaborate with the clinical and integrated care programmes to ensure the changes implemented are consistent with the frameworks, models of care, pathways and guidelines designed by the integrated and clinical care programmes.
Accountability Framework The HSE is the statutory body with responsibility for the delivery of health and personal social care services and has a Governance Framework in place covering corporate, clinical and financial governance. While the HSE’s primary accountability is to the Minister of Health, it has a range of other accountability obligations to the Oireachtas and to its Regulators. The Accountability Framework was developed and implemented in 2015 and strengthens governance arrangements by measuring, monitoring and reporting on performance. The Framework sets out the arrangements between the National Performance Oversight Group (NPOG) and the National Directors in accounting for and responding to areas of underperformance across the balanced scorecard in relation to access to services, quality, financial management and human resources. The Framework sets out the responsibilities of all managers to deliver the targets set out in the Service Plan. An Escalation and Intervention Framework is also part of this process and sets out four levels of escalation identifying supports, interventions and sanctions when service areas are underperforming against defined thresholds. 2015 was the first year of operation of the new Accountability Framework. A formal review was commissioned and completed in 2015. The Framework has been updated for 2016 to ensure its operation, effectiveness and application best meets the evolving needs of the organisation and drives overall performance improvement. Recommendations for further enhancement from the review will be implemented early in 2016.
Health Service Reform 2016 will be another important year in the ongoing reform of the HSE with continued focus on programmes of work to bring about strategic reform of the health services. A formal charter that lists out these projects for the Primary Care Division has been developed with the System Reform Group and agreed with the leadership team. In 2016 we will be progressing key projects within that charter. Infrastructural changes and service improvements to support safe patient care and the development of quality services are included in the Charter. The following are some of the key reform programmes for Primary Care in 2016: GP/GMS Contract(s) review Community Referral and Patient Management System procurement Implementation of prioritised chronic disease management programmes Individual Health Identifier implementation Direct access to diagnostics for GPs Roll out of minor surgery in general practice PCRS – Clinical Advisory Group recommendations and online medical card processing Quality Information Management System procurement CIT/OPAT System – Portal developments and infrastructural deployment.
Children First The Children First implementation plan sets out key actions to ensure compliance with both the Children First legislation and national policy. Under legislation, the HSE and funded organisations providing services to children and young people will be required to undertake an assessment of risk and to use this risk assessment to develop and publish a Child Safeguarding Statement. The Safeguarding Statement will also outline how staff/volunteers will be
7
provided with information to identify abuse which children may experience outside of the organisation, and what they should do with concerns about child safety. In 2016, high level actions include the development of Children First implementation plans by CHOs and Hospital Groups with support from the Children First National Office; and the delivery of a suite of Children First training programmes for HSE staff and HSE funded organisations. Child protection policies at CHO and Hospital Group level will also be developed and reports will be tracked and monitored by the Children First Office. Children First compliance will also be included in the performance assurance process.
Supporting Service Delivery Direct service provision is dependent on a number of key business support functions. The Division will work with Health Business Services (HBS) and other corporate support services (HR, Finance, Office of the Chief Information Officer, Communications, and Internal Audit) which are essential enablers for the CHOs to deliver direct patient services. A number of common support business services are now delivered on a shared basis. This allows operational services to focus management attention on core service provision and also helps services to be compliant with National EU Directives, legislation and regulation. Relationships will be further enhanced during 2016 through Business Partnership Arrangements (BPAs) between HBS and each CHO, setting out clearly the quantum of support services the functions within HBS (Estates, Procurement, HBS HR, HBS Finance and Enterprise Resource Planning Services) will provide. The National Service Plan 2016 sets out in detail all corporate support service priorities and actions for 2016.
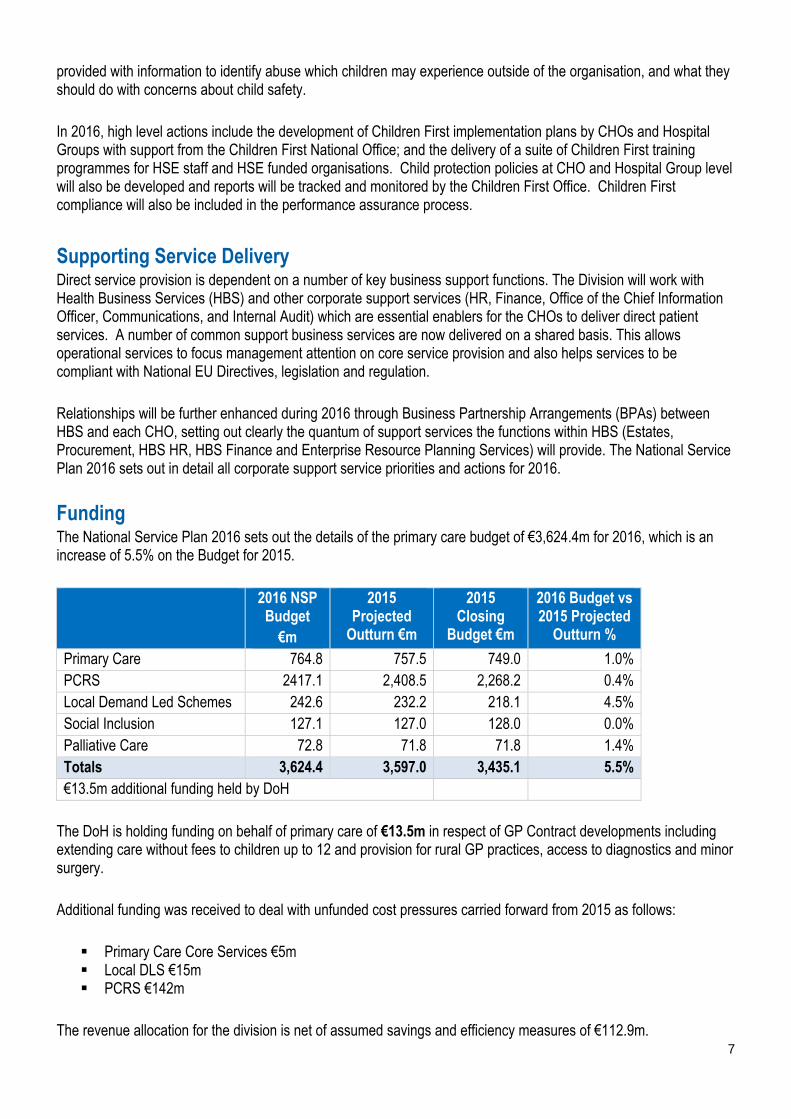
Funding The National Service Plan 2016 sets out the details of the primary care budget of €3,624.4m for 2016, which is an increase of 5.5% on the Budget for 2015.
2016 NSP Budget
€m
2015 Projected
Outturn €m
2015 Closing
Budget €m
2016 Budget vs 2015 Projected
Outturn %
Primary Care 764.8 757.5 749.0 1.0% PCRS 2417.1 2,408.5 2,268.2 0.4% Local Demand Led Schemes 242.6 232.2 218.1 4.5% Social Inclusion 127.1 127.0 128.0 0.0% Palliative Care 72.8 71.8 71.8 1.4% Totals 3,624.4 3,597.0 3,435.1 5.5% €13.5m additional funding held by DoH
The DoH is holding funding on behalf of primary care of €13.5m in respect of GP Contract developments including extending care without fees to children up to 12 and provision for rural GP practices, access to diagnostics and minor surgery. Additional funding was received to deal with unfunded cost pressures carried forward from 2015 as follows: Primary Care Core Services €5m Local DLS €15m PCRS €142m
The revenue allocation for the division is net of assumed savings and efficiency measures of €112.9m.

8
In 2016 all services will be required to operate within the planned budget levels in order to deliver a breakeven position. There are significant challenges in containing expenditure in areas that have experienced growth over a number of consecutive years, such as drug expenditure on Local Demand Led Schemes and complex discharges to the community and these will continue to be a source of pressure in 2016 with limited scope for growth. Whilst the PCRS budget shows an overall net increase of 6.57% there is significant growth in drug costs in existing run rates, combined with savings targets linked to numbers availing of schemes and volume of medical cards which are not within the division’s control. In addition a successful conclusion to sectoral discussions around the cost of medicines involving DPER, DoH, HSE and industry is a critical component of the PCRS breakeven plan. The cost of increments to the division estimated at €1.3m will also have to be funded from existing resources.
Workforce The Division’s staff are its most valuable resource. In addition to key objectives such as recruitment and retention of staff, maintaining a motivated workforce is of paramount importance to ensuring the quality of service delivered to the public. This requires effective workforce planning and resource allocation arrangements, together with appropriate structures for positive engagement with staff. 2016 will see a focus on The People Strategy 2015 -2018 which has been developed in recognition of the vital role the workforce plays in delivering safer and better healthcare. Government policy focuses on ensuring that the number of people employed is within the pay budget available. The management of human resources in 2016 will be based on the Paybill Management and Control Framework. This approach is a transition from the moratorium to an accountability framework designed to support multi-annual workforce plans based on models of care that will deliver services within allocated pay resources. Service managers who meet budget targets will have greater discretion and flexibility in how they manage their workforce and payroll costs, while ensuring services are delivered in line with the national service plan. The Primary Care Division will operate control mechanisms to monitor staff numbers and work with CHOs to evaluate vacancies in the context of workforce composition, skill mix, cost and capacity to deliver core services. Current WTE numbers in the Division are 10,370 (including Section 38 organisations).
Developments The 2016 DoH held funding allocation of €13.5m will facilitate progress in relation to: Extension of free GP care to children up to 12 years, subject to negotiation under the Framework
Agreement. Improved access to diagnostics (ultrasound and x-rays) for GPs. Expansion of minor surgery services in primary care.
In addition, combined approaches with the mental health and social care divisions will facilitate: Improved access to primary care psychology and counselling. Improved access to primary care speech and language therapy services.
Risks to Service Delivery 2016 The budget allocation for primary care in 2016 presents significant challenges for the maintenance of existing levels of service for the division, particularly so for the PCRS range of demand-led services. A range of measures has been identified to manage the Primary Care Division services within budget, they include the following:
9
Core Services Reviewing service delivery models for primary care services The development of prioritisation protocols for the delivery of services The introduction of quality improvement initiatives across the division Further roll out of the Performance Management Framework Further reduction in agency costs Enhanced procurement and process measures to improve the management of consumables Adherence to the Pay Bill Framework in relation to staff replacements Containing activity on 2015 new developments to 2015 expenditure levels Containing activity in primary care core services to existing levels of service Maintaining activity in dental treatment to existing levels of service.
Local Demand-Led Schemes Delivering activity under local demand-led schemes to funded levels.
PCRS Assumptions Primary Care Reimbursement Service (PCRS) – €2,417m available to HSE (with a further €10m held by DoH) The PCRS budget has been set at the level indicated by the letter of determination received by the HSE.
In summary, the various schemes including the medical card scheme are operated by the HSE on the basis of legislation as well as policy and direction provided by DoH.
Eligibility under these schemes is administered by PCRS. Its key task in this regard is to ensure that those who have eligibility can have this confirmed and access their entitlements under the schemes in as efficient and responsive a way as possible. PCRS also has a role in ensuring appropriate application of the various scheme rules. This includes ensuring probity in claims processing and payments to primary care contractors and PCRS will pursue the targets set under this heading.
Thereafter demographic, economic and other variable factors, given the demand-led nature of the schemes, will dictate the actual numbers of eligible persons and the cost of their entitlements to be paid by PCRS in 2016 under each scheme. The PCRS plan for 2016 is based on a number of assumptions around demographics, economic growth and these other factors which have been agreed with the DoH following an extensive series of engagements.
As regards drugs, the growth in costs related to existing drugs is largely a feature of the entitlements of individuals as determined by their eligibility and the demographic and other factors outlined above including prescribing practices. In relation to new drug costs, primarily High-Tech drugs, sectoral agreements and the assessment process in place to establish whether new drugs can be introduced on the basis of funding available will be a significant feature in 2016.
The PCRS budget for 2016 has been framed by reference to a series of working assumptions. These have been developed in detailed discussion with the DoH. They have been accepted as the basis on which, in respect of the PCRS, the HSE should address the statutory requirement to indicate the type and volume of services to be provided during the year to include the following: Persons eligible for medical cards will continue to receive them in a timely manner and in accordance with
the turnaround times for processing applications as outlined in the plan. Appropriate measures will continue to ensure the accurate administration of the various schemes. This will
involve savings being achieved from continued enhanced monitoring of claims and payments to primary care contractors.
The medical card profile outlined in the plan (see table below and in appendix 3) reflects the funding allocated for 2016. It is jointly acknowledged that the actual level of activity will depend on the number of eligible patients availing of services.
The savings targets in relation to drugs / medicines will be achieved in full – this is a key shared assumption that is dependent on the outcome of engagement with the pharmaceutical industry, prescribers and retailers.
10
Overall net expenditure on High Tech drugs in 2016 is maintained at 2015 outturn levels (which includes provision for new drugs in 2016) – this is dependent on the HSE’s capacity to contain approvals for new medicines to overall funded levels and the outcome of negotiations with key stakeholders.
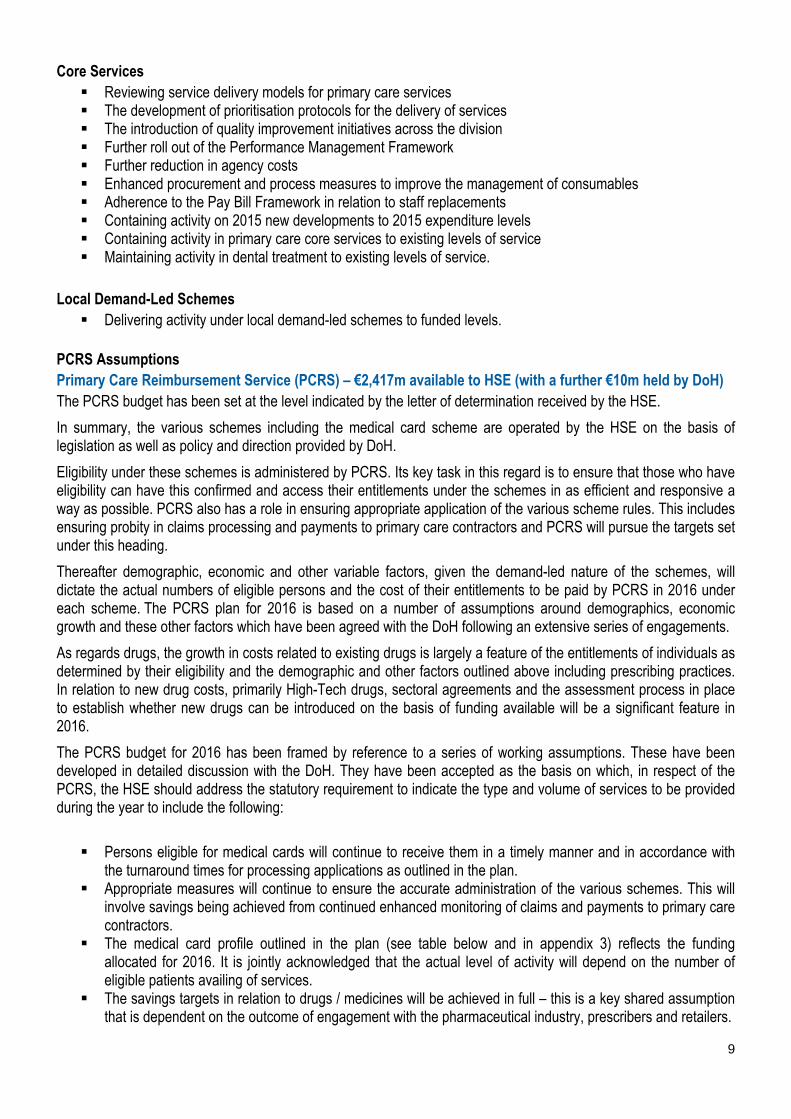
Efficiencies and stock management improvements in the High Tech medicines area will reduce costs. Savings in relation to administration costs will also be achieved. GMS activity is in accordance with funded levels as follows:
Schemes Projected Outturn
2015 Activity Level
2016
GMS (medical card numbers) 1,725,767 1,675,767
GP Visit Cards 435,785 485,192*
*Target does not include Universal GP Visit Cards for children aged 6 to 11 years Expenditure in the PCRS budget will be the subject of close monitoring and assessment from the beginning of 2016. The implications of any emerging variations from the working assumptions underpinning the budget will be the subject of engagement with the DoH through the reporting and oversight arrangements which operate in relation to the NSP. In this context the HSE will indicate to the DoH the nature and extent of any interventions that it considers necessary to ensure that the available budget for PCRS is not exceeded and will seek direction in this regard.
Conclusion This plan sets out details of funded services and/new service developments provided for in the Letter of Determination; it is not anticipated that it will be possible to expand or put in place additional services outside of these, which will be challenging in the context of ever increasing demands for services. The Primary Care Division will work to maximise the delivery of services within the resources available while at the same time ensuring that quality and patient safety remains a key priority. John Hennessy, National Director, Primary Care Division. January 2016
11
Operational Framework
Financial Framework The National Service Plan 2016 sets out the details of the primary care budget of €3,624.4m for 2016, which is an increase of 5.55% on the Budget for 2015. The tables below further allocate this budget by Pay, Non Pay and income by CHO, National Services and the Primary Care Reimbursement Service.
Incoming Deficit Additional funding was received to deal with unfunded cost pressures carried forward from 2015 as follows: Primary Care Core Services €5m Local DLS €15m PCRS €142m.
Existing Level of Service Funding was received in respect of Existing level of service as follows: €9m – Primary care core services 2016 Non Pay Funding €4.8m – Primary care core services full year cost of 2015 commitments €10m – Local DLS €117m – PCRS.
A significant portion of the primary care core services funding will be required to cover the increasing cost of primary care leases and the costs associated with complex paediatric home care packages.
Savings and Extra Revenue Targets The revenue allocation for the Division is net of assumed savings and efficiency measures of €112.9m as follows; €2.9m - General reductions in non-pay budgets including savings to be made through the procurement
process. €110m - Targeted reductions in drug and prescribing costs; this will involve additional measures in areas
such as probity and prescribing behaviour.
HSE Prioritised Initiatives The DoH holds further funding on behalf of primary care of €13.5m in respect of GP Contract developments including extending care without fees to children up to 12 and provision for rural GP practices, access to diagnostics and minor surgery.
Pay and Pay Related Savings The Division commenced the implementation of a plan for the conversion of agency in 2015 and this will continue in 2016. In line with Pay Bill Management Policy, the replacement of existing posts will be dependent on individual CHO being able to deliver its planned services within allocated funding.

12
Financial Risk Areas In 2016 all services will be required to operate within the planned budget level set out in table below. Whilst the PCRS budget shows an overall net increase of 6.57%, there is significant growth in drug expenditure in existing run rates combined with savings targets linked to numbers availing of schemes and volume of medical cards. In addition a successful conclusion to sectoral discussions on the cost of medicines involving DPER, DoH, HSE and industry is a critical component of the PCRS breakeven plan. This is a significant risk to the overall primary care division delivering a balanced budget and as such the assumptions around volume and type of services underlying the budget was the subject of significant engagement with the DoH. Accordingly, expenditure in the PCRS budget will be the subject of close monitoring and assessment from the beginning of 2016. The HSE will avail of the existing oversight arrangements which operate in conjunction with the DoH to indicate interventions it considers necessary to ensure that the available PCRS budget is not exceeded and will seek direction from the DoH in this regard. Furthermore, the cost of increments to the division estimated at €1.3m in 2016 will have to be funded from existing resources.
2016 Primary Care Division - Net Expenditure Allocations
Primary
Care Palliative
Care Social
Inclusion Local DLS PCRS Total
€m €m €m €m €m €m
Budget 2015 748.683 71.765 127.166 217.600 2,268.166 3,433.380 Incoming Deficit Funding 5.000 15.000 142.000 162.000 Opening Base Budget 2016 753.683 71.765 127.166 232.600 2,410.166 3,595.380 Programme for Government Funding LRA 1.069 0.459 0.041 1.569 PSPR & Other Pressures 0.004 0.012 0.016 Chairman's Notes 0.006 0.006 Non Pay 2016 Cost Pressures 8.960 0.140 10.000 116.893 135.993 NSP 2015 Full Year Cost of Commitments 3.900 3.900 ED-Winter Plan 0.900 0.900 2016 Initiatives 0.700 0.700
14.839 1.171 0.140 10.000 116.934 143.084 Savings Measures 2016 Savings Measures 2.839 0.012 0.012 110.000 112.863 Adj. for ICPs other 1.283 0.124 0.194 1.601
4.122 0.136 0.206 0.000 110.000 114.464 Budget 2016 764.400 72.800 127.100 242.600 2,417.100 3,624.000
13
Workforce Plan
Introduction Primary Care services are delivered in or as close as possible to people’s homes. The Division’s people are its most valuable resource. In addition to key objectives such as recruitment and the retention of staff, maintaining a motivated workforce is of paramount importance in ensuring the quality of service delivered to the population. This requires that the Division has effective workforce planning and resource allocation arrangements in place, together with appropriate structures for positive engagement with staff. 2016 will see a focus on The People Strategy 2015 -2018 which has been developed in recognition of the vital roles the workforce plays in delivering safer and better healthcare.
Staff Engagement Employee engagement is central to the People Strategy 2015-2018, with a focus on developing mechanisms for more effective internal communications to support listening and learning across services. The Primary Care Division will facilitate staff opportunities to discuss their professional and career aspirations with their managers in a way that informs learning and development.
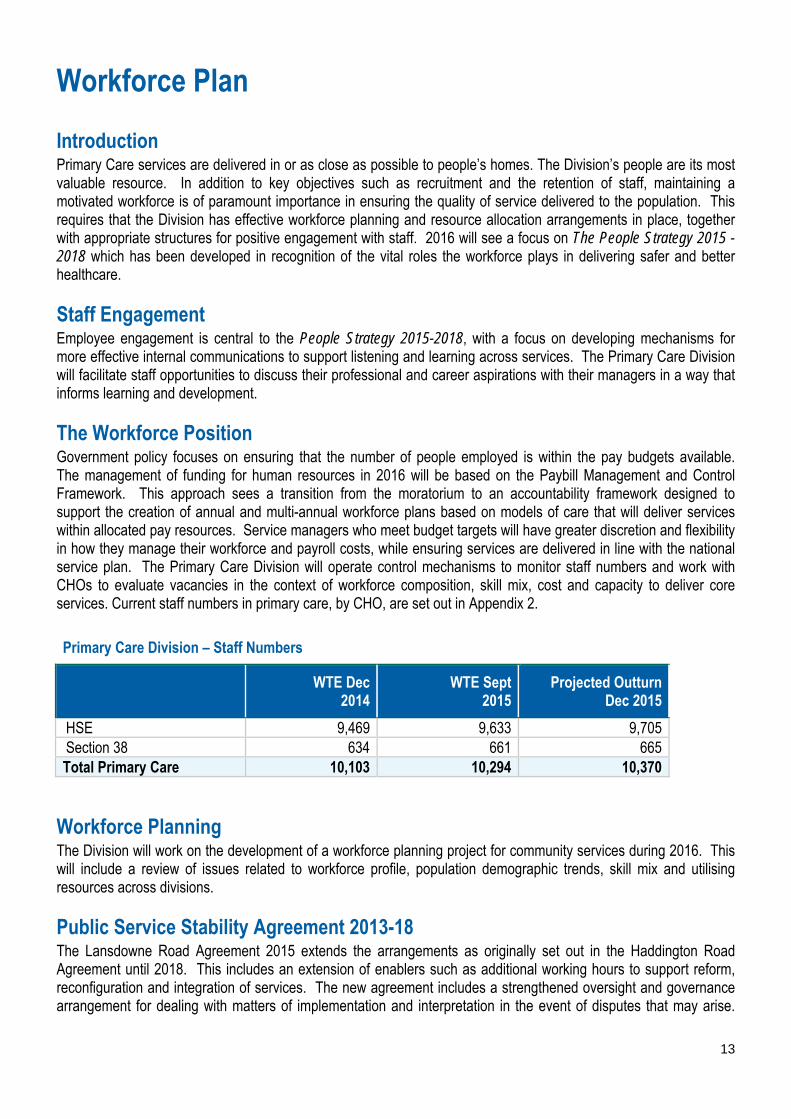
The Workforce Position Government policy focuses on ensuring that the number of people employed is within the pay budgets available. The management of funding for human resources in 2016 will be based on the Paybill Management and Control Framework. This approach sees a transition from the moratorium to an accountability framework designed to support the creation of annual and multi-annual workforce plans based on models of care that will deliver services within allocated pay resources. Service managers who meet budget targets will have greater discretion and flexibility in how they manage their workforce and payroll costs, while ensuring services are delivered in line with the national service plan. The Primary Care Division will operate control mechanisms to monitor staff numbers and work with CHOs to evaluate vacancies in the context of workforce composition, skill mix, cost and capacity to deliver core services. Current staff numbers in primary care, by CHO, are set out in Appendix 2.
Primary Care Division – Staff Numbers
WTE Dec
2014 WTE Sept
2015 Projected Outturn
Dec 2015
HSE 9,469 9,633 9,705 Section 38 634 661 665 Total Primary Care 10,103 10,294 10,370
Workforce Planning The Division will work on the development of a workforce planning project for community services during 2016. This will include a review of issues related to workforce profile, population demographic trends, skill mix and utilising resources across divisions.
Public Service Stability Agreement 2013-18 The Lansdowne Road Agreement 2015 extends the arrangements as originally set out in the Haddington Road Agreement until 2018. This includes an extension of enablers such as additional working hours to support reform, reconfiguration and integration of services. The new agreement includes a strengthened oversight and governance arrangement for dealing with matters of implementation and interpretation in the event of disputes that may arise.
14
The Division will utilise the agreement, in collaboration with staff and other stakeholders, to support the roll out of planned new community structures.
Reducing Agency and Overtime Costs There was a particular focus in 2015 on agency and overtime to reduce direct expenditure and release funding to invest in essential posts. This focus will continue in 2016, with pay costs managed and monitored through funded workforce plans within the CHOs. The Division will monitor and review agency and overtime costs whilst working to support CHOs in implementing initiatives to reduce costs such as redeployment, skill mix review and changes in work practices. Oversight and governance arrangements as set out in the Lansdowne Road Public Service Stability Agreement will support implementation and interpretation in the event of a dispute or of issues requiring clarification.
Service Developments The Primary Care Division will continue service developments commenced in 2015 in the areas of Integrated Care and Chronic Disease Projects, Children First and Palliative Care, supported by the completion of the recruitment process for these projects.
Attendance and Absence Management The Primary Care Division will build on progress made over the past year on improving attendance levels. The performance target for 2016 remains a 3.5% staff absence rate. Monitoring of attendance will be further enabled by new reporting arrangements whereby absenteeism will be reported by division rather than on a combined basis for non-acute services.
Health and Safety at Work In 2016 there will be a corporate emphasis on reviewing and revising the Corporate Safety Statement, developing key performance indicators (KPIs) in Health and Safety Management and Performance, launching a new statutory Occupational Safety and Health training policy, and developing a national audit and inspection programme. Staff will be supported to become healthier in their workplaces and an Occupational Health Business Unit will be established.
15
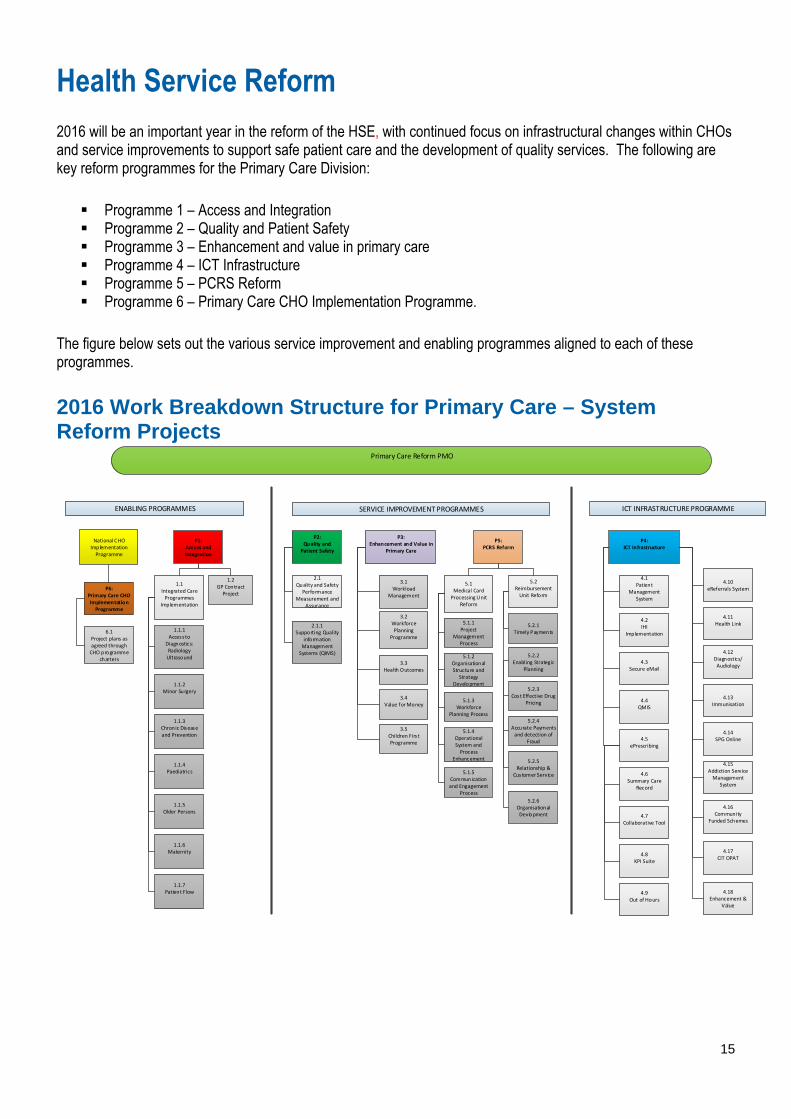
Health Service Reform 2016 will be an important year in the reform of the HSE, with continued focus on infrastructural changes within CHOs and service improvements to support safe patient care and the development of quality services. The following are key reform programmes for the Primary Care Division: Programme 1 – Access and Integration Programme 2 – Quality and Patient Safety Programme 3 – Enhancement and value in primary care Programme 4 – ICT Infrastructure Programme 5 – PCRS Reform Programme 6 – Primary Care CHO Implementation Programme.
The figure below sets out the various service improvement and enabling programmes aligned to each of these programmes.
2016 Work Breakdown Structure for Primary Care – System Reform Projects
ENABLING PROGRAMMES SERVICE IMPROVEMENT PROGRAMMES ICT INFRASTRUCTURE PROGRAMME
P6: Primary Care CHO Implementation Programme
6.1 Project plans as agreed through CHO programme
charters
P1:Access and Integration
1.1 Integrated Care Programmes
Implementation
1.1.1Access to
Diagnostics:RadiologyUltrasound
1.1.2Minor Surgery
1.1.4Paediatrics
1.2GP ContractProject
1.1.3Chronic Disease and Prevention
1.1.5Older Persons
1.1.6Maternity
1.1.7Patient Flow
P2:Quality and Patient Safety
P3:Enhancement and Value in
Primary Care
P5: PCRS Reform
2.1Quality and Safety
Performance Measurement and
Assurance
2.1.1Supporting Quality
information Management Systems (QIMS)
3.1Workload
Management
3.2Workforce Planning
Programme
3.3Health Outcomes
3.4Value for Money
3.5Children Firs t Programme
5.1Medical Card Processing Unit
Reform
5.2Reimbursement Unit Reform
5.1.1Project
Management Process
5.1.2Organisational Structure and
Strategy Development
5.1.3Workforce
Planning Process
5.1.4Operational System and Process
Enhancement
5.1.5Communication and Engagement
Process
5.2.2Enabling Strategic
Planning
5.2.3 Cost Effective Drug
Pricing
5.2.4Accurate Payments and detection of
Fraud
5.2.5Relationship &
Customer Service
5.2.6Organisational Devlopment
P4: ICT Infrastructure
4.1Patient
Management System
4.2IHI
Implementation
4.3Secure eMail
4.4QMIS
4.5ePrescribing
4.6Summary Care
Record
4.7Collaborative Tool
4.8KPI Suite
4.9Out of Hours
4.10eReferrals System
4.11Health Link
4.12Diagnostics/ Audiology
4.13 Immunisation
4.14SPG Online
4.15Addiction Service Management
System
Primary Care Reform PMO
National CHO Implementation Programme
5.2.1Timely Payments
4.16Community
Funded Schemes
4.17CIT OPAT
4.18Enhancement &
Value

16
Delivery of Services

17
Delivery of Services Legend
ND – National Director HOP – Head of Operations HPPPM – Head of Planning, Performance and Programme Management OHL – Oral Health Lead
Q&S – Quality and Safety ADL – Addiction Lead SIL – Social Inclusion Lead PCL – Palliative Care Lead NL – Nursing Lead
HIPL – Health Identifier Project Lead CFL – Children First Lead HOC – Head of Contract NCAGL – National Clinical Advisory Group Lead NCAGL – GP Lead
ANDPCRS – Assistant National Director, Primary Care Reimbursement Service COCCP – Community Oncology Cancer Control Programme GPTPL – GP Training Project Lead NCLAS – National Clinical Lead Addiction Services
Key Priorities and Actions to Deliver on Goals in 2016 Promote health and wellbeing as part of everything we do so that people will be healthier
Primary Care and Health and Wellbeing Collaborative Actions for Healthy Ireland Implementation Plan In partnership with health and wellbeing services the following will be delivered in 2016: ► Support CHOs to develop implementation plans for Healthy Ireland. ► Engage with LCDCs to ensure relevant health and social care priorities are addressed. ► Implement the Healthy Workplace Policy with supporting initiatives for staff to look after their own Health and
Wellbeing. Operational Plan Actions End Q Owner Support CHOs on development of Primary Care, PCRS, Social Inclusion and Palliative
Care actions for inclusion in their CHO implementation plans for Healthy Ireland. Q1-Q4 HPPPM
AND Support each CHO in their engagement with the LCDCs and in the development of the
Local Economic and Community Plans in collaboration with Health and Wellbeing. PCRS
SIL PCL
Implement child health programmes / initiative to improve health outcomes for children ► Implement the revised child health programme.
Operational Plan Actions End Q Owner Engage with the National Steering Group on Implementation of revised Child Health
Model. Q3 HPPPM
Engage with the Health and Wellbeing Division to agree a governance structure to support all child screening programmes.
Q4 HPPPM
► Implement the Nurture - Infant Health and Wellbeing programme in primary care settings.
Operational Plan Actions End Q Owner Implement the plan for the rollout of the Nurture Programme – Infant Health and
Wellbeing. Q1 HPPPM
Support the development of a dedicated ‘Child Health’ webpage on the HSE’s website Q4 HPPPM Agree the framework for the provision of child health training modules to frontline staff. Review and update the child safety training programme.
Q4 Q4
HPPPM HPPPM
Improve national immunisation rates ► Improve influenza vaccination uptake rates among persons aged 65 and over. ► Improve influenza vaccine uptake rates among staff in front line settings.
18
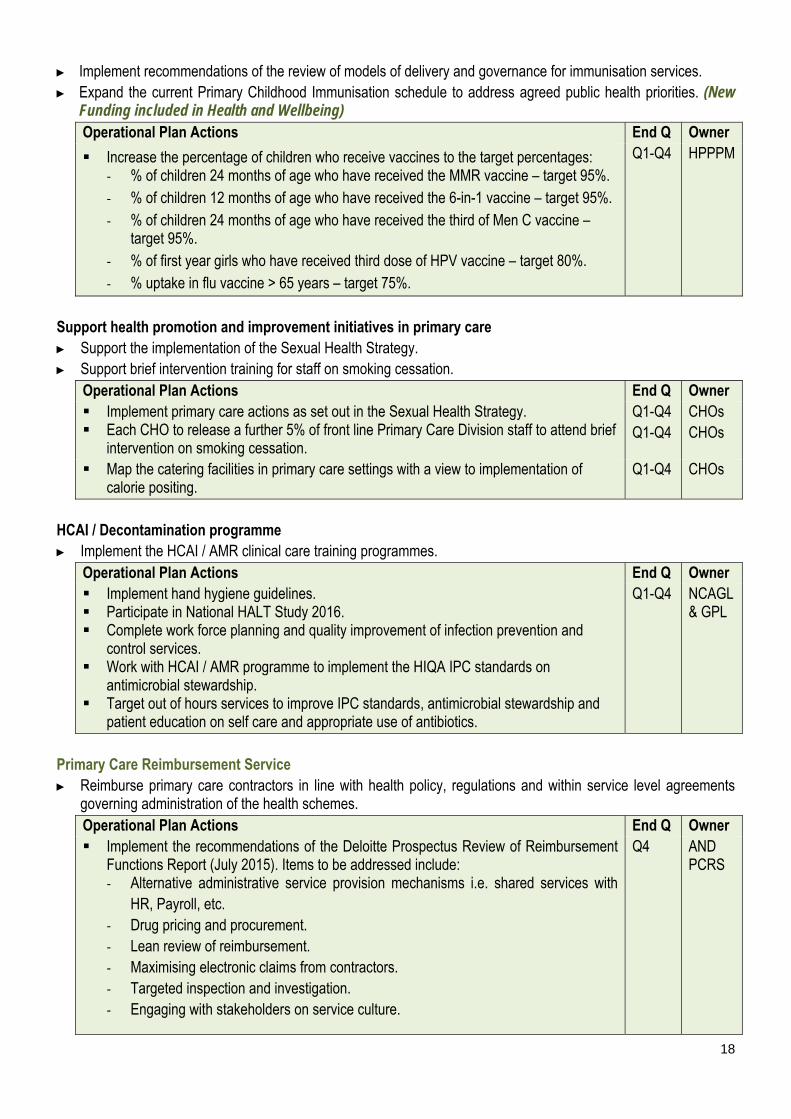
► Implement recommendations of the review of models of delivery and governance for immunisation services. ► Expand the current Primary Childhood Immunisation schedule to address agreed public health priorities. (New
Funding included in Health and Wellbeing) Operational Plan Actions End Q Owner
Increase the percentage of children who receive vaccines to the target percentages: - % of children 24 months of age who have received the MMR vaccine – target 95%. - % of children 12 months of age who have received the 6-in-1 vaccine – target 95%. - % of children 24 months of age who have received the third of Men C vaccine –
target 95%. - % of first year girls who have received third dose of HPV vaccine – target 80%. - % uptake in flu vaccine > 65 years – target 75%.
Q1-Q4 HPPPM
Support health promotion and improvement initiatives in primary care ► Support the implementation of the Sexual Health Strategy. ► Support brief intervention training for staff on smoking cessation.
Operational Plan Actions End Q Owner Implement primary care actions as set out in the Sexual Health Strategy. Each CHO to release a further 5% of front line Primary Care Division staff to attend brief
intervention on smoking cessation.
Q1-Q4 Q1-Q4
CHOs CHOs
Map the catering facilities in primary care settings with a view to implementation of calorie positing.
Q1-Q4 CHOs
HCAI / Decontamination programme ► Implement the HCAI / AMR clinical care training programmes.
Operational Plan Actions End Q Owner Implement hand hygiene guidelines. Participate in National HALT Study 2016. Complete work force planning and quality improvement of infection prevention and
control services. Work with HCAI / AMR programme to implement the HIQA IPC standards on
antimicrobial stewardship. Target out of hours services to improve IPC standards, antimicrobial stewardship and
patient education on self care and appropriate use of antibiotics.
Q1-Q4 NCAGL & GPL
Primary Care Reimbursement Service ► Reimburse primary care contractors in line with health policy, regulations and within service level agreements
governing administration of the health schemes. Operational Plan Actions End Q Owner Implement the recommendations of the Deloitte Prospectus Review of Reimbursement
Functions Report (July 2015). Items to be addressed include: - Alternative administrative service provision mechanisms i.e. shared services with
HR, Payroll, etc. - Drug pricing and procurement. - Lean review of reimbursement. - Maximising electronic claims from contractors. - Targeted inspection and investigation. - Engaging with stakeholders on service culture.
Q4 AND PCRS
19
Develop and implement action plans to ensure that the reimbursement function has a clear vision, proper staffing and appropriate structures to implement these recommendations.
Q3 AND PCRS
Assess eligibility of new applicants for medical cards and GP visit cards and review eligibility of existing cardholders in line with health legislation, policy, regulations and service level arrangements governing administration of the GMS Scheme.
- Implement the recommendations of the Clinical Advisory Group.
Q4 AND PCRS
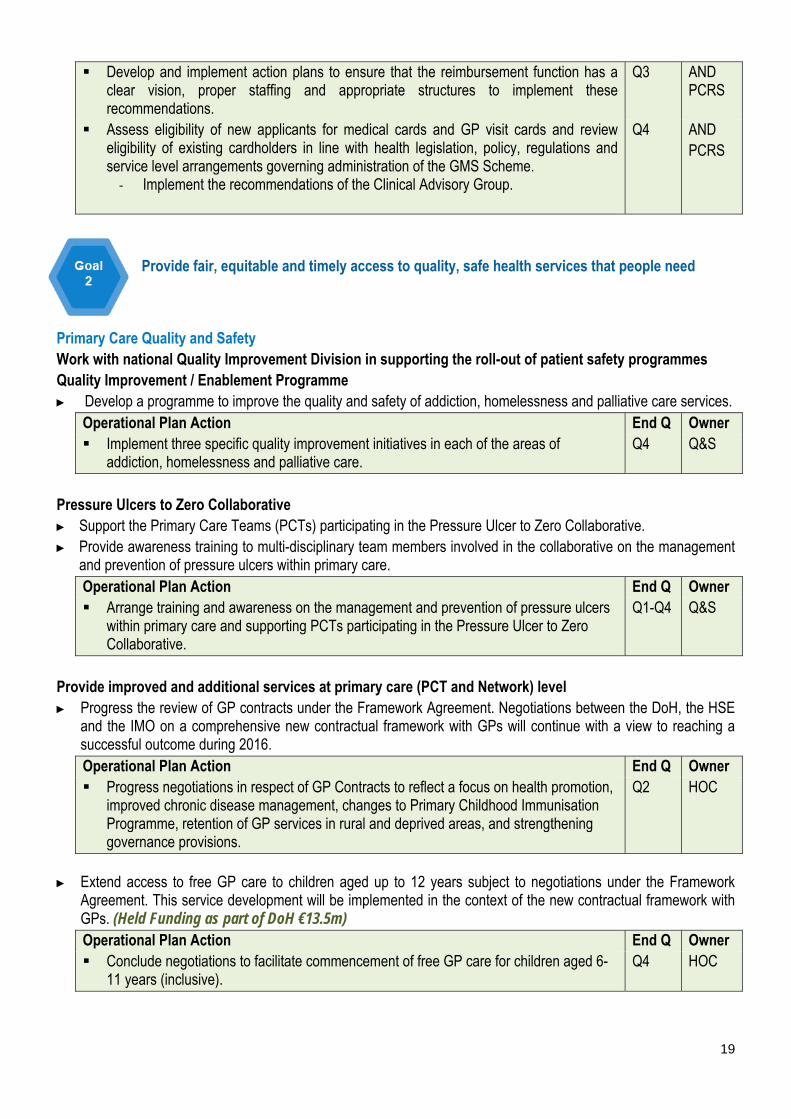
Provide fair, equitable and timely access to quality, safe health services that people need
Primary Care Quality and Safety Work with national Quality Improvement Division in supporting the roll-out of patient safety programmes Quality Improvement / Enablement Programme ► Develop a programme to improve the quality and safety of addiction, homelessness and palliative care services.
Operational Plan Action End Q Owner Implement three specific quality improvement initiatives in each of the areas of
addiction, homelessness and palliative care. Q4 Q&S
Pressure Ulcers to Zero Collaborative ► Support the Primary Care Teams (PCTs) participating in the Pressure Ulcer to Zero Collaborative. ► Provide awareness training to multi-disciplinary team members involved in the collaborative on the management
and prevention of pressure ulcers within primary care. Operational Plan Action End Q Owner Arrange training and awareness on the management and prevention of pressure ulcers
within primary care and supporting PCTs participating in the Pressure Ulcer to Zero Collaborative.
Q1-Q4 Q&S
Provide improved and additional services at primary care (PCT and Network) level ► Progress the review of GP contracts under the Framework Agreement. Negotiations between the DoH, the HSE
and the IMO on a comprehensive new contractual framework with GPs will continue with a view to reaching a successful outcome during 2016. Operational Plan Action End Q Owner Progress negotiations in respect of GP Contracts to reflect a focus on health promotion,
improved chronic disease management, changes to Primary Childhood Immunisation Programme, retention of GP services in rural and deprived areas, and strengthening governance provisions.
Q2 HOC
► Extend access to free GP care to children aged up to 12 years subject to negotiations under the Framework
Agreement. This service development will be implemented in the context of the new contractual framework with GPs. (Held Funding as part of DoH €13.5m) Operational Plan Action End Q Owner Conclude negotiations to facilitate commencement of free GP care for children aged 6-
11 years (inclusive). Q4 HOC
20
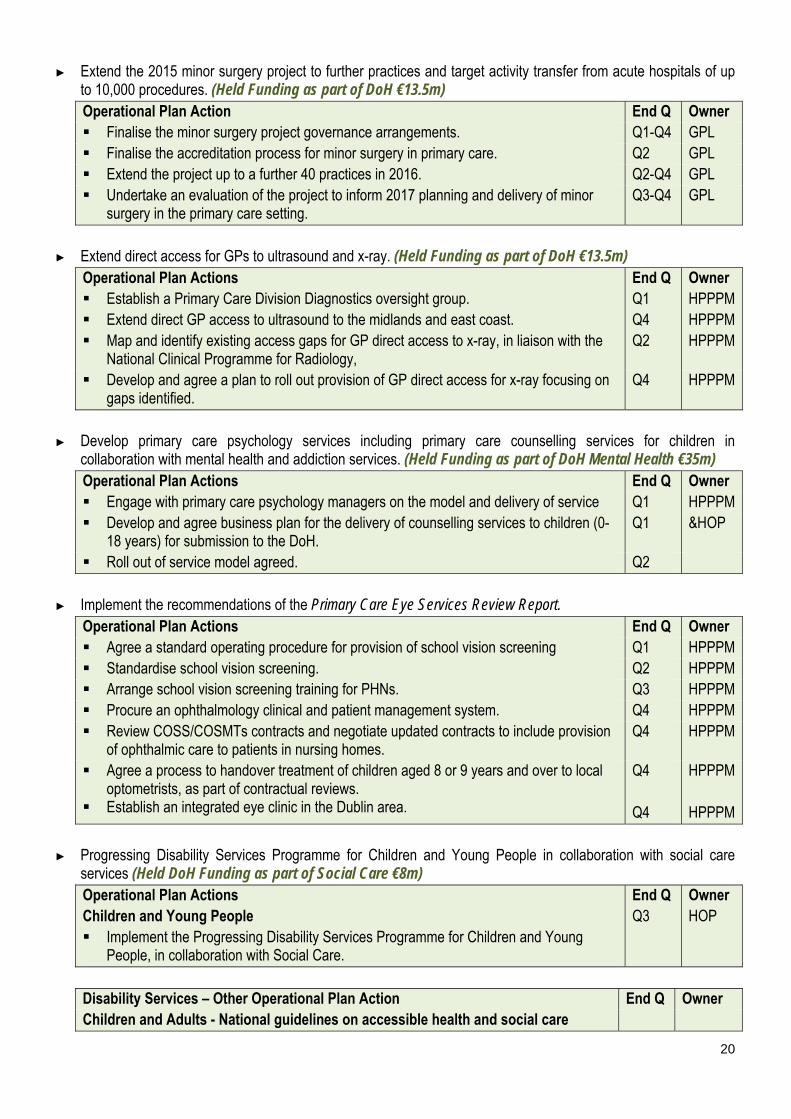
► Extend the 2015 minor surgery project to further practices and target activity transfer from acute hospitals of up to 10,000 procedures. (Held Funding as part of DoH €13.5m) Operational Plan Action End Q Owner Finalise the minor surgery project governance arrangements. Q1-Q4 GPL Finalise the accreditation process for minor surgery in primary care. Q2 GPL Extend the project up to a further 40 practices in 2016. Q2-Q4 GPL Undertake an evaluation of the project to inform 2017 planning and delivery of minor
surgery in the primary care setting. Q3-Q4 GPL
► Extend direct access for GPs to ultrasound and x-ray. (Held Funding as part of DoH €13.5m)
Operational Plan Actions End Q Owner Establish a Primary Care Division Diagnostics oversight group. Q1 HPPPM Extend direct GP access to ultrasound to the midlands and east coast. Q4 HPPPM Map and identify existing access gaps for GP direct access to x-ray, in liaison with the
National Clinical Programme for Radiology, Q2 HPPPM
Develop and agree a plan to roll out provision of GP direct access for x-ray focusing on gaps identified.
Q4 HPPPM
► Develop primary care psychology services including primary care counselling services for children in
collaboration with mental health and addiction services. (Held Funding as part of DoH Mental Health €35m) Operational Plan Actions End Q Owner Engage with primary care psychology managers on the model and delivery of service Q1 HPPPM Develop and agree business plan for the delivery of counselling services to children (0-
18 years) for submission to the DoH. Q1 &HOP
Roll out of service model agreed. Q2
► Implement the recommendations of the Primary Care Eye Services Review Report. Operational Plan Actions End Q Owner Agree a standard operating procedure for provision of school vision screening Q1 HPPPM Standardise school vision screening. Q2 HPPPM Arrange school vision screening training for PHNs. Q3 HPPPM Procure an ophthalmology clinical and patient management system. Q4 HPPPM Review COSS/COSMTs contracts and negotiate updated contracts to include provision
of ophthalmic care to patients in nursing homes. Q4 HPPPM
Agree a process to handover treatment of children aged 8 or 9 years and over to local optometrists, as part of contractual reviews.
Establish an integrated eye clinic in the Dublin area.
Q4 Q4
HPPPM HPPPM
► Progressing Disability Services Programme for Children and Young People in collaboration with social care
services (Held DoH Funding as part of Social Care €8m) Operational Plan Actions Children and Young People Implement the Progressing Disability Services Programme for Children and Young
People, in collaboration with Social Care.
End Q Q3
Owner HOP
Disability Services – Other Operational Plan Action End Q Owner Children and Adults - National guidelines on accessible health and social care
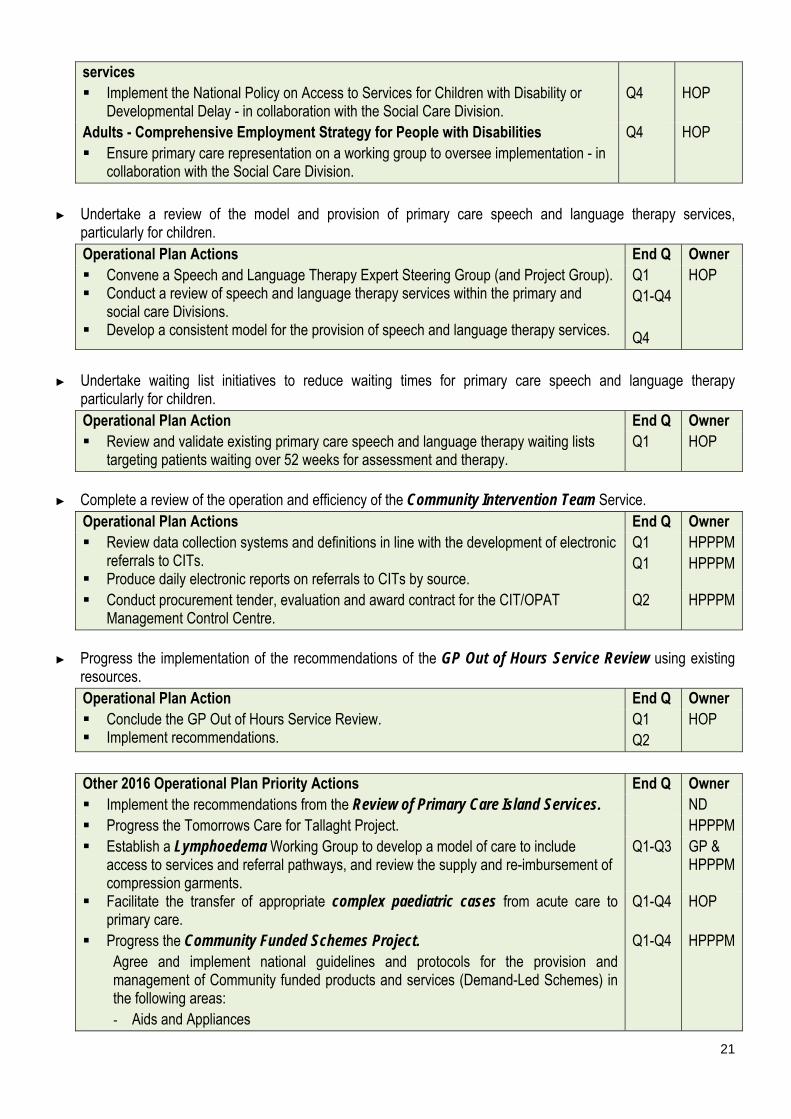
21
services Implement the National Policy on Access to Services for Children with Disability or
Developmental Delay - in collaboration with the Social Care Division.
Q4
HOP
Adults - Comprehensive Employment Strategy for People with Disabilities Ensure primary care representation on a working group to oversee implementation - in
collaboration with the Social Care Division.
Q4 HOP
► Undertake a review of the model and provision of primary care speech and language therapy services,
particularly for children. Operational Plan Actions End Q Owner Convene a Speech and Language Therapy Expert Steering Group (and Project Group). Conduct a review of speech and language therapy services within the primary and
social care Divisions. Develop a consistent model for the provision of speech and language therapy services.
Q1 Q1-Q4 Q4
HOP
► Undertake waiting list initiatives to reduce waiting times for primary care speech and language therapy
particularly for children. Operational Plan Action End Q Owner Review and validate existing primary care speech and language therapy waiting lists
targeting patients waiting over 52 weeks for assessment and therapy. Q1 HOP
► Complete a review of the operation and efficiency of the Community Intervention Team Service.
Operational Plan Actions End Q Owner Review data collection systems and definitions in line with the development of electronic
referrals to CITs. Produce daily electronic reports on referrals to CITs by source.
Q1 Q1
HPPPM HPPPM
Conduct procurement tender, evaluation and award contract for the CIT/OPAT Management Control Centre.
Q2 HPPPM
► Progress the implementation of the recommendations of the GP Out of Hours Service Review using existing
resources. Operational Plan Action End Q Owner Conclude the GP Out of Hours Service Review. Implement recommendations.
Q1 Q2
HOP
Other 2016 Operational Plan Priority Actions End Q Owner Implement the recommendations from the Review of Primary Care Island Services. ND Progress the Tomorrows Care for Tallaght Project. HPPPM Establish a Lymphoedema Working Group to develop a model of care to include
access to services and referral pathways, and review the supply and re-imbursement of compression garments.
Q1-Q3 GP & HPPPM
Facilitate the transfer of appropriate complex paediatric cases from acute care to primary care.
Q1-Q4 HOP
Progress the Community Funded Schemes Project. Agree and implement national guidelines and protocols for the provision and management of Community funded products and services (Demand-Led Schemes) in the following areas: - Aids and Appliances
Q1-Q4 HPPPM
22
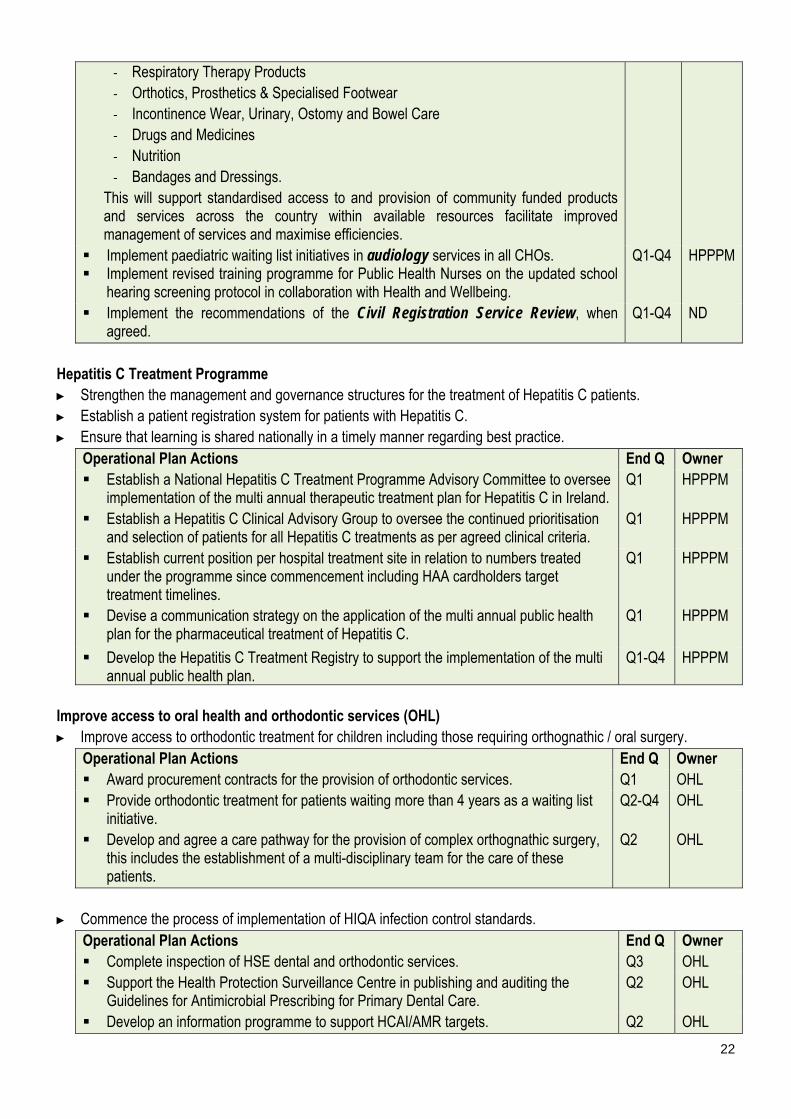
- Respiratory Therapy Products - Orthotics, Prosthetics & Specialised Footwear - Incontinence Wear, Urinary, Ostomy and Bowel Care - Drugs and Medicines - Nutrition - Bandages and Dressings.
This will support standardised access to and provision of community funded products and services across the country within available resources facilitate improved management of services and maximise efficiencies.
Implement paediatric waiting list initiatives in audiology services in all CHOs. Implement revised training programme for Public Health Nurses on the updated school
hearing screening protocol in collaboration with Health and Wellbeing.
Q1-Q4 HPPPM
Implement the recommendations of the Civil Registration Service Review, when agreed.
Q1-Q4 ND
Hepatitis C Treatment Programme ► Strengthen the management and governance structures for the treatment of Hepatitis C patients. ► Establish a patient registration system for patients with Hepatitis C. ► Ensure that learning is shared nationally in a timely manner regarding best practice.
Operational Plan Actions End Q Owner Establish a National Hepatitis C Treatment Programme Advisory Committee to oversee
implementation of the multi annual therapeutic treatment plan for Hepatitis C in Ireland. Q1 HPPPM
Establish a Hepatitis C Clinical Advisory Group to oversee the continued prioritisation and selection of patients for all Hepatitis C treatments as per agreed clinical criteria.
Q1 HPPPM
Establish current position per hospital treatment site in relation to numbers treated under the programme since commencement including HAA cardholders target treatment timelines.
Q1 HPPPM
Devise a communication strategy on the application of the multi annual public health plan for the pharmaceutical treatment of Hepatitis C.
Q1
HPPPM
Develop the Hepatitis C Treatment Registry to support the implementation of the multi annual public health plan.
Q1-Q4 HPPPM
Improve access to oral health and orthodontic services (OHL) ► Improve access to orthodontic treatment for children including those requiring orthognathic / oral surgery.
Operational Plan Actions End Q Owner Award procurement contracts for the provision of orthodontic services. Q1 OHL Provide orthodontic treatment for patients waiting more than 4 years as a waiting list
initiative. Q2-Q4 OHL
Develop and agree a care pathway for the provision of complex orthognathic surgery, this includes the establishment of a multi-disciplinary team for the care of these patients.
Q2 OHL
► Commence the process of implementation of HIQA infection control standards.
Operational Plan Actions End Q Owner Complete inspection of HSE dental and orthodontic services. Q3 OHL Support the Health Protection Surveillance Centre in publishing and auditing the
Guidelines for Antimicrobial Prescribing for Primary Dental Care. Q2 OHL
Develop an information programme to support HCAI/AMR targets. Q2 OHL
23
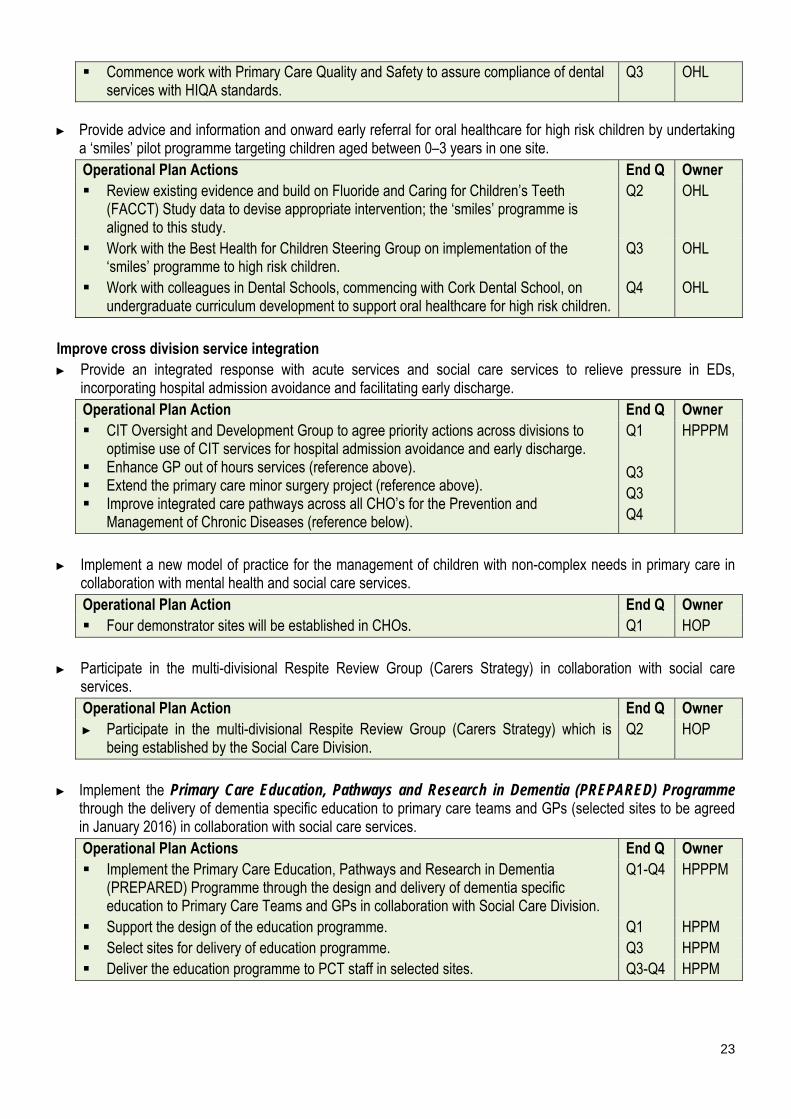
Commence work with Primary Care Quality and Safety to assure compliance of dental services with HIQA standards.
Q3 OHL
► Provide advice and information and onward early referral for oral healthcare for high risk children by undertaking a ‘smiles’ pilot programme targeting children aged between 0–3 years in one site. Operational Plan Actions End Q Owner Review existing evidence and build on Fluoride and Caring for Children’s Teeth
(FACCT) Study data to devise appropriate intervention; the ‘smiles’ programme is aligned to this study.
Q2 OHL
Work with the Best Health for Children Steering Group on implementation of the ‘smiles’ programme to high risk children.
Q3 OHL
Work with colleagues in Dental Schools, commencing with Cork Dental School, on undergraduate curriculum development to support oral healthcare for high risk children.
Q4 OHL
Improve cross division service integration ► Provide an integrated response with acute services and social care services to relieve pressure in EDs,
incorporating hospital admission avoidance and facilitating early discharge. Operational Plan Action End Q Owner CIT Oversight and Development Group to agree priority actions across divisions to
optimise use of CIT services for hospital admission avoidance and early discharge. Enhance GP out of hours services (reference above). Extend the primary care minor surgery project (reference above). Improve integrated care pathways across all CHO’s for the Prevention and
Management of Chronic Diseases (reference below).
Q1 Q3 Q3 Q4
HPPPM
► Implement a new model of practice for the management of children with non-complex needs in primary care in
collaboration with mental health and social care services. Operational Plan Action End Q Owner Four demonstrator sites will be established in CHOs. Q1 HOP
► Participate in the multi-divisional Respite Review Group (Carers Strategy) in collaboration with social care services. Operational Plan Action End Q Owner ► Participate in the multi-divisional Respite Review Group (Carers Strategy) which is
being established by the Social Care Division. Q2 HOP
► Implement the Primary Care Education, Pathways and Research in Dementia (PREPARED) Programme
through the delivery of dementia specific education to primary care teams and GPs (selected sites to be agreed in January 2016) in collaboration with social care services. Operational Plan Actions End Q Owner Implement the Primary Care Education, Pathways and Research in Dementia
(PREPARED) Programme through the design and delivery of dementia specific education to Primary Care Teams and GPs in collaboration with Social Care Division.
Q1-Q4 HPPPM
Support the design of the education programme. Q1 HPPM Select sites for delivery of education programme. Q3 HPPM Deliver the education programme to PCT staff in selected sites. Q3-Q4 HPPM
24
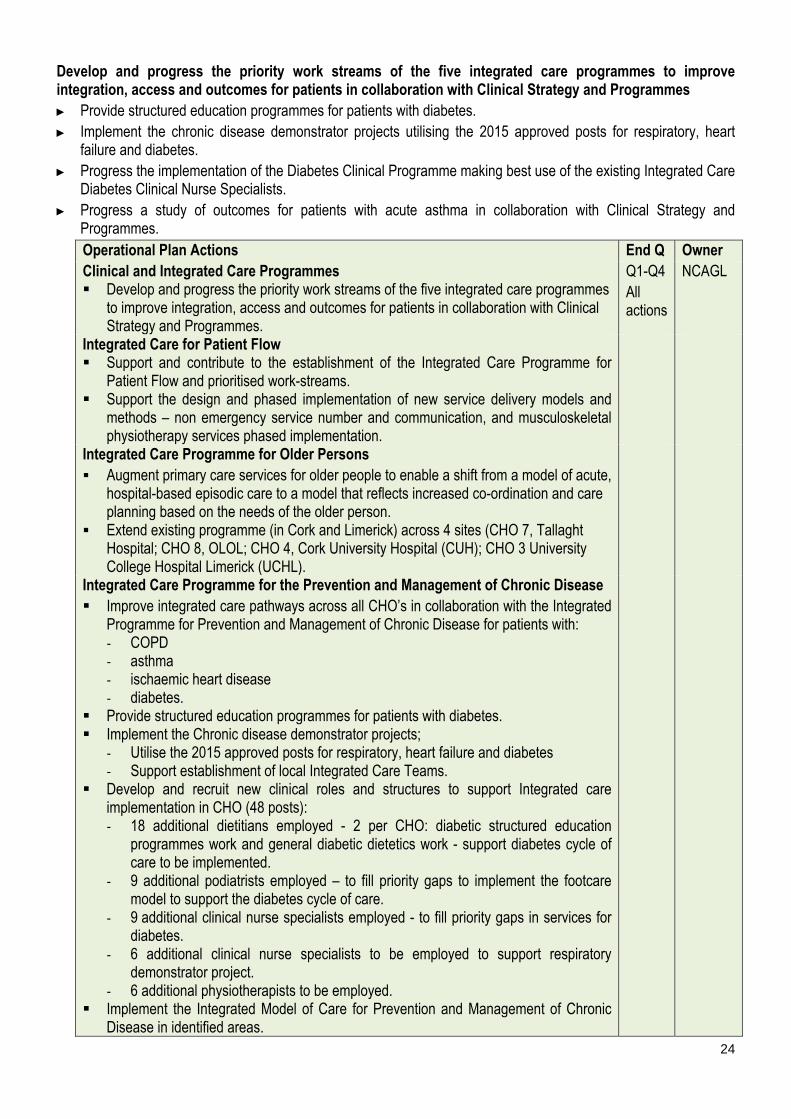
Develop and progress the priority work streams of the five integrated care programmes to improve integration, access and outcomes for patients in collaboration with Clinical Strategy and Programmes ► Provide structured education programmes for patients with diabetes. ► Implement the chronic disease demonstrator projects utilising the 2015 approved posts for respiratory, heart
failure and diabetes. ► Progress the implementation of the Diabetes Clinical Programme making best use of the existing Integrated Care
Diabetes Clinical Nurse Specialists. ► Progress a study of outcomes for patients with acute asthma in collaboration with Clinical Strategy and
Programmes. Operational Plan Actions End Q Owner Clinical and Integrated Care Programmes Develop and progress the priority work streams of the five integrated care programmes
to improve integration, access and outcomes for patients in collaboration with Clinical Strategy and Programmes.
Q1-Q4 All actions
NCAGL
Integrated Care for Patient Flow Support and contribute to the establishment of the Integrated Care Programme for
Patient Flow and prioritised work-streams. Support the design and phased implementation of new service delivery models and
methods – non emergency service number and communication, and musculoskeletal physiotherapy services phased implementation.
Integrated Care Programme for Older Persons Augment primary care services for older people to enable a shift from a model of acute,
hospital-based episodic care to a model that reflects increased co-ordination and care planning based on the needs of the older person.
Extend existing programme (in Cork and Limerick) across 4 sites (CHO 7, Tallaght Hospital; CHO 8, OLOL; CHO 4, Cork University Hospital (CUH); CHO 3 University College Hospital Limerick (UCHL).
Integrated Care Programme for the Prevention and Management of Chronic Disease Improve integrated care pathways across all CHO’s in collaboration with the Integrated
Programme for Prevention and Management of Chronic Disease for patients with: - COPD - asthma - ischaemic heart disease - diabetes.
Provide structured education programmes for patients with diabetes. Implement the Chronic disease demonstrator projects;
- Utilise the 2015 approved posts for respiratory, heart failure and diabetes - Support establishment of local Integrated Care Teams.
Develop and recruit new clinical roles and structures to support Integrated care implementation in CHO (48 posts): - 18 additional dietitians employed - 2 per CHO: diabetic structured education
programmes work and general diabetic dietetics work - support diabetes cycle of care to be implemented.
- 9 additional podiatrists employed – to fill priority gaps to implement the footcare model to support the diabetes cycle of care.
- 9 additional clinical nurse specialists employed - to fill priority gaps in services for diabetes.
- 6 additional clinical nurse specialists to be employed to support respiratory demonstrator project.
- 6 additional physiotherapists to be employed. Implement the Integrated Model of Care for Prevention and Management of Chronic
Disease in identified areas.
25
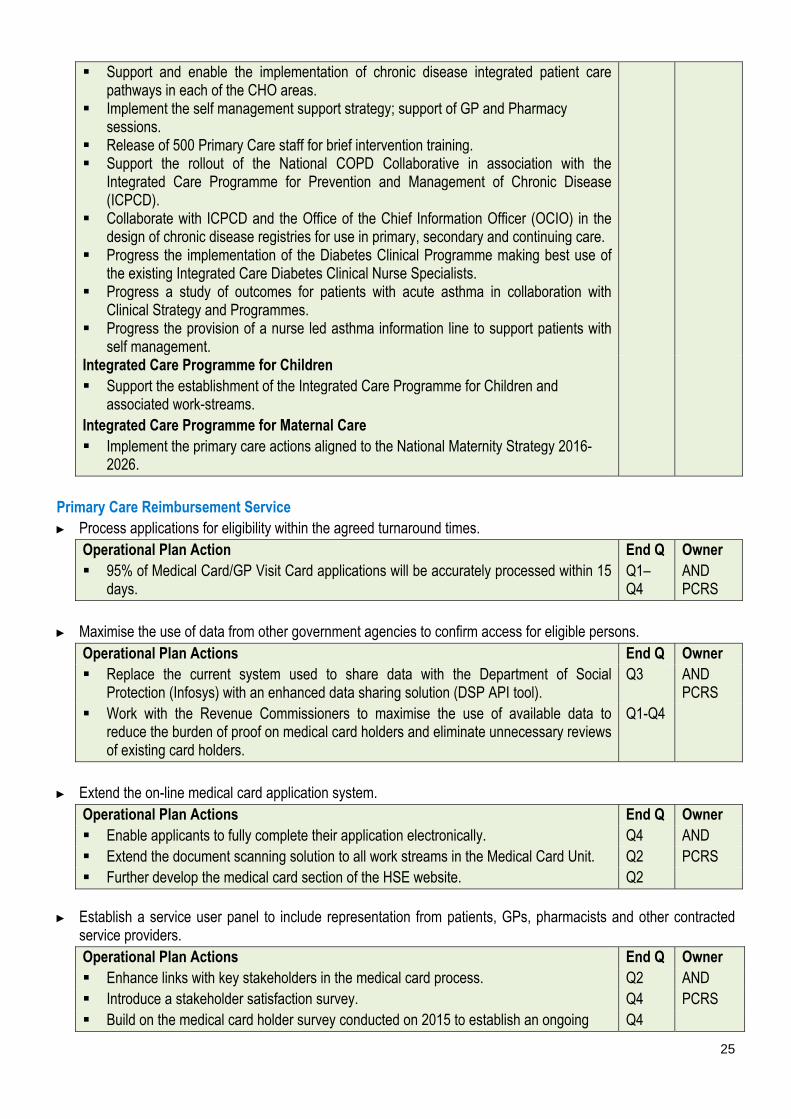
Support and enable the implementation of chronic disease integrated patient care pathways in each of the CHO areas.
Implement the self management support strategy; support of GP and Pharmacy sessions.
Release of 500 Primary Care staff for brief intervention training. Support the rollout of the National COPD Collaborative in association with the
Integrated Care Programme for Prevention and Management of Chronic Disease (ICPCD).
Collaborate with ICPCD and the Office of the Chief Information Officer (OCIO) in the design of chronic disease registries for use in primary, secondary and continuing care.
Progress the implementation of the Diabetes Clinical Programme making best use of the existing Integrated Care Diabetes Clinical Nurse Specialists.
Progress a study of outcomes for patients with acute asthma in collaboration with Clinical Strategy and Programmes.
Progress the provision of a nurse led asthma information line to support patients with self management.
Integrated Care Programme for Children Support the establishment of the Integrated Care Programme for Children and
associated work-streams. Integrated Care Programme for Maternal Care Implement the primary care actions aligned to the National Maternity Strategy 2016-
2026.
Primary Care Reimbursement Service ► Process applications for eligibility within the agreed turnaround times.
Operational Plan Action End Q Owner 95% of Medical Card/GP Visit Card applications will be accurately processed within 15
days. Q1–Q4
AND PCRS
► Maximise the use of data from other government agencies to confirm access for eligible persons.
Operational Plan Actions End Q Owner Replace the current system used to share data with the Department of Social
Protection (Infosys) with an enhanced data sharing solution (DSP API tool). Q3 AND
PCRS Work with the Revenue Commissioners to maximise the use of available data to
reduce the burden of proof on medical card holders and eliminate unnecessary reviews of existing card holders.
Q1-Q4
► Extend the on-line medical card application system.
Operational Plan Actions End Q Owner Enable applicants to fully complete their application electronically. Q4 AND Extend the document scanning solution to all work streams in the Medical Card Unit. Q2 PCRS Further develop the medical card section of the HSE website. Q2
► Establish a service user panel to include representation from patients, GPs, pharmacists and other contracted service providers. Operational Plan Actions End Q Owner Enhance links with key stakeholders in the medical card process. Q2 AND Introduce a stakeholder satisfaction survey. Q4 PCRS Build on the medical card holder survey conducted on 2015 to establish an ongoing Q4

26
process of assessing card holder satisfaction at least annually. Develop and expand the Quality Assurance function (established in 2015) to ensure:
- Comprehensive review of all client correspondence. - Assurance that each letter is Irish language certified and reviewed by NALA. - Establish quality assurance clinics to troubleshoot complex applications and
update Standard Operating Procedures accordingly.
Q2 Q2 Q2
Incorporate Eircodes for all medical card applicants into the National Medical Card Unit internal processing system and in all correspondence including forms.
Q2
Enable access to new drugs and medicines in line with health policy and legislation. Q1-Q4 Implement the individual health identifier register ► Implement the plan for the roll out of individual health identifiers in 2016 in line with the Health Identifiers Act
2014. Operational Plan Action End Q Owner Design and build the IHI register design. Q2 HIPL Establish a Business Unit for the implementation of IHI. Q3 HIPL
Social Inclusion Improve health outcomes for people with addiction issues ► Implement the outstanding actions in the National Drugs Strategy (2009–2016).
Operational Plan Action End Q Owner Commence the HSE plan for phased increased access to buprenorphine/naloxone and
buprenorphine products within the context of available resources (National Drug Strategy Action 32).
Q2 ADL
Participate in development of a new National Drugs Strategy (2017 onwards) with regard to actions outlined in terms of reference of the Steering Committee.
Q2-Q4 ADL
► Ensure that adults deemed appropriate for treatment for substance abuse receive treatment within one calendar
month (National Drug Strategy Action 32). ► Ensure that children deemed appropriate for treatment for substance abuse receive treatment within one week.
Operational Plan Actions End Q Owner Implement the Opioid Treatment Protocol to ensure that addiction services can be
accessed at the lowest level of complexity and as close to the home of the service user as is practicable (arising from National Drug Strategy Action 35).
Q1-Q4 ADL
Develop and expand integrated models of care, addressing needs related to mental and/or physical health-related problems, rehabilitation, and social support in order to improve the health, social reintegration and recovery of problem and dependent drug/ alcohol users, including those affected by co-morbidity.
Enhance the effectiveness of drug and alcohol treatment and rehabilitation by introducing models of care which address co-occurring conditions.
Q1-Q4 ADL
► Ensure that addiction services operate within the person-centred care planning processes of the Drugs
Rehabilitation Framework. Operational Plan Action End Q Owner Embed the National Drugs Rehabilitation Framework among relevant HSE Divisions,
other Statutory Bodies and Voluntary/ Community Sectors to achieve integrated care management, seamless transition between services and optimal pathways to recovery for users of addiction services.
Q1-Q4 ADL
27
Monitor and review referrals, admissions and outcomes to HSE funded Tier 4 services; ensure that all referrals are in line with the National Drugs Rehabilitation Framework.
Q1-Q4 ADL
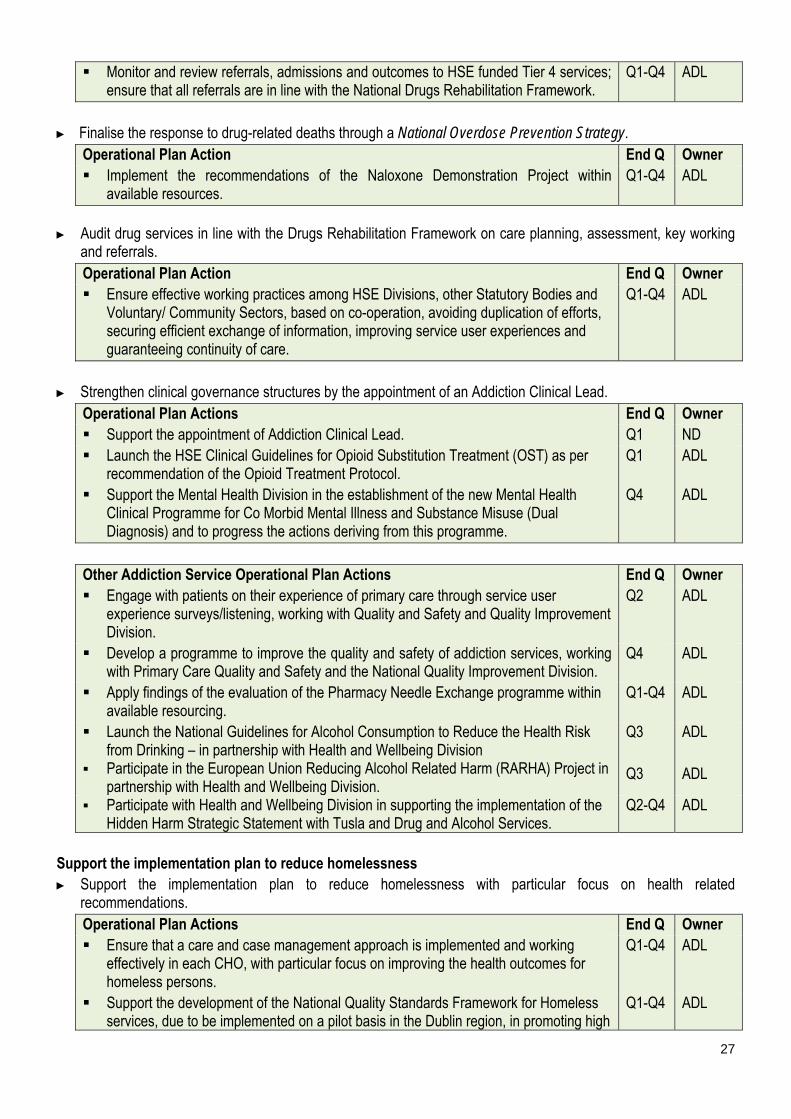
► Finalise the response to drug-related deaths through a National Overdose Prevention Strategy.
Operational Plan Action End Q Owner Implement the recommendations of the Naloxone Demonstration Project within
available resources. Q1-Q4 ADL
► Audit drug services in line with the Drugs Rehabilitation Framework on care planning, assessment, key working and referrals. Operational Plan Action End Q Owner Ensure effective working practices among HSE Divisions, other Statutory Bodies and
Voluntary/ Community Sectors, based on co-operation, avoiding duplication of efforts, securing efficient exchange of information, improving service user experiences and guaranteeing continuity of care.
Q1-Q4 ADL
► Strengthen clinical governance structures by the appointment of an Addiction Clinical Lead.
Operational Plan Actions End Q Owner Support the appointment of Addiction Clinical Lead. Q1 ND Launch the HSE Clinical Guidelines for Opioid Substitution Treatment (OST) as per
recommendation of the Opioid Treatment Protocol. Q1 ADL
Support the Mental Health Division in the establishment of the new Mental Health Clinical Programme for Co Morbid Mental Illness and Substance Misuse (Dual Diagnosis) and to progress the actions deriving from this programme.
Q4 ADL
Other Addiction Service Operational Plan Actions End Q Owner Engage with patients on their experience of primary care through service user
experience surveys/listening, working with Quality and Safety and Quality Improvement Division.
Q2 ADL
Develop a programme to improve the quality and safety of addiction services, working with Primary Care Quality and Safety and the National Quality Improvement Division.
Q4 ADL
Apply findings of the evaluation of the Pharmacy Needle Exchange programme within available resourcing.
Q1-Q4 ADL
Launch the National Guidelines for Alcohol Consumption to Reduce the Health Risk from Drinking – in partnership with Health and Wellbeing Division
Participate in the European Union Reducing Alcohol Related Harm (RARHA) Project in partnership with Health and Wellbeing Division.
Q3 Q3
ADL ADL
Participate with Health and Wellbeing Division in supporting the implementation of the Hidden Harm Strategic Statement with Tusla and Drug and Alcohol Services.
Q2-Q4 ADL
Support the implementation plan to reduce homelessness ► Support the implementation plan to reduce homelessness with particular focus on health related
recommendations. Operational Plan Actions End Q Owner Ensure that a care and case management approach is implemented and working
effectively in each CHO, with particular focus on improving the health outcomes for homeless persons.
Q1-Q4 ADL
Support the development of the National Quality Standards Framework for Homeless services, due to be implemented on a pilot basis in the Dublin region, in promoting high
Q1-Q4 ADL
28
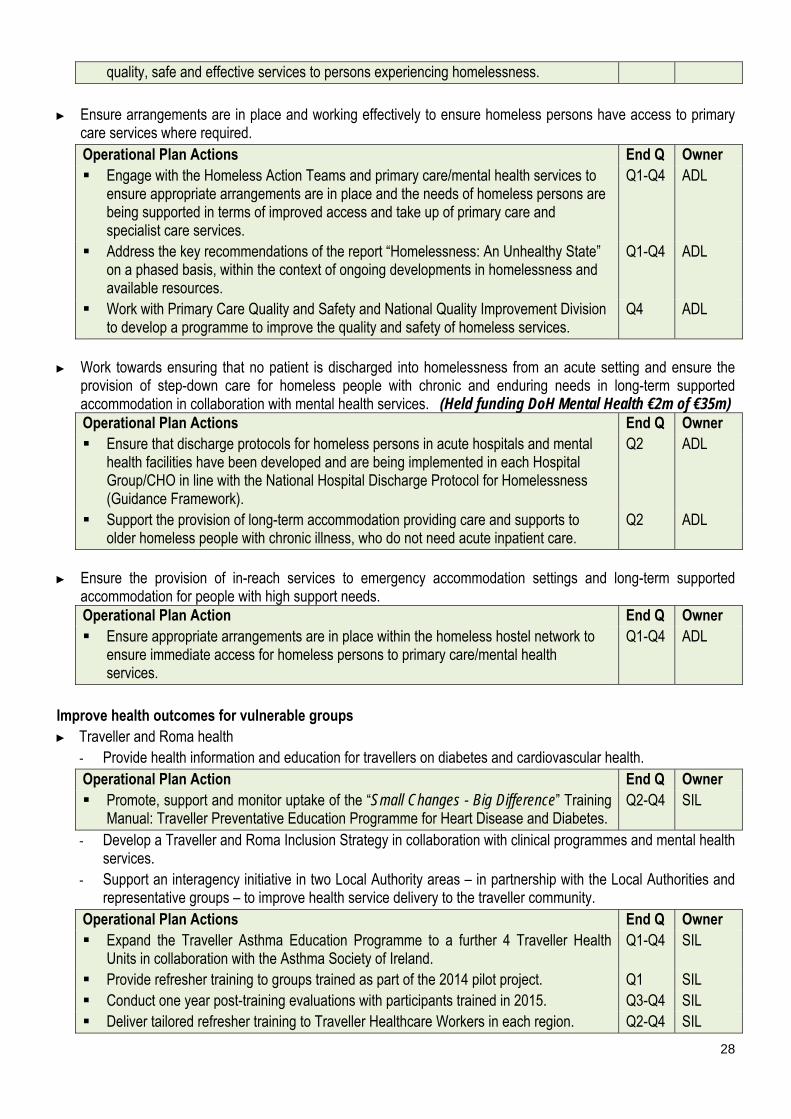
quality, safe and effective services to persons experiencing homelessness.
► Ensure arrangements are in place and working effectively to ensure homeless persons have access to primary care services where required. Operational Plan Actions End Q Owner Engage with the Homeless Action Teams and primary care/mental health services to
ensure appropriate arrangements are in place and the needs of homeless persons are being supported in terms of improved access and take up of primary care and specialist care services.
Q1-Q4 ADL
Address the key recommendations of the report “Homelessness: An Unhealthy State” on a phased basis, within the context of ongoing developments in homelessness and available resources.
Q1-Q4 ADL
Work with Primary Care Quality and Safety and National Quality Improvement Division to develop a programme to improve the quality and safety of homeless services.
Q4 ADL
► Work towards ensuring that no patient is discharged into homelessness from an acute setting and ensure the
provision of step-down care for homeless people with chronic and enduring needs in long-term supported accommodation in collaboration with mental health services. (Held funding DoH Mental Health €2m of €35m) Operational Plan Actions End Q Owner Ensure that discharge protocols for homeless persons in acute hospitals and mental
health facilities have been developed and are being implemented in each Hospital Group/CHO in line with the National Hospital Discharge Protocol for Homelessness (Guidance Framework).
Q2 ADL
Support the provision of long-term accommodation providing care and supports to older homeless people with chronic illness, who do not need acute inpatient care.
Q2 ADL
► Ensure the provision of in-reach services to emergency accommodation settings and long-term supported
accommodation for people with high support needs. Operational Plan Action End Q Owner Ensure appropriate arrangements are in place within the homeless hostel network to
ensure immediate access for homeless persons to primary care/mental health services.
Q1-Q4 ADL
Improve health outcomes for vulnerable groups ► Traveller and Roma health
- Provide health information and education for travellers on diabetes and cardiovascular health. Operational Plan Action End Q Owner Promote, support and monitor uptake of the “Small Changes - Big Difference” Training
Manual: Traveller Preventative Education Programme for Heart Disease and Diabetes. Q2-Q4 SIL
- Develop a Traveller and Roma Inclusion Strategy in collaboration with clinical programmes and mental health services.
- Support an interagency initiative in two Local Authority areas – in partnership with the Local Authorities and representative groups – to improve health service delivery to the traveller community.
Operational Plan Actions End Q Owner Expand the Traveller Asthma Education Programme to a further 4 Traveller Health
Units in collaboration with the Asthma Society of Ireland. Q1-Q4 SIL
Provide refresher training to groups trained as part of the 2014 pilot project. Q1 SIL Conduct one year post-training evaluations with participants trained in 2015. Q3-Q4 SIL Deliver tailored refresher training to Traveller Healthcare Workers in each region. Q2-Q4 SIL
29
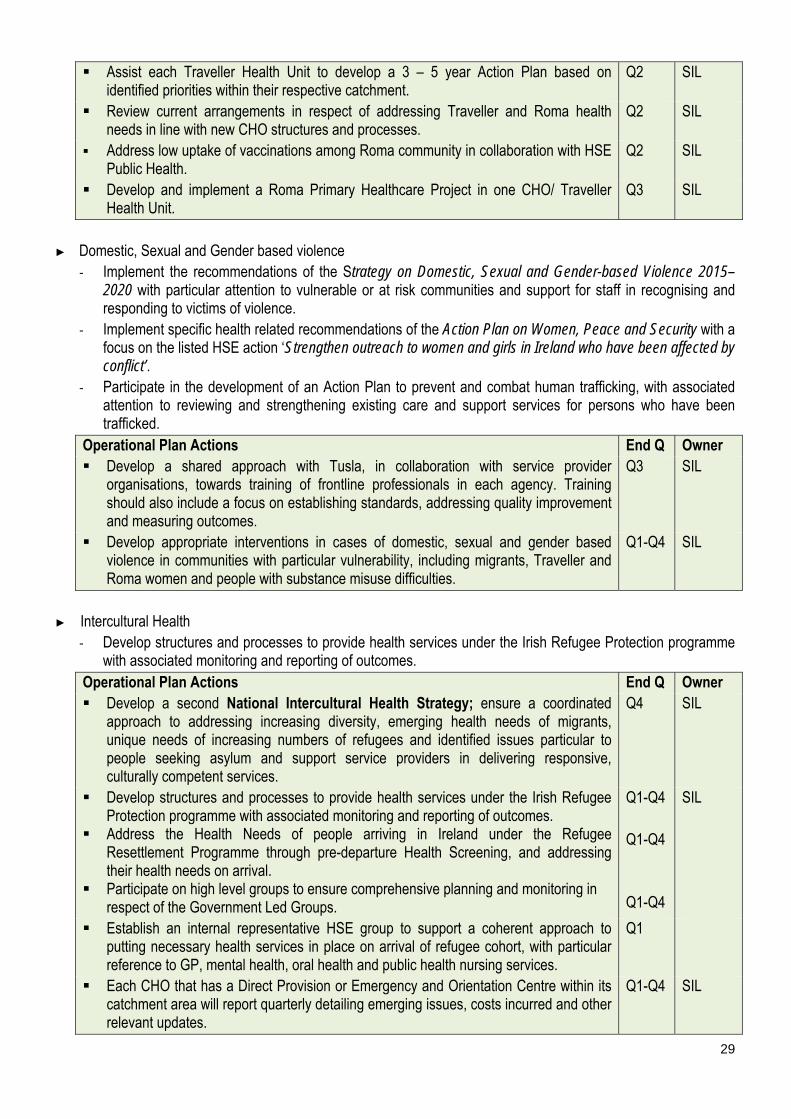
Assist each Traveller Health Unit to develop a 3 – 5 year Action Plan based on identified priorities within their respective catchment.
Q2 SIL
Review current arrangements in respect of addressing Traveller and Roma health needs in line with new CHO structures and processes.
Q2 SIL
Address low uptake of vaccinations among Roma community in collaboration with HSE Public Health.
Q2 SIL
Develop and implement a Roma Primary Healthcare Project in one CHO/ Traveller Health Unit.
Q3 SIL
► Domestic, Sexual and Gender based violence
- Implement the recommendations of the Strategy on Domestic, Sexual and Gender-based Violence 2015–2020 with particular attention to vulnerable or at risk communities and support for staff in recognising and responding to victims of violence.
- Implement specific health related recommendations of the Action Plan on Women, Peace and Security with a focus on the listed HSE action ‘Strengthen outreach to women and girls in Ireland who have been affected by conflict’.
- Participate in the development of an Action Plan to prevent and combat human trafficking, with associated attention to reviewing and strengthening existing care and support services for persons who have been trafficked.
Operational Plan Actions End Q Owner Develop a shared approach with Tusla, in collaboration with service provider
organisations, towards training of frontline professionals in each agency. Training should also include a focus on establishing standards, addressing quality improvement and measuring outcomes.
Q3 SIL
Develop appropriate interventions in cases of domestic, sexual and gender based violence in communities with particular vulnerability, including migrants, Traveller and Roma women and people with substance misuse difficulties.
Q1-Q4 SIL
► Intercultural Health
- Develop structures and processes to provide health services under the Irish Refugee Protection programme with associated monitoring and reporting of outcomes.
Operational Plan Actions End Q Owner Develop a second National Intercultural Health Strategy; ensure a coordinated
approach to addressing increasing diversity, emerging health needs of migrants, unique needs of increasing numbers of refugees and identified issues particular to people seeking asylum and support service providers in delivering responsive, culturally competent services.
Q4 SIL
Develop structures and processes to provide health services under the Irish Refugee Protection programme with associated monitoring and reporting of outcomes.
Address the Health Needs of people arriving in Ireland under the Refugee Resettlement Programme through pre-departure Health Screening, and addressing their health needs on arrival.
Participate on high level groups to ensure comprehensive planning and monitoring in respect of the Government Led Groups.
Q1-Q4 Q1-Q4 Q1-Q4
SIL
Establish an internal representative HSE group to support a coherent approach to putting necessary health services in place on arrival of refugee cohort, with particular reference to GP, mental health, oral health and public health nursing services.
Q1
Each CHO that has a Direct Provision or Emergency and Orientation Centre within its catchment area will report quarterly detailing emerging issues, costs incurred and other relevant updates.
Q1-Q4 SIL
30
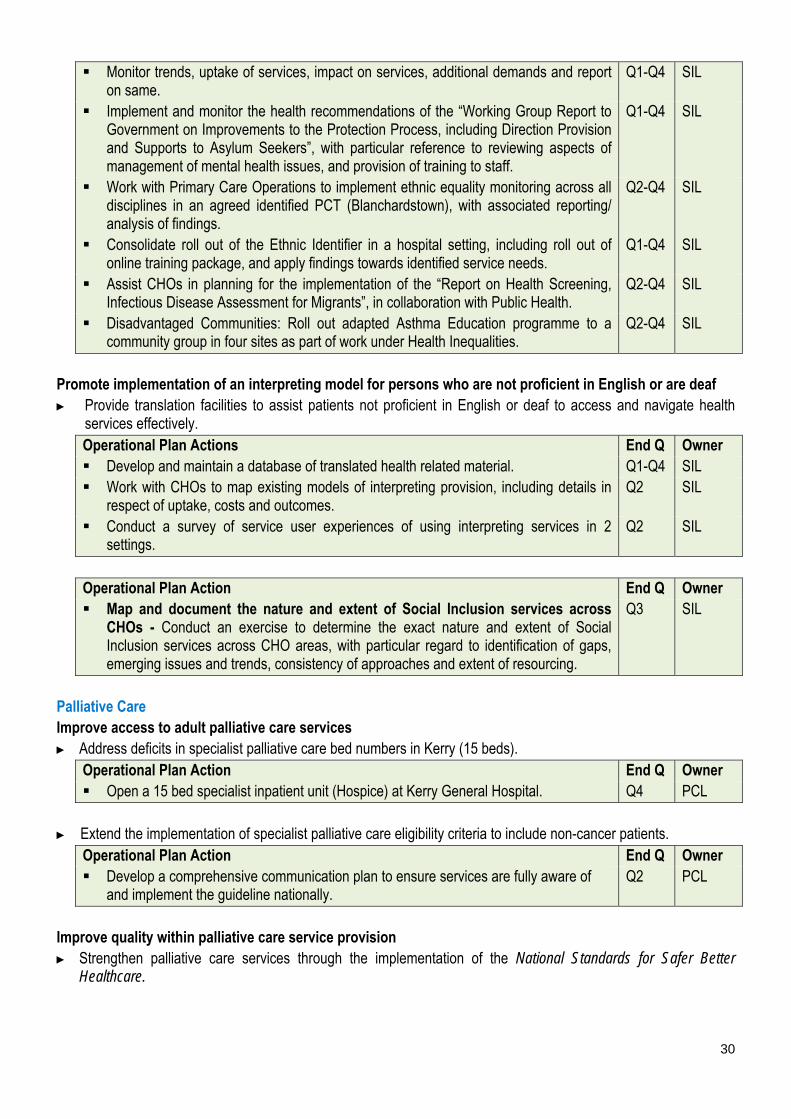
Monitor trends, uptake of services, impact on services, additional demands and report on same.
Q1-Q4 SIL
Implement and monitor the health recommendations of the “Working Group Report to Government on Improvements to the Protection Process, including Direction Provision and Supports to Asylum Seekers”, with particular reference to reviewing aspects of management of mental health issues, and provision of training to staff.
Q1-Q4 SIL
Work with Primary Care Operations to implement ethnic equality monitoring across all disciplines in an agreed identified PCT (Blanchardstown), with associated reporting/ analysis of findings.
Q2-Q4 SIL
Consolidate roll out of the Ethnic Identifier in a hospital setting, including roll out of online training package, and apply findings towards identified service needs.
Q1-Q4 SIL
Assist CHOs in planning for the implementation of the “Report on Health Screening, Infectious Disease Assessment for Migrants”, in collaboration with Public Health.
Q2-Q4 SIL
Disadvantaged Communities: Roll out adapted Asthma Education programme to a community group in four sites as part of work under Health Inequalities.
Q2-Q4 SIL
Promote implementation of an interpreting model for persons who are not proficient in English or are deaf ► Provide translation facilities to assist patients not proficient in English or deaf to access and navigate health
services effectively. Operational Plan Actions End Q Owner Develop and maintain a database of translated health related material. Q1-Q4 SIL Work with CHOs to map existing models of interpreting provision, including details in
respect of uptake, costs and outcomes. Q2 SIL
Conduct a survey of service user experiences of using interpreting services in 2 settings.
Q2 SIL
Operational Plan Action End Q Owner Map and document the nature and extent of Social Inclusion services across
CHOs - Conduct an exercise to determine the exact nature and extent of Social Inclusion services across CHO areas, with particular regard to identification of gaps, emerging issues and trends, consistency of approaches and extent of resourcing.
Q3 SIL
Palliative Care Improve access to adult palliative care services ► Address deficits in specialist palliative care bed numbers in Kerry (15 beds).
Operational Plan Action End Q Owner Open a 15 bed specialist inpatient unit (Hospice) at Kerry General Hospital. Q4 PCL
► Extend the implementation of specialist palliative care eligibility criteria to include non-cancer patients. Operational Plan Action End Q Owner Develop a comprehensive communication plan to ensure services are fully aware of
and implement the guideline nationally. Q2 PCL
Improve quality within palliative care service provision ► Strengthen palliative care services through the implementation of the National Standards for Safer Better
Healthcare.

31
Operational Plan Actions End Q Owner Establish a Quality Assurance and Improvement enabling committee for specialist
palliative care services, to be followed by a Shared Learning Forum. This forum will support services to undertake self assessment, and service improvement programmes to implement the National Standards for Safer Better Healthcare.
Q1 & Q4
PCL
► Implement clinical guidelines on the management of cancer pain and the management of constipation.
Operational Plan Actions End Q Owner Develop an implementation plan to include the communication and dissemination of
the guidelines to specialist and generalist palliative care services, including designated centres for older people.
Agree and implement a multi-site demonstration project in the Dublin area.
Q1 Q2
PCL
► Develop and implement a suite of quality improvement measures for children’s palliative care services.
Operational Plan Action End Q Owner Work with the National Development Committee on Children’s Palliative care to
develop standards and national documentation to improve the provision of children’s palliative care.
Q2 PCL
► Work with the Children’s Hospital Group to ensure existing children’s palliative care services become fully
integrated with the new structures. Operational Plan Action End Q Owner Engage with the Children’s Hospital Group to ensure that the children’s palliative care
service pathways and protocols are aligned to the Clinical Programmes. Q1 PCL
Improve access to children’s palliative care services. ► Provide for a Palliative Care Consultant previously funded by Irish Hospice Foundation. (New Funding included
in Acute Services) Operational Plan Action End Q Owner Provide a Consultant Paediatrician with a Special Interest in Paediatric Palliative Care
Medicine in Our Lady’s Children’s Hospital Crumlin. Q3 PCL
Ensure palliative care services are effective, efficient and responsive to the needs of individuals and families ► Work with the Irish Hospice Foundation on the Design and Dignity Grants Scheme.
Operational Plan Actions End Q Owner Complete the minor capital projects, funded under round two of the grant scheme to
improve the hospital environment for palliative care patients, their families and staff i.e. 12 projects over 9 sites to be completed e.g. family rooms, quiet spaces, mortuaries etc.
Q4 PCL
Complete and publish a review project of four sites funded under the scheme. Q4 PCL
► Work with primary care services on the Rapid Discharge Planning Pathway to facilitate those who wish to die at home. Operational Plan Action End Q Owner Develop an agreed process that will accommodate quick access to home care
packages and aids / equipment for patients returning home. Q1 PCL
► Implement the recommendations from the Palliative Care Support Beds Review.
32
Operational Plan Action End Q Owner Review the recommendations and develop a plan to implement the recommendations
on a phased basis. The recommendations relate to Level 2 / Support Beds aligned to Social Care.
Q3 PCL
► Implement the specialist palliative care initiative in four designated centres for older people in the North East.
Operational Plan Action End Q Owner Work in partnership across services to ensure residents requiring palliative care can
remain at home, prevent inappropriate admissions to acute hospitals and enable people to return home as quickly as possible after a stay in hospital.
Q1-Q4 PCL
► Complete a demonstration project to develop a best practice model of palliative care for EDs.
Operational Plan Action End Q Owner Work in partnership with the National Clinical Programme for Emergency Medicine and
the Irish Hospice Foundation to complete and disseminate the findings of the project undertaken in St. Vincent’s University Hospital.
Q2 PCL
► Work with NAS to support emergency responders to manage end of life care, enabling people to be cared for at
home if appropriate. Operational Plan Action End Q Owner Adults: Complete a clinical practice guideline and develop a national implementation
plan. Children: Complete the pilot of the Ambulance Care Directive for Children and develop
national implementation plan.
Q2 Q3
PCL
Community Oncology Programme (NCCP)
Operational Plan Action End Q Owner Implement GP guidelines for non-melanoma skin cancer. Extend the primary care community nursing oncology programme in collaboration with
the NCCP prioritising the North East, Midlands and South.
Q3 COCCP
Foster a culture that is honest, compassionate, transparent and accountable
Primary Care Quality and Safety Patient engagement and empowerment ► Engage with patients on their experience of primary care through listening sessions conducted in partnership with
the Quality Improvement Division. ► Measure primary care service users experience within CHOs through the use of the primary care service user
survey. Operational Plan Action End Q Owner Engage with staff in CHOs through listening sessions and establish their views on the
provision of primary care services. Q1-Q4 Q&S

33
Governing for quality and safety ► Work with the Quality Improvement Division to foster accountability for quality within primary care through quality
initiatives, i.e. provide support, training and advice to the primary care quality and safety committees. Operational Plan Action End Q Owner Establish the Primary Care Quality and Safety Committee. Implement the National Framework for Improving Quality in the primary care setting.
Q1 Q1-Q4
Q&S Q&S
Support a quality improvement and enablement project involving training, awareness and advice.
Q2 Q&S
Open disclosure programme ► Work with the Quality Improvement Division to roll out the Open Disclosure Programme to all primary care
services. (Cross reference Goal 5 operational plan actions). Strengthening the Primary Care Accountability Framework ► Monitor performance of health services against agreed indicators for quality and safety and the Primary Care
Quality Dashboard. (Cross reference Goal 5 operational plan actions). Promoting safe services ► Ensure systems and structures are in place within primary care for reporting and monitoring serious reportable
events (SREs) and other serious safety incidents. ► Ensure incidents in primary care are effectively identified, managed, reported, investigated with learning shared
in line with national policy. Operational Plan Action End Q Owner Ensure learning is shared on incidents through workshops during the year. Implement effective complaints management systems in the Ombudsman’s Report
Learning to get Better.
Q2-Q4 Q&S CHOs
National Standards for Safer Better Health Care ► Support CHOs in implementing the National Standards for Safer Better Health Care.
Operational Plan Action End Q Owner Support CHOs in implementing the National Standards for Safer Better Health Care
with a specific focus on addiction and homeless standards. Q2-Q4 Q&S
► Establish a quality support group to promote patient safety and quality improvement programmes in primary care.
Operational Plan Action End Q Owner Establish a Primary Care Quality and Safety Networking and Support Group to
promote patient safety and quality improvement programmes in primary care. Q1 Q&S
Support the work of the National Clinical Effectiveness Committee ► Implement the NCEC Guidelines and Standards for Clinical Practice. (Cross reference Goal 5 operational plan
actions).
Understanding patient safety incidents ► Support the roll out of the National Incident Management System (NIMS) in primary care in conjunction with
Quality Assurance and Verification and the State Claims Agency. ► Develop and produce high level incident information data from NIMS.
34
Operational Plan Actions End Q Owner Work with the State Claims Agency (SCA) to produce high level incident information
data from NIMS. Q4 Q&S
Engage with National Incident Management Learning Team to share learning from analysis of investigation reports.
Q4 Q&S
Audit and reviews ► Undertake audits of quality and safety in primary care, with the support of the National Quality Assurance and
Verification Division, to provide assurance that standards are in line with the National Standards for Safer Better Health Care. (Cross reference Goal 5 operational plan actions).
Measurement and analysis of information for quality improvement: Build capacity in the use of measurement and data for quality improvement ► Work with CHOs to further develop the primary care quality dashboard to provide one mechanism for measuring
quality and safety. ► Work with the Quality Improvement Division to develop a quality profile in the primary care setting. ► Promote the development of additional quality and safety indicators.
(Cross reference Goal 5 operational plan actions). Risk management ► Manage risk within primary care through the ongoing development of risk management processes. ► Work with other divisions to enhance the capacity and capability of staff in relation to the management of risk
through education and training. (Cross reference Goal 5 operational plan actions).
Children First ► Provide a standard system of reporting child protection and welfare concerns to the Child and Family Agency.
Reports will be tracked and monitored by the Children First Office following submission of weekly / monthly reports by assigned Designated Liaison Persons (DLPs).Names and contact details for DLPs will be available to each staff member in CHOs and hospital groups. Operational Plan Action End Q Owner Implement standard systems of reporting child protection and welfare concerns to the
Child and Family Agency. Q3 CFL
Circulate names and contact details for DLPs to all staff. Q1 CFL Primary Care Reimbursement Service Implement the recommendations of the reform programme in PCRS ► Continue the regular engagement with primary care contractor representative organisations.
Operational Plan Actions End Q Owner Review and update Contractor Handbooks. Q2 AND PCRS Enhance contractor and practice support processing. Q2 Develop and test electronic claims processing. Q2 Develop and test optical scanning of documents. Q2 Enhance and develop the online Dental Treatment Service Scheme checker. Q2
35
► Review the content of itemised claims listings with primary care contractor representative organisations. Operational Plan Actions End Q Owner Review and update core lists based on the outcome of Medicine Management
Programme review with Clinical Programmes. Review and update wound management products approved for reimbursement to align
with best practice for community use.
Q2 Q3
AND PCRS
► Consider, in conjunction with the DoH where appropriate, further recommendations of the Clinical Advisory
Group including conclusions in relation to the assessment of the burden of disease. Operational Plan Action End Q Owner Implement the recommendations of the CAG reports (subject to those
recommendations being approved). Q4 AND
PCRS Develop the Community Schemes Control and Inspectorate Function in line with recommendations from the reform programme ► Develop enhanced inspection procedures. ► Increase the use of advanced data analysis to support inspection functions.
Operational Plan Actions End Q Owner Primary Care Reimbursement Service Implement revised organisation structures for the PCRS Probity function as recommended in the Deloitte Prospectus Report on Governance Structures at PCRS (subject to final approval of the recommendations in the report)
Develop the Probity Function including skills in analytics; inspection and case management across the four contractor groups: - Development of data analytics to support probity assurance. - Development of an inspectorate team for each contractor group to support probity
assurance. Review and update the processes to support verification of claims with clients,
compliance assurance arrangements and Community Schemes Control.
Q1-Q4 Q3
AND PCRS
Social Inclusion Roll out of Brief Intervention Training for Drugs and Alcohol Services. ► Develop and distribute standardised problem alcohol and substance use screening and brief intervention SAOR
(Support, Ask and Assess, Offer Assistance and Refer) toolkits to support Tier 1 and Tier 2 services. ► Publish a Guiding Framework for Education and Training in Screening and Brief Intervention for Problem Alcohol
Use for nurses and midwives in acute, primary and community settings. Operational Plan Action End Q Owner Develop a revised Guiding Framework for Education and Training in Screening and
Brief Intervention for Problem Alcohol Use including review of existing best practice and stakeholder engagement.
Q2 ADL
Develop and implement Screening and Brief Intervention (SBI) plans in 5 CHO areas. Q4 ADL Strengthen community development approaches in line with Healthy Ireland and other relevant initiatives ► Establish a social inclusion working group on community development, to incorporate principles in respect of
addressing health inequalities, community development, community participation, social prescribing etc. with a focus on vulnerable communities. This working group will have representation from each CHO.

36
Operational Plan Actions End Q Owner Support each CHO in their engagement with the LCDCs and in the development of the
LCDC Local Economic and Community Plans in each CHO area. Q1-Q4 SIL
Expand the Social Prescribing Initiative (currently in operation in Donegal) to another CHO in 2016 (area to be agreed). This will be aligned to the Framework for Implementation of Community Participation in Primary Healthcare.
Q3 SIL
Enhance Community approaches to addressing HIV/AIDS ► Collaborate with HIV Ireland and other stakeholders to further develop and enhance community approaches to
addressing HIV / AIDS. Operational Plan Actions End Q Owner Develop a best practice manual to support the further development of community
testing nationally. Q3 SIL
Develop and Pilot a HIV, Hepatitis and STI community testing service in Area 8 (North East) within community Addiction and Homeless Services.
Q2 SIL
Work with the Sexual Health and Crisis Pregnancy Programme to support 3 NGOs in the piloting of a 12 month community based rapid HIV testing initiative in non-clinical settings in Dublin, Cork and Limerick.
Q2-Q4 SIL
Hepatitis C Strategy ► Implement the recommendations of the Hepatitis C Strategy through the development of national guidelines for
Hepatitis C screening and provision of updated website information. Operational Plan Actions End Q Owner Health Promotion: Provide clear, consistent advice on Hepatitis C through the
development of an education and awareness campaign and development of updated website information.
Q3 SIL
Surveillance and Screening: Develop national guidelines for hepatitis C screening and improve information on prevalence of hepatitis C.
Q3 SIL
Palliative Care Encourage the ongoing development of person-centred services ► Develop an integrated whole system approach to person-centred care provision.
Operational Plan Actions End Q Owner Undertake a stakeholder engagement exercise to support the agreement of model of
care. Q2 PCL
Finalise and implement a comprehensive model of care for adult palliative care services.
Q4
PCL
► Undertake a health system performance and evaluation study from a person-centred perspective.
Operational Plan Action End Q Owner Support services to implement Theme 1 Person Centred Care and Support within the
National Standards for Safer Better Healthcare. This will be done with the support of the Primary Care Quality and Safety Office.
Q4 PCL
► Incorporate the experiences of service users and staff to evaluate and plan services.
Operational Plan Action End Q Owner Adults: Work with the All Island Institute of Hospice and Palliative Care to incorporate
the learning from the Let’s Talk About survey into service plans and service delivery. Q1-Q4 PCL
37
Ensure patient representation on palliative care working groups. Children: Finalise the external evaluation of the children’s palliative care programme.
Review the recommendations and develop an implementation plan. Q2 PCL
► Support services to implement the Patient Charter for Specialist Palliative Care.
Operational Plan Action End Q Owner Develop and communicate the charter in partnership with relevant stakeholders. Q3 PCL
► Commence collection of key performance indicators with a quality focus. Operational Plan Action End Q Owner Engage with inpatient units and homecare community stakeholders to pilot the metrics Q1 PCL Pilot metrics, refine and commence collection. Q2 PCL
► Commence the collection of patient / family satisfaction feedback. Operational Plan Action End Q Owner Work in partnership with service providers and service users to agree a survey
methodology and commence collection of feedback. Q3 PCL
Engage, develop and value our workforce to deliver the best possible care and services to the people who depend on them
Primary Care Restructure the provision of GP training ► Agree a service level agreement on the training programme for GPs.
Operational Plan Action End Q Owner Restructure the management and governance of GP Training. Increase the number of GP Trainees by 15.
Q1 Q4
GPTPL
Quality and Safety ► Improve capacity in quality and safety within primary care by providing support to staff to develop clinical audit
tools. Operational Plan Action End Q Owner Improve capacity in quality and safety within primary care by providing support and
training to staff on systems analysis investigation, incident management, risk assessment, open disclosure and clinical audit.
Q1-Q4 Q&S
Develop the capacity of staff to lead and deliver quality improvement by education and training in partnership with the professional colleges. This will be progressed in collaboration with the National Quality Improvement Division.
Q4 Q&S
Implement Children First ► Promote the implementation of Children First in each CHO / hospital group.
- Ensure each CHO / hospital group has a Children First implementation plan. - Ensure each CHO / hospital has a local Child Protection and Welfare Policy.
► Ensure that each staff member is aware of their social, corporate and legal responsibilities under Children First. - Facilitate staff (including staff of funded agencies) to undertake the Children First e-Learning programme.

38
- Deliver Children First Training Programmes to meet the needs of services including out of hours and at weekends if required.
Operational Plan Actions End Q Owner Establish a Children First National Office with a dedicated team of Training and
Information Officers. Q1 CFL
Appoint DPLs in each CHO. Q1 Commence e-reporting for submissions of all child protection reports. This will support
the management of statutory requirements and will facilitate the provision of timely management information regarding all aspects of reporting including KPIs.
Q3
Develop the Children First Webpage as a resource for all primary care staff. Q2 Ensure that all new primary care staff receive information on the HSE Child Protection
and Welfare policy as part of their induction process. Q1-Q4
Public Health Nursing Operational Plan Action End Q Owner Implement a Service Improvement Framework for Public Health Nursing/collaborative
project between Office of the Nursing and Midwifery Services Director and Primary Care Division.
Q4 NL
Primary Care Reimbursement Service Engage with and inform all team members about developments ► Develop staff skills to deliver the HR improvement initiatives from the positive workplace engagements.
Operational Plan Actions End Q Owner Roll out of the Staff Development Programme to all staff. Q2 AND Conduct regular staffing briefing sessions for all staff. Q1-Q4 PCRS
Implement organisation structures in line with the recommendations of the reform programme ► Align organisation structures and enhance team capacity as recommended.
Operational Plan Action End Q Owner Implement the Deloitte Prospectus Report on Governance Structures (subject to final
approval of the recommendations in the report). Q4 AND
PCRS Social Inclusion ► Provide LGBT health training for health service staff across three CHOs.
Operational Plan Action End Q Owner Roll out TENI (Transgender Equality Network) training to 3 CHOs. Q2 SIL
► Provide intercultural health training to enable staff to deliver services in a culturally competent manner. This
training will be targeted at staff delivering services to asylum seekers in Direct Provision and to refugees arriving under Resettlement and Relocation programmes. Operational Plan Action End Q Owner Review intercultural health training. Link with services on the provision of training for staff dealing with asylum seekers and
refugees.
Q2-Q4 Q3-Q4
SIL
► Roll out of SAOR screening and brief intervention training to 300 staff for problem alcohol and substance use
within Tier 1 and Tier 2 services.
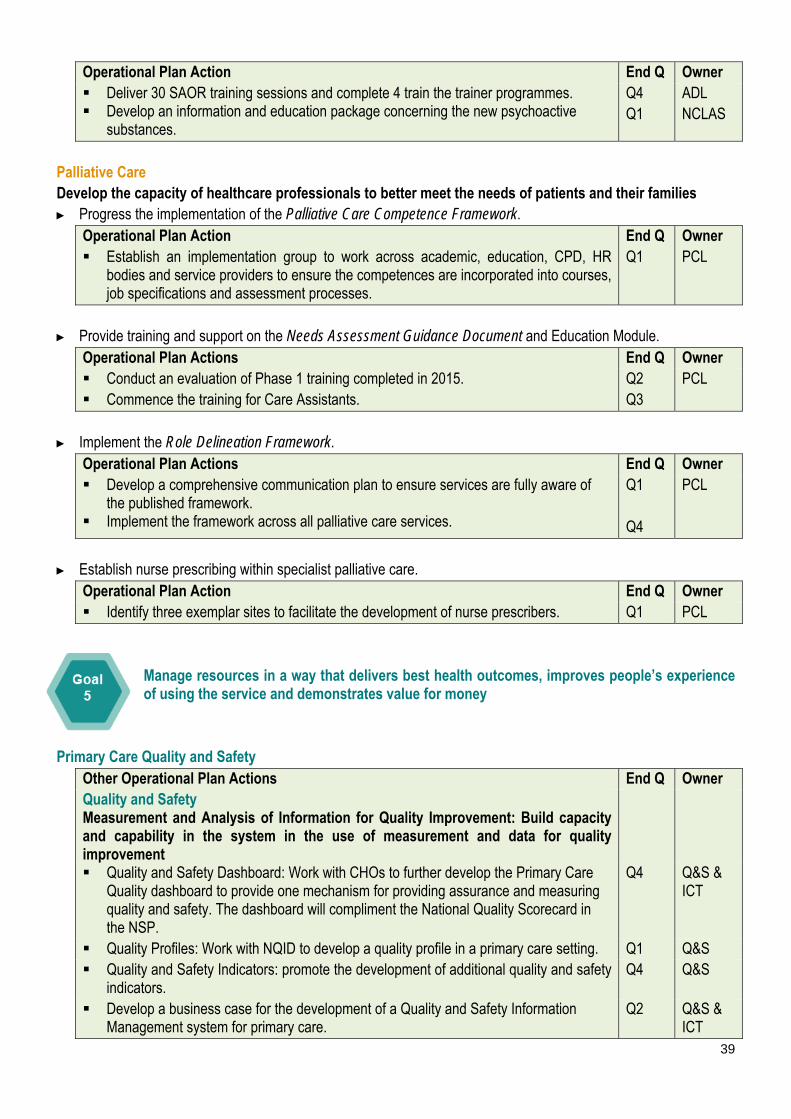
39
Operational Plan Action End Q Owner Deliver 30 SAOR training sessions and complete 4 train the trainer programmes. Develop an information and education package concerning the new psychoactive
substances.
Q4 Q1
ADL NCLAS
Palliative Care Develop the capacity of healthcare professionals to better meet the needs of patients and their families ► Progress the implementation of the Palliative Care Competence Framework.
Operational Plan Action End Q Owner Establish an implementation group to work across academic, education, CPD, HR
bodies and service providers to ensure the competences are incorporated into courses, job specifications and assessment processes.
Q1 PCL
► Provide training and support on the Needs Assessment Guidance Document and Education Module.
Operational Plan Actions End Q Owner Conduct an evaluation of Phase 1 training completed in 2015. Commence the training for Care Assistants.
Q2 Q3
PCL
► Implement the Role Delineation Framework.
Operational Plan Actions End Q Owner Develop a comprehensive communication plan to ensure services are fully aware of
the published framework. Implement the framework across all palliative care services.
Q1 Q4
PCL
► Establish nurse prescribing within specialist palliative care.
Operational Plan Action End Q Owner Identify three exemplar sites to facilitate the development of nurse prescribers. Q1 PCL
Manage resources in a way that delivers best health outcomes, improves people’s experience of using the service and demonstrates value for money
Primary Care Quality and Safety Other Operational Plan Actions End Q Owner Quality and Safety Measurement and Analysis of Information for Quality Improvement: Build capacity and capability in the system in the use of measurement and data for quality improvement
Quality and Safety Dashboard: Work with CHOs to further develop the Primary Care Quality dashboard to provide one mechanism for providing assurance and measuring quality and safety. The dashboard will compliment the National Quality Scorecard in the NSP.
Q4 Q&S & ICT
Quality Profiles: Work with NQID to develop a quality profile in a primary care setting. Q1 Q&S Quality and Safety Indicators: promote the development of additional quality and safety
indicators. Q4 Q&S
Develop a business case for the development of a Quality and Safety Information Management system for primary care.
Q2 Q&S & ICT
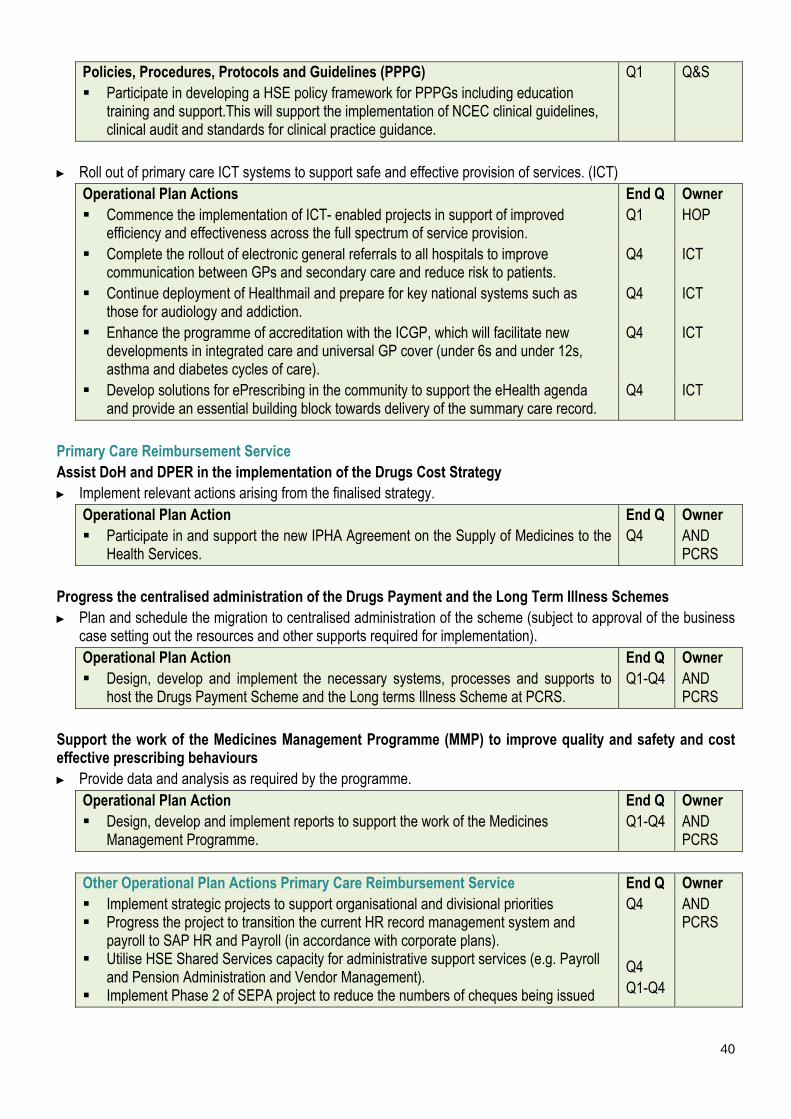
40
Policies, Procedures, Protocols and Guidelines (PPPG) Participate in developing a HSE policy framework for PPPGs including education
training and support.This will support the implementation of NCEC clinical guidelines, clinical audit and standards for clinical practice guidance.
Q1 Q&S
► Roll out of primary care ICT systems to support safe and effective provision of services. (ICT)
Operational Plan Actions End Q Owner Commence the implementation of ICT- enabled projects in support of improved
efficiency and effectiveness across the full spectrum of service provision. Q1 HOP
Complete the rollout of electronic general referrals to all hospitals to improve communication between GPs and secondary care and reduce risk to patients.
Q4 ICT
Continue deployment of Healthmail and prepare for key national systems such as those for audiology and addiction.
Q4 ICT
Enhance the programme of accreditation with the ICGP, which will facilitate new developments in integrated care and universal GP cover (under 6s and under 12s, asthma and diabetes cycles of care).
Q4 ICT
Develop solutions for ePrescribing in the community to support the eHealth agenda and provide an essential building block towards delivery of the summary care record.
Q4 ICT
Primary Care Reimbursement Service Assist DoH and DPER in the implementation of the Drugs Cost Strategy ► Implement relevant actions arising from the finalised strategy.
Operational Plan Action End Q Owner Participate in and support the new IPHA Agreement on the Supply of Medicines to the
Health Services. Q4 AND
PCRS Progress the centralised administration of the Drugs Payment and the Long Term Illness Schemes ► Plan and schedule the migration to centralised administration of the scheme (subject to approval of the business
case setting out the resources and other supports required for implementation). Operational Plan Action End Q Owner Design, develop and implement the necessary systems, processes and supports to
host the Drugs Payment Scheme and the Long terms Illness Scheme at PCRS. Q1-Q4 AND
PCRS Support the work of the Medicines Management Programme (MMP) to improve quality and safety and cost effective prescribing behaviours ► Provide data and analysis as required by the programme.
Operational Plan Action End Q Owner Design, develop and implement reports to support the work of the Medicines
Management Programme. Q1-Q4 AND
PCRS
Other Operational Plan Actions Primary Care Reimbursement Service End Q Owner Implement strategic projects to support organisational and divisional priorities Progress the project to transition the current HR record management system and
payroll to SAP HR and Payroll (in accordance with corporate plans). Utilise HSE Shared Services capacity for administrative support services (e.g. Payroll
and Pension Administration and Vendor Management). Implement Phase 2 of SEPA project to reduce the numbers of cheques being issued
Q4 Q4 Q1-Q4
AND PCRS

41
Balance Scorecard - Quality and Access Indicators of Performance Quality and Access Indicators of Performance
Quality Expected
Activity / Target 2016
Primary Care Service User Experience Complaints
System-wide
% of PCTs by CHO that can evidence service user involvement. 100%
Safe Care Serious Reportable Events System-wide
Safety Incident Reporting
Healthcare Associated Infections: Medication Management Consumption of antibiotics in community settings (defined daily doses per 1,000 population)
< 21.7
Effective Care Community Intervention Teams (number of referrals) Admission Avoidance (includes OPAT)
24,202 914
Hospital Avoidance 12,932
Early discharge (includes OPAT) 6,360
Unscheduled referrals from community sources 3,996
Health Amendment Act: Services to persons with state acquired Hepatitis C Number of patients who were reviewed
798
Primary Care Reimbursement Service Effective Care Medical Cards % of Medical Card / GP Visit Card applications, assigned for Medical Officer review,
processed within 5 days
90%
% of Medical Card / GP Visit Card applications which are accurately processed by national medical card unit staff
95%
Social Inclusion Effective Care Traveller Health No. of people who received health information on type 2 diabetes and cardiovascular health
3,470
Homeless Services % of service users admitted to homeless emergency accommodation hostels / facilities
whose health needs have been assessed as part of a Holistic Needs Assessment (HNA) within two weeks of admission
85%
Palliative Care Effective Care % of patients triaged within 1 working day of referral
90%
% of patients with a multi-disciplinary care plan documented within 5 working days of initial 90%

42
Quality Expected
Activity / Target 2016
review
Access Expected Activity / Target 2016
Primary Care GP Activity No. of contacts with GP Out of Hours service
964,770 Nursing No. of new patients accepted on the caseload and waiting to be seen over 12 weeks
0
Speech and Language Therapy % on waiting list for assessment ≤ 52 weeks
100%
% on waiting list for treatment ≤ 52 weeks 100% Physiotherapy and Occupational Therapy % of new patients seen for assessment within 12 weeks
70%
% on waiting list for assessment ≤ 52 weeks 100% Podiatry, Ophthalmology, Audiology, Dietetics and Psychology Podiatry % on waiting list for treatment ≤ 52 weeks
100% % on waiting list for treatment ≤ 12 weeks 75% Ophthalmology % on waiting list for treatment ≤ 52 weeks
100%
% on waiting list for treatment ≤ 12 weeks 60% Audiology % on waiting list for treatment ≤ 52 weeks
100%
% on waiting list for treatment ≤ 12 weeks 60% Dietetics % on waiting list for treatment ≤ 52 weeks
100%
% on waiting list for treatment ≤ 12 weeks 70% Psychology % on waiting list for treatment ≤ 52 weeks
100%
% on waiting list for treatment ≤ 12 weeks 60% Oral Health % of new patients who commenced treatment within 3 months of assessment
80%
Orthodontics % of referrals seen for assessment within 6 months
75%
Reduce the proportion of patients on the treatment waiting list longer than 4 years (grade IV and V)
< 5%
Primary Care Reimbursement Service Medical Cards % of completed Medical Card / GP Visit Card applications processed within 15 days
95% No. of persons covered by Medical Cards as at 31st December 1,675,767
No. of persons covered by GP Visit Cards as at 31st December 485,192*
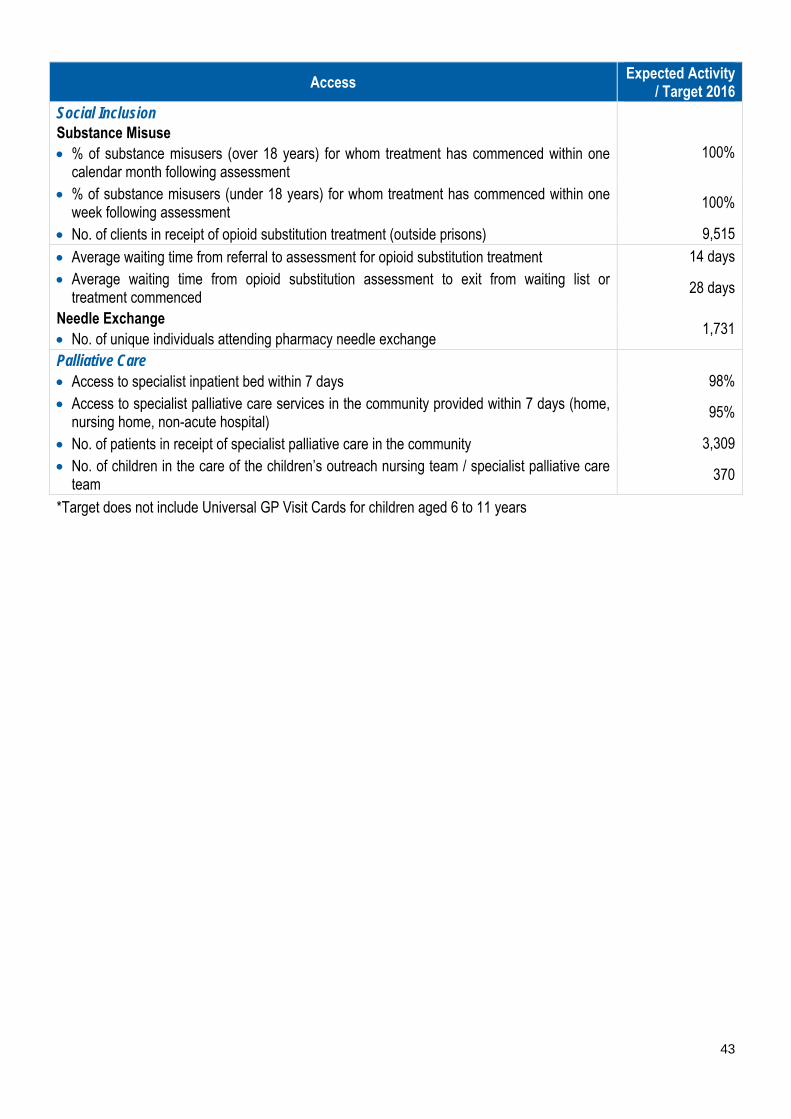
43
Access Expected Activity / Target 2016
Social Inclusion Substance Misuse % of substance misusers (over 18 years) for whom treatment has commenced within one
calendar month following assessment
100%
% of substance misusers (under 18 years) for whom treatment has commenced within one week following assessment
100%
No. of clients in receipt of opioid substitution treatment (outside prisons) 9,515
Average waiting time from referral to assessment for opioid substitution treatment 14 days Average waiting time from opioid substitution assessment to exit from waiting list or
treatment commenced 28 days
Needle Exchange No. of unique individuals attending pharmacy needle exchange
1,731
Palliative Care Access to specialist inpatient bed within 7 days
98%
Access to specialist palliative care services in the community provided within 7 days (home, nursing home, non-acute hospital)
95%
No. of patients in receipt of specialist palliative care in the community 3,309 No. of children in the care of the children’s outreach nursing team / specialist palliative care
team 370
*Target does not include Universal GP Visit Cards for children aged 6 to 11 years
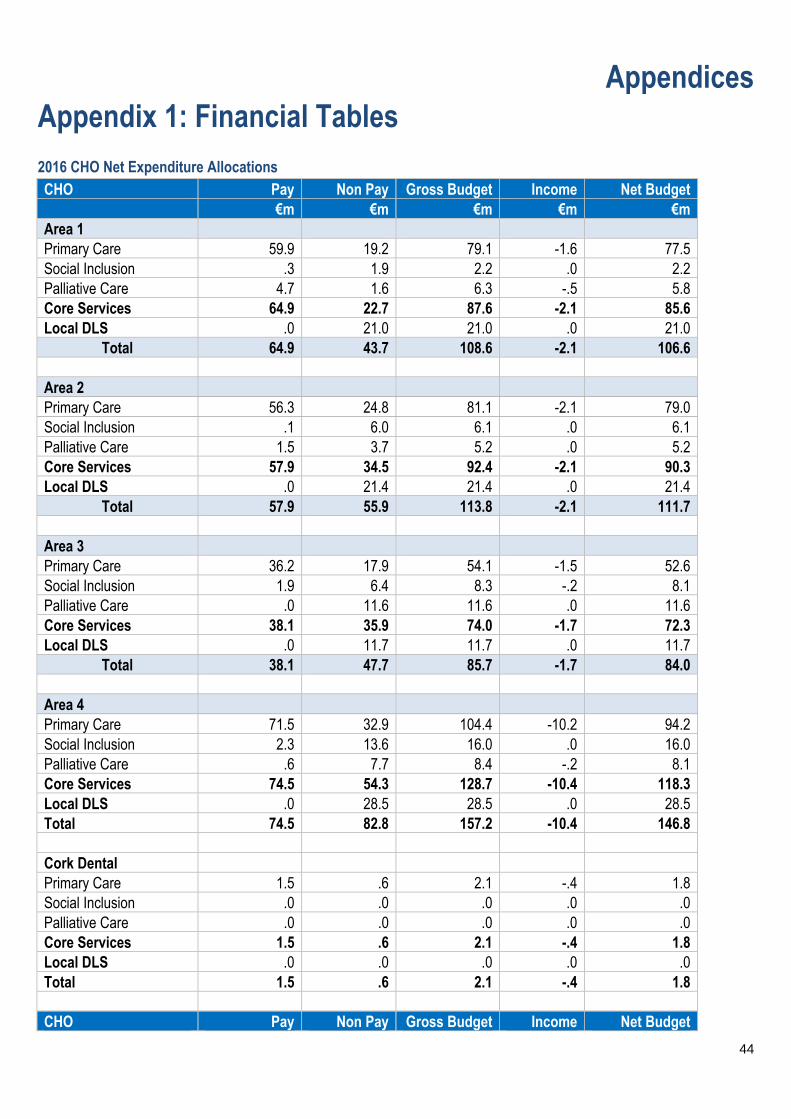
44
Appendices Appendix 1: Financial Tables 2016 CHO Net Expenditure Allocations CHO Pay Non Pay Gross Budget Income Net Budget €m €m €m €m €m Area 1 Primary Care 59.9 19.2 79.1 -1.6 77.5 Social Inclusion .3 1.9 2.2 .0 2.2 Palliative Care 4.7 1.6 6.3 -.5 5.8 Core Services 64.9 22.7 87.6 -2.1 85.6 Local DLS .0 21.0 21.0 .0 21.0
Total 64.9 43.7 108.6 -2.1 106.6 Area 2 Primary Care 56.3 24.8 81.1 -2.1 79.0 Social Inclusion .1 6.0 6.1 .0 6.1 Palliative Care 1.5 3.7 5.2 .0 5.2 Core Services 57.9 34.5 92.4 -2.1 90.3 Local DLS .0 21.4 21.4 .0 21.4
Total 57.9 55.9 113.8 -2.1 111.7 Area 3 Primary Care 36.2 17.9 54.1 -1.5 52.6 Social Inclusion 1.9 6.4 8.3 -.2 8.1 Palliative Care .0 11.6 11.6 .0 11.6 Core Services 38.1 35.9 74.0 -1.7 72.3 Local DLS .0 11.7 11.7 .0 11.7
Total 38.1 47.7 85.7 -1.7 84.0 Area 4 Primary Care 71.5 32.9 104.4 -10.2 94.2 Social Inclusion 2.3 13.6 16.0 .0 16.0 Palliative Care .6 7.7 8.4 -.2 8.1 Core Services 74.5 54.3 128.7 -10.4 118.3 Local DLS .0 28.5 28.5 .0 28.5 Total 74.5 82.8 157.2 -10.4 146.8 Cork Dental Primary Care 1.5 .6 2.1 -.4 1.8 Social Inclusion .0 .0 .0 .0 .0 Palliative Care .0 .0 .0 .0 .0 Core Services 1.5 .6 2.1 -.4 1.8 Local DLS .0 .0 .0 .0 .0 Total 1.5 .6 2.1 -.4 1.8
CHO Pay Non Pay Gross Budget Income Net Budget
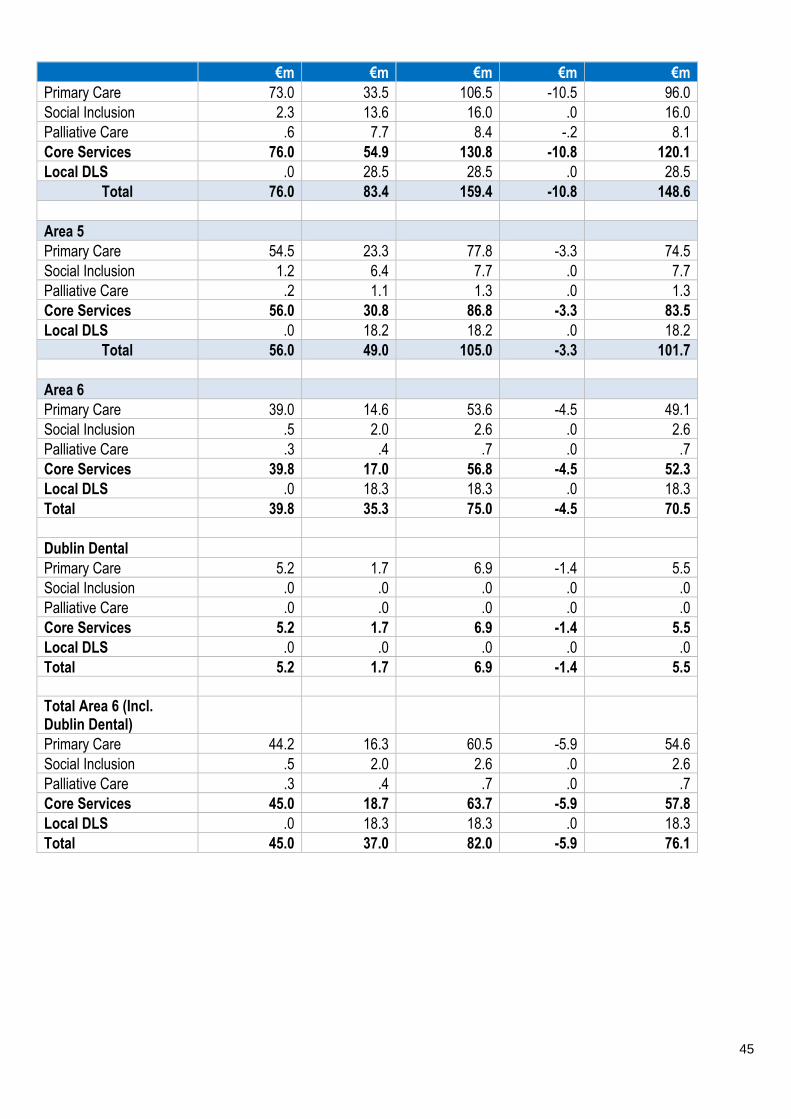
45
€m €m €m €m €m Primary Care 73.0 33.5 106.5 -10.5 96.0 Social Inclusion 2.3 13.6 16.0 .0 16.0 Palliative Care .6 7.7 8.4 -.2 8.1 Core Services 76.0 54.9 130.8 -10.8 120.1 Local DLS .0 28.5 28.5 .0 28.5
Total 76.0 83.4 159.4 -10.8 148.6 Area 5 Primary Care 54.5 23.3 77.8 -3.3 74.5 Social Inclusion 1.2 6.4 7.7 .0 7.7 Palliative Care .2 1.1 1.3 .0 1.3 Core Services 56.0 30.8 86.8 -3.3 83.5 Local DLS .0 18.2 18.2 .0 18.2
Total 56.0 49.0 105.0 -3.3 101.7 Area 6 Primary Care 39.0 14.6 53.6 -4.5 49.1 Social Inclusion .5 2.0 2.6 .0 2.6 Palliative Care .3 .4 .7 .0 .7 Core Services 39.8 17.0 56.8 -4.5 52.3 Local DLS .0 18.3 18.3 .0 18.3 Total 39.8 35.3 75.0 -4.5 70.5 Dublin Dental Primary Care 5.2 1.7 6.9 -1.4 5.5 Social Inclusion .0 .0 .0 .0 .0 Palliative Care .0 .0 .0 .0 .0 Core Services 5.2 1.7 6.9 -1.4 5.5 Local DLS .0 .0 .0 .0 .0 Total 5.2 1.7 6.9 -1.4 5.5 Total Area 6 (Incl. Dublin Dental) Primary Care 44.2 16.3 60.5 -5.9 54.6 Social Inclusion .5 2.0 2.6 .0 2.6 Palliative Care .3 .4 .7 .0 .7 Core Services 45.0 18.7 63.7 -5.9 57.8 Local DLS .0 18.3 18.3 .0 18.3 Total 45.0 37.0 82.0 -5.9 76.1
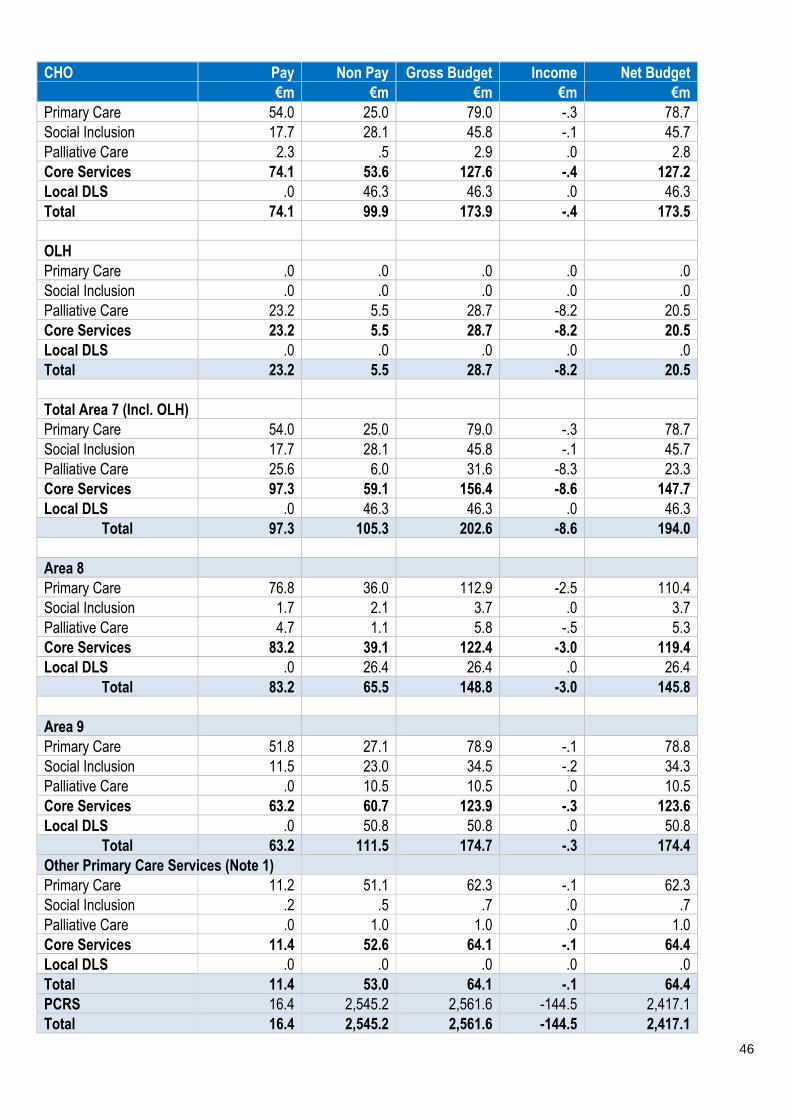
46
CHO Pay Non Pay Gross Budget Income Net Budget €m €m €m €m €m
Primary Care 54.0 25.0 79.0 -.3 78.7 Social Inclusion 17.7 28.1 45.8 -.1 45.7 Palliative Care 2.3 .5 2.9 .0 2.8 Core Services 74.1 53.6 127.6 -.4 127.2 Local DLS .0 46.3 46.3 .0 46.3 Total 74.1 99.9 173.9 -.4 173.5 OLH Primary Care .0 .0 .0 .0 .0 Social Inclusion .0 .0 .0 .0 .0 Palliative Care 23.2 5.5 28.7 -8.2 20.5 Core Services 23.2 5.5 28.7 -8.2 20.5 Local DLS .0 .0 .0 .0 .0 Total 23.2 5.5 28.7 -8.2 20.5 Total Area 7 (Incl. OLH) Primary Care 54.0 25.0 79.0 -.3 78.7 Social Inclusion 17.7 28.1 45.8 -.1 45.7 Palliative Care 25.6 6.0 31.6 -8.3 23.3 Core Services 97.3 59.1 156.4 -8.6 147.7 Local DLS .0 46.3 46.3 .0 46.3
Total 97.3 105.3 202.6 -8.6 194.0 Area 8 Primary Care 76.8 36.0 112.9 -2.5 110.4 Social Inclusion 1.7 2.1 3.7 .0 3.7 Palliative Care 4.7 1.1 5.8 -.5 5.3 Core Services 83.2 39.1 122.4 -3.0 119.4 Local DLS .0 26.4 26.4 .0 26.4
Total 83.2 65.5 148.8 -3.0 145.8 Area 9 Primary Care 51.8 27.1 78.9 -.1 78.8 Social Inclusion 11.5 23.0 34.5 -.2 34.3 Palliative Care .0 10.5 10.5 .0 10.5 Core Services 63.2 60.7 123.9 -.3 123.6 Local DLS .0 50.8 50.8 .0 50.8
Total 63.2 111.5 174.7 -.3 174.4 Other Primary Care Services (Note 1) Primary Care 11.2 51.1 62.3 -.1 62.3 Social Inclusion .2 .5 .7 .0 .7 Palliative Care .0 1.0 1.0 .0 1.0 Core Services 11.4 52.6 64.1 -.1 64.4 Local DLS .0 .0 .0 .0 .0 Total 11.4 53.0 64.1 -.1 64.4 PCRS 16.4 2,545.2 2,561.6 -144.5 2,417.1 Total 16.4 2,545.2 2,561.6 -144.5 2,417.1
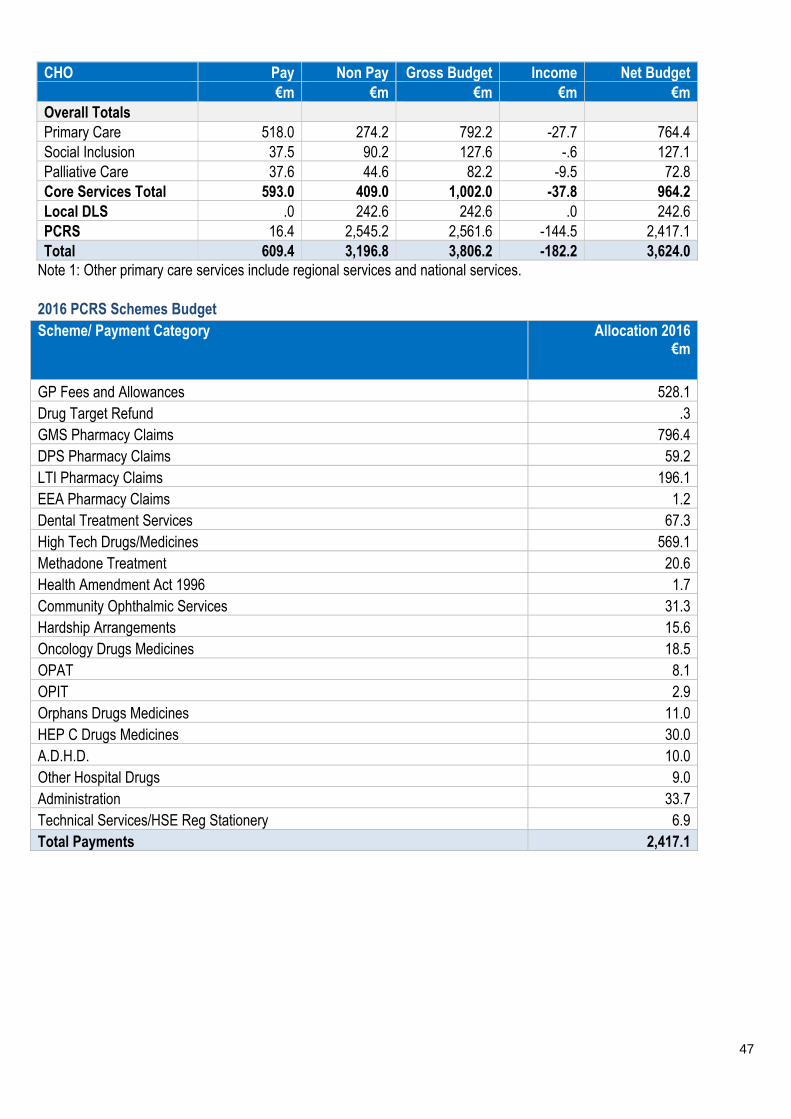
47
CHO Pay Non Pay Gross Budget Income Net Budget €m €m €m €m €m Overall Totals Primary Care 518.0 274.2 792.2 -27.7 764.4 Social Inclusion 37.5 90.2 127.6 -.6 127.1 Palliative Care 37.6 44.6 82.2 -9.5 72.8 Core Services Total 593.0 409.0 1,002.0 -37.8 964.2 Local DLS .0 242.6 242.6 .0 242.6 PCRS 16.4 2,545.2 2,561.6 -144.5 2,417.1 Total 609.4 3,196.8 3,806.2 -182.2 3,624.0
Note 1: Other primary care services include regional services and national services.
2016 PCRS Schemes Budget Scheme/ Payment Category Allocation 2016
€m
GP Fees and Allowances 528.1 Drug Target Refund .3 GMS Pharmacy Claims 796.4 DPS Pharmacy Claims 59.2 LTI Pharmacy Claims 196.1 EEA Pharmacy Claims 1.2 Dental Treatment Services 67.3 High Tech Drugs/Medicines 569.1 Methadone Treatment 20.6 Health Amendment Act 1996 1.7 Community Ophthalmic Services 31.3 Hardship Arrangements 15.6 Oncology Drugs Medicines 18.5 OPAT 8.1 OPIT 2.9 Orphans Drugs Medicines 11.0 HEP C Drugs Medicines 30.0 A.D.H.D. 10.0 Other Hospital Drugs 9.0 Administration 33.7 Technical Services/HSE Reg Stationery 6.9 Total Payments 2,417.1
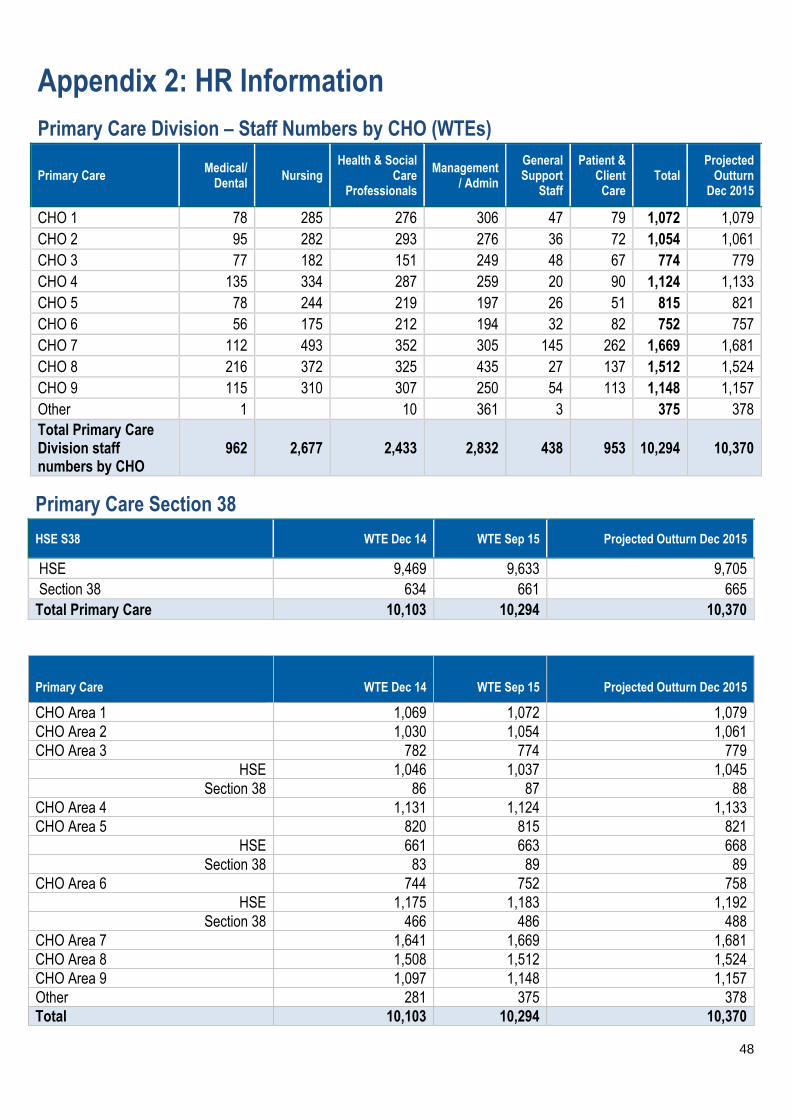
48
Appendix 2: HR Information
Primary Care Division – Staff Numbers by CHO (WTEs)
Primary Care Medical/
Dental Nursing
Health & Social Care
Professionals
Management/ Admin
General Support
Staff
Patient & Client
Care Total
Projected Outturn
Dec 2015
CHO 1 78 285 276 306 47 79 1,072 1,079 CHO 2 95 282 293 276 36 72 1,054 1,061 CHO 3 77 182 151 249 48 67 774 779 CHO 4 135 334 287 259 20 90 1,124 1,133 CHO 5 78 244 219 197 26 51 815 821 CHO 6 56 175 212 194 32 82 752 757 CHO 7 112 493 352 305 145 262 1,669 1,681 CHO 8 216 372 325 435 27 137 1,512 1,524 CHO 9 115 310 307 250 54 113 1,148 1,157 Other 1
10 361 3
375 378
Total Primary Care Division staff numbers by CHO
962 2,677 2,433 2,832 438 953 10,294 10,370
Primary Care Section 38
HSE S38 WTE Dec 14 WTE Sep 15 Projected Outturn Dec 2015
HSE 9,469 9,633 9,705 Section 38 634 661 665
Total Primary Care 10,103 10,294 10,370
Primary Care WTE Dec 14 WTE Sep 15 Projected Outturn Dec 2015
CHO Area 1 1,069 1,072 1,079 CHO Area 2 1,030 1,054 1,061 CHO Area 3 782 774 779
HSE 1,046 1,037 1,045 Section 38 86 87 88
CHO Area 4 1,131 1,124 1,133 CHO Area 5 820 815 821
HSE 661 663 668 Section 38 83 89 89
CHO Area 6 744 752 758 HSE 1,175 1,183 1,192
Section 38 466 486 488 CHO Area 7 1,641 1,669 1,681 CHO Area 8 1,508 1,512 1,524 CHO Area 9 1,097 1,148 1,157 Other 281 375 378 Total 10,103 10,294 10,370

49
Appendix 3 – Performance Indicator Suite
Primary Care Primary Care
Indicator Reporting Frequency
NSP 2015 Expected Activity /
Target
Projected Outturn
2015
Expected Activity /
Target 2016
Community Intervention Teams (no. of referrals) Admission avoidance (includes OPAT)
M 26,355 1,196
18,600 651
24,202 914
Hospital Avoidance M 14,134 10,788 12,932
Early discharge (includes OPAT) M 6,375 3,980 6,360
Unscheduled referrals from community sources M 4,650 3,181 3,996
Health Amendment Act: Services to persons with state acquired Hepatitis C No. of patients who were reviewed
Q
820
22
798
Healthcare Associated Infections: Medication Management Consumption of antibiotics in community settings (defined daily doses per 1,000 population)
< 21.7
25.7
< 21.7
Service User Experience % of PCTs by CHO, that can evidence service user involvement as required by Action 19 of the Primary Care Strategy – A New Direction (2001)
Q
New PI
2016
New PI
2016
100%
GP Activity No. of contacts with GP Out of Hours Service
M
959,455
964,770
964,770
Nursing No. of new patients accepted on the caseload and waiting to be seen over 12 weeks
M
New PI
2016
New PI
2016
0
Physiotherapy % of new patients seen for assessment within 12 weeks
M
80%
83%
70%
% on waiting list for assessment ≤ 52 weeks M New PI 2016
New PI 2016
100%
Occupational Therapy % of new patients seen for assessment within 12 weeks
M
80%
76%
70%
% on waiting list for assessment ≤ 52 weeks M New PI 2016
New PI 2016
100%
Speech and Language Therapy % on waiting lists for assessment ≤ 52 weeks
M
New PI 2016
New PI 2016
100%
% on waiting list for treatment ≤ 52 weeks M New PI 2016
New PI 2016
100%
Podiatry, Ophthalmology, Audiology, Dietetics and Psychology Podiatry % on waiting list for treatment ≤ 52 weeks
M
New PI 2016
New PI 2016
100%
% on waiting list for treatment ≤ 12 weeks M New PI New PI 75%
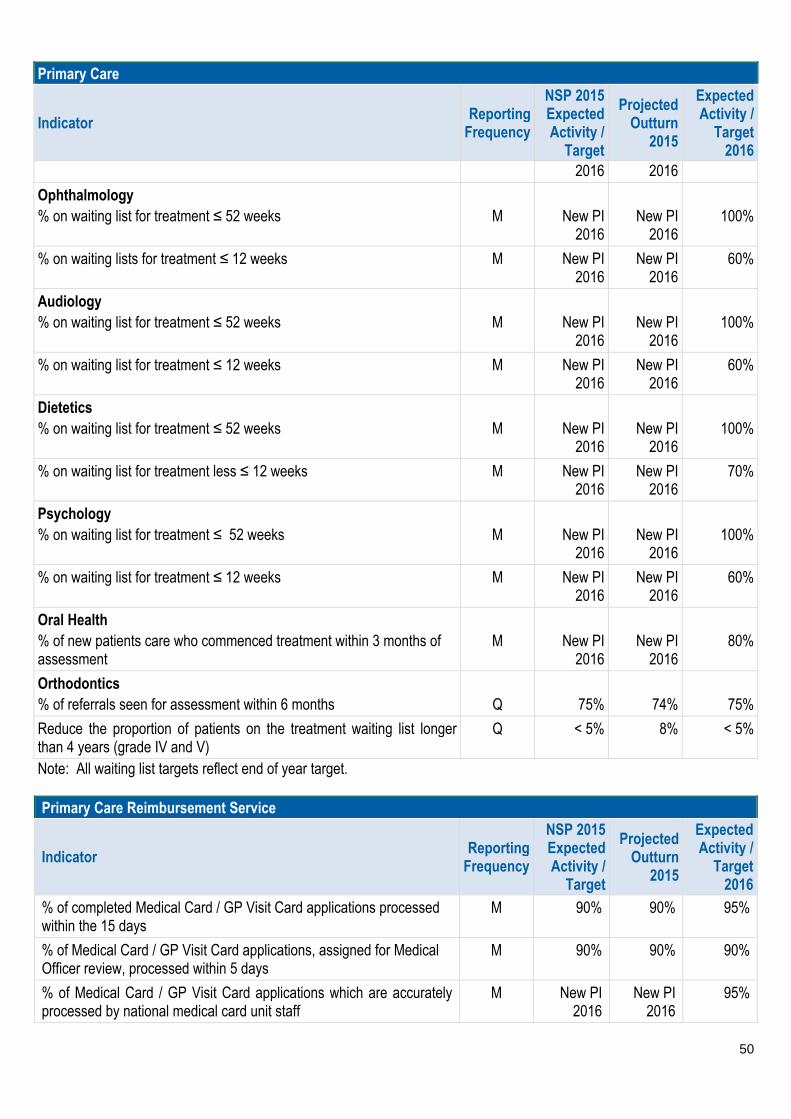
50
Primary Care
Indicator Reporting Frequency
NSP 2015 Expected Activity /
Target
Projected Outturn
2015
Expected Activity /
Target 2016
2016 2016
Ophthalmology % on waiting list for treatment ≤ 52 weeks
M
New PI
2016
New PI
2016
100%
% on waiting lists for treatment ≤ 12 weeks M New PI 2016
New PI 2016
60%
Audiology % on waiting list for treatment ≤ 52 weeks
M
New PI
2016
New PI
2016
100%
% on waiting list for treatment ≤ 12 weeks M New PI 2016
New PI 2016
60%
Dietetics % on waiting list for treatment ≤ 52 weeks
M
New PI
2016
New PI
2016
100%
% on waiting list for treatment less ≤ 12 weeks M New PI 2016
New PI 2016
70%
Psychology % on waiting list for treatment ≤ 52 weeks
M
New PI
2016
New PI
2016
100%
% on waiting list for treatment ≤ 12 weeks M New PI 2016
New PI 2016
60%
Oral Health % of new patients care who commenced treatment within 3 months of assessment
M
New PI
2016
New PI
2016
80%
Orthodontics % of referrals seen for assessment within 6 months
Q
75%
74%
75%
Reduce the proportion of patients on the treatment waiting list longer than 4 years (grade IV and V)
Q < 5% 8% < 5%
Note: All waiting list targets reflect end of year target. Primary Care Reimbursement Service
Indicator Reporting Frequency
NSP 2015 Expected Activity /
Target
Projected Outturn
2015
Expected Activity /
Target 2016
% of completed Medical Card / GP Visit Card applications processed within the 15 days
M 90% 90% 95%
% of Medical Card / GP Visit Card applications, assigned for Medical Officer review, processed within 5 days
M 90% 90% 90%
% of Medical Card / GP Visit Card applications which are accurately processed by national medical card unit staff
M New PI 2016
New PI 2016
95%
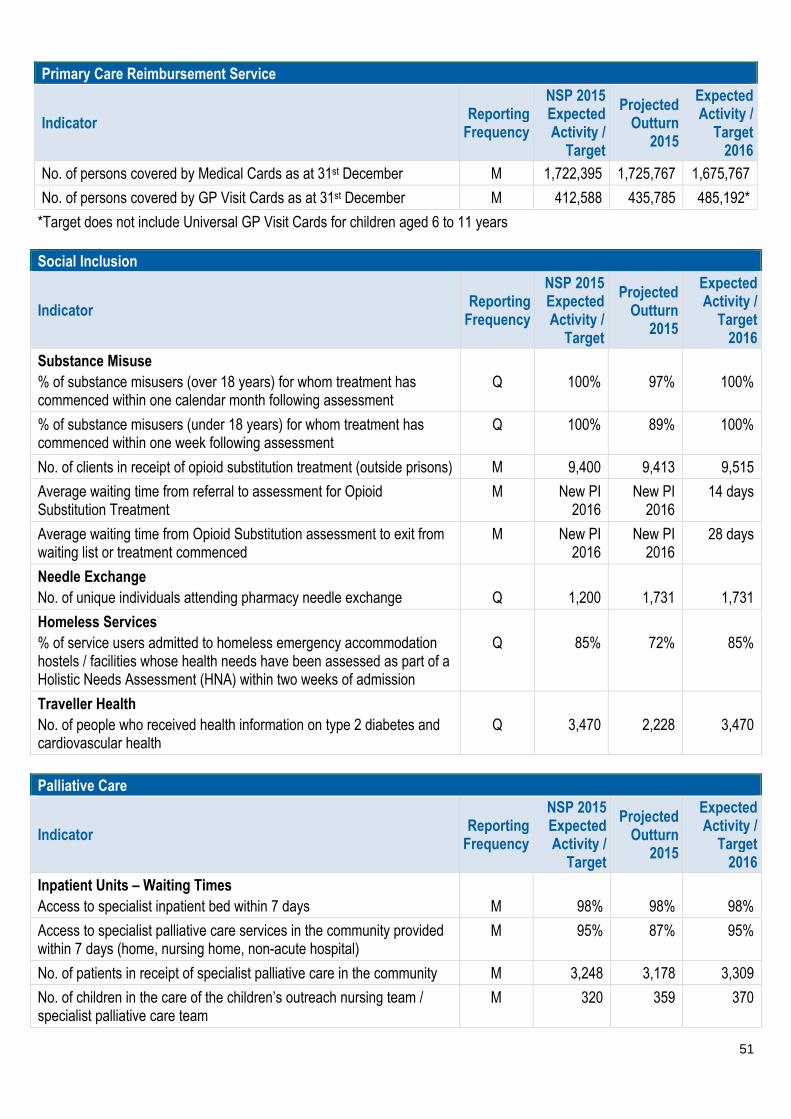
51
Primary Care Reimbursement Service
Indicator Reporting Frequency
NSP 2015 Expected Activity /
Target
Projected Outturn
2015
Expected Activity /
Target 2016
No. of persons covered by Medical Cards as at 31st December M 1,722,395 1,725,767 1,675,767
No. of persons covered by GP Visit Cards as at 31st December M 412,588 435,785 485,192*
*Target does not include Universal GP Visit Cards for children aged 6 to 11 years Social Inclusion
Indicator Reporting Frequency
NSP 2015 Expected Activity /
Target
Projected Outturn
2015
Expected Activity /
Target 2016
Substance Misuse % of substance misusers (over 18 years) for whom treatment has commenced within one calendar month following assessment
Q
100%
97%
100%
% of substance misusers (under 18 years) for whom treatment has commenced within one week following assessment
Q 100% 89% 100%
No. of clients in receipt of opioid substitution treatment (outside prisons) M 9,400 9,413 9,515
Average waiting time from referral to assessment for Opioid Substitution Treatment
M New PI 2016
New PI 2016
14 days
Average waiting time from Opioid Substitution assessment to exit from waiting list or treatment commenced
M New PI 2016
New PI 2016
28 days
Needle Exchange No. of unique individuals attending pharmacy needle exchange
Q
1,200
1,731
1,731
Homeless Services % of service users admitted to homeless emergency accommodation hostels / facilities whose health needs have been assessed as part of a Holistic Needs Assessment (HNA) within two weeks of admission
Q
85%
72%
85%
Traveller Health No. of people who received health information on type 2 diabetes and cardiovascular health
Q
3,470
2,228
3,470
Palliative Care
Indicator Reporting Frequency
NSP 2015 Expected Activity /
Target
Projected Outturn
2015
Expected Activity /
Target 2016
Inpatient Units – Waiting Times Access to specialist inpatient bed within 7 days
M
98%
98%
98%
Access to specialist palliative care services in the community provided within 7 days (home, nursing home, non-acute hospital)
M 95% 87% 95%
No. of patients in receipt of specialist palliative care in the community M 3,248 3,178 3,309
No. of children in the care of the children’s outreach nursing team / specialist palliative care team
M 320 359 370
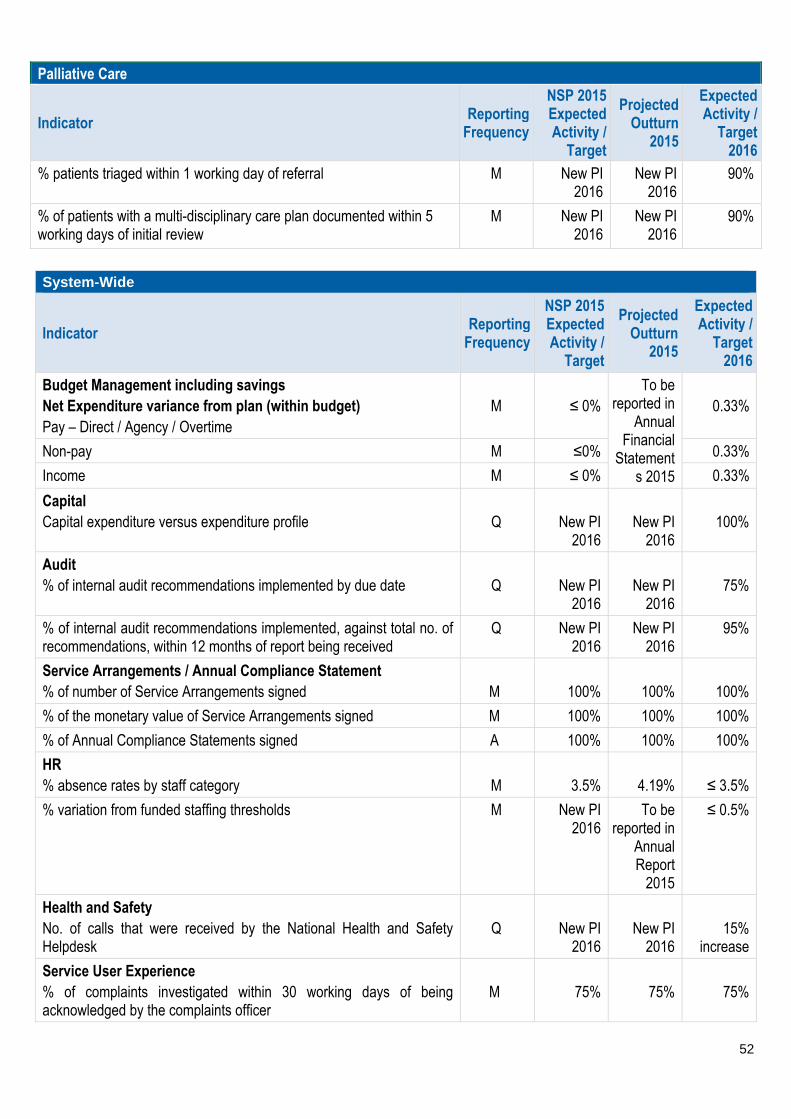
52
Palliative Care
Indicator Reporting Frequency
NSP 2015 Expected Activity /
Target
Projected Outturn
2015
Expected Activity /
Target 2016
% patients triaged within 1 working day of referral M New PI 2016
New PI 2016
90%
% of patients with a multi-disciplinary care plan documented within 5 working days of initial review
M New PI 2016
New PI 2016
90%
System-Wide
Indicator Reporting
Frequency
NSP 2015 Expected Activity /
Target
Projected Outturn
2015
Expected Activity /
Target 2016
Budget Management including savings Net Expenditure variance from plan (within budget) Pay – Direct / Agency / Overtime
M
≤ 0%
To be reported in
Annual Financial
Statements 2015
0.33%
Non-pay M ≤0% 0.33%
Income M ≤ 0% 0.33%
Capital Capital expenditure versus expenditure profile
Q
New PI
2016
New PI
2016
100%
Audit % of internal audit recommendations implemented by due date
Q
New PI
2016
New PI
2016
75%
% of internal audit recommendations implemented, against total no. of recommendations, within 12 months of report being received
Q New PI 2016
New PI 2016
95%
Service Arrangements / Annual Compliance Statement % of number of Service Arrangements signed
M
100%
100%
100%
% of the monetary value of Service Arrangements signed M 100% 100% 100%
% of Annual Compliance Statements signed A 100% 100% 100%
HR % absence rates by staff category
M
3.5%
4.19%
≤ 3.5%
% variation from funded staffing thresholds M New PI 2016
To be reported in
Annual Report
2015
≤ 0.5%
Health and Safety No. of calls that were received by the National Health and Safety Helpdesk
Q
New PI
2016
New PI
2016
15%
increase
Service User Experience % of complaints investigated within 30 working days of being acknowledged by the complaints officer
M
75%
75%
75%
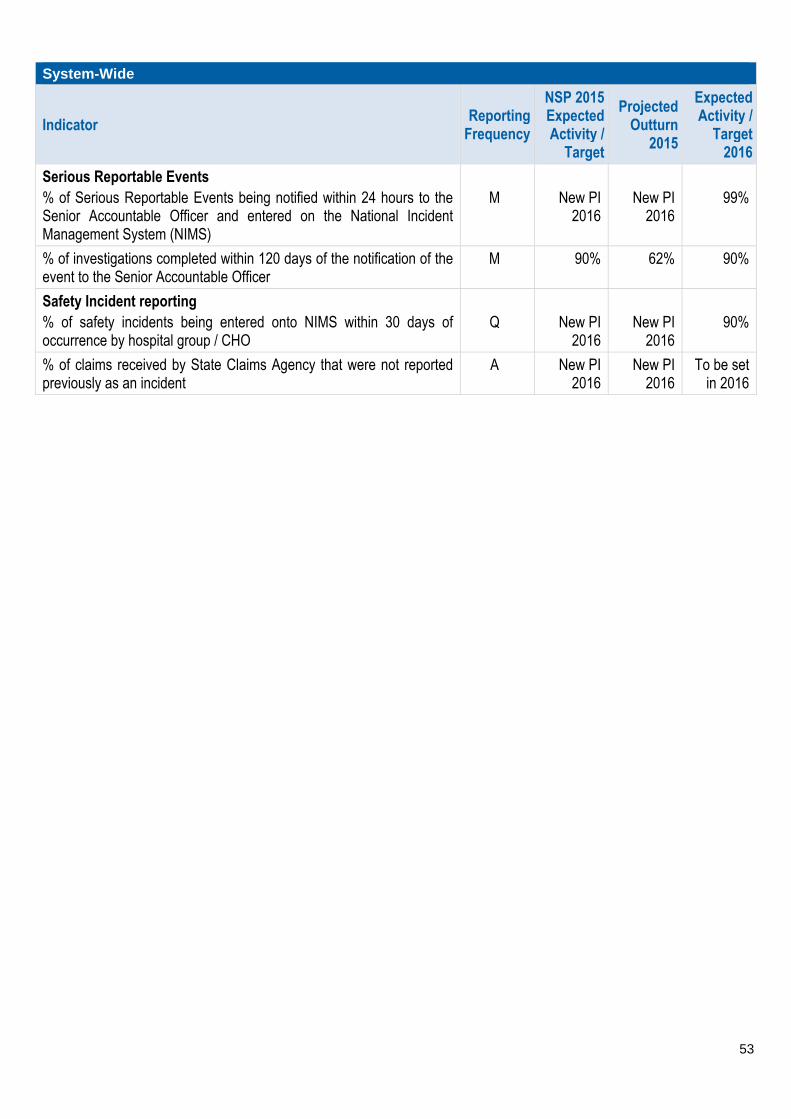
53
System-Wide
Indicator Reporting
Frequency
NSP 2015 Expected Activity /
Target
Projected Outturn
2015
Expected Activity /
Target 2016
Serious Reportable Events % of Serious Reportable Events being notified within 24 hours to the Senior Accountable Officer and entered on the National Incident Management System (NIMS)
M
New PI
2016
New PI
2016
99%
% of investigations completed within 120 days of the notification of the event to the Senior Accountable Officer
M 90% 62% 90%
Safety Incident reporting % of safety incidents being entered onto NIMS within 30 days of occurrence by hospital group / CHO
Q
New PI
2016
New PI
2016
90%
% of claims received by State Claims Agency that were not reported previously as an incident
A New PI 2016
New PI 2016
To be set in 2016

54
Primary Care – Full Metrics/KPI Suite (All metrics highlighted in yellow background are those that are included in the Balance Scorecard)
Key Performance Indicators Service Planning 2016
NSP / DOP
KPI Type Access/ Quality /Access Activity
Report Freq-uency
KPIs 2015 KPIs 2016
KPI Title
2015 National Target /
Expected Activity
2015 Projected outturn
2016 National Target /
Expected Activity
Reported at
National/ CHO
Community Healthcare Organisations
1 2 3 4 5 6 7 8 9
Community Intervention Teams (number of referrals)
26,355 18,600
24,202
0 900 4,713 1,350 3060 1,200 6,941 1,140 4,898
Admission Avoidance (includes OPAT) NSP Quality M 1,196 651 914 CHO 0 36 164 108 139 77 141 57 192
Hospital Avoidance NSP Quality M 14,134 10,788 12,932 CHO 0 234 2,598 435 1994 816 4,922 275 1,658
Early discharge (includes OPAT) NSP Quality M 6,375 3,980 6,360 CHO 0 540 935 275 847 253 1,878 694 938
Unscheduled referrals from community sources
NSP Quality M 4,650 3,181 3,996 CHO 0 90 1,016 532 80 54 0 114 2,110
Outpatient parenteral Antimicrobial Therapy OPAT Re-admission rate % DOP
Access /Activity MQ2
New PI 2016 New PI 2016 ≤5% HG ≤5% ≤5% ≤5% ≤5% ≤5% ≤5% ≤5% ≤5%
Community Intervention Teams Activity (by referral source)
26,355 18,600 24,202 CHO 0 900 4,713 1,350 3060 1,200 6,941 1140 4,898
ED / Hospital wards / Units DOP Access /Activity
M 17,038 11,272 13,956 CHO 0 504 2,509 392 1,408 646 5,274 740 2,483
GP Referral DOP Access /Activity
M 6,029 4,073 6,386 CHO 0 324 795 352 1,288 449 1,055 259 1,864
Community Referral DOP Access /Activity M 1,455 1,823 2,226 CHO 0 0 1,216 470 0 0 211 50 279
OPAT Referral DOP Access /Activity
M 1,833 1,432 1,634 CHO 0 72 193 136 364 105 401 91 272
GP Out of Hours
No. of contacts with GP Out of Hours Service NSP Access /Activity
M 959,455 964,770 964,770 National
Tobacco Control
% of primary care staff to undertake brief intervention training for smoking cessation
DOP Quality Q New 2016 New 2016 5% CHO 5% 5% 5% 5% 5% 5% 5% 5% 5%
Physiotherapy
No of patient referrals DOP Activity M 184,596 192,884 193,677 CHO 25,157 20,877 15,802 28,818 24,029 12,215 22,237 27,207 17,335
No of patients seen for a first time assessment DOP Activity M 159,260 158,262 160,017 CHO 21,228 15,884 12,062 26,412 20,911 10,049 16,886 23,059 13,526
No of patients treated in the reporting month (monthly target)
DOP Activity M 34,993 35,291 36,430 CHO 4,721 4,288 2,305 5,646 4,868 2,174 4,171 5,324 2,933
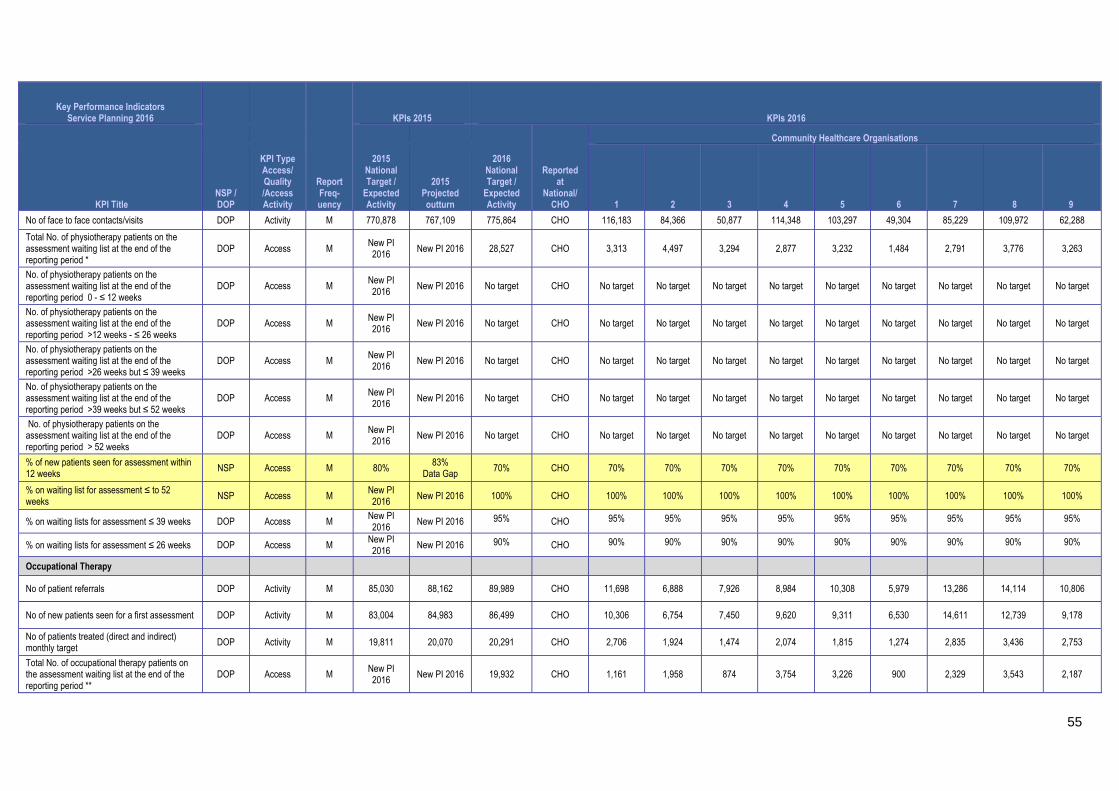
55
Key Performance Indicators Service Planning 2016
NSP / DOP
KPI Type Access/ Quality /Access Activity
Report Freq-uency
KPIs 2015 KPIs 2016
KPI Title
2015 National Target /
Expected Activity
2015 Projected outturn
2016 National Target /
Expected Activity
Reported at
National/ CHO
Community Healthcare Organisations
1 2 3 4 5 6 7 8 9
No of face to face contacts/visits DOP Activity M 770,878 767,109 775,864 CHO 116,183 84,366 50,877 114,348 103,297 49,304 85,229 109,972 62,288
Total No. of physiotherapy patients on the assessment waiting list at the end of the reporting period *
DOP Access M New PI 2016 New PI 2016 28,527 CHO 3,313 4,497 3,294 2,877 3,232 1,484 2,791 3,776 3,263
No. of physiotherapy patients on the assessment waiting list at the end of the reporting period 0 - ≤ 12 weeks
DOP Access M New PI 2016
New PI 2016 No target CHO No target No target No target No target No target No target No target No target No target
No. of physiotherapy patients on the assessment waiting list at the end of the reporting period >12 weeks - ≤ 26 weeks
DOP Access M New PI 2016
New PI 2016 No target CHO No target No target No target No target No target No target No target No target No target
No. of physiotherapy patients on the assessment waiting list at the end of the reporting period >26 weeks but ≤ 39 weeks
DOP Access M New PI 2016 New PI 2016 No target CHO No target No target No target No target No target No target No target No target No target
No. of physiotherapy patients on the assessment waiting list at the end of the reporting period >39 weeks but ≤ 52 weeks
DOP Access M New PI 2016
New PI 2016 No target CHO No target No target No target No target No target No target No target No target No target
No. of physiotherapy patients on the assessment waiting list at the end of the reporting period > 52 weeks
DOP Access M New PI 2016
New PI 2016 No target CHO No target No target No target No target No target No target No target No target No target
% of new patients seen for assessment within 12 weeks NSP Access M 80%
83% Data Gap 70% CHO 70% 70% 70% 70% 70% 70% 70% 70% 70%
% on waiting list for assessment ≤ to 52 weeks
NSP Access M New PI 2016
New PI 2016 100% CHO 100% 100% 100% 100% 100% 100% 100% 100% 100%
% on waiting lists for assessment ≤ 39 weeks DOP Access M New PI 2016
New PI 2016 95% CHO 95% 95% 95% 95% 95% 95% 95% 95% 95%
% on waiting lists for assessment ≤ 26 weeks DOP Access M New PI 2016
New PI 2016 90% CHO 90% 90% 90% 90% 90% 90% 90% 90% 90%
Occupational Therapy
No of patient referrals DOP Activity M 85,030 88,162 89,989 CHO 11,698 6,888 7,926 8,984 10,308 5,979 13,286 14,114 10,806
No of new patients seen for a first assessment DOP Activity M 83,004 84,983 86,499 CHO 10,306 6,754 7,450 9,620 9,311 6,530 14,611 12,739 9,178
No of patients treated (direct and indirect) monthly target
DOP Activity M 19,811 20,070 20,291 CHO 2,706 1,924 1,474 2,074 1,815 1,274 2,835 3,436 2,753
Total No. of occupational therapy patients on the assessment waiting list at the end of the reporting period **
DOP Access M New PI 2016
New PI 2016 19,932 CHO 1,161 1,958 874 3,754 3,226 900 2,329 3,543 2,187
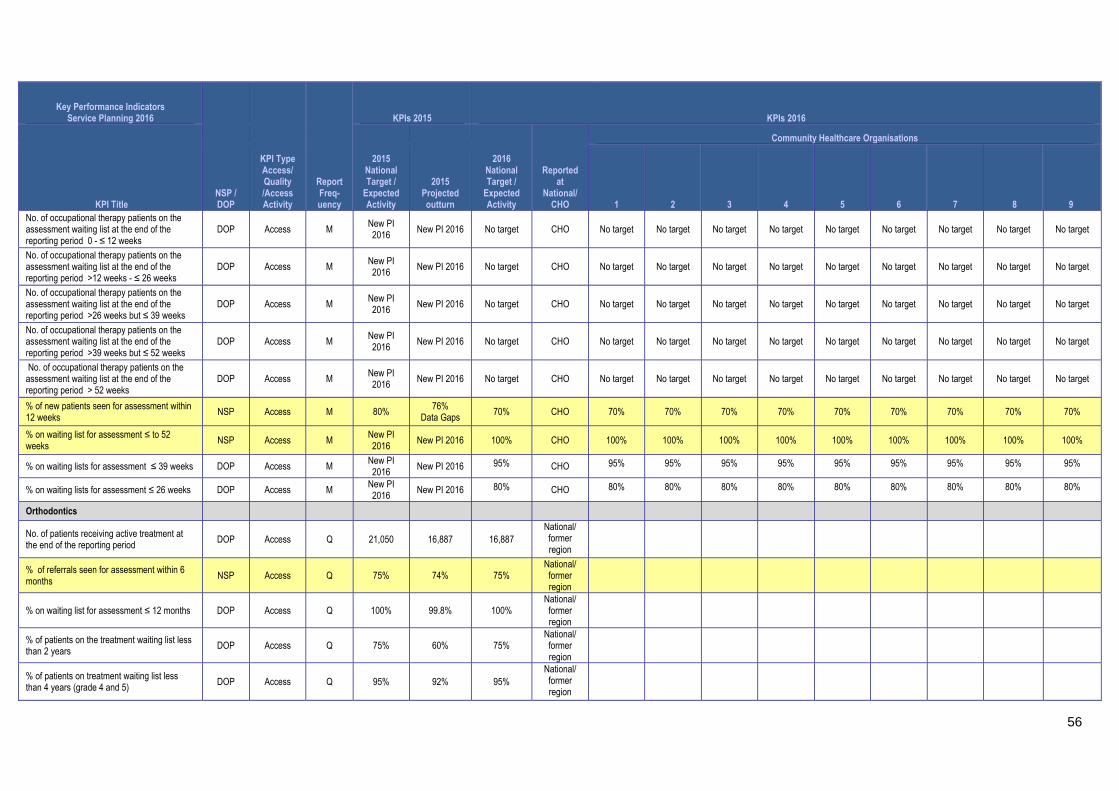
56
Key Performance Indicators Service Planning 2016
NSP / DOP
KPI Type Access/ Quality /Access Activity
Report Freq-uency
KPIs 2015 KPIs 2016
KPI Title
2015 National Target /
Expected Activity
2015 Projected outturn
2016 National Target /
Expected Activity
Reported at
National/ CHO
Community Healthcare Organisations
1 2 3 4 5 6 7 8 9
No. of occupational therapy patients on the assessment waiting list at the end of the reporting period 0 - ≤ 12 weeks
DOP Access M New PI 2016
New PI 2016 No target CHO No target No target No target No target No target No target No target No target No target
No. of occupational therapy patients on the assessment waiting list at the end of the reporting period >12 weeks - ≤ 26 weeks
DOP Access M New PI 2016
New PI 2016 No target CHO No target No target No target No target No target No target No target No target No target
No. of occupational therapy patients on the assessment waiting list at the end of the reporting period >26 weeks but ≤ 39 weeks
DOP Access M New PI 2016 New PI 2016 No target CHO No target No target No target No target No target No target No target No target No target
No. of occupational therapy patients on the assessment waiting list at the end of the reporting period >39 weeks but ≤ 52 weeks
DOP Access M New PI 2016
New PI 2016 No target CHO No target No target No target No target No target No target No target No target No target
No. of occupational therapy patients on the assessment waiting list at the end of the reporting period > 52 weeks
DOP Access M New PI 2016
New PI 2016 No target CHO No target No target No target No target No target No target No target No target No target
% of new patients seen for assessment within 12 weeks
NSP Access M 80% 76% Data Gaps
70% CHO 70% 70% 70% 70% 70% 70% 70% 70% 70%
% on waiting list for assessment ≤ to 52 weeks
NSP Access M New PI 2016
New PI 2016 100% CHO 100% 100% 100% 100% 100% 100% 100% 100% 100%
% on waiting lists for assessment ≤ 39 weeks DOP Access M New PI 2016
New PI 2016 95% CHO 95% 95% 95% 95% 95% 95% 95% 95% 95%
% on waiting lists for assessment ≤ 26 weeks DOP Access M New PI 2016
New PI 2016 80% CHO 80% 80% 80% 80% 80% 80% 80% 80% 80%
Orthodontics
No. of patients receiving active treatment at the end of the reporting period DOP Access Q 21,050 16,887 16,887
National/ former region
% of referrals seen for assessment within 6 months
NSP Access Q 75% 74% 75% National/ former region
% on waiting list for assessment ≤ 12 months DOP Access Q 100% 99.8% 100% National/ former region
% of patients on the treatment waiting list less than 2 years
DOP Access Q 75% 60% 75% National/ former region
% of patients on treatment waiting list less than 4 years (grade 4 and 5) DOP Access Q 95% 92% 95%
National/ former region
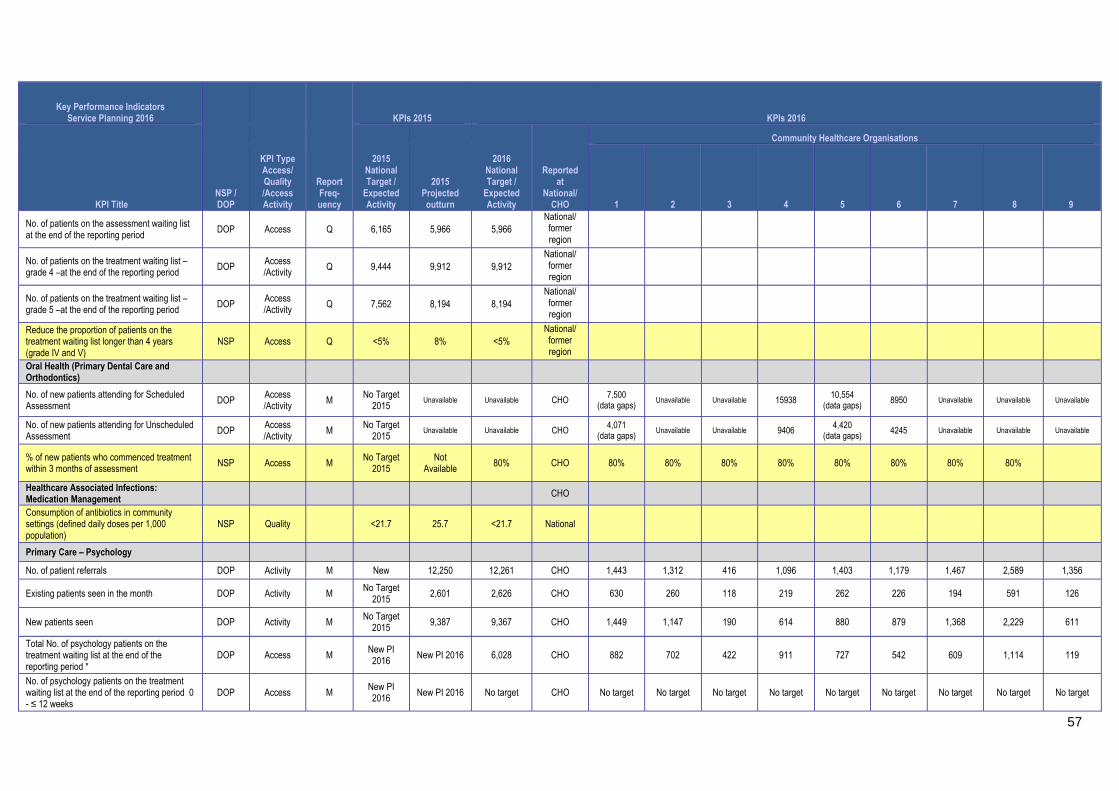
57
Key Performance Indicators Service Planning 2016
NSP / DOP
KPI Type Access/ Quality /Access Activity
Report Freq-uency
KPIs 2015 KPIs 2016
KPI Title
2015 National Target /
Expected Activity
2015 Projected outturn
2016 National Target /
Expected Activity
Reported at
National/ CHO
Community Healthcare Organisations
1 2 3 4 5 6 7 8 9
No. of patients on the assessment waiting list at the end of the reporting period
DOP Access Q 6,165 5,966 5,966 National/ former region
No. of patients on the treatment waiting list – grade 4 –at the end of the reporting period
DOP Access /Activity
Q 9,444 9,912 9,912 National/ former region
No. of patients on the treatment waiting list – grade 5 –at the end of the reporting period DOP
Access /Activity Q 7,562 8,194 8,194
National/ former region
Reduce the proportion of patients on the treatment waiting list longer than 4 years (grade IV and V)
NSP Access Q <5% 8% <5% National/ former region
Oral Health (Primary Dental Care and Orthodontics)
No. of new patients attending for Scheduled Assessment DOP
Access /Activity M
No Target 2015
Unavailable Unavailable CHO 7,500 (data gaps)
Unavailable Unavailable 15938 10,554 (data gaps) 8950 Unavailable Unavailable Unavailable
No. of new patients attending for Unscheduled Assessment DOP
Access /Activity M
No Target 2015
Unavailable Unavailable CHO 4,071 (data gaps)
Unavailable Unavailable 9406 4,420 (data gaps) 4245 Unavailable Unavailable Unavailable
% of new patients who commenced treatment within 3 months of assessment NSP Access M
No Target 2015
Not Available 80% CHO 80% 80% 80% 80% 80% 80% 80% 80%
Healthcare Associated Infections: Medication Management
CHO
Consumption of antibiotics in community settings (defined daily doses per 1,000 population)
NSP Quality <21.7 25.7 <21.7 National
Primary Care – Psychology
No. of patient referrals DOP Activity M New 12,250 12,261 CHO 1,443 1,312 416 1,096 1,403 1,179 1,467 2,589 1,356
Existing patients seen in the month DOP Activity M No Target
2015 2,601 2,626 CHO 630 260 118 219 262 226 194 591 126
New patients seen DOP Activity M No Target
2015 9,387 9,367 CHO 1,449 1,147 190 614 880 879 1,368 2,229 611
Total No. of psychology patients on the treatment waiting list at the end of the reporting period *
DOP Access M New PI 2016
New PI 2016 6,028 CHO 882 702 422 911 727 542 609 1,114 119
No. of psychology patients on the treatment waiting list at the end of the reporting period 0 - ≤ 12 weeks
DOP Access M New PI 2016 New PI 2016 No target CHO No target No target No target No target No target No target No target No target No target
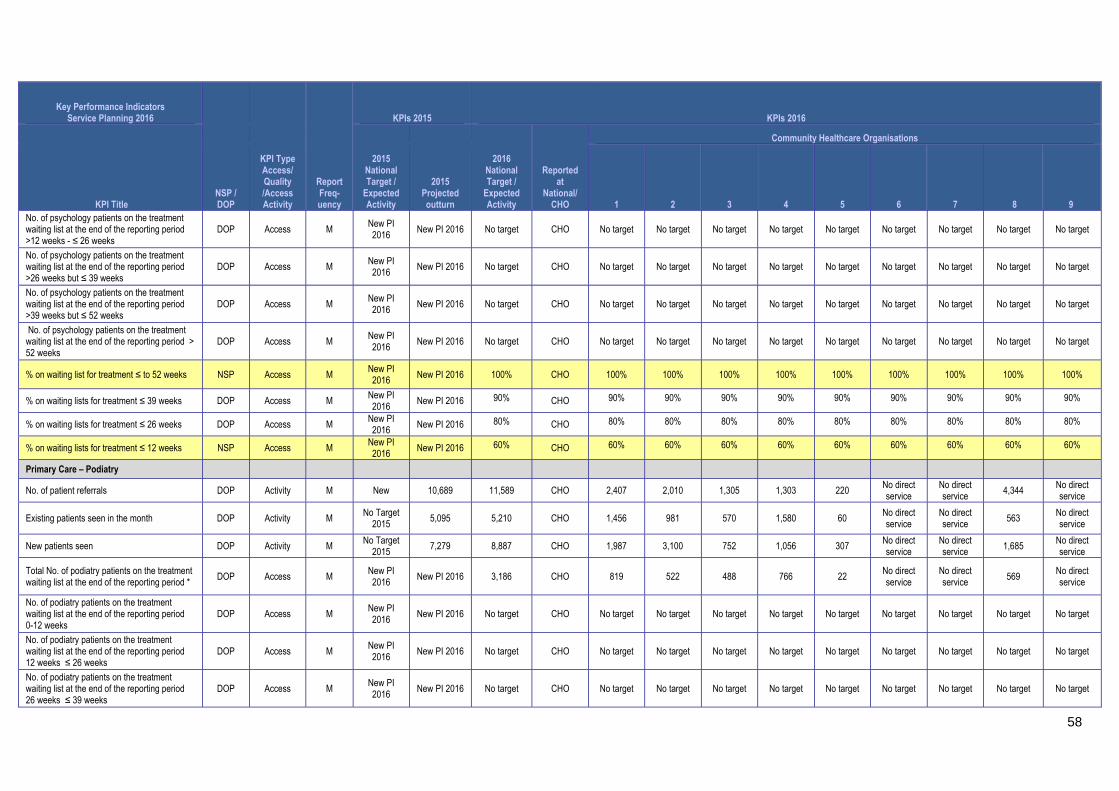
58
Key Performance Indicators Service Planning 2016
NSP / DOP
KPI Type Access/ Quality /Access Activity
Report Freq-uency
KPIs 2015 KPIs 2016
KPI Title
2015 National Target /
Expected Activity
2015 Projected outturn
2016 National Target /
Expected Activity
Reported at
National/ CHO
Community Healthcare Organisations
1 2 3 4 5 6 7 8 9
No. of psychology patients on the treatment waiting list at the end of the reporting period >12 weeks - ≤ 26 weeks
DOP Access M New PI 2016
New PI 2016 No target CHO No target No target No target No target No target No target No target No target No target
No. of psychology patients on the treatment waiting list at the end of the reporting period >26 weeks but ≤ 39 weeks
DOP Access M New PI 2016
New PI 2016 No target CHO No target No target No target No target No target No target No target No target No target
No. of psychology patients on the treatment waiting list at the end of the reporting period >39 weeks but ≤ 52 weeks
DOP Access M New PI 2016 New PI 2016 No target CHO No target No target No target No target No target No target No target No target No target
No. of psychology patients on the treatment waiting list at the end of the reporting period > 52 weeks
DOP Access M New PI 2016
New PI 2016 No target CHO No target No target No target No target No target No target No target No target No target
% on waiting list for treatment ≤ to 52 weeks NSP Access M New PI 2016 New PI 2016 100% CHO 100% 100% 100% 100% 100% 100% 100% 100% 100%
% on waiting lists for treatment ≤ 39 weeks DOP Access M New PI 2016
New PI 2016 90% CHO 90% 90% 90% 90% 90% 90% 90% 90% 90%
% on waiting lists for treatment ≤ 26 weeks DOP Access M New PI 2016 New PI 2016 80% CHO 80% 80% 80% 80% 80% 80% 80% 80% 80%
% on waiting lists for treatment ≤ 12 weeks NSP Access M New PI 2016 New PI 2016 60% CHO 60% 60% 60% 60% 60% 60% 60% 60% 60%
Primary Care – Podiatry
No. of patient referrals DOP Activity M New 10,689 11,589 CHO 2,407 2,010 1,305 1,303 220 No direct service
No direct service
4,344 No direct service
Existing patients seen in the month DOP Activity M No Target 2015
5,095 5,210 CHO 1,456 981 570 1,580 60 No direct service
No direct service
563 No direct service
New patients seen DOP Activity M No Target 2015
7,279 8,887 CHO 1,987 3,100 752 1,056 307 No direct service
No direct service
1,685 No direct service
Total No. of podiatry patients on the treatment waiting list at the end of the reporting period *
DOP Access M New PI 2016
New PI 2016 3,186 CHO 819 522 488 766 22 No direct service
No direct service
569 No direct service
No. of podiatry patients on the treatment waiting list at the end of the reporting period 0-12 weeks
DOP Access M New PI 2016
New PI 2016 No target CHO No target No target No target No target No target No target No target No target No target
No. of podiatry patients on the treatment waiting list at the end of the reporting period 12 weeks ≤ 26 weeks
DOP Access M New PI 2016 New PI 2016 No target CHO No target No target No target No target No target No target No target No target No target
No. of podiatry patients on the treatment waiting list at the end of the reporting period 26 weeks ≤ 39 weeks
DOP Access M New PI 2016
New PI 2016 No target CHO No target No target No target No target No target No target No target No target No target
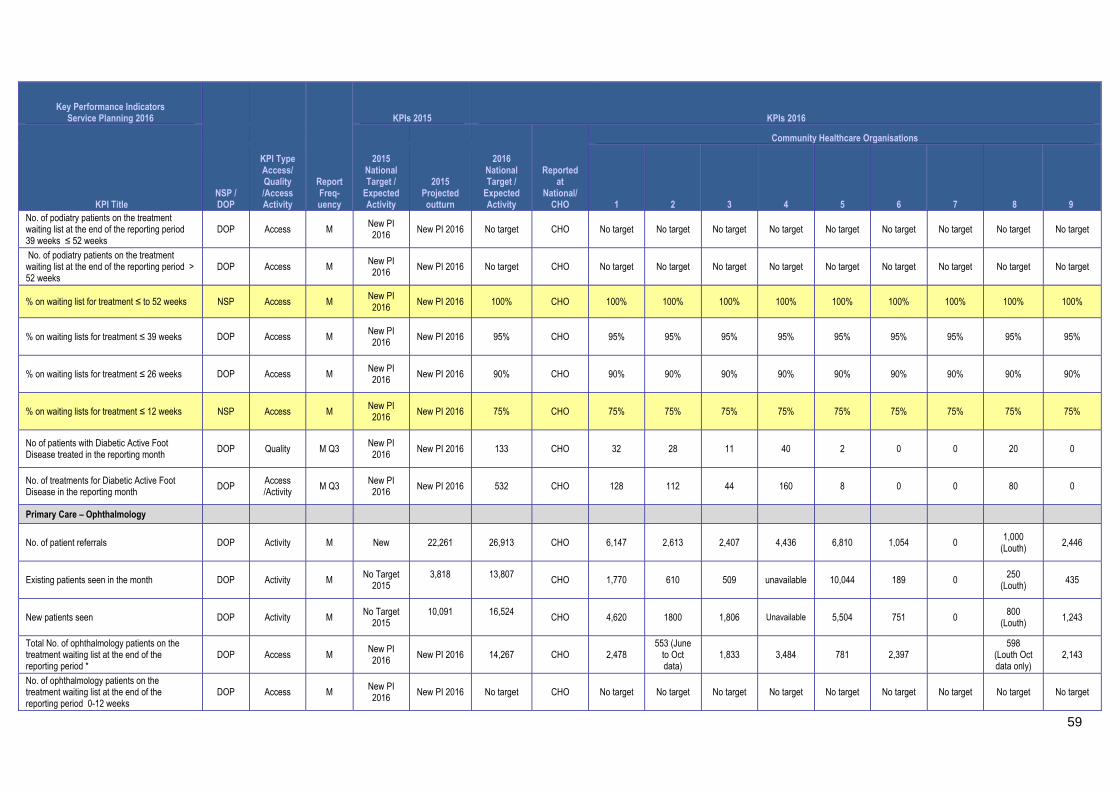
59
Key Performance Indicators Service Planning 2016
NSP / DOP
KPI Type Access/ Quality /Access Activity
Report Freq-uency
KPIs 2015 KPIs 2016
KPI Title
2015 National Target /
Expected Activity
2015 Projected outturn
2016 National Target /
Expected Activity
Reported at
National/ CHO
Community Healthcare Organisations
1 2 3 4 5 6 7 8 9
No. of podiatry patients on the treatment waiting list at the end of the reporting period 39 weeks ≤ 52 weeks
DOP Access M New PI 2016
New PI 2016 No target CHO No target No target No target No target No target No target No target No target No target
No. of podiatry patients on the treatment waiting list at the end of the reporting period > 52 weeks
DOP Access M New PI 2016
New PI 2016 No target CHO No target No target No target No target No target No target No target No target No target
% on waiting list for treatment ≤ to 52 weeks NSP Access M New PI 2016
New PI 2016 100% CHO 100% 100% 100% 100% 100% 100% 100% 100% 100%
% on waiting lists for treatment ≤ 39 weeks DOP Access M New PI 2016
New PI 2016 95% CHO 95% 95% 95% 95% 95% 95% 95% 95% 95%
% on waiting lists for treatment ≤ 26 weeks DOP Access M New PI 2016
New PI 2016 90% CHO 90% 90% 90% 90% 90% 90% 90% 90% 90%
% on waiting lists for treatment ≤ 12 weeks NSP Access M New PI 2016 New PI 2016 75% CHO 75% 75% 75% 75% 75% 75% 75% 75% 75%
No of patients with Diabetic Active Foot Disease treated in the reporting month
DOP Quality M Q3 New PI 2016
New PI 2016 133 CHO 32 28 11 40 2 0 0 20 0
No. of treatments for Diabetic Active Foot Disease in the reporting month
DOP Access /Activity
M Q3 New PI 2016
New PI 2016 532 CHO 128 112 44 160 8 0 0 80 0
Primary Care – Ophthalmology
No. of patient referrals DOP Activity M New 22,261 26,913 CHO 6,147 2,613 2,407 4,436 6,810 1,054 0 1,000
(Louth) 2,446
Existing patients seen in the month DOP Activity M No Target 2015
3,818
13,807
CHO 1,770 610 509 unavailable 10,044 189 0 250 (Louth)
435
New patients seen DOP Activity M No Target
2015 10,091
16,524
CHO 4,620 1800 1,806 Unavailable 5,504 751 0 800
(Louth) 1,243
Total No. of ophthalmology patients on the treatment waiting list at the end of the reporting period *
DOP Access M New PI 2016
New PI 2016 14,267 CHO 2,478 553 (June
to Oct data)
1,833 3,484 781 2,397 598
(Louth Oct data only)
2,143
No. of ophthalmology patients on the treatment waiting list at the end of the reporting period 0-12 weeks
DOP Access M New PI 2016
New PI 2016 No target CHO No target No target No target No target No target No target No target No target No target
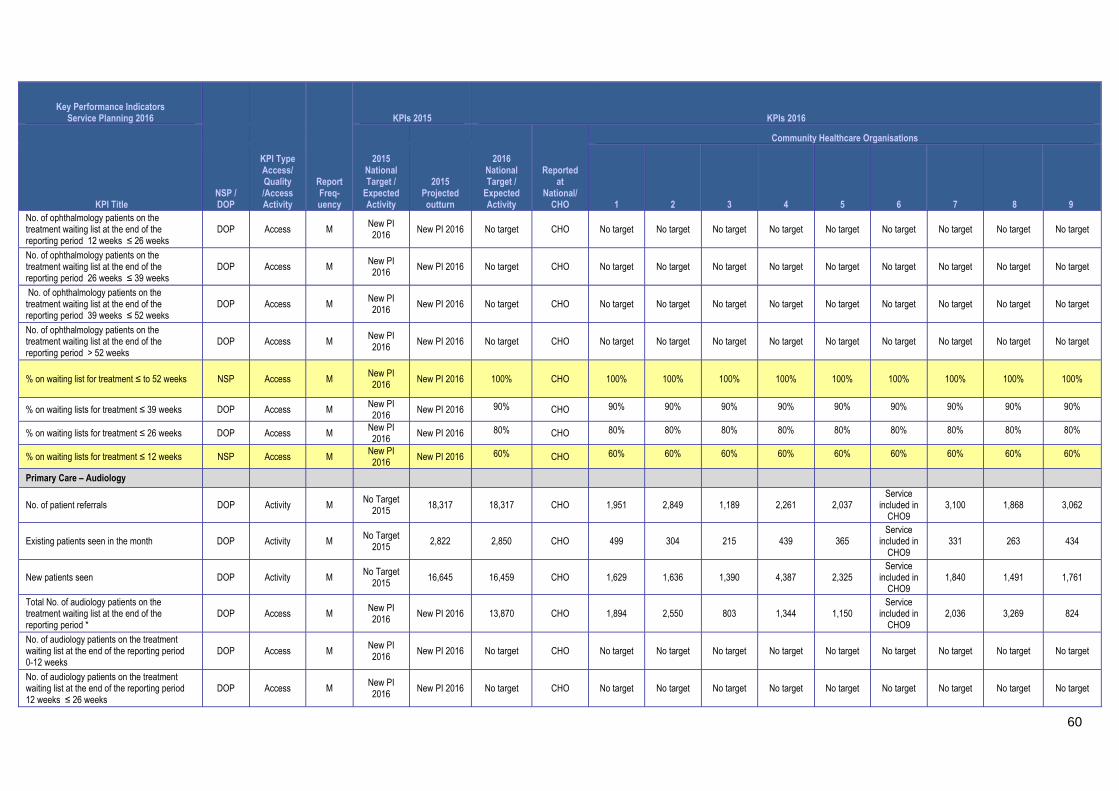
60
Key Performance Indicators Service Planning 2016
NSP / DOP
KPI Type Access/ Quality /Access Activity
Report Freq-uency
KPIs 2015 KPIs 2016
KPI Title
2015 National Target /
Expected Activity
2015 Projected outturn
2016 National Target /
Expected Activity
Reported at
National/ CHO
Community Healthcare Organisations
1 2 3 4 5 6 7 8 9
No. of ophthalmology patients on the treatment waiting list at the end of the reporting period 12 weeks ≤ 26 weeks
DOP Access M New PI 2016
New PI 2016 No target CHO No target No target No target No target No target No target No target No target No target
No. of ophthalmology patients on the treatment waiting list at the end of the reporting period 26 weeks ≤ 39 weeks
DOP Access M New PI 2016
New PI 2016 No target CHO No target No target No target No target No target No target No target No target No target
No. of ophthalmology patients on the treatment waiting list at the end of the reporting period 39 weeks ≤ 52 weeks
DOP Access M New PI 2016 New PI 2016 No target CHO No target No target No target No target No target No target No target No target No target
No. of ophthalmology patients on the treatment waiting list at the end of the reporting period > 52 weeks
DOP Access M New PI 2016
New PI 2016 No target CHO No target No target No target No target No target No target No target No target No target
% on waiting list for treatment ≤ to 52 weeks NSP Access M New PI 2016 New PI 2016 100% CHO 100% 100% 100% 100% 100% 100% 100% 100% 100%
% on waiting lists for treatment ≤ 39 weeks DOP Access M New PI 2016
New PI 2016 90% CHO 90% 90% 90% 90% 90% 90% 90% 90% 90%
% on waiting lists for treatment ≤ 26 weeks DOP Access M New PI 2016 New PI 2016 80% CHO 80% 80% 80% 80% 80% 80% 80% 80% 80%
% on waiting lists for treatment ≤ 12 weeks NSP Access M New PI 2016 New PI 2016 60% CHO 60% 60% 60% 60% 60% 60% 60% 60% 60%
Primary Care – Audiology
No. of patient referrals DOP Activity M No Target
2015 18,317 18,317 CHO 1,951 2,849 1,189 2,261 2,037
Service included in
CHO9 3,100 1,868 3,062
Existing patients seen in the month DOP Activity M No Target 2015
2,822 2,850 CHO 499 304 215 439 365 Service
included in CHO9
331 263 434
New patients seen DOP Activity M No Target
2015 16,645 16,459 CHO 1,629 1,636 1,390 4,387 2,325
Service included in
CHO9 1,840 1,491 1,761
Total No. of audiology patients on the treatment waiting list at the end of the reporting period *
DOP Access M New PI 2016
New PI 2016 13,870 CHO 1,894 2,550 803 1,344 1,150 Service
included in CHO9
2,036 3,269 824
No. of audiology patients on the treatment waiting list at the end of the reporting period 0-12 weeks
DOP Access M New PI 2016
New PI 2016 No target CHO No target No target No target No target No target No target No target No target No target
No. of audiology patients on the treatment waiting list at the end of the reporting period 12 weeks ≤ 26 weeks
DOP Access M New PI 2016
New PI 2016 No target CHO No target No target No target No target No target No target No target No target No target
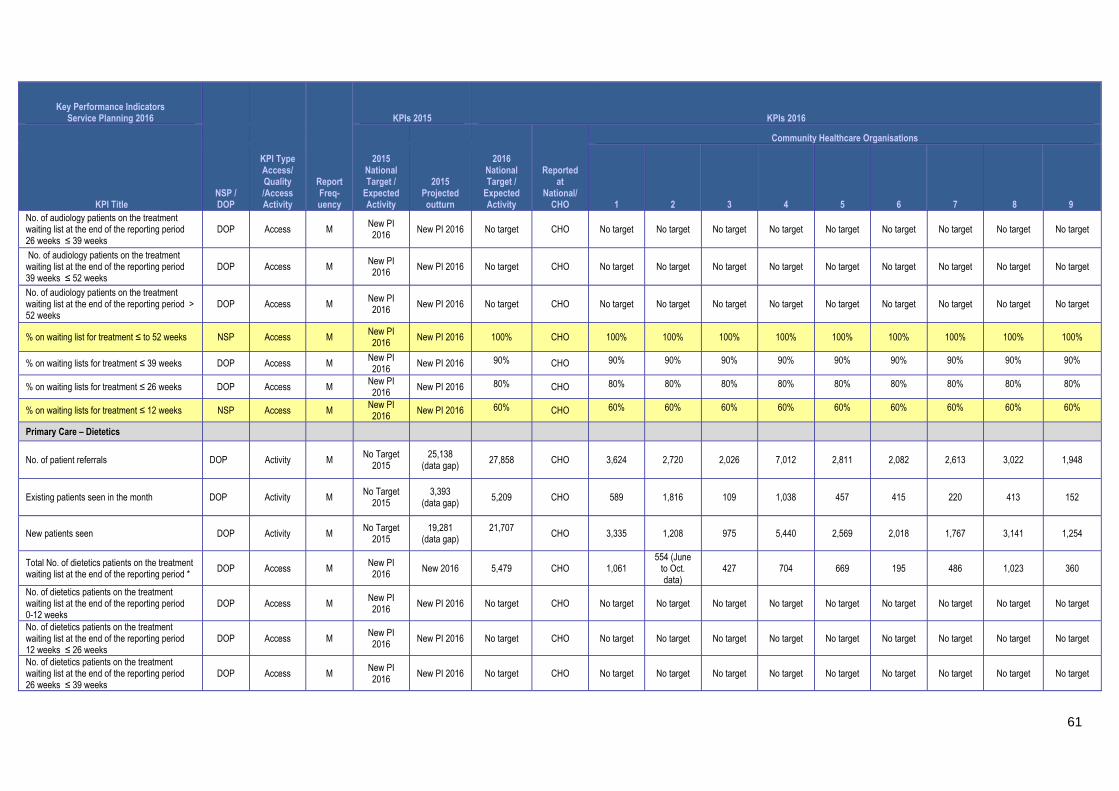
61
Key Performance Indicators Service Planning 2016
NSP / DOP
KPI Type Access/ Quality /Access Activity
Report Freq-uency
KPIs 2015 KPIs 2016
KPI Title
2015 National Target /
Expected Activity
2015 Projected outturn
2016 National Target /
Expected Activity
Reported at
National/ CHO
Community Healthcare Organisations
1 2 3 4 5 6 7 8 9
No. of audiology patients on the treatment waiting list at the end of the reporting period 26 weeks ≤ 39 weeks
DOP Access M New PI 2016
New PI 2016 No target CHO No target No target No target No target No target No target No target No target No target
No. of audiology patients on the treatment waiting list at the end of the reporting period 39 weeks ≤ 52 weeks
DOP Access M New PI 2016
New PI 2016 No target CHO No target No target No target No target No target No target No target No target No target
No. of audiology patients on the treatment waiting list at the end of the reporting period > 52 weeks
DOP Access M New PI 2016 New PI 2016 No target CHO No target No target No target No target No target No target No target No target No target
% on waiting list for treatment ≤ to 52 weeks NSP Access M New PI 2016
New PI 2016 100% CHO 100% 100% 100% 100% 100% 100% 100% 100% 100%
% on waiting lists for treatment ≤ 39 weeks DOP Access M New PI 2016
New PI 2016 90% CHO 90% 90% 90% 90% 90% 90% 90% 90% 90%
% on waiting lists for treatment ≤ 26 weeks DOP Access M New PI 2016 New PI 2016 80% CHO 80% 80% 80% 80% 80% 80% 80% 80% 80%
% on waiting lists for treatment ≤ 12 weeks NSP Access M New PI 2016 New PI 2016 60% CHO 60% 60% 60% 60% 60% 60% 60% 60% 60%
Primary Care – Dietetics
No. of patient referrals DOP Activity M No Target
2015 25,138
(data gap) 27,858 CHO 3,624 2,720 2,026 7,012 2,811 2,082 2,613 3,022 1,948
Existing patients seen in the month DOP Activity M No Target
2015 3,393
(data gap) 5,209 CHO 589 1,816 109 1,038 457 415 220 413 152
New patients seen DOP Activity M No Target
2015 19,281
(data gap) 21,707
CHO 3,335
1,208
975 5,440 2,569 2,018 1,767 3,141 1,254
Total No. of dietetics patients on the treatment waiting list at the end of the reporting period *
DOP Access M New PI 2016
New 2016 5,479 CHO 1,061 554 (June
to Oct. data)
427 704 669 195 486 1,023 360
No. of dietetics patients on the treatment waiting list at the end of the reporting period 0-12 weeks
DOP Access M New PI 2016
New PI 2016 No target CHO No target No target No target No target No target No target No target No target No target
No. of dietetics patients on the treatment waiting list at the end of the reporting period 12 weeks ≤ 26 weeks
DOP Access M New PI 2016 New PI 2016 No target CHO No target No target No target No target No target No target No target No target No target
No. of dietetics patients on the treatment waiting list at the end of the reporting period 26 weeks ≤ 39 weeks
DOP Access M New PI 2016
New PI 2016 No target CHO No target No target No target No target No target No target No target No target No target

62
Key Performance Indicators Service Planning 2016
NSP / DOP
KPI Type Access/ Quality /Access Activity
Report Freq-uency
KPIs 2015 KPIs 2016
KPI Title
2015 National Target /
Expected Activity
2015 Projected outturn
2016 National Target /
Expected Activity
Reported at
National/ CHO
Community Healthcare Organisations
1 2 3 4 5 6 7 8 9
No. of dietetics patients on the treatment waiting list at the end of the reporting period 39 weeks ≤ 52 weeks
DOP Access M New PI 2016
New PI 2016 No target CHO No target No target No target No target No target No target No target No target No target
No. of dietetics patients on the treatment waiting list at the end of the reporting period > 52 weeks
DOP Access M New PI 2016
New PI 2016 No target CHO No target No target No target No target No target No target No target No target No target
% on waiting list for treatment ≤ to 52 weeks NSP Access M New PI 2016 New PI 2016 100% CHO 100% 100% 100% 100% 100% 100% 100% 100% 100%
% on waiting lists for treatment ≤ 39 weeks DOP Access M New PI 2016
New PI 2016 95% CHO 95% 95% 95% 95% 95% 95% 95% 95% 95%
% on waiting lists for treatment ≤ 26 weeks DOP Access M New PI 2016
New PI 2016 85% CHO 85% 85% 85% 85% 85% 85% 85% 85% 85%
% on waiting lists for treatment ≤ 12 weeks NSP Access M New PI 2016
New PI 2016 70% CHO 70% 70% 70% 70% 70% 70% 70% 70% 70%
Primary Care – Nursing
No. of patient referrals DOP Activity M No Target 2015
150,768 159,694 CHO 8,351 (Data gap)
18,417 17,796 84,403 Unavailable 7,809 1,702 (Data gap)
Unavailable 21,216
Existing patients seen in the month DOP Activity M No Target
2015 63,724 64,660 CHO
3,857 (Data gap)
5,341 21,934 26,441 Unavailable 1,482 1,800
(Data gap) Unavailable 3,805
New patients seen DOP Activity M No Target
2015 115,785 123,024 CHO
10,960 (Data gap)
17,185 16,509 49,450 Unavailable 5,948 1,884
(Data gap) Unavailable 21,088
Number of new patients accepted on the caseload and waiting to be seen over 12 weeks
NSP Access M New 2016 New 2016 0 CHO 0 0 0 0 0 0 0 0 0
Primary Care – Speech and Language Therapy***
No. of patient referrals DOP Activity M No Target
2015 50,863 50,863 CHO 6,140 4,373 4,062 6,739 4,905 3,333 5,769 7,918 7,624
Existing patients seen in the month DOP Activity M Q2 New 2016 New PI 2016 New PI 2016
CHO New PI 2016
New PI 2016
New PI 2016
New PI 2016
New PI 2016
New PI 2016
New PI 2016
New PI 2016
New PI 2016
New patients seen for initial assessment DOP Activity M No Target 2015
41,083 41,083 CHO 4,569 3,891 3,381 6,324 4,450 1,862 4,045 6,414 6,147
Total No. of speech and language patients waiting initial assessment at end of the
DOP Access M New 2016 New PI 2016 13,050 CHO 963 658 832 1,566 1,109 504 3,057 2,223 2,138
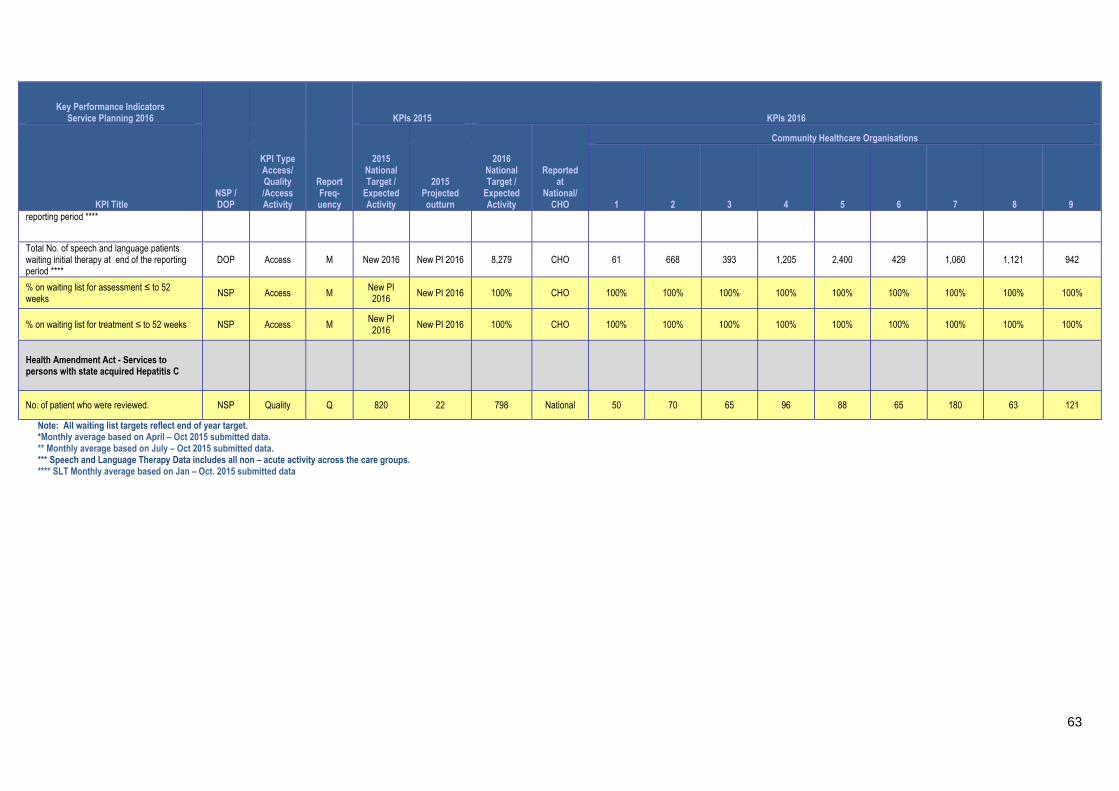
63
Key Performance Indicators Service Planning 2016
NSP / DOP
KPI Type Access/ Quality /Access Activity
Report Freq-uency
KPIs 2015 KPIs 2016
KPI Title
2015 National Target /
Expected Activity
2015 Projected outturn
2016 National Target /
Expected Activity
Reported at
National/ CHO
Community Healthcare Organisations
1 2 3 4 5 6 7 8 9
reporting period ****
Total No. of speech and language patients waiting initial therapy at end of the reporting period ****
DOP Access M New 2016 New PI 2016 8,279 CHO 61 668 393 1,205 2,400 429 1,060 1,121 942
% on waiting list for assessment ≤ to 52 weeks
NSP Access M New PI 2016
New PI 2016 100% CHO 100% 100% 100% 100% 100% 100% 100% 100% 100%
% on waiting list for treatment ≤ to 52 weeks NSP Access M New PI 2016
New PI 2016 100% CHO 100% 100% 100% 100% 100% 100% 100% 100% 100%
Health Amendment Act - Services to persons with state acquired Hepatitis C
No. of patient who were reviewed. NSP Quality Q 820 22 798 National 50 70 65 96 88 65 180 63 121
Note: All waiting list targets reflect end of year target. *Monthly average based on April – Oct 2015 submitted data. ** Monthly average based on July – Oct 2015 submitted data. *** Speech and Language Therapy Data includes all non – acute activity across the care groups. **** SLT Monthly average based on Jan – Oct. 2015 submitted data
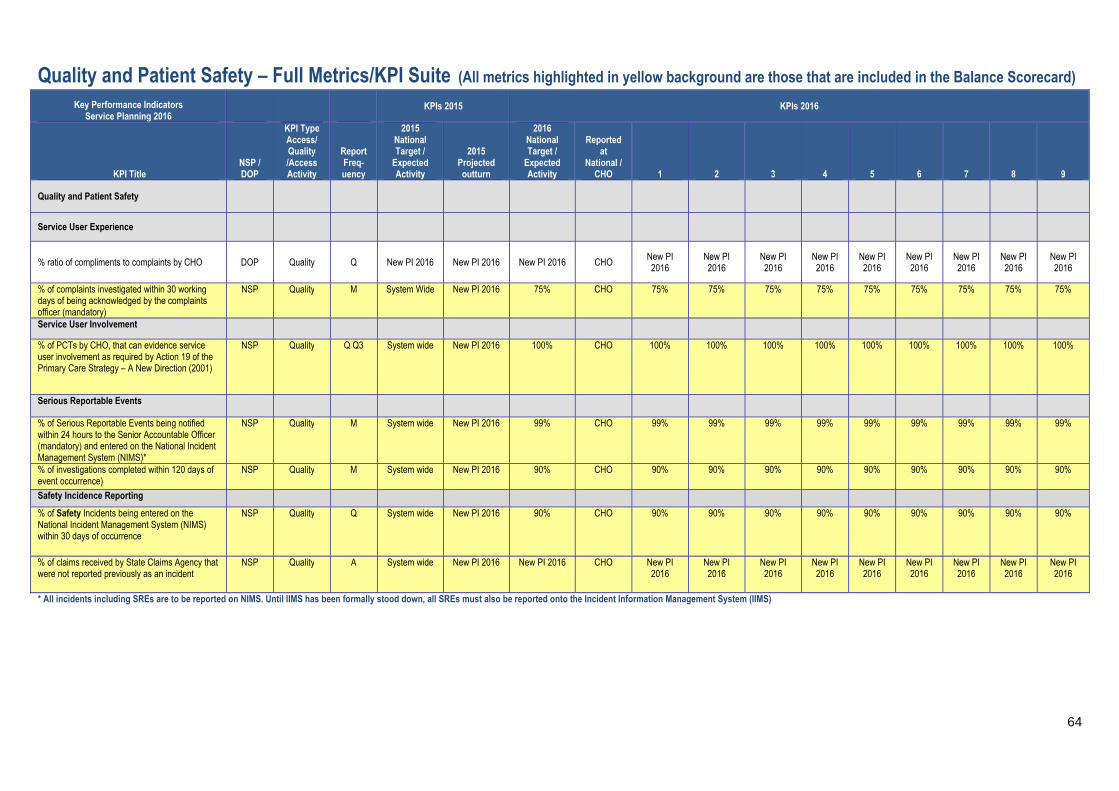
64
Quality and Patient Safety – Full Metrics/KPI Suite (All metrics highlighted in yellow background are those that are included in the Balance Scorecard) Key Performance Indicators
Service Planning 2016 KPIs 2015 KPIs 2016
KPI Title NSP / DOP
KPI Type Access/ Quality /Access Activity
Report Freq-uency
2015 National Target /
Expected Activity
2015 Projected outturn
2016 National Target /
Expected Activity
Reported at
National / CHO
1 2 3 4 5 6 7 8 9
Quality and Patient Safety
Service User Experience
% ratio of compliments to complaints by CHO DOP Quality Q New PI 2016 New PI 2016 New PI 2016 CHO New PI 2016
New PI 2016
New PI 2016
New PI 2016
New PI 2016
New PI 2016
New PI 2016
New PI 2016
New PI 2016
% of complaints investigated within 30 working days of being acknowledged by the complaints officer (mandatory)
NSP Quality M System Wide New PI 2016 75% CHO 75% 75% 75% 75% 75% 75% 75% 75% 75%
Service User Involvement
% of PCTs by CHO, that can evidence service user involvement as required by Action 19 of the Primary Care Strategy – A New Direction (2001)
NSP Quality Q Q3 System wide New PI 2016 100% CHO 100% 100% 100% 100% 100% 100% 100% 100% 100%
Serious Reportable Events
% of Serious Reportable Events being notified within 24 hours to the Senior Accountable Officer (mandatory) and entered on the National Incident Management System (NIMS)*
NSP Quality M System wide New PI 2016 99% CHO 99% 99% 99% 99% 99% 99% 99% 99% 99%
% of investigations completed within 120 days of event occurrence)
NSP Quality M System wide New PI 2016 90% CHO 90% 90% 90% 90% 90% 90% 90% 90% 90%
Safety Incidence Reporting
% of Safety Incidents being entered on the National Incident Management System (NIMS) within 30 days of occurrence
NSP Quality Q System wide New PI 2016 90% CHO 90% 90% 90% 90% 90% 90% 90% 90% 90%
% of claims received by State Claims Agency that were not reported previously as an incident
NSP Quality A System wide New PI 2016 New PI 2016 CHO New PI 2016
New PI 2016
New PI 2016
New PI 2016
New PI 2016
New PI 2016
New PI 2016
New PI 2016
New PI 2016
* All incidents including SREs are to be reported on NIMS. Until IIMS has been formally stood down, all SREs must also be reported onto the Incident Information Management System (IIMS)
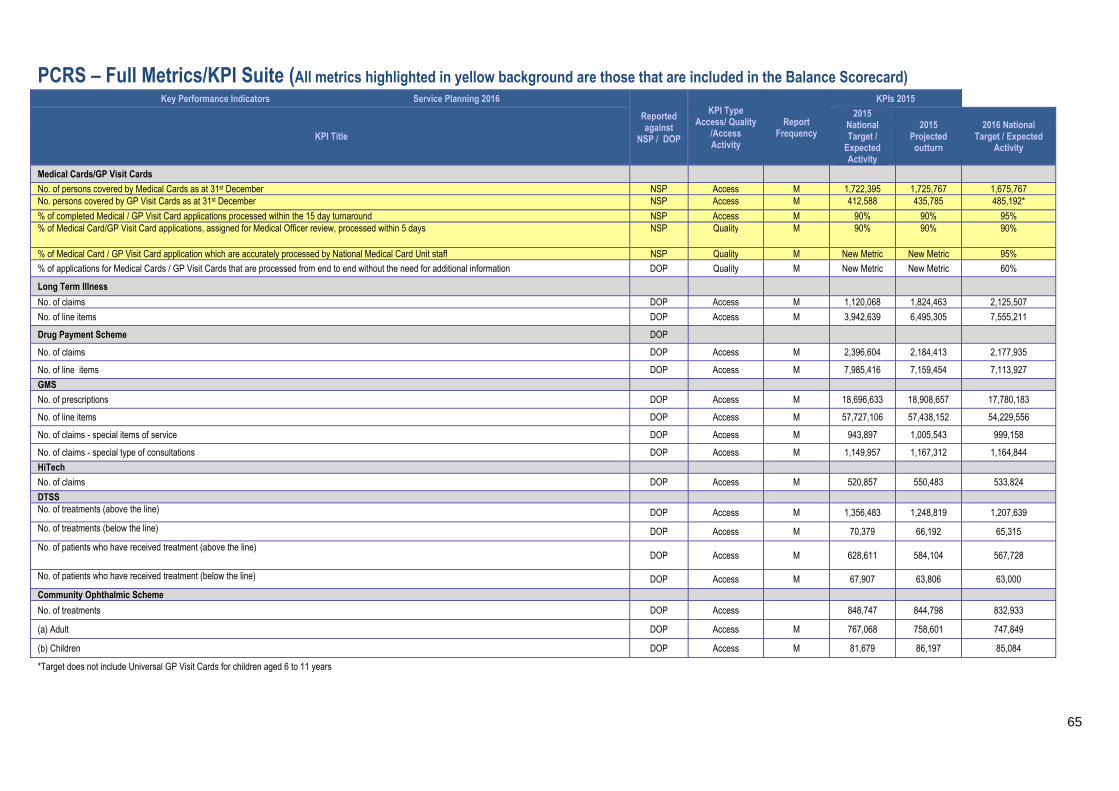
65
PCRS – Full Metrics/KPI Suite (All metrics highlighted in yellow background are those that are included in the Balance Scorecard) Key Performance Indicators Service Planning 2016
Reported against
NSP / DOP
KPI Type Access/ Quality
/Access Activity
Report Frequency
KPIs 2015
KPI Title
2015 National Target /
Expected Activity
2015 Projected outturn
2016 National Target / Expected
Activity
Medical Cards/GP Visit Cards
No. of persons covered by Medical Cards as at 31st December NSP Access M 1,722,395 1,725,767 1,675,767 No. persons covered by GP Visit Cards as at 31st December NSP Access M 412,588 435,785 485,192*
% of completed Medical / GP Visit Card applications processed within the 15 day turnaround NSP Access M 90% 90% 95% % of Medical Card/GP Visit Card applications, assigned for Medical Officer review, processed within 5 days NSP Quality
M 90% 90% 90%
% of Medical Card / GP Visit Card application which are accurately processed by National Medical Card Unit staff NSP Quality M New Metric New Metric 95%
% of applications for Medical Cards / GP Visit Cards that are processed from end to end without the need for additional information DOP Quality M New Metric New Metric 60%
Long Term Illness
No. of claims DOP Access M 1,120,068 1,824,463 2,125,507
No. of line items DOP Access M 3,942,639 6,495,305 7,555,211
Drug Payment Scheme DOP
No. of claims DOP Access M 2,396,604 2,184,413 2,177,935
No. of line items DOP Access M 7,985,416 7,159,454 7,113,927
GMS
No. of prescriptions DOP Access M 18,696,633 18,908,657 17,780,183
No. of line items DOP Access M 57,727,106 57,438,152 54,229,556
No. of claims - special items of service DOP Access M 943,897 1,005,543 999,158
No. of claims - special type of consultations DOP Access M 1,149,957 1,167,312 1,164,844
HiTech
No. of claims DOP Access M 520,857 550,483 533,824
DTSS No. of treatments (above the line) DOP Access M 1,356,483 1,248,819 1,207,639
No. of treatments (below the line) DOP Access M 70,379 66,192 65,315
No. of patients who have received treatment (above the line) DOP Access M 628,611 584,104 567,728
No. of patients who have received treatment (below the line) DOP Access M 67,907 63,806 63,000
Community Ophthalmic Scheme
No. of treatments DOP Access 848,747 844,798 832,933
(a) Adult DOP Access M 767,068 758,601 747,849
(b) Children DOP Access M 81,679 86,197 85,084
*Target does not include Universal GP Visit Cards for children aged 6 to 11 years
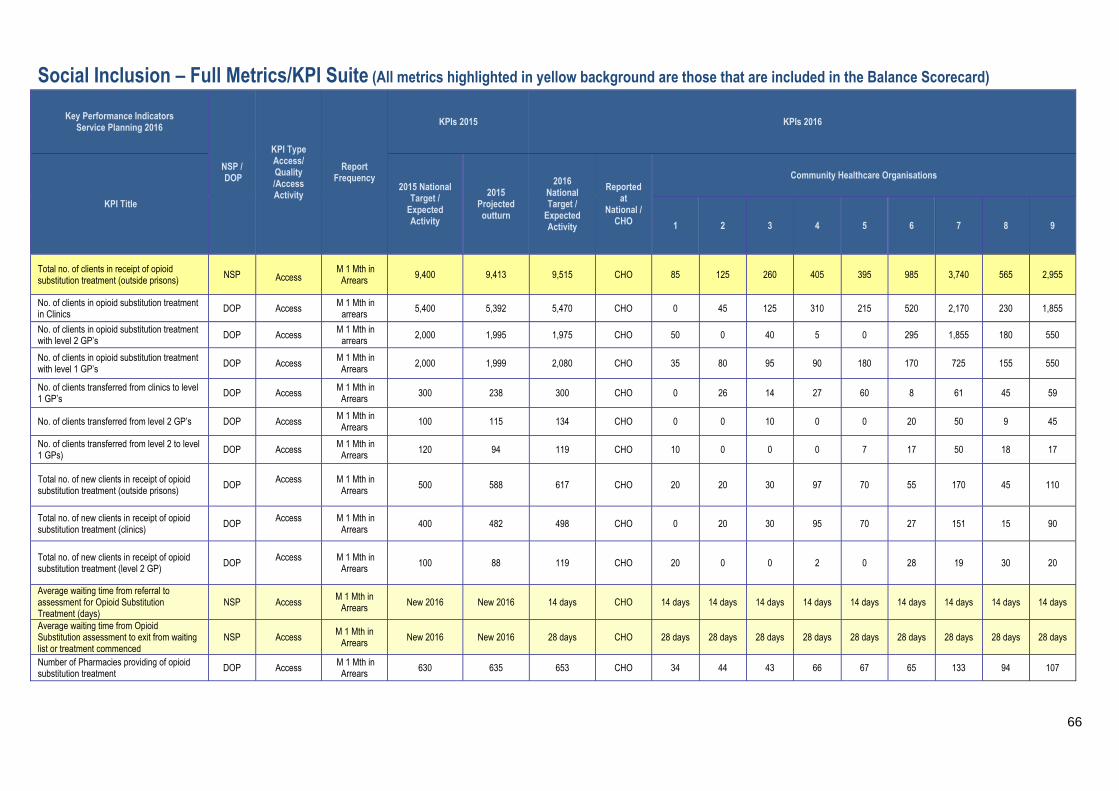
66
Social Inclusion – Full Metrics/KPI Suite (All metrics highlighted in yellow background are those that are included in the Balance Scorecard)
Key Performance Indicators Service Planning 2016
NSP / DOP
KPI Type Access/ Quality /Access Activity
Report Frequency
KPIs 2015 KPIs 2016
KPI Title
2015 National Target /
Expected Activity
2015 Projected outturn
2016 National Target /
Expected Activity
Reported at
National / CHO
Community Healthcare Organisations
1 2 3 4 5 6 7 8 9
Total no. of clients in receipt of opioid substitution treatment (outside prisons)
NSP Access
M 1 Mth in Arrears
9,400 9,413 9,515 CHO 85 125 260 405 395 985 3,740 565 2,955
No. of clients in opioid substitution treatment in Clinics
DOP Access M 1 Mth in arrears
5,400 5,392 5,470 CHO 0 45 125 310 215 520 2,170 230 1,855
No. of clients in opioid substitution treatment with level 2 GP’s
DOP Access M 1 Mth in arrears
2,000 1,995 1,975 CHO 50 0 40 5 0 295 1,855 180 550
No. of clients in opioid substitution treatment with level 1 GP’s
DOP Access M 1 Mth in
Arrears 2,000 1,999 2,080 CHO 35 80 95 90 180 170 725 155 550
No. of clients transferred from clinics to level 1 GP’s
DOP Access M 1 Mth in Arrears
300 238 300 CHO 0 26 14 27 60 8 61 45 59
No. of clients transferred from level 2 GP’s DOP Access M 1 Mth in
Arrears 100 115 134 CHO 0 0 10 0 0 20 50 9 45
No. of clients transferred from level 2 to level 1 GPs) DOP Access
M 1 Mth in Arrears 120 94 119 CHO 10 0 0 0 7 17 50 18 17
Total no. of new clients in receipt of opioid substitution treatment (outside prisons)
DOP Access
M 1 Mth in
Arrears 500 588 617 CHO 20 20 30 97 70 55 170 45 110
Total no. of new clients in receipt of opioid substitution treatment (clinics)
DOP Access
M 1 Mth in
Arrears 400 482 498 CHO 0 20 30 95 70 27 151 15 90
Total no. of new clients in receipt of opioid substitution treatment (level 2 GP) DOP
Access
M 1 Mth in Arrears 100 88 119 CHO 20 0 0 2 0 28 19 30 20
Average waiting time from referral to assessment for Opioid Substitution Treatment (days)
NSP Access M 1 Mth in
Arrears New 2016 New 2016 14 days CHO 14 days 14 days 14 days 14 days 14 days 14 days 14 days 14 days 14 days
Average waiting time from Opioid Substitution assessment to exit from waiting list or treatment commenced
NSP Access M 1 Mth in Arrears
New 2016 New 2016 28 days CHO 28 days 28 days 28 days 28 days 28 days 28 days 28 days 28 days 28 days
Number of Pharmacies providing of opioid substitution treatment
DOP Access M 1 Mth in Arrears
630 635 653 CHO 34 44 43 66 67 65 133 94 107
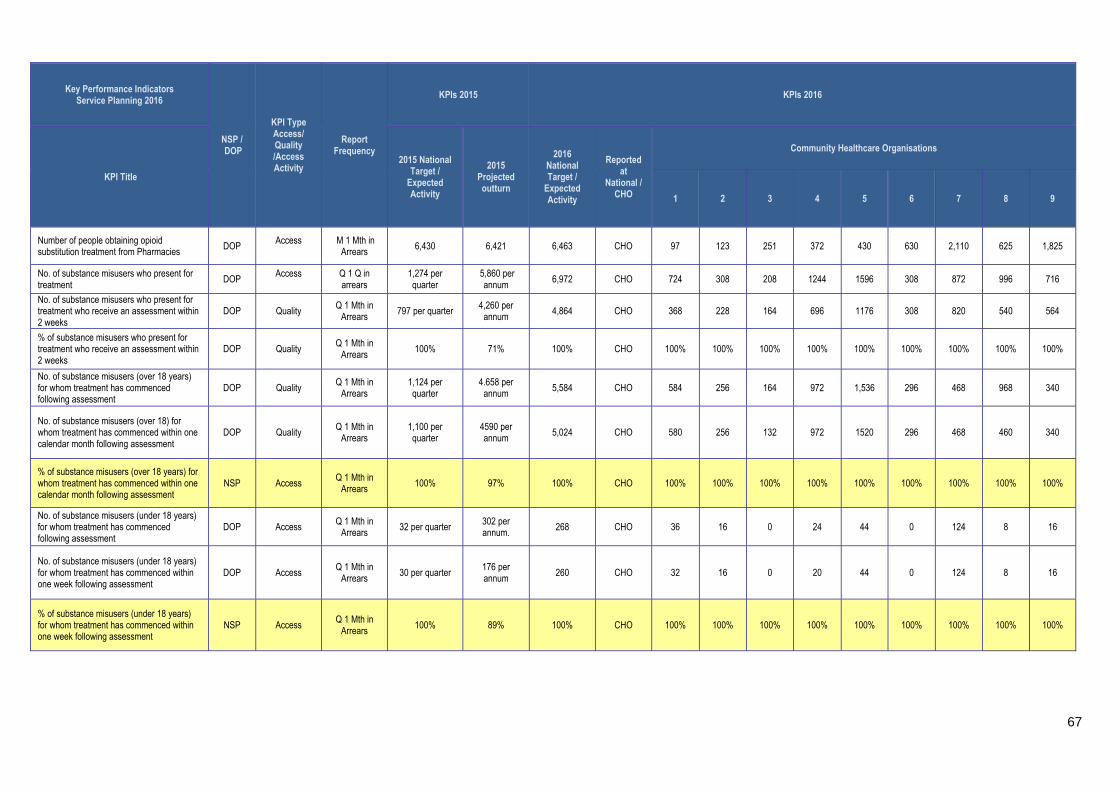
67
Key Performance Indicators Service Planning 2016
NSP / DOP
KPI Type Access/ Quality /Access Activity
Report Frequency
KPIs 2015 KPIs 2016
KPI Title
2015 National Target /
Expected Activity
2015 Projected outturn
2016 National Target /
Expected Activity
Reported at
National / CHO
Community Healthcare Organisations
1 2 3 4 5 6 7 8 9
Number of people obtaining opioid substitution treatment from Pharmacies DOP
Access
M 1 Mth in Arrears 6,430 6,421 6,463 CHO 97 123 251 372 430 630 2,110 625 1,825
No. of substance misusers who present for treatment
DOP Access
Q 1 Q in arrears
1,274 per quarter
5,860 per annum
6,972 CHO 724 308 208 1244 1596 308 872 996 716
No. of substance misusers who present for treatment who receive an assessment within 2 weeks
DOP Quality Q 1 Mth in Arrears
797 per quarter 4,260 per annum
4,864 CHO 368 228 164 696 1176 308 820 540 564
% of substance misusers who present for treatment who receive an assessment within 2 weeks
DOP Quality Q 1 Mth in
Arrears 100% 71% 100% CHO 100% 100% 100% 100% 100% 100% 100% 100% 100%
No. of substance misusers (over 18 years) for whom treatment has commenced following assessment
DOP Quality Q 1 Mth in
Arrears 1,124 per quarter
4.658 per annum 5,584 CHO 584 256 164 972 1,536 296 468 968 340
No. of substance misusers (over 18) for whom treatment has commenced within one calendar month following assessment
DOP Quality Q 1 Mth in Arrears
1,100 per quarter
4590 per annum
5,024 CHO 580 256 132 972 1520 296 468 460 340
% of substance misusers (over 18 years) for whom treatment has commenced within one calendar month following assessment
NSP Access Q 1 Mth in
Arrears 100% 97% 100% CHO 100% 100% 100% 100% 100% 100% 100% 100% 100%
No. of substance misusers (under 18 years) for whom treatment has commenced following assessment
DOP Access Q 1 Mth in Arrears
32 per quarter 302 per annum.
268 CHO 36 16 0 24 44 0 124 8 16
No. of substance misusers (under 18 years) for whom treatment has commenced within one week following assessment
DOP Access Q 1 Mth in
Arrears 30 per quarter
176 per annum
260 CHO 32 16 0 20 44 0 124 8 16
% of substance misusers (under 18 years) for whom treatment has commenced within one week following assessment
NSP Access Q 1 Mth in
Arrears 100% 89% 100% CHO 100% 100% 100% 100% 100% 100% 100% 100% 100%
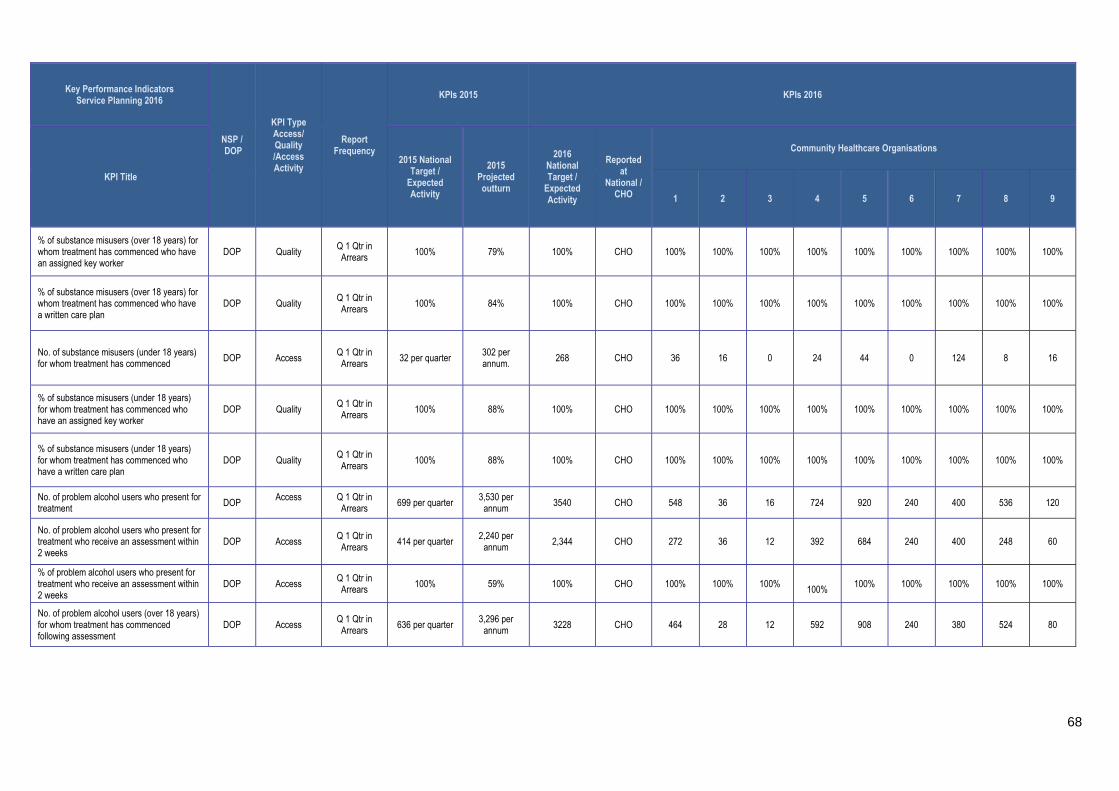
68
Key Performance Indicators Service Planning 2016
NSP / DOP
KPI Type Access/ Quality /Access Activity
Report Frequency
KPIs 2015 KPIs 2016
KPI Title
2015 National Target /
Expected Activity
2015 Projected outturn
2016 National Target /
Expected Activity
Reported at
National / CHO
Community Healthcare Organisations
1 2 3 4 5 6 7 8 9
% of substance misusers (over 18 years) for whom treatment has commenced who have an assigned key worker
DOP Quality Q 1 Qtr in Arrears 100% 79% 100% CHO 100% 100% 100% 100% 100% 100% 100% 100% 100%
% of substance misusers (over 18 years) for whom treatment has commenced who have a written care plan
DOP Quality Q 1 Qtr in Arrears
100% 84% 100% CHO 100% 100% 100% 100% 100% 100% 100% 100% 100%
No. of substance misusers (under 18 years) for whom treatment has commenced DOP Access
Q 1 Qtr in Arrears 32 per quarter
302 per annum. 268 CHO 36 16 0 24 44 0 124 8 16
% of substance misusers (under 18 years) for whom treatment has commenced who have an assigned key worker
DOP Quality Q 1 Qtr in Arrears 100% 88% 100% CHO 100% 100% 100% 100% 100% 100% 100% 100% 100%
% of substance misusers (under 18 years) for whom treatment has commenced who have a written care plan
DOP Quality Q 1 Qtr in Arrears
100% 88% 100% CHO 100% 100% 100% 100% 100% 100% 100% 100% 100%
No. of problem alcohol users who present for treatment DOP
Access
Q 1 Qtr in Arrears 699 per quarter
3,530 per annum 3540 CHO 548 36 16 724 920 240 400 536 120
No. of problem alcohol users who present for treatment who receive an assessment within 2 weeks
DOP Access Q 1 Qtr in Arrears
414 per quarter 2,240 per
annum 2,344 CHO 272 36 12 392 684 240 400 248 60
% of problem alcohol users who present for treatment who receive an assessment within 2 weeks
DOP Access Q 1 Qtr in Arrears 100% 59% 100% CHO 100% 100% 100%
100% 100% 100% 100% 100% 100%
No. of problem alcohol users (over 18 years) for whom treatment has commenced following assessment
DOP Access Q 1 Qtr in Arrears
636 per quarter 3,296 per
annum 3228 CHO 464 28 12 592 908 240 380 524 80
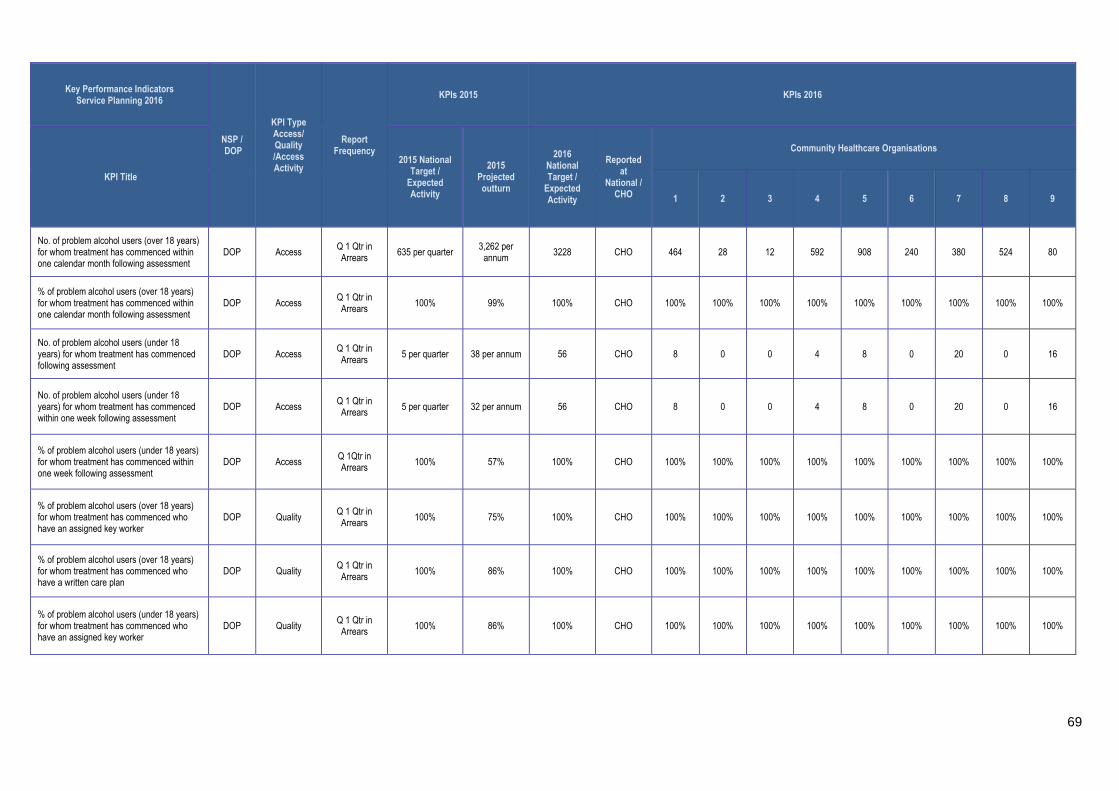
69
Key Performance Indicators Service Planning 2016
NSP / DOP
KPI Type Access/ Quality /Access Activity
Report Frequency
KPIs 2015 KPIs 2016
KPI Title
2015 National Target /
Expected Activity
2015 Projected outturn
2016 National Target /
Expected Activity
Reported at
National / CHO
Community Healthcare Organisations
1 2 3 4 5 6 7 8 9
No. of problem alcohol users (over 18 years) for whom treatment has commenced within one calendar month following assessment
DOP Access Q 1 Qtr in Arrears
635 per quarter 3,262 per
annum 3228 CHO 464 28 12 592 908 240 380 524 80
% of problem alcohol users (over 18 years) for whom treatment has commenced within one calendar month following assessment
DOP Access Q 1 Qtr in Arrears
100% 99% 100% CHO 100% 100% 100% 100% 100% 100% 100% 100% 100%
No. of problem alcohol users (under 18 years) for whom treatment has commenced following assessment
DOP Access Q 1 Qtr in Arrears
5 per quarter 38 per annum 56 CHO 8 0 0 4 8 0 20 0 16
No. of problem alcohol users (under 18 years) for whom treatment has commenced within one week following assessment
DOP Access Q 1 Qtr in Arrears
5 per quarter 32 per annum 56 CHO 8 0 0 4 8 0 20 0 16
% of problem alcohol users (under 18 years) for whom treatment has commenced within one week following assessment
DOP Access Q 1Qtr in Arrears
100% 57% 100% CHO 100% 100% 100% 100% 100% 100% 100% 100% 100%
% of problem alcohol users (over 18 years) for whom treatment has commenced who have an assigned key worker
DOP Quality Q 1 Qtr in Arrears
100% 75% 100% CHO 100% 100% 100% 100% 100% 100% 100% 100% 100%
% of problem alcohol users (over 18 years) for whom treatment has commenced who have a written care plan
DOP Quality Q 1 Qtr in Arrears
100% 86% 100% CHO 100% 100% 100% 100% 100% 100% 100% 100% 100%
% of problem alcohol users (under 18 years) for whom treatment has commenced who have an assigned key worker
DOP Quality Q 1 Qtr in Arrears
100% 86% 100% CHO 100% 100% 100% 100% 100% 100% 100% 100% 100%
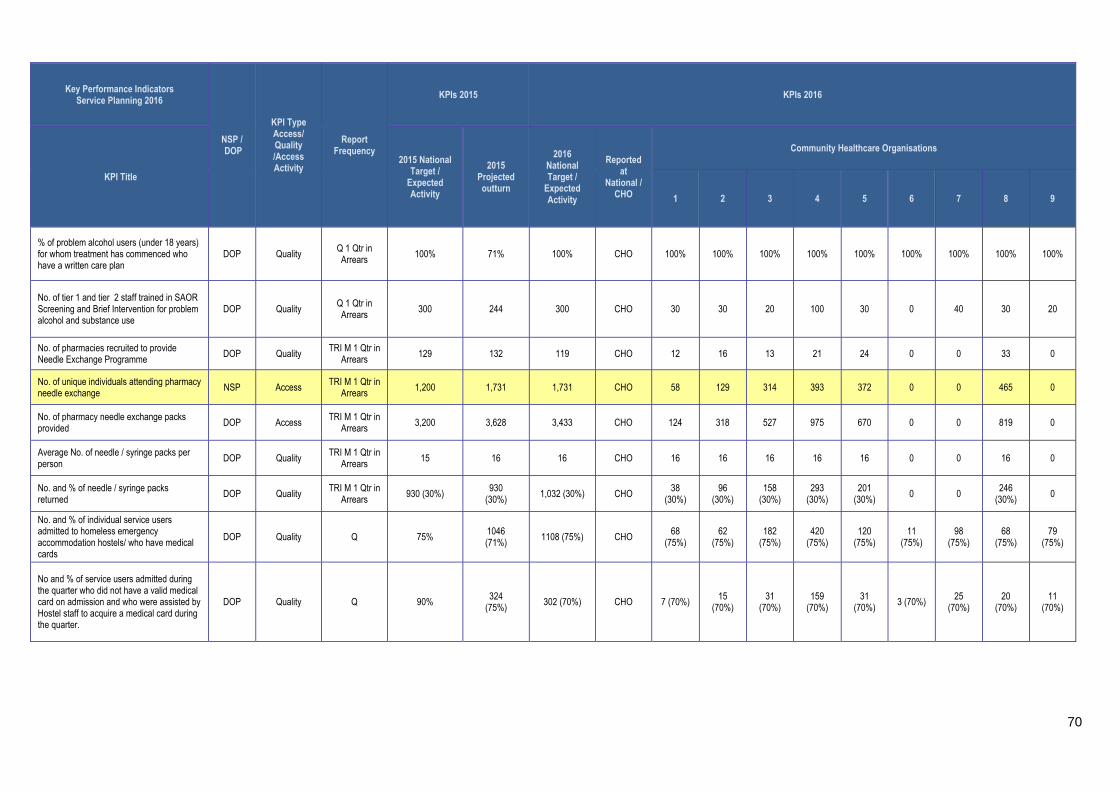
70
Key Performance Indicators Service Planning 2016
NSP / DOP
KPI Type Access/ Quality /Access Activity
Report Frequency
KPIs 2015 KPIs 2016
KPI Title
2015 National Target /
Expected Activity
2015 Projected outturn
2016 National Target /
Expected Activity
Reported at
National / CHO
Community Healthcare Organisations
1 2 3 4 5 6 7 8 9
% of problem alcohol users (under 18 years) for whom treatment has commenced who have a written care plan
DOP Quality Q 1 Qtr in Arrears
100% 71% 100% CHO 100% 100% 100% 100% 100% 100% 100% 100% 100%
No. of tier 1 and tier 2 staff trained in SAOR Screening and Brief Intervention for problem alcohol and substance use
DOP Quality Q 1 Qtr in Arrears
300 244 300 CHO 30 30 20 100 30 0 40 30 20
No. of pharmacies recruited to provide Needle Exchange Programme
DOP Quality TRI M 1 Qtr in Arrears
129 132 119 CHO 12 16 13 21 24 0 0 33 0
No. of unique individuals attending pharmacy needle exchange
NSP Access TRI M 1 Qtr in Arrears
1,200 1,731 1,731 CHO 58 129 314 393 372 0 0 465 0
No. of pharmacy needle exchange packs provided
DOP Access TRI M 1 Qtr in
Arrears 3,200 3,628 3,433 CHO 124 318 527 975 670 0 0 819 0
Average No. of needle / syringe packs per person
DOP Quality TRI M 1 Qtr in
Arrears 15 16 16 CHO 16 16 16 16 16 0 0 16 0
No. and % of needle / syringe packs returned
DOP Quality TRI M 1 Qtr in
Arrears 930 (30%)
930 (30%)
1,032 (30%) CHO 38
(30%) 96
(30%) 158
(30%) 293
(30%) 201
(30%) 0 0
246 (30%)
0
No. and % of individual service users admitted to homeless emergency accommodation hostels/ who have medical cards
DOP Quality Q 75% 1046 (71%)
1108 (75%) CHO 68
(75%) 62
(75%) 182
(75%) 420
(75%) 120
(75%) 11
(75%) 98
(75%) 68
(75%) 79
(75%)
No and % of service users admitted during the quarter who did not have a valid medical card on admission and who were assisted by Hostel staff to acquire a medical card during the quarter.
DOP Quality Q 90% 324 (75%)
302 (70%) CHO 7 (70%) 15 (70%)
31 (70%)
159 (70%)
31 (70%)
3 (70%) 25 (70%)
20 (70%)
11 (70%)
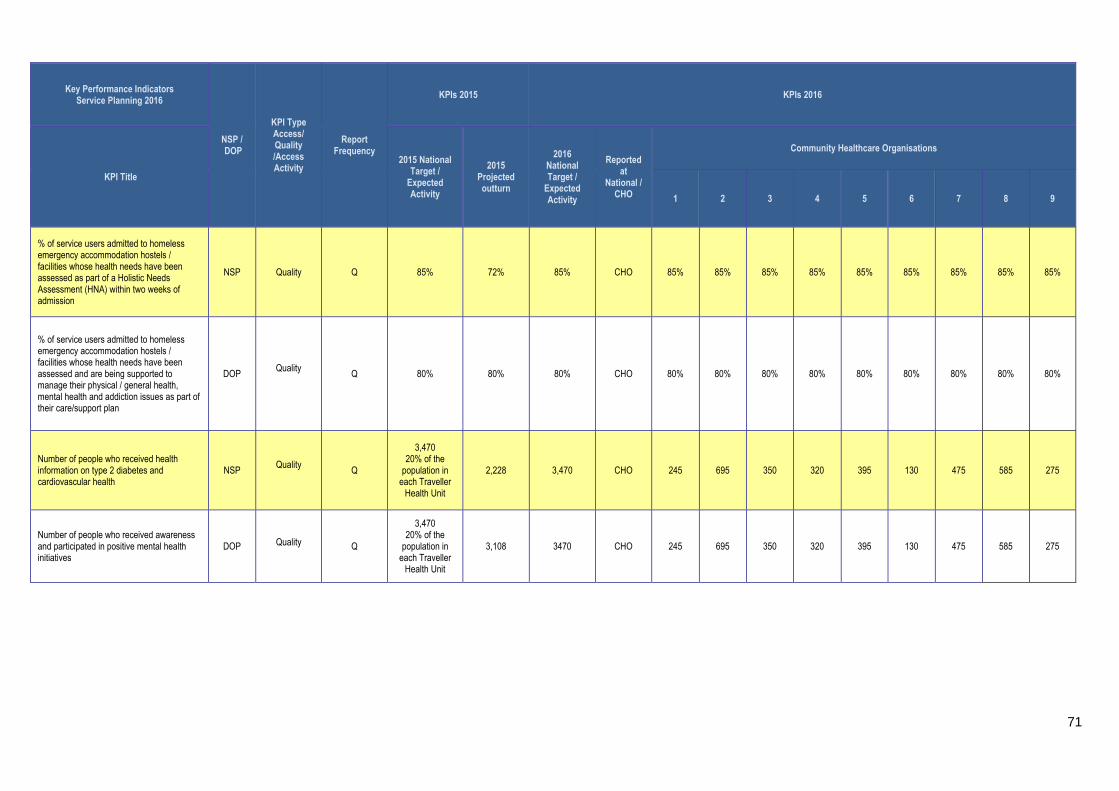
71
Key Performance Indicators Service Planning 2016
NSP / DOP
KPI Type Access/ Quality /Access Activity
Report Frequency
KPIs 2015 KPIs 2016
KPI Title
2015 National Target /
Expected Activity
2015 Projected outturn
2016 National Target /
Expected Activity
Reported at
National / CHO
Community Healthcare Organisations
1 2 3 4 5 6 7 8 9
% of service users admitted to homeless emergency accommodation hostels / facilities whose health needs have been assessed as part of a Holistic Needs Assessment (HNA) within two weeks of admission
NSP Quality Q 85% 72% 85% CHO 85% 85% 85% 85% 85% 85% 85% 85% 85%
% of service users admitted to homeless emergency accommodation hostels / facilities whose health needs have been assessed and are being supported to manage their physical / general health, mental health and addiction issues as part of their care/support plan
DOP
Quality
Q 80% 80% 80% CHO 80% 80% 80% 80% 80% 80% 80% 80% 80%
Number of people who received health information on type 2 diabetes and cardiovascular health
NSP
Quality
Q
3,470 20% of the
population in each Traveller
Health Unit
2,228 3,470 CHO 245 695 350 320 395 130 475 585 275
Number of people who received awareness and participated in positive mental health initiatives
DOP Quality
Q
3,470 20% of the
population in each Traveller
Health Unit
3,108 3470 CHO 245 695 350 320 395 130 475 585 275

72
Palliative Care – Full Metrics/KPI Suite (All metrics highlighted in yellow background are those that are included in the Balance Scorecard)
Key Performance Indicators Service Planning 2016
NSP / DOP
KPI Type Access/ Quality /Access Activity
Report Frequency
KPIs 2015 KPIs 2016
KPI Title
2015 National Target /
Expected Activity
2015 Projected outturn
2016 National Target /
Expected Activity
Reported at National/ CHO / HG
Level
CHO1 CHO2 CHO3 CHO4 CHO5 CHO6 CHO7 CHO8 CHO9
Inpatient Palliative Care Services
Access to specialist inpatient bed within 7 days (during the reporting month)
NSP Access M 98% 98% 98% CHO 98% 98% 98% 98% 98% 98% 98% 98% 98%
Access to specialist palliative care inpatient bed from 8 to14 days (during the reporting month)
DOP Access M New metric
2016 New metric
2016 New metric
2016 CHO 2% 2% 2% 2% 2% 2% 2% 2% 2%
Total number of referrals for specialist inpatient Palliative care services received DOP
Access /Activity M
New metric 2016
New metric 2016
New metric 2016 CHO
New metric
New metric
New metric
New metric
New metric
New metric
New metric
New metric
New metric
Total number of referrals deemed appropriate for admission - cancer DOP
Access /Activity M
New metric 2016
New metric 2016
New metric 2016 CHO
New metric
New metric
New metric
New metric
New metric
New metric
New metric
New metric
New metric
Total number of referrals deemed appropriate for admission - non cancer DOP
Access /Activity M
New metric 2016
New metric 2016
New metric 2016 CHO
New metric
New metric
New metric
New metric
New metric
New metric
New metric
New metric
New metric
No. of patients in receipt of treatment in specialist palliative care inpatient units (during the reporting month)
DOP Access /Activity
M 445 429 474 CHO 41 55 70 97 13 31 82 0 85
No. of new patients seen or admitted to the specialist palliative care service (monthly cumulative)
DOP Access /Activity
M 2,752 2,633 2,877 CHO 270 304 400 616 111 170 496 0 510
No. of admissions to specialist palliative care inpatient units (monthly cumulative) DOP
Access /Activity
M 3,177 3,403 3,310 CHO 311 350 460 708 128 196 570 0 587
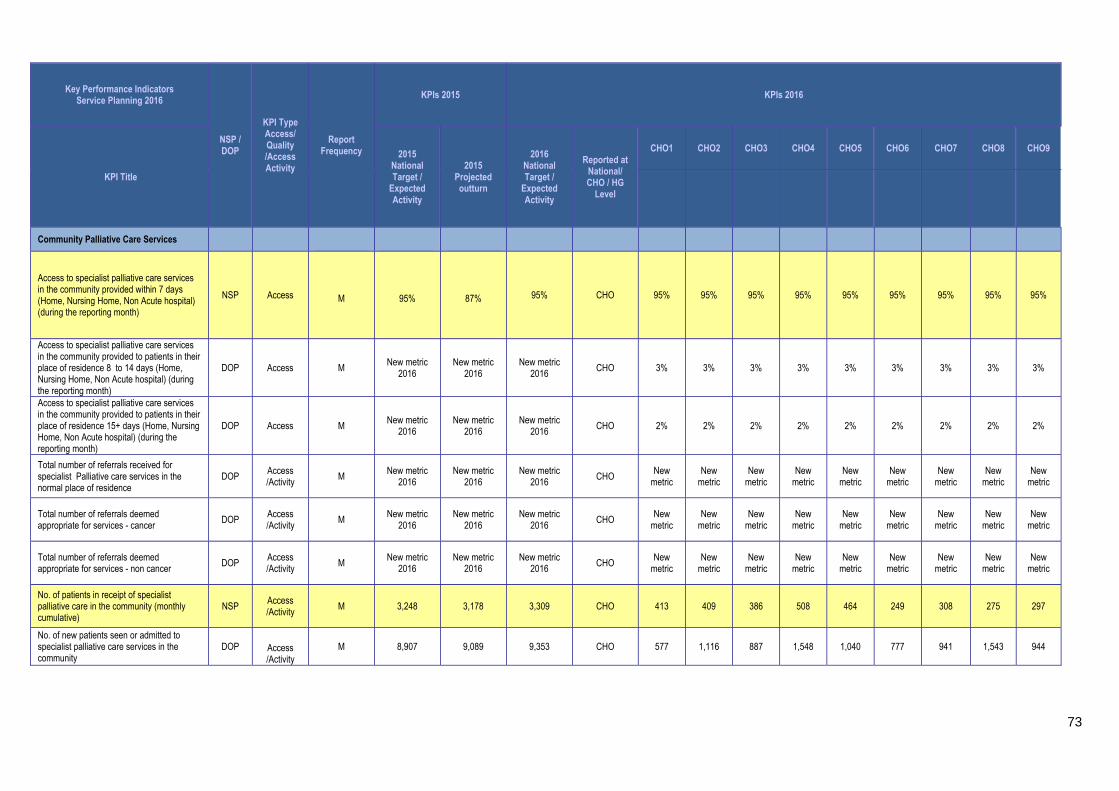
73
Key Performance Indicators Service Planning 2016
NSP / DOP
KPI Type Access/ Quality /Access Activity
Report Frequency
KPIs 2015 KPIs 2016
KPI Title
2015 National Target /
Expected Activity
2015 Projected outturn
2016 National Target /
Expected Activity
Reported at National/ CHO / HG
Level
CHO1 CHO2 CHO3 CHO4 CHO5 CHO6 CHO7 CHO8 CHO9
Community Palliative Care Services
Access to specialist palliative care services in the community provided within 7 days (Home, Nursing Home, Non Acute hospital) (during the reporting month)
NSP Access M
95%
87%
95% CHO 95% 95% 95% 95% 95% 95% 95% 95% 95%
Access to specialist palliative care services in the community provided to patients in their place of residence 8 to 14 days (Home, Nursing Home, Non Acute hospital) (during the reporting month)
DOP Access M New metric
2016 New metric
2016 New metric
2016 CHO 3% 3% 3% 3% 3% 3% 3% 3% 3%
Access to specialist palliative care services in the community provided to patients in their place of residence 15+ days (Home, Nursing Home, Non Acute hospital) (during the reporting month)
DOP Access M New metric
2016 New metric
2016 New metric
2016 CHO 2% 2% 2% 2% 2% 2% 2% 2% 2%
Total number of referrals received for specialist Palliative care services in the normal place of residence
DOP Access /Activity M
New metric 2016
New metric 2016
New metric 2016 CHO
New metric
New metric
New metric
New metric
New metric
New metric
New metric
New metric
New metric
Total number of referrals deemed appropriate for services - cancer
DOP Access /Activity
M New metric
2016 New metric
2016 New metric
2016 CHO
New metric
New metric
New metric
New metric
New metric
New metric
New metric
New metric
New metric
Total number of referrals deemed appropriate for services - non cancer DOP
Access /Activity M
New metric 2016
New metric 2016
New metric 2016 CHO
New metric
New metric
New metric
New metric
New metric
New metric
New metric
New metric
New metric
No. of patients in receipt of specialist palliative care in the community (monthly cumulative)
NSP Access /Activity
M 3,248 3,178 3,309 CHO 413 409 386 508 464 249 308 275 297
No. of new patients seen or admitted to specialist palliative care services in the community
DOP Access /Activity
M 8,907 9,089 9,353 CHO 577 1,116 887 1,548 1,040 777 941 1,543 944
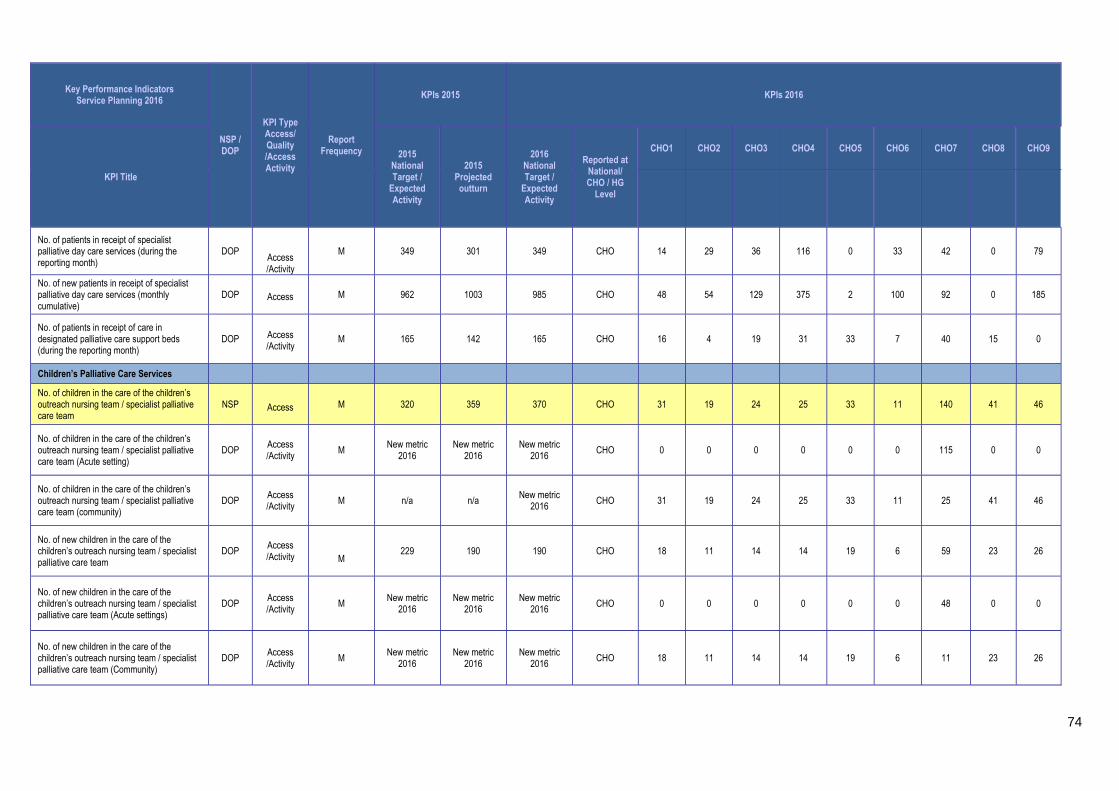
74
Key Performance Indicators Service Planning 2016
NSP / DOP
KPI Type Access/ Quality /Access Activity
Report Frequency
KPIs 2015 KPIs 2016
KPI Title
2015 National Target /
Expected Activity
2015 Projected outturn
2016 National Target /
Expected Activity
Reported at National/ CHO / HG
Level
CHO1 CHO2 CHO3 CHO4 CHO5 CHO6 CHO7 CHO8 CHO9
No. of patients in receipt of specialist palliative day care services (during the reporting month)
DOP Access /Activity
M 349 301 349 CHO 14 29 36 116 0 33 42 0 79
No. of new patients in receipt of specialist palliative day care services (monthly cumulative)
DOP Access
M 962 1003 985 CHO 48 54 129 375 2 100 92 0 185
No. of patients in receipt of care in designated palliative care support beds (during the reporting month)
DOP Access /Activity
M 165 142 165 CHO 16 4 19 31 33 7 40 15 0
Children’s Palliative Care Services
No. of children in the care of the children’s outreach nursing team / specialist palliative care team
NSP Access
M 320 359 370 CHO 31 19 24 25 33 11 140 41 46
No. of children in the care of the children’s outreach nursing team / specialist palliative care team (Acute setting)
DOP Access /Activity
M New metric
2016 New metric
2016 New metric
2016 CHO 0 0 0 0 0 0 115 0 0
No. of children in the care of the children’s outreach nursing team / specialist palliative care team (community)
DOP Access /Activity M n/a n/a
New metric 2016 CHO 31 19 24 25 33 11 25 41 46
No. of new children in the care of the children’s outreach nursing team / specialist palliative care team
DOP Access /Activity M
229 190 190 CHO 18 11 14 14 19 6 59 23 26
No. of new children in the care of the children’s outreach nursing team / specialist palliative care team (Acute settings)
DOP Access /Activity M
New metric 2016
New metric 2016
New metric 2016 CHO 0 0 0 0 0 0 48 0 0
No. of new children in the care of the children’s outreach nursing team / specialist palliative care team (Community)
DOP Access /Activity
M New metric
2016 New metric
2016 New metric
2016 CHO 18 11 14 14 19 6 11 23 26

75
Key Performance Indicators Service Planning 2016
NSP / DOP
KPI Type Access/ Quality /Access Activity
Report Frequency
KPIs 2015 KPIs 2016
KPI Title
2015 National Target /
Expected Activity
2015 Projected outturn
2016 National Target /
Expected Activity
Reported at National/ CHO / HG
Level
CHO1 CHO2 CHO3 CHO4 CHO5 CHO6 CHO7 CHO8 CHO9
Total number of new referrals for inpatient services seen by the specialist palliative care team
DOP Access /Activity
M
n/a
486
Expected activity to be determined
CHO Baseline to be determined
Specialist palliative care services provided in the acute setting for new patients and re referral within 2 days
DOP Quality M
n/a 93% Target to be determined CHO Baseline to be determined
Bereavement Services
Total number of family units who received bereavement services
DOP Access /Activity M
n/a 621 621 CHO New
metric New
metric New
metric New
metric New
metric New
metric New
metric New
metric New
metric
% patients triaged within 1 working day of referral (acute service) NSP
Quality
M 2016 Q4 Reporting
New metric 2016
New metric 2016 90% CHO 90% 90% 90% 90% 90% 90% 90% 90% 90%
% patients with a multidisciplinary care plan documented within 5 working days of initial review
NSP Quality
M 2016 Q4 Reporting
New metric 2016
New metric 2016
90% CHO 90% 90% 90% 90% 90% 90% 90% 90% 90%
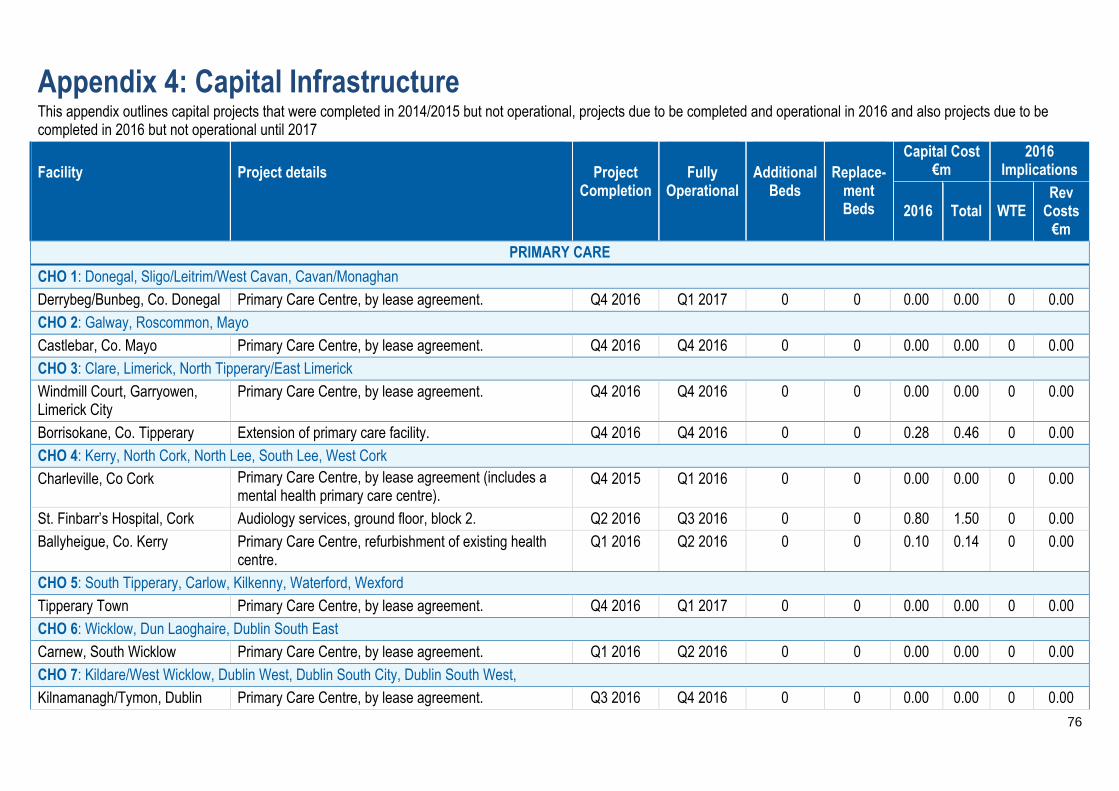
76
Appendix 4: Capital Infrastructure This appendix outlines capital projects that were completed in 2014/2015 but not operational, projects due to be completed and operational in 2016 and also projects due to be completed in 2016 but not operational until 2017 Facility
Project details
Project
Completion
Fully
Operational
Additional
Beds
Replace-
ment Beds
Capital Cost €m
2016 Implications
2016 Total WTE Rev
Costs €m
PRIMARY CARE
CHO 1: Donegal, Sligo/Leitrim/West Cavan, Cavan/Monaghan
Derrybeg/Bunbeg, Co. Donegal Primary Care Centre, by lease agreement. Q4 2016 Q1 2017 0 0 0.00 0.00 0 0.00
CHO 2: Galway, Roscommon, Mayo
Castlebar, Co. Mayo Primary Care Centre, by lease agreement. Q4 2016 Q4 2016 0 0 0.00 0.00 0 0.00
CHO 3: Clare, Limerick, North Tipperary/East Limerick
Windmill Court, Garryowen, Limerick City
Primary Care Centre, by lease agreement. Q4 2016 Q4 2016 0 0 0.00 0.00 0 0.00
Borrisokane, Co. Tipperary Extension of primary care facility. Q4 2016 Q4 2016 0 0 0.28 0.46 0 0.00
CHO 4: Kerry, North Cork, North Lee, South Lee, West Cork
Charleville, Co Cork Primary Care Centre, by lease agreement (includes a mental health primary care centre).
Q4 2015 Q1 2016 0 0 0.00 0.00 0 0.00
St. Finbarr’s Hospital, Cork Audiology services, ground floor, block 2. Q2 2016 Q3 2016 0 0 0.80 1.50 0 0.00
Ballyheigue, Co. Kerry Primary Care Centre, refurbishment of existing health centre.
Q1 2016 Q2 2016 0 0 0.10 0.14 0 0.00
CHO 5: South Tipperary, Carlow, Kilkenny, Waterford, Wexford
Tipperary Town Primary Care Centre, by lease agreement. Q4 2016 Q1 2017 0 0 0.00 0.00 0 0.00
CHO 6: Wicklow, Dun Laoghaire, Dublin South East
Carnew, South Wicklow Primary Care Centre, by lease agreement. Q1 2016 Q2 2016 0 0 0.00 0.00 0 0.00
CHO 7: Kildare/West Wicklow, Dublin West, Dublin South City, Dublin South West,
Kilnamanagh/Tymon, Dublin Primary Care Centre, by lease agreement. Q3 2016 Q4 2016 0 0 0.00 0.00 0 0.00
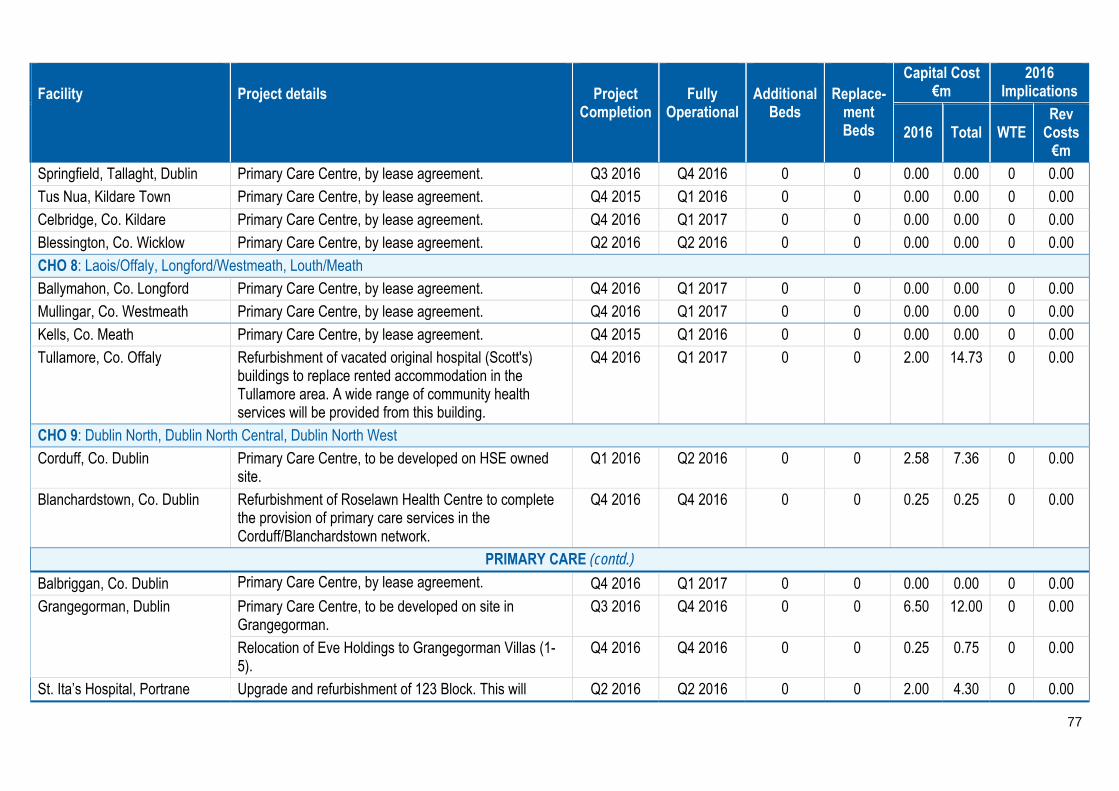
77
Facility
Project details
Project
Completion
Fully
Operational
Additional
Beds
Replace-
ment Beds
Capital Cost €m
2016 Implications
2016 Total WTE Rev
Costs €m
Springfield, Tallaght, Dublin Primary Care Centre, by lease agreement. Q3 2016 Q4 2016 0 0 0.00 0.00 0 0.00
Tus Nua, Kildare Town Primary Care Centre, by lease agreement. Q4 2015 Q1 2016 0 0 0.00 0.00 0 0.00
Celbridge, Co. Kildare Primary Care Centre, by lease agreement. Q4 2016 Q1 2017 0 0 0.00 0.00 0 0.00
Blessington, Co. Wicklow Primary Care Centre, by lease agreement. Q2 2016 Q2 2016 0 0 0.00 0.00 0 0.00
CHO 8: Laois/Offaly, Longford/Westmeath, Louth/Meath
Ballymahon, Co. Longford Primary Care Centre, by lease agreement. Q4 2016 Q1 2017 0 0 0.00 0.00 0 0.00
Mullingar, Co. Westmeath Primary Care Centre, by lease agreement. Q4 2016 Q1 2017 0 0 0.00 0.00 0 0.00
Kells, Co. Meath Primary Care Centre, by lease agreement. Q4 2015 Q1 2016 0 0 0.00 0.00 0 0.00
Tullamore, Co. Offaly Refurbishment of vacated original hospital (Scott's) buildings to replace rented accommodation in the Tullamore area. A wide range of community health services will be provided from this building.
Q4 2016 Q1 2017 0 0 2.00 14.73 0 0.00
CHO 9: Dublin North, Dublin North Central, Dublin North West
Corduff, Co. Dublin Primary Care Centre, to be developed on HSE owned site.
Q1 2016 Q2 2016 0 0 2.58 7.36 0 0.00
Blanchardstown, Co. Dublin Refurbishment of Roselawn Health Centre to complete the provision of primary care services in the Corduff/Blanchardstown network.
Q4 2016 Q4 2016 0 0 0.25 0.25 0 0.00
PRIMARY CARE (contd.)
Balbriggan, Co. Dublin Primary Care Centre, by lease agreement. Q4 2016 Q1 2017 0 0 0.00 0.00 0 0.00
Grangegorman, Dublin Primary Care Centre, to be developed on site in Grangegorman.
Q3 2016 Q4 2016 0 0 6.50 12.00 0 0.00
Relocation of Eve Holdings to Grangegorman Villas (1-5).
Q4 2016 Q4 2016 0 0 0.25 0.75 0 0.00
St. Ita’s Hospital, Portrane Upgrade and refurbishment of 123 Block. This will Q2 2016 Q2 2016 0 0 2.00 4.30 0 0.00
78
Facility
Project details
Project
Completion
Fully
Operational
Additional
Beds
Replace-
ment Beds
Capital Cost €m
2016 Implications
2016 Total WTE Rev
Costs €m
facilitate the provision of Coolock Primary Care Centre, a European Institute of Innovation and Technology Centre and accommodate services currently in rented accommodation and accommodate staff currently in Coolock Health Centre.
79
Accountability Framework Introduction The HSE is the statutory body tasked with responsibility for the delivery of health and personal social care services in Ireland. In discharging its public accountabilities, it has in place a Governance Framework covering corporate, clinical and financial governance. While the HSE’s primary accountability is to the Minister of Health, it has a range of other accountability obligations to the Oireachtas and to its Regulators. The Primary Care Division recognises the critical importance of good governance and of continually enhancing its accountability arrangements. During 2015, the HSE strengthened its overall accountability arrangements and put in place a new Accountability Framework. This enhanced governance and accountability framework was implemented by the Primary Care Division and made explicit the responsibilities of all managers, including primary care managers, to deliver the targets set out in the National Service Plan and the Primary Care Division Operational Plan. The Accountability Framework describes in detail the means by which the HSE, and in particular Hospital Groups and Community Healthcare Organisations, was held to account in 2015. 2015 was the first year of operation of the new Accountability Framework. The Framework has been updated for 2016 to ensure its operation, effectiveness and application best meets the evolving needs of the organisation and drives overall performance improvement. A formal review of the Framework was commissioned and completed in 2015, focusing on the operation of the Framework during its first year of operation. Proposed recommendations for further enhancement from the review will be implemented early in 2016.
Accountability Levels There are 5 main levels covered by the Accountability Framework. These are the accountability of the: Level 1 Accountability: The HSEs accountability through the Directorate to the Minister for Health. Level 2 Accountability: The Director General’s accountability to the Directorate. Level 3 Accountability: National Directors accountability to the Director General. Level 4 Accountability: Hospital Group CEOs to the National Director Acute Hospitals and CHO Chief Officers to
the National Directors for Community Services. Level 5 Accountability: Service Managers accountability to the relevant Hospital Group CEO or CHO Chief Officer
and Section 38 and Section 39 funded agencies accountability to the relevant Hospital Group CEOs and CHO Chief Officers.
Accountability Suite (Plans, Agreements and Reports) The National Service Plan is the contract between the HSE and the Minister, against which the HSE’s performance is measured. A National (inclusive of divisional data and commentary) Performance Assurance Report is produced on a monthly basis which is provided to the Minister for Health and subsequently published. An Annual Report is also produced. A key feature of the Accountability Framework was the introduction in 2015 of formal Performance Agreements. During 2016 the monitoring and management of the NSP and Operational Plans will be strengthened through the Performance Agreements which will explicitly link accountability for the delivery of the HSE’s plans to managers at each level of the organisation. These Agreements were put in place as follows: The National Director Performance Agreement between the Director General and each National Director for
services. The Hospital Group CEO Performance Agreement between the National Director Acute Hospitals and each
Hospital Group CEO.
80
A single CHO Chief Officer Performance Agreement (covering all community service Divisions) between the four National Directors for Primary Care, Social Care, Mental Health and Health and Wellbeing and each of the CHO Chief Officers.
Accountability Processes The Executive Management Committee for Community Healthcare, comprising of the four National Directors (i.e. Primary Care, Social Care, Mental Health and Health and Wellbeing) was established in 2015 and will continue in its current form in 2016. During 2015 the National Director for Social Care was appointed by the Director General to chair the committee. These arrangements will remain in place in 2016.
Accountability Processes During 2015, the National Performance Oversight Group (NPOG) was established (subgroup of the Directorate). This remit of this group is underpinned by the Accountability Framework and is the principal planning and performance assurance governance group within the HSE. The National Director for the Primary Care Division has monthly engagements with this group and provides reports, commentary, plans (including developmental and/corrective measures plans) to this group on behalf of Divisional service/projects/issues. The main outputs from the NPOG include: Monthly National Performance Assurance Report for submission by the Directorate to the Minister. Formal escalation of performance issues to the Director General by the Deputy Director General.
Escalation, Interventions and Sanctions One of the key elements of the strengthened Accountability Framework is the requirements for Managers at each level to ensure that any issues of underperformance are identified and addressed at the level where they occur. Where there are issues of persistent underperformance (in any quadrant of the Balance Scorecard) the HSE, or Division, implements a formal Performance Escalation, Support and Intervention Process as part of the Accountability Framework. The process includes: Responsibilities at each level for performance and escalation. The thresholds and tolerances for underperforming services at each level. The type of supports and interventions to be taken at each level of escalation.
The National Director for the Primary Care Division has agreed the escalation thresholds for the targets set out in the Primary Care Division Balance Scorecard.