online simulation of gas distribution networks simulation of gas distribution networks fig. 2-1: the...
TRANSCRIPT

9th SIMONE Congress, October 15-17, 2008, Dubrownik, Croatia
Online simulation of gas distribution networks
Peter Aymanns, Stadtwerke Düsseldorf Netz GmbH, DüsseldorfAndreas Stolte, Dirk Wilms, Wolfgang Dörner, PSI AG, Aschaffenburg
Online simulation, state estimator, look ahead simulation, load model adaptation, distribution systems, GIS integration, SCADA integration
The integration of online network status simulation in SCADA systems improves the management of gas distribution networks. Supply shortages can be detected early. The consequences of valve closing or different demand situations can be simulated.
The online simulation functions comprise a state estimation with the adaptation of the load model and a look ahead simulation. Simulations are seamlessly integrated with the SCADA system. Pipes and network equipment are imported from a geographic information system.
The state estimator calculates the present flow situation. Pressures, flows and the distribution of qualities are computed and provide additional information required to supervise the gas network. Thus, information on locations without measurement is available. This provides a consistent overview of the network state. Inaccurate measurements can be detected.
The look ahead simulation provides for checking the network behaviour before a switching operation is carried out and can help to optimize the operations. Thus, maintenance and repair activities can be planned more easily and carried out faster.
The dispatchers are supported by the possibilities of network visualisation. This gives them a new range of views of the distribution network by providing qualitative as well as quantitative views. The network views are geographically oriented and periodically imported from a geographic information system (GIS).
1. Introduction and overview
Stadtwerke Düsseldorf Netz GmbH manages the distribution systems for electricity, gas, water and district heating from one combined energies control room.There are online network calculation functionalities available for each energy sector of the combined energies network control system.By looking at the gas sector, section 2 and 3 of this paper show the motivation to integrate network calculations for pipelines into the control system from an operational point of view.The solution as implemented in the PSIcontrol network control system of PSI AG is described in Sections 4 and 5. Section 6 contains an introduction to the most important applications of online calculations for pipe-based networks. Last-but-not-least Section 7 provides reference applications showing how the laid out approach may be transferred to other pipe-based networks.
simone_congress_2008_aymanns_stolte_wilms_doerner Page 1/17

Online simulation of gas distribution networks
2. Network control at Düsseldorf Cityworks (Stadtwerke Düsseldorf AG)
Stadtwerke Düsseldorf AG is the municipal utility of the city of Düsseldorf. Düsseldorf is the capital of North Rhine-Westphalia, Germany's most populous state. It has about 570,000 inhabitants and covers an area of approx. 218 km².
As a municipal company, Stadtwerke Düsseldorf operates the gas, drinking water, district heating and power systems in the city as well as power and gas systems for street lighting, two gas-fired power plants, a waste incineration plant and three waterworks.
Especially in cities and regional supply systems, integrated utilities are the rule rather than the exception in Germany. Companies only supplying a single source of energy (such as gas companies) are usually only found on the transport system level.
You will find some of the key figures of Stadtwerke Düsseldorf's networks below:
Gas:High-pressure: 20 bar, 4 bar, medium-pressure 900 mbar, low-pressure 42 mbar1,456 km total length, approx. 54,100 buildings connected, 121,000 meters7.0 TWh/year output (domestic and commercial), 39.4 GWh/d max. day4.0 – 5.0 TWh/year power plant gas9 transfer stations, about 270 gas metering and pressure regulating stationsGas family: Enriched low-BTU gasCommon network management: Pressure regulation, no variation of linepack or storage
Water:7 pressure zones1,740 km total length, 73,700 buildings connected55,369,000 m³/year sales, 212,760 m³/day max.
District heating:3 network sections183 km total length, 4,950 delivery stations 1.6 GWh sales
Electrical power:High, medium and low voltage9418 km system length, approx. 83,500 buildings connected4.4 TWh/year sendout; 750 MW peak load
Street lighting: About 62,000 electric and 17,000 gas lights
simone_congress_2008_aymanns_stolte_wilms_doerner Page 2/17

Online simulation of gas distribution networks
Fig. 2-1: The gas network of Stadtwerke Düsseldorf with its main transfer stations
For historical reasons Stadtwerke Duesseldorf used to operate different establishments and organizations for the management of pipeline networks (gas, water, heating) and electrical networks up to 1999.
Due to the rising competition on the energy markets in Europe, Stadtwerke Duesseldorf, too, was forced to cut costs by streamlining and enhancement of synergies.
Therefore, the different sectors, which had been separated for decades, were integrated and organised in one network from the year 2000.One important point in this adjustment was the merger of the control rooms in the network sectors.
In 2004 to 2005, control centre staff from different sectors were trained together. In this connection, Simone was used as training simulator (Simone Congress 2005, Lednice, Peter Aymanns & Martin Althoff, training control room staff from local distribution companies)
simone_congress_2008_aymanns_stolte_wilms_doerner Page 3/17
B 8:3.2 - 3.6 bar- 49 TNm3/h
B 7:3.2 - 3.6 bar- 96 TNm3/h
B 4:3.2 - 3.6 bar- 98 TNm3/h

Online simulation of gas distribution networks
Fig. 2-2: Combined energies control room of Stadtwerke Düsseldorf
Since early 2006 staff of the various sectors work interactively. Very soon it was realized that the gas network simulation functionality is very useful in day-to-day operations.
3. Why online network calculations?
Considering the preconditions of a non-comprehensive measuring infrastructure and a partly inexact stationary data model (pipe friction, individual resistors), which does not offer precise results, the implementation of an online network calculation functionality for a distribution network is not really a calculation functionality but supplies indications for measurements that are not available and allows for plausibility checks.
During the training sessions mentioned above, the control centre personnel prepared themselves for their job in the gas network sector based on network calculations and simulations. This revealed the great value of network calculation for network management in the gas network. Moreover, the way of handling calculation results became apparent.
simone_congress_2008_aymanns_stolte_wilms_doerner Page 4/17

Online simulation of gas distribution networks
The online network calculation is an important tool when deciding over the evaluation of complex network operations. The online gas network calculation is very useful when evaluating activities in the gas network such as
Planned or unplanned closing of network sections Planned or unplanned closing or partial closing of gas metering and pressure regu-
lating stations Pressure adjustment in the networks Monitoring of load flow
In general, the network calculation functionality has the following aims in operational planning:
Capacity studies for different load conditions are implemented Effects of faults are examined Conditions for the operation management are recognized and developed Network bottlenecks are detected
While the aims in operational management are the following: Review of the supply situation for proposed closures Establish the control variables for controlling Evaluate the impacts of changes in the network switching status Provide information about abnormal conditions in current operations.
In the management of electrical networks the online network calculation is an integral part of the SCADA system for many years now. It was for reasons of uniformity and reduction of various software applications that it was decided to implement the online gas network calculation into the existing SCADA system.
This leads to many major advantages over stand alone network calculation programs: No interfaces required to transfer the dynamic operational data (pressure, feeding,
topology) No double data maintenance work in case of changes in the network and the data
model Intuitive handling of the calculation within the uniform user interface Simple integration of the calculation results into the operational decisions Available and applicable at all times
As described in Section 2, Stadtwerke Duesseldorf operate a pressure-regulated gas net-work without any significant variation of linepack. Therefore, a stationary calculation meth-od was chosen.
simone_congress_2008_aymanns_stolte_wilms_doerner Page 5/17
Online simulation of gas distribution networks
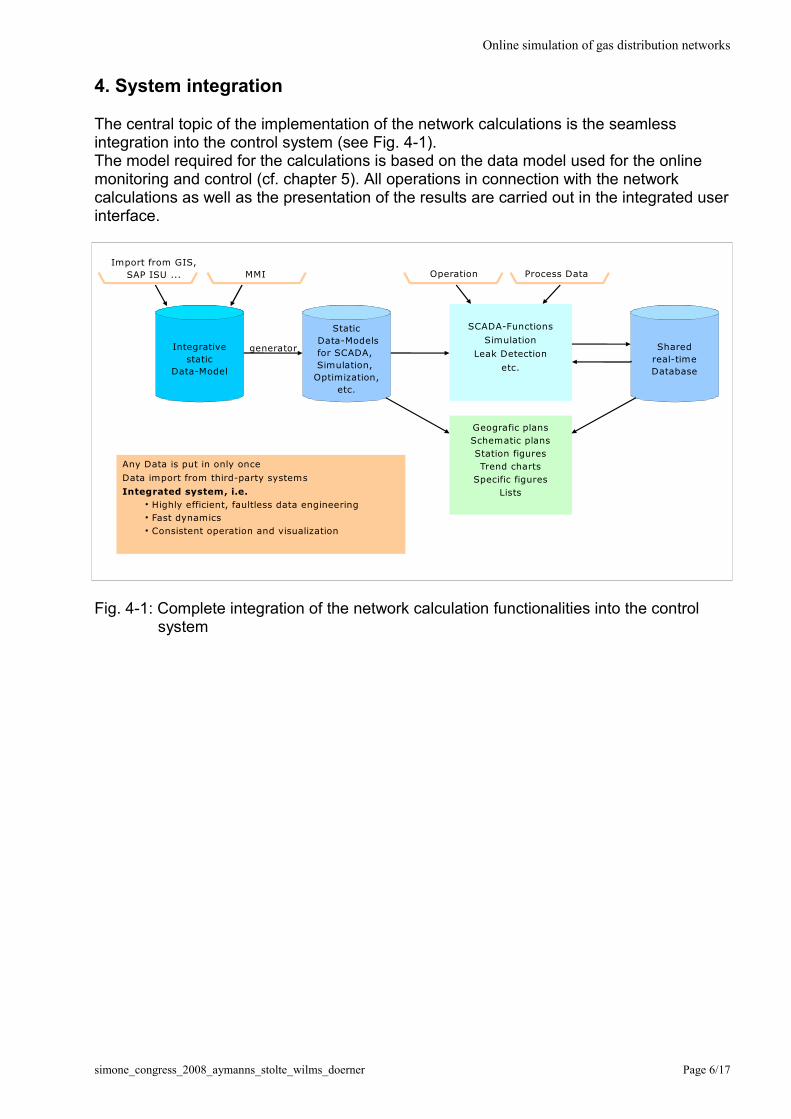
4. System integration
The central topic of the implementation of the network calculations is the seamless integration into the control system (see Fig. 4-1).The model required for the calculations is based on the data model used for the online monitoring and control (cf. chapter 5). All operations in connection with the network calculations as well as the presentation of the results are carried out in the integrated user interface.
Fig. 4-1: Complete integration of the network calculation functionalities into the control system
simone_congress_2008_aymanns_stolte_wilms_doerner Page 6/17
Any Data is put in only once
Data import from third-party systems
Integrated system, i.e. Highly efficient, faultless data engineering Fast dynamics Consistent operation and visualization
Static Data-Modelsfor SCADA, Simulation,
Optimization,etc.
Sharedreal-timeDatabase
Integrativestatic
Data-Model
SCADA-Functions
Simulation
Leak Detection
etc.
Geografic plansSchematic plansStation figuresTrend charts
Specific figuresLists
generator
Import from GIS,SAP ISU ... MMI Operation Process Data

Online simulation of gas distribution networks
5. Common data handling
The model data necessary for the net computation are maintained completely in the integrated data model of the control system. They can be entered using the user Interface of the data engineering system. Alternatively at least part of the data can be imported from other systems.
The topological description of the stations (measuring points and measured values, description of the regulating valves, slide valves, etc.) as well as the linking of the stations with the pipelines that have been imported from the GIS is done in the Data Engineering module of the control system. The station pictures are drawn; the information is then evaluated by the system. This allows for a very efficient and correct data entry. These pictures are used consistently by all applications of the control system. Therefore they are also available for the presentation of the result of the network calculations. Additional data on the elements in the stations can be either entered using the provided forms or imported via an appropriate interface.
The technical data of the pipe network are imported from a geographical information system (GIS). With respect to the network calculations important data are:
Pipes (length, diameter, roughness) Connecting pipes (to link the customer loads) Valves Geodetic height.
The GIS data is imported periodically into the control system. The data import works on an incremental basis. The objects, which are already part of the data model, remain unchanged. This is necessary in order to avoid a re-entry of hand dressed information (e.g. manually entered valve positions) when the GIS data is imported.The roughness of the pipes is not imported from the GIS but is maintained manually using the PSIcontrol tools. For the determination of appropriate values for the roughness the system provides a calibration tool. This tool allows to define the roughness for types of pipes (e.g. according to diameter and material). The results are then compared to the measurements (see Fig. 5-1).
simone_congress_2008_aymanns_stolte_wilms_doerner Page 7/17

Online simulation of gas distribution networks
Fig. 5-1: Calibration tool
The consumption is not completely measured in the distribution network. To obtain information about the amount of gas drawn from the network by each consumer, the total consumption for a year or the maximum intake from the billing or the EDM system are used. In order to relate this consumer data topologically in the network, the consumption needs to reference the location. This reference is created based on the address data available.
For a stationary calculation the feeding equals the load in a network at all times. This allows to determine the non-measured loads as the difference between the online measured total feeding and the online measured loads. The individual loads are then derived by scaling. For the look-ahead simulation (see chapter 6.2) the scaling is carried out in an analogue way. For each step in time the non-measured loads are determined as the difference between the forecasted total consumption and the forecasted measured loads.
The network model for the network calculations is automatically created by a generator from the integrated data model of the control system. During the data model generation comprehensive checks are carried out. For the analysis of the data model and the calculation results specific protocols and information functions as well as the graphic displays of the control system can be used (see chapter 4). This facilitates the search for errors in the definition data (e.g. errors in the connectivity).
simone_congress_2008_aymanns_stolte_wilms_doerner Page 8/17

Online simulation of gas distribution networks
6. Applications
6.1 State estimation
The online state estimaton determines, based on the measured and counted data the current flow conditions in the network. The simulation is usually carried out periodically and automatically. If required, the simulation can be started manually.
The results of the calculation are handed over to the process data processing. The data can be displayed in the process pictures in the same way as measurements. The process data processing checks for limit violations and for discrepancies between measured and calculated values. All findings are logged in the alarm and event lists. The operator is able to access measured as well as calculated values without the need to start the network calculations manually.
The results of the network calculations can be displayed graphically in the network pictures. The pipes can be coloured dependent on the calculation results (pressure, flow, velocity, etc.) or static characteristics (e.g. nominal size). In addition the numerical values as well as the flow direction can be displayed (see Fig. 6-1).
All input data and the results of the network calculation can be displayed and analyzed in sorted lists. Information on individual pipes can be displayed in pop-up windows after clicking on the respective element in the process picture.
Fig. 6-1: Network colouring and visualization
simone_congress_2008_aymanns_stolte_wilms_doerner Page 9/17

Online simulation of gas distribution networks
6.2 Look-ahead simulation
The look-ahead simulation allows to determine the network status for future load and switching statuses. Both load forecasts as well as nominations are considered. Using a simulation timetable (see Fig. 6-2) future controlling operations (opening and closing of valves, changing of setpoint values) as well as feedings and load settings can be defined.
To display the results of the look-ahead simulation the same tools as described in the online background simulation can be used. A slider allows to display the network colouring according to the selected time in the simulated period. The calculation results can be displayed as trends, too. The trend displays for the look-ahead simulation provide the same functionality as the trending of online measurements.
Fig. 6-2: Simulation Timetable
6.3 Example scenarios
6.3.1 Checking the supply status before taking the GDR station C78 out of service
The gas pressure regulation station C 78 is to be taken out of service to allow planned maintenance work. No remote monitored measurements are available in the station. However the online state estimation provides calculated values instead of measurements.These values can be displayed for an object in the process pictures by clicking on the object. The simulation determines a flow of about 2.6 TNm3/h at a base pressure of 0.935 bar. The look ahead simulation calculates the flow conditions for the situation that C 78 is out of service (cf. Fig. 6-3a to 6-3e). Near to the station the pressure is calculated at 911 mbar instead of 930 mbar. In the south eastern supply pipe a flow reversion occurs. Before switching off the station about 1.3 TNm3/h were transported to the south-west, after the deactivation 1.2 TNm3/h are flowing into the opposite direction.The checking of the low pressure near to the station shows a reduction from 40 mbar to 39 mbar only. Further checking of the low pressure network show no critical status.It should be possible to deactivate the station C 78.
simone_congress_2008_aymanns_stolte_wilms_doerner Page 10/17

Online simulation of gas distribution networks
Fig. 6-3a: Flow status, C78 in operation
Fig. 6-3b: Flow status, C78 out of service
simone_congress_2008_aymanns_stolte_wilms_doerner Page 11/17
Flows C78 out of service
Example scenario : station C78 taken out of service
Initial flow status
Example scenario: station C78 taken out of service

Online simulation of gas distribution networks
Fig. 6-3c: Pressures, C78 out of service
Fig. 6-3d: Pressures, C78 in operation
simone_congress_2008_aymanns_stolte_wilms_doerner Page 12/17
Initial pressures
Example scenario : station C78 taken out of service
Pressures C78 out of service
Example scenario : station C78 taken out of service

Online simulation of gas distribution networks
Fig. 6-3e: Pressure of low pressure pipes, C78 out of service
6.3.2 Determining the effects of closing hp valve SBN 778
By closing the high pressure valve SBN 778 in the vicinity of the pressure regulation station C 93 the feeding situation is changed (see Fig. 6-4a to Fig. 6-4d). The station B 10 in the west delivers about 10 TNm3/h less. This amount is taken over by other stations. The station B7 (in the north) provides now about 7.5 TNm3/h and the station B 8 in the sourth 2.5 TNm3/h more. The logs as well as the station pictures show that no limits are reached or violated. Due to the shift in the feedings a very high flow speed results in the north, at the interfaces of the upper ring. This is shown in Fig. 6-4d in red. This hot spot is to be monitored intensively.The checking of the medium pressure network shows no further influence. Therefore it can be assumes that closing the valve SBN 778 will result in a stable network status with a secure supply.
simone_congress_2008_aymanns_stolte_wilms_doerner Page 13/17
Lp pressures C78 out of service
Example scenario : station C78 taken out of service

Online simulation of gas distribution networks
Fig. 6-4a: Flow status, high pressure valve SBN 778 open
Fig. 6-4b: Flow status, high pressure valve SBN 778 closed
simone_congress_2008_aymanns_stolte_wilms_doerner Page 14/17
Initial flow status
Example scenario: closing hp valve SBN 778
SBN 778
Flows SBN 778 closed
Example scenario: closing hp valve SBN 778
SBN 778

Online simulation of gas distribution networks
Fig. 6-4c: Feeding summary
Fig. 6-4d: Velocity status, high pressure valve SBN 778 closed
simone_congress_2008_aymanns_stolte_wilms_doerner Page 15/17
Velocities SBN 778 closed
Example scenario: closing hp valve SBN 778
SBN 778
Increased velocity
Initial Feeding
Example scenario: closing hp valve SBN 778
Feeding SBN 778 closed

Online simulation of gas distribution networks
7. Common Integration Approach, Reference Applications
The stationary network calculations which have been discussed in the previous chapters do not consider any variation of linepack. Time dependent transport can be modelled by a sequence of hydraulic stationary calculations (quasi-stationary calculations). The switching status as well as the injected and extracted amounts of gas may change during the calculated period. This allows to determine the distribution of the calorific value of the gas. In the same way the temperature profile for district heating or the age of the water can be determined. However, variation of linepack is to be considered for high pressure networks. The flow status is to be modelled as time dependent. This is done using transient network calculations. The quality of the gas (calorific value, density) is also determined in transient calculations.
Each method is implemented by a respective calculation kernel. For the integration of network calculation applications into PSIcontrol an open approach has been chosen, which allows to use different calculation kernels. The operations and the visualization of the results is done in the common user interface of the control system. The operator has therefore access to a comprehensive tool for network management, regardless of the difference in the calculation kernels and the data provision.
The following projects use PSIcontrol’s integrated online pipeline network calculations or are presently in implementation:
24/7 Netze GmbH, Mannheim Quasi-stationary district heating calculations Transient gas network calculations
Stadtwerke Düsseldorf Netz GmbH, Düsseldorf Stationary gas network calculations Quasi-stationary water network calculations Quasi-stationary district heating network calculations
Stadtwerke Duisburg Netzgesellschaft mbH, Duisburg Stationary gas network calculations Stationary water network calculations
NRM Netzdienste Rhein-Main GmbH, Frankfurt Transient gas network calculations
HEAG Südhessische Energie AG, Darmstadt Stationry gas network calculations
SWM Infrastruktur GmbH, München Transient gas network calculations
E.ON Avacon Netz GmbH, Braunschweig Transient gas network calculations
simone_congress_2008_aymanns_stolte_wilms_doerner Page 16/17

Online simulation of gas distribution networks
8. Summary
For the optimization of the network management, Stadtwerke Düsseldorf has extended their existing combined energies control system with online network calculations. In the first step stationary calculations have been implemented. This allows (within the given data accuracy) to determine bottlenecks in the gas supply as well as the influence of closing valves in pipeline segments or the changing of the infeed and load situation.
The functionality is seamlessly integrated into the control system and includes an online state estimation, a load adaptation as well as a look-ahead simulation.
The online state estimation allows determining the current status of the network and monitoring it. All pressure and flows are calculated, even for locations without online measurement. A consistent network status is the result.
The look ahead simulation allows to determine the network status before an operation is carried out and to optimize the network operations. This allows, for example, to simplify and speed up repairs in the network.
The operators are supported by visualization functionality of the control system for network pictures. This allows a previously unknown overview of the gas network. The geospatial network picture is periodically imported from the existing GIS of the Stadtwerke Düsseldorf.
The system is open for development. A calorific value monitoring can facilitate the effects of different gas infeed situations or the use of a transient calculation kernel allows to consider the variation of linepack.
simone_congress_2008_aymanns_stolte_wilms_doerner Page 17/17