online network traffic characterization - ontic project · kpi key performance indicators ... ontic...
TRANSCRIPT
Online Network Traffic Characterization
Deliverable Progress on Use Cases
ONTIC Project
(GA number 619633)
Deliverable D5.2 Dissemination Level: PUBLIC
Authors Alejandro Bascuñana, Miguel-Ángel Monjas (Ericsson Spain); Daniele Apiletti (POLITO); Fernando Arias (EMC2); Miguel Ángel López Peña,
José María Ocón (SATEC Spain); Juliette Dromard, Philippe Owezarski (LAAS-CNRS); Alberto Mozo, Bruno Ordozgoiti (UPM); Panos Georgatsos
(ADAPTit)
Version ONTIC_D5.2.2016-01-29.0.10
!!
619633 ONTIC. Deliverable D5.2: Progress on Use Cases
2 / 80
! !
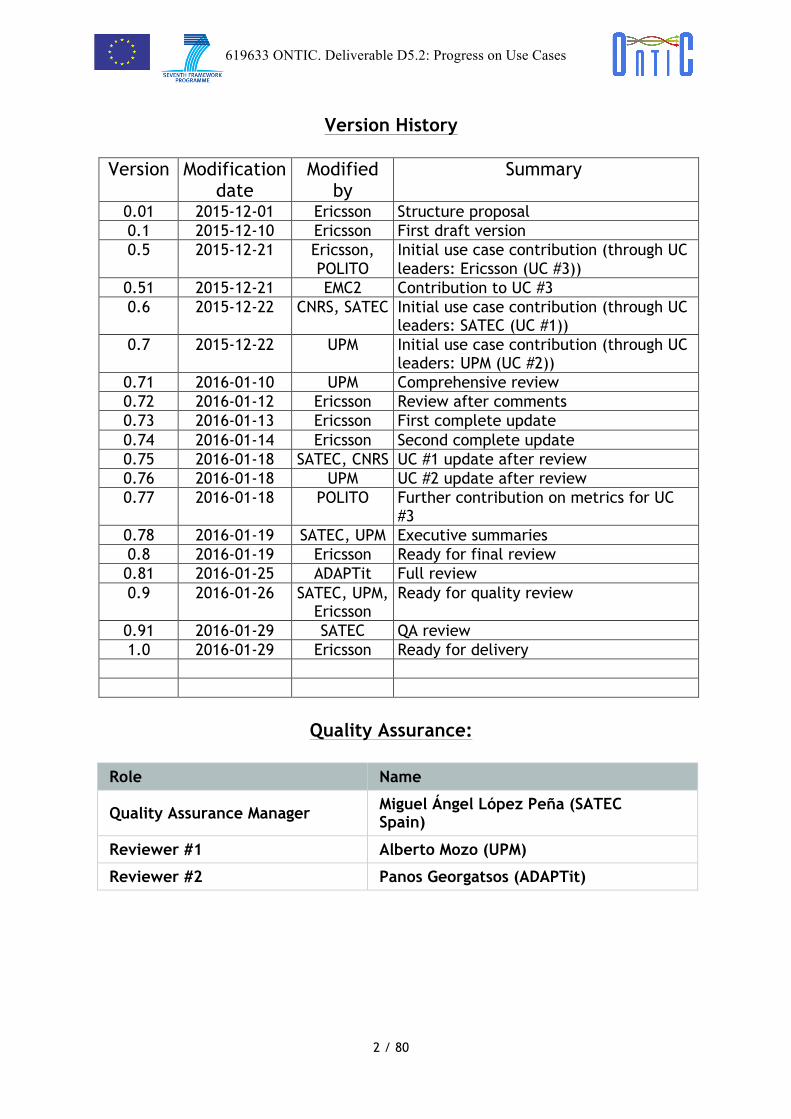
Version History
Version Modification date
Modified by
Summary
0.01 2015-12-01 Ericsson Structure proposal 0.1 2015-12-10 Ericsson First draft version 0.5 2015-12-21 Ericsson,
POLITO Initial use case contribution (through UC leaders: Ericsson (UC #3))
0.51 2015-12-21 EMC2 Contribution to UC #3 0.6 2015-12-22 CNRS, SATEC Initial use case contribution (through UC
leaders: SATEC (UC #1)) 0.7 2015-12-22 UPM Initial use case contribution (through UC
leaders: UPM (UC #2)) 0.71 2016-01-10 UPM Comprehensive review 0.72 2016-01-12 Ericsson Review after comments 0.73 2016-01-13 Ericsson First complete update 0.74 2016-01-14 Ericsson Second complete update 0.75 2016-01-18 SATEC, CNRS UC #1 update after review 0.76 2016-01-18 UPM UC #2 update after review 0.77 2016-01-18 POLITO Further contribution on metrics for UC
#3 0.78 2016-01-19 SATEC, UPM Executive summaries 0.8 2016-01-19 Ericsson Ready for final review 0.81 2016-01-25 ADAPTit Full review 0.9 2016-01-26 SATEC, UPM,
Ericsson Ready for quality review
0.91 2016-01-29 SATEC QA review 1.0 2016-01-29 Ericsson Ready for delivery
Quality Assurance:
Role Name
Quality Assurance Manager Miguel Ángel López Peña (SATEC Spain)
Reviewer #1 Alberto Mozo (UPM)
Reviewer #2 Panos Georgatsos (ADAPTit)
619633 ONTIC. Deliverable D5.2: Progress on Use Cases
3 / 80
! !
Table of Contents 1. ACRONYMS AND DEFINITIONS 7
1.1 Acronyms ............................................................................................. 7
2. PURPOSE OF THE DOCUMENT 9
3. SCOPE 10
4. INTENDED AUDIENCE 11
5. SUGGESTED PREVIOUS READINGS 12
6. EXECUTIVE SUMMARY 13
7. USE CASE ENVIRONMENT 15
7.1 Overall .............................................................................................. 15
7.2 Use Case #1 - Network Anomaly Detection .................................................... 16
7.3 Use Case #2 - Proactive Congestion Detection and Control System ........................ 17
7.4 Use Case #3 - Adaptive QoE Control ............................................................ 19
8. USE CASES DESCRIPTION 22
8.1 Use cases, epics and user stories ............................................................... 22
8.2 UC #1 (User Story 1): Network Anomaly Detection ........................................... 24 8.2.1 Scenario description .................................................................................... 24 8.2.2 User Requirements ...................................................................................... 24 8.2.3 System model ............................................................................................ 26 8.2.4 Performance Evaluation ................................................................................ 31 8.2.5 Open issues, deviations and future developments ................................................. 33
8.3 UC #2 (User Story 2): Proactive Congestion Detection and Control ........................ 34 8.3.1 Scenario description .................................................................................... 34 8.3.2 User Requirements ...................................................................................... 37 8.3.3 System model ............................................................................................ 38 8.3.4 Performance Evaluation ................................................................................ 42 8.3.5 Open issues, deviations and future developments ................................................. 43
8.4 UC #3 (User Story 3): Adaptive QoE Control .................................................. 44 8.4.1 Scenario description .................................................................................... 44 8.4.2 User Requirements ...................................................................................... 48 8.4.3 System model ............................................................................................ 50 8.4.4 Performance Evaluation ................................................................................ 63 8.4.5 Open issues, deviations and future developments ................................................. 64
9. REFERENCES 66
ANNEX A : VLC TEST-BED CONFIGURATION 68
619633 ONTIC. Deliverable D5.2: Progress on Use Cases
4 / 80
! !A.1 Hardware Configuration ........................................................................ 68
A.2 Software Configuration ......................................................................... 68
A.3 Network configuration .......................................................................... 68
A.4 Test scenarios ................................................................................... 68
A.5 Server shell script code ........................................................................ 69
A.6 Client shell script code ......................................................................... 70
A.7 Tstat log files .................................................................................... 71
ANNEX B QUALITY OF EXPERIENCE (QOE) FRAMEWORK 72
ANNEX C PGF INTERFACES SUMMARY 75
C.1 IF3-2 REST Interfaces: Summary .............................................................. 75
C.2 IF3-21 REST Interfaces: Summary ............................................................. 75
C.1 IF3-22 REST Interfaces: Summary ............................................................. 76
ANNEX D USER STORIES 77
619633 ONTIC. Deliverable D5.2: Progress on Use Cases
5 / 80
! !
List of figures Figure 1: Automated Management Control Loop pattern ............................................... 19 Figure 2: Use Case #1 High-level Architecture ............................................................ 26 Figure 3: UC #1 Dashboard Functional View .............................................................. 27 Figure 4: UML specification of UC #1 on anomaly detection ........................................... 28 Figure 5: Network traffic and anomaly detection dashboard architecture .......................... 29 Figure 6: An example of how EERC protocols work. ..................................................... 35 Figure 7: UC #2 Software Architecture .................................................................... 40 Figure 8: UC #3 framework .................................................................................. 45 Figure 9: VLC test-bed ........................................................................................ 47 Figure 10: UC #3 System Architecture ..................................................................... 50 Figure 11: UC #3 reference points .......................................................................... 52 Figure 12: Mitigation Plan Simulation workflow .......................................................... 54 Figure 13: Computation of partial KPI values ............................................................. 55 Figure 14: Function modelling the bandwidth release and the KPI gain (Linear, Exponentiation, and Logistic) ................................................................................................... 55 Figure 15: PGF Data Model ................................................................................... 56 Figure 16: PGF High Level Architecture ................................................................... 57 Figure 17: Mitigation Plan Simulation tool - High-Level Architecture ................................. 58 Figure 18: Standard dialogue between AF and PGF ...................................................... 61 Figure 19: Example Communication Service Provider A. Young pre-paid user base operator ..... 73 Figure 20: Example Communication Service Provider B. Convergent operator – Big corporate user base ............................................................................................................. 73

619633 ONTIC. Deliverable D5.2: Progress on Use Cases
6 / 80
! !
List of tables Table 1: ONTIC use cases .................................................................................... 15 Table 2: Use Cases (DoW) − Epics − User Stories correlation ........................................... 24 Table 3: Envisioned improvements in congestion control ............................................... 37 Table 4: New scenarios for enhancing user’s QoE (Updated) .......................................... 48 Table 5: VLC test-bed network configuration ............................................................. 68 Table 6: ONTIC user stories .................................................................................. 80
619633 ONTIC. Deliverable D5.2: Progress on Use Cases
7 / 80
! !
1. Acronyms and Definitions
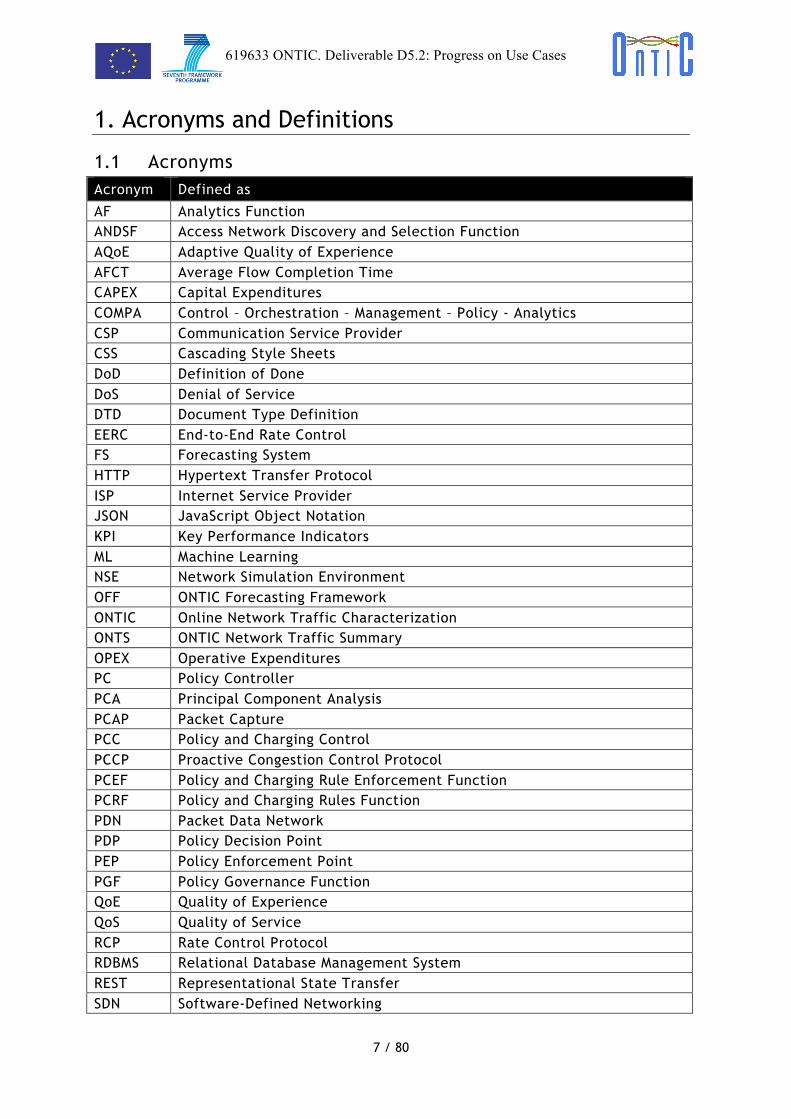
1.1 Acronyms Acronym Defined as
AF Analytics Function ANDSF Access Network Discovery and Selection Function AQoE Adaptive Quality of Experience AFCT Average Flow Completion Time CAPEX Capital Expenditures COMPA Control – Orchestration – Management – Policy - Analytics CSP Communication Service Provider CSS Cascading Style Sheets DoD Definition of Done DoS Denial of Service DTD Document Type Definition EERC End-to-End Rate Control FS Forecasting System HTTP Hypertext Transfer Protocol ISP Internet Service Provider JSON JavaScript Object Notation KPI Key Performance Indicators ML Machine Learning NSE Network Simulation Environment OFF ONTIC Forecasting Framework ONTIC Online Network Traffic Characterization ONTS ONTIC Network Traffic Summary OPEX Operative Expenditures PC Policy Controller PCA Principal Component Analysis PCAP Packet Capture PCC Policy and Charging Control PCCP Proactive Congestion Control Protocol PCEF Policy and Charging Rule Enforcement Function PCRF Policy and Charging Rules Function PDN Packet Data Network PDP Policy Decision Point PEP Policy Enforcement Point PGF Policy Governance Function QoE Quality of Experience QoS Quality of Service RCP Rate Control Protocol RDBMS Relational Database Management System REST Representational State Transfer SDN Software-Defined Networking

619633 ONTIC. Deliverable D5.2: Progress on Use Cases
8 / 80
! !SQL Structured Query Language VLC VideoLAN media player XCP Universal Measurement and Calibration Protocol XML Extensible Markup Language
619633 ONTIC. Deliverable D5.2: Progress on Use Cases
9 / 80
! !
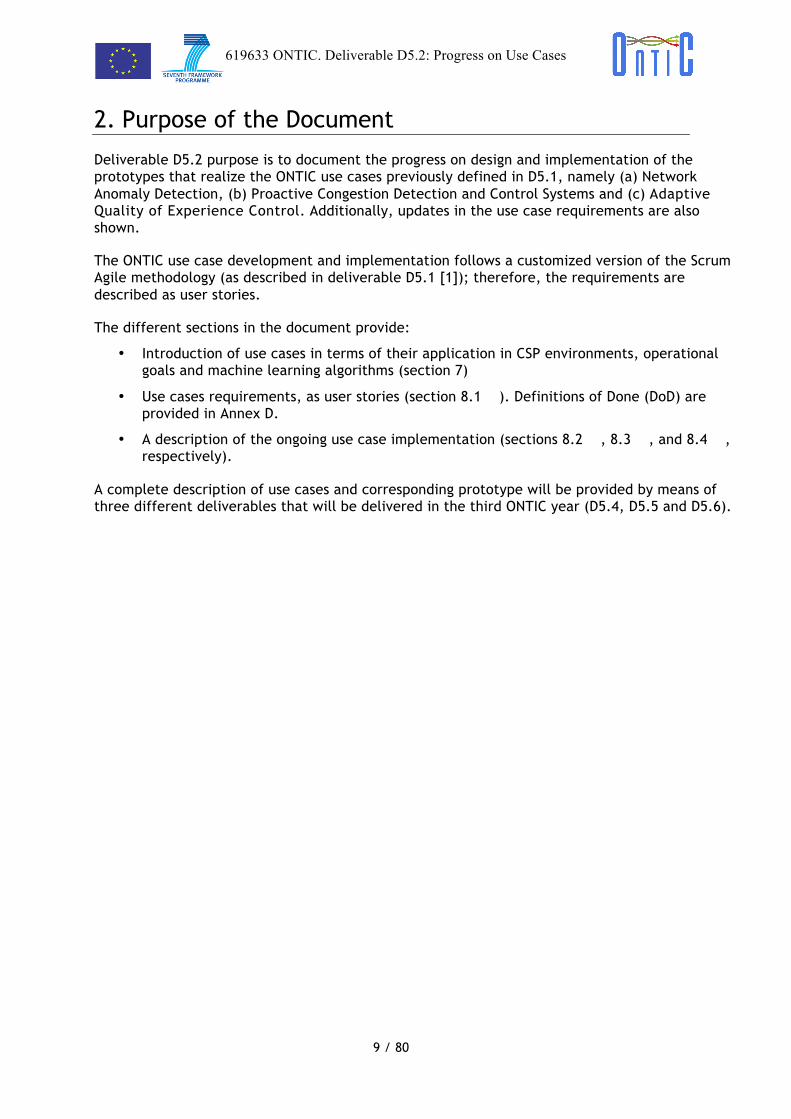
2. Purpose of the Document
Deliverable D5.2 purpose is to document the progress on design and implementation of the prototypes that realize the ONTIC use cases previously defined in D5.1, namely (a) Network Anomaly Detection, (b) Proactive Congestion Detection and Control Systems and (c) Adaptive Quality of Experience Control. Additionally, updates in the use case requirements are also shown.
The ONTIC use case development and implementation follows a customized version of the Scrum Agile methodology (as described in deliverable D5.1 [1]); therefore, the requirements are described as user stories.
The different sections in the document provide:
• Introduction of use cases in terms of their application in CSP environments, operational goals and machine learning algorithms (section 7)
• Use cases requirements, as user stories (section 8.1 ). Definitions of Done (DoD) are provided in Annex D.
• A description of the ongoing use case implementation (sections 8.2 , 8.3 , and 8.4 , respectively).
A complete description of use cases and corresponding prototype will be provided by means of three different deliverables that will be delivered in the third ONTIC year (D5.4, D5.5 and D5.6).

619633 ONTIC. Deliverable D5.2: Progress on Use Cases
10 / 80
! !3. Scope
This document provides information about use case requirements (as user stories) and corresponding prototype implementation. Therefore it is not expected to provide description of algorithms descriptions or a description of the ONTIC Big Data Architecture, as there are specific deliverables for said topics (D3.2 and D4.2, and D2.3, respectively), unless absolutely needed for the understanding of the use case implementation.

619633 ONTIC. Deliverable D5.2: Progress on Use Cases
11 / 80
! !4. Intended Audience
The intended document audience includes not only all the partners in the ONTIC consortium (especially those involved in gathering requirements, and in designing, implementing and validating the prototypes) or the receivers of the project. It also includes any reader interested in understanding the ONTIC use cases and the business principles that guide the research within the project.

619633 ONTIC. Deliverable D5.2: Progress on Use Cases
12 / 80
! !5. Suggested Previous Readings
It is expected that a basic background on Information and Communications Technology (ICT) is sufficient to address the contents of this document; however, some previous readings are suggested:
• ONTIC. “Deliverable D5.1. Use Case Requirements” [1].
619633 ONTIC. Deliverable D5.2: Progress on Use Cases
13 / 80
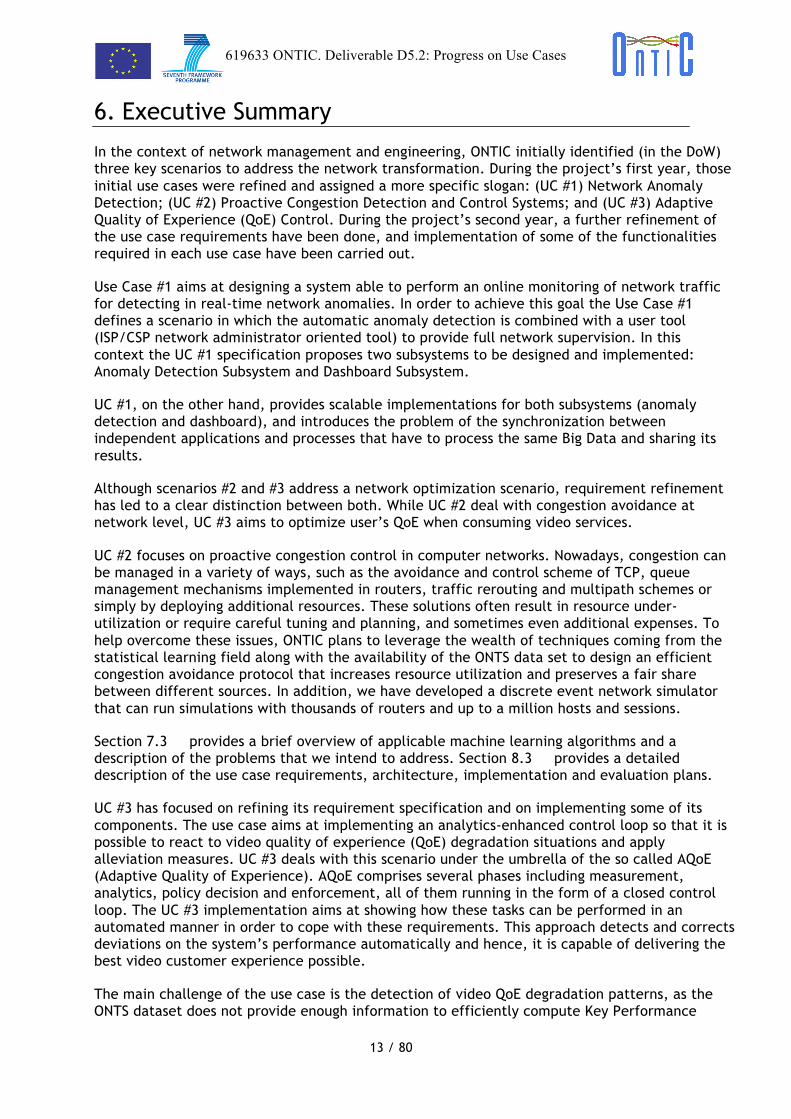
! !6. Executive Summary
In the context of network management and engineering, ONTIC initially identified (in the DoW) three key scenarios to address the network transformation. During the project’s first year, those initial use cases were refined and assigned a more specific slogan: (UC #1) Network Anomaly Detection; (UC #2) Proactive Congestion Detection and Control Systems; and (UC #3) Adaptive Quality of Experience (QoE) Control. During the project’s second year, a further refinement of the use case requirements have been done, and implementation of some of the functionalities required in each use case have been carried out.
Use Case #1 aims at designing a system able to perform an online monitoring of network traffic for detecting in real-time network anomalies. In order to achieve this goal the Use Case #1 defines a scenario in which the automatic anomaly detection is combined with a user tool (ISP/CSP network administrator oriented tool) to provide full network supervision. In this context the UC #1 specification proposes two subsystems to be designed and implemented: Anomaly Detection Subsystem and Dashboard Subsystem.
UC #1, on the other hand, provides scalable implementations for both subsystems (anomaly detection and dashboard), and introduces the problem of the synchronization between independent applications and processes that have to process the same Big Data and sharing its results.
Although scenarios #2 and #3 address a network optimization scenario, requirement refinement has led to a clear distinction between both. While UC #2 deal with congestion avoidance at network level, UC #3 aims to optimize user’s QoE when consuming video services.
UC #2 focuses on proactive congestion control in computer networks. Nowadays, congestion can be managed in a variety of ways, such as the avoidance and control scheme of TCP, queue management mechanisms implemented in routers, traffic rerouting and multipath schemes or simply by deploying additional resources. These solutions often result in resource under-utilization or require careful tuning and planning, and sometimes even additional expenses. To help overcome these issues, ONTIC plans to leverage the wealth of techniques coming from the statistical learning field along with the availability of the ONTS data set to design an efficient congestion avoidance protocol that increases resource utilization and preserves a fair share between different sources. In addition, we have developed a discrete event network simulator that can run simulations with thousands of routers and up to a million hosts and sessions.
Section 7.3 provides a brief overview of applicable machine learning algorithms and a description of the problems that we intend to address. Section 8.3 provides a detailed description of the use case requirements, architecture, implementation and evaluation plans.
UC #3 has focused on refining its requirement specification and on implementing some of its components. The use case aims at implementing an analytics-enhanced control loop so that it is possible to react to video quality of experience (QoE) degradation situations and apply alleviation measures. UC #3 deals with this scenario under the umbrella of the so called AQoE (Adaptive Quality of Experience). AQoE comprises several phases including measurement, analytics, policy decision and enforcement, all of them running in the form of a closed control loop. The UC #3 implementation aims at showing how these tasks can be performed in an automated manner in order to cope with these requirements. This approach detects and corrects deviations on the system’s performance automatically and hence, it is capable of delivering the best video customer experience possible.
The main challenge of the use case is the detection of video QoE degradation patterns, as the ONTS dataset does not provide enough information to efficiently compute Key Performance

619633 ONTIC. Deliverable D5.2: Progress on Use Cases
14 / 80
! !Indicators (KPI’s) for video services. Therefore, alternative approaches have been taken: on one hand, a proposal on how to obtain application payload in a safe and secure way by means of a VLC-based test bed; on the other, internally looking for datasets that, even smaller, could contain the necessary information.
At the same time, the UC #3 implementation has focused on designing and developing the functional components that link the Analytics Function that detect video QoE degradation patterns (by using algorithms developed in WP3) with the enforcement elements. That link is realized by means of RESTful interfaces which have been specified and implemented. Finally, a simulation tool for estimating the effects on QoE when applying specific mitigation plans has been also implemented.
619633 ONTIC. Deliverable D5.2: Progress on Use Cases
15 / 80
! !7. Use Case Environment
7.1 Overall
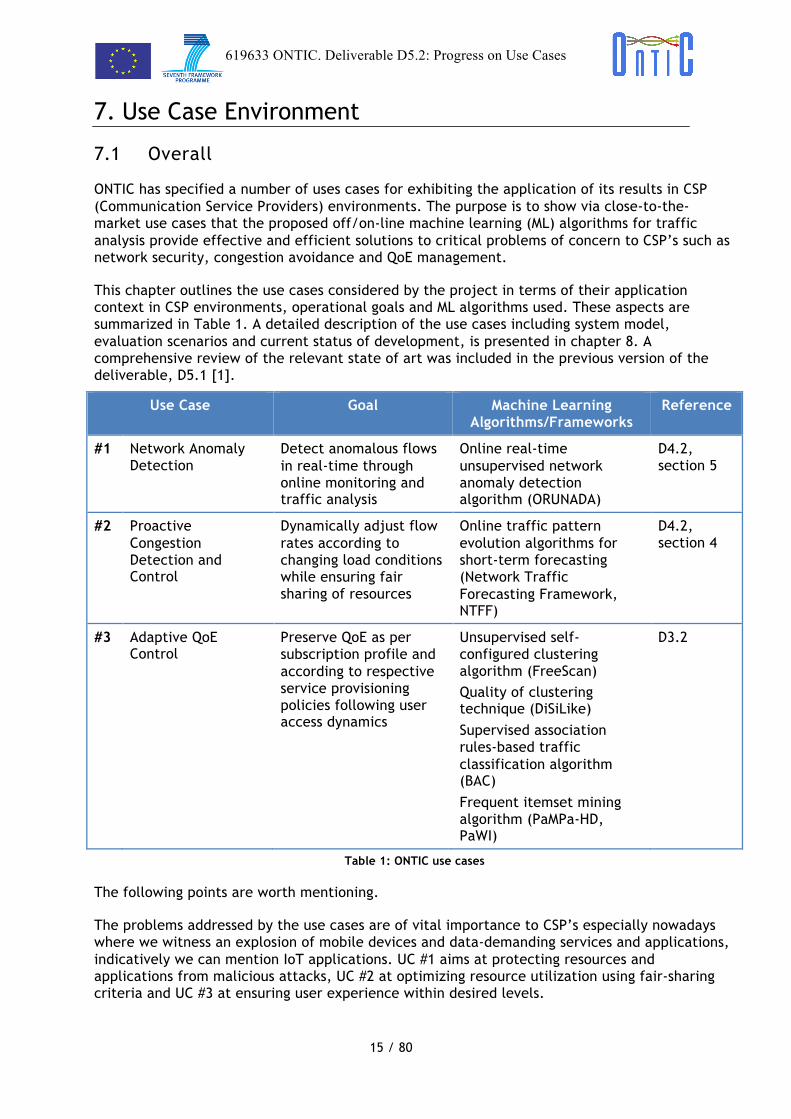
ONTIC has specified a number of uses cases for exhibiting the application of its results in CSP (Communication Service Providers) environments. The purpose is to show via close-to-the-market use cases that the proposed off/on-line machine learning (ML) algorithms for traffic analysis provide effective and efficient solutions to critical problems of concern to CSP’s such as network security, congestion avoidance and QoE management.
This chapter outlines the use cases considered by the project in terms of their application context in CSP environments, operational goals and ML algorithms used. These aspects are summarized in Table 1. A detailed description of the use cases including system model, evaluation scenarios and current status of development, is presented in chapter 8. A comprehensive review of the relevant state of art was included in the previous version of the deliverable, D5.1 [1].
Use Case Goal Machine Learning Algorithms/Frameworks
Reference
#1 Network Anomaly Detection
Detect anomalous flows in real-time through online monitoring and traffic analysis
Online real-time unsupervised network anomaly detection algorithm (ORUNADA)
D4.2, section 5
#2 Proactive Congestion Detection and Control
Dynamically adjust flow rates according to changing load conditions while ensuring fair sharing of resources
Online traffic pattern evolution algorithms for short-term forecasting (Network Traffic Forecasting Framework, NTFF)
D4.2, section 4
#3 Adaptive QoE Control
Preserve QoE as per subscription profile and according to respective service provisioning policies following user access dynamics
Unsupervised self-configured clustering algorithm (FreeScan) Quality of clustering technique (DiSiLike) Supervised association rules-based traffic classification algorithm (BAC) Frequent itemset mining algorithm (PaMPa-HD, PaWI)
D3.2
Table 1: ONTIC use cases
The following points are worth mentioning.
The problems addressed by the use cases are of vital importance to CSP’s especially nowadays where we witness an explosion of mobile devices and data-demanding services and applications, indicatively we can mention IoT applications. UC #1 aims at protecting resources and applications from malicious attacks, UC #2 at optimizing resource utilization using fair-sharing criteria and UC #3 at ensuring user experience within desired levels.
619633 ONTIC. Deliverable D5.2: Progress on Use Cases
16 / 80
! !The application of innovative ML algorithms for improving the performance of core network operations is currently gaining momentum. Although ML algorithms for network traffic classification are an active research topic, their integration in closed-loop controls with the available network/service management systems in CSP’s is generally missing. Existing control systems rely on aggregated metrics (totals, averages, min/max) and as such they do not exploit the wealth of evolving structural information that could be extracted from analyzing raw monitored data based on ML techniques. The ONTIC use cases pave the way in this direction; their practical deployment in CSP’s has been discussed in the architectural deliverable, D2.3 [2]. Note that the increasing adoption of Big Data technologies by CSP’s, even as an alternative data warehouse, facilitates the deployment of the ONTIC algorithms.
Last but not least, the use cases combine ML and telecoms expertise, which is well represented in the ONTIC consortium by the mix of academic and industrial partners, respectively. Such a combination is outmost essential since it is commonly recognized that the application of ML algorithms in specific domains needs to utilize intimate knowledge of the domain itself. ML algorithms assume a generic, domain-agnostic, input model –a space of points with attributes- which obviously needs to be customized to specific application needs. This customization becomes even crucial for the application of ML traffic analysis algorithms in CSP domains since yielded analytics may trigger actions that impact on network performance, quality of the offered services and customer experience.
7.2 Use Case #1 - Network Anomaly Detection
UC #1 aims at designing a system able to perform online monitoring and analysis of network traffic for detecting in real-time network anomalies. As already described in deliverable D5.1 [1], the related literature refers to two kinds of ML approaches for anomaly detection: The first one leverages previously acquired knowledge as signatures or statistical models for supervised learning-based approaches. The second one does not consider any acquired knowledge or training stage for initiating and configuring the detection system and its constituting algorithms. All knowledge is produced online by monitoring and analyzing network traffic. Unsupervised learning algorithms are well fitted for such objectives.
The context and objectives of UC #1 as explained in D5.1 can be summarized as follows:
• Anomalies (including attacks) are a moving target, as new anomalies and attacks arise every day. Network traffic is also constantly evolving with new applications and services appearing very frequently. The detection of new unknown anomalies (called 0d anomalies) in this changing environment is essential, and an objective of the ONTIC project. The signature and supervised learning approaches are therefore not fulfilling the requirements, as signatures and traffic statistical models have to be humanly produced, in an offline way, thus leading to long delay and cost. In addition, supervised learning approaches require training the system before the detection phase. The training then requires previously labeled traffic traces containing the labels for all applications and anomalies the system needs to know for performing the detection work. Of course, building labeled traces is a very time consuming task, while it is prone to errors that can impact on the performance of the detection system afterwards.
• Traffic needs to be autonomously characterized and classified (as much as possible) in order to autonomously make a decision concerning the treatment to apply on the isolated traffic classes (legitimate or illegitimate). Relying on human network administrators for deciding whether a flow is legitimate leads to very poor temporal performances, and can even be useless if the attack finishes before the administrators can cope with it (attacks, for instance, are generally triggered at night, during days off, when very popular events arise, etc. i.e. when network administrators are not supposed to be at work).

619633 ONTIC. Deliverable D5.2: Progress on Use Cases
17 / 80
! !Given the presented context and objectives, unsupervised learning is the only promising approach. UC #1 then aims at leveraging the online unsupervised learning algorithms based on clustering designed in WP4 for building a system able to detect anomalies (including 0d ones) and apply countermeasures in real-time, autonomously, and without relying on a human network administrator, previously labeled traffic traces for training, or anomaly signatures.
Practically speaking, the system to be developed in UC #1 is strongly needed for any network administrator: they require a tool able to display traffic monitoring results, as well as able to detect anomalies, the strongest need being related to Denial of Service (DoS) attacks. Many commercial tools exist for that purpose, but they generally lack efficiency in terms of anomaly detection: they leverage very poor first order statistics that are absolutely not suited in the context of the highly variable and versatile traffic nature. As a result, their ability to detect DoS attacks is very limited leading to high false positive and false negative rates. For instance, this is the case for the recent AlienVault solution,1 which aims at providing unified security monitoring, security events management and reporting, and continuous threat intelligence, as well as multiple security functions. However, it lacks real-time features and does not work in an autonomous way. Thus, it lets most of the work to the network administrator and shows a limited usefulness.
UC #1 and its supporting real-time unsupervised network anomaly detection algorithm developed by the project aim at fixing the flaws of tools such as AlienVault. It does so by providing a fully real-time, scalable and autonomous monitoring and anomaly detection tool, able to autonomously trigger counter-measures for security purposes. It is described in section 8.2 .
7.3 Use Case #2 - Proactive Congestion Detection and Control System
For coping with congestion in communications networks, two main approaches can be distinguished: congestion control techniques that reactively deal with congestion problems, that is, after the network is detected to be overloaded; and, congestion avoidance techniques that proactively prevent congestion problems from happening, taking ameliorative actions before the network becomes overloaded.
In UC #2, the project members are working on a variety of techniques for designing an effective congestion avoidance mechanism, based on the principles of fairness, statistics, machine learning and time series analysis. Our goal is to design a distributed protocol that can rapidly approximate the max-min fair share across the network, that is, a fair share of available bandwidth between existing flows without wasting any resources.
In an environment such as the Internet, where huge amounts of heterogeneous traffic traverse complex network topologies every second, the problem of approaching max-min fair rates efficiently in practical scenarios remains unresolved. There exists a wide variety of protocols and algorithms that try to combat congestion or maximize bandwidth usage. Perhaps the most well-known one is the avoidance and control scheme of TCP Reno, which increases the congestion window linearly (after an initial quadratic period) until packet loss is detected, triggering a multiplicative decrease of the transmission rate. Other mechanisms, implemented in routers, resort to local actions and/or signaling when congestion is detected in their queues. This can be done by dropping packets or by flipping the explicit congestion notification (ECN) bits in the IP header. More recently, certain protocols have been proposed to notify sources of
1 https://www.alienvault.com/products Indeed, only the demo version of the tool was tested and evaluated, as the price of the tool was not affordable.

619633 ONTIC. Deliverable D5.2: Progress on Use Cases
18 / 80
! !the exact transmission rates that they are should use for optimal link utilization. As previously stated, a more detailed overview can be found in D5.1 [1].
Existing congestion control and avoidance techniques present certain issues. These, along with certain challenges that must be addressed by congestion control protocols in general, can be summarized as follows:
• Scalability: protocols must not be dependent on the number of flows that are traversing the network and must continue to behave in a stable manner when the size of the network grows.
• TCP friendliness: Since TCP is still predominant in today’s Internet, new protocols must not be sensitive to its presence nor should they interfere with its operation or impact on its performance. A negative impact that congestion control schemes can have on TCP is the problem of global synchronization, that is, the simultaneous reaction of all TCP sources crossing a TailDrop link.
• Misbehaving hosts: This is a self-evident and complex problem which remains unresolved for many network protocols and systems. Orthogonal means, such as real-time protection mechanisms (see UC #1) need to be in place since the malicious behavior of sources seem infeasible to be predicted.
RED and WRED [12], which are perhaps the most widely deployed router congestion control algorithms, address some of the above issues. By randomly dropping a selection of packets, they avoid congestion built-up without causing global synchronization. In addition, they do not need to store per-flow information and are specifically designed for TCP. However, RED and WRED are sensitive to their parameters, which are very difficult to tune [13]. Although there have been attempts to overcome this, the suggested approaches have not been widely tested and deployed.
The family of protocols known as Explicit End-to-End Rate Control (EERC) constitutes a promising area of research, since they explicitly allocate bandwidth for each session depending on link capacities and path constraints. Existing explicit rate allocation mechanisms in the literature, however, present two key problems:
• Scalability: Via simulations, we have observed that the most representative of these proposals either store per-flow information in the router or suffer from heavy oscillations in the computed rates when the network size and complexity grows.
• Signaling delays: Another fundamental problem is the time it takes for rate allocation signals to reach the corresponding sources. In a highly dynamic environment such as the Internet, where the number and nature of sessions crossing the network is constantly changing, a decision made at a network link might be outdated once it reaches the recipient hosts.
This approach to congestion control is currently receiving attention from key figures in the field of computer networks such as Nick McKeown, Professor of Computer Science and Electrical Engineering at Stanford University and one of the main contributors to the creation of Software Defined Networking (SDN) and OpenFlow. Prof. McKeown’s team has recently published several works on explicit rate allocation for congestion control [23] and has contacted us in order to share the code of our previous congestion control proposal SLBN [14] to be included in a benchmark paper his team is preparing.
UC #2 aims at providing a distributed congestion control protocol that successfully overcomes the above issues, leveraging the ML-based short-term forecasting algorithms developed by the project. It is described in section 8.3 .
619633 ONTIC. Deliverable D5.2: Progress on Use Cases
19 / 80
! !7.4 Use Case #3 - Adaptive QoE Control
UC #3 addresses the problem of Adaptive QoE (AQoE) management. It is built around two main concepts: (a) the online detection of Quality of Experience degradation situations, and (b) the use of such insights to trigger mitigation actions so that the QoE in a telecommunication network is enhanced.
Execution of said alleviation policies will take advantage of the availability of a comprehensive framework able to (a) gather the generation of analytics insights, (b) determine what to do (which actions to perform) upon reception of an insight, and (c) execute the determined actions. In [8], Ericsson introduced the COMPA (Control/Orchestration/Management/Policy/Analytics) architectural model, which aims to simplify the operations both in management and business processes of a telecommunication network. It consists of several components outlined below:
• Analytics is in charge of turning data into information and insights that serve as a basis for decision making and triggering actions.
• Policy is a function that governs the behavior of a telecommunication system.
• Management is the function that, operating in full lifecycles, coordinates the efforts to accomplish goals and objectives using available resources efficiently and effectively.
• Control is responsible for negotiating, establishing, maintaining and terminating dynamic data/user plane connections.
• Orchestration describes the automated arrangement, coordination, and (resource) management of complex communications systems, middleware, and services (including networking).
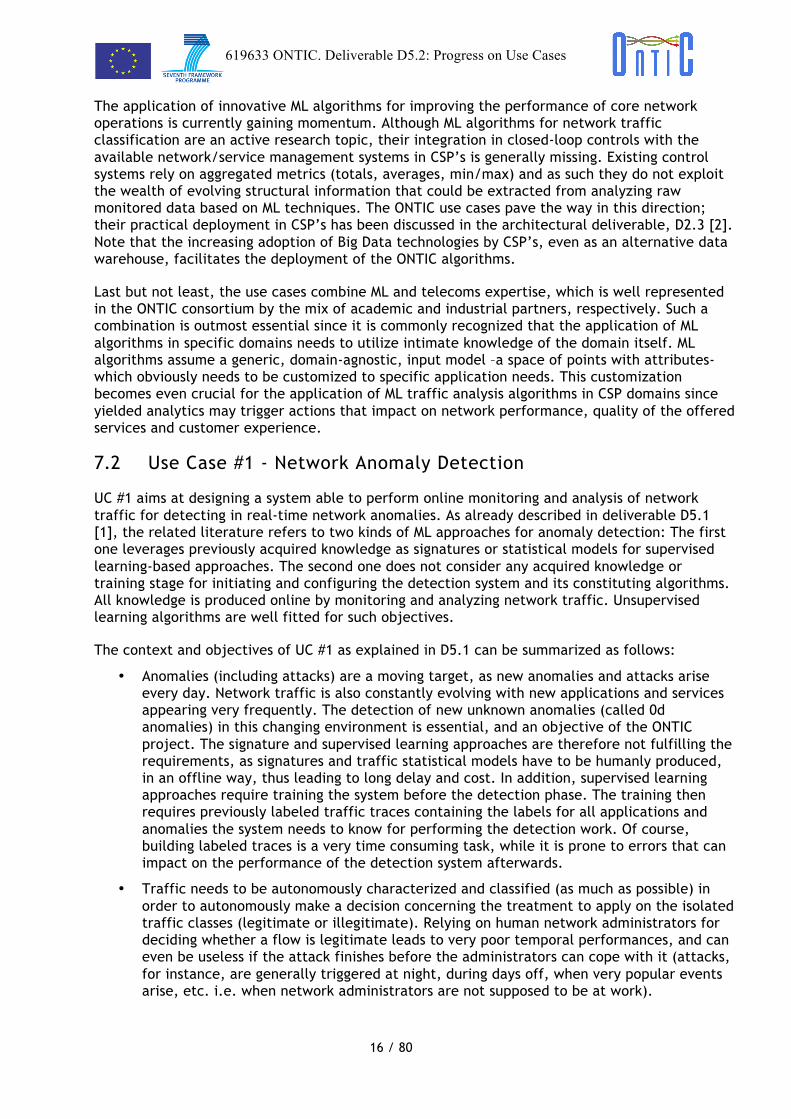
The control loop described by COMPA begins with the Analytics function. It processes data and applies analytics to discover and understand trends and patterns. Next, it sends the corresponding insight as a Policy Trigger (along with the context garnered from the insight) into the Policy function. The Policy function establishes the network situation led by the trigger and either recommends a set of actions or decides to take direct action(s) on the system. The Policy function sends the outcome of its decision making as a request to COM (collectively denoting the Control, Orchestration and Management functions). Upon receiving a request, COM attempt to act on it. The final results are vendor-, node-, and domain-specific actions that can be enforced. The internal feedback shown in Figure 1 allows the loop to self-stabilize. Feedback from requests can direct future decision making.
Figure 1: Automated Management Control Loop pattern

619633 ONTIC. Deliverable D5.2: Progress on Use Cases
20 / 80
! !The Adaptive QoE scenario of UC #3 fits very well into the above model and therefore its architecture (presented in D5.1) has been aligned with the COMPA architecture. In particular, the Analytics Function identified in the Adaptive QoE scenario has been modelled as the “A” in COMPA while the functionalities assigned to the Policy Governance Module have been mapped to the “P” in COMPA.
To the end of distilling QoE insights from raw network data, the Analytics Function utilizes ML algorithms across three different families:
1. unsupervised learning, 2. supervised learning, and 3. frequent itemset mining with association rule extraction.
These algorithms, each from its own perspective, try to spot out current and evolutionary traffic patterns indicating or (proved of) causing QoE degradation. Note that the policy- policy-based design of the QoE use case can afford non-stringent predictions in terms of accuracy and time window ahead.
Unsupervised techniques, i.e. clustering, are used to analyze unlabeled data. The basic idea is to split the input dataset into heterogeneous clusters, minimizing intra-cluster differences. The approach allows us to summarize the original data into a relatively small set of clusters that can be manually handled and deeply analyzed as homogeneous aggregates. In the specific application context, the input dataset is represented by a collection of network flows that need to be appropriately characterized so that unsupervised clustering techniques are able to group together traces enjoying QoE at similar levels. These techniques usually require configuration parameters which can be challenging to tune up, especially when dealing with very large amount of data. For this reason, we have developed clustering implementations able to automatically find the best parameter configuration (see FreeScan in D3.2 [4]).
For asserting on the levels of provided QoE, clustering quality becomes critical. The evaluation of the clustering quality is a very challenging task in a Big Data context, because of the lack of scalable evaluators able to address non-convex cluster shapes in high-dimensional datasets. To this end, we have introduced DiSiLike (see D3.2), a scalable distributed Silhouette-like tool to measure clustering quality. Both FreeScan and DiSiLike contribute to the SaFe-NeC framework (see D3.2 [4]), which aims at providing a semi-automatic network traffic characterization tool. In SaFe-NeC, the self-learning nature of the clustering technique, coupled with the self-assessment indicators and domain-driven semantics used to enrich the data mining results, are used to build a model from the data. The process requires minimal user intervention and allows to highlight potential meaningful interpretation to domain experts. At the same time, the framework is able to track the quality degradation of the model itself, hence being a promising tool for the QoE evaluation and prediction.
Supervised learning algorithms are a set of techniques able to analyze labeled data and predict the proper labels for unclassified data. The principle is to create a model by analyzing a training dataset and apply the model to new unlabeled data. In a networking environment, a common application is the classification of the application service from flow datasets, such as video streaming, P2P traffic, VoIP, etc. In such context, we have developed BAC (see D3.2), a scalable classifier which leverages bagging and association rules to compute data classification. The capability to handle very large datasets while providing good predictions is a key component in addressing QoE by combining information about the number of active flows per application service.
The last family of techniques includes Frequent Itemset Mining algorithms, which aim to extract frequent co-occurring set of objects / items and highlight hidden correlations among data. Currently, a set of Apache Hadoop and Spark frequent itemset miners able to deal with large

619633 ONTIC. Deliverable D5.2: Progress on Use Cases
21 / 80
! !amount of transactions are available. However, these approaches have very low performance with datasets with a lot of features. Hence, we introduced PaMPa-HD, a Parallel MapReduce-based frequent closeditemset mining algorithm for high-dimensional datasets. The algorithm is able to scale with the number of features, allowing to process very high-dimensional datasets, which are very common in many domains. In the specific context of network traffic analysis, datasets with hundreds of features for each flow can be translated into thousand-feature datasets when multiple temporally-adjacent flows are considered as a single transaction. Hence, such high-dimensional traffic datasets allow us to address the temporal evolution of network traffic, which is essential for predicting QoE.
Finally, PaWI, a Parallel Weighted Itemset miner, allows us to include item relevance weights into the mining process. The technique, which is a major extension of traditional mining algorithms, allows network domain experts to drive the itemset extraction with an ad-hoc weight assignment. This enables highlighting the behavior of different classes of traffic with respect to QoE.
Finally, it is worthy to mention that, provided that the use case focuses on video services, the following tools will be used for the implementation and test of certain aspects of UC #3 functionalities, mainly those related to the capturing and pre-processing of video traces:
• VideoLAN (VLC),2 a free and open source cross-platform multimedia player and framework able to play most multimedia files as well as various streaming protocols.
• Tstat v3.0,3 a passive sniffer able to provide insights on the traffic patterns at both the network and the transport levels.
2 http://www.videolan.org/ 3 http://tstat.polito.it/
619633 ONTIC. Deliverable D5.2: Progress on Use Cases
22 / 80
! !8. Use Cases Description
8.1 Use cases, epics and user stories
In this section we provide a detailed description of the three different scenarios addressed by ONTIC by means of user stories:
1. Use Case #1. Network Anomaly Detection
2. Use Case #2. Proactive Congestion Detection and Control
3. Use Case #3. Adaptive Quality of Experience (QoE) Control
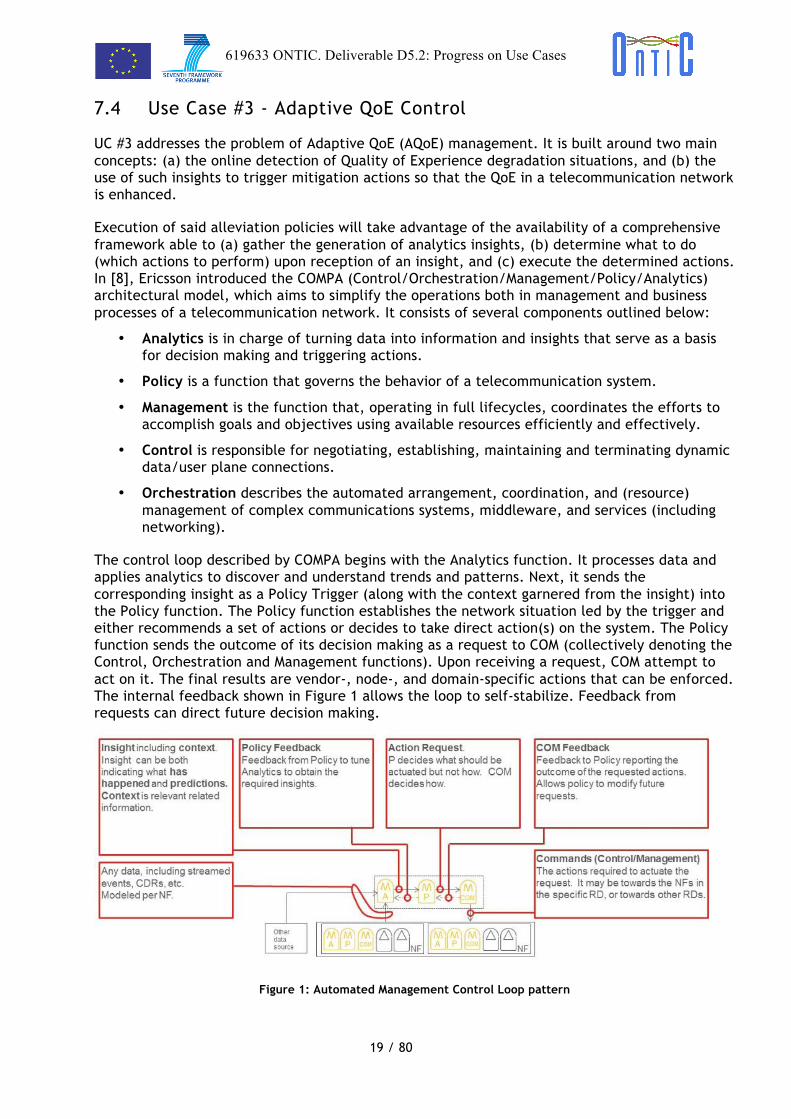
In accordance with the Agile methodology, the use cases have been turned into so-called epics (high level user stories). However, although in D5.1 [1] a common epic was introduced to cover both UC #2 and UC #3, in order to clarify the scope of each use case, a different epic has been provided. Additionally, new user stories have been introduced while existing ones have been refined.
Use Case (ONTIC DoW)
Epic (as translated in
project execution time)
User Stories (as working items)
UC #1 - Network Anomaly Detection
User Story 1 (UC #1): As a CSP or ISP network administrator, I want an autonomous method for detecting and characterizing traffic anomalies, so that it makes it possible to autonomously and efficiently manage them.
US 1.1
As a CSP or ISP network administrator, I want a mining mechanism, so that traffic classes can be autonomously distinguished.
US 1.2
As a CSP or ISP network administrator, I want a discrimination mechanism so that anomaly signatures can be autonomously issued.
US 1.3 As a CSP or ISP network administrator, I want a ranking score for assessing the abnormality and dangerousness of anomalies, so that an autonomous process can choose between discarding attacks and coping with legitimate anomalies.
US 1.4 As a CSP or ISP network administrator, I want to have monitoring tools and exchange formats and protocols, so that the results from both traffic monitoring and anomaly detection algorithms can be displayed live.
UC #2 - Proactive Congestion Detection and Control
User Story 2 (UC #2) As a CSP or ISP network administrator, I want to have a bandwidth allocation protocol that rapidly maximizes the utilization of available resources, distributes them fairly among
US 2.1
As a CSP or ISP network administrator, I want to have a bandwidth sharing mechanism that is deployable in an incremental manner, so that I can progressively adapt my infrastructure.
US 2.2 As a CSP or ISP network administrator, I want to have a bandwidth sharing mechanism that scales well with traffic volume and client count, so that it can remain effective when my network grows in size.
619633 ONTIC. Deliverable D5.2: Progress on Use Cases
23 / 80
! !existing users and prevents links from becoming congested, so that I can provide a better service to my customers while maximizing resource utilization.
US 2.3 As a CSP or ISP network administrator, I want to have a bandwidth sharing mechanism that detects and reacts to misbehaving hosts, so that my network remains operational in case of unexpected or malicious user behavior.
US 2.4 As a CSP or ISP network administrator, I want to have a bandwidth sharing mechanism that can detect trends in its variables and make reliable forecasts, so that rate assignments correspond to an up-to-date state of the network when the source nodes become aware of them.
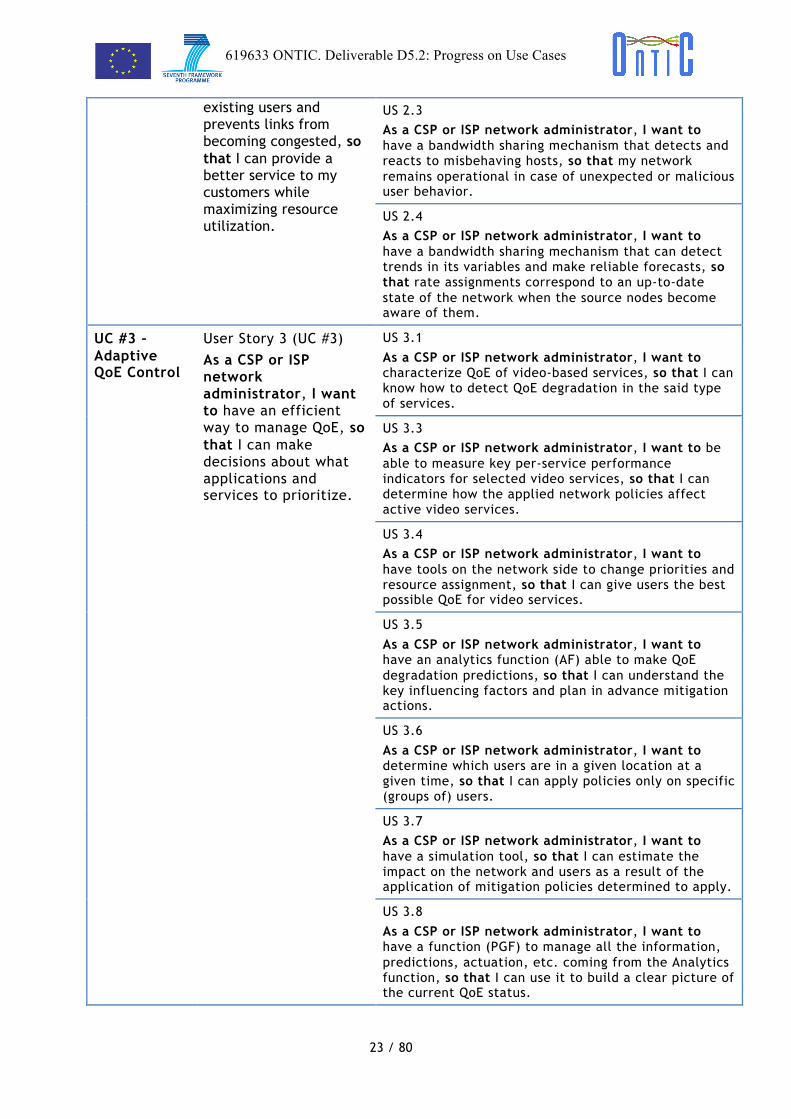
UC #3 - Adaptive QoE Control
User Story 3 (UC #3) As a CSP or ISP network administrator, I want to have an efficient way to manage QoE, so that I can make decisions about what applications and services to prioritize.
US 3.1
As a CSP or ISP network administrator, I want to characterize QoE of video-based services, so that I can know how to detect QoE degradation in the said type of services.
US 3.3 As a CSP or ISP network administrator, I want to be able to measure key per-service performance indicators for selected video services, so that I can determine how the applied network policies affect active video services.
US 3.4 As a CSP or ISP network administrator, I want to have tools on the network side to change priorities and resource assignment, so that I can give users the best possible QoE for video services.
US 3.5
As a CSP or ISP network administrator, I want to have an analytics function (AF) able to make QoE degradation predictions, so that I can understand the key influencing factors and plan in advance mitigation actions.
US 3.6
As a CSP or ISP network administrator, I want to determine which users are in a given location at a given time, so that I can apply policies only on specific (groups of) users.
US 3.7 As a CSP or ISP network administrator, I want to have a simulation tool, so that I can estimate the impact on the network and users as a result of the application of mitigation policies determined to apply.
US 3.8
As a CSP or ISP network administrator, I want to have a function (PGF) to manage all the information, predictions, actuation, etc. coming from the Analytics function, so that I can use it to build a clear picture of the current QoE status.
619633 ONTIC. Deliverable D5.2: Progress on Use Cases
24 / 80
! !Table 2: Use Cases (DoW) − Epics − User Stories correlation
8.2 UC #1 (User Story 1): Network Anomaly Detection
8.2.1 Scenario description
As stated in D5.1 [1], network anomaly detection is a vital component of any network in today’s Internet. Ranging from non-malicious unexpected events such as flash-crowds and failures, to network attacks such as denials-of-service and network scans, network traffic anomalies can have serious detrimental effects on the performance and integrity of the network. The principal challenge in automatically detecting and characterizing traffic anomalies is that these are moving targets. It is difficult to precisely and permanently define the set of possible anomalies that may arise, especially in the case of network attacks, because new attacks as well as new variants of already known attacks are continuously emerging. A general anomaly detection system should therefore be able to detect a wide range of anomalies with diverse structures, using the least amount of previous knowledge and information, ideally none.
ONTIC UC #1 aims at designing a new autonomous anomaly detection system based on original unsupervised machine learning algorithms designed for that purpose. The most important feature of the anomaly detector under design is that it does not rely on previously acquired knowledge, it does not need any training phase or labeled data, and it is expected not to leverage on a human operator for making a decision on the status of detected anomalies (legitimate vs. attack or intrusion for instance). It aims also at triggering the appropriate counter-measures.
However, based on the second year research results in WP4, it appears that it would not be possible for the anomaly detection to autonomously make a decision for all anomalies. The new functionality that is required, and has been added in the design of the new anomaly detection system is a network traffic analytic dashboard. It aims at providing the human administrator with the required elements gained by the detection algorithms in order for her/him to decide whether the anomaly is legitimate or not, and apply the suited counter-measure. It includes two sets of information:
• Legacy monitoring information on the flowing traffic.
• The characteristics of the detected anomalies as determined by the employed autonomous traffic clustering algorithm, as well as traffic statistics associated to the period in which the anomalies have been detected.
8.2.2 User Requirements
The functional specification for UC #1 is described as a set of user stories exposed below:
• As a CSP or ISP network administrator, I want an autonomous method for detecting and characterizing traffic anomalies, so that it makes it possible to autonomously and efficiently manage them.
o User Story 1.1: As a CSP or ISP network administrator, I want a mining mechanism, so that traffic classes can be autonomously distinguished.
• User Story 1.1.1: As a CSP or ISP network administrator, I want to have efficient monitoring and unsupervised clustering techniques and related analytics, so that I can autonomously classify the network traffic. →Implementation ongoing
o User Story 1.2: As a CSP or ISP network administrator, I want a discrimination mechanism, so that anomaly signatures can be autonomously issued.
619633 ONTIC. Deliverable D5.2: Progress on Use Cases
25 / 80
! !• User Story 1.2.1: As a CSP or ISP network administrator, I want to have
mechanisms for identifying the most significant traffic attributes, so that it becomes possible to issue traffic class discrimination rules. → Implementation ongoing
o User Story 1.3: As a CSP or ISP network administrator, I want a ranking score for assessing the abnormality and dangerousness of anomalies, so that an autonomous process can choose between discarding attacks and coping with legitimate anomalies
• User Story 1.3.1: As a CSP or ISP network administrator, I want to have accurate abnormality scores, so that it becomes possible to autonomously discriminate between legitimate and illegitimate traffic classes. → Implementation ongoing
o User Story 1.4: As a CSP or ISP network administrator, I want to have monitoring tools and exchange formats and protocols, so that the results from both traffic monitoring and anomaly detection algorithms can be displayed live.
• User Story 1.4.1: As a CSP or ISP network administrator, I want to have a data network traffic dashboard to show traffic and flow statistics, anomaly detection details, etc., so that I will be able to analyze data traffic features and to study in deep the anomalies detected.
- User Story 1.4.1.1: As a CSP or ISP network administrator, I want to get traffic analysis charts, so that I can have a well-aimed knowledge about the state of the network.
» User Story 1.4.1.1.1: As a CSP or ISP network administrator, I want to get a traffic analysis visualization tool, so that I can view overall traffic statistics regarding IPs, ports, type of service, bytes, etc. → Implementation ongoing
» User Story 1.4.1.1.2: As a CSP or ISP network administrator, I want to get a flow analysis tool, so that I can view precise statistics related to traffic flows, such as conversations. → Implementation ongoing
» User Story 1.4.1.1.3: As a CSP or ISP network administrator, I want the anomaly detection tool to show a warning message whenever an anomaly has been detected, so that I can become aware of the situation any time it happens and obtain further information by accessing the tool. → Implementation ongoing
» User Story 1.4.1.1.4: As a CSP or ISP network administrator, I want to be able to specify the time interval the traffic analysis refers to by choosing between the last minutes (counted from current time) or a time interval specified by arbitrary start and end times and dates, so that I have a flexible way to review the traffic and get further details of any anomaly or relevant event. → Implementation ongoing
- User Story 1.4.1.2: As a CSP or ISP network administrator, I want to get an anomaly detection tool, so that whenever a traffic anomaly is detected I will be aware of it at once, along with its details, and I can check traffic statistics for the specific period when the anomaly happened. → Implementation ongoing
619633 ONTIC. Deliverable D5.2: Progress on Use Cases
26 / 80
! !- User Story 1.4.1.3: As a CSP or ISP network administrator, I want to
have a set of administration procedures, so that it is possible to manage and configure different system features. → Implementation ongoing.
- User Story 1.4.1.4: As a CSP or ISP network administrator, I want to have a login/password authentication procedure, so that it is possible to prevent unauthorized parties from accessing the anomaly detection tool. → Implementation ongoing
8.2.3 System model
8.2.3.1 Functionalities
Based on the specification of the user stories US 1.1 through US 1.4, two main system functions need to be provided: (a) an autonomous system for detecting and characterizing traffic anomalies, making it possible to autonomously and efficiently manage them, and (b) a dashboard for enabling network operators to access details about network traffic features and statistics, near real-time, anomalies detected and traffic behavior during the periods in which the anomalies are detected.
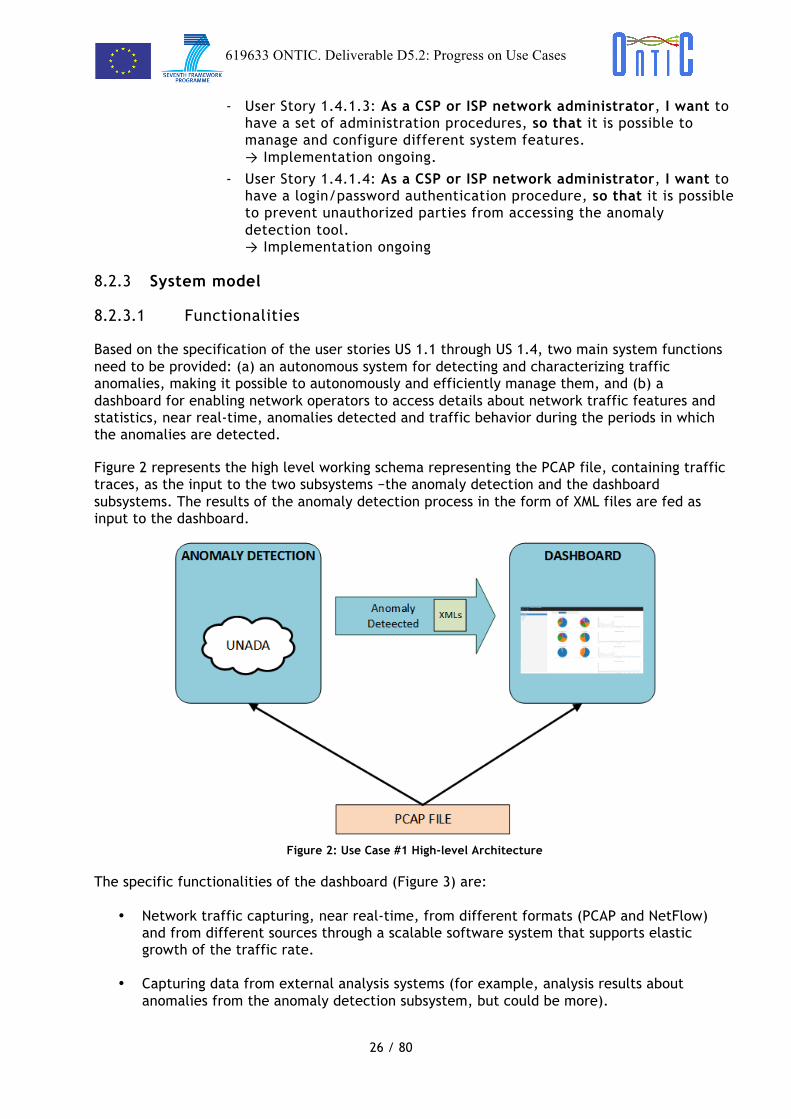
Figure 2 represents the high level working schema representing the PCAP file, containing traffic traces, as the input to the two subsystems −the anomaly detection and the dashboard subsystems. The results of the anomaly detection process in the form of XML files are fed as input to the dashboard.
Figure 2: Use Case #1 High-level Architecture
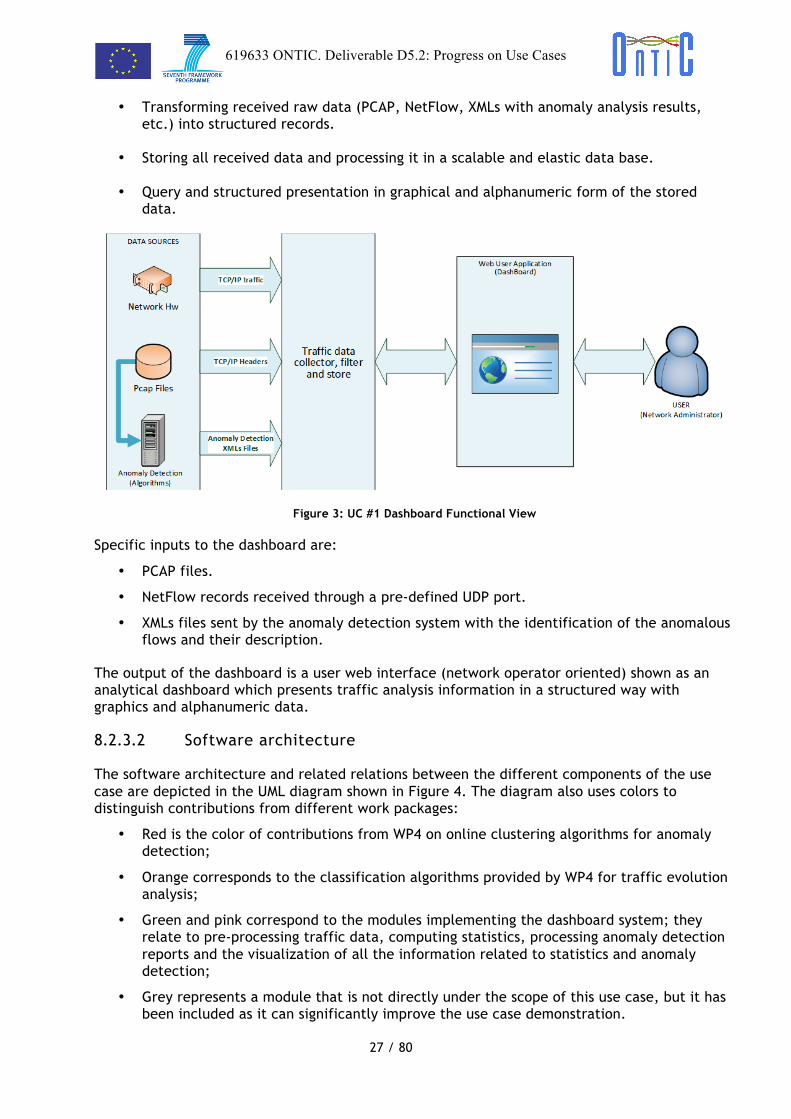
The specific functionalities of the dashboard (Figure 3) are:
• Network traffic capturing, near real-time, from different formats (PCAP and NetFlow) and from different sources through a scalable software system that supports elastic growth of the traffic rate.
• Capturing data from external analysis systems (for example, analysis results about anomalies from the anomaly detection subsystem, but could be more).
619633 ONTIC. Deliverable D5.2: Progress on Use Cases
27 / 80
! !• Transforming received raw data (PCAP, NetFlow, XMLs with anomaly analysis results,
etc.) into structured records.
• Storing all received data and processing it in a scalable and elastic data base.
• Query and structured presentation in graphical and alphanumeric form of the stored data.
Figure 3: UC #1 Dashboard Functional View
Specific inputs to the dashboard are:
• PCAP files.
• NetFlow records received through a pre-defined UDP port.
• XMLs files sent by the anomaly detection system with the identification of the anomalous flows and their description.
The output of the dashboard is a user web interface (network operator oriented) shown as an analytical dashboard which presents traffic analysis information in a structured way with graphics and alphanumeric data.
8.2.3.2 Software architecture
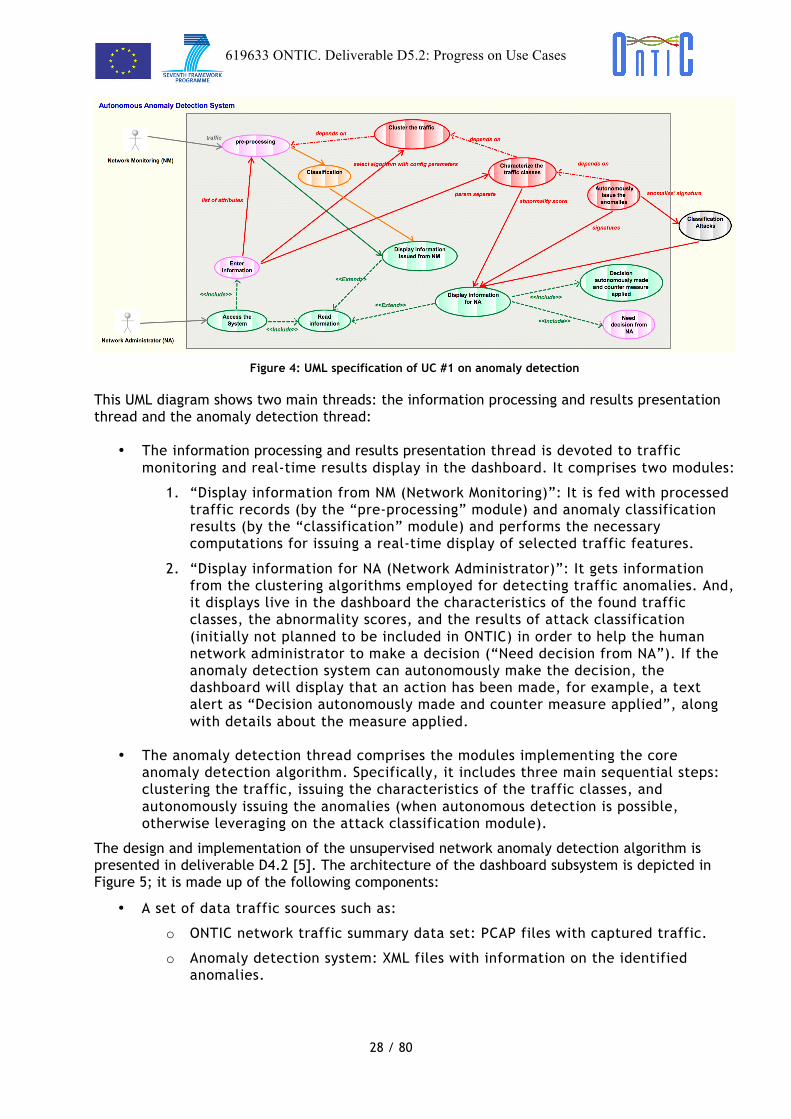
The software architecture and related relations between the different components of the use case are depicted in the UML diagram shown in Figure 4. The diagram also uses colors to distinguish contributions from different work packages:
• Red is the color of contributions from WP4 on online clustering algorithms for anomaly detection;
• Orange corresponds to the classification algorithms provided by WP4 for traffic evolution analysis;
• Green and pink correspond to the modules implementing the dashboard system; they relate to pre-processing traffic data, computing statistics, processing anomaly detection reports and the visualization of all the information related to statistics and anomaly detection;
• Grey represents a module that is not directly under the scope of this use case, but it has been included as it can significantly improve the use case demonstration.
619633 ONTIC. Deliverable D5.2: Progress on Use Cases
28 / 80
! !
Figure 4: UML specification of UC #1 on anomaly detection
This UML diagram shows two main threads: the information processing and results presentation thread and the anomaly detection thread:
• The information processing and results presentation thread is devoted to traffic monitoring and real-time results display in the dashboard. It comprises two modules:
1. “Display information from NM (Network Monitoring)”: It is fed with processed traffic records (by the “pre-processing” module) and anomaly classification results (by the “classification” module) and performs the necessary computations for issuing a real-time display of selected traffic features.
2. “Display information for NA (Network Administrator)”: It gets information from the clustering algorithms employed for detecting traffic anomalies. And, it displays live in the dashboard the characteristics of the found traffic classes, the abnormality scores, and the results of attack classification (initially not planned to be included in ONTIC) in order to help the human network administrator to make a decision (“Need decision from NA”). If the anomaly detection system can autonomously make the decision, the dashboard will display that an action has been made, for example, a text alert as “Decision autonomously made and counter measure applied”, along with details about the measure applied.
• The anomaly detection thread comprises the modules implementing the core anomaly detection algorithm. Specifically, it includes three main sequential steps: clustering the traffic, issuing the characteristics of the traffic classes, and autonomously issuing the anomalies (when autonomous detection is possible, otherwise leveraging on the attack classification module).
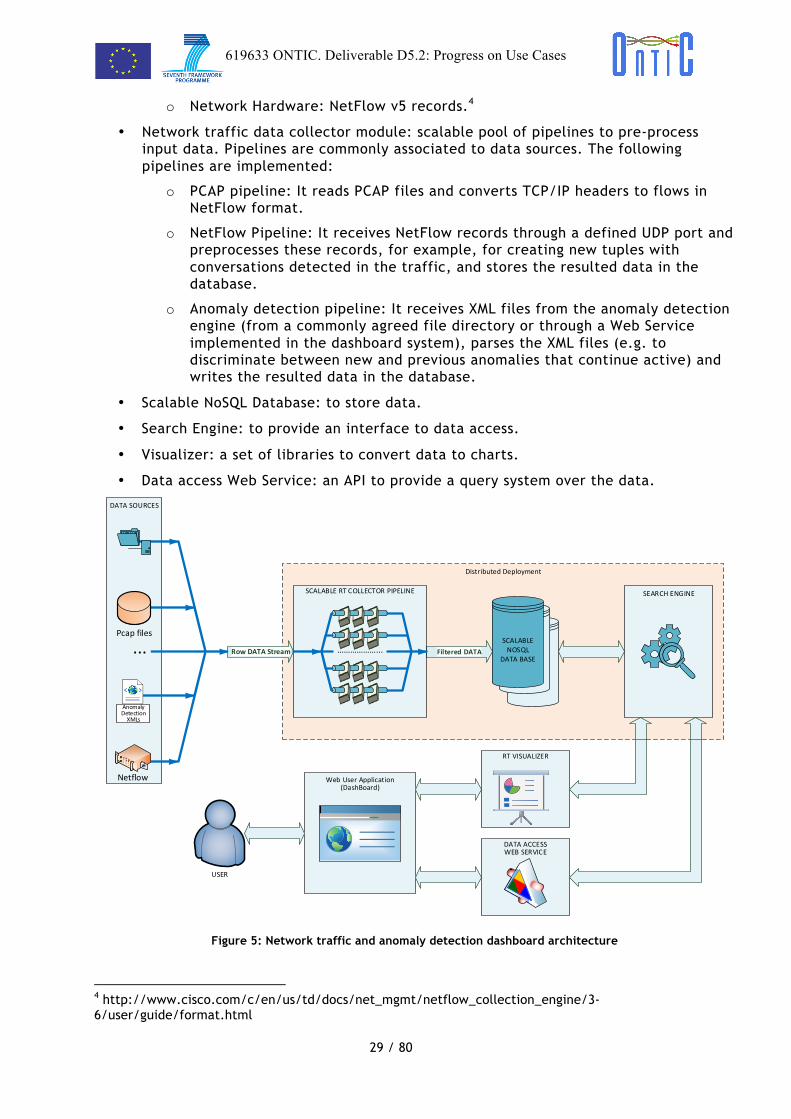
The design and implementation of the unsupervised network anomaly detection algorithm is presented in deliverable D4.2 [5]. The architecture of the dashboard subsystem is depicted in Figure 5; it is made up of the following components:
• A set of data traffic sources such as:
o ONTIC network traffic summary data set: PCAP files with captured traffic.
o Anomaly detection system: XML files with information on the identified anomalies.
619633 ONTIC. Deliverable D5.2: Progress on Use Cases
29 / 80
! !o Network Hardware: NetFlow v5 records.4
• Network traffic data collector module: scalable pool of pipelines to pre-process input data. Pipelines are commonly associated to data sources. The following pipelines are implemented:
o PCAP pipeline: It reads PCAP files and converts TCP/IP headers to flows in NetFlow format.
o NetFlow Pipeline: It receives NetFlow records through a defined UDP port and preprocesses these records, for example, for creating new tuples with conversations detected in the traffic, and stores the resulted data in the database.
o Anomaly detection pipeline: It receives XML files from the anomaly detection engine (from a commonly agreed file directory or through a Web Service implemented in the dashboard system), parses the XML files (e.g. to discriminate between new and previous anomalies that continue active) and writes the resulted data in the database.
• Scalable NoSQL Database: to store data.
• Search Engine: to provide an interface to data access.
• Visualizer: a set of libraries to convert data to charts.
• Data access Web Service: an API to provide a query system over the data.
Figure 5: Network traffic and anomaly detection dashboard architecture
4 http://www.cisco.com/c/en/us/td/docs/net_mgmt/netflow_collection_engine/3-6/user/guide/format.html
Web User Application(DashBoard)
Distributed Deployment
DATA ACCESS WEB SERVICE
DATA SOURCES
SCALABLE NOSQL
DATA BASE
Netflow
Pcap files
...
RT VISUALIZER
SEARCH ENGINE
Filtered DATA
USER
Anomaly Detection XMLs
SCALABLE RT COLLECTOR PIPELINE
………………...
619633 ONTIC. Deliverable D5.2: Progress on Use Cases
30 / 80
! !8.2.3.3 Enabling technologies
The technologies, products, and libraries used to implement the use case are:
• Apache Spark 1.5.15 as cluster computing framework.
• Apache Kafka 2.106 as message broker.
• Elasticsearch 1.7.37 as NoSQL Data Base.
• D3.js (3.5.12) / C3.js (0.4-10)8, JavaScript libraries for data visualizations.
8.2.3.4 API specification
The output interface defined for the anomaly detection engine is a XML generator (it generates XML files periodically at specified time intervals). Each XML contains a list of attributes that define the anomalies detected in the period.
The dashboard receives and processes the XML files as soon as they arrive. Two such interface means are provided: through files written into a defined file directory or through a Web Service interface implemented in the dashboard system to which XMLs could be sent continuously.
The following DTD defines the legal building blocks of the XML files sent by the anomaly detection engine to the dashboard. It describes the document structure with a list of legal elements and attributes. The DTD is associated to a particular XML document by means of a document type declaration (DOCTYPE):
<!DOCTYPE UNADA SYSTEM "/path/to/file.dtd"> <!DOCTYPE UNADA[ <!ELEMENT UNADA (anomaly+)> <!ELEMENT anomaly(flow, signature)> <!ELEMENT flow (attributes+)> <!ELEMENT attribute (#PCDATA)> <!ELEMENT signature (rule+)> <!ELEMENT rule> <!ATTLIST UNADA start CDATA #REQUIRED> <!ATTLIST UNADA end CDATA #REQUIRED> <!ATTLIST UNADA file CDATA #REQUIRED> <!ATTLIST UNADA aggreg CDATA #REQUIRED> <!ATTLIST anomaly type CDATA #REQUIRED> <!ATTLIST flow id CDATA #REQUIRED> <!ATTLIST attribute dim CDATA #REQUIRED> <!ATTLIST signature scoreDiss CDATA #REQUIRED> <!ATTLIST rule dir CDATA #REQUIRED> <!ATTLIST rule dim CDATA #REQUIRED> <!ATTLIST rule value CDATA #REQUIRED>
])
5 http://spark.apache.org/ 6 http://kafka.apache.org/ 7 https://www.elastic.co/products/elasticsearch 8 http://c3js.org/
619633 ONTIC. Deliverable D5.2: Progress on Use Cases
31 / 80
! !8.2.4 Performance Evaluation
8.2.4.1 Relevant Metrics
8.2.4.1.1 Anomaly Detection
The evaluation of the anomaly detection system is two-fold. It consists of evaluating both the quality of the detection (as well as the classification) of the anomalies in the traffic, and the detection time (it is expected to have a fast response for being able to trigger counter measures for mitigating the anomalies).
Detection quality
The evaluation of the detection and classification quality relies on the use of classical metrics, as TPR (True Positive Rate), FPR (False Positive Rate), FNR (False Negative Rate), and ROC curves (Receiver Oriented Curves).
• TPR is the ratio between the number of well detected (or well classified) anomalies and the total number of anomalies.
• FPR is the ratio between the number of wrongly detected anomalies and the total number of anomalies. It corresponds to a system detecting anomalies that do not actually exist in the traffic.
• FNR is the ratio between the number of undetected anomalies and the total number of anomalies. It corresponds to the number of anomalies the system was unable to detect.
• A ROC curve is the representation of the TPR depending on the number of wrong detections, with wrong detections being the sum of FPR and FNR. On such a curve, the line TPR=FPR+FNR corresponds to the performance of a random detection process. The ideal curve has the equation TPR=1 for FPR+FNR>0. The closest from this top line, the better the detection system.
Detection time
The detection time is the time that elapses between the moment the first packet of an anomalous flow enters the network and the moment the detection system raises an alarm for this flow. This obviously relates to the time required for ingesting data to the system and the execution time of the detector.
8.2.4.1.2 Dashboard
The main metrics defined for the dashboard software application are:
• The time required to export PCAP to NetFlow files.
• The time required to process NetFlow packets and send them to the database.
• The time required to import all processed NetFlow packets into the database.
• The time required to execute queries to the database as a function of the size of the data stored.
8.2.4.2 Mechanisms
8.2.4.2.1 Anomaly Detection
Performing such a quality evaluation of the detection system requires a set of labeled traces, i.e. traces for which all anomalies are known and labeled. This is practically a very strong
619633 ONTIC. Deliverable D5.2: Progress on Use Cases
32 / 80
! !constraint, and really impossible to respect. Indeed, two kinds of labeled traces exist: synthetic and real.
Synthetic traces are traces that have been built for that purpose. It consists of traffic (real or artificially generated) in which artificial anomalies have been injected. The advantage of this approach is that all anomalies are perfectly known and classified. The main drawbacks are related to the unfortunately limited number of anomalies and anomaly kinds injected, and their limited realism. Examples of such traces include the famous KDD dataset that has been widely used for years. Its advantage is its availability, and remains today the largest dataset of this kind. On the other side, it is quite aged.
Real labeled traces are traces that have been collected on real commercial or public networks, and for which an anomaly detection process has been applied for detecting the anomalies contained in the trace. This process can be handmade in some cases, or rely on existing anomaly detection tools. The advantage of this kind of labeled traces is its realism, and it is interesting for evaluation purposes. On the other side, it is not guaranteed that the applied detection process detected all anomalies and that the detected anomalies have been well classified. It can therefore lead to errors and unfair deviations when the evaluation of a new detection tool relies on such traces. Up to our knowledge, the largest publicly available dataset of this kind has been collected by the MAWI working group of the WIDE project9 on a trans-Pacific link between Japan and USA. Traces are collected every day since year 2000 on the basis of 15 minutes of traffic collected every day, plus on some particular days, full day traces.
The anomaly detection system developed for UC #1 will be evaluated on these two kinds of datasets, namely KDD’99 and MAWI. We also intend to create our own synthetic dataset in order to include more recent anomalies and attacks than the one included in KDD’99. Finally, even though the ONTS dataset is not labeled and cannot be used directly to measure the accuracy of our algorithms, the project members still plan to take advantage of its availability. Once the anomaly detection system has been validated based on the synthetic traces, it will be used for discovering and classifying the anomalies contained in the ONTS traffic dataset. In addition, an exploratory analysis process will also be performed in order to locate possible anomalies in the collected traffic. If any anomalies are located, the labels will be used to validate the ONTIC methods against existing unsupervised anomaly detection algorithms.
8.2.4.2.2 Dashboard
In this section we discuss the performance of the dashboard and we analyze the system to detect the bottlenecks and obtain an estimate of hardware resources and architecture needs to monitor the links. The dashboard system performs two main tasks: processing incoming NetFlow data and output to dashboard.
For analyzing the performance of the NetFlow information storage procedure the following tasks have to be considered:
• Processing headers to export them as NetFlow version 5 data.
• Processing NetFlow version 5 data and shipment to the database.
• The insertion in the database.
For displaying the information the following considerations have to be taken into account:
• Implementing web services to request information and return graphical results and ensuring that the throughput is high enough to avoid information loss.
9 http://mawi.wide.ad.jp/mawi/

619633 ONTIC. Deliverable D5.2: Progress on Use Cases
33 / 80
! !• Implementing the queries from the dashboard business logic to the database.
• The drawing procedure at the browser.
Thus, the dashboard system has to support insertions in the database (from the collectors) and queries to draw the analysis results (through the web server) at the same time. This is the main challenge: to make our system able to provide a fast and reliable response for these operations.
In order to test the internal dashboard performance and to detect possible bottlenecks the following tests are proposed:
• Measuring the processing time for the component that reads the contents of PCAP files and exports them to the next pipeline step (PCAP to NetFlow converter).
• Measuring the processing time for the component which processes the NetFlow records and send them to the database queue.
To test the database insertion time we need to have a sizeable amount of data to insert. This data would allow us to appropriately configure the database. Our web server handles static documents with very high output rates. A high database query load, however, requires long periods of time. A good performance of database queries is therefore crucial for a good user experience.
Finally, rendering the main page and charts in the browser relies on the computational power of the end-user machine.
In the end, we have a pipeline and we need our tasks to complete in similar periods of time to avoid performance penalties. We have to work in near real time for a good user experience.
The final requirements and the dimensioning of the architecture depend on the amount of traffic that we will be analyzed. A good starting point is the sizes of the ONTS files produced every day (see deliverable D2.5 [3]).
8.2.5 Open issues, deviations and future developments
A partial mock-up of the dashboard is already available. More work is still expected in order to integrate all measurement parameters and link them to the different modules it needs to be connected to.
Regarding the anomaly detection engine, once a validated version of the algorithm will be released by WP4 it will be integrated in the framework of UC #1, depicted in Figure 4. As mentioned in the previous section, its evaluation requires labeled datasets. For a thorough evaluation, we plan to develop a new synthetic dataset to avoid relying on a dataset as old as KDD’99.
The open lines identified to progress on the dashboard are:
• Completing the integration with the anomaly detection engine. This involves the display of detailed information about detections and traffic details in the same time interval in which anomalies occur.
• Improving the data input throughput and increasing the database insertion throughput with a good time response (system scalability).

619633 ONTIC. Deliverable D5.2: Progress on Use Cases
34 / 80
! !• Improving throughput of pipelines to the database by adding more copies of our
filter process to export from PCAP to NetFlow and/or queues (horizontal scaling of the pipeline pool).
• Improving the query engine module by analyzing the processing time of queries and the input capacity.
8.3 UC #2 (User Story 2): Proactive Congestion Detection and Control
8.3.1 Scenario description
Congestion in communication networks can be fought by either reactive congestion control or proactive congestion avoidance techniques. Among the latter, those that explicitly signal the adequate rates to each source are often referred to −as stated in section 7.3 − as Explicit End-to-End Rate Control (EERC). As stated in deliverable D5.1 [1], for this use case ONTIC aims to design a distributed and proactive congestion avoidance system based on EERC models that:
• Fairly allocates bandwidth to existing flows,
• Achieves near-optimal resource utilization.
• Is scalable with respect to the number of flows.
In order to achieve fair allocation without wasting bandwidth, we propose to follow the max-min fairness criterion, which guarantees redistribution of unused resources. A max-min fair protocol takes the path of each session and the capacity of each link into account. The idea behind this fairness criterion is to first allocate equal bandwidth to all contending sessions at each link and, if a session cannot utilize its bandwidth because of constraints elsewhere in its path, then the residual bandwidth is distributed among the rest of sessions. Thus, no session is penalized, and all sessions are guaranteed a certain minimum quality of service. In other words, each session is allocated a transmission rate so that no link is overloaded, and a session can only increase its rate at the expense of a session with the same or smaller rate.
The max-min fair rates in a network can be easily computed by means of a centralized algorithm utilizing information from every router link and session. In a real-world network, however, a distributed algorithm is required for the following reasons:
• routers do not generally share their information globally;
• the huge number of links in a regular Internet scenario precludes a centralized solution;
• the overhead for updating the required information exchange is prohibitive given the volume and rate at which flows enter/leave the network.
In order to develop a usable protocol, we propose to honor three key requirements: TCP-friendliness, scalability, and the detection of misbehaving hosts. To this end, we build upon the foundations of distributed congestion control proposals based on the Explicit End-to-End Rate Control (EERC) model. EERC protocols determine optimal transmission rates for each flow based on actual usage data per network link, and it is possible to do so in linear time in stable conditions. Reactive protocols (e.g. TCP, RCP, XCP) use congestion signals to approach to optimal transmission rates. As these approaches suffer from poor convergence times we propose to use proactive protocols (e.g. Charny [15], Bneck [16], SLBN [14]), which explicitly compute transmission rates independently of congestion signals.
619633 ONTIC. Deliverable D5.2: Progress on Use Cases
35 / 80
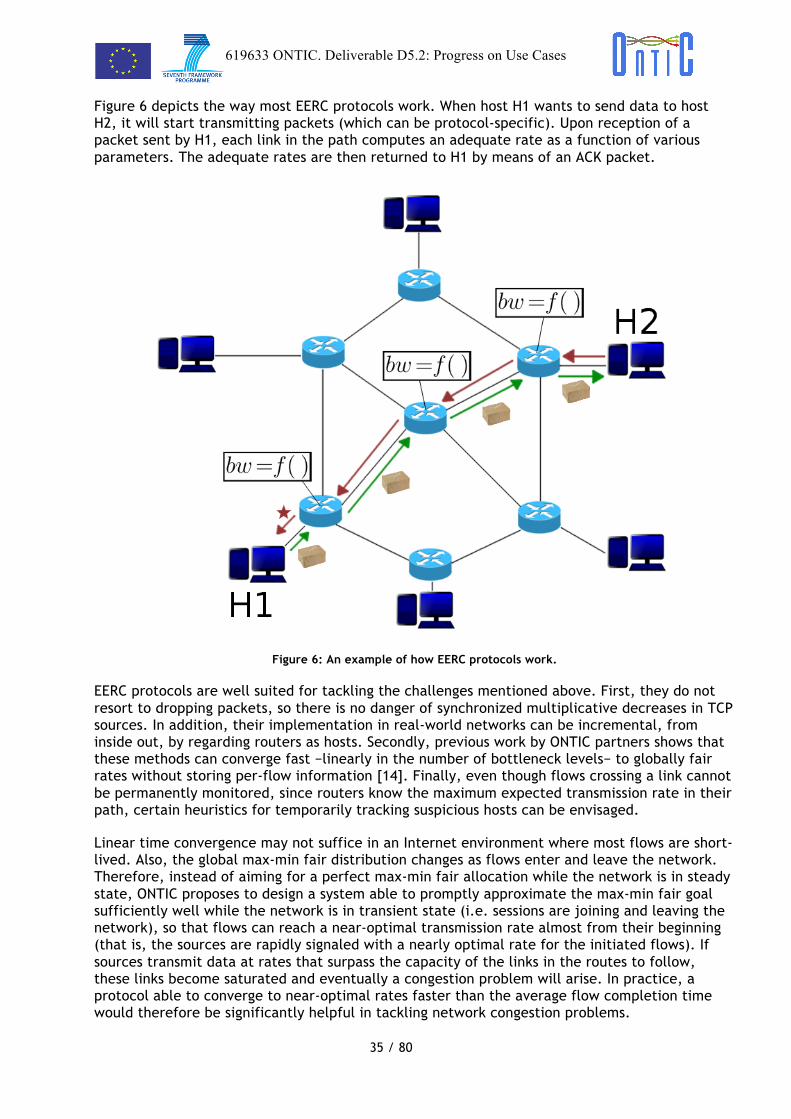
! !Figure 6 depicts the way most EERC protocols work. When host H1 wants to send data to host H2, it will start transmitting packets (which can be protocol-specific). Upon reception of a packet sent by H1, each link in the path computes an adequate rate as a function of various parameters. The adequate rates are then returned to H1 by means of an ACK packet.
Figure 6: An example of how EERC protocols work.
EERC protocols are well suited for tackling the challenges mentioned above. First, they do not resort to dropping packets, so there is no danger of synchronized multiplicative decreases in TCP sources. In addition, their implementation in real-world networks can be incremental, from inside out, by regarding routers as hosts. Secondly, previous work by ONTIC partners shows that these methods can converge fast −linearly in the number of bottleneck levels− to globally fair rates without storing per-flow information [14]. Finally, even though flows crossing a link cannot be permanently monitored, since routers know the maximum expected transmission rate in their path, certain heuristics for temporarily tracking suspicious hosts can be envisaged.
Linear time convergence may not suffice in an Internet environment where most flows are short-lived. Also, the global max-min fair distribution changes as flows enter and leave the network. Therefore, instead of aiming for a perfect max-min fair allocation while the network is in steady state, ONTIC proposes to design a system able to promptly approximate the max-min fair goal sufficiently well while the network is in transient state (i.e. sessions are joining and leaving the network), so that flows can reach a near-optimal transmission rate almost from their beginning (that is, the sources are rapidly signaled with a nearly optimal rate for the initiated flows). If sources transmit data at rates that surpass the capacity of the links in the routes to follow, these links become saturated and eventually a congestion problem will arise. In practice, a protocol able to converge to near-optimal rates faster than the average flow completion time would therefore be significantly helpful in tackling network congestion problems.
619633 ONTIC. Deliverable D5.2: Progress on Use Cases
36 / 80
! !From a high-level perspective, we can consider various approaches to address this challenge. Ideally, a process associated to each link would reveal the max-min fair allocation for each session on demand. However, if we consider that the state of the network changes rapidly, it becomes apparent that the rate signaled by routers, though optimal in a certain sense, might be already outdated when the information-carrying packet reaches the source node. We are therefore interested in developing a solution that can estimate transmission rates that remain up-to-date from initiation to completion.
To this end, we leverage the research being conducted in task T4.2 of WP4 (Traffic Pattern Evolution). Specifically, we are interested in forecasting suitable session flow parameters (e.g. number of flows crossing a router link) to be used by router links when computing the max-min fair allocation for each session. Proactive Explicit End-to-End Rate Control (EERC) protocols can function in a variety of ways, but they almost always involve the computation of explicit rates for each session crossing each link based on certain variables, which usually follow a stochastic process and can therefore be studied by means of the standard time series analysis toolset. More sophisticated techniques for providing short-term forecasts with a certain confidence, like the ones studied by the project, could prove useful enough in this context. By enhancing forecast accuracy ahead the volatility of the computed explicit rates can be reduced and as such, the performance of EERC protocols could be improved in terms of the following:
• The convergence time to the max-min fair allocation.
• The approximation error with respect to the max-min fair allocation when sessions are joining and leaving the network.
• The stress inflicted on router link queues when congestion occurs.
In this use case we propose a congestion control architecture that incorporates a forecasting module into a proactive EERC system model.
Congestion control test-bed
In order to get realistic evaluation results, we will deploy our experiments on top of a discrete event simulator. We have modified a version of Peersim,10 which has been adapted and optimized to support the following features:
• Running simulations with thousands of routers and up to a million hosts and sessions.
• Importing Internet-like topologies generated with the Georgia Tech gt-itm tool.11
• Modeling several network parameters, like processing time in routers, and transmission and propagation times in the network links.
• Modeling finite-sized packet queues in each link, in order to evaluate the performance of protocols with respect to the stress they impose on them.
The networks we plan to use in the experiments will be generated with the gt-itm graph generator, with a typical Internet transit-stub model. Different network topologies and sizes will be considered in the evaluation, paying special attention to WAN scenarios because larger RTT appear in them, which makes the convergence speed of the algorithms worse and more realistic. The simulations will be run on three network topologies of different sizes, composed of 110 routers (Small network), 1100 routers (Medium network) and 11,000 routers (Big network), respectively, and up to 1,000,000 hosts.
10 http://peersim.sourceforge.net/ 11 http://www.cc.gatech.edu/projects/gtitm/
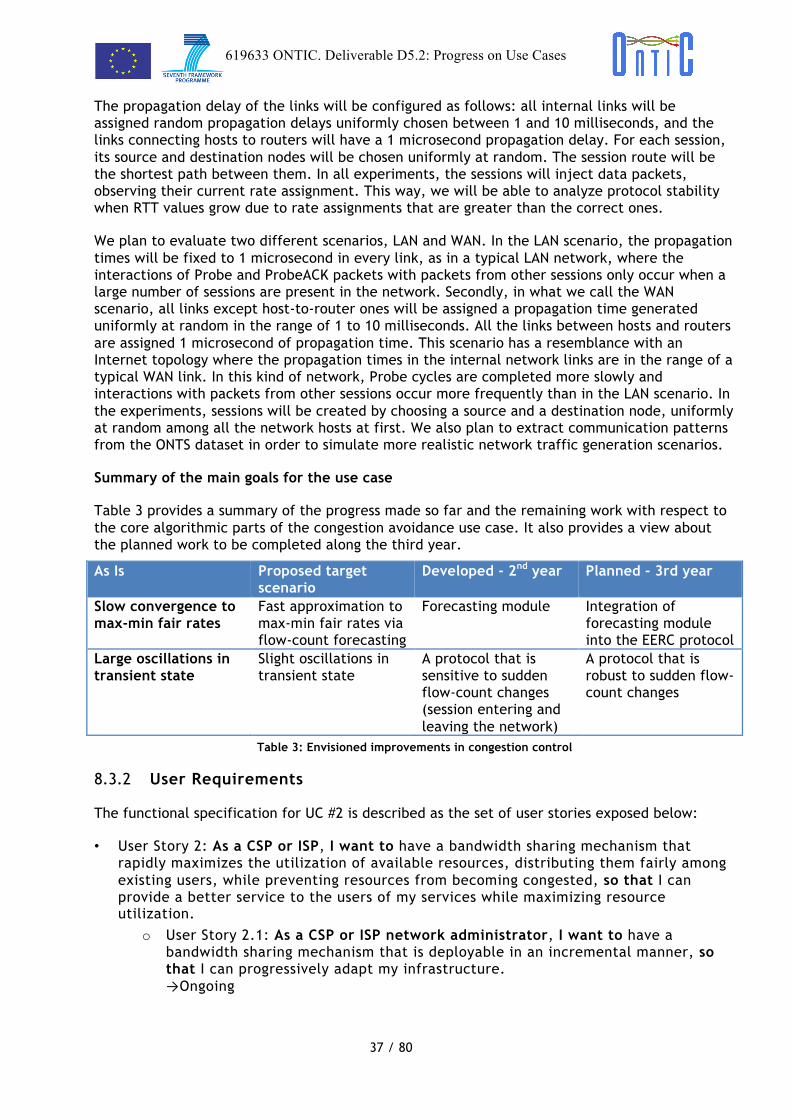
619633 ONTIC. Deliverable D5.2: Progress on Use Cases
37 / 80
! !The propagation delay of the links will be configured as follows: all internal links will be assigned random propagation delays uniformly chosen between 1 and 10 milliseconds, and the links connecting hosts to routers will have a 1 microsecond propagation delay. For each session, its source and destination nodes will be chosen uniformly at random. The session route will be the shortest path between them. In all experiments, the sessions will inject data packets, observing their current rate assignment. This way, we will be able to analyze protocol stability when RTT values grow due to rate assignments that are greater than the correct ones.
We plan to evaluate two different scenarios, LAN and WAN. In the LAN scenario, the propagation times will be fixed to 1 microsecond in every link, as in a typical LAN network, where the interactions of Probe and ProbeACK packets with packets from other sessions only occur when a large number of sessions are present in the network. Secondly, in what we call the WAN scenario, all links except host-to-router ones will be assigned a propagation time generated uniformly at random in the range of 1 to 10 milliseconds. All the links between hosts and routers are assigned 1 microsecond of propagation time. This scenario has a resemblance with an Internet topology where the propagation times in the internal network links are in the range of a typical WAN link. In this kind of network, Probe cycles are completed more slowly and interactions with packets from other sessions occur more frequently than in the LAN scenario. In the experiments, sessions will be created by choosing a source and a destination node, uniformly at random among all the network hosts at first. We also plan to extract communication patterns from the ONTS dataset in order to simulate more realistic network traffic generation scenarios.
Summary of the main goals for the use case
Table 3 provides a summary of the progress made so far and the remaining work with respect to the core algorithmic parts of the congestion avoidance use case. It also provides a view about the planned work to be completed along the third year.
As Is Proposed target scenario
Developed - 2nd year Planned - 3rd year
Slow convergence to max-min fair rates
Fast approximation to max-min fair rates via flow-count forecasting
Forecasting module Integration of forecasting module into the EERC protocol
Large oscillations in transient state
Slight oscillations in transient state
A protocol that is sensitive to sudden flow-count changes (session entering and leaving the network)
A protocol that is robust to sudden flow-count changes
Table 3: Envisioned improvements in congestion control
8.3.2 User Requirements
The functional specification for UC #2 is described as the set of user stories exposed below:
• User Story 2: As a CSP or ISP, I want to have a bandwidth sharing mechanism that rapidly maximizes the utilization of available resources, distributing them fairly among existing users, while preventing resources from becoming congested, so that I can provide a better service to the users of my services while maximizing resource utilization.
o User Story 2.1: As a CSP or ISP network administrator, I want to have a bandwidth sharing mechanism that is deployable in an incremental manner, so that I can progressively adapt my infrastructure. →Ongoing

619633 ONTIC. Deliverable D5.2: Progress on Use Cases
38 / 80
! !o User Story 2.2: As a CSP or ISP network administrator, I want to have a
bandwidth sharing mechanism that scales well with traffic volume and client count, so that it can remain effective when my network grows in size. →Ongoing
o User Story 2.3: As a CSP or ISP network administrator, I want to have a bandwidth sharing mechanism that detects and reacts to misbehaving hosts, so that my network remains operational in case of unexpected or malicious user behavior. →To be started. Planned for 3rd year.
o User Story 2.4: As a CSP or ISP network administrator, I want to have a bandwidth sharing mechanism that can detect trends in its variables and make reliable forecasts, so that rate assignments correspond to an up-to-date state of the network when the source nodes become aware of them. →Integration of WP4 work pending. Planned for 3rd year.
8.3.3 System model
8.3.3.1 Functionalities
The main components that define the system model of this use case are: Routers, Hosts, Links and Sessions. Routers, Hosts and Links compose the network, and Sessions transverse the network from one Host to another. For the sake of simplicity, we initially consider that each of the Hosts is connected to only one Router via a dedicated Link, and Routers can be connected to several Routers and Hosts at the same time. Links can have different propagation delays and varied bandwidths. The Sessions follow a static path in the network, starting at a Host (the source), and ending at another Host (the destination). The intermediate nodes in the Session’s path are the Routers that connect the source and the destination. For the sake of simplicity, in this model each Host can only be the source of one Session.
A rate-based explicit congestion control mechanism is employed. It provides the source nodes with the explicit rate at which they can transmit, using an adequate policy to share the Links’ bandwidth among present sessions. Sessions are allowed to specify the maximum rate they need and to change it dynamically. They are considered greedy in this context, i.e., they want to match their assigned bandwidth to their requested maximum rate (with the consideration that data and control packets share the same bandwidth assigned to a Session, putting the control traffic at, approximately, 1% of the total traffic).
Being able to know when a Session is active and when it is no longer active is a key to a rate control mechanism in order to allocate and deallocate resources to Sessions (the use-it-or-lose-it principle). Since the max-min fair problem is very sensitive to errors (one small error in a Link can produce large errors in some other Link), estimating the number of Sessions that cross a Link may generate large oscillations in rate assignments, and when these oscillations become permanent they will eventually cause serious congestion problems.
To avoid the above problems associated with the estimation of the number of Sessions, we propose a mechanism where the source nodes participate in an active way, explicitly signaling the arrival and departure of Sessions, providing an exact computation of the number of Sessions in the network. The Sessions interact with the protocol by means of a set of 4 primitives that allow the upper-level applications to communicate with the protocol at the host nodes: that a Session has joined the network (Join), that a Session is no longer active (Leave), the request of a new maximum rate by a Session (Change) and the assignment of a new maximum rate to a Session (Rate), explicit rate, determined by the protocol.
619633 ONTIC. Deliverable D5.2: Progress on Use Cases
39 / 80
! !This model proposal could be regarded as unrealistic since sessions do not know if they are active or not, so the idea is to take Hosts away from the model and to delegate the responsibility of implementing the above primitives to the first Router in the Session path. It is commonly assumed that access Routers maintain information about each individual flow, while core Routers do not for scalability purposes. Hence, explicitly signaling the arrival and departure of Sessions does not compromise the scalability of the access Router (e.g., an XDSL home router), since it only has to cope with a small number of Sessions. Therefore, it is easy for this kind of routers to execute the Join primitive when they detect a new flow or the Leave primitive when an existing flow times out.
Stream oriented flows (e.g., TCP) explicitly indicate the start and end of data transmission per flow’, so access Routers can execute the corresponding primitives when they detect the corresponding packets (e.g., SYN and FIN in TCP). On the other hand, datagram oriented flows (e.g., UDP) can be tracked down with the help of an array of active flows (e.g. identified by source-destination pairs), and an activity timer for each flow. Additionally, the source Router can measure in real time differences between the assigned and the actual bandwidth used by a session, and execute the Change primitive if the actual rate is significantly lower than the rate assigned by the control congestion mechanism.
In this use case, the Links are assumed to be reliable communication channels to transmit protocol control packets, but in the case that this reliability could not be guaranteed, classical techniques could be used to cope with communication errors, keeping the state in nodes consistent.
8.3.3.2 Software architecture
The envisioned architecture in each router link is comprised of three main modules: the router-side implementation of the Proactive Congestion Control Protocol (PCCP), the Forecasting System (FS) and the Forwarding module (FW). The explicit rate for each flow is calculated by PCCP using input from the FS module. FS will be trained for each router link in a previous stage and, when trained, it will be able to forecast relevant session parameters. Router links can perform arbitrary calls to their FS module in order to update their variables. Router links also feed the relevant data to the FS so that it can update its models. The following figure details these three components and their interactions in a router.
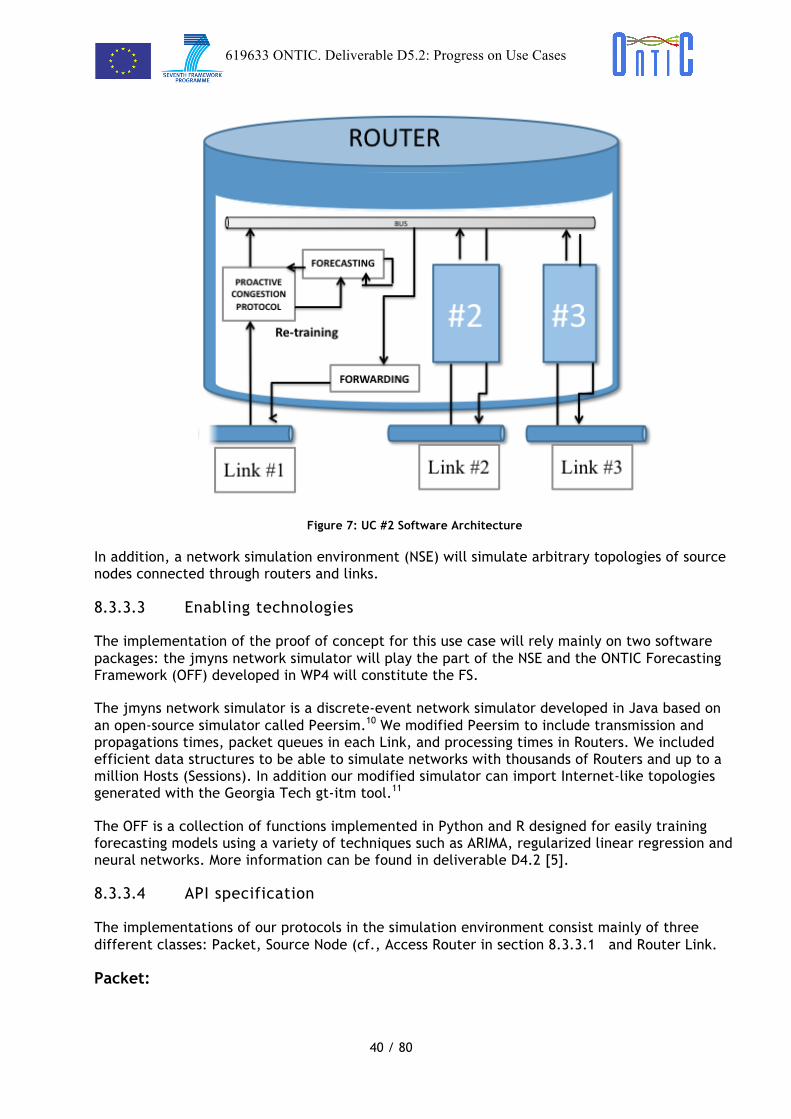
619633 ONTIC. Deliverable D5.2: Progress on Use Cases
40 / 80
! !
Figure 7: UC #2 Software Architecture
In addition, a network simulation environment (NSE) will simulate arbitrary topologies of source nodes connected through routers and links.
8.3.3.3 Enabling technologies
The implementation of the proof of concept for this use case will rely mainly on two software packages: the jmyns network simulator will play the part of the NSE and the ONTIC Forecasting Framework (OFF) developed in WP4 will constitute the FS.
The jmyns network simulator is a discrete-event network simulator developed in Java based on an open-source simulator called Peersim.10 We modified Peersim to include transmission and propagations times, packet queues in each Link, and processing times in Routers. We included efficient data structures to be able to simulate networks with thousands of Routers and up to a million Hosts (Sessions). In addition our modified simulator can import Internet-like topologies generated with the Georgia Tech gt-itm tool.11
The OFF is a collection of functions implemented in Python and R designed for easily training forecasting models using a variety of techniques such as ARIMA, regularized linear regression and neural networks. More information can be found in deliverable D4.2 [5].
8.3.3.4 API specification
The implementations of our protocols in the simulation environment consist mainly of three different classes: Packet, Source Node (cf., Access Router in section 8.3.3.1 and Router Link.
Packet:

619633 ONTIC. Deliverable D5.2: Progress on Use Cases
41 / 80
! !Packets contain protocol information. They originate at the source nodes, and bounce at the destination node in the form of ACK packets. When they traverse a router link, they trigger different actions, depending on their type (which can be Join, Leave, Probe or ProbeACK) and the parameters they contain. The information they carry is represented by a list of parameters p, which typically contains information on the session they belong to, their bandwidth demand and possibly other parameters describing the state of the network.
Source Node:
The source node operates by means of a simple API: Join and Leave functions.
API.Join(s, p):
s: The session identifier
p: The parameter list
This function triggers the transmission of a Join packet with parameters p to the destination node of session s.
API .Leave(s):
s: The session identifier
This function triggers the sending of a Leave packet to the destination node of session s as soon as a ProbeACK packet is received.
Router Link
Functions
Rx_Join(s, p)
It is triggered upon reception of a Join packet (downstream) and updates local and packet variables according to the received parameters and the internal state.
Rx_Probe(s, p)
It is triggered upon reception of a Probe packet (downstream) and computes a bandwidth assignment for session s while it updates local and packet variables accordingly.
Rx_ProbeACK(s, p)
It is triggered upon reception of a ProbeACK packet (upstream) and performs similar to the Probe function.
Rx_Leave(s)
It is triggered upon reception of a Leave packet (downstream) and decreases the number of sessions currently crossing the link while it updates the corresponding variables.

619633 ONTIC. Deliverable D5.2: Progress on Use Cases
42 / 80
! !8.3.4 Performance Evaluation
8.3.4.1 Relevant Metrics
The simulation environment to be used for testing our proposed system provides detailed metrics on the state of the network, allowing us to assess its performance with respect to the several criteria. In particular, we will compute the following metrics.
Average Flow Completion Time (AFCT): AFCT is a good measure of the quality of a bandwidth allocation algorithm. This metric reflects the experience of the end user when engaging in short-lived network interactions, which constitute the majority of the Internet flows observed today.
It can be computed as follows:
where n is the number of sessions that have crossed the network, S is the set of such sessions, fi is the timestamp of the arrival of the FIN packet of session i and si is the timestamp of the departure of the SYN packet.
Bandwidth usage: This metric gives information on whether the capacity of the available resources is being used by the protocol to its maximum or not. This is especially relevant to network managers, and can be computed as follows:
where m is the number of links in the network, L is the set of the links, ui is the sum of the bandwidth currently allocated by link i to the sessions that cross it and ci is the capacity of link i.
Deviation from max-min fair allocation: This metric is similar to the bandwidth usage metric (even equivalent in certain scenarios) but provides a different perspective on the theoretical properties of the implemented system. In particular, it provides a good criterion for determining whether the allocation has converged to an optimal state. This can be computed as follows:
where n is the number of sessions that have crossed the network, S is the set of such sessions, bi is the current bandwidth allocation to session i and b*i is the max-min fair allocation to session i as computed locally at each link.
Convergence time: This is the time required by the protocol to stabilize once no sessions enter or leave the network.
Queue stress: This is measured as a set of functions of the queue size at each link (e.g. maximum observed queue size, average of the top queue size observed at each link, data loss, etc.). Traffic arriving at host nodes (in practical scenarios, these would be access routers), will be filtered before entering the network. Excess rates can therefore be managed by means of a simple drop-tail scheme, which will trigger the corresponding rate reduction at the TCP–like end

619633 ONTIC. Deliverable D5.2: Progress on Use Cases
43 / 80
! !hosts when packet loss is detected. UDP-like protocols would simply lose packets, as is usually the case in most networks.
8.3.4.2 Mechanisms
As already mentioned, evaluation will be undertaken in a network simulation environment that we have built. We will run three types of experiments, which are described below.
In the first set of experiments we will evaluate the behavior of our protocols and different settings of the forecasting module when many sessions arrive simultaneously. In each experiment a different number of sessions (from 10 to 1,000,000) will join the network during the first millisecond of the simulation. The moment each session joins the network will be chosen uniformly at random. We will run simulations using Small, Medium and Big networks configured in both LAN and WAN scenarios. In this experimentation line, we are interested in the time that the protocols require to reach the steady state, as well as the overhead they generate.
In the second set of experiments we will study the stability of our protocol under different settings of the FS module in a highly dynamic environment, transient state, so that we can observe their oscillations. Again, we will consider both LAN and WAN scenarios in Small, Medium and Big networks, with sessions joining, leaving and changing their rates. These experiments reproduce the highly variable state frequently observed in a real network.
In the third set of experiments we will compare the performance of our protocols against several representatives of existing proactive and reactive congestion control protocols. Among others, we will consider the following:
• Erica [18] and BFYZ [19] representing the family of algorithms that need per-session information at each router,
• CG [20] as an algorithm that only uses constant state at each router, and
• RCP [21] and PIQI-RCP [22], as efficient representatives of reactive congestion controllers that do not need to store and process state information for each session.
In all these experiments we will measure bandwidth usage and the deviation from max-min fair allocation during the transient phase, as well as the time taken to converge to stability. In the third set we will also measure the average flow completion time and the link queue stress.
8.3.5 Open issues, deviations and future developments
During the third year we will integrate the Forecasting System into the Network Simulation Environment to test the effectiveness of the proposed approach.
The traffic generation models used for evaluating the performance of network functions rely on stochastic models which cannot adequately capture the variable dynamics of an actual network environment. Therefore, in order to validate the applicability of the WP4 models to this use case, we will use the ONTS data set to generate close-to-real-life traffic patterns of join, leave and rate change session events for the experiments described above. This will allow us to test our protocols and the forecasting models on a network that behaves similarly to an actual one, which will provide insights on the applicability of the system in real-world environments. Each of the anonymized IPs present in the ONTS sample employed for this purpose will be assigned to a source node, in a many-to-one relationship. The fact that one source node can represent various IP addresses is consistent with a real scenario if we regard said nodes as routers in an inner layer

619633 ONTIC. Deliverable D5.2: Progress on Use Cases
44 / 80
! !of the network rather than as hosts. Each source node will send the Join packet at the starting timestamp of a flow and the Leave packet at the end. In the middle, it will transmit the associated byte count at the rate assigned by the EERC protocol.
In a first approach the forecasting FS module will be trained only one time and we will assume that no drift will appear in the network traffic. In a second stage, the FS module will be trained as soon as a significant drift appears.
The incorporation of the Forecasting System into the EERC model is only one of the options that can be considered for improving the metrics described above. During the third year of the project, we plan to work on alternative approaches leveraging the research carried out so far in the rest of the work packages. Specifically, we plan to carry out a thorough feature extraction process on the elements of the EERC protocol in order to search for good predictors of the variables of interest. When the network is stable, the full flow set can be described as a static data set comprised of the extracted features. Therefore, a regression model to estimate bandwidth allocations can be conceived.
8.4 UC #3 (User Story 3): Adaptive QoE Control
8.4.1 Scenario description
Use case #3 deals with the scenario of Adaptive Quality of Experience (AQoE) Control, as introduced by the DoW and initially described in D5.1 [1]. The core foundation of this use case is the need of dynamically solving the problem of providing users with the best available QoE in service degradation situations by managing the available network resources.
The implementation of the use case has started by defining two main functional blocks that work in cooperation in order to fulfill its requirements: the Analytics Function and the Policy Governance Function. These are key elements to implement the decision part of the closed-loop control that enables the application of mitigation actions when a QoE degradation situation is detected or predicted.
As presented in [1], the figure below provides an end-to-end view of the proposed Adaptive Quality of Experience Control framework, which is discussed below. Similarities with the COMPA (Control/Orchestration/Management/Policy/Analytics) architectural model, introduced by Ericsson [8] for unifying business and management processes in a telecoms environment, are drawn (a wider description of the QoE frameworks is provided in Annex B).
On the left side of the figure the ‘Prediction’ module, based on traffic analytics, provides at time t, an estimation about the status of the network at time t+1 (what event, where, probability, etc.). That is the Analytics Function (the A in the COMPA model). Subsequently, the ‘Policy Decision’ module receives as input the yielded insights and determines the actions to be taken by evaluating a pre-configured set of policies reflecting operator’s concrete business requirements and operational practices. That is the Policy Governance Function (PGF) and any other existing Policy Decision Points (the P in the COMPA model). In order to assess how good or bad the mitigation plans are, the PGF can also be assisted by executing an evaluation process to assess the effect of the applied actions. Finally, the resulting mitigation actions are enforced in the network by the ‘Policy Enforcement’ module: the existing Policy Enforcement Points (the COM in the COMPA model).
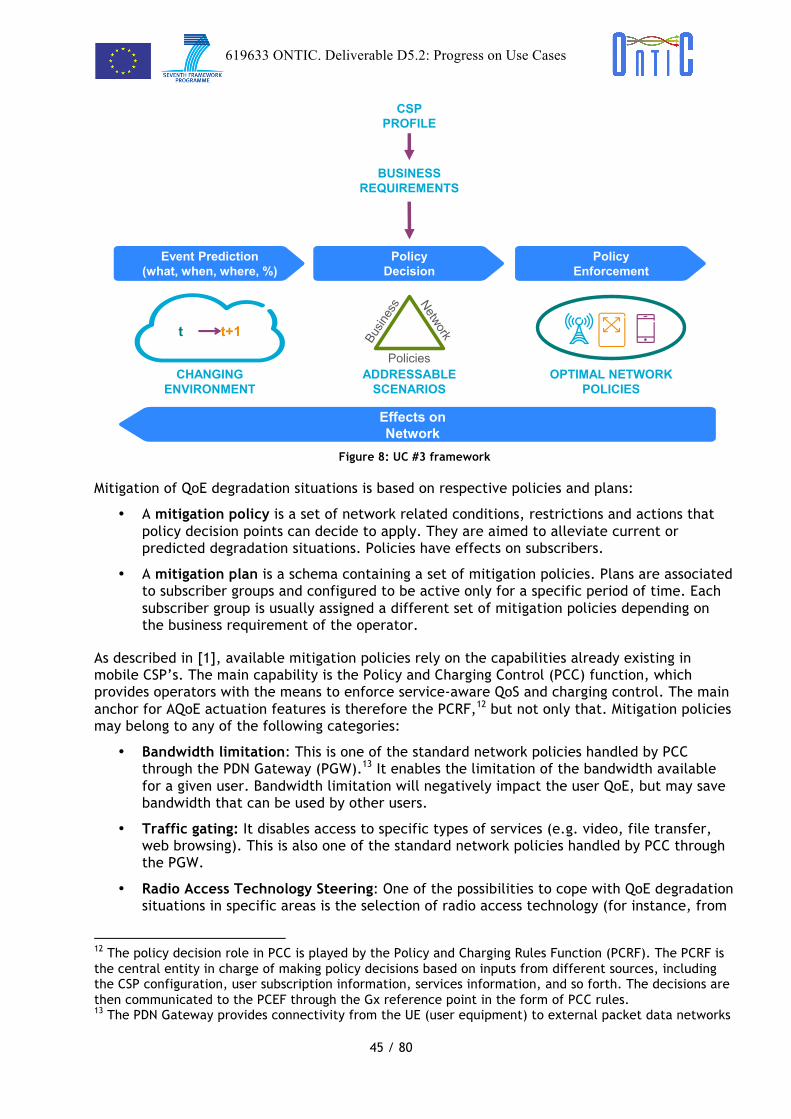
619633 ONTIC. Deliverable D5.2: Progress on Use Cases
45 / 80
! !
Figure 8: UC #3 framework
Mitigation of QoE degradation situations is based on respective policies and plans:
• A mitigation policy is a set of network related conditions, restrictions and actions that policy decision points can decide to apply. They are aimed to alleviate current or predicted degradation situations. Policies have effects on subscribers.
• A mitigation plan is a schema containing a set of mitigation policies. Plans are associated to subscriber groups and configured to be active only for a specific period of time. Each subscriber group is usually assigned a different set of mitigation policies depending on the business requirement of the operator.
As described in [1], available mitigation policies rely on the capabilities already existing in mobile CSP’s. The main capability is the Policy and Charging Control (PCC) function, which provides operators with the means to enforce service-aware QoS and charging control. The main anchor for AQoE actuation features is therefore the PCRF,12 but not only that. Mitigation policies may belong to any of the following categories:
• Bandwidth limitation: This is one of the standard network policies handled by PCC through the PDN Gateway (PGW).13 It enables the limitation of the bandwidth available for a given user. Bandwidth limitation will negatively impact the user QoE, but may save bandwidth that can be used by other users.
• Traffic gating: It disables access to specific types of services (e.g. video, file transfer, web browsing). This is also one of the standard network policies handled by PCC through the PGW.
• Radio Access Technology Steering: One of the possibilities to cope with QoE degradation situations in specific areas is the selection of radio access technology (for instance, from
12 The policy decision role in PCC is played by the Policy and Charging Rules Function (PCRF). The PCRF is the central entity in charge of making policy decisions based on inputs from different sources, including the CSP configuration, user subscription information, services information, and so forth. The decisions are then communicated to the PCEF through the Gx reference point in the form of PCC rules. 13 The PDN Gateway provides connectivity from the UE (user equipment) to external packet data networks
OPTIMAL NETWORK POLICIES
CHANGING ENVIRONMENT
t t+1
ADDRESSABLE SCENARIOS
Policies
CSPPROFILE
BUSINESS REQUIREMENTS
Effects on NetworkEffects on
Network
Event Prediction(what, when, where, %)
PolicyDecision
Policy Enforcement

619633 ONTIC. Deliverable D5.2: Progress on Use Cases
46 / 80
! !LTE to WCDMA or GSM) or even frequency selection within the same radio technology (for instance, from LTE FDD to LTE TDD).14 There are several ways to enforce this type of mitigation policies. One of them is the Sx reference point [9], a proprietary interface implemented by Ericsson products that directly connects the PCRF with the MME15 and enables direct interaction without going through the PGW.
• Offload to Wi-Fi: This can be implemented through an Access Network Discovery and Selection Function (ANDSF) server. This is an entity introduced by 3GPP to assist User Equipment (UE) to discover non-3GPP access networks –such as WLAN or WIMAX– that can be used for data communications in addition to 3GPP access networks [11].
• Introduction of Software-Defined Networks (SDN) service chains16 (through a Service Function Chaining, SFC) [10]: For instance, if the QoE degradation refers to video services, a service function providing video optimization can be instantiated to the affected users’ traffic path.
Based on the above, the AQoE Control scenario supports different treatment for each subscriber group in order to maximize the user’s QoE. Different mitigation plans can be applied to each customer segment. For instance, when video QoE degradation is predicted, Gold users may be assigned a lenient mitigation plan while Bronze users undergo a stricter plan. When the degradation situation ends, mitigation policies are deactivated. However, most of the times, mitigation plans are defined by human experts, which must take their intuition and network knowledge to devise the best possible plan. Therefore, a tool for simulating mitigation plans has also been developed, so that it is possible to estimate the effects of a given mitigation plan, in a scenario with a predefined set of subscriber groups and corresponding shares. It supports the simulation of specific plans and also the determination of the best plan provided a set of constraints and the preferences introduced by the operator.
VLC Test-bed
The evaluation of the AQoE use case will be undertaken in a test-bed provided by project partners (Figure 9). The entire closed loop, from network monitoring to network enforcement, is implemented. In particular, the test-bed provides for appropriate tools to generate video traffic in a controlled environment involving a number of VLC clients who access a local server of content streaming sites in the Internet. Video traces are collected, pre-processed, fed to the developed ML algorithms for making predictions about QoE degradation and mitigation actions are enforced back to the clients.
The test-bed will not be used only for evaluating/demonstrating the use case but also, because of its controlled nature, for training and testing the outcome of the algorithms developed for spotting QoE degradation situations. For these, the test-bed provides components for modifying the switch bandwidth behavior in order to simulate different conditions in video quality of experience and for applying policies (from the Policy Governance Function, PGF) to mitigate degradation of the service as appropriate to the subscription profile of the users (VLC clients).
14 FDD: Frequency-Division Duplex. TDD: Time-Division Duplex 15 The Mobility Management Entity (MME) is the key control-node for the LTE access-network. It is involved in the bearer activation/deactivation process and is also responsible for choosing the SGW for a UE at the initial attach. 16 Service Chaining allows dynamic steering of traffic coming out of a PGW through a bunch of Value Added Services (VAS) before it hits the final destination.
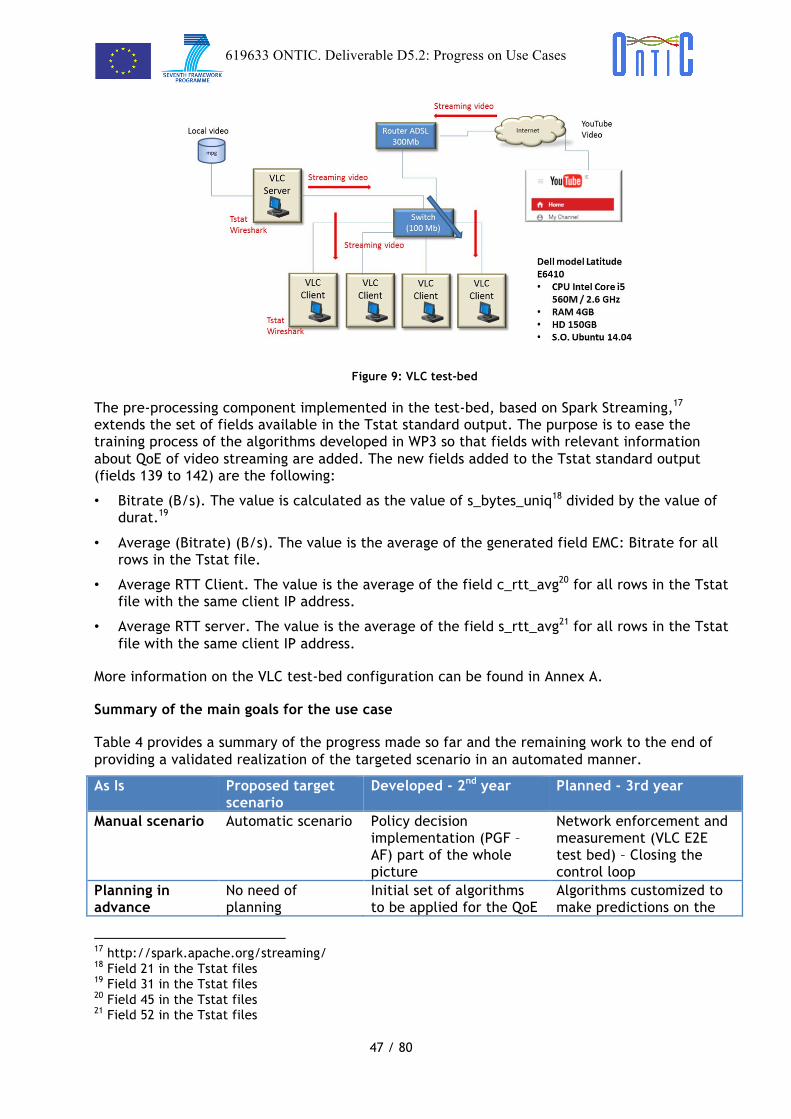
619633 ONTIC. Deliverable D5.2: Progress on Use Cases
47 / 80
! !
Figure 9: VLC test-bed
The pre-processing component implemented in the test-bed, based on Spark Streaming,17 extends the set of fields available in the Tstat standard output. The purpose is to ease the training process of the algorithms developed in WP3 so that fields with relevant information about QoE of video streaming are added. The new fields added to the Tstat standard output (fields 139 to 142) are the following:
• Bitrate (B/s). The value is calculated as the value of s_bytes_uniq18 divided by the value of durat.19
• Average (Bitrate) (B/s). The value is the average of the generated field EMC: Bitrate for all rows in the Tstat file.
• Average RTT Client. The value is the average of the field c_rtt_avg20 for all rows in the Tstat file with the same client IP address.
• Average RTT server. The value is the average of the field s_rtt_avg21 for all rows in the Tstat file with the same client IP address.
More information on the VLC test-bed configuration can be found in Annex A.
Summary of the main goals for the use case
Table 4 provides a summary of the progress made so far and the remaining work to the end of providing a validated realization of the targeted scenario in an automated manner.
As Is Proposed target scenario
Developed - 2nd year Planned - 3rd year
Manual scenario Automatic scenario Policy decision implementation (PGF – AF) part of the whole picture
Network enforcement and measurement (VLC E2E test bed) – Closing the control loop
Planning in advance
No need of planning
Initial set of algorithms to be applied for the QoE
Algorithms customized to make predictions on the
17 http://spark.apache.org/streaming/ 18 Field 21 in the Tstat files 19 Field 31 in the Tstat files 20 Field 45 in the Tstat files 21 Field 52 in the Tstat files
619633 ONTIC. Deliverable D5.2: Progress on Use Cases
48 / 80
! !degradation prediction scenario along year 3 defined
QoE case
Only solve scheduled scenarios
Can solve unscheduled scenarios
Initial set of algorithms defined
Algorithms customized to make predictions
Very basic set of rules provided by the PCRF operator
Advanced and automatic generated set of rules
Simulation and Recommendation tools enabling the use of complex policy combinations
Enhancement of the Simulation and Recommendation tools to manage even more complex policy plans
Ad-hoc optimization of the network resources
General and continuous network optimization
Not addressed Not addressed
Table 4: New scenarios for enhancing user’s QoE (Updated)
8.4.2 User Requirements
The functional specification for UC #3 is described as the set of user stories exposed below:
• (Epic) User Story 3: As a CSP or ISP network administrator, I want to have an efficient way to manage QoE, so that I can make decisions about what applications and services to prioritize.
o (QoE Characterization) User Story 3.1: As a CSP or ISP network administrator, I want to characterize QoE of video-based services, so that I can know how to detect QoE degradation in the said type of services. → Ongoing.
o (Epic) User Story 3.2: As a CSP or ISP network administrator, I want to be able to mitigate QoE degradation, so that I can improve the users QoE. → Merged.
o (KPI measurement) User Story 3.3: As a CSP or ISP network administrator, I want to be able to measure key per-service performance indicators for selected video services, so that I can determine how the applied network policies affect active video services. → Ongoing - VLC test bed, non-ONTIC datasets.
o (Network Enforcement) User Story 3.4: As a CSP or ISP network administrator, I want to have tools on the network side to change priorities and resource assignment, so that I can give users the best possible QoE for video services. → Epic for the network actuation and monitoring part. It will be available in year three by integrating the PGF with routers with built-in bandwidth management capabilities.
• User Story 3.4.1: As a CSP or ISP network administrator, I want to have the enforcement part controlled from the PGF, so that I can implement decisions. →To be started. Planned for 3rd year.
• User Story 3.4.2: As a CSP or ISP network administrator, I want to be able to change network resource assignment, so that I can decide which (groups of) users receive the best possible QoE. →Planned for year 3. Using a router with built-in bandwidth management capabilities.
619633 ONTIC. Deliverable D5.2: Progress on Use Cases
49 / 80
! !o (Old Epic Analytics Function) User Story 3.5: As a CSP or ISP network
administrator, I want to get predictions about QoE degradation for given places, so that I can preemptively actuate appropriate mitigation policies. → Epic for the Analytic Function (AF) → Reworked (see below).
o (New Epic Analytics Function) User Story 3.5: As a CSP or ISP network administrator, I want to have a function (AF) able to make QoE degradation predictions, so that I can understand the key influencing factors and plan in advance mitigation actions.
• User Story 3.5.1: As a CSP or ISP network administrator, I want to be able to make predictions based on per-(video) service key performance indicators, so that I can determine how the applied network policies affect given video services. →To be started. Planned for 3rd year.
• User Story 3.5.2: As a CSP or ISP network administrator, I want to get predictions about QoE degradation for given places, so that I can preemptively actuate appropriate mitigation policies. →To be started. Planned for 3rd year.
• User Story 3.5.3: As a CSP or ISP network administrator, I want to make updates on the predictions about QoE degradation for given places, so that I can fine tune the mitigation policies. →To be started. Planned for 3rd year.
o (Network Monitoring) User Story 3.6: As a CSP or ISP network administrator, I want to determine which users are in a given location at a given time, so that I can apply policies only on specific (groups of) users. →To be started. Planned for 3rd year.
o (Simulation and Recommender Tool) User Story 3.7: As a CSP or ISP network administrator, I want to have a simulation tool, so that I can estimate the impact on the network and users as a result of the application of mitigation policies determined to apply. →First version provided.
o (PGF) User Story 3.8: As a CSP or ISP network administrator, I want to have a way to manage QoE workflow from a single point, so that I can see the performance of my network with respect to delivered QoE → Reworked (see below).
o (New statement for the PGF Epic) User Story 3.8: As a CSP or ISP network administrator, I want to have a function (PGF) to manage all the information, predictions, actuation, etc. coming from the Analytics Function, so that I can build a clear picture of the current QoE status and planned actions:
• User Story 3.8.1: As a CSP or ISP network administrator, I want to be able to store all the information related to the QoE predictions and actuations, so that the ISP can manage them. →Implementation ongoing.
• User Story 3.8.2: As a CSP or ISP network administrator, I want to have a GUI to manage all the information related to the QoE predictions and actuations, so that I can easily manage them. →Implementation ongoing.
• User Story 3.8.3: As a CSP or ISP network administrator, I want to be able to mitigate QoE degradation in video services, so that I can improve
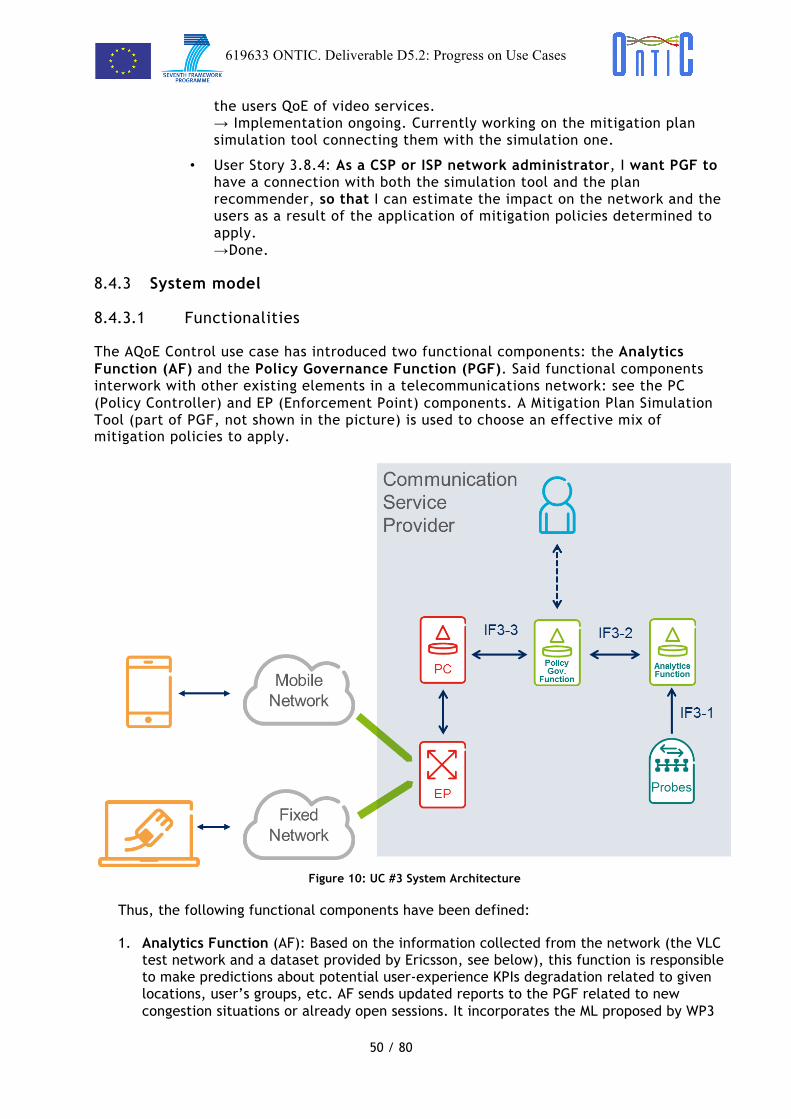
619633 ONTIC. Deliverable D5.2: Progress on Use Cases
50 / 80
! !the users QoE of video services. → Implementation ongoing. Currently working on the mitigation plan simulation tool connecting them with the simulation one.
• User Story 3.8.4: As a CSP or ISP network administrator, I want PGF to have a connection with both the simulation tool and the plan recommender, so that I can estimate the impact on the network and the users as a result of the application of mitigation policies determined to apply. →Done.
8.4.3 System model
8.4.3.1 Functionalities
The AQoE Control use case has introduced two functional components: the Analytics Function (AF) and the Policy Governance Function (PGF). Said functional components interwork with other existing elements in a telecommunications network: see the PC (Policy Controller) and EP (Enforcement Point) components. A Mitigation Plan Simulation Tool (part of PGF, not shown in the picture) is used to choose an effective mix of mitigation policies to apply.
Figure 10: UC #3 System Architecture
Thus, the following functional components have been defined:
1. Analytics Function (AF): Based on the information collected from the network (the VLC test network and a dataset provided by Ericsson, see below), this function is responsible to make predictions about potential user-experience KPIs degradation related to given locations, user’s groups, etc. AF sends updated reports to the PGF related to new congestion situations or already open sessions. It incorporates the ML proposed by WP3
619633 ONTIC. Deliverable D5.2: Progress on Use Cases
51 / 80
! !for self-configured clustering and cluster quality assessment, association rules-based traffic classification and frequent itemset mining (see section 7.4 ).
2. Policy Governance Function (PGF). This functional component manages the prediction reports sent by the AF and helps in the process of configuring the proper mitigation plans. PGF is also responsible of both the injection of policies on the policy controller function and the follow up of the degradation situations. It comprises the following modules:
a. QoE Degradation Console: It provides a tool for network administrators to track the status of the already active degradation sessions started by the AF.
b. Mitigation Plan Composer: This tool helps the network administrator to compose the mitigation plans to be applied to degradation scenarios. This tool can use the Mitigation Plan Simulation Tool (see next items) in order to assess the quality of any new mitigation plan.
3. Mitigation Plan Simulation Tool (not shown in the figure): This functional component helps the network administrator to build mitigation plans based on mathematical models. It is made of the following modules (see next section for further description):
a. Mitigation Plan Simulator: It helps the operator to make an evaluation of the potential effect of applying different policies to alleviate congestion scenarios.
b. Mitigation Plan Recommender: Based on the set of available policies, group share, and other parameters the system is able to recommend the best plan to manage the QoE degradation situation.
On the network enforcement and monitoring part the AQoE system can be integrated in CSP environments by interfacing with the available data sources and management systems. The reference system architecture above assumed a policy-based network management architecture and therefore, the PGF is interfaced with the:
4. Policy Controller (PC): This function is located on the network side, and receives from the PGF and applies the policies in the selected mitigation plans; in the case of 3GPP networks this function is called PCRF. The Policy Controller orders the Enforcement Point (EP) to effectively apply policies.
As for the data to be used for training and evaluating the ML traffic analysis algorithms for QoE prediction, the project will make use of the following datasets:
• A dataset from the VLC test-bed: As already outlined (section 8.4.1 ), the project has deployed a client/server infrastructure, using virtual machines, to generate video (VLC) traffic. In this test-bed data per user and service can be collected and processed (using the Tstat tool) so that the appropriate features be available for computing the KPIs reflecting user experience for video services. As the test-bed offers a controlled environment i.e. can be tuned to QoE degradation conditions, the gathered dataset can also be used for testing the outcome of the ML algorithms.
• A dataset provided by Ericsson: This dataset has been generated in a controlled environment by Ericsson based on data from an operational network and has been processed using the Tstat tool to turn them into the flow form required by the ML algorithms.
Note that the ONTS (ONTIC Network Traffic Summary) dataset that the project captures from the operational network of an ISP (see deliverable D2.5 [3]) cannot be of value to the AQoE use case. For privacy reasons, the application payload has been removed and as a result it is not possible to accurately compute the KPIs of video QoE.
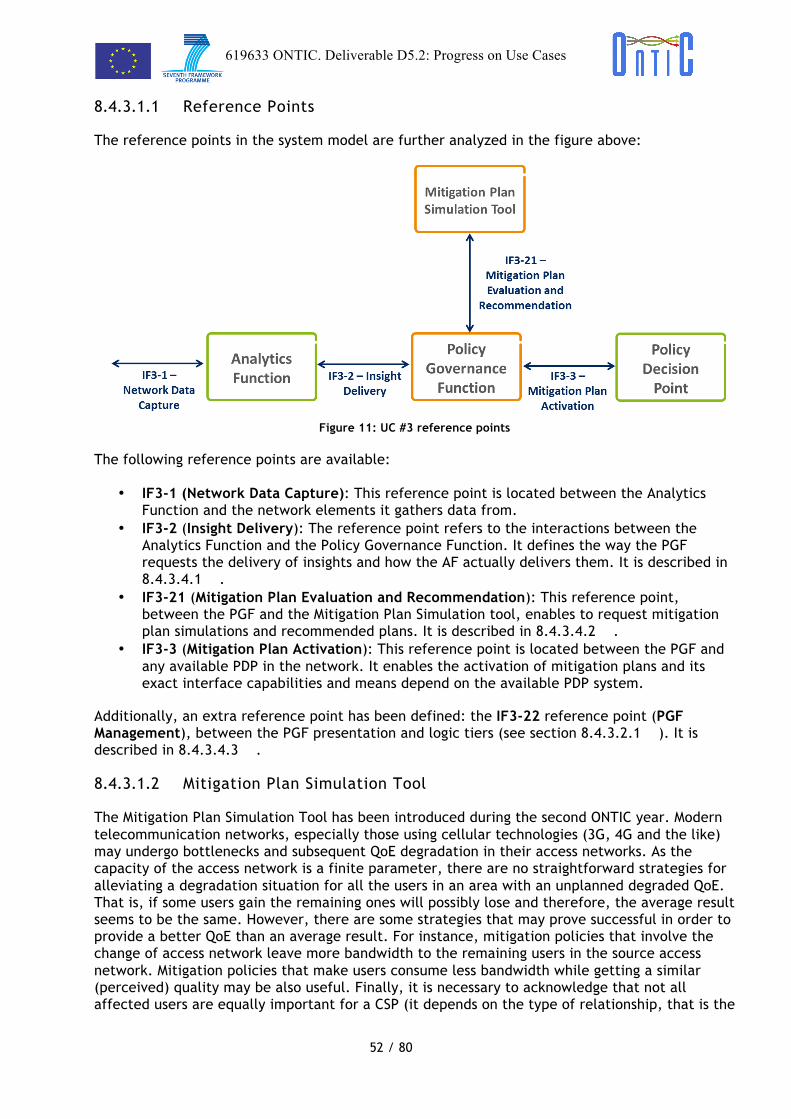
619633 ONTIC. Deliverable D5.2: Progress on Use Cases
52 / 80
! !8.4.3.1.1 Reference Points
The reference points in the system model are further analyzed in the figure above:
Figure 11: UC #3 reference points
The following reference points are available:
• IF3-1 (Network Data Capture): This reference point is located between the Analytics Function and the network elements it gathers data from.
• IF3-2 (Insight Delivery): The reference point refers to the interactions between the Analytics Function and the Policy Governance Function. It defines the way the PGF requests the delivery of insights and how the AF actually delivers them. It is described in 8.4.3.4.1 .
• IF3-21 (Mitigation Plan Evaluation and Recommendation): This reference point, between the PGF and the Mitigation Plan Simulation tool, enables to request mitigation plan simulations and recommended plans. It is described in 8.4.3.4.2 .
• IF3-3 (Mitigation Plan Activation): This reference point is located between the PGF and any available PDP in the network. It enables the activation of mitigation plans and its exact interface capabilities and means depend on the available PDP system.
Additionally, an extra reference point has been defined: the IF3-22 reference point (PGF Management), between the PGF presentation and logic tiers (see section 8.4.3.2.1 ). It is described in 8.4.3.4.3 .
8.4.3.1.2 Mitigation Plan Simulation Tool
The Mitigation Plan Simulation Tool has been introduced during the second ONTIC year. Modern telecommunication networks, especially those using cellular technologies (3G, 4G and the like) may undergo bottlenecks and subsequent QoE degradation in their access networks. As the capacity of the access network is a finite parameter, there are no straightforward strategies for alleviating a degradation situation for all the users in an area with an unplanned degraded QoE. That is, if some users gain the remaining ones will possibly lose and therefore, the average result seems to be the same. However, there are some strategies that may prove successful in order to provide a better QoE than an average result. For instance, mitigation policies that involve the change of access network leave more bandwidth to the remaining users in the source access network. Mitigation policies that make users consume less bandwidth while getting a similar (perceived) quality may be also useful. Finally, it is necessary to acknowledge that not all affected users are equally important for a CSP (it depends on the type of relationship, that is the
619633 ONTIC. Deliverable D5.2: Progress on Use Cases
53 / 80
! !contract, between the CSP and the user) and therefore, even if the average gain (or decrease) in QoE is small, there is an actual increase in the weighted QoE (considering the weights of the subscriber groups when computing the resulting KPI’s).
As described in section 8.4.1 , the following specific mitigation policies will be considered (most of them are based on the use of a standard PCRF):
1. Access technology switch: a. Off-load to Wi-Fi (through an ANDSF Server) b. Switch from 4G to 3G
2. Bandwidth limitation a. Bandwidth limitation (64 Kbps) b. Bandwidth limitation (1 Mbps) c. Bandwidth limitation (3 Mbps)
3. Traffic gating a. Blocking of Video services traffic b. Blocking of File Transfer services traffic c. Blocking of Web Browser services traffic
4. Introduction of service chains (through a Service Function Chaining), such as Video Acceleration (only applies to video services)
It is important to note that the number of available policies is small. If we consider the list above, no more than thirteen policies can be available (traffic gating policies may be combined depending on how many types of services are banned: in total, no more than seven different policies).22 The aforementioned policies can be classified into three different types:
1. Policies that hand over subscribers from the affected area (1a and 1b in the list above). These subscribers will usually undergo an enhancement in the KPI values (provided that the access networks to which they are handed over are in a better condition than the access network in the source areas). As a result of the handover of subscribers to other access network, subscribers remaining in the affected area will also undergo an enhancement, as more bandwidth becomes available.
2. Policies that throttle subscriber traffic (2 and 3 above). Subscribers whose traffic is throttled will undergo KPI degradation. In the same way as with type ‘a’ policies, subscribers whose traffic is not throttled will undergo an enhancement in the KPI values, as a result of the increased bandwidth available.
3. Policies that optimize subscribers’ delivery of services (4 above). KPIs for these subscribers will get better. At the same time, the remaining subscribers will also undergo an enhancement in the KPI values, as a result of the increased bandwidth available.
Simulation of mitigation plans are based on sequentially computing the effects of applying mitigation policies on the available bandwidth for the users that are not included in the application of a policy in the previous step, as described in the following figures:
22 Considering three types of services, we can ban all types of services, pairs of service types (for instance, banning Video and Web Browsing; Video and File Transfer; or Web Browsing and File Transfer), and banning each individual service type.
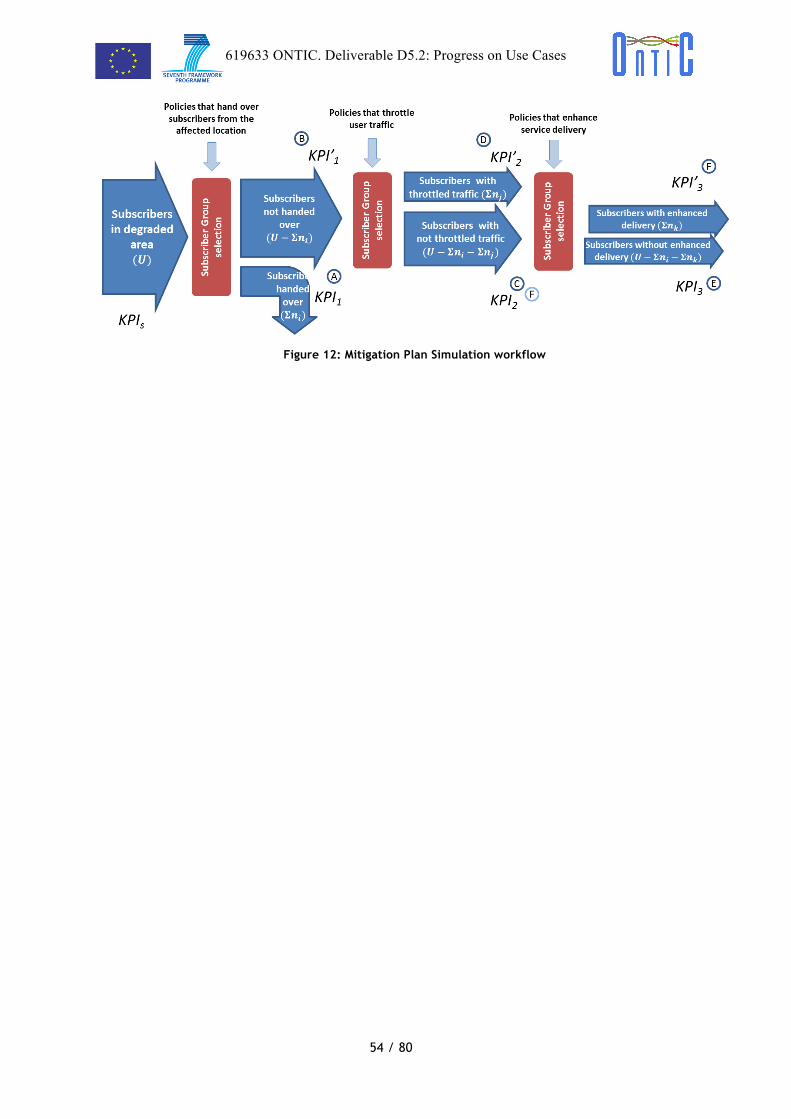
619633 ONTIC. Deliverable D5.2: Progress on Use Cases
54 / 80
! !
Figure 12: Mitigation Plan Simulation workflow
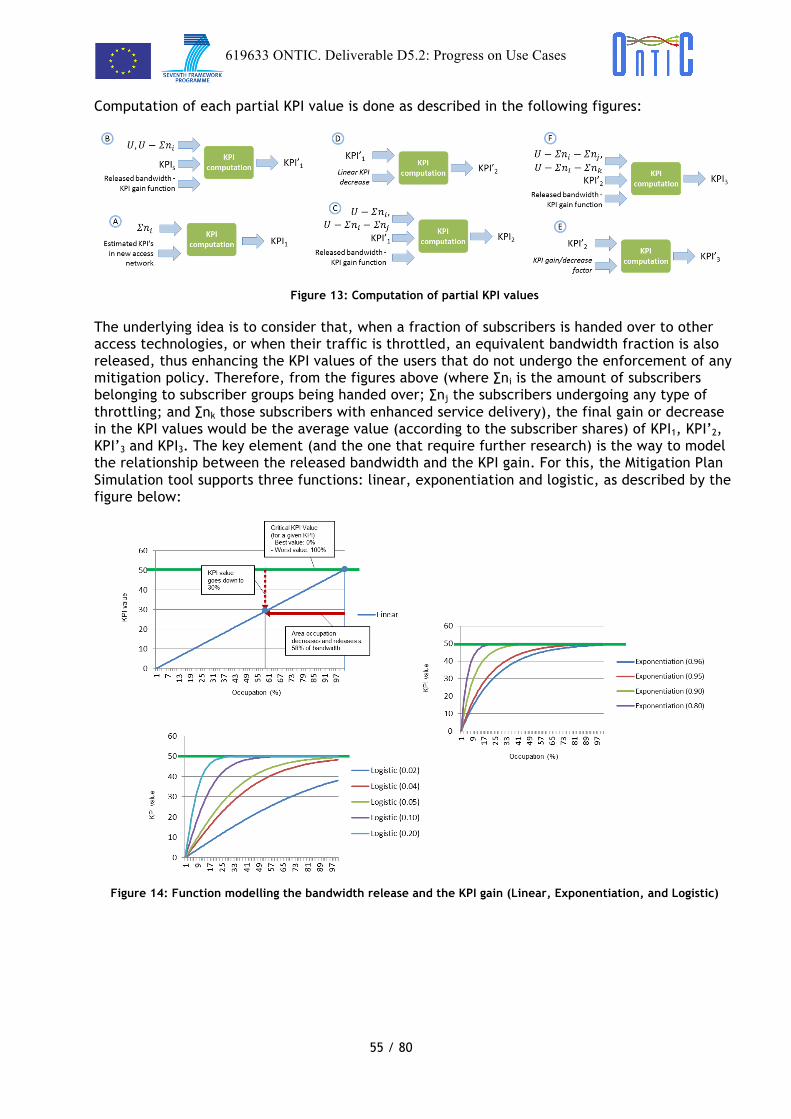
619633 ONTIC. Deliverable D5.2: Progress on Use Cases
55 / 80
! !Computation of each partial KPI value is done as described in the following figures:
Figure 13: Computation of partial KPI values
The underlying idea is to consider that, when a fraction of subscribers is handed over to other access technologies, or when their traffic is throttled, an equivalent bandwidth fraction is also released, thus enhancing the KPI values of the users that do not undergo the enforcement of any mitigation policy. Therefore, from the figures above (where ∑ni is the amount of subscribers belonging to subscriber groups being handed over; ∑nj the subscribers undergoing any type of throttling; and ∑nk those subscribers with enhanced service delivery), the final gain or decrease in the KPI values would be the average value (according to the subscriber shares) of KPI1, KPI’2, KPI’3 and KPI3. The key element (and the one that require further research) is the way to model the relationship between the released bandwidth and the KPI gain. For this, the Mitigation Plan Simulation tool supports three functions: linear, exponentiation and logistic, as described by the figure below:
Figure 14: Function modelling the bandwidth release and the KPI gain (Linear, Exponentiation, and Logistic)

619633 ONTIC. Deliverable D5.2: Progress on Use Cases
56 / 80
! !8.4.3.2 Software architecture
8.4.3.2.1 Policy Governance Function
The PGF is built on top data model presented in the figure below:
Figure 15: PGF Data Model
The PGF Data Model is split in four schemas, described below, that simplify the way PGF information is managed. The stored information is related to the QoE prediction reports, session status, location of the radio cells, KPI’s, customer segments, policies, etc.:
• Degradation: It groups tables for storing the information sent by the Analytics Function. Tables:
o report: It stores the degradation information report. o session: It stores the latest valid information related to a given session. The
prediction for every session id updated by reportIds o mitigation_plan: It stores the information related to the mitigation plans that will
be applied to congestion situations.
• Technologies: It stores information related to the technologies monitored, location of the cells, etc. Tables:
o location: It stores information related to the location of the cells. o kpi: It stores information related to the KPI’s that are evaluated by both the AF
and the PGF.
• Subscriber: It stores information related to the customer segments available in the network and the groups they are integrated in. Tables:
o customer_segments: It stores the set of customer groups available at the operator side. Predictions about QoE degradation contain the percentage of the affected customer segments.
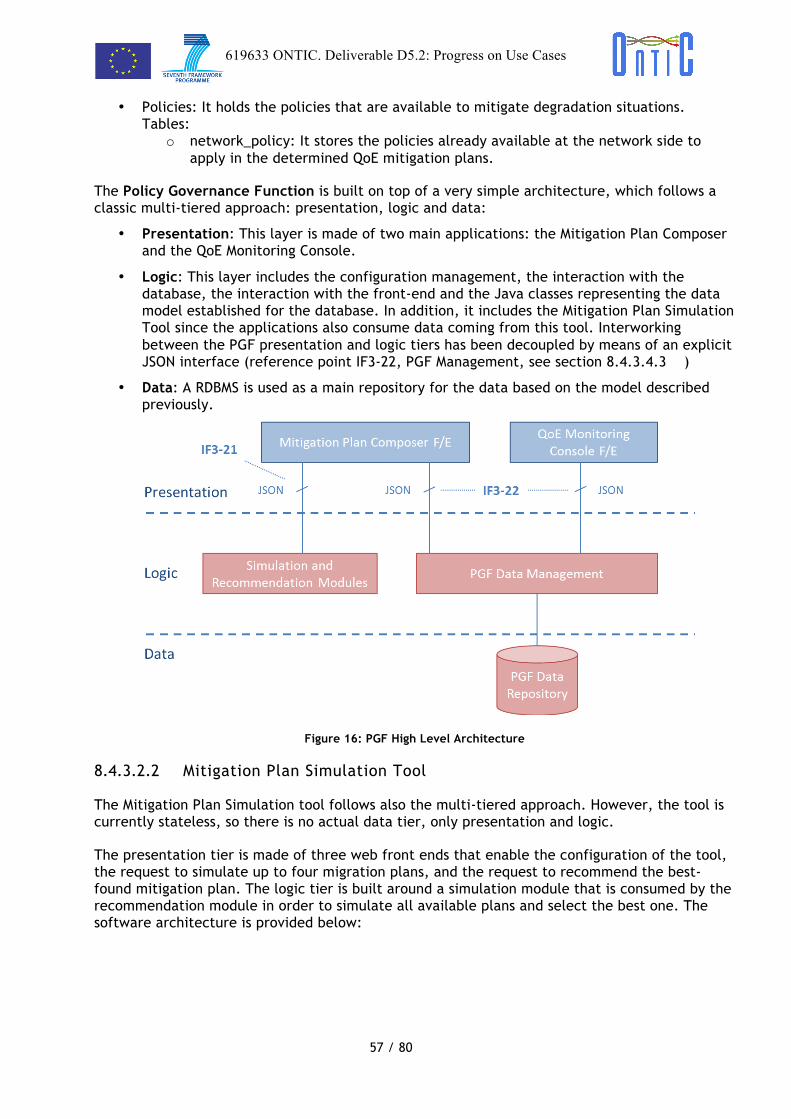
619633 ONTIC. Deliverable D5.2: Progress on Use Cases
57 / 80
! !• Policies: It holds the policies that are available to mitigate degradation situations.
Tables: o network_policy: It stores the policies already available at the network side to
apply in the determined QoE mitigation plans.
The Policy Governance Function is built on top of a very simple architecture, which follows a classic multi-tiered approach: presentation, logic and data:
• Presentation: This layer is made of two main applications: the Mitigation Plan Composer and the QoE Monitoring Console.
• Logic: This layer includes the configuration management, the interaction with the database, the interaction with the front-end and the Java classes representing the data model established for the database. In addition, it includes the Mitigation Plan Simulation Tool since the applications also consume data coming from this tool. Interworking between the PGF presentation and logic tiers has been decoupled by means of an explicit JSON interface (reference point IF3-22, PGF Management, see section 8.4.3.4.3 )
• Data: A RDBMS is used as a main repository for the data based on the model described previously.
Figure 16: PGF High Level Architecture
8.4.3.2.2 Mitigation Plan Simulation Tool
The Mitigation Plan Simulation tool follows also the multi-tiered approach. However, the tool is currently stateless, so there is no actual data tier, only presentation and logic.
The presentation tier is made of three web front ends that enable the configuration of the tool, the request to simulate up to four migration plans, and the request to recommend the best-found mitigation plan. The logic tier is built around a simulation module that is consumed by the recommendation module in order to simulate all available plans and select the best one. The software architecture is provided below:
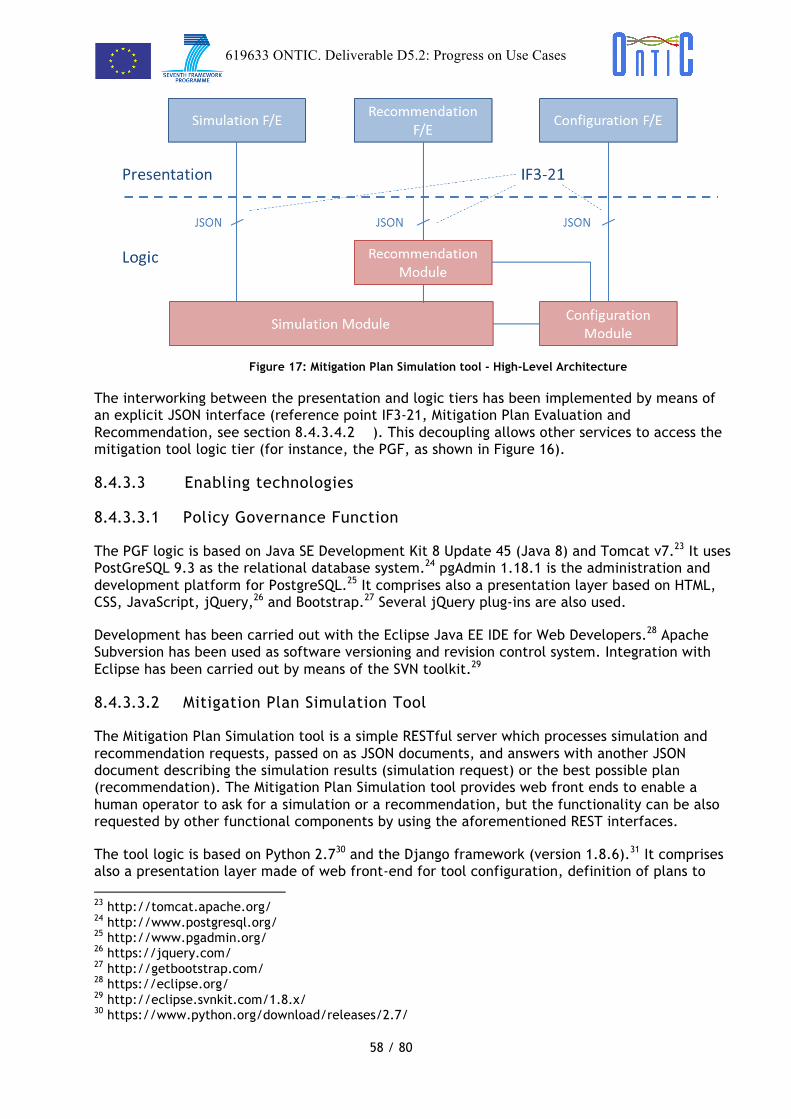
619633 ONTIC. Deliverable D5.2: Progress on Use Cases
58 / 80
! !
Figure 17: Mitigation Plan Simulation tool - High-Level Architecture
The interworking between the presentation and logic tiers has been implemented by means of an explicit JSON interface (reference point IF3-21, Mitigation Plan Evaluation and Recommendation, see section 8.4.3.4.2 ). This decoupling allows other services to access the mitigation tool logic tier (for instance, the PGF, as shown in Figure 16).
8.4.3.3 Enabling technologies
8.4.3.3.1 Policy Governance Function
The PGF logic is based on Java SE Development Kit 8 Update 45 (Java 8) and Tomcat v7.23 It uses PostGreSQL 9.3 as the relational database system.24 pgAdmin 1.18.1 is the administration and development platform for PostgreSQL.25 It comprises also a presentation layer based on HTML, CSS, JavaScript, jQuery,26 and Bootstrap.27 Several jQuery plug-ins are also used.
Development has been carried out with the Eclipse Java EE IDE for Web Developers.28 Apache Subversion has been used as software versioning and revision control system. Integration with Eclipse has been carried out by means of the SVN toolkit.29
8.4.3.3.2 Mitigation Plan Simulation Tool
The Mitigation Plan Simulation tool is a simple RESTful server which processes simulation and recommendation requests, passed on as JSON documents, and answers with another JSON document describing the simulation results (simulation request) or the best possible plan (recommendation). The Mitigation Plan Simulation tool provides web front ends to enable a human operator to ask for a simulation or a recommendation, but the functionality can be also requested by other functional components by using the aforementioned REST interfaces.
The tool logic is based on Python 2.730 and the Django framework (version 1.8.6).31 It comprises also a presentation layer made of web front-end for tool configuration, definition of plans to 23 http://tomcat.apache.org/ 24 http://www.postgresql.org/ 25 http://www.pgadmin.org/ 26 https://jquery.com/ 27 http://getbootstrap.com/ 28 https://eclipse.org/ 29 http://eclipse.svnkit.com/1.8.x/ 30 https://www.python.org/download/releases/2.7/
619633 ONTIC. Deliverable D5.2: Progress on Use Cases
59 / 80
! !simulate and demonstration of results by means of charts, based on HTML, CSS, JavaScript, jQuery,26 Google Charts32 and Bootstrap.27 Several jQuery plug-ins are also used. The functionality is served by means of the Apache Web Server 2.0, with mod_wsgi on an Ubuntu 14.04 LTS machine. The Mitigation Plan Simulation tool can be accessed at ontic.extremeinnovationlab.net, through the port 8008: http://ontic.extremeinnovationlab.net:8008/.
Development has been carried out with Wing IDE as Python IDE, Apache Subversion and the Django Development Server on Windows 7.
8.4.3.3.3 VLC-based testing plan
The lab environment consists of five laptops Dell Latitude E6410 configured in the same VLAN. Each server works with Ubuntu v14.04.
8.4.3.4 API specification
8.4.3.4.1 IF3-2 Reference Point (Insight Delivery)
The Analytics Function (AF) is responsible for reporting in advance (that is, predicting) the degradation of a given set of service performance indicators (KPI’s) in given locations. It is expected that the AF is able to analyze the evolution of KPI’s and predict when their values will trespass predefined thresholds.
The prediction on a QoE degradation situation is notified by means of the so-called Degradation Reports. When an initial report is issued by the AF, a session is created in the PGF and sent back to the AF. This session represents a predicted degradation situation. The AF is expected to update its predictions by issuing updated degradation reports. Any report related to the same degradation situation must carry the same session identifier.
Degradation reports must contain:
• A report identifier. This identifier is different to the session identifier. • A session identifier. It identifies the degradation situation. Although there are several
options to create this identifier, this document assumes that the identifier is created by the PGF the first time a report referring to a given degradation situation arrives and sent back to the AF. The AF must include or refer to the session identifier in any subsequent degradation report referring to the same predicted degradation situation.
• A spatial location prediction scope: a cell or groups of contiguous cells. • Time indicators: when the degradation situation is predicted to start and to end. A
timestamp is provided as well. • A confidence parameter (optional). • The service indicators (KPIs) the prediction refers to and the predicted degraded value. • The predicted share of each customer segment.
Delivery of reports from the AF to the PGF may be triggered according to the AF configuration (the most usual option) or as a response to an explicit request by PGF (which may be referred only to a specific cell or group of cells).
When a degradation report is received at the PGF, a session is created in the PGF to track the evolution of said degradation situation. The PGF might state how updated reports have
31 https://www.djangoproject.com/ 32 https://developers.google.com/chart/
619633 ONTIC. Deliverable D5.2: Progress on Use Cases
60 / 80
! !to be delivered (for example, with a specific periodicity). Said delivery of updated reports may be also triggered according to internal AF configuration.
The IF3-2 implements a push procedure, where the AF delivers QoE degradation reports to the PGF, without needing an explicit subscription. There are three types of messages defined for this reference point. One of them (mandatory) enables the delivery of degradation information from the AF to the PGF. The remaining ones are used to handle the subscription/notification procedure and may be absent if the AF is properly configured.
As mentioned in the previous paragraph, the very first set of messages enables delivery of information. This set of messages is the only mandatory one:
1. Delivery of QoE Degradation Reports from the Analytics Function to the Policy Governance Function. Delivery of degradation reports is usually triggered when and how the AF configuration options require it. That is, depending on a number of configured conditions, the AF issues degradation reports to the PGF address. It is also possible that said delivery conditions are set at the AF as the result of an explicit subscription request from the PGF (see item 2 below). Aggregation of degradation information referred to contiguous groups of cells might be supported (aggregation should be however only allowed for cells affected by the same degradation situation). However, the PGF only will support, in its initial stage, degradation information referred to one cell. An important aspect to highlight is the fact that the AF is expected to keep on sending degradation reports until the predicted degradation situation ends. Reports related to the same degradation situation will pass on the same session identifier (generated by the PGF every time a fresh degradation report arrives).
The remaining messages enable the management of the subscription/notification procedures. They are not mandatory in this first stage of the implementation:
2. Request to Subscribe to the QoE Degradation Reports delivered by the AF. This set of messages enables the PGF to request the AF to send degradation reports to the PGF when the AF foresees a QoE degradation situation. The implementation of these messages is usually not required, as in its setup the AF is configured to send degradation reports to the PGF. However, there can be scenarios in which the AF is expected to send only reports when degradation is predicted within a specific scope (for specific areas, for specific services…). Thus, the PGF may use these messages to set the scope of notifications (that is, to request notifications related only to a given geographical area, or to a specific service) or to define where or how frequently degradation reports must be sent. Three pairs of messages are defined to implement this functionality: (a) ‘Start Subscription to QoE Degradation Reports’, (b) ‘Update Subscription to QoE Degradation Reports’, and (c) ‘Stop Subscription to QoE Degradation Reports’.
3. Request to Modify the Delivery of QoE Degradation Reports. Once an initial degradation report is received by the PGF, the AF is expected to keep on sending updated reports to the PGF referred to the original degradation prediction on a periodical basis. The PGF must create a session when said initial report arrives and update it whenever a new report, referred to the same degradation situation, arrives. However, it should be possible for the PGF to explicitly request to modify the delivery conditions of subsequent degradation reports (updating, for instance, the notification frequency), or even to stop delivery of subsequent reports related to a same degradation situation. Two pairs of messages are defined: (a) ‘Modify Subscription to QoE Degradation Reports’, and (b) ‘Stop Subscription to QoE Degradation Reports’.
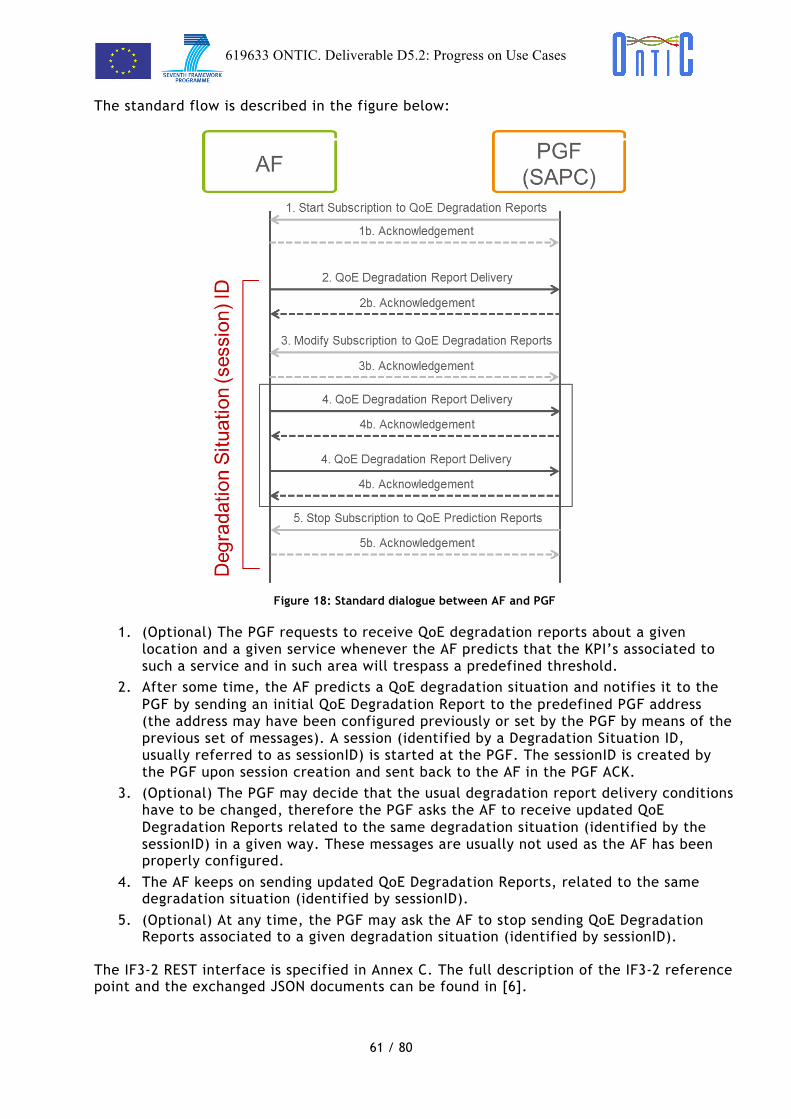
619633 ONTIC. Deliverable D5.2: Progress on Use Cases
61 / 80
! !The standard flow is described in the figure below:
Figure 18: Standard dialogue between AF and PGF
1. (Optional) The PGF requests to receive QoE degradation reports about a given location and a given service whenever the AF predicts that the KPI’s associated to such a service and in such area will trespass a predefined threshold.
2. After some time, the AF predicts a QoE degradation situation and notifies it to the PGF by sending an initial QoE Degradation Report to the predefined PGF address (the address may have been configured previously or set by the PGF by means of the previous set of messages). A session (identified by a Degradation Situation ID, usually referred to as sessionID) is started at the PGF. The sessionID is created by the PGF upon session creation and sent back to the AF in the PGF ACK.
3. (Optional) The PGF may decide that the usual degradation report delivery conditions have to be changed, therefore the PGF asks the AF to receive updated QoE Degradation Reports related to the same degradation situation (identified by the sessionID) in a given way. These messages are usually not used as the AF has been properly configured.
4. The AF keeps on sending updated QoE Degradation Reports, related to the same degradation situation (identified by sessionID).
5. (Optional) At any time, the PGF may ask the AF to stop sending QoE Degradation Reports associated to a given degradation situation (identified by sessionID).
The IF3-2 REST interface is specified in Annex C. The full description of the IF3-2 reference point and the exchanged JSON documents can be found in [6].
619633 ONTIC. Deliverable D5.2: Progress on Use Cases
62 / 80
! !8.4.3.4.2 IF3-21 Reference Point (Mitigation Plan Evaluation and
Recommendation)
Interworking between the Mitigation Plan Simulation Tool presentation and logic tiers has been decoupled by means of an explicit JSON interface. It allow to request the simulation of the effects on KPI values of a given mitigation plan (or set of plans), to request the recommendation of a best mitigation plan and the configuration of the tool itself. The reference point follows stateless request-response procedures implementing the following messages:
1. Request to Simulate Mitigation Plans. From the tool front-end (or from the PGF) it is possible to define the parameters of a set of mitigation plans and to request the simulation of several mitigation plans. The input is a JSON document that is sent by means of the HTTP POST method. The JSON document must pass on information about which KPI must be simulated, the involved subscriber groups and their relative shares and the policies that each mitigation plan comprises. The logic tier answers with a response JSON document passed on as the HTTP response body that comprises the KPI values for every subscriber group, and their average and weighted values.
2. Request to Get a Recommended Mitigation Plan. From the tool front-end (or from the PGF) it is possible to define a set of constraints and request to get a recommendation according to such constraints. The input is a JSON document that is sent by means of HTTP POST method. The JSON document must pass on information about which KPI(s) the recommendation must maximize, the involved subscriber groups and their relative shares and, if any, which polices the mitigation plan cannot comprise. The logic tier answers with another JSON document passed on as the HTTP response body that comprises mitigation plan description and the KPI gain.
3. Update Configuration. This message allows the update of the tool configuration. As with the previous sets of messages, the input is a JSON document sent by means of the HTTP POST method. This JSON document contains elements such as configuration parameters, the supported KPI’s or subscriber groups, the KPI gain simulation function, the KPI thresholds and the like. The output is a simple HTTP status code.
The IF3-22 REST interface is specified in Annex C. The full description of the exchanged IF3-21 JSON documents can be found in [7].
8.4.3.4.3 IF3-22 Reference Point (PGF Management)
Interworking between the PGF presentation and logic tiers has been decoupled by means of an explicit JSON interface. Therefore, the two PGF front-ends (the Mitigation Plan Builder and the QoE Monitoring) are able to interwork with the logic tier. The reference point implements the following messages:
1. Request to Get an Enriched Prediction Report: The QoE monitoring application needs a consolidated view about the prediction sent by AF. This message provides the information needed taking it from different tables.
2. Request Available Cells: It gets a list of available cells from the operator database. 3. Request Services List: It gets a list of the available services on the network side. The UC
#3 implementation has as the main service to be modeled the video service. Other services have been taken into account but will not be managed.
4. Request Available Policies: It gets a list of the available policies that will be used to compose new mitigation plans. The list of policies will be used in the simulation and recommendation tools.
619633 ONTIC. Deliverable D5.2: Progress on Use Cases
63 / 80
! !5. Request Available Mitigation Plans: It gets a list of the available mitigation plans. Every
mitigation plan is related to a reportId. There are no mitigation plans isolated from a reportId.
6. Request Current Prediction: It gets a list of the available plans related to a reportId.
The IF3-22 REST interface is specified in Annex C.
8.4.4 Performance Evaluation
8.4.4.1 Relevant Metrics
The performance of the PGF and the PGF Mitigation Plan Simulator will be evaluated using typical metrics for Web applications:
• Availability: represents the percentage of time where a Web application can be accessed;
• Latency: it is the time interval between the time of making a request and the time at which the responses are returned;
• Throughput: the number of requests that can be processed per minute yielding a reasonable latency.
With regard to ML algorithms incorporated in the Analytics Function, clustering quality evaluation will be addressed by means of the following metrics:
• SSE (Sum of Squared Errors):33 SSE is the sum of the squared differences between each observation and its group's mean. It can be used as a measure of the variation within a cluster. If all cases within a cluster are identical the SSE would then be equal to 0.
• Silhouette:34 The silhouette coefficient compares the average distance of elements in the same cluster with the average distance to elements in other clusters. Objects with a high silhouette value are considered well clustered; objects with a low value may be outliers.
In the traffic classification evaluation context, the following metrics will be considered:
• Prediction accuracy:35 The accuracy is the proportion of true results (both true positives and true negatives) among the total number of cases examined.
• Precision:36 In a classification task, the precision for a class is the number of true positives (i.e. the number of items correctly labeled as belonging to the positive class) divided by the total number of elements labeled as belonging to the positive class (i.e. the sum of true positives and false positives, which are items incorrectly labeled as belonging to the class).
• Recall: In a classification task, recall is defined as the number of true positives divided by the total number of elements that actually belong to the positive class, i.e., the sum of true positives and false negatives, which are items which were not labeled as belonging to the positive class but should have been.
33 https://hlab.stanford.edu/brian/error_sum_of_squares.html 34 Peter J. Rousseeuw (1987). "Silhouettes: a Graphical Aid to the Interpretation and Validation of Cluster Analysis". Computational and Applied Mathematics 20: 53–65. doi:10.1016/0377-0427(87)90125-7 35 https://en.wikipedia.org/wiki/Accuracy_and_precision#In_binary_classification 36 https://en.wikipedia.org/wiki/Precision_and_recall

619633 ONTIC. Deliverable D5.2: Progress on Use Cases
64 / 80
! !For itemsets and association rule mining algorithms, the following metrics will be considered:
• Support: The support value of an itemset X is defined as the proportion of transactions in the database which contains the itemset X itself.
• Confidence: The confidence value of a rule, X → Y, with respect to a set of transactions, is the proportion of the transactions that contain X which also contain Y.
• Lift:37 The lift of a rule X → Y is defined as the ratio of the observed support to that expected if X and Y were independent.
8.4.4.2 Mechanisms
Performance metrics of Web applications (such as the PGF and the PGF Mitigation Plan Simulator Tool) will be addressed through stress tests (component testing in critical conditions).
The software to perform stress test will be Apache JMeter, 38 customized with JMeter plugins39 in order to improve the monitoring capability. JMeter configuration will possibly require further refinement in order to support non-interactive mode and to show progress during test execution. As a matter of facts, the non-interactive mode is the best choice due to high machine load. JMeter is an open source Java-based application that can be used as a load testing tool for measuring the performance of a variety of services, with a focus on Web applications (that including HTTP/HTTPS and REST interfaces).
8.4.5 Open issues, deviations and future developments
During the third year, the components of the AQoE system will be integrated and an end-to-end prototype will be implemented in the VLC test-bed. More specifically:
The ML traffic classification algorithms will be trained and tested with datasets provided by the VLC test-bed and by partners. Given that the ONTS dataset, captured by the project, has been stripped off any payload for privacy reasons, the deployment of the VLC test-bed and the investigation of alternative traffic datasets suitable for computing QoE KPIs has been one of the main work dimensions.
The validated ML algorithms will be incorporated in the Analytics Function for providing a fully functional interface with the Policy Governance Function. The already implemented components for data collection and pre-processing in the VLC test-bed will be integrated with the Analytics Function for allowing the ML algorithms to operate on actual operations data. Note that this set-up is according to the specified ONTIC Big Data architecture (see deliverable D2.3 [2]).
The implementation of the Policy Governance Function and the Mitigation Plan Simulation Tool will be finalized (it is already in an advanced state) and the Policy Governance Function will be integrated with a commercially available router with built-in bandwidth management capabilities. Through this router the actions of the mitigation policies will be enforced in the VLC test-bed; the router has already been selected by the project40 and deployed in the VLC test-bed.
Based on the above, the full functional closed-loop control for AQoE -data collection, ML-based analysis and enforcement of mitigation policies- will be active in the VLC test-bed. The system 37 https://en.wikipedia.org/wiki/Association_rule_learning 38 http://jmeter.apache.org/ 39 http://jmeter-plugins.org/ 40 TP-LINK Gigabit Router with built-in IP QoS features (http://www.tp-link.com/en/products/details/cat-9_TL-WR1042ND.html)

619633 ONTIC. Deliverable D5.2: Progress on Use Cases
65 / 80
! !then can be exercised in a controlled environment and the ML algorithms will be tested and demonstrated for their ability to adequately predict QoE degradation situations.
619633 ONTIC. Deliverable D5.2: Progress on Use Cases
66 / 80
! !9. References
[1] ONTIC. “Deliverable D5.1. Use Case Requirements.” Internet: http://www.ict-ontic.eu/, Feb. 2014 [Dec. 1, 2015].
[2] ONTIC. “Deliverable D2.3. Progress on ONTIC Big Data Architecture.” Internet: http://www.ict-ontic.eu/, Feb. 2015.
[3] ONTIC. “Deliverable D2.5. Progress on Provisioning Subsystem.” Internet: http://www.ict-ontic.eu/, Feb. 2015.
[4] ONTIC. “Deliverable D3.2. Scalable algorithms for offline network characterization.” Internet: http://www.ict-ontic.eu/, Feb. 2015.
[5] ONTIC. “Deliverable D4.2. Algorithms description.” Internet: http://www.ict-ontic.eu/, Feb. 2015.
[6] ONTIC. “Adaptive QoE Control Reference Point IF3-2: QoE Analytics Function − Policy Governance Function (Insight Delivery)” Internet: http://www.ict-ontic.eu/, Jun. 2015 [Dec. 1, 2015].
[7] ONTIC. “Adaptive QoE Control Mitigation Plan Simulation tool. Development and Deployment Guide” Internet: http://www.ict-ontic.eu/, Dec. 2015 [Dec. 1, 2015].
[8] Rune, Göran, et al. "Architecture Evolution for Automation and Network Programmability." Ericsson Review 28 Nov. 2014.
[9] Ericsson SAPC Commercial Presentation. http://archive.ericsson.net/service/internet/picov/get?DocNo=4/22109-FGB101428&Lang=EN&HighestFree=Y
[10] Open Dayligh. Service Function Chaining, https://wiki.opendaylight.org/view/Service_Function_Chaining:Main
[11] 3GPP TS 23.402 V12.4.0 (2014-03): Architecture enhancements for non-3GPP accesses (Release 12).
[12] Floyd, Sally, and Van Jacobson. "Random early detection gateways for congestion avoidance." Networking, IEEE/ACM Transactions on 1.4 (1993): 397-413.
[13] Jacobson, Van, Kathy Nichols, and Kedar Poduri. "RED in a Different Light." Unpublished draft available at http://www.cnaf.infn.it/∼ferrari/papers/ispn/red light 9 (1999): 30.
[14] Mozo, Alberto, López Presa, José Luis, and Fernández Anta, Antonio. "SLBN: A Scalable Max-min Fair Algorithm for Rate-Based Explicit Congestion Control." Network Computing and Applications (NCA), 2012 11th IEEE International Symposium on. IEEE, 2012.
[15] Charny, Anna, David D. Clark, and Raj Jain. "Congestion control with explicit rate indication." Communications, 1995. ICC'95 Seattle, 'Gateway to Globalization', 1995 IEEE International Conference on. Vol. 3. IEEE, 1995.
619633 ONTIC. Deliverable D5.2: Progress on Use Cases
67 / 80
! ![16] Mozo, Alberto, López Presa, José Luis, and Fernández Anta, Antonio. "B-Neck: A
distributed and quiescent max-min fair algorithm." Network Computing and Applications (NCA), 2011 10th IEEE International Symposium on. IEEE, 2011.
[17] Zegura, Ellen W., Kenneth L. Calvert, and Samrat Bhatt Acharjee. "How to model an internetwork." INFOCOM'96. Fifteenth Annual Joint Conference of the IEEE Computer Societies. Networking the Next Generation. Proceedings IEEE. Vol. 2. IEEE, 1996.
[18] Kalyanaraman, Shivkumar, et al. "The ERICA switch algorithm for ABR traffic management in ATM networks." Networking, IEEE/ACM Transactions on 8.1 (2000): 87-98.
[19] Bartal, Yair, et al. "Fast, fair and frugal bandwidth allocation in atm networks." Algorithmica 33.3 (2002): 272-286.
[20] Cobb, Jorge A., and Mohamed G. Gouda. "Stabilization of max-min fair networks without per-flow state." Stabilization, Safety, and Security of Distributed Systems. Springer Berlin Heidelberg, 2008. 156-172.
[21] Dukkipati, Nandita, and Nick McKeown. "Why flow-completion time is the right metric for congestion control." ACM SIGCOMM Computer Communication Review 36.1 (2006): 59-62.
[22] Jain, Saurabh, and Dmitri Loguinov. "Piqi-rcp: Design and analysis of rate-based explicit congestion control." Quality of Service, 2007 Fifteenth IEEE International Workshop on. IEEE, 2007.
[23] Jose, Lavanya, Lisa Yan, Mohammad Alizadeh, George Varghese, Nick McKeown, and Sachin Katti. "High Speed Networks Need Proactive Congestion Control." In Proceedings of the 14th ACM Workshop on Hot Topics in Networks, p. 14. ACM, 2015.
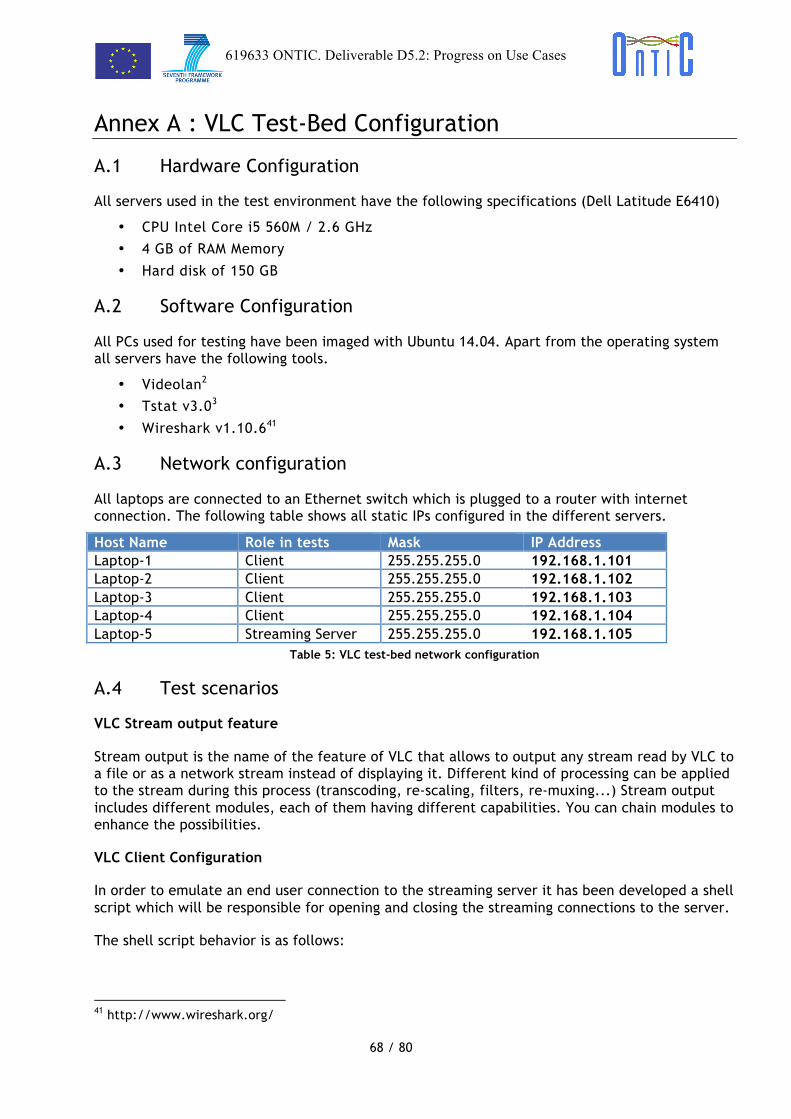
619633 ONTIC. Deliverable D5.2: Progress on Use Cases
68 / 80
! !
Annex A : VLC Test-Bed Configuration
A.1 Hardware Configuration
All servers used in the test environment have the following specifications (Dell Latitude E6410)
• CPU Intel Core i5 560M / 2.6 GHz
• 4 GB of RAM Memory
• Hard disk of 150 GB
A.2 Software Configuration
All PCs used for testing have been imaged with Ubuntu 14.04. Apart from the operating system all servers have the following tools.
• Videolan2
• Tstat v3.03
• Wireshark v1.10.641
A.3 Network configuration
All laptops are connected to an Ethernet switch which is plugged to a router with internet connection. The following table shows all static IPs configured in the different servers.
Host Name Role in tests Mask IP Address Laptop-1 Client 255.255.255.0 192.168.1.101 Laptop-2 Client 255.255.255.0 192.168.1.102 Laptop-3 Client 255.255.255.0 192.168.1.103 Laptop-4 Client 255.255.255.0 192.168.1.104 Laptop-5 Streaming Server 255.255.255.0 192.168.1.105
Table 5: VLC test-bed network configuration
A.4 Test scenarios
VLC Stream output feature
Stream output is the name of the feature of VLC that allows to output any stream read by VLC to a file or as a network stream instead of displaying it. Different kind of processing can be applied to the stream during this process (transcoding, re-scaling, filters, re-muxing...) Stream output includes different modules, each of them having different capabilities. You can chain modules to enhance the possibilities.
VLC Client Configuration
In order to emulate an end user connection to the streaming server it has been developed a shell script which will be responsible for opening and closing the streaming connections to the server.
The shell script behavior is as follows:
41 http://www.wireshark.org/
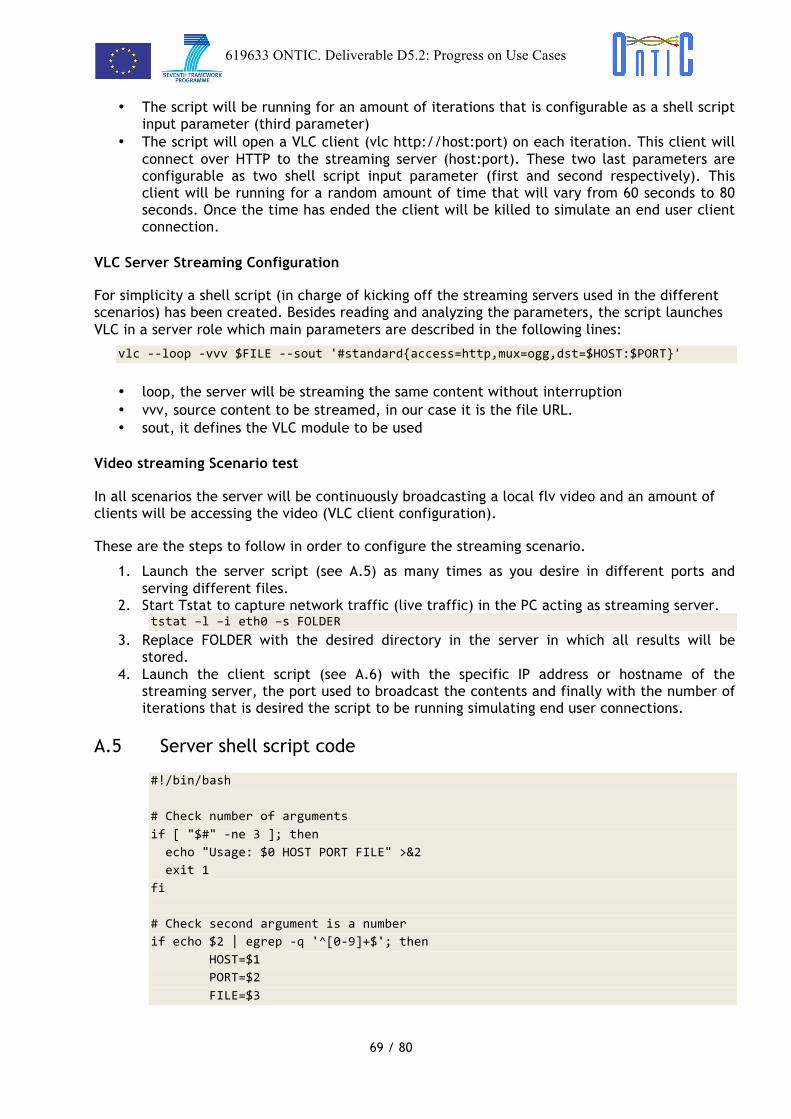
619633 ONTIC. Deliverable D5.2: Progress on Use Cases
69 / 80
! !• The script will be running for an amount of iterations that is configurable as a shell script
input parameter (third parameter) • The script will open a VLC client (vlc http://host:port) on each iteration. This client will
connect over HTTP to the streaming server (host:port). These two last parameters are configurable as two shell script input parameter (first and second respectively). This client will be running for a random amount of time that will vary from 60 seconds to 80 seconds. Once the time has ended the client will be killed to simulate an end user client connection.
VLC Server Streaming Configuration
For simplicity a shell script (in charge of kicking off the streaming servers used in the different scenarios) has been created. Besides reading and analyzing the parameters, the script launches VLC in a server role which main parameters are described in the following lines:
vlc -‐-‐loop -‐vvv $FILE -‐-‐sout '#standard{access=http,mux=ogg,dst=$HOST:$PORT}'
• loop, the server will be streaming the same content without interruption • vvv, source content to be streamed, in our case it is the file URL. • sout, it defines the VLC module to be used
Video streaming Scenario test
In all scenarios the server will be continuously broadcasting a local flv video and an amount of clients will be accessing the video (VLC client configuration).
These are the steps to follow in order to configure the streaming scenario.
1. Launch the server script (see A.5) as many times as you desire in different ports and serving different files.
2. Start Tstat to capture network traffic (live traffic) in the PC acting as streaming server. tstat –l –i eth0 –s FOLDER
3. Replace FOLDER with the desired directory in the server in which all results will be stored.
4. Launch the client script (see A.6) with the specific IP address or hostname of the streaming server, the port used to broadcast the contents and finally with the number of iterations that is desired the script to be running simulating end user connections.
A.5 Server shell script code
#!/bin/bash # Check number of arguments if [ "$#" -‐ne 3 ]; then echo "Usage: $0 HOST PORT FILE" >&2 exit 1 fi # Check second argument is a number if echo $2 | egrep -‐q '^[0-‐9]+$'; then HOST=$1 PORT=$2 FILE=$3
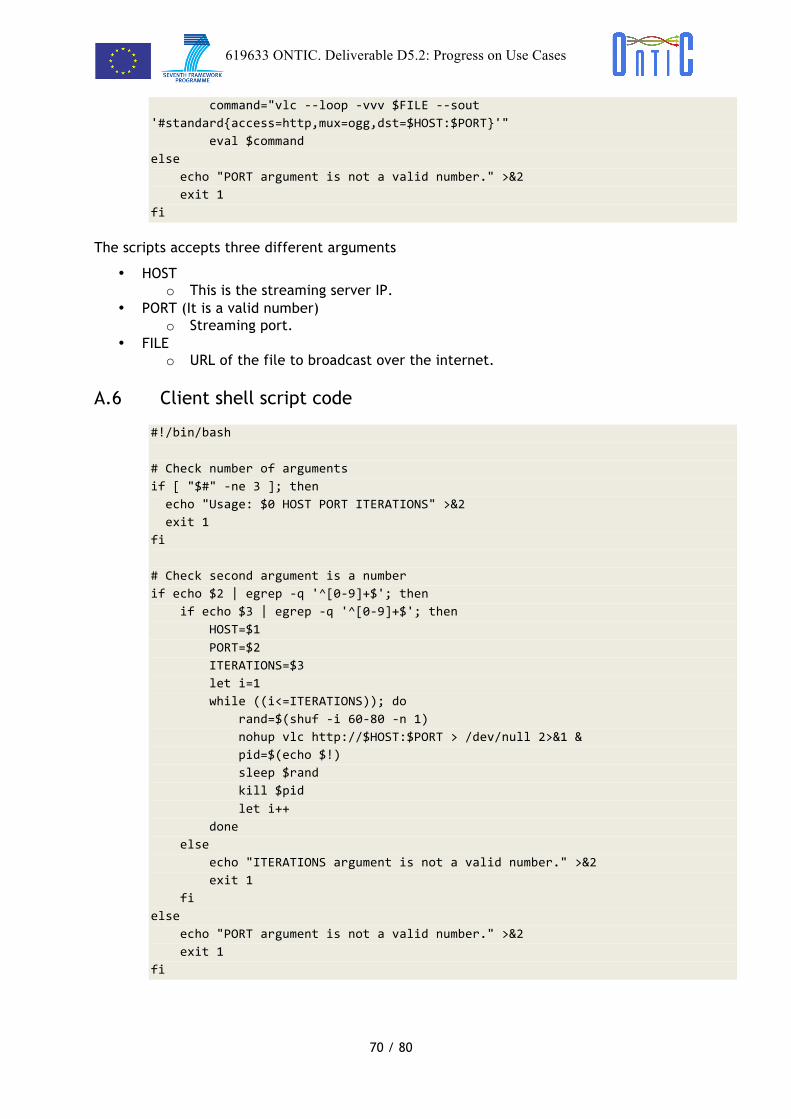
619633 ONTIC. Deliverable D5.2: Progress on Use Cases
70 / 80
! ! command="vlc -‐-‐loop -‐vvv $FILE -‐-‐sout '#standard{access=http,mux=ogg,dst=$HOST:$PORT}'" eval $command else echo "PORT argument is not a valid number." >&2 exit 1 fi
The scripts accepts three different arguments
• HOST o This is the streaming server IP.
• PORT (It is a valid number) o Streaming port.
• FILE o URL of the file to broadcast over the internet.
A.6 Client shell script code
#!/bin/bash # Check number of arguments if [ "$#" -‐ne 3 ]; then echo "Usage: $0 HOST PORT ITERATIONS" >&2 exit 1 fi # Check second argument is a number if echo $2 | egrep -‐q '^[0-‐9]+$'; then if echo $3 | egrep -‐q '^[0-‐9]+$'; then HOST=$1 PORT=$2 ITERATIONS=$3 let i=1 while ((i<=ITERATIONS)); do rand=$(shuf -‐i 60-‐80 -‐n 1) nohup vlc http://$HOST:$PORT > /dev/null 2>&1 & pid=$(echo $!) sleep $rand kill $pid let i++ done else echo "ITERATIONS argument is not a valid number." >&2 exit 1 fi else echo "PORT argument is not a valid number." >&2 exit 1 fi
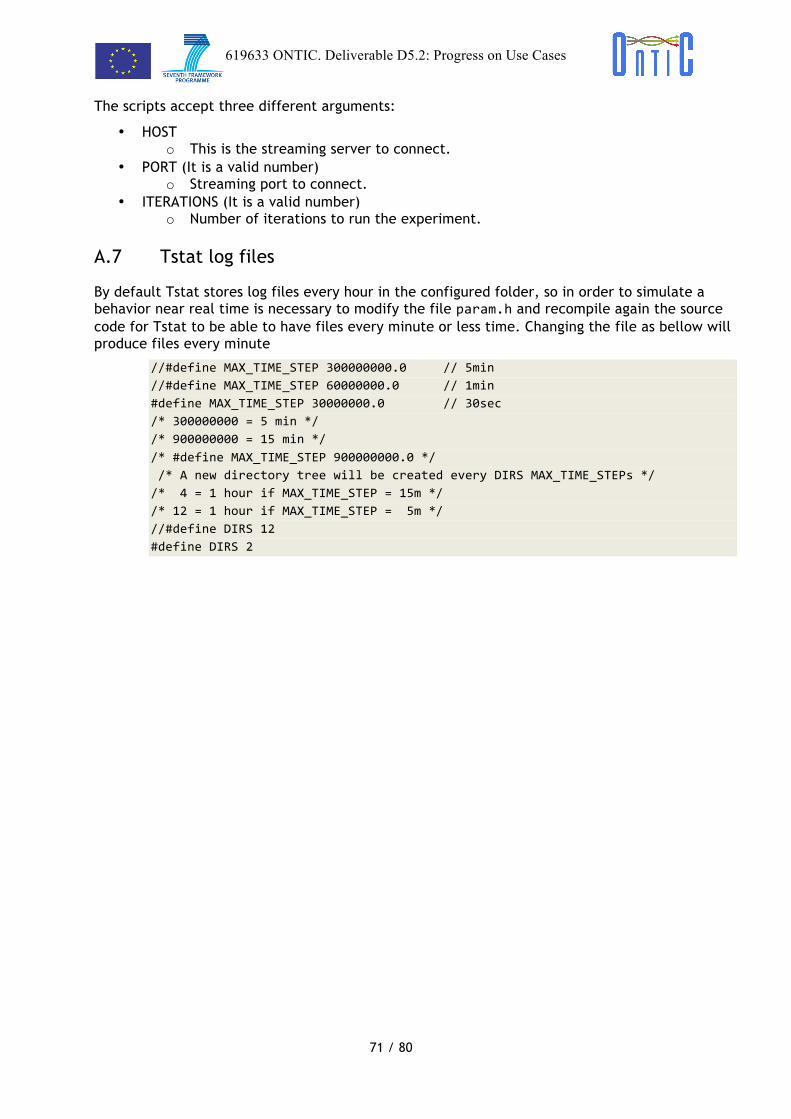
619633 ONTIC. Deliverable D5.2: Progress on Use Cases
71 / 80
! !The scripts accept three different arguments:
• HOST o This is the streaming server to connect.
• PORT (It is a valid number) o Streaming port to connect.
• ITERATIONS (It is a valid number) o Number of iterations to run the experiment.
A.7 Tstat log files
By default Tstat stores log files every hour in the configured folder, so in order to simulate a behavior near real time is necessary to modify the file param.h and recompile again the source code for Tstat to be able to have files every minute or less time. Changing the file as bellow will produce files every minute
//#define MAX_TIME_STEP 300000000.0 // 5min //#define MAX_TIME_STEP 60000000.0 // 1min #define MAX_TIME_STEP 30000000.0 // 30sec /* 300000000 = 5 min */ /* 900000000 = 15 min */ /* #define MAX_TIME_STEP 900000000.0 */ /* A new directory tree will be created every DIRS MAX_TIME_STEPs */ /* 4 = 1 hour if MAX_TIME_STEP = 15m */ /* 12 = 1 hour if MAX_TIME_STEP = 5m */ //#define DIRS 12 #define DIRS 2

619633 ONTIC. Deliverable D5.2: Progress on Use Cases
72 / 80
! !
Annex B Quality of Experience (QoE) Framework
Quality of Experience is defined as the overall performance of a system from the point of view of the users. QoE is a measure of end-to-end performance at the services level from the user perspective and an indication of how well the system meets the user’s needs. Thus, the QoE value for every user given a type of services is the perceived quality expected by the customer for a given service delivered through a telecommunication network and is closely related to what is expected by the user regarding the type of service and the service levels agreed with the communication service provider whose network is used by the customer. In that sense, it is important to acknowledge that there are different CSP profiles and different business strategies, which translate in different business-wise requirements, which finally land on concrete policies and constraints to be applied to the different user groups.
Based on the CSP business profile, the definition of subscriber groups and associated price plans are different, and so are the prices, user segmentation, priorities, etc. At the end of the chain, the customer will have different expectations depending on that. So the operator profile defines one or various target segments.
CSP Profile: It sets the target subscriber groups, the type of network and main business goals of the communication service provider by defining a set of high level statements that later on will be more and more detailed as we move down towards the physical layer. It is not the same a communication service provider focused on corporate customers than other focused on young people. Two different profiles will be defined to test the hypothesis.
Business Requirements: once the communication service provider profile has been defined, it is time to define the different high level business requirements that go down a step further in making the CSP profile vision closer to the real actuation on the network side. Business requirements provide an overview about the way the QoE degradation scenarios are managed, how to prioritize the QoE needs of its customer base, how to use their network resources, etc.
Once the high level business rules on how the CSP deals with the degradation events in its network and its priorities have been defined, it is time to move towards the actual implementation in the network. Here various factors come into play, such as how the degradation events will be predicted, which threshold Key Performance Indicators (KPI) values for the different customer segments are defined, and the different types of mitigation policies to apply to cope with QoE degradation scenarios.
Event prediction: The prediction triggers the whole AQoE Control loop. Predictions are computed in the Analytics Function and are based on current measurements, taking into account historical records about the use of a type of service, the customer profile, etc. Predictions are not static insights that do not change over time, but as the environment evolves, there is a continuous modulation of the insights about the same event (that is, we can consider the existence of sessions related to the prediction of a degradation situation).
Policy evaluation: based on the predictions, the business requirements, the network status and the availability of mitigation policies, this functionality (played by a Policy Decision Point complemented by the Policy Governance Function) will apply the mitigation plan that better matches the conditions of the analytics insight in order to alleviate the degradation situation. As said, these situations are not static, so a reevaluation could be needed.
Finally, the Policy Enforcement point can be found. Here the mitigation plans are applied and enforced on the network side, and trigger new measurements of the different parameters that
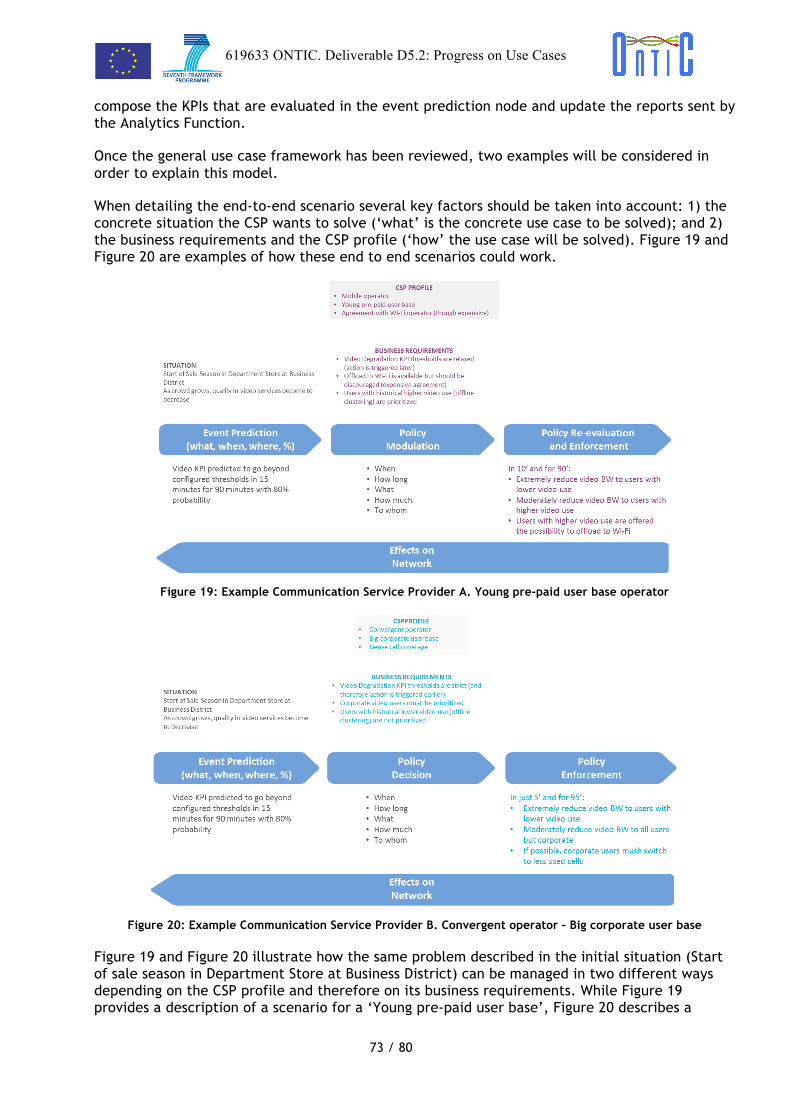
619633 ONTIC. Deliverable D5.2: Progress on Use Cases
73 / 80
! !compose the KPIs that are evaluated in the event prediction node and update the reports sent by the Analytics Function.
Once the general use case framework has been reviewed, two examples will be considered in order to explain this model.
When detailing the end-to-end scenario several key factors should be taken into account: 1) the concrete situation the CSP wants to solve (‘what’ is the concrete use case to be solved); and 2) the business requirements and the CSP profile (‘how’ the use case will be solved). Figure 19 and Figure 20 are examples of how these end to end scenarios could work.
Figure 19: Example Communication Service Provider A. Young pre-paid user base operator
Figure 20: Example Communication Service Provider B. Convergent operator – Big corporate user base
Figure 19 and Figure 20 illustrate how the same problem described in the initial situation (Start of sale season in Department Store at Business District) can be managed in two different ways depending on the CSP profile and therefore on its business requirements. While Figure 19 provides a description of a scenario for a ‘Young pre-paid user base’, Figure 20 describes a

619633 ONTIC. Deliverable D5.2: Progress on Use Cases
74 / 80
! !scenario for a convergent operator with a big corporate user base. Depending on the type of CSP, the business requirements are tuned up to fulfill the CSP’s needs, and therefore the way the policies will be selected and enforced.
As an example, CSP A focuses mainly on corporate users, and therefore its main performance target is focused on having their corporate customers with the best possible QoE, always taking into account network restrictions. The following could be the key statements that define the way the CSP have to deal with unexpected situations.
• Mobile operator
• Young pre-paid user base
• Agreement with Wi-Fi operator (though expensive)
The profile turns into the following business requirements:
1. Video Degradation KPI thresholds are relaxed (action can be triggered later)
2. Offload to Wi-Fi is available but should be discouraged (as the agreements is expensive)
3. Users with historical higher video use (offline clustering) are prioritized
As a summary, the PGF and the complete AQoE Control loop should have the flexibility to cope with different business requirements and scenarios, and this is something that is reflected on the system requirements. A set of concrete end-to-end scenarios, in addition to the one provided above, will be provided to test the flexibility of the platform when setting up the triggers for the predictions and the recommended plans for the QoE degradation.
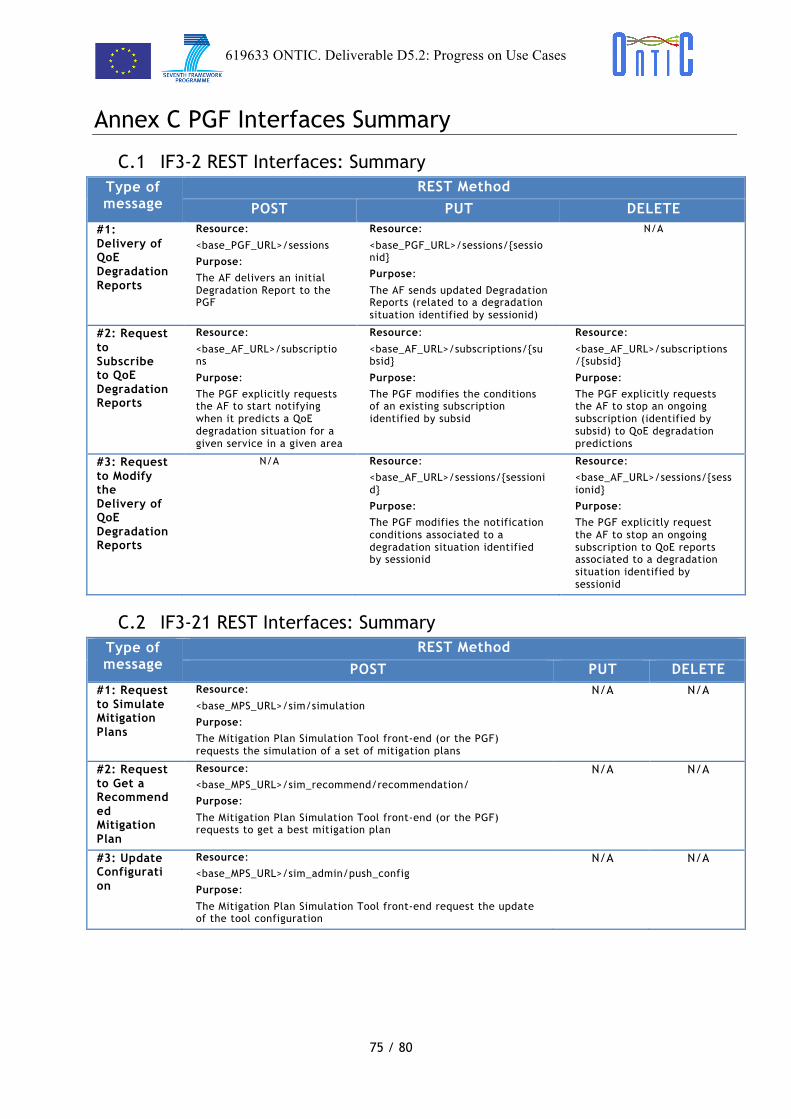
619633 ONTIC. Deliverable D5.2: Progress on Use Cases
75 / 80
! !
Annex C PGF Interfaces Summary
C.1 IF3-2 REST Interfaces: Summary Type of message
REST Method POST PUT DELETE
#1: Delivery of QoE Degradation Reports
Resource:
<base_PGF_URL>/sessions
Purpose:
The AF delivers an initial Degradation Report to the PGF
Resource:
<base_PGF_URL>/sessions/{sessionid}
Purpose:
The AF sends updated Degradation Reports (related to a degradation situation identified by sessionid)
N/A
#2: Request to Subscribe to QoE Degradation Reports
Resource:
<base_AF_URL>/subscriptions
Purpose:
The PGF explicitly requests the AF to start notifying when it predicts a QoE degradation situation for a given service in a given area
Resource:
<base_AF_URL>/subscriptions/{subsid}
Purpose:
The PGF modifies the conditions of an existing subscription identified by subsid
Resource:
<base_AF_URL>/subscriptions/{subsid}
Purpose:
The PGF explicitly requests the AF to stop an ongoing subscription (identified by subsid) to QoE degradation predictions
#3: Request to Modify the Delivery of QoE Degradation Reports
N/A Resource:
<base_AF_URL>/sessions/{sessionid}
Purpose:
The PGF modifies the notification conditions associated to a degradation situation identified by sessionid
Resource:
<base_AF_URL>/sessions/{sessionid}
Purpose:
The PGF explicitly request the AF to stop an ongoing subscription to QoE reports associated to a degradation situation identified by sessionid
C.2 IF3-21 REST Interfaces: Summary Type of message
REST Method POST PUT DELETE
#1: Request to Simulate Mitigation Plans
Resource:
<base_MPS_URL>/sim/simulation
Purpose:
The Mitigation Plan Simulation Tool front-end (or the PGF) requests the simulation of a set of mitigation plans
N/A N/A
#2: Request to Get a Recommended Mitigation Plan
Resource:
<base_MPS_URL>/sim_recommend/recommendation/
Purpose:
The Mitigation Plan Simulation Tool front-end (or the PGF) requests to get a best mitigation plan
N/A N/A
#3: Update Configuration
Resource:
<base_MPS_URL>/sim_admin/push_config
Purpose:
The Mitigation Plan Simulation Tool front-end request the update of the tool configuration
N/A N/A
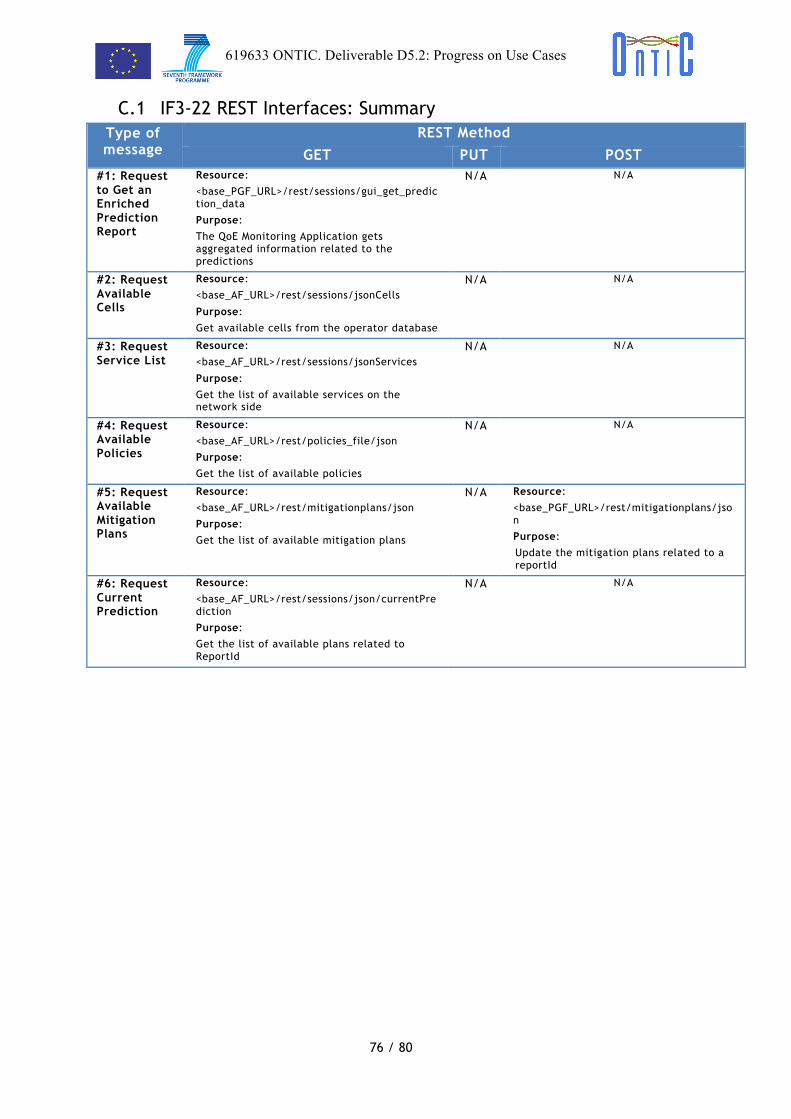
619633 ONTIC. Deliverable D5.2: Progress on Use Cases
76 / 80
! !C.1 IF3-22 REST Interfaces: Summary
Type of message
REST Method GET PUT POST
#1: Request to Get an Enriched Prediction Report
Resource:
<base_PGF_URL>/rest/sessions/gui_get_prediction_data
Purpose:
The QoE Monitoring Application gets aggregated information related to the predictions
N/A N/A
#2: Request Available Cells
Resource:
<base_AF_URL>/rest/sessions/jsonCells
Purpose:
Get available cells from the operator database
N/A N/A
#3: Request Service List
Resource:
<base_AF_URL>/rest/sessions/jsonServices
Purpose:
Get the list of available services on the network side
N/A N/A
#4: Request Available Policies
Resource:
<base_AF_URL>/rest/policies_file/json
Purpose:
Get the list of available policies
N/A N/A
#5: Request Available Mitigation Plans
Resource:
<base_AF_URL>/rest/mitigationplans/json
Purpose:
Get the list of available mitigation plans
N/A Resource:
<base_PGF_URL>/rest/mitigationplans/json
Purpose:
Update the mitigation plans related to a reportId
#6: Request Current Prediction
Resource:
<base_AF_URL>/rest/sessions/json/currentPrediction
Purpose:
Get the list of available plans related to ReportId
N/A N/A
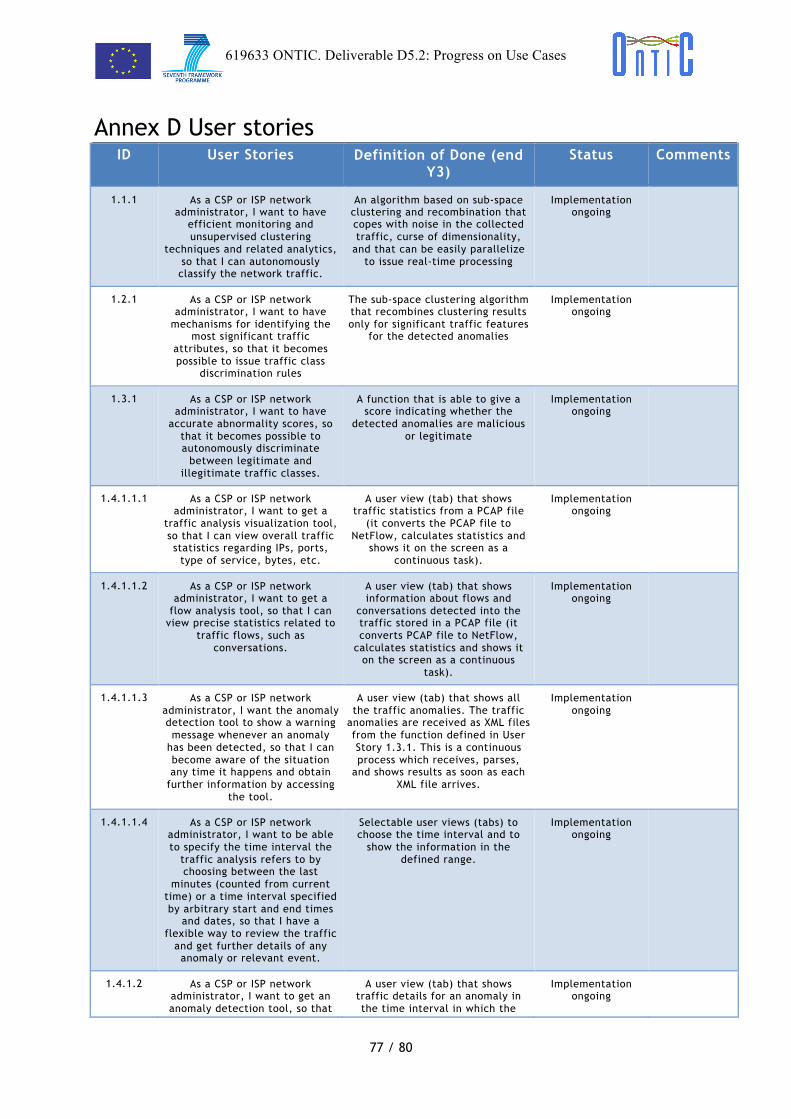
619633 ONTIC. Deliverable D5.2: Progress on Use Cases
77 / 80
! !
Annex D User stories ID User Stories Definition of Done (end
Y3) Status Comments
1.1.1 As a CSP or ISP network administrator, I want to have
efficient monitoring and unsupervised clustering
techniques and related analytics, so that I can autonomously classify the network traffic.
An algorithm based on sub-space clustering and recombination that copes with noise in the collected traffic, curse of dimensionality,
and that can be easily parallelize to issue real-time processing
Implementation ongoing
1.2.1 As a CSP or ISP network administrator, I want to have
mechanisms for identifying the most significant traffic
attributes, so that it becomes possible to issue traffic class
discrimination rules
The sub-space clustering algorithm that recombines clustering results only for significant traffic features
for the detected anomalies
Implementation ongoing
1.3.1 As a CSP or ISP network administrator, I want to have
accurate abnormality scores, so that it becomes possible to autonomously discriminate
between legitimate and illegitimate traffic classes.
A function that is able to give a score indicating whether the
detected anomalies are malicious or legitimate
Implementation ongoing
1.4.1.1.1 As a CSP or ISP network administrator, I want to get a
traffic analysis visualization tool, so that I can view overall traffic statistics regarding IPs, ports,
type of service, bytes, etc.
A user view (tab) that shows traffic statistics from a PCAP file
(it converts the PCAP file to NetFlow, calculates statistics and
shows it on the screen as a continuous task).
Implementation ongoing
1.4.1.1.2 As a CSP or ISP network administrator, I want to get a
flow analysis tool, so that I can view precise statistics related to
traffic flows, such as conversations.
A user view (tab) that shows information about flows and
conversations detected into the traffic stored in a PCAP file (it converts PCAP file to NetFlow,
calculates statistics and shows it on the screen as a continuous
task).
Implementation ongoing
1.4.1.1.3 As a CSP or ISP network administrator, I want the anomaly detection tool to show a warning message whenever an anomaly
has been detected, so that I can become aware of the situation any time it happens and obtain
further information by accessing the tool.
A user view (tab) that shows all the traffic anomalies. The traffic
anomalies are received as XML files from the function defined in User Story 1.3.1. This is a continuous process which receives, parses,
and shows results as soon as each XML file arrives.
Implementation ongoing
1.4.1.1.4 As a CSP or ISP network administrator, I want to be able to specify the time interval the
traffic analysis refers to by choosing between the last
minutes (counted from current time) or a time interval specified by arbitrary start and end times
and dates, so that I have a flexible way to review the traffic
and get further details of any anomaly or relevant event.
Selectable user views (tabs) to choose the time interval and to
show the information in the defined range.
Implementation ongoing
1.4.1.2 As a CSP or ISP network administrator, I want to get an anomaly detection tool, so that
A user view (tab) that shows traffic details for an anomaly in the time interval in which the
Implementation ongoing
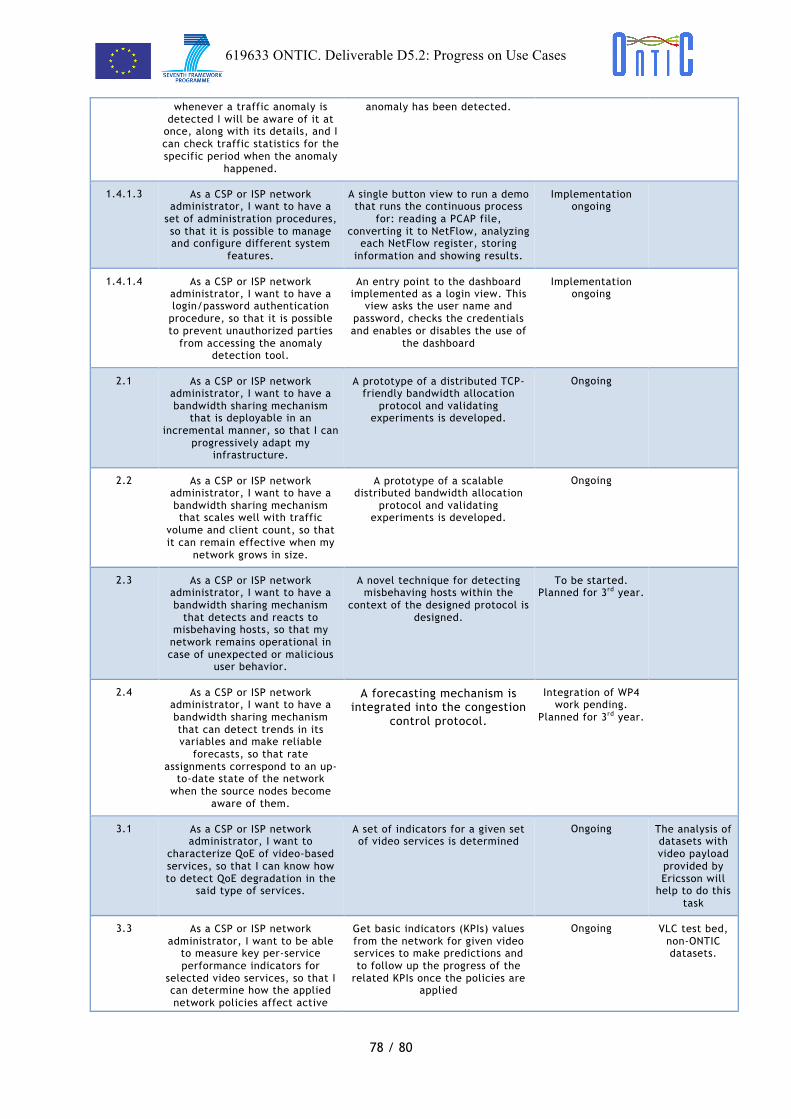
619633 ONTIC. Deliverable D5.2: Progress on Use Cases
78 / 80
! !whenever a traffic anomaly is
detected I will be aware of it at once, along with its details, and I can check traffic statistics for the specific period when the anomaly
happened.
anomaly has been detected.
1.4.1.3 As a CSP or ISP network administrator, I want to have a
set of administration procedures, so that it is possible to manage and configure different system
features.
A single button view to run a demo that runs the continuous process
for: reading a PCAP file, converting it to NetFlow, analyzing
each NetFlow register, storing information and showing results.
Implementation ongoing
1.4.1.4 As a CSP or ISP network administrator, I want to have a login/password authentication
procedure, so that it is possible to prevent unauthorized parties
from accessing the anomaly detection tool.
An entry point to the dashboard implemented as a login view. This
view asks the user name and password, checks the credentials and enables or disables the use of
the dashboard
Implementation ongoing
2.1 As a CSP or ISP network administrator, I want to have a bandwidth sharing mechanism
that is deployable in an incremental manner, so that I can
progressively adapt my infrastructure.
A prototype of a distributed TCP-friendly bandwidth allocation
protocol and validating experiments is developed.
Ongoing
2.2 As a CSP or ISP network administrator, I want to have a bandwidth sharing mechanism that scales well with traffic
volume and client count, so that it can remain effective when my
network grows in size.
A prototype of a scalable distributed bandwidth allocation
protocol and validating experiments is developed.
Ongoing
2.3 As a CSP or ISP network administrator, I want to have a bandwidth sharing mechanism
that detects and reacts to misbehaving hosts, so that my network remains operational in case of unexpected or malicious
user behavior.
A novel technique for detecting misbehaving hosts within the
context of the designed protocol is designed.
To be started. Planned for 3rd year.
2.4 As a CSP or ISP network administrator, I want to have a bandwidth sharing mechanism that can detect trends in its variables and make reliable
forecasts, so that rate assignments correspond to an up-
to-date state of the network when the source nodes become
aware of them.
A forecasting mechanism is integrated into the congestion
control protocol.
Integration of WP4 work pending.
Planned for 3rd year.
3.1 As a CSP or ISP network administrator, I want to
characterize QoE of video-based services, so that I can know how to detect QoE degradation in the
said type of services.
A set of indicators for a given set of video services is determined
Ongoing The analysis of datasets with video payload provided by Ericsson will
help to do this task
3.3 As a CSP or ISP network administrator, I want to be able
to measure key per-service performance indicators for
selected video services, so that I can determine how the applied network policies affect active
Get basic indicators (KPIs) values from the network for given video services to make predictions and to follow up the progress of the
related KPIs once the policies are applied
Ongoing VLC test bed, non-ONTIC datasets.
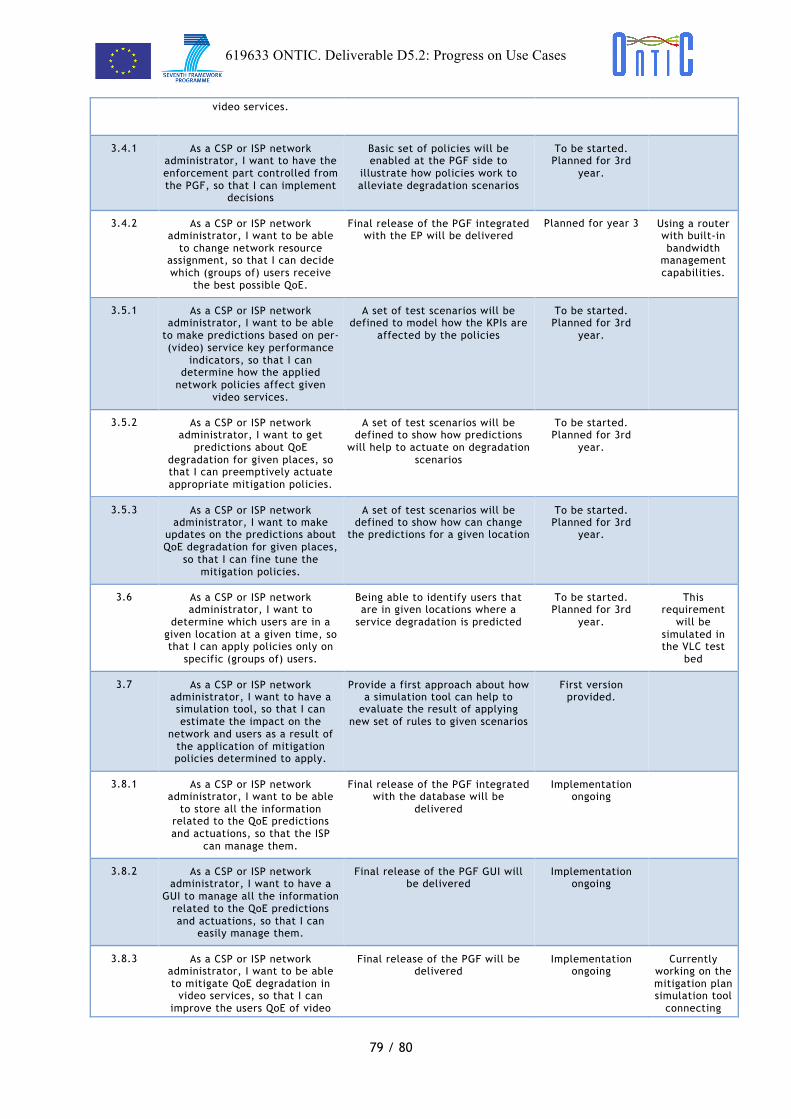
619633 ONTIC. Deliverable D5.2: Progress on Use Cases
79 / 80
! !video services.
3.4.1 As a CSP or ISP network administrator, I want to have the enforcement part controlled from the PGF, so that I can implement
decisions
Basic set of policies will be enabled at the PGF side to
illustrate how policies work to alleviate degradation scenarios
To be started. Planned for 3rd
year.
3.4.2 As a CSP or ISP network administrator, I want to be able
to change network resource assignment, so that I can decide which (groups of) users receive
the best possible QoE.
Final release of the PGF integrated with the EP will be delivered
Planned for year 3 Using a router with built-in bandwidth
management capabilities.
3.5.1 As a CSP or ISP network administrator, I want to be able
to make predictions based on per-(video) service key performance
indicators, so that I can determine how the applied
network policies affect given video services.
A set of test scenarios will be defined to model how the KPIs are
affected by the policies
To be started. Planned for 3rd
year.
3.5.2 As a CSP or ISP network administrator, I want to get
predictions about QoE degradation for given places, so that I can preemptively actuate appropriate mitigation policies.
A set of test scenarios will be defined to show how predictions
will help to actuate on degradation scenarios
To be started. Planned for 3rd
year.
3.5.3 As a CSP or ISP network administrator, I want to make
updates on the predictions about QoE degradation for given places,
so that I can fine tune the mitigation policies.
A set of test scenarios will be defined to show how can change
the predictions for a given location
To be started. Planned for 3rd
year.
3.6 As a CSP or ISP network administrator, I want to
determine which users are in a given location at a given time, so that I can apply policies only on
specific (groups of) users.
Being able to identify users that are in given locations where a
service degradation is predicted
To be started. Planned for 3rd
year.
This requirement
will be simulated in the VLC test
bed
3.7 As a CSP or ISP network administrator, I want to have a simulation tool, so that I can estimate the impact on the
network and users as a result of the application of mitigation policies determined to apply.
Provide a first approach about how a simulation tool can help to
evaluate the result of applying new set of rules to given scenarios
First version provided.
3.8.1 As a CSP or ISP network administrator, I want to be able
to store all the information related to the QoE predictions and actuations, so that the ISP
can manage them.
Final release of the PGF integrated with the database will be
delivered
Implementation ongoing
3.8.2 As a CSP or ISP network administrator, I want to have a
GUI to manage all the information related to the QoE predictions and actuations, so that I can
easily manage them.
Final release of the PGF GUI will be delivered
Implementation ongoing
3.8.3 As a CSP or ISP network administrator, I want to be able to mitigate QoE degradation in
video services, so that I can improve the users QoE of video
Final release of the PGF will be delivered
Implementation ongoing
Currently working on the mitigation plan simulation tool
connecting

619633 ONTIC. Deliverable D5.2: Progress on Use Cases
80 / 80
! !services. them with the
simulation one.
3.8.4 As a CSP or ISP network administrator, I want PGF to have
a connection with both the simulation tool and the plan recommender, so that I can estimate the impact on the
network and the users as a result of the application of mitigation policies determined to apply.
Final release of the PGF integrating both functionalities
Done for the simulation tool and
ongoing for the recommender
Table 6: ONTIC user stories