communication networks: traffic data, network topologies, and...
TRANSCRIPT
Communication Networks: Traffic Data, Network Topologies, and Routing
Anomalies
Ljiljana Trajković [email protected]
Communication Networks Laboratory
http://www.ensc.sfu.ca/cnl School of Engineering Science
Simon Fraser University, Vancouver, British Columbia Canada
Roadmap
n Introduction n Traffic collection, characterization, and modeling n Case study: Collection of BCNET traffic n Internet topology and spectral analysis of Internet
graphs n Machine learning models for feature selection and
classification of traffic anomalies n Conclusions
SPIN 2015, Amity University, Noida, India February 19, 2015 2
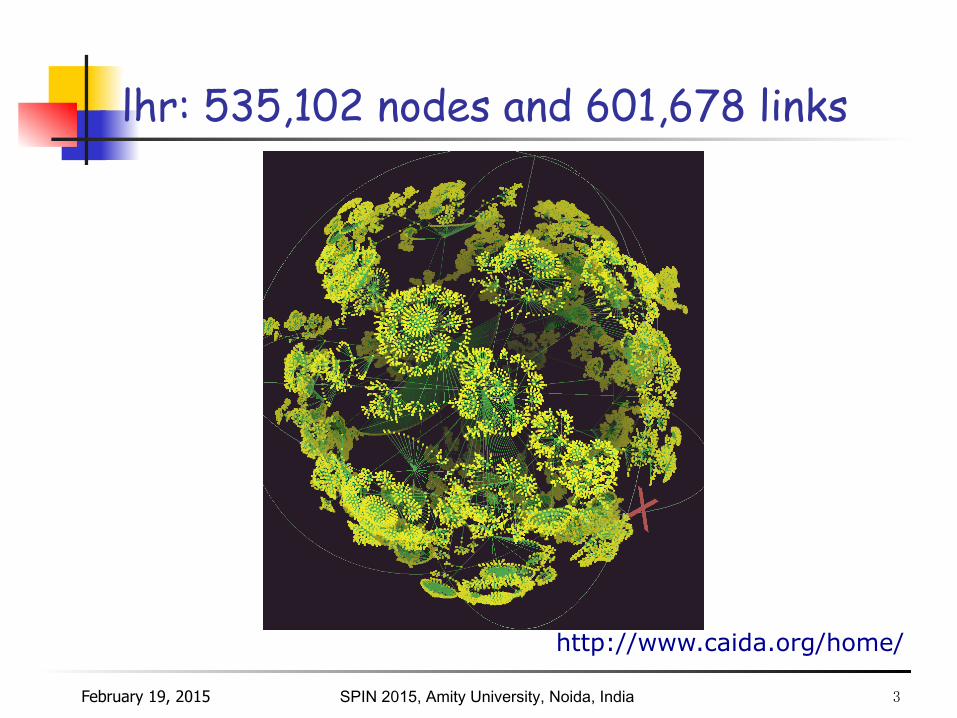
lhr: 535,102 nodes and 601,678 links
SPIN 2015, Amity University, Noida, India
http://www.caida.org/home/
February 19, 2015 3
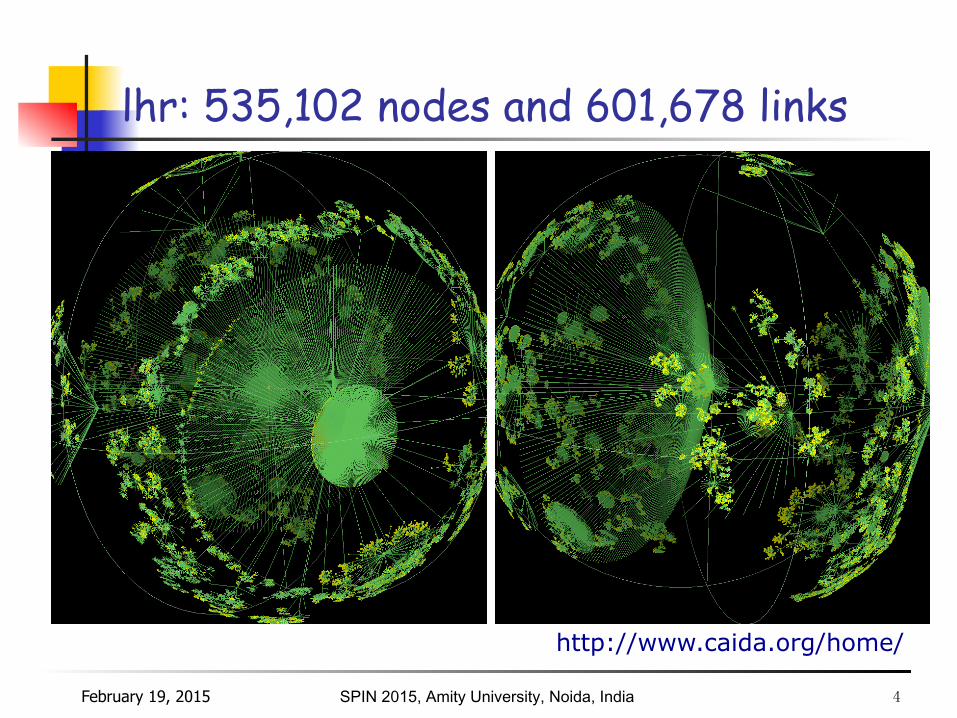
lhr: 535,102 nodes and 601,678 links
SPIN 2015, Amity University, Noida, India
http://www.caida.org/home/
February 19, 2015 4
Roadmap
n Introduction n Traffic collection, characterization, and modeling n Case study: Collection of BCNET traffic n Internet topology and spectral analysis of Internet
graphs n Machine learning models for feature selection and
classification of traffic anomalies n Conclusions
SPIN 2015, Amity University, Noida, India February 19, 2015 5
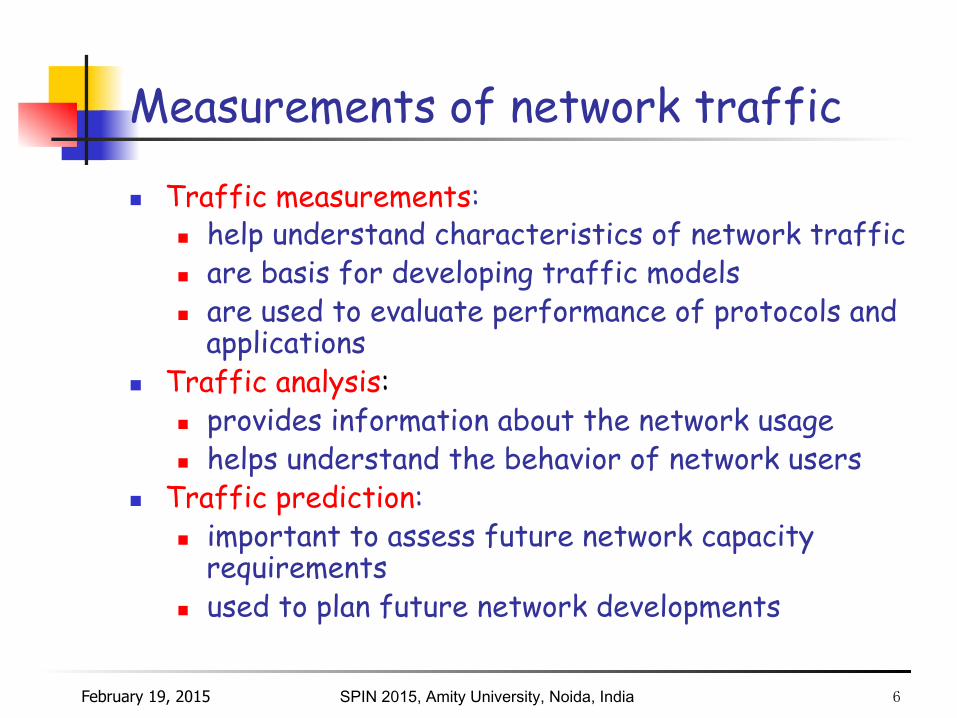
n Traffic measurements: n help understand characteristics of network traffic n are basis for developing traffic models n are used to evaluate performance of protocols and
applications n Traffic analysis:
n provides information about the network usage n helps understand the behavior of network users
n Traffic prediction: n important to assess future network capacity
requirements n used to plan future network developments
Measurements of network traffic
SPIN 2015, Amity University, Noida, India February 19, 2015 6
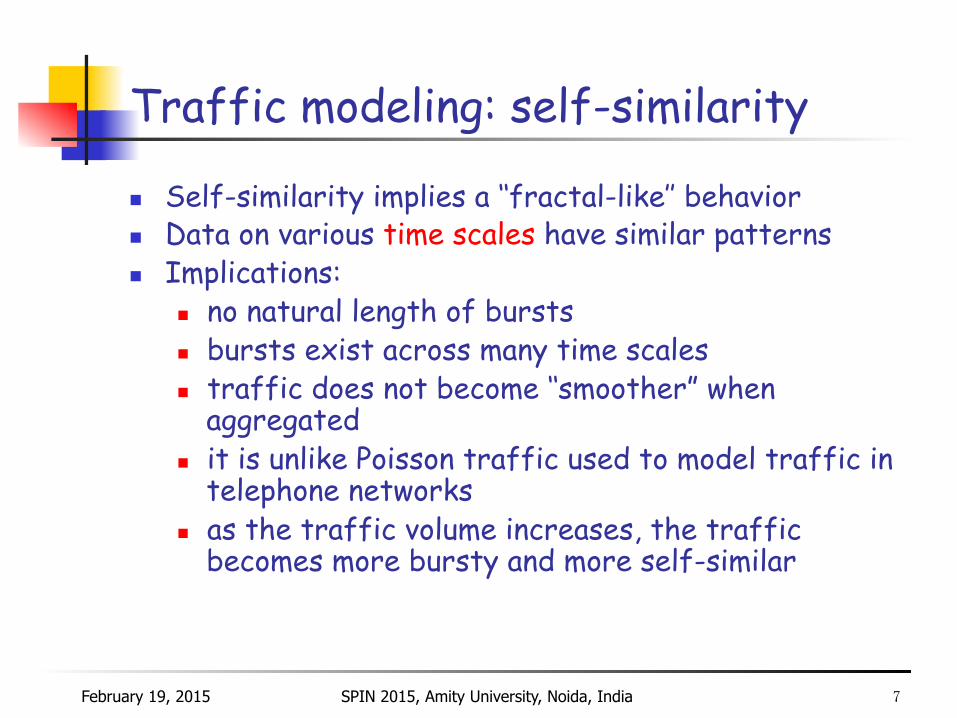
Traffic modeling: self-similarity
n Self-similarity implies a ‘‘fractal-like’’ behavior n Data on various time scales have similar patterns n Implications:
n no natural length of bursts n bursts exist across many time scales n traffic does not become ‘‘smoother” when
aggregated n it is unlike Poisson traffic used to model traffic in
telephone networks n as the traffic volume increases, the traffic
becomes more bursty and more self-similar
SPIN 2015, Amity University, Noida, India February 19, 2015 7
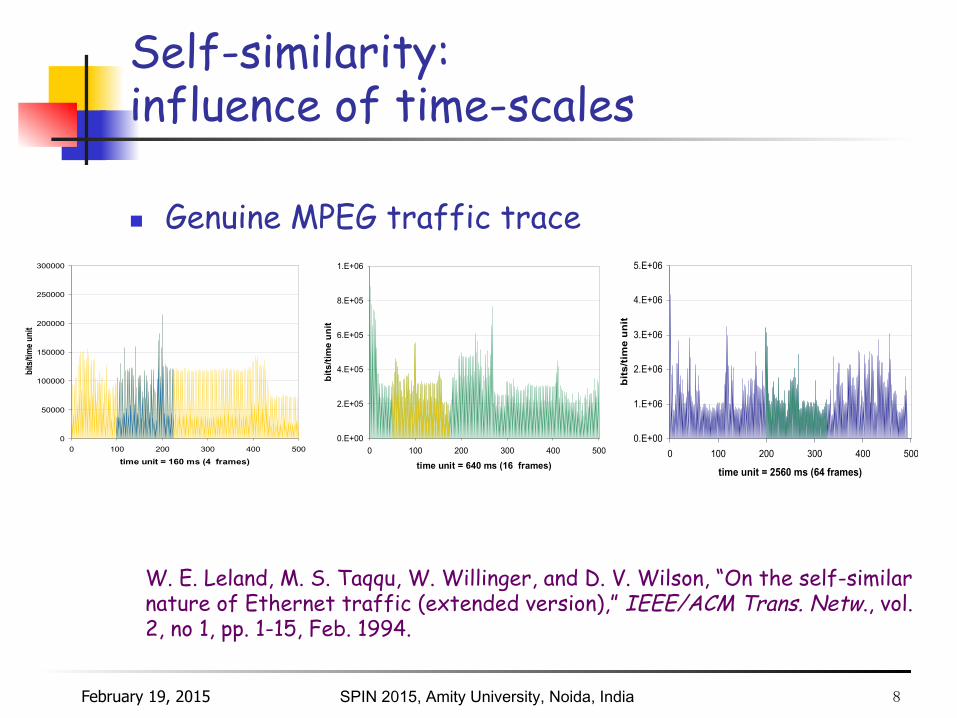
Self-similarity: influence of time-scales
n Genuine MPEG traffic trace
0
50000
100000
150000
200000
250000
300000
0 100 200 300 400 500
time unit = 160 ms (4 frames)
bits
/tim
e uni
t
0.E+00
2.E+05
4.E+05
6.E+05
8.E+05
1.E+06
0 100 200 300 400 500
time unit = 640 ms (16 frames)
bits
/tim
e un
it
0.E+00
1.E+06
2.E+06
3.E+06
4.E+06
5.E+06
0 100 200 300 400 500
time unit = 2560 ms (64 frames)
bits
/tim
e un
it
SPIN 2015, Amity University, Noida, India
W. E. Leland, M. S. Taqqu, W. Willinger, and D. V. Wilson, “On the self-similar nature of Ethernet traffic (extended version),” IEEE/ACM Trans. Netw., vol. 2, no 1, pp. 1-15, Feb. 1994.
February 19, 2015 8
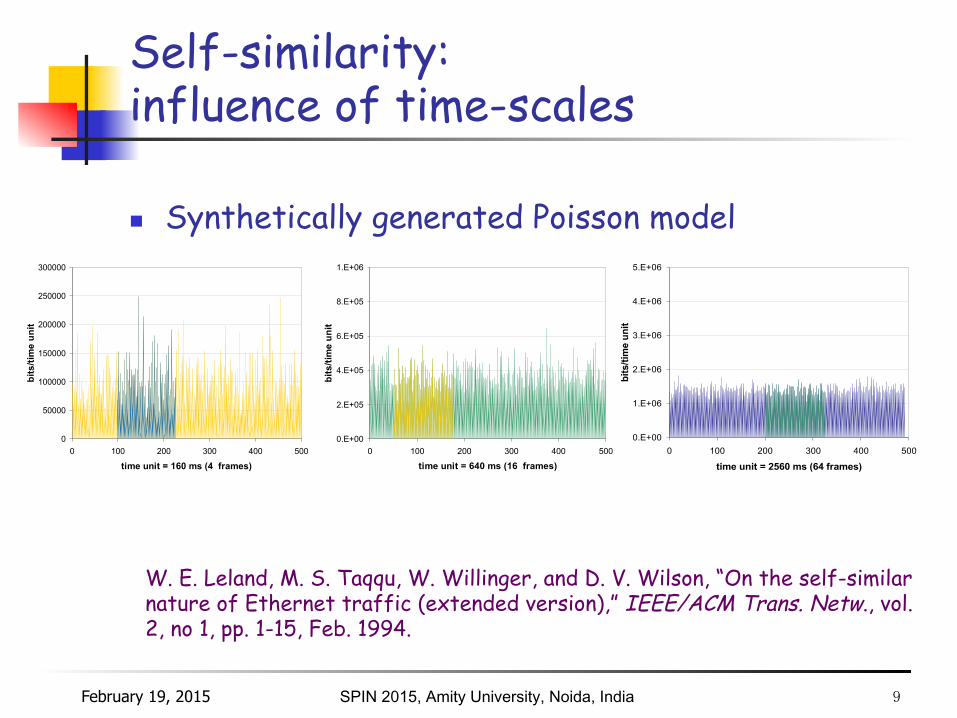
Self-similarity: influence of time-scales
n Synthetically generated Poisson model
0
50000
100000
150000
200000
250000
300000
0 100 200 300 400 500
time unit = 160 ms (4 frames)
bits
/tim
e un
it
0.E+00
2.E+05
4.E+05
6.E+05
8.E+05
1.E+06
0 100 200 300 400 500
time unit = 640 ms (16 frames)
bits
/tim
e un
it
0.E+00
1.E+06
2.E+06
3.E+06
4.E+06
5.E+06
0 100 200 300 400 500
time unit = 2560 ms (64 frames)
bits
/tim
e un
it
SPIN 2015, Amity University, Noida, India
W. E. Leland, M. S. Taqqu, W. Willinger, and D. V. Wilson, “On the self-similar nature of Ethernet traffic (extended version),” IEEE/ACM Trans. Netw., vol. 2, no 1, pp. 1-15, Feb. 1994.
February 19, 2015 9
Roadmap
n Introduction n Traffic collection, characterization, and modeling n Case study: Collection of BCNET traffic n Internet topology and spectral analysis of Internet
graphs n Machine learning models for feature selection and
classification of traffic anomalies n Conclusions
SPIN 2015, Amity University, Noida, India February 19, 2015 10
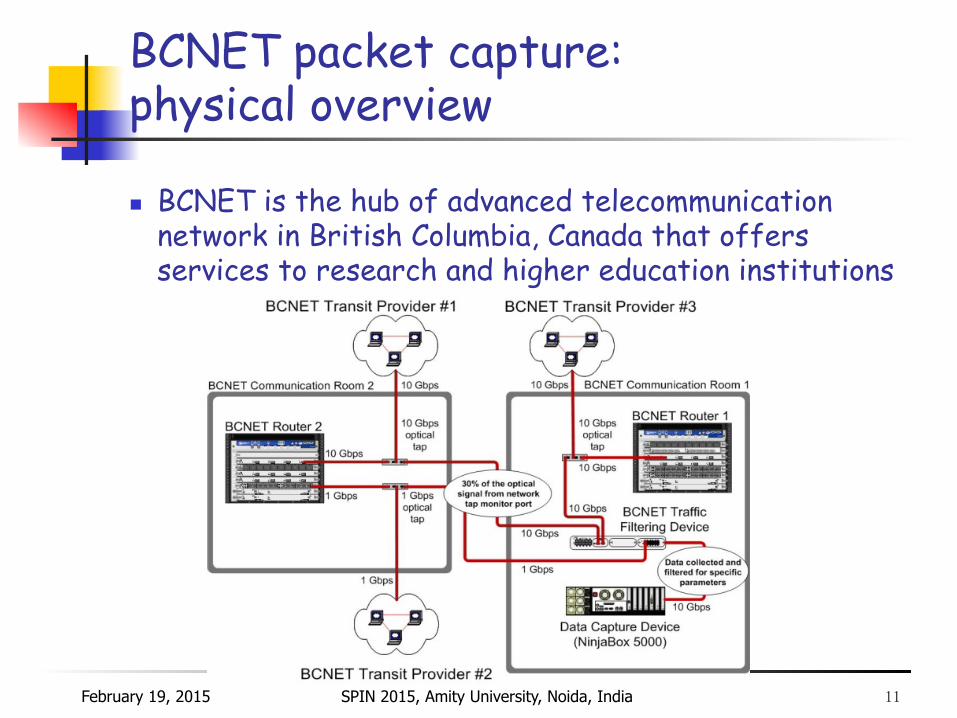
BCNET packet capture: physical overview
n BCNET is the hub of advanced telecommunication network in British Columbia, Canada that offers services to research and higher education institutions
SPIN 2015, Amity University, Noida, India February 19, 2015 11
BCNET packet capture
n BCNET transits have two service providers with 10 Gbps network links and one service provider with 1 Gbps network link
n Optical Test Access Point (TAP) splits the signal into two distinct paths
n The signal splitting ratio from TAP may be modified n The Data Capture Device (NinjaBox 5000) collects the
real-time data (packets) from the traffic filtering device
SPIN 2015, Amity University, Noida, India February 19, 2015 12
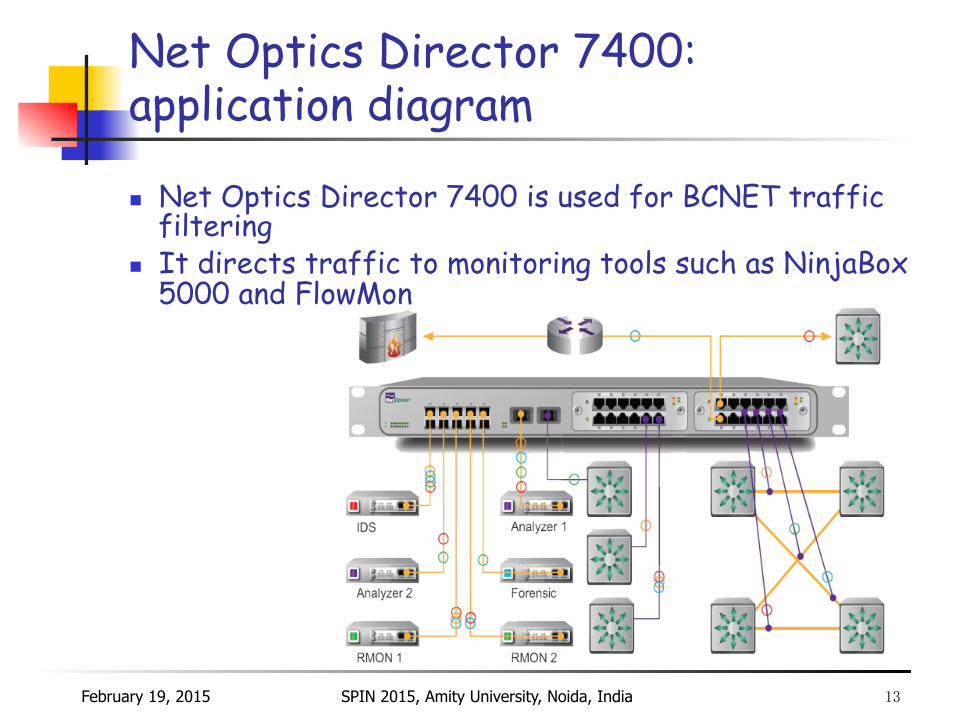
Net Optics Director 7400: application diagram
n Net Optics Director 7400 is used for BCNET traffic filtering
n It directs traffic to monitoring tools such as NinjaBox 5000 and FlowMon
SPIN 2015, Amity University, Noida, India February 19, 2015 13
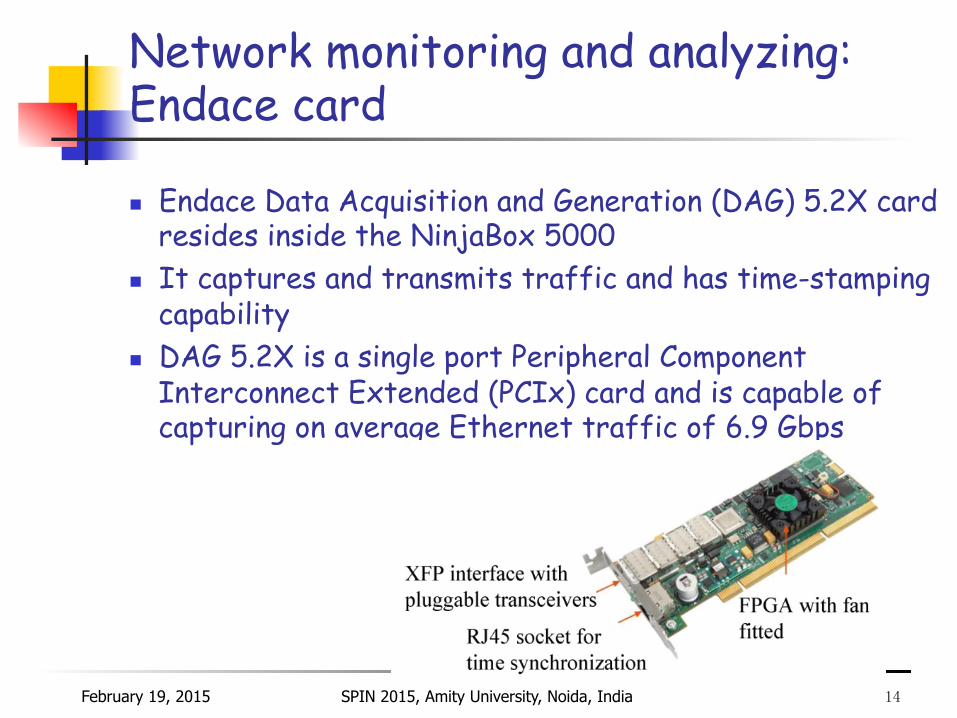
Network monitoring and analyzing: Endace card
n Endace Data Acquisition and Generation (DAG) 5.2X card resides inside the NinjaBox 5000
n It captures and transmits traffic and has time-stamping capability
n DAG 5.2X is a single port Peripheral Component Interconnect Extended (PCIx) card and is capable of capturing on average Ethernet traffic of 6.9 Gbps
SPIN 2015, Amity University, Noida, India February 19, 2015 14
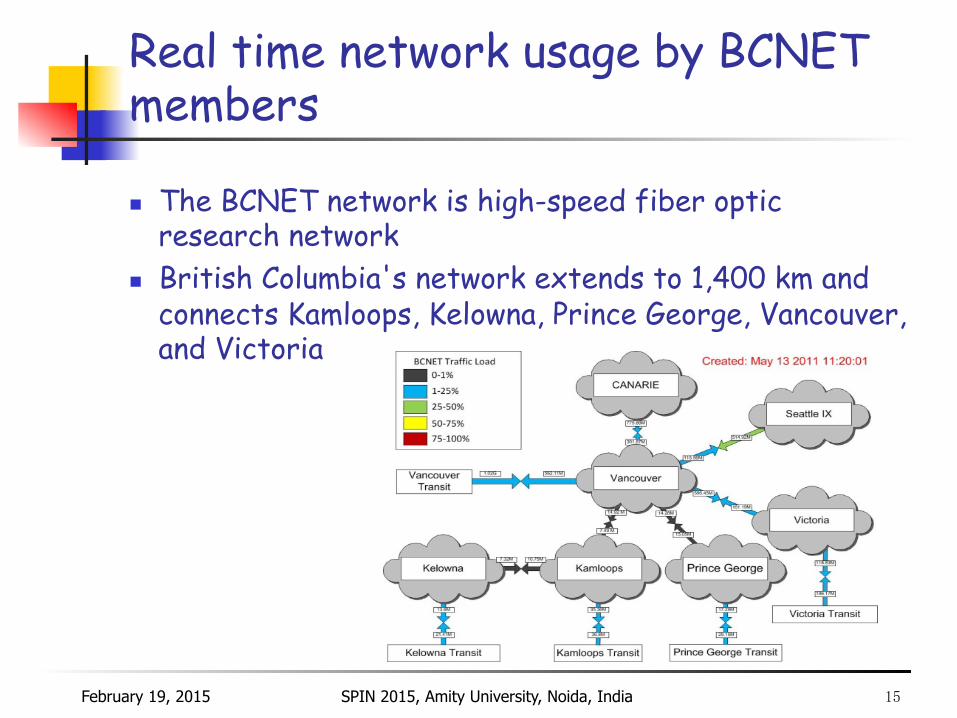
Real time network usage by BCNET members
n The BCNET network is high-speed fiber optic research network
n British Columbia's network extends to 1,400 km and connects Kamloops, Kelowna, Prince George, Vancouver, and Victoria
SPIN 2015, Amity University, Noida, India February 19, 2015 15
Roadmap
n Introduction n Traffic collection, characterization, and modeling n Case study: Collection of BCNET traffic n Internet topology and spectral analysis of Internet
graphs n Machine learning models for feature selection and
classification of traffic anomalies n Conclusions
SPIN 2015, Amity University, Noida, India February 19, 2015 16
Internet topology
n Internet is a network of Autonomous Systems: n groups of networks sharing the same routing policy n identified with Autonomous System Numbers
(ASN) n Autonomous System Numbers: http://www.iana.org/
assignments/as-numbers n Internet topology on AS-level:
n the arrangement of ASes and their interconnections
n Analyzing the Internet topology and finding properties of associated graphs rely on mining data and capturing information about Autonomous Systems (ASes)
SPIN 2015, Amity University, Noida, India February 19, 2015 17
Variety of graphs
n Random graphs: n nodes and edges are generated by a random process n Erdős and Rényi model
n Small world graphs: n nodes and edges are generated so that most of the
nodes are connected by a small number of nodes in between
n Watts and Strogatz model (1998)
SPIN 2015, Amity University, Noida, India February 19, 2015 18
19
Scale-free graphs
n Scale-free graphs: n graphs whose node degree distribution follow
power-law n rich get richer n Barabási and Albert model (1999)
n Analysis of complex networks: n discovery of spectral properties of graphs n constructing matrices describing the network
connectivity
SPIN 2015, Amity University, Noida, India February 19, 2015 19
20
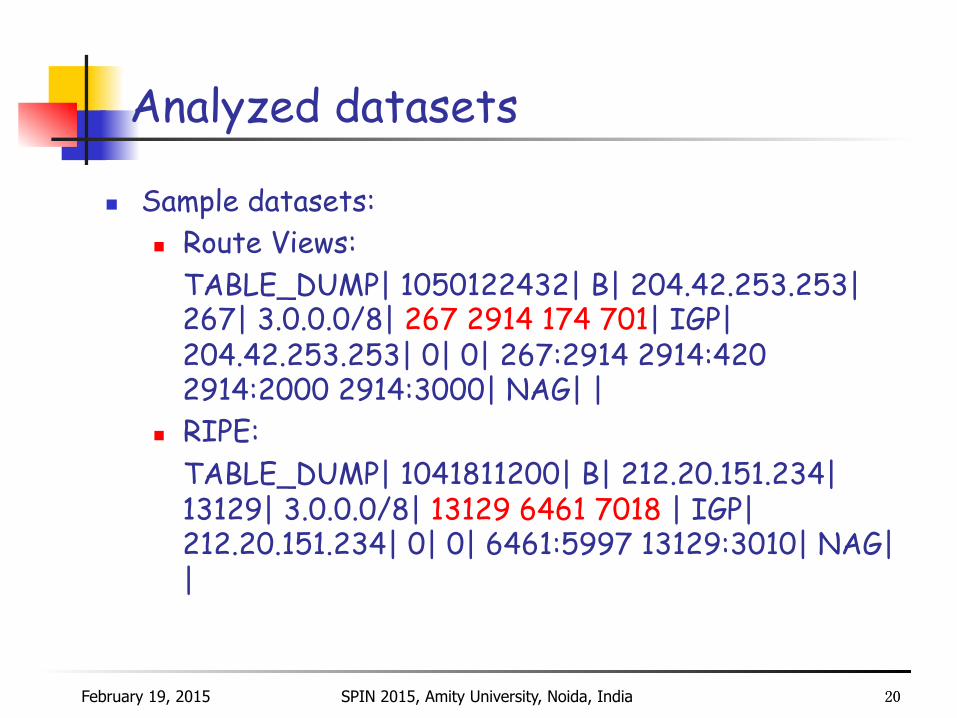
Analyzed datasets
n Sample datasets: n Route Views:
TABLE_DUMP| 1050122432| B| 204.42.253.253| 267| 3.0.0.0/8| 267 2914 174 701| IGP| 204.42.253.253| 0| 0| 267:2914 2914:420 2914:2000 2914:3000| NAG| |
n RIPE: TABLE_DUMP| 1041811200| B| 212.20.151.234| 13129| 3.0.0.0/8| 13129 6461 7018 | IGP| 212.20.151.234| 0| 0| 6461:5997 13129:3010| NAG| |
SPIN 2015, Amity University, Noida, India February 19, 2015 20
21
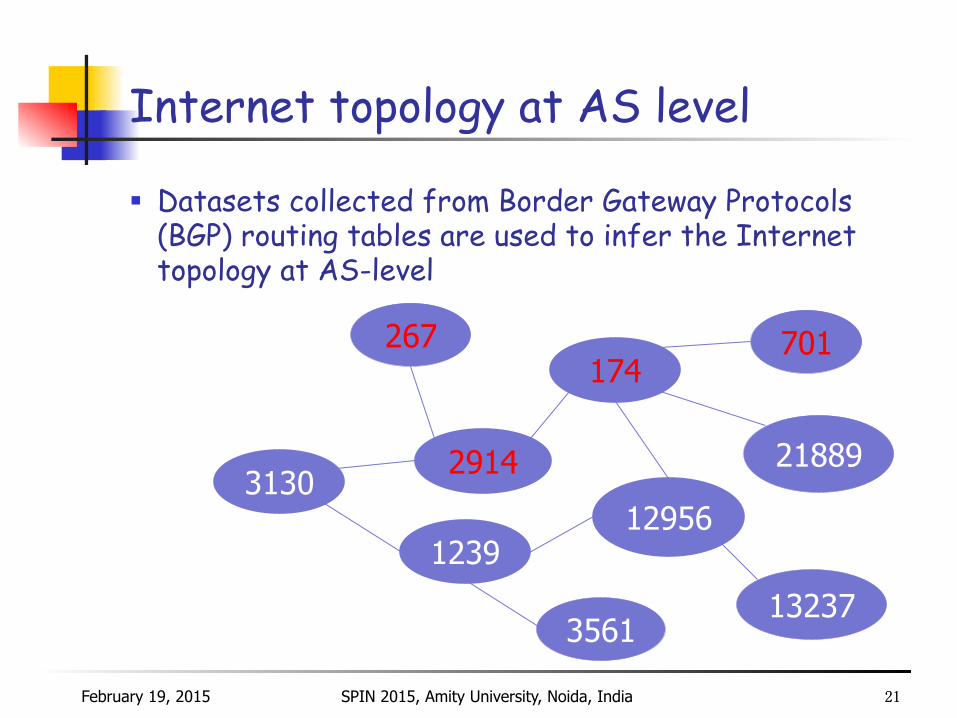
Internet topology at AS level
267 174
1239 12956
2914 21889
3561
701
13237
3130
§ Datasets collected from Border Gateway Protocols (BGP) routing tables are used to infer the Internet topology at AS-level
SPIN 2015, Amity University, Noida, India February 19, 2015 21
Internet topology
n The Internet topology is characterized by the presence of various power-laws: n node degree vs. node rank n eigenvalues of the matrices describing Internet
graphs (adjacency matrix and normalized Laplacian matrix)
n Power-laws exponents have not significantly changed over the years
n Spectral analysis reveals new historical trends and notable changes in the connectivity and clustering of AS nodes over the years
SPIN 2015, Amity University, Noida, India February 19, 2015 22
Roadmap
n Introduction n Traffic collection, characterization, and modeling n Case study: Collection of BCNET traffic n Internet topology and spectral analysis of Internet
graphs n Machine learning models for feature selection and
classification of traffic anomalies n Conclusions
SPIN 2015, Amity University, Noida, India February 19, 2015 23
Traffic anomalies
n Slammer, Nimda, and Code Red I anomalies affected performance of the Internet Border Gateway Protocol (BGP)
n BGP anomalies also include: Internet Protocol (IP) prefix hijacks, miss-configurations, and electrical failures
n Techniques for detecting BGP anomalies have recently gained visible attention and importance
SPIN 2015, Amity University, Noida, India February 19, 2015 24

Anomaly detection techniques
n Classification problem: n assigning an “anomaly” or “regular” label to a data
point n Accuracy of a classifier depends on:
n extracted features n combination of selected features n underlying model
Goal: n Detect Internet routing anomalies using the Border
Gateway Protocol (BGP) update messages
SPIN 2015, Amity University, Noida, India February 19, 2015 25
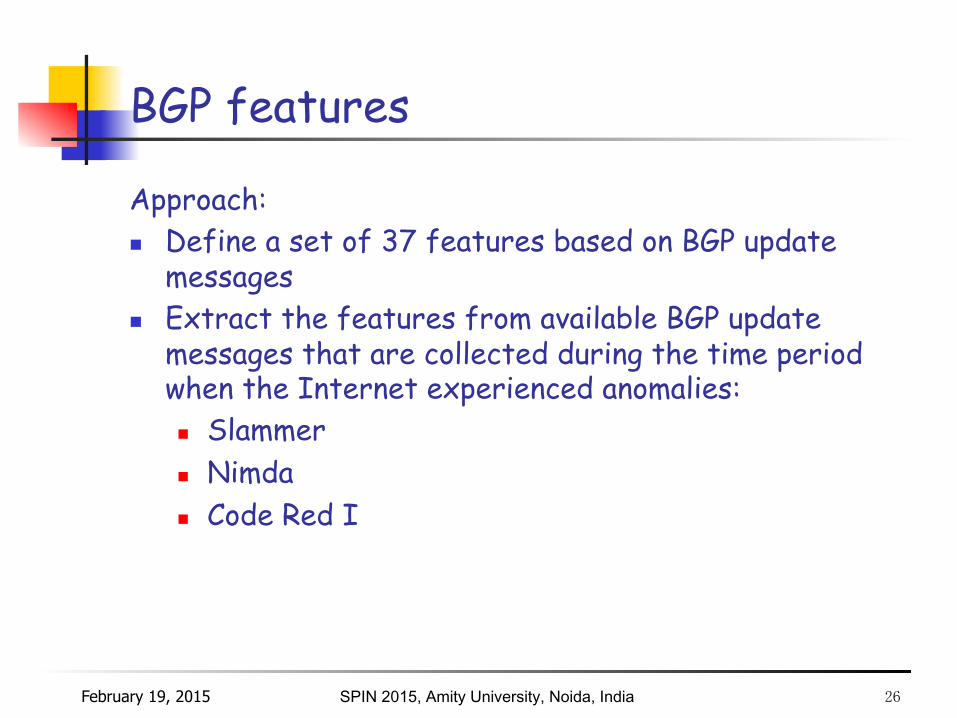
BGP features
Approach: n Define a set of 37 features based on BGP update
messages n Extract the features from available BGP update
messages that are collected during the time period when the Internet experienced anomalies: n Slammer n Nimda n Code Red I
SPIN 2015, Amity University, Noida, India February 19, 2015 26
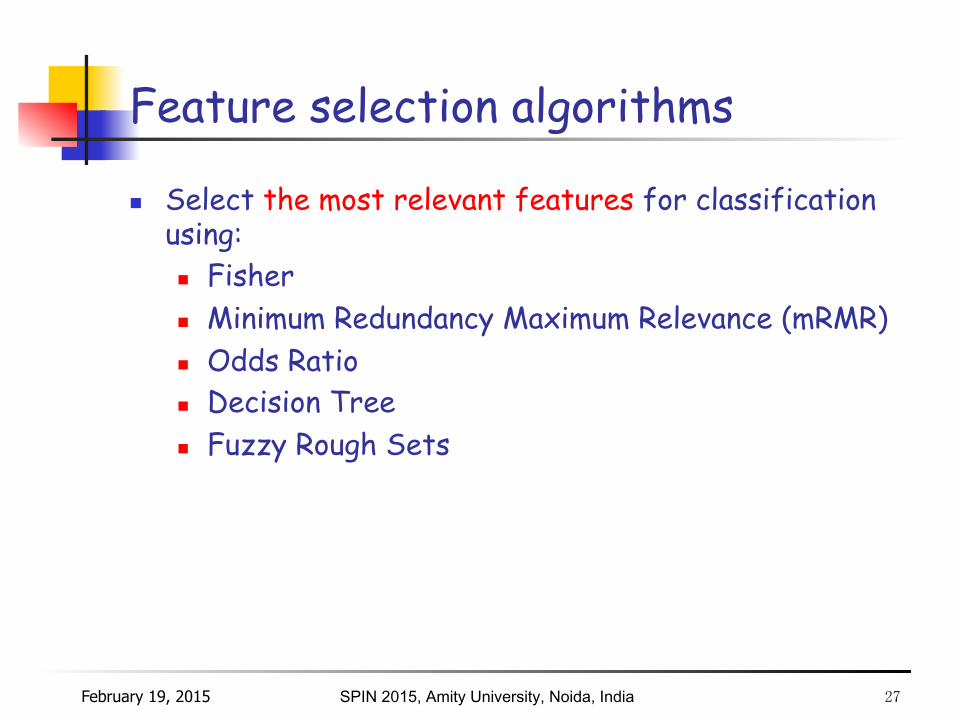
Feature selection algorithms
n Select the most relevant features for classification using: n Fisher n Minimum Redundancy Maximum Relevance (mRMR) n Odds Ratio n Decision Tree n Fuzzy Rough Sets
SPIN 2015, Amity University, Noida, India February 19, 2015 27
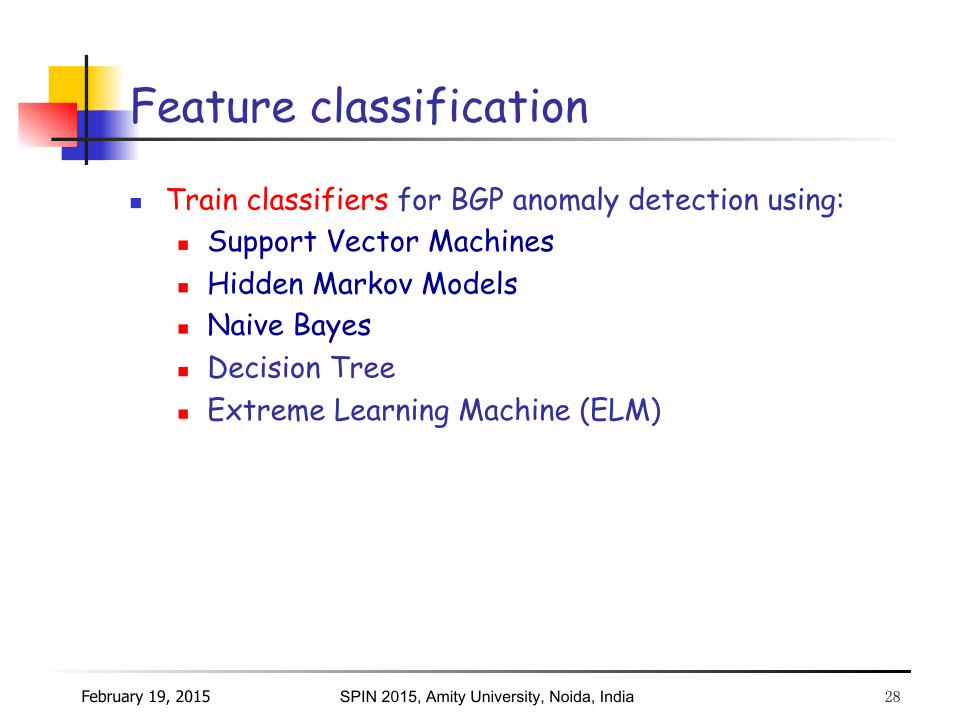
Feature classification
n Train classifiers for BGP anomaly detection using: n Support Vector Machines n Hidden Markov Models n Naive Bayes n Decision Tree n Extreme Learning Machine (ELM)
SPIN 2015, Amity University, Noida, India February 19, 2015 28
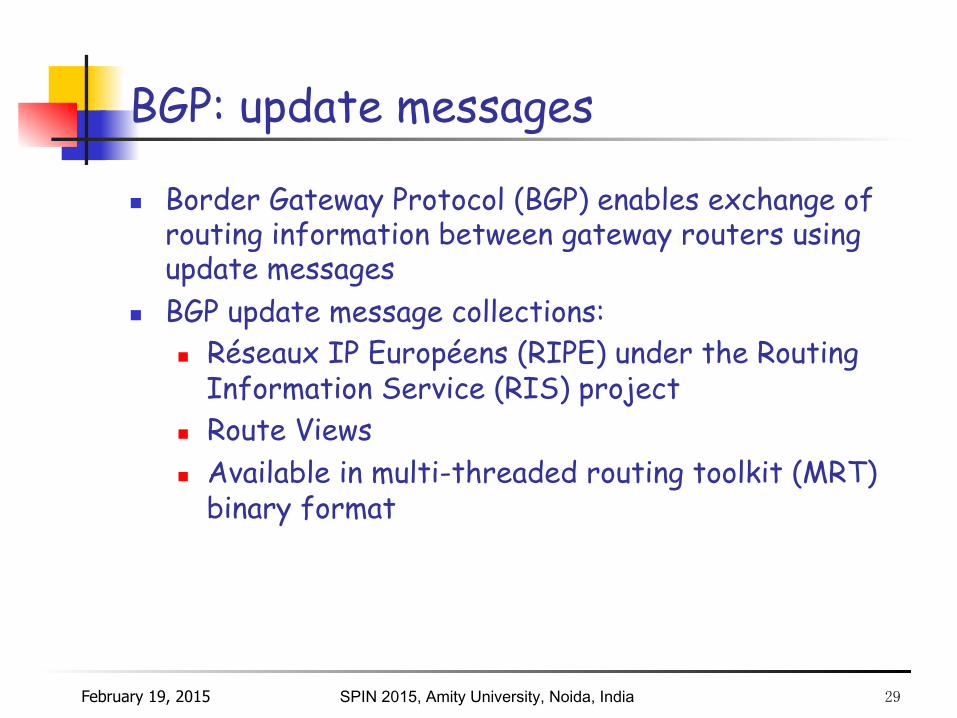
BGP: update messages
n Border Gateway Protocol (BGP) enables exchange of routing information between gateway routers using update messages
n BGP update message collections: n Réseaux IP Européens (RIPE) under the Routing
Information Service (RIS) project n Route Views n Available in multi-threaded routing toolkit (MRT)
binary format
SPIN 2015, Amity University, Noida, India February 19, 2015 29
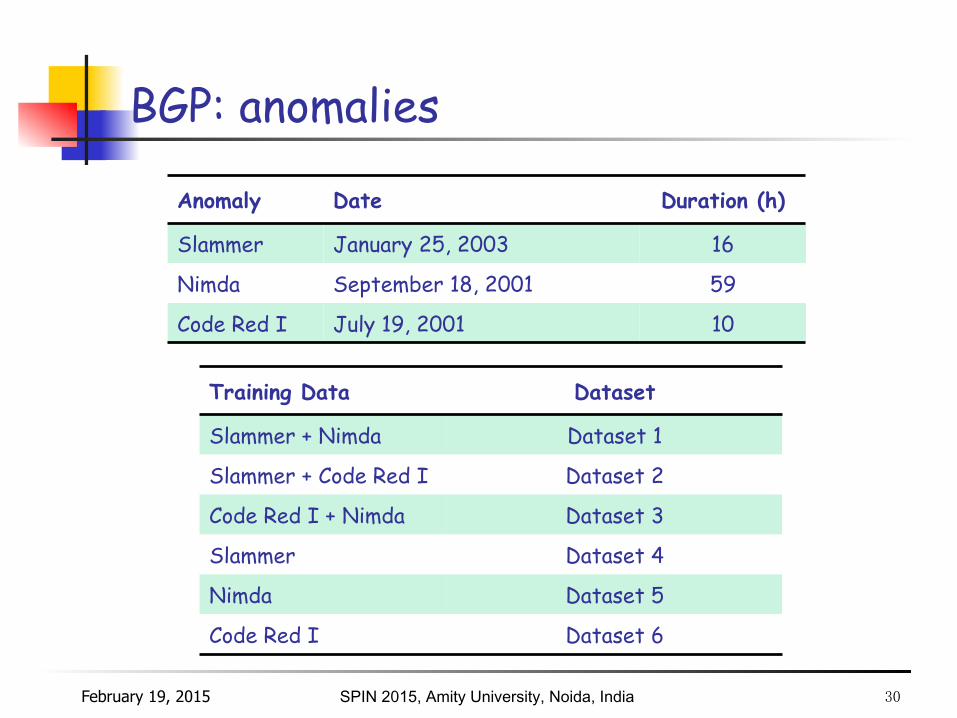
BGP: anomalies
SPIN 2015, Amity University, Noida, India
Anomaly Date Duration (h)
Slammer January 25, 2003 16
Nimda September 18, 2001 59
Code Red I July 19, 2001 10
Training Data Dataset
Slammer + Nimda Dataset 1
Slammer + Code Red I Dataset 2
Code Red I + Nimda Dataset 3
Slammer Dataset 4
Nimda Dataset 5
Code Red I Dataset 6
February 19, 2015 30
BGP: features
n Define 37 features n Sample every minute during a five-day period:
n the peak day of an anomaly n two days prior and two days after the peak day
n 7,200 samples for each anomalous event: n 5,760 regular samples (non-anomalous) n 1,440 anomalous samples n Imbalanced dataset
SPIN 2015, Amity University, Noida, India February 19, 2015 31
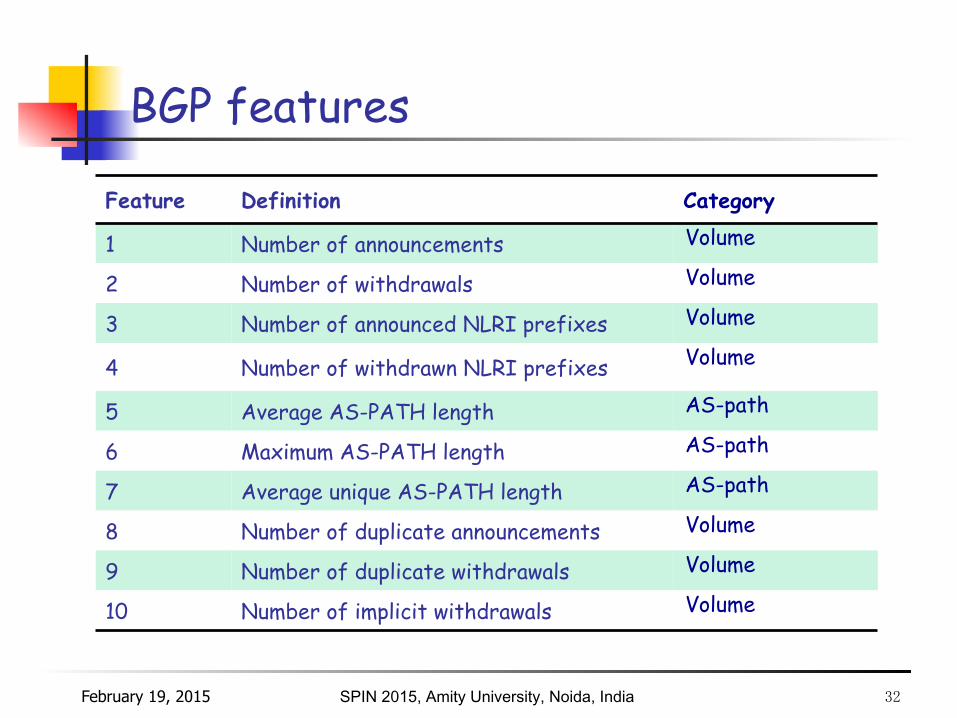
BGP features
SPIN 2015, Amity University, Noida, India
Feature Definition Category
1 Number of announcements Volume
2 Number of withdrawals Volume
3 Number of announced NLRI prefixes Volume
4 Number of withdrawn NLRI prefixes Volume
5 Average AS-PATH length AS-path
6 Maximum AS-PATH length AS-path
7 Average unique AS-PATH length AS-path
8 Number of duplicate announcements Volume
9 Number of duplicate withdrawals Volume
10 Number of implicit withdrawals Volume
February 19, 2015 32
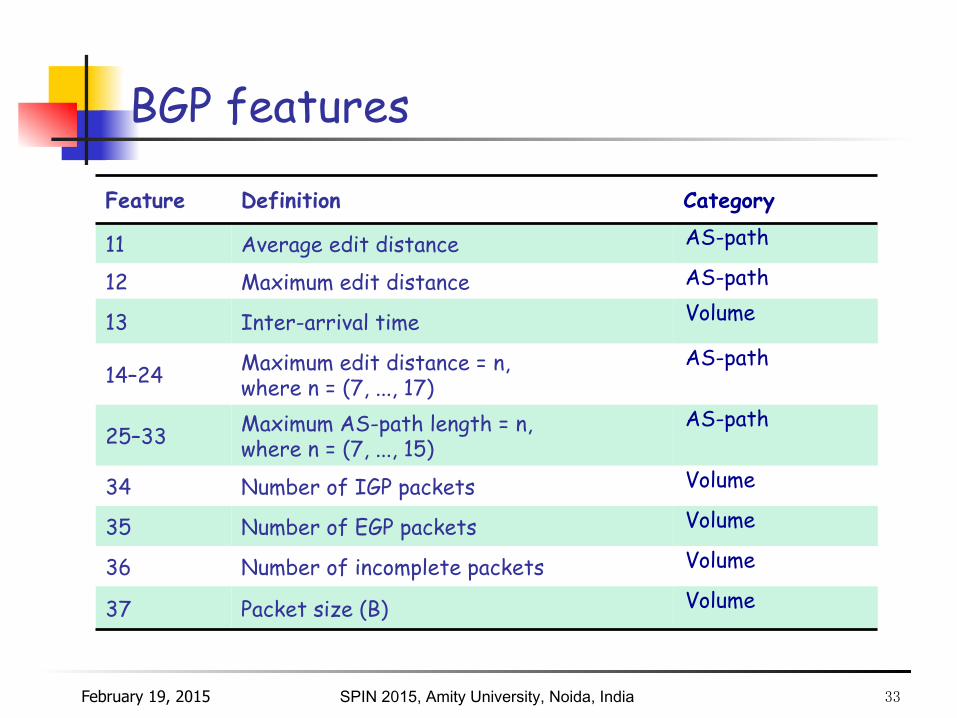
BGP features
SPIN 2015, Amity University, Noida, India
Feature Definition Category
11 Average edit distance AS-path
12 Maximum edit distance AS-path
13 Inter-arrival time Volume
14–24 Maximum edit distance = n, where n = (7, ..., 17)
AS-path
25–33 Maximum AS-path length = n, where n = (7, ..., 15)
AS-path
34 Number of IGP packets Volume
35 Number of EGP packets Volume
36 Number of incomplete packets Volume
37 Packet size (B) Volume
February 19, 2015 33
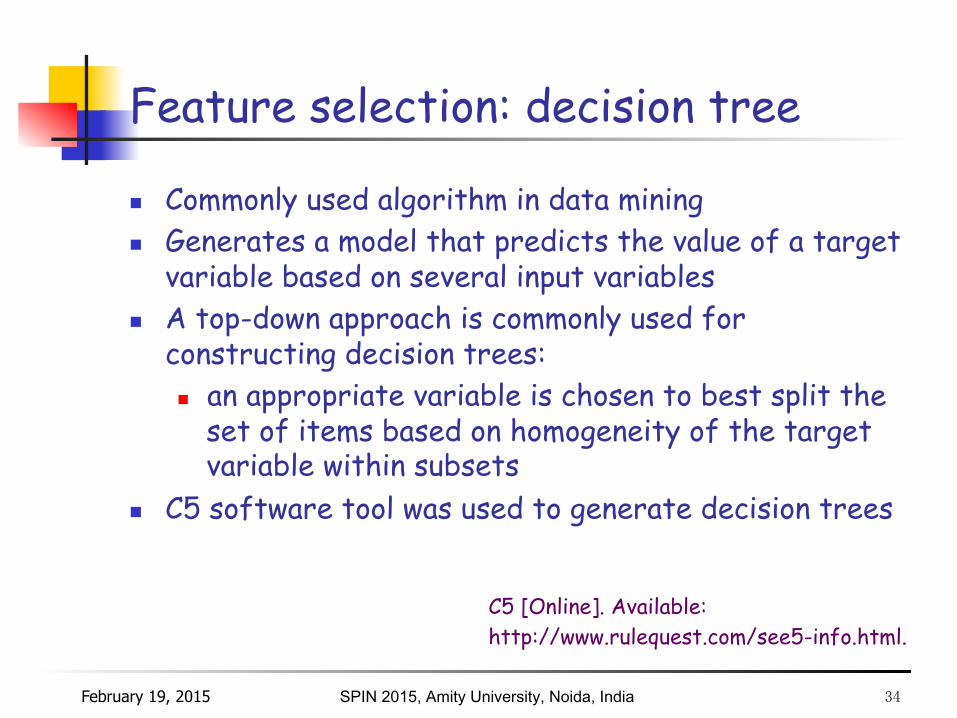
Feature selection: decision tree
n Commonly used algorithm in data mining n Generates a model that predicts the value of a target
variable based on several input variables n A top-down approach is commonly used for
constructing decision trees: n an appropriate variable is chosen to best split the
set of items based on homogeneity of the target variable within subsets
n C5 software tool was used to generate decision trees
SPIN 2015, Amity University, Noida, India
C5 [Online]. Available: http://www.rulequest.com/see5-info.html.
February 19, 2015 34
Feature selection: decision tree
SPIN 2015, Amity University, Noida, India
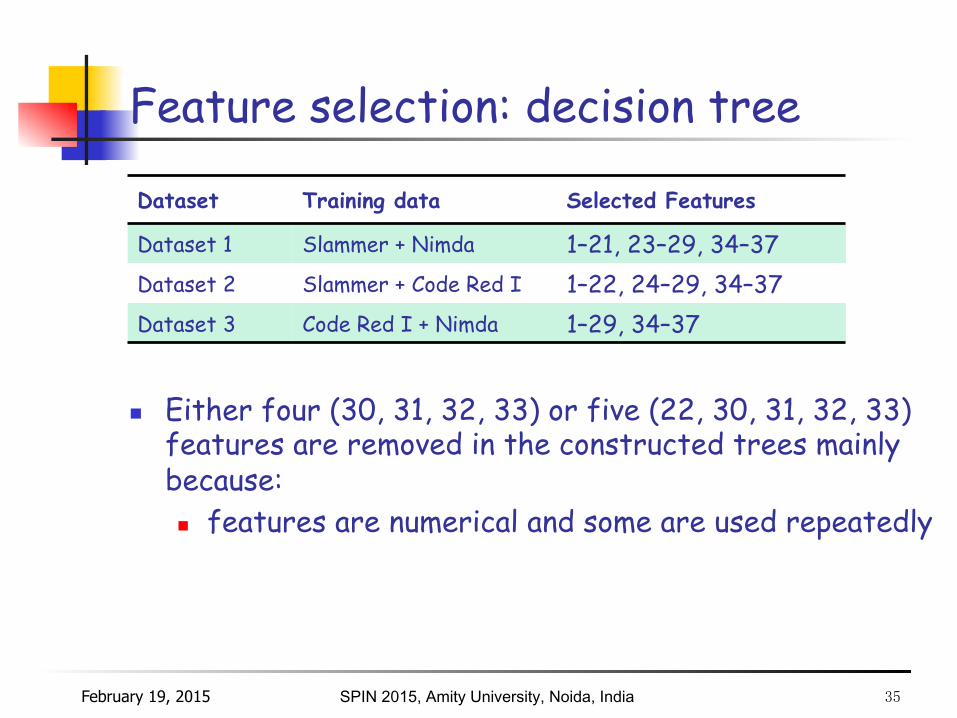
Dataset Training data Selected Features
Dataset 1 Slammer + Nimda 1–21, 23–29, 34–37
Dataset 2 Slammer + Code Red I 1–22, 24–29, 34–37
Dataset 3 Code Red I + Nimda 1–29, 34–37
n Either four (30, 31, 32, 33) or five (22, 30, 31, 32, 33)
features are removed in the constructed trees mainly because: n features are numerical and some are used repeatedly
February 19, 2015 35

Feature selection: fuzzy rough sets
n Deal with the approximation of fuzzy sets in a fuzzy approximation space defined by a fuzzy similarity relation or by a fuzzy partition
n The fuzzy similarity relation Sim(C) is: n an nxn matrix that describes similarities between
any two samples n computed by the min operator
n Computational complexity: O(n2m) n n is the number of samples n m is the number of features
SPIN 2015, Amity University, Noida, India February 19, 2015 36
Feature selection: fuzzy rough sets
SPIN 2015, Amity University, Noida, India
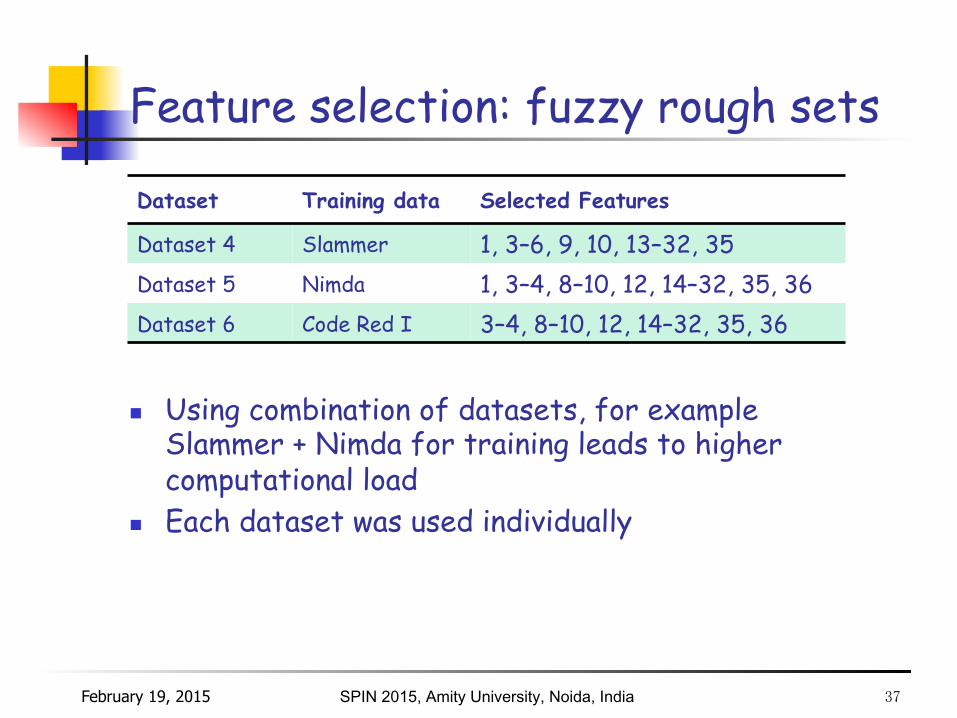
n Using combination of datasets, for example Slammer + Nimda for training leads to higher computational load
n Each dataset was used individually
Dataset Training data Selected Features
Dataset 4 Slammer 1, 3–6, 9, 10, 13–32, 35
Dataset 5 Nimda 1, 3–4, 8–10, 12, 14–32, 35, 36
Dataset 6 Code Red I 3–4, 8–10, 12, 14–32, 35, 36
February 19, 2015 37
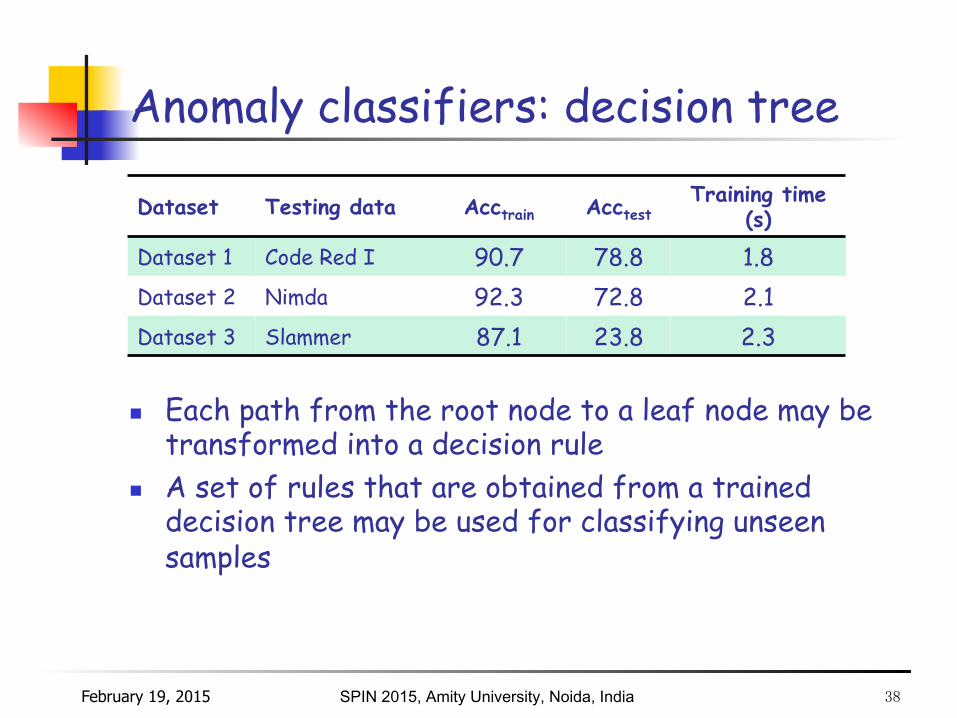
Anomaly classifiers: decision tree
n Each path from the root node to a leaf node may be transformed into a decision rule
n A set of rules that are obtained from a trained decision tree may be used for classifying unseen samples
SPIN 2015, Amity University, Noida, India
Dataset Testing data Acctrain Acctest Training time
(s)
Dataset 1 Code Red I 90.7 78.8 1.8
Dataset 2 Nimda 92.3 72.8 2.1 Dataset 3 Slammer 87.1 23.8 2.3
February 19, 2015 38
Anomaly classifier: ELM
n Used for learning with a single hidden layer feed forward neural network
n Weights connecting the input and hidden layers with the bias terms are initialized randomly
n Weights connecting the hidden and output layers are analytically determined
n Learns faster than SVMs by a factor of thousands n Suitable for online applications n We use all features (37), all continuous features (17),
features selected by fuzzy rough sets (28 or 27), and continuous features selected by fuzzy rough sets (9 or 8)
SPIN 2015, Amity University, Noida, India February 19, 2015 39

Anomaly classifiers: ELM
SPIN 2015, Amity University, Noida, India
No. of features Dataset Acctrain Acctest
Training time (s)
37
Dataset 1 83.57 ± 0.11 80.01 ± 0.07 2.3043
Dataset 2 83.53 ± 0.12 79.75 ± 0.08 2.2756
Dataset 3 80.82 ± 0.09 21.65 ± 1.93 2.2747
17
Dataset 1 84.50 ± 0.07 79.91 ± 0.01 1.9268
Dataset 2 84.43 ± 0.12 79.53 ± 0.10 1.5928
Dataset 3 83.06 ± 0.07 51.56 ± 16.38 1.8882
n 195 hidden units n The binary features 14–33 are removed to form a set
of 17 features
February 19, 2015 40
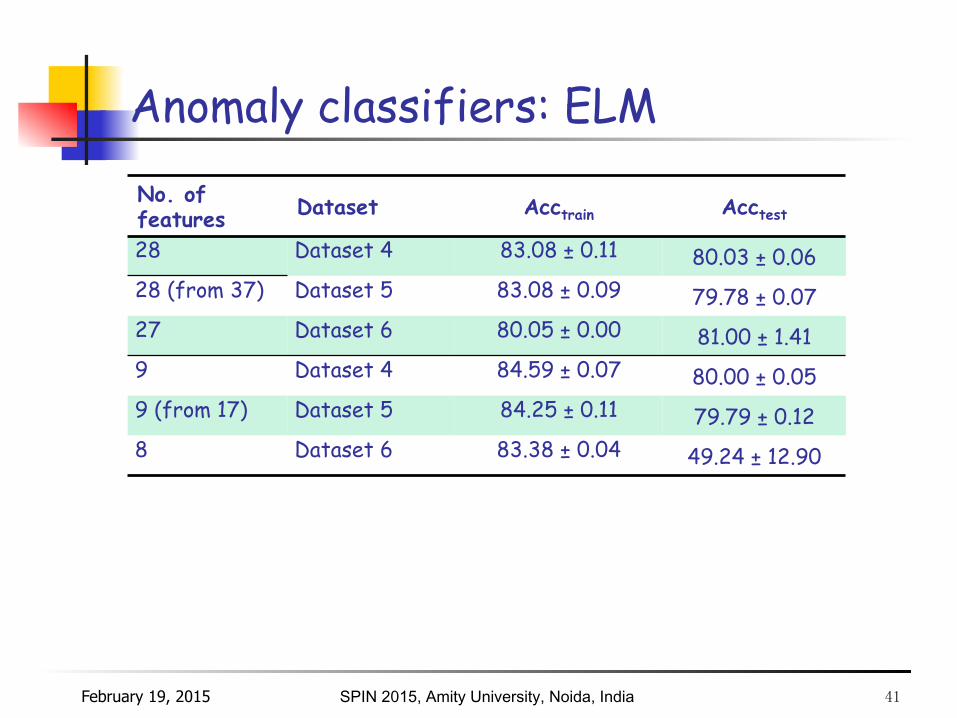
Anomaly classifiers: ELM
SPIN 2015, Amity University, Noida, India
No. of features Dataset Acctrain Acctest
28 Dataset 4 83.08 ± 0.11 80.03 ± 0.06 28 (from 37) Dataset 5 83.08 ± 0.09 79.78 ± 0.07 27 Dataset 6 80.05 ± 0.00 81.00 ± 1.41 9 Dataset 4 84.59 ± 0.07 80.00 ± 0.05 9 (from 17) Dataset 5 84.25 ± 0.11 79.79 ± 0.12 8 Dataset 6 83.38 ± 0.04 49.24 ± 12.90
February 19, 2015 41
Roadmap
n Introduction n Traffic collection, characterization, and modeling n Case study: Collection of BCNET traffic n Internet topology and spectral analysis of Internet
graphs n Machine learning models for feature selection and
classification of traffic anomalies n Conclusions
SPIN 2015, Amity University, Noida, India February 19, 2015 42

Conclusions
n Data collected from deployed networks are used to: n evaluate network performance n characterize and model traffic (inter-arrival and
call holding times) n identify trends in the evolution of the Internet
topology n classify traffic and network anomalies
SPIN 2015, Amity University, Noida, India February 19, 2015 43
Conclusions
n Machine learning algorithms (feature selection and classification algorithms) are used for detecting BGP anomalies
n Performance of classifiers greatly depended on the employed datasets
n Feature selection algorithms were used to improve the performance of classifiers
n For smaller datasets, performance of the ELM classifier was improved by using fuzzy rough sets
n Both decision tree and ELM are relatively fast classifiers with satisfactory accuracy
SPIN 2015, Amity University, Noida, India February 19, 2015 44
References: sources of data
n RIPE RIS raw data [Online]. Available: http://www.ripe.net/data-tools/.
n University of Oregon Route Views project [Online]. Available: http:// www.routeviews.org/.
n CAIDA: Center for Applied Internet Data Analysis: {Online}. Available: http://www.caida.org/home/.
SPIN 2015, Amity University, Noida, India February 19, 2015 45
References: http://www.sfu.ca/~ljilja/cnl n Y. Li, H. J. Xing, Q. Hua, X.-Z. Wang, P. Batta, S. Haeri, and Lj. Trajković,
“Classification of BGP anomalies using decision trees and fuzzy rough sets,” in Proc. IEEE International Conference on Systems, Man, and Cybernetics, SMC 2014, San Diego, CA, October 2014, pp. 1331-1336.
n N. Al-Rousan, S. Haeri, and Lj. Trajković, “Feature selection for classification of BGP anomalies using Bayesian models," in Proc. ICMLC 2012, Xi'an, China, July 2012, pp. 140-147.
n N. Al-Rousan and Lj. Trajković, “Machine learning models for classification of BGP anomalies,” in Proc. IEEE Conf. High Performance Switching and Routing, HPSR 2012, Belgrade, Serbia, June 2012, pp. 103-108.
n T. Farah, S. Lally, R. Gill, N. Al-Rousan, R. Paul, D. Xu, and Lj. Trajković, “Collection of BCNET BGP traffic," in Proc. 23rd ITC, San Francisco, CA, USA, Sept. 2011, pp. 322-323.
n S. Lally, T. Farah, R. Gill, R. Paul, N. Al-Rousan, and Lj. Trajković, “Collection and characterization of BCNET BGP traffic," in Proc. 2011 IEEE Pacific Rim Conf. Communications, Computers and Signal Processing, Victoria, BC, Canada, Aug. 2011, pp. 830-835.
SPIN 2015, Amity University, Noida, India February 19, 2015 46