one-third of a nation: rising dropout rates and declining - ets
TRANSCRIPT

Policy Information Report
One-Third of a Nation: Rising Dropout Rates and Declining Opportunities
Listening.
Learning.
Leading.
Visit us on the Web at www.ets.org/research
00263-46448 • U25E5
727243
Policy Evaluation and Research Center
Policy Information Center
46448_one_third_cvr.indd 2-346448_one_third_cvr.indd 2-3 1/24/05 9:51:14 AM1/24/05 9:51:14 AM

1
This report was written by:Paul E. BartonPolicy Information CenterEducational Testing Service
The views expressed in this report are those of the author and do not necessarily reflect the views of the officers and trustees of Educational Testing Service.
Additional copies of this report can be ordered for $15 (prepaid) from:
Policy Information CenterMail Stop 19-REducational Testing ServiceRosedale RoadPrinceton, NJ 08541-0001(609) [email protected]
Copies can be downloaded from:www.ets.org/research/pic
Copyright © 2005 by Educational Testing Service. All rights reserved. Educational Testing Service is an Affirmative Action/Equal Opportunity Employer. Educational Testing Service, ETS, and the ETS logo are registered trademarks of Educational Testing Service.
February 2005
Policy Evaluation and Research CenterPolicy Information CenterEducational Testing Service
Preface. . . . . . . . . . . . . . . . . . . . . . . . . . . . . . . . . . . . . . . . . . . . . . . . . . . . . . . . . . . . . . . 2
Acknowledgments. . . . . . . . . . . . . . . . . . . . . . . . . . . . . . . . . . . . . . . . . . . . . . . . . . . . . . 2
Executive Summary. . . . . . . . . . . . . . . . . . . . . . . . . . . . . . . . . . . . . . . . . . . . . . . . . . . . . 3
Introduction . . . . . . . . . . . . . . . . . . . . . . . . . . . . . . . . . . . . . . . . . . . . . . . . . . . . . . . . . . . 6
The Elusive and Rising High School Dropout Rate . . . . . . . . . . . . . . . . . . . . . . . . . . . . 7
The Correlates of School Completion: Predicting State Completion Rates. . . . . . . . 14
Efforts to Retain Students. . . . . . . . . . . . . . . . . . . . . . . . . . . . . . . . . . . . . . . . . . . . . . . 20
Alternative Schools . . . . . . . . . . . . . . . . . . . . . . . . . . . . . . . . . . . . . . . . . . . . . . . 20
The Talent Development High School . . . . . . . . . . . . . . . . . . . . . . . . . . . . . . . . . 22
Communities In Schools . . . . . . . . . . . . . . . . . . . . . . . . . . . . . . . . . . . . . . . . . . . . 22
Maryland’s Tomorrow. . . . . . . . . . . . . . . . . . . . . . . . . . . . . . . . . . . . . . . . . . . . . . . 23
The Quantum Opportunities Program. . . . . . . . . . . . . . . . . . . . . . . . . . . . . . . . . . 23
Scarcity of Guidance Counseling . . . . . . . . . . . . . . . . . . . . . . . . . . . . . . . . . . . . . . . . . 25
The Structure of Opportunity for Dropouts . . . . . . . . . . . . . . . . . . . . . . . . . . . . . . . . . 29
Declining Second Chance Opportunities . . . . . . . . . . . . . . . . . . . . . . . . . . . . . . . 29
The GED: Plan B. . . . . . . . . . . . . . . . . . . . . . . . . . . . . . . . . . . . . . . . . . . . . . . . . . . 30
The Job Corps . . . . . . . . . . . . . . . . . . . . . . . . . . . . . . . . . . . . . . . . . . . . . . . . . . . . 34
YouthBuild USA . . . . . . . . . . . . . . . . . . . . . . . . . . . . . . . . . . . . . . . . . . . . . . . . . . . 34
The Center for Employment Training (CET). . . . . . . . . . . . . . . . . . . . . . . . . . . . . . 35
Youth Corps (Service and Conservation Corps) . . . . . . . . . . . . . . . . . . . . . . . . . . 36
Youth Opportunity Grants . . . . . . . . . . . . . . . . . . . . . . . . . . . . . . . . . . . . . . . . . . . 36
The Community College . . . . . . . . . . . . . . . . . . . . . . . . . . . . . . . . . . . . . . . . . . . . 37
Education After Dropping Out: One Cohort’s Experience . . . . . . . . . . . . . . . . . . 39
Economic Consequences . . . . . . . . . . . . . . . . . . . . . . . . . . . . . . . . . . . . . . . . . . . . . . . 40
Lost Travelers? . . . . . . . . . . . . . . . . . . . . . . . . . . . . . . . . . . . . . . . . . . . . . . . . . . . 40
Earning Power in the Young Adult Years. . . . . . . . . . . . . . . . . . . . . . . . . . . . . . . . 41
Taking Stock . . . . . . . . . . . . . . . . . . . . . . . . . . . . . . . . . . . . . . . . . . . . . . . . . . . . . . . . . 43
Appendix A: Estimates of High School Completion Rates by State, 1990 and 2000 . . . . . . . . . . . . . . . . . . . . . . . . . . . . . . . . . . . . . . . . . . . . . . . . . . . . 45
Appendix B: Regression Analysis Used to Predict High School Completion Rates. . . . . . . . . . . . . . . . . . . . . . . . . . . . . . . . . . . . . . . . . . . . . . . . . . . . . . . . . . . . 46
2
Preface
Recent efforts by the President, the nation’s gover-nors, and the business world’s top CEOs have put high school reform front and center in the education reform movement. A higher level of student achieve-ment is the prime objective, and rightly so. But an-other major objective should be dealing with the fact that one-third of those who enter our high schools do not graduate.
This report is about this one-third of our nation who do not complete high school, about the fact that this situation has gotten worse in most states during the last decade, and about the factors in students’ lives that are closely associated with dropping out of school. The report identifies several approaches to increasing student retention that evaluations have shown to have positive results.
Paul Barton describes the steadily declining oppor-tunities for dropouts after they leave school – declining public investment in “second-chance” programs and declining earnings in the job market. And he describes the kinds of second-chance efforts that have been shown to be effective.
Higher expectations for student achievement, Barton argues, need to be matched by greater efforts and success in getting students through to graduation, thereby opening doors for more educational oppor-tunities or decent paying jobs. And when students do drop out, there needs to be a larger system of second-chance opportunities for them to drop into.
Michael T. NettlesVice PresidentPolicy Evaluation and
Research Center
Acknowledgments
The author appreciates the thoughtful feedback, comments, and suggestions made by the following reviewers of the draft report: Henry Braun and Rich-ard Coley, ETS; Margaret E. Goertz, Center for Policy Research in Education at the University of Pennsylva-nia; Jay P. Greene of the Manhattan Institute for Policy Research; and Sam Halperin of the American Youth
Policy Forum. The regression analyses were conducted by Fred Cline. David Freund also provided data and advice. The report was edited by Amanda McBride. Susan Mills and Rick Hasney provided desk-top pub-lishing and Joe Kolodey designed the cover. Errors of fact or interpretation are those of the author.

3
Executive Summary
This report is about high—and rising—high school dropout rates, some exemplary efforts to retain stu-dents, the limited—and diminishing—opportunities for dropouts to regain a footing in education and training, and the increasingly dire prospects for drop-outs in today’s economy. About a third of students are leaving high school without a diploma: One-Third of a Nation.
The High School Completion Rate Has Not Been Accurately Reported.
• Official estimates of state completion rates are too high, and the U.S. Department of Education is ex-amining ways to obtain better measurements. One National Center for Education Statistics (NCES) series going back to the 1880s is on the mark, but never seems to be reported in the press.
• A number of independent researchers have made recent estimates that put the national rate variously at 66.1, 66.6, 68.7, 69.6, and 71.0 percent.
The High School Completion Rate Has Been Falling.
• Nationally, after peaking at 77.1 percent in 1969, the rate dropped to 69.9 percent in 2000.
• From 1990 to 2000, the completion rate declined in all but seven states. In 10 states, it declined by 8 percentage points or more.
The Completion Rates Vary Widely Among the States, in Close Relationship to Factors Identified by Research as Predictive of Students Dropping Out.
• Recent completion rates range from a high of 88 percent in Vermont to a low of 48 percent in the District of Columbia and 55 percent in Arizona.
• A combination of three factors—socioeconomic characteristics, number of parents living in the home, and a history of changing schools frequent-ly—are associated with 58 percent of the variation in completion rates among the states. These factors combined predict estimated state completion rates within four percentage points in 24 states. A close study of the states with completion rates that are substantially different from predicted rates might reveal important differences that affect student retention. Such correlations do not foreordain school completion rates; efforts of various kinds to improve retention have shown results and are dis-cussed in this report. Also, improvements in school quality that raise student achievement will also improve completion rates, for succeeding students are more likely to complete school.
Ways to Increase Retention Have Been Demon-strated, Providing a Resource for School Systems to Follow.
• Alternative Schools, approximately 11,000 in num-ber, have been established to serve students at risk of dropping out. But we need to know more about the schools that are successful and the different kinds of approaches they use.
• The Talent Development (TD) High School is a model reform program developed by the Center for Research on the Education of Students Placed at Risk (CRESPAR). The TD high school is based on research on student motivation and teacher com-mitment. There are now 33 TD high schools in 12 states, and evaluations have shown TD to increase student retention.
• Communities in Schools (CIS), a program run from a national office and five regional offices, has been around for a long time. Evaluations have shown that this type of program can increase stu-dent retention.

4
• Maryland’s Tomorrow, begun in 1985, is a state-wide dropout prevention program operating in 75 schools. Evaluations carried out by the state of Maryland and Johns Hopkins University have shown positive effects on student retention.
• The Quantum Opportunities Program was a program funded by the Ford Foundation with the intention of keeping students in school. The pro-gram had considerable success, running from 1989 to 1992, when the grant ended. The knowledge and experience developed by the program are still available.
While these programs have helped us better under-stand some of the mechanisms that can help keep stu-dents in school, the homework on retaining students has not been finished; a need still exists for rigorous evaluation, and for replication of evaluations already conducted.
A Scarcity Exists of Guidance and Counseling Personnel, and Related Staff, to Work One on One with Students at Risk of Dropping Out and Their Families.
• On average, only one certified counselor is avail-able for each 500 students in all schools, and one counselor to 285 students in high schools.
• The ratio varies considerably. The ratio is higher in schools where less than half of the students are col-lege bound; it is also higher in schools with a high percentage of minority students.
• The bulk of counselor time goes to helping students with the transition to college, getting students scheduled for classes, dealing with student be-havioral problems, and, increasingly, administer-ing standardized testing as part of accountability systems. Little time is spent on career guidance for students going directly to work, or on transition-to-work services for such students. And there is little time for one-on-one work with students who are at risk of dropping out and their families. The counseling function has been largely ignored in the education reform movement.
Opportunity for Dropouts to Resume Education and Training Is Diminishing.
• The federal investment in second-chance programs has dropped from $15 billion in the late 1970s, at a time when school completion was peaking, to $3 billion today. Projects originating at the local level come and go, but national records are not kept on them.
• This decrease in program funding is happening at the same time that the earning power of dropouts is in sharp decline.
The GED Program Is an Important Second-Chance Opportunity, but Opportunities for Instruction in Second-Chance Programs Are Not Growing.
• While generally known as a program for adults, GED certificates have shifted toward 16- and 17-year-olds over the past decade. Several possible reasons are discussed in this report, but knowledge is incomplete.
• The American Council on Education has recently strengthened the GED and made it a more rigorous test. It is as yet unknown whether this new test will result in a change in the number of GEDs awarded.
While Second-Chance Opportunities Have Dimin-ished, Scientific Evaluations Have Shown Some Programs in Operation to Be Effective; a Base of Knowledge Exists for Rebuilding.
• The Job Corps, with more than 60,000 enrollees, has been operating since 1964 and has been subject to many evaluations. The program has shown stay-ing power and is the only such program operating that long.
• YouthBuild USA provides education and training in the context of building affordable housing. Funded primarily by the Department of Housing and Urban Development, the program has created more than 12,000 housing units while training more than 40,000 youth.
• The Center for Employment Training (CET), begun in 1967, has 33 centers in 12 states. The CET pro-vides job training and education. Evaluations have found the CET to be very effective.
5
• Youth Corps (Service and Conservation Corps) trace back to the Civilian Conservation Corps of the 1930s. After a period of federal funding ended, 31 states continued to operate programs, enroll-ing 23,000 youth annually. The program generates $1.60 in immediate benefits for every $1 of costs.
• The community college is a ubiquitous and flexible institution with a lot of involvement in GED and remedial instruction for dropouts. These colleges have the capability to make a much larger contri-bution. But unless special tuition reimbursement or grant programs are available, dropouts must pay tuition – often supporting themselves at the same time they are attending school.
The Earning Power of High School Dropouts Has Been in Almost Continuous Decline Over the Past Three Decades.
• High percentages of young dropouts are either not employed or are not even in the labor force. Most wander through life like lost travelers, without guidance or goals, and many end up in prisons.
• The earning power in constant 2002 dollars of 25- to 34-year-old dropouts who work full time for a full year has been in steady decline, during an age period critical to getting established, forming families, and raising children.
• In 1971, male dropouts earned $35,087 (in 2002 dollars), falling to $23,903 in 2002, a decline of 35 percent.
• In the same period, the earnings of female dropouts fell from $19,888 to $17,114.
• Earnings of high school graduates also dropped considerably, but not as much as earnings for those who dropout out of school.
The Nation Faces Increasing Dropout Rates, Declining Assisted Second-Chance Opportunities for Education and Training, and a Deteriorating Economic Position.
• In high school completion rates, the United States has now slipped to 10th place in the world.
• Only the kind of national resolve being shown to raise student academic achievement can reverse these adverse trends for this third of the nation’s youth. Increasing student achievement in the early years may well lead to increases in school comple-tion since it is the low achievers who are more prone to dropping out.

6
Introduction
This report is about high—and rising—high school dropout rates, some ways schools are trying to retain students, the limited—and diminishing—supported opportunities for dropouts to regain a footing in edu-cation and training, and the increasingly dire pros-pects for dropouts in today’s economy.
Every decade in this author’s memory, the “dropout crisis” is discovered anew. The situation is bemoaned and dire warnings are issued about the consequences of failure to act. Over the past four decades, the ac-count that best gained the nation’s attention was a little book published in 1961 by James Conant entitled, Slums and Suburbs: A Commentary on Schools in Metropolitan Areas. According to Conant, the problems facing schools in the slums is getting students through school and into jobs, and trying to raise students’ sights to continue their education. Conant writes: “The task thus stated seems simple. In actual fact, the dif-ficulties are appalling.”1 He explains that he wrote the book “because I am convinced we are allowing social dynamite to accumulate in our large cities.” His term “social dynamite” has reverberated ever since.
Of course, the problem of not completing high school is not limited to city slums. It radiates out, past city boundaries, and permeates many rural areas, particularly in the South. What is also appalling is that little has been done to improve the situation. Some im-provements were made in the early 1960s to the mid-1970s; the percentage of students completing school improved, but not likely in the slums that Conant was seeing firsthand. Since peaking in the 1970s and staying level for about two decades, the high school completion rate turned down in the 1990s—during a period of strong school reform efforts. And the rates in the kinds of places Conant was seeing remain in the 50 percent range. About a third of students do not gradu-ate after four years of high school; thus, the title of this report: One-Third of a Nation.
1 James Conant, Slums and Suburbs: A Commentary on Schools in Metropolitan Areas, New York: McGraw-Hill, 1961, p. 10. This book came about through a grant from the Carnegie Corporation to the Educational Testing Service.
The report starts by describing the recently rec-ognized difficulties of simply obtaining an accurate measure of the extent of the problem. It provides state-by-state estimates made by the author and others, and a comparison between 1990 and 2000.
The correlates of the school completion rate are examined, drawing on a synthesis of research conduct-ed over a considerable period of time. A set of factors related to school completion is used to predict state rates, and these predicted rates are compared with actual performance.
Certain approaches for increasing student retention have been tried; a few of these are described, together with their evaluation results. An assessment of the state of counseling and guidance in the schools is pro-vided, and the extremely limited resources available to try to keep students in school are also discussed.
When students drop out, what kinds of opportuni-ties do they have to return to education and training, in what are called “second-chance” programs? The report surveys the current opportunity structure, in-cluding the General Education Development, or GED, program. Over the past three decades, supported op-portunities in second-chance programs have declined precipitously, although there are successful models upon which to build. A few of these models, together with evaluations of them, are provided.
The consequences of leaving school without a diploma are very often dire and considerable. The report describes the employment prospects for young dropouts and the earning prospects of these young adults at a critical time in their lives when careers and families are started.
For the past two decades, the agenda of school reform has been to improve the quality of schools and raise the levels of student achievement. The task now is to broaden this effort to encompass school comple-tion as well as higher achievement.

7
The Elusive and Rising High School Dropout Rate
For many years, Americans read in their newspapers about high and rising high school graduation rates and took comfort that the national rate was nearing 90 percent, based on reports from the U.S. Bureau of the Census. In the past four years, however, about a half-dozen studies by independent researchers have concluded that it simply isn’t so. Likewise, the studies concluded that the state estimates provided by the U.S. Department of Education, as well as the rates supplied by the states under reporting requirements of the No Child Left Behind Act (NCLB), also are inaccurate and generally inflated.
A number of reasons exist for the inaccurate statis-tics. For example, the Census Bureau statistics on high school graduation include awarded General Educa-tion Development Certificates, which are earned by passing a test commonly referred to as the GED, not by completing high school. An increase in the number of GEDs awarded annually has masked a decline in diplomas awarded for completing four years of high school. Also, the Census Bureau’s household sample is based on self-reports from families regarding the graduation status of family members, rather than on actual school records – and is therefore not particu-larly accurate.
The National Center for Education Statistics (NCES), in the early 1990s, developed a quite logical procedure for the states to follow in reporting data used to calculate completion rates: Dropout rates for each year of high school were summed to get a com-pletion rate after four years. However, as accountabil-ity systems started to include completion rates in their
reward and punishment systems, schools developed a reluctance to classify students as “dropouts” when other categories were available in which to report them, and became creative in reporting why students were no longer enrolled. Or possibly, record keep-ing was just sloppy. In response, NCES convened the Task Force on Graduation, Completion, and Dropout Indicators, made up of 10 academics and government statisticians. The panel was formed in the fall of 2003 to advise the U.S. Department of Education’s chief statistical agency on ways to improve its reporting on schools’ progress in helping students earn high school diplomas. The panel’s recommendation was to assign a unique identification number to each student and to use these numbers to track student progress over time. To do so will be expensive, however, since only about one-fifth of the states have systems in place that could be used to track school completion.2
Another indicator of school completion for the na-tion as a whole is calculated and reported by NCES. This number, seldom reported in the press, is buried in the thick Digest of Education Statistics. This author has watched this measure over the past four decades, and has become increasingly perplexed by the growing disparity between what it showed and what was being reported in the newspapers, which typically report on information culled from Census Bureau reports. This was one factor that lead, four years ago, to the writing of the report entitled The Closing of the Educa-tion Frontier?, which displayed a chart showing high school completion rates going back to 1870.3
2 Debra Viadero, “Panel Urges New System for H.S. Data,” Education Week, December 8, 2004.3 Paul E. Barton, The Closing of the Education Frontier?, Policy Information Report, Policy Information Center, Educational Testing Service,
Princeton, N.J., September 2002. See www.ets.org/research/pic.

8
The chart is based simply on the ratio of diplomas awarded to the number of 17-year-olds in the popula-tion, which can be taken as the cohort of graduating age, whether slightly younger or slightly older. While still rising in the 1960s, the completion rate declined in the 1990s. The rate peaked at 77 percent in 1969, dropped to 70 percent in 1995, and held close to that
through 2001, although it dropped to 68.8 percent in 1998. For a historical perspective, this is shown below in Figure 1. While this estimate is available from NCES for every year, it never seems to make it into press releases, or to be quoted in the press or in reports about the dropout rate.
Figure 1:High School Graduates as a Percentage of the 17-Year-Old Population, 1869-70 to 1999-2000
Note: Graduates are of regular day school programs. Source: U.S. Department of Education, National Center for Education Statistics.
1870
0
20
40
60
80
’20 ’52 ’59 ’00’94’64 ’69 ’74 ’78 ’84 ’89
Gra
dua
tes
as a
Per
cent
age
of
17-Y
ear-
Old
Po
pul
atio
n
9
4 Paul E. Barton, Unfinished Business: More Measured Approaches in Standards-Based Reform, Policy Information Report, Policy Informa-tion Center, Educational Testing Service, Princeton, N.J., January 2005. www.ets.org/research/pic.
5 These estimates are drawn from Jay P. Greene, High School Graduation Rates in the United States, the Manhattan Institute, New York, April 2002; Christopher B. Swanson and Duncan Chaplin, Counting High School Graduates When Graduates Count, Education Policy Center, Urban Institute, February 23, 2003; Andrew Sum et al., The Hidden Crisis in the High School Dropout Problems of Young Adults in the U.S.: Recent Trends in Overall School Dropout Rates and Gender Differences in Dropout Behavior, prepared for the Business Roundtable, Center for Labor Market Studies, Northeastern University, Boston, Mass., February 2003; Barton, 2005; and Thomas Mortenson, Postsec-ondary Education Opportunity, Iowa City, Iowa, May 2002.
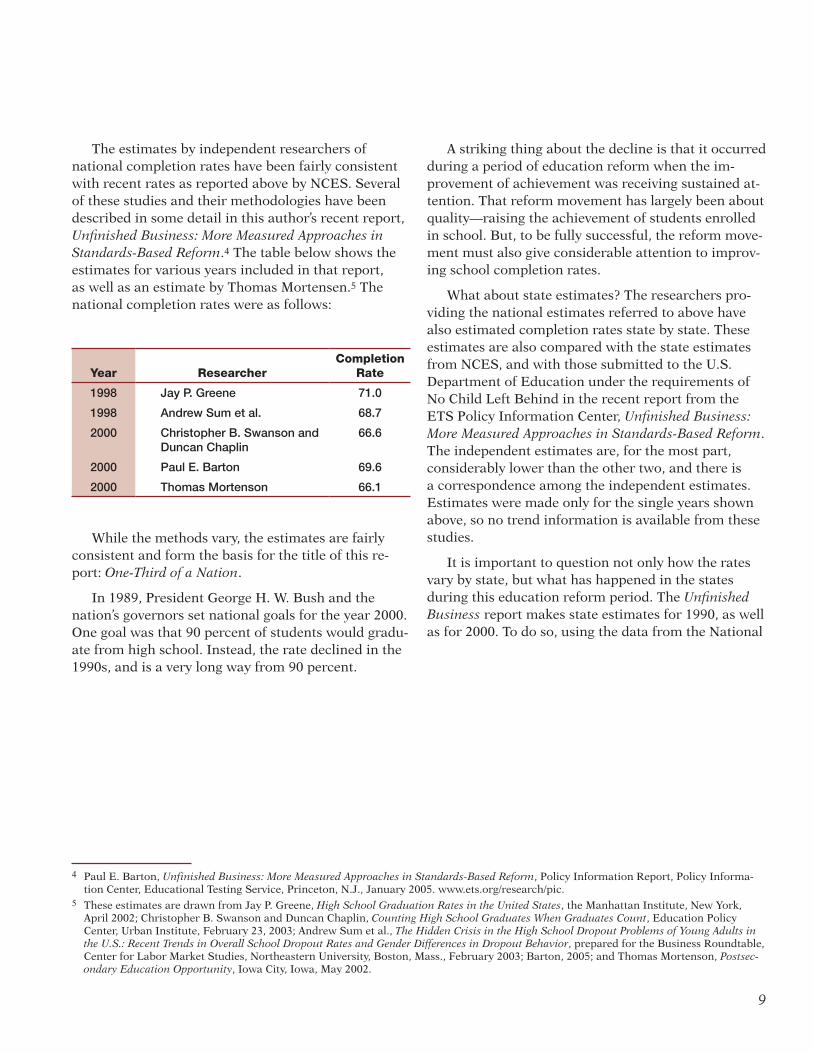
The estimates by independent researchers of national completion rates have been fairly consistent with recent rates as reported above by NCES. Several of these studies and their methodologies have been described in some detail in this author’s recent report, Unfinished Business: More Measured Approaches in Standards-Based Reform.4 The table below shows the estimates for various years included in that report, as well as an estimate by Thomas Mortensen.5 The national completion rates were as follows:
Year ResearcherCompletion
Rate
1998 Jay P. Greene 71.0
1998 Andrew Sum et al. 68.7
2000 Christopher B. Swanson and Duncan Chaplin
66.6
2000 Paul E. Barton 69.6
2000 Thomas Mortenson 66.1
While the methods vary, the estimates are fairly consistent and form the basis for the title of this re-port: One-Third of a Nation.
In 1989, President George H. W. Bush and the nation’s governors set national goals for the year 2000. One goal was that 90 percent of students would gradu-ate from high school. Instead, the rate declined in the 1990s, and is a very long way from 90 percent.
A striking thing about the decline is that it occurred during a period of education reform when the im-provement of achievement was receiving sustained at-tention. That reform movement has largely been about quality—raising the achievement of students enrolled in school. But, to be fully successful, the reform move-ment must also give considerable attention to improv-ing school completion rates.
What about state estimates? The researchers pro-viding the national estimates referred to above have also estimated completion rates state by state. These estimates are also compared with the state estimates from NCES, and with those submitted to the U.S. Department of Education under the requirements of No Child Left Behind in the recent report from the ETS Policy Information Center, Unfinished Business: More Measured Approaches in Standards-Based Reform. The independent estimates are, for the most part, considerably lower than the other two, and there is a correspondence among the independent estimates. Estimates were made only for the single years shown above, so no trend information is available from these studies.
It is important to question not only how the rates vary by state, but what has happened in the states during this education reform period. The Unfinished Business report makes state estimates for 1990, as well as for 2000. To do so, using the data from the National
10
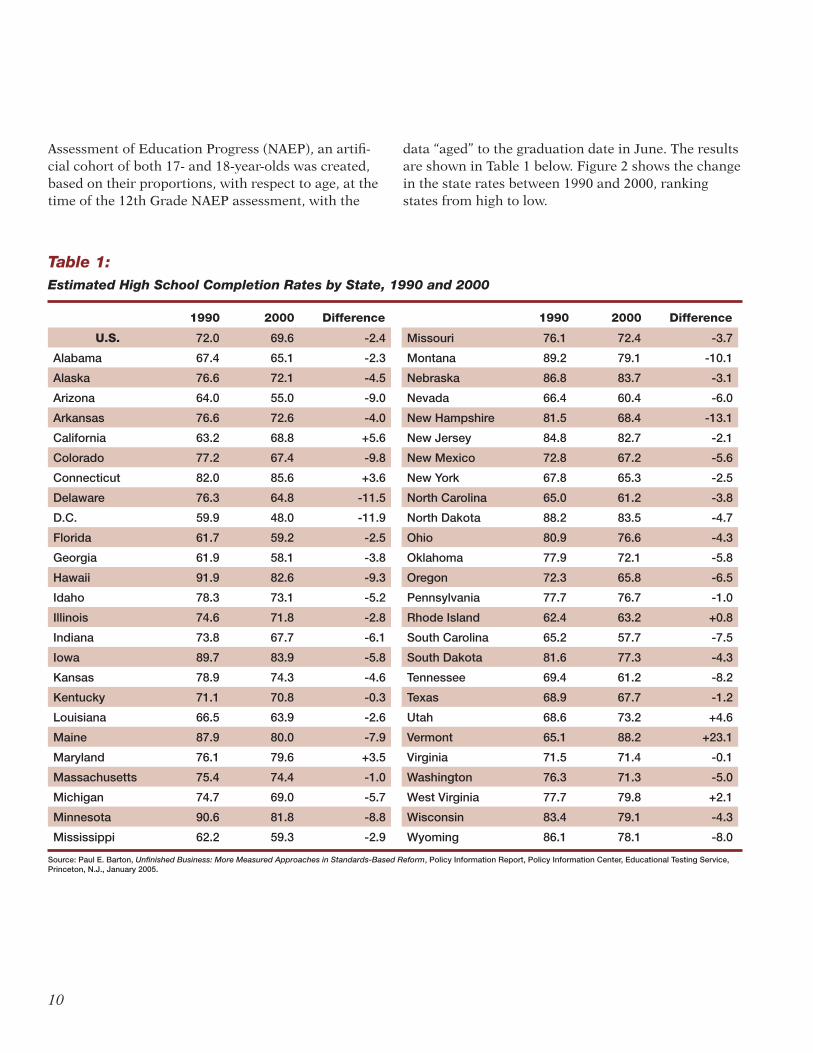
Assessment of Education Progress (NAEP), an artifi-cial cohort of both 17- and 18-year-olds was created, based on their proportions, with respect to age, at the time of the 12th Grade NAEP assessment, with the
1990 2000 Difference 1990 2000 Difference
U.S. 72.0 69.6 -2.4 Missouri 76.1 72.4 -3.7
Alabama 67.4 65.1 -2.3 Montana 89.2 79.1 -10.1
Alaska 76.6 72.1 -4.5 Nebraska 86.8 83.7 -3.1
Arizona 64.0 55.0 -9.0 Nevada 66.4 60.4 -6.0
Arkansas 76.6 72.6 -4.0 New Hampshire 81.5 68.4 -13.1
California 63.2 68.8 +5.6 New Jersey 84.8 82.7 -2.1
Colorado 77.2 67.4 -9.8 New Mexico 72.8 67.2 -5.6
Connecticut 82.0 85.6 +3.6 New York 67.8 65.3 -2.5
Delaware 76.3 64.8 -11.5 North Carolina 65.0 61.2 -3.8
D.C. 59.9 48.0 -11.9 North Dakota 88.2 83.5 -4.7
Florida 61.7 59.2 -2.5 Ohio 80.9 76.6 -4.3
Georgia 61.9 58.1 -3.8 Oklahoma 77.9 72.1 -5.8
Hawaii 91.9 82.6 -9.3 Oregon 72.3 65.8 -6.5
Idaho 78.3 73.1 -5.2 Pennsylvania 77.7 76.7 -1.0
Illinois 74.6 71.8 -2.8 Rhode Island 62.4 63.2 +0.8
Indiana 73.8 67.7 -6.1 South Carolina 65.2 57.7 -7.5
Iowa 89.7 83.9 -5.8 South Dakota 81.6 77.3 -4.3
Kansas 78.9 74.3 -4.6 Tennessee 69.4 61.2 -8.2
Kentucky 71.1 70.8 -0.3 Texas 68.9 67.7 -1.2
Louisiana 66.5 63.9 -2.6 Utah 68.6 73.2 +4.6
Maine 87.9 80.0 -7.9 Vermont 65.1 88.2 +23.1
Maryland 76.1 79.6 +3.5 Virginia 71.5 71.4 -0.1
Massachusetts 75.4 74.4 -1.0 Washington 76.3 71.3 -5.0
Michigan 74.7 69.0 -5.7 West Virginia 77.7 79.8 +2.1
Minnesota 90.6 81.8 -8.8 Wisconsin 83.4 79.1 -4.3
Mississippi 62.2 59.3 -2.9 Wyoming 86.1 78.1 -8.0
Table 1: Estimated High School Completion Rates by State, 1990 and 2000
Source: Paul E. Barton, Unfinished Business: More Measured Approaches in Standards-Based Reform, Policy Information Report, Policy Information Center, Educational Testing Service, Princeton, N.J., January 2005.
data “aged” to the graduation date in June. The results are shown in Table 1 below. Figure 2 shows the change in the state rates between 1990 and 2000, ranking states from high to low.

11
Figure 2:Change in High School Completion Rates, by State, 1990 to 2000
Source: Paul E. Barton, Unfinished Business: More Measured Approaches in Standards-Based Reform, Policy Information Report, Policy Information Center, Educational Testing Service, Princeton, N.J., January 2005.
-30 -20 -10 0 10 20 30
23.15.6
4.63.63.5
2.10.8
-0.1-0.3-1-1
-1.2-2.1-2.3
-2.4-2.5-2.5-2.6-2.8-2.9-3.1
-3.7-3.8-3.8
-4-4.3-4.3-4.3-4.5-4.6-4.7
-5-5.2-5.6-5.7-5.8-5.8
-6-6.1-6.5
-7.5-7.9
-8-8.2
-8.8-9
-9.3-9.8
-10.1-11.5-11.9
-13.1
VermontCalifornia
UtahConnecticut
MarylandWest VirginiaRhode Island
VirginiaKentucky
PennsylvaniaMassachusetts
TexasNew Jersey
AlabamaU.S.
New YorkFlorida
LouisianaIllinois
MississippiNebraskaMissouri
North CarolinaGeorgia
ArkansasWisconsin
South DakotaOhio
AlaskaKansas
North DakotaWashington
IdahoNew Mexico
MichiganIowa
OklahomaNevadaIndianaOregon
South CarolinaMaine
WyomingTennesseeMinnesota
ArizonaHawaii
ColoradoMontanaDelaware
District of ColumbiaNew Hampshire
Difference in Completion Rate, 1990 to 2000

12
Only seven states showed increases: California, Connecticut, Maryland, Utah, West Virginia, Rhode Island, and Vermont. The rest of the states showed declines.
• 16 states declined up to 3.9 percentage points;
• 18 states declined from 4 to 7.9 percentage points;
• 9 states declined from 8 to 11.9 percentage points; and
• 1 state declined 13 or more percentage points.6
This is a straightforward way of calculating com-pletion rates, and relies only on diplomas awarded (from both public and private schools) and the popula-tion counts from the Census Bureau; in this case, from the decennial censuses. This approach derives from the way NCES has long provided estimates for the na-tion, as shown in Figure 1.
The results paint a picture of generally declining graduation rates for states as a whole. But there are very large differences in states among subgroups in the population. There are some estimates by state and by subgroup, the fi rst such effort being that of Jay P. Greene and Greg Forster at the Manhattan Institute, previously referenced. The estimates are for public schools, for states where the racial and ethnic data were available.
For White students in 40 states, the high rate was 93 percent for North Dakota, and the low rate was 61 percent in Florida. For Black students in 33 states, the high was 73 percent in New Mexico and the low was 44 percent in Wisconsin. For Hispanic students in 23 states, the high was 74 percent in Louisiana and the low was 42 percent in New York. For Asian students in 28 states, the high was 94 percent in Arkansas and the
6 After this author’s calculations were made for the ETS Policy Information Report Unfinished Business: More Measured Approaches in Standards-Based Reform (referenced earlier), estimates by state for the period 1989-2001 became available from Walter Haney et al. Haney looked at how many eighth graders graduated from high school four years later. Using this method, he found that 10 states gained (typi-cally, just several points), five showed no change, and 33 declined (of which 11 declined 5 or more percentage points). See Walter Haney et al., The Education Pipeline in the United States 1970-2000, the National Board on Educational Testing and Public Policy, Boston College, Boston, Mass., January 2004. With regard to the huge increase in Vermont of 23 percentage points in school completion rates shown in Figure 2, note that in the same period, the Haney et al. computations show a rise of only 5 points using his method of aging public school enrollment from the eighth grade.
7 Christopher B. Swanson, The Real Truth About Low Graduation Rates, An Evidence-Based Commentary, The Urban Institute, Washington, D.C., August 2004, p. 3
low was 65 percent in Mississippi. Among the states, graduation rates not only vary among racial and eth-nic groups, they also vary considerably within those groups; for example, the Black rate varies considerably in different states, as do the rates for other groups.
Overall, the Greene report puts the rate for White students at 72 percent, the rate for Black students at 51 percent, the rate for Hispanic students at 52 percent, the rate for American Indian students at 54 percent, and rate for Asian students at 70 percent. This author is aware of no estimates of trend data by state, on the basis of race and ethnicity.
The U.S. Department of Education is taking a very serious look at the issues surrounding completion rates, and improvements will likely be forthcoming. It may well turn out that there is no single true way to measure completion rates, and that we need to use multiple approaches.
It may come as a surprise to many that we have not developed good measures, let alone used them. After extensive work in the area, Christopher Swanson of the Urban Institute had this to say:
Despite widespread agreement that obtaining a high school diploma represents a critical avenue for social, economic, and personal advancement, this is simply not an outcome we have spent much time or effort trying to measure in a care-ful and uniform way. In fact, at present, there is no widely accepted and scientifi cally validated method for calculating graduation rates that could be systematically applied to the data cur-rently available in the States.7

13
The comprehensive study by Walter Haney and col-leagues, referenced earlier, discloses a striking change in high school enrollment and dropout patterns.8
There has developed what he calls a “bulge” in enroll-ments in Grade 9, with 440,000 more students enrolled in Grade 9 than in Grade 8 in 2000. Also, attrition has increased, as compared with the past, between Grade 9 and Grade 10. Haney et al. say the two trends com-bined are “surely a reflection of the fact that more students nationally were being flunked to repeat Grade 9.” By 2000-2001, Haney et al. report, over half the states had 10 percent or more students in the ninth grade than were in the eighth grade the previous year, with seven states having 20 percent or more.
Much of the dropping out of school has shifted from tending to take place between Grades 11 and 12, typical three decades ago, to typically occurring between Grades 9 and 10, possibly drawing from the group of students held back. This is a significant shift,
making dropouts younger and less educated than in the past, and therefore facing more difficulty in get-ting jobs. This development, beyond the high rates themselves, increases the need to strengthen efforts to retain students and to enlarge second-chance opportu-nities for school leavers—and particularly to get them on track for a diploma. There is also some indication that some unknown numbers of students are taking five years to get a high school diploma rather than four; so, while some are leaving earlier, others may be staying longer.
A 2004 report from the Organization for Economic Co-Operation and Development finds the United States falling behind internationally in high school comple-tion, and is now 10th, behind such nations as Korea, Norway, the Czech Republic, and Japan. However, for adults over 44 who have completed high school, the United States still leads.9
8 Haney et al., 2004, p. 14.9 Ben Fuller, Associated Press, Detroit News, September 14, 2004.

14
The Correlates of School Completion: Predicting State Completion Rates
There are, then, large differences among the states in the percentage of students who complete high school. Understanding these differences requires an under-standing of the determinants of staying in school to completion.
Over many decades, surveys have been carried out in which students were asked why they left school before graduating. While there have been some dif-ferences in the way the questions were worded, the results have had a considerable sameness. Replies include such issues as getting pregnant, falling behind in school, not liking school, and wanting or needing to go to work. The reasons given are only proximate; experiences that have taken place over many years of students’ lives contribute to the act of leaving school. Full understanding would require delving deeply into the circumstances of students’ early formative years, if one could do so.
The life and school experiences that help to cre-ate differences in students’ school achievement will likely also be those that resulted in the differences in completing school. A previous ETS Policy Information Center Report synthesized the results of research on the correlates of school achievement. That report iden-tified 14 correlates, beginning with low birth weight and including hunger and nutrition, being read to by parents, TV watching patterns, qualifications of teach-ers, and the student behavior climate in the school.10
School achievement itself is also an important deter-minant of completing school; students performing poorly are candidates for becoming noncompleters.
In a study reported in 2002, the U.S. General Accounting Office synthesized the body of research on dropping out, summing up the results as follows:
Research has shown that multiple factors are associated with dropping out, and that dropping out of school is a long-term process of disen-gagement that occurs over time and begins in the earliest grades. NCES and private research organizations have identified two types of fac-tors—those associated with families and those related to an individual’s experience in school—that are related to dropping out. For example, students from low income, single-parent, and less-educated families often enter school less prepared than children from more affluent, bet-ter educated families, and subsequently drop out at a much high rate than other students do.
Factors related to an individual’s experiences in school often can be identified soon after a child begins school. These factors, such as low grades, absenteeism, disciplinary problems, frequently changing schools, and being retained two or more grades, are all found at a much higher than average rate in students that drop out. Study of the long-term process of dropping out may provide insight into ways to identify earlier potential dropouts.11
10 Paul E. Barton, Parsing the Achievement Gap: Baselines for Tracking Progress, Policy Information Report, Policy Information Center, Edu-cational Testing Service, Princeton, N.J., November 2003.
11 SCHOOL DROPOUTS: Education Could Play a Stronger Role in Identifying and Disseminating Promising Prevention Strategies, United States General Accounting Office, GAO-02-240, February 2002, p. 3.

15
How much of a role do these established key fac-tors play in explaining the differences in completion rates among the states? And given the varying con-ditions and economies that exist among the states, which states are doing better, and which are doing worse than might be expected? The states considerably exceeding expectations might be looked at intensively to see what might be helping, and states not doing as well as would be expected may benefi t from adopting new approaches to stem the fl ow of students leaving school before completion.
Several indicators were found to be associated with school completion in the states.12
������������������ ���� ������. The measures used were (1) median family income, (2) the per-centage of persons age 25 and over with a B.A. degree or higher, and (3) the percentage of those employed who are in professional and manage-rial occupations. These factors were not statisti-cally signifi cant in predicting the high school completion rate.
��������� �����������. This factor, added to number 1 above (socioeconomic characteristics), was the percentage of children under 18 in the state living in two-parent families (ranging from a high of 77 percent in North Dakota to a low of 33 percent in the District of Columbia). Add-ing this variable to number 1 above explained a total of 49.2 percent of the variation in comple-tion rates. The results indicate that having two parents in the home makes a huge difference in predicting high school completion, even after controlling for family income.
������������������. The measure used was the percentage of eighth graders who had not changed schools during the preceding two years. The inclusion of this variable added 9 percent-age points, bringing the total percentage of the variation in dropout rates explained to 58.2 percent.13
Given these substantial correlations, it was then possible to predict a state’s completion rate based on these factors. Figure 3 shows both the predicted rate and the actual rate for 2000. (Actual rates are esti-mated, as explained in the previous section). For each state, it can be seen how much the state matched, exceeded, or fell below the predicted completion rate.
Figure 3 shows that these factors generally predict-ed actual high school completion rates. The predicted rate is very close to the actual rate in many of the states. In 24 of the states the actual rate was within plus or minus 4 percentage points of the predicted rate. Except for Rhode Island and Hawaii, all of the rest of the states were within plus or minus 10 percent-age points of the predicted rate. These data are shown in Figure 4. Table 2 shows these data for states listed alphabetically.
12 See Appendix B for details of the calculation of correlations.13 This information on student mobility was available for only the 36 states participating in the NAEP state assessment. Another analy-
sis was performed for all the states, with the only difference being that the rate of immigration into the state was used as a measure of student mobility. This factor added 8.4 percentage points. Estimated completions for the non-NAEP states were drawn from this second analysis.

16
Vermont
Nebraska
Hawaii
West Virginia
Montana
Pennsylvania
Kansas
Arkansas
Oklahoma
Washington
California
Texas
Oregon
Delaware
North Carolina
Mississippi
South Carolina
0 20 40 60 80 100
8886
848484838382
808080797978777777
747473737372727272717171
6969686868686767
6565656463
61616059595858
5548
0 20 40 60 80 100
80777880
NA77
7180
7872
7076
7372
7575
7280
7879
7566
7069
67747374
7270
677675
6974
667273
6866
6175
6965
5960
656565
6346
Connecticut
Iowa
North DakotaNew Jersey
MinnesotaMaine
MarylandWisconsin
WyomingSouth Dakota
OhioMassachusetts
UtahIdaho
MissouriAlaska
Illinois
Virginia
Kentucky
Michigan
New HampshireIndiana
Colorado
New Mexico
New YorkAlabama
LouisianaRhode Island
Tennessee
Nevada
Florida
Georgia
Arizona
District of Columbia
Completion Rate
Actual Predicted
Figure 3:Actual and Predicted High School Completion Rates, by State

17
Hawaii
Vermont
West Virginia
Montana
New Jersey
Oklahoma
Nebraska
Alaska
South Dakota
Missouri
California
New Mexico
Nevada
Texas
Michigan
Virginia
Illinois
Alabama
Tennessee
Massachusetts
Utah
Georgia
New Hampshire
Arizona
Indiana
(15) (10) (5) 0 5 10 15
1210
888
66666
544
33333
2222
111
(1)(1)(1)(1)
(2)(2)(2)(2)(2)
(3)(4)(4)
(6)(6)(6)(6)
(7)(7)(7)(7)(7)
(8)(8)(8)
(12)
Maryland
Connecticut
Arkansas
Wyoming
Iowa
Ohio
Louisiana
Wisconsin
Maine
District of Columbia
Minnesota
Pennsylvania
Mississippi
Kentucky
Delaware
Idaho
Washington
Kansas
Oregon
Florida
Colorado
New York
North Carolina
South Carolina
Rhode Island
Difference Between Actual and Predicted High School Completion Rates
Actual rate higher than predicted
Actual rate lower than predicted
Figure 4:Differences Between Actual and Predicted High School Completion Rates, by State

18
Table 2: Predicted and Actual High School Completion Rates, and the Differences
State PredictedActual (2000) Difference State Predicted
Actual (2000) Difference
Alabama 68.4 65.1 -3.3 Montana 73.1 79.1 +6.0
Alaska 69.2* 72.1 +2.9 Nebraska 79.6 83.7 +4.1
Arizona 62.6 55.0 -7.6 Nevada 59.2 60.4 +1.2
Arkansas 66.4 72.6 +6.2 New Hampshire 75.7* 68.4 -7.3
California 67.2 68.8 +1.6 New Jersey 77.0* 82.7 +5.7
Colorado 73.9* 67.4 -6.5 New Mexico 65.8 67.2 +1.4
Connecticut 77.3 85.6 +8.3 New York 72.5 65.3 -7.2
Delaware 66.3* 64.8 -1.5 North Carolina 68.6 61.2 -7.4
D.C. 45.8 48.0 +2.2 North Dakota NA 83.5 NA
Florida 65.0* 59.2 -5.8 Ohio 72.4 76.6 +4.2
Georgia 65.2* 58.1 -7.1 Oklahoma 67.2 72.1 +4.9
Hawaii 70.5 82.6 +12.1 Oregon 71.5 65.8 -5.7
Idaho 75.1 73.1 -2.0 Pennsylvania 75.4* 76.7 +1.3
Illinois 74.0* 71.8 -2.2 Rhode Island 74.9 63.2 -11.7
Indiana 75.4 67.7 -7.7 South Carolina 65.4 57.7 -7.7
Iowa 78.3* 83.9 +5.6 South Dakota 74.7* 77.3 +2.6
Kansas 78.0 74.3 -3.7 Tennessee 65.0 61.2 -3.8
Kentucky 71.8 70.8 -1.0 Texas 68.7 67.7 -1.0
Louisiana 60.6 63.9 +3.3 Utah 79.1 73.2 -5.9
Maine 77.5 80.0 +2.5 Vermont 79.9 88.2 +8.3
Maryland 69.9 79.6 +9.7 Virginia 73.1 71.4 -1.7
Massachusetts 80.1 74.4 -5.7 Washington 73.7* 71.3 -2.4
Michigan 70.4 69.0 -1.4 West Virginia 71.9 79.8 +7.9
Minnesota 80.3* 81.8 +1.5 Wisconsin 76.3* 79.1 +2.8
Mississippi 59.9 59.3 -0.6 Wyoming 72.4 78.1 +5.7
Missouri 70.0 72.4 +2.4
*Note: States with an asterisk are where NAEP data on student mobility are not available and where data on immigration into the state were used instead. See Appendix B for details.

19
It is not suggested that the completion rate is fore-ordained by such a set of conditions or experiences. The previously referenced report, Parsing the Achieve-ment Gap, found that where “socioeconomic level” is broken down into the differences in actual conditions and experiences that are correlated with achievement of children and students, there are changes that can be made that can improve the situation, including several school conditions. Where attention is paid to the conditions that can improve student achievement, completion rates will improve; students who are suc-ceeding are more likely to complete school than those who are not.
Differences among the states in race and ethnicity were not used as a factor in the correlations that pro-duced these predicted state completion rates. All the factors and conditions used are changeable, however hard it may be to do so. These are the kinds of factors that vary considerably, on the average, among differ-ent racial and ethnic populations. After all these other factors were considered, another correlation was run to add in the percentage of minority students in the state. This raised the correlation only slightly; nearly all of the differences were already accounted for by the factors described above.14
Obviously, some schools in some states rise above what these factors alone would predict. And, of course, some schools fall below what this set of circumstances would predict. It could well be useful to look closely at what is happening with regard to circumstances, poli-cies, and practices not captured by these prediction factors that may cause a state to do much better than predicted, or much worse. It is also worth noting that doing as “well as predicted” is hardly an indication of a satisfactory completion rate.
What caused these rate changes that cropped up between 1990 and 2000? Given the role that the num-ber of parents in the home plays in predicting state dropout rates, it is reasonable to wonder if that factor played a role in the decline. The percentage of fami-lies with two parents did decline from 76.2 percent to 71.6 percent during this period, and declined in all the states—some a little and some a lot. However, no pat-tern emerges to relate completion rates to the number of parents in the home. Later in this report, other suspects are examined, but no explanation is found to tie down this decline.
14 The multiple correlation was raised from an R of .763 to .799 by adding the variable, percentage of minority students.

20
Efforts to Retain Students
Over the decades, much has been said about the high school dropout rate, and much has been attempted to address it. Many campaigns at the district, state, and national level have worked to improve the school completion rate. The tide of such efforts has ebbed and flowed. New policies and pilot programs have been undertaken, and some of those started and dis-continued likely had some successes. There is a long history of such efforts ending after special funding ran out, or after a new executive curtailed the programs or policies of prior executives.
The question of how to improve the completion rate has no simple answer. The discussion on the cor-relates of school completion shows how deeply the issue is tied to the social, economic, and school life of U.S. students. But the problem is hardly hopeless. Be-low are highlights of a few successful efforts with the specific purpose of retaining students until graduation.
Alternative Schools
Alternative schools exist within the public education system, either as separate schools or as programs within schools. Students in these alternative schools are still in the public education system, but they have been separated out, or have separated themselves out, from the mainstream system.
The specific purpose of alternative schools is de-fined by each state, and therefore is not uniform. What these schools typically have in common, however, is that students “are referred to alternative schools and programs if they are at risk of education failure, as indicated by poor grades, truancy, disruptive behavior, suspension, pregnancy, or similar factors associated with early withdrawal from school.”15 In the recent, and first, national survey of alternative schools, carried out by NCES, the schools included were public alter-native schools and programs that were geared toward students at risk of education failure.16
The approximately 11,000 schools included in this national survey establish alternative schools as a very substantial public school effort to retain at-risk stu-dents in the education system, students likely nearest to terminating their school careers.
Alternative schools are not new, having been in-troduced in the 1960s. From the beginning, they were geared toward students unsuccessful in traditional school settings, although there were other purposes and agendas as well, where successful students en-rolled in programs with innovative and nontraditional approaches.
The growth of alternative schools seems to have been steady. NCES counted 2,606 in 1993-94 and 3,850 in 1997-98. The most recent special national study found 10,900 schools with 612,000 students—1.3 per-cent of all public school students in 2000-2001.17
The Institute on Community Integration at the University of Minnesota conducted a survey of the legislative and policy bases of alternative schools in all 50 states, using a “key informant” in each state. Below is a summary of the common themes running through state laws and policies regarding enrollment practices and requirements in most states, or in a large portion of them.
• In 34 states, students are admitted if they have been suspended from school. Admission may be re-quired or, in some states, admission is at the choice of the student.
• In 21 states, students often must meet some form of at-risk criteria. Typical at-risk behaviors were having dropped out of school, truancy, having been physically abused by someone, substance abuse or possession, or homelessness.
15 Brian Kleiner et al., Public Alternative Schools and Programs for Students at Risk of Education Failure: 2000-01, National Center for Educa-tion Statistics, Washington, D.C., September 2002.
16 Kleiner et al., 2002.17 Kleiner et al., 2002.

21
• In 14 states, students who have been disruptive in school are admitted. For example, in Pennsylvania, “where the student’s presence poses . . . ongoing threat of disrupting the academic process, the stu-dent may be immediately removed from the regular education curriculum.”
• Students who have been academically unsuccess-ful and would benefit from a nontraditional setting are also considered good candidates for alternative schools.
It was also either typical or frequent that the cur-riculum and educational program required:
• A core curriculum that emphasized basic academic skills and addressed state content standards (in 28 states)
• Provision of social services (in 12 states)
• Provision of community-based learning and com-munity service programs (in 10 states)
• An emphasis on individual instruction (in 9 states).
The authors of the study conclude with some thoughtful questions for public policy:
Is the underlying intent of alternative education legislation to meet the needs of disenfranchised students, or to assist traditional public schools in behavior management? What is the role of alternative education within the larger context of public school choice and options . . . What are the outcomes and expectations for students who attend these schools?18
What is clear is that purposes are sometimes mul-tiple, and that there is a lot of variation among schools and states as to what is intended, what is expected, and what is provided.
The NCES survey referenced earlier has, for the first time, provided a solid basis for measuring some basic things about the characteristics of alternative schools.
• 39 percent of public school districts administered at least one school or program; this was true of 66 percent of urban districts.
• In the Southeast, the establishment of such schools is reaching toward universality, with 80 percent of districts having at least one. The low is in the Cen-tral region, where just 28 percent of districts have a school or program.
• The higher the minority enrollment and the con-centration of poverty, the more likely a district is to have a school or program.
• Of the 10,900 such schools, 6,400 are housed in separate facilities.
• Districts with enrollments of 10,000 or more students have three or more alternative schools or programs.
• The highest rates of having alternative schools or programs are in high schools, at around 90 percent of school districts.
• In 90 percent of the districts, teachers were hired specifically to teach in these schools or programs; in 49 percent, teachers were transferred by their choice from a regular school; and in 10 percent of districts, teachers were involuntarily assigned.
Enrollment in these schools is often restricted due to limitations of space and staffing. About a third of the districts were unable to enroll new students in at least one school or program during the 1999-2000 school year; this was more likely in large and moder-ate-size districts than in small ones.
Alternative schools have undoubtedly become im-portant in aiding school retention, but we know very little about how important a role they have played. No data are available—at least, at the national level—about success rates, either in terms of graduation rates or academic achievement. These schools seem to exist in a dark corner of the education system. Researchers and the education community in general need to shine a bright light on these schools so that we may better understand the important role they are playing—and to help illuminate the possibilities that may exist for them to play a larger role.
18 Camilla A. Lehr, Eric J. Launers, and Cheryl M. Lange, Alternative Schools: Policy and Legislation Across the United States, University of Minnesota, 2003, pp. 7-8.

22
The Talent Development High School
The Talent Development (TD) model of educational reform was developed by the Center for Research on the Education of Students Placed at Risk (CRESPAR), a collaboration between Johns Hopkins and Howard Universities. The first implementation was at Patterson High School in Baltimore, Maryland. Patterson was a school slated for reconstitution due to its past poor performance (it had been designated one of the two worst schools in the state).
The TD model is based on research in the area of student motivation and teacher commitment that uses a “school-within-a-school” approach. The TD high schools focused their initial implementation on the ninth grade by creating small learning communities, enacting curricular reforms, and providing profession-al development for teachers. They utilized interdisci-plinary teams of teachers responsible for 150 to 180 students, had longer class periods to permit greater depth in learning, and used employer advisory boards to help design curriculum and provide internship op-portunities. There are now 33 TD high schools located in 12 states.
The CRESPAR evaluation found that:
• Attendance rose from 66 percent to 75 percent in the ninth grade, and rose schoolwide from 72 per-cent to 78 percent.
• In terms of attendance, Patterson moved from sec-ond worst in the city to second best.
• Ninth-grade promotion went from 47 percent to an estimated 69 percent, based on first semester course grades.
• Teacher perceptions of the school changed dramati-cally.19
The Manpower Development Research Corpora-tion has just reported the early results of an evaluation based on five TD high schools during the ninth grade. The schools in this study were characterized by low student engagement, poor prior preparation among
entering ninth graders, and low ninth-grade promo-tion rates. The percentage of ninth graders complet-ing a core academic curriculum increased from an average of 43 percent to 56 percent after implementa-tion—about three times the level for similar schools in the district. There were also modest improvements in attendance, and improvement has been sustained in the second and third year for the three schools in their third year of implementation.20
The increasing reach and success of the TD model is making it a significant development in such schools to improve achievement, increase promotion, and increase attendance, all of which are closely related to high school completion.
Communities In Schools
Previously named Cities in Schools, this widespread program is run by Communities in Schools, Inc., a nonprofit organization dedicated to helping children succeed in school and prepare for life. The purpose of the Communities In Schools (CIS) program is to keep students in school. The approach and effectiveness of the individual programs likely vary. At the community level, partnerships are formed between the schools and community agencies. The intention is to bring such community agencies together to deliver services to students. Such services might include:
• Management of individual student cases;
• Individual and group counseling;
• Volunteers and mentors;
• Classes teaching life skills and employment-related topics;
• Classes providing remedial education;
• Tutoring; and
• After-school or in-school programs on conflict reso-lution, community service, substance abuse preven-tion, pregnancy prevention, and teen parenting.
19 American Youth Policy Forum, Some Things Do Make a Difference, 1998, pp. 56-59.20 James J. Kemple and Corinna M. Herlihy, The Talent Development High School Model, Manpower Development Research Corporation,
June 2004.

23
A relatively recent evaluation of the CIS program was conducted by the Urban Institute, which reported the results in 1995. The findings on effectiveness in-cluded:
• The cumulative dropout rate was 21 percent over three years, or about 7 percent annually, compared to 12 percent for students in low-income families.
• Of the half of students who had a history of high absenteeism before entering the CIS program, 68 percent improved their attendance.
• Of the 45 percent of students who entered the CIS program with GPAs of 1.99 or lower, 60 percent improved in the first year.
• CIS students in alternative schools or academies, and in schools-within-schools, showed more improvement than CIS students in typical public schools.21
Maryland’s Tomorrow
This is a large-scale statewide dropout prevention effort operating in 75 high schools. Its goal is to raise student achievement. Effort is directed at youth con-sidered at risk of dropping out, over half of whom are members of a minority group. When it first began in 1985, Maryland’s Tomorrow (MT) served 100 summer school students in one city. Service rose to 7,500 annu-ally for students in Grade 9 through Grade 12.
Among other program components, the program includes counseling with a high level of student sup-port, intensive academic instruction during both the summer and the school year, career guidance explora-tion over five years, a variety of summer activities, and adult mentors.
The Maryland State Department of Education and the Institute for Policy Studies at Johns Hopkins Uni-versity carried out evaluations that found that:
• More than half of the programs studied showed higher graduation rates and lower dropout rates than the comparison group;
• Performance on the Maryland Achievement Test improved; and
• The grade point averages of ninth and 10th graders improved, but not the grade point averages of 11th and 12th graders.22
The Quantum Opportunities Program
The Quantum Opportunities Program (QOP) was an intensive, multi-component intervention program tar-geting randomly selected at-risk ninth graders entering inner-city high schools with high dropout rates. Its goal was to help socioeconomically and educationally disadvantaged youth improve their academic perfor-mance in school, graduate from high school, and go on to college, advanced skills training, or the military. The program was launched in 1989 using funding pro-vided by the Ford Foundation; the Ford Foundation and the U.S. Department of Labor provided funding for the program’s second phase (1995 to 1999).
Using a comprehensive case management ap-proach, the program provided year-round services to the participants throughout their four years of high school. Program components included tutoring, homework assistance, computer-assisted instruction, life- and family-skills training, supplemental after-school education, developmental activities, mentoring, community service activities, and financial incentives.
21 The results of the Urban Institute evaluation are provided in American Youth Policy Forum, Some Things Do Make a Difference, 1998, pp. 104-105.
22 American Youth Policy Forum, Some Things Do Make a Difference, 1998.

24
Participants received a sequence of 250 hours each annually of education, development, and service activi-ties. All services were delivered by caring adult coun-selors who served as mentors, role models, disciplinar-ians, advocates, and problem solvers. The program also provided financial incentives for participating in the program: Associates received a stipend for each hour spent on QOP activities, and a bonus of $100 after completing 100 hours of education, development, or service activities in a given year (for up to $300). The stipends and bonuses were placed in an interest bearing Quantum Opportunity Account and held for approved use, such as college or job training.
The four cornerstones of the QOP program were:
• Education – Self-paced computer-assisted-instruc-tion, including Internet access and instruction, with heavy emphasis on the fundamentals of read-ing, writing, math, science, and social studies;
• Community service – Tutoring elementary students, assisting the homeless and the elderly, cleaning up neighborhoods, and volunteering at local hospitals;
• Development – Life-skills training, personal devel-opment activities, cultural enrichment; and
• Support – Financial incentives for each hour of participation; counselors/mentors on call 24 hours a day, 7 days a week throughout the participant’s high school years.
The QOP program was a scientifically based ef-fort. Twenty-five students from four different cities, each from a family receiving public assistance, were chosen at random to participate in the program. Of these, 86 percent were ethnic minorities, and only 9 percent lived with both parents. The program fol-lowed the youth through all four years of high school. A control group was also established in the research phase, which was conducted by the Center for Human Resources at the Heller Graduate School at Brandeis University. Evidence of the program’s effectiveness includes the following findings:
• A high school dropout rate of 23 percent, compared to 50 percent for the control group;
• 42 percent of the program participants went on to postsecondary education, compared to 16 percent for the control group, with 18 percent attending a four-year college compared to 5 percent for the control group; and
• Participants became teen parents less often: 24 per-cent compared to 38 percent for the control group.
The effects increased for each year of school in the academic and functional areas measured. The cost was $10,000 per student over the entire four years.23
Although the program died at the end of the four years, exhumation can provide a road map for the supplementation of the regular four-year programs in schools that have a high proportion of minority, welfare, and low-income families. The program offers a rich source of information for the design of com-prehensive community schools. An effort that cuts the dropout rate by more than half is not to be ignored.
* * * * *
A number of promising practices and approaches have been found to produce improvements in school completion rates. However, not all the evaluations are as strong as they need to be, nor have as many studies been replicated as would be desirable. It is also worth keeping in mind that efforts to increase achievement in the early grades also help to reduce dropping out; successful students are more likely to complete school than are unsuccessful ones.
23 These results are provided in American Youth Policy Forum, Some Things Do Make a Difference, 1998, pp. 123-124.

25
Scarcity of Guidance Counseling
Signs that students are at a high risk of dropping out of school are easy to recognize. The clues show up in their school records, school performance, and behav-ior, and include such symptoms as low grades, skip-ping classes, being tardy, and generally uncooperative behavior.
Guidance counselors who pick up on these tell-tale signs can initiate discussions with students about their behavior and what lies behind it. Counselors can try to learn about students’ home circumstances and talk to their parents. They can try to find ways to help stu-dents cope and support them in ways that increase the likelihood they will stay in school. While this discus-sion uses data on high school counselors, counseling in earlier grades is also important in identifying behav-iors and conditions that may be precursors to school leaving. Precursors of dropping out may be evident before students enter high school, so work in the el-ementary schools is also important.
Being aware of students’ problems can lead to very practical assistance. For example, John Dulin, a 19-year-old of no fixed address in Fairfax County, Virgin-ia, finally graduated after being pushed and prodded over several years. Getting to school was a problem for John, so during summer school, when he was finish-ing an English requirement, he received a wakeup call from the school at 6:30 every morning. Now the effort continues to get him into college.24
24 S. Mitra Kalita, The Washington Post, August 13, 2004, p. B1.
Clarifying links between staying in school and get-ting a job upon leaving school may help to convince students that they should stay in school and get a diploma. Guidance counselors can maintain the kind of relationships with community colleges, training organizations, employer organizations, and placement services such as the public Employment Service, that enable the school to smooth the transition to em-ployment after graduation, or to further preparation in postsecondary education or proprietary schools. Schools have, in fact, operated placement services. Knowledge that the school can actually facilitate postgraduation success, provide sound advice about how to proceed after graduation, and refer graduates to opportunities may well influence many students to stay in school.
Most would say that these are obvious points, and that guidance professionals are prepared to do such things. But the truth is that, in most school settings, services that might improve retention for those most likely to drop out are largely not available, or are available only to a very limited extent. Also, the role of guidance counseling has largely been ignored in the education reform movement of the past two decades. Attention has gone almost exclusively to raising the achievement of those who are in school and who stay in school. And where resources for guidance services are available, they have been historically focused on the transition to further education, not to transition-ing directly to work or to work-based training for the students expressing no interest in college.

26
There are many reasons for this situation. To start, according the NCES, there is only one counselor for every 500 or so elementary and secondary school stu-dents, a ratio that has remained fairly stable over the last two decades, although it has improved over prior decades. In 2002, there was just one certified coun-selor for each 284 students in high schools, and this varied considerably by the size of the school. Where enrollment was less than 400, the ratio was 1 counsel-or to 150 students; where the enrollment was 2,000 or more, the ratio was 1 counselor to 365 students. Stu-dents in schools where less than half of the students were college bound had higher ratios than students in schools where more than half were college bound. In schools with few minority students, the ratios were much lower than in schools with high proportions of minority students25 (see Figure 5).
25 National Center for Education Statistics, The Condition of Education 2004, Table 27-1.
Counselors, already limited by their dwindling numbers, have a myriad and burgeoning range of du-ties, reducing the time they might be available to work with students at high risk of dropping out, and limit-ing the kind of services they could provide that might convince students they can receive help in getting a job if they stay in school. The many activities of the limited number of counselors can be seen in Table 3.
The greatest amount of time goes to scheduling students for classes, helping students make the transi-tion to college, and dealing with student attendance, discipline, and other school and personal problems. This last activity likely puts counselors in touch with students who are most at risk of dropping out, but the study does not identify how much time counselors have for follow-up with such students, beyond dealing with the immediate issue.
Less than 10 percent
10 to 24 percent
25 to 49 percent
50 to 74 percent
75 percent or more
0 100 200 300 400
256
278
306
323
305
Number of Students per Counselor
Percentage ofMinority Students:
Figure 5:Number of Secondary School Students per Certified Counselor, by Percentage of Minority Students in the School, 2002
Source: National Center for Education Statistics, The Condition of Education 2004, Table 27-1.

27
Time Spent: 5 percent Or Less
Time Spent: 20 percent Or More Activity
7% 49% Choosing and scheduling high school courses
4% 43% Postsecondary education advice and selection
10% 17% Occupation choice and career planning
54% 2% Job placement and employability skill development
15% 33% Student attendance, discipline, and other school and personal problems
23% 19% Academic testing
56% 13% Other guidance activities
73% 5% Nonguidance activities (hall/lunch duties, bus duty, etc.)
Because counselors are held responsible for or assist in the administration of standardized tests, a considerable amount of time is dedicated to academic testing. Such testing has grown by leaps and bounds over the last couple of decades. Under the federal No Child Left Behind Act, testing will continue to grow, further drawing counselors away from counseling students. Other guidance activities take some time, but the survey does not tell us how much of this may relate to activities that help school retention. They must also find time for those nonguidance activities that include hall/lunch duties, substitute teaching, bus duty, and the like. These take time and, while they help to maintain an orderly school environment, they do little to keep at-risk students on the path to earning a high school diploma.
Helping students plan their careers and make oc-cupational choices may well help them decide to stay in school and graduate, particularly as they learn what kind of education is required to land decent jobs. Just 17 percent of counselors say they spend more than a fifth of their time on such activities, less than the time dedicated to academic testing—a function in support of instructional and accountability activities, not stu-dent guidance.
Table 3.Where Counseling Time Is Spent, By Percentage of Total Counselors
Source: U.S. Department of Education, National Center for Education Statistics, Survey on High School Guidance Counseling, 2001, FRSS 80, 2002.
For students motivated more immediately toward employment rather than college, would help with em-ployability skill development and the availability of job placement services cause them to think that staying in high school is a better way to get a job? This seems plausible, but 54 percent of counselors spend 5 per-cent or less of their time on such activities, and only 2 percent of counselors spend more than 20 percent of their time this way.
All in all, guidance counseling, as it exists in a great many high schools today, cannot be expected to make a major contribution to raising the high school reten-tion rate, given the number of students that counselors must work with, the myriad of duties they perform, and the large proportion of time they must spend get-ting students into college and administering standard-ized tests.

28
Where students are most in need, and where the noncompletion rates are likely the highest, the staff time available is even bleaker. We have already seen that less counseling time is available in schools with a higher percentage of minority enrollment, and in schools where fewer students are college bound. To compound the situation, these are also schools where more counselor time is diverted to standardized achievement testing; the percentage of counselors spending 20 percent or more of their time on it is 17 percent in schools with less than 6 percent minority enrollment, compared with 23 percent where minor-ity enrollment is 50 percent or more. In schools where less than half of students are college bound, 17 percent of counselors spend more than 10 percent of their time on “nonguidance activities,” compared with 11 percent in schools where three-fourths or more of students are college bound. As much time is spent on “postsecond-ary education advice and selection” in schools with high minority enrollment—where the non-completion rate is highest—as in schools with the lowest minority enrollment. As desirable as it is to help with college entrance in these high minority schools, it does indi-cate relative priorities in terms of dealing with school retention. Minority students are very unlikely to transi-tion to higher education if they do not graduate from high school.26
From the NCES longitudinal survey of the high school cohort scheduled to graduate in 1992 and fol-lowed up in 1994, we can get some idea of how many high school dropouts actually met with high school counselors immediately before or immediately after dropping out of high school. Of the dropouts who had by that time not received a diploma elsewhere or a GED certificate, just under a fourth had seen a high school counselor or social worker. This was true for 40 percent of those dropouts who had subsequently earned a diploma or certificate. Just 8 percent of either group had gone to a youth center-type program.27
There is no body of research that tells us how much we can increase the high school completion rate by increasing the number of guidance and related per-sonnel to work with students at high risk of dropping out. But there are enough reasons to be encouraged. A recent report sums it up this way:
There is general agreement that career develop-ment is a desirable part of schooling, and there is evidence that many different types of career guidance interventions are effective, according to the measure chosen. Yet, the research overall does not help us in determining the optimum content or method of delivery of career guid-ance.28
This research summary provides few specifics about how guidance counseling can keep more stu-dents in school. A serious effort to improve retention should involve a very close look at guidance counsel-ing in terms of the numbers of counselors available, the demands on and priorities for the use of their time, and effective approaches. There also should be a care-ful look at the erosion of counselor time available for working with students resulting from increased time spent on standardized academic testing for school ac-countability.
And if not an augmented guidance and counseling staff, augmented perhaps with paraprofessionals and volunteers, then who? Who will learn enough, and fol-low through enough to make a difference at a critical point in such young lives? Teachers can instruct and inspire, and they can spot troubled youth, but they do not have sufficient time to follow through with individ-ual students. Nevertheless, it is recognized that there has been too little rigorous research and evaluation of the effectiveness of counseling in reducing the propen-sity of students to leave school before completion. A hardheaded approach to the deployment of resources demands a better knowledge base.
26 U.S. Department of Education, National Center for Education Statistics, Survey on High School Guidance Counseling, 2001, FRSS 80, 2002.
27 National Center for Education Statistics, National Educational Longitudinal Study of 1988.28 Katherine L. Hughes and Melinda Mechur Karp, School-Based Career Development: A Synthesis of Literature, Institute on Education and
the Economy, Teachers College, Columbia University, February 2004, p. 31.

29
The Structure of Opportunity for Dropouts
When students drop out of high school, what oppor-tunities are there for them to drop into? This section of the report addresses this question, although data often are not readily available, as is the case for data regarding enrollment in regular public schools. It is clear that there has been a decline in the support of structured second-chance opportunities for education and training. Some strong programs that have been evaluated remain, however. These will be described, as will the growing GED testing program. A base of ex-perience and knowledge exists upon which to rebuild toward the level of commitment reached a quarter century ago. At the end of this section, the experiences of a cohort of students who participated in a national longitudinal study of eighth graders are described in-cluding the experiences of those who dropped out.
Declining Second-Chance Opportunities
The 1970s and early 1980s brought a spurt in federal activity in the creation of second-chance education and training opportunities, after a good start in the mid-1960s with the Job Corps, part of the War on Pov-erty and the 1964 Economic Opportunity Act. The ear-ly 1980s saw major retrenchment, and then a leveling out of the relative number of opportunities, although the Job Corps and some of the stronger and surviv-ing community-based organization programs were retained. Recently, the Department of Labor Youth Op-portunity Grants have been curtailed altogether.
Attempts have been made to estimate the number of opportunities in such programs. One recent effort is the work of the Campaign for Youth:
All of the full-time federally-funded education, employment, and national service programs combined (Job Corps, YouthBuild, Service Corps, Challenge, AmeriCorps, Workforce Investment Act, Youth Opportunity Grants) are barely scratching the surface of the need and demand. There are less than 300,000 full-time training and educational opportunities for 2.4 million low-income 16 to 24 year-olds who left school without a diploma or got a diploma and can’t find a job.
Of course, when you reduce that number to those who are school dropouts and still in their teens, it may be more like just 100,000 opportunities.
Estimates by the National Coalition for Youth Em-ployment also have been made of the change in federal investment since 1979. In current dollars, the invest-ment was about $15 billion in 1979. It was less than $3 billion in 2003.29 Yet, as described earlier in this report, the dropout rate has been advancing since the mid-1990s. These seemingly antithetical trends indi-cate that the nation was beginning to extend opportu-nity to a considerable proportion of those not gradu-ating from high school, even at the point where the graduation rate had reached its highest levels. Then, a long period of decline set in.
This is by no means to say that opportunities are nonexistent. A great many youth find a way to get their diploma, or GED, and many of those find a way to continue their education. While the bulk of the funding for second-chance programs has come from the federal government, this is not the base for the whole of the opportunity structure. There are pro-grams emanating from some states and cities, as well as from community- and faith-based organizations. But how many such opportunities exist in the aggre-gate is unknown, as is whether such opportunities are increasing or decreasing. Thirty years ago, there also were nonfederal programs coming from a variety of sources.
29 Personal correspondence, David Brown, Executive Director of the National Coalition for Youth Employment. For a history of youth employment programs over the last 40 years, see Alan Zuckerman, “The More Things Change, the More They Remain the Same: The Evolution and Devolution of Youth Employment Programs,” in Trends in Youth Development, Peter L. Benson and Karen Johnson Pittman (eds.), Klumer Academic Publishers, 2001. The Campaign for Youth is led by the National Coalition for Youth Employment in partner-ships with the National Association of Associations and Conservation Corps and YouthBuild USA.
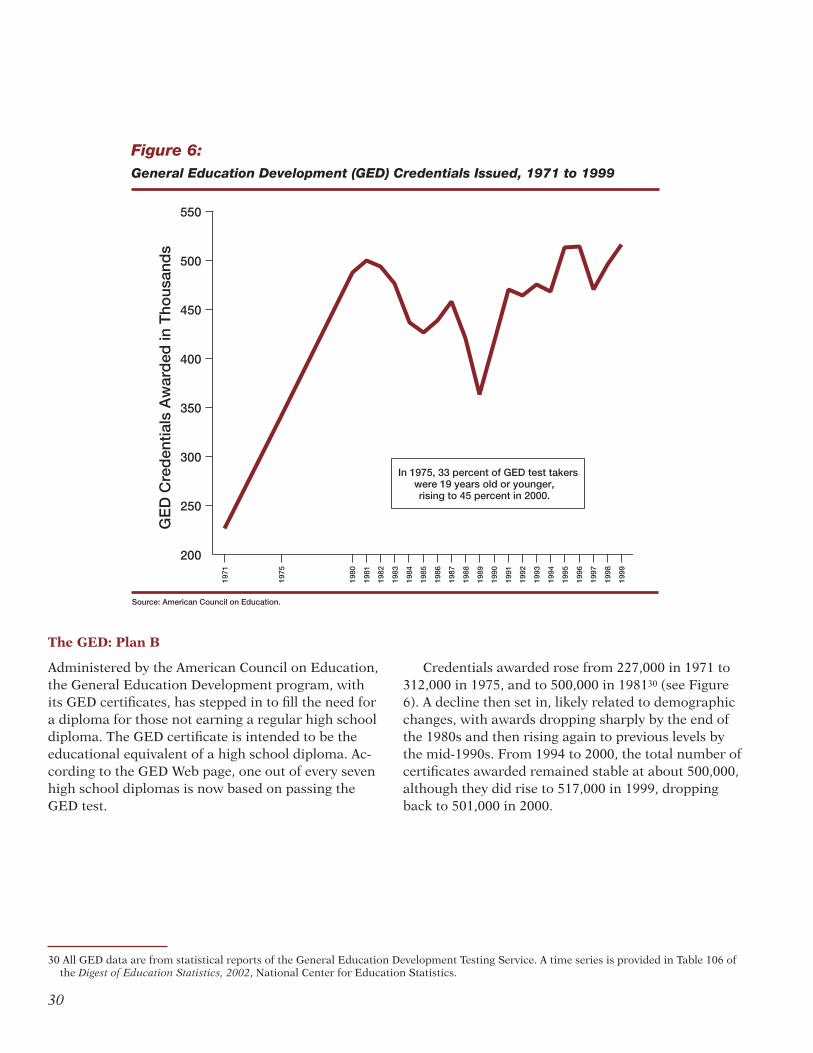
30
The GED: Plan B
Administered by the American Council on Education, the General Education Development program, with its GED certificates, has stepped in to fill the need for a diploma for those not earning a regular high school diploma. The GED certificate is intended to be the educational equivalent of a high school diploma. Ac-cording to the GED Web page, one out of every seven high school diplomas is now based on passing the GED test.
1971
1975
1980
1981
1982
1983
1984
1985
1986
1987
1988
1989
1990
1991
1992
1993
1994
1995
1996
1997
1998
1999
200
250
300
350
400
450
500
550
GE
D C
red
entia
ls A
war
ded
in T
hous
and
s
In 1975, 33 percent of GED test takerswere 19 years old or younger,rising to 45 percent in 2000.
Figure 6:General Education Development (GED) Credentials Issued, 1971 to 1999
Source: American Council on Education.
Credentials awarded rose from 227,000 in 1971 to 312,000 in 1975, and to 500,000 in 198130 (see Figure 6). A decline then set in, likely related to demographic changes, with awards dropping sharply by the end of the 1980s and then rising again to previous levels by the mid-1990s. From 1994 to 2000, the total number of certificates awarded remained stable at about 500,000, although they did rise to 517,000 in 1999, dropping back to 501,000 in 2000.
30 All GED data are from statistical reports of the General Education Development Testing Service. A time series is provided in Table 106 of the Digest of Education Statistics, 2002, National Center for Education Statistics.

31
The GED program is a valuable one, although it is not in all respects a substitute for a regular diploma in terms of later success in life. A number of studies have been conducted in an attempt to understand how a GED affects employment success. This work was synthesized in a report published by the U.S. Depart-ment of Education in 1998. The report points out that the GED itself is not an education program, but a way to certify the knowledge a person has. GED examinees spend a median of 30 hours in preparation, although 24 percent spend over 100 hours. This compares to about 410 hours in core curriculum classes in a typical high school year. Also, with their average of 2.1 years of additional schooling, “high school graduates typi-cally had 861 more hours of core curriculum classes.”
The general conclusion of the synthesis was as follows:
In some respects, GED recipients resemble high school graduates; in others, they resemble drop-outs; in still other ways, they fall between the two. Given these mixed findings, the common practice of counting GEDs as high school gradu-ates should be reconsidered.”31
Duncan Chaplin of the Urban Institute has also conducted some important research on the effects of the GED.32 In labor market outcomes, he finds that the studies made so far show that the earnings of GED holders are less than their counterparts who receive regular diplomas—but more than those without either. Chaplin asks whether the increasing availability of the GED for teenagers is drawing many out of high school. In his examination of changes in a number of GED policies over the years, he finds evidence that this is
occurring. For example, the rule that individuals must be at least 20 to take the GED has been dropped, mak-ing the GED accessible to high school-age students. After that rule relaxation, a rule that required teenag-ers to get parental permission to take the GED was also dropped.
In 2002, the American Council on Education re-vised the GED so that it goes beyond multiple-choice testing. The revised test, designed to be more rigorous, has now replaced the old test. Research on outcomes described in this section is based on the previous (“old”) version of the GED. In this discussion, only GED data are used through 2000.
The year 2001 was a transition year and there was an unusual increase in test volume, because individu-als who had carried passing scores into 2001 on fewer than five tests in the old battery of tests had to pass the remaining tests by the end of 2001 in order to receive their credential based on the old tests. There was a rush to meet the deadline. Testing volume dropped sharply in 2002, as was expected. It is hard to predict exactly what the volume will be when this transition is fully completed.
Despite the stability of the total testing volume from 1994 to 2000, one very large change has oc-curred. The GED program seems to be in a process of redistribution toward teenagers. Nationally, 35.8 percent of certificates were awarded to those age 16-19 in 1990, rising to 44.6 percent in 2000. In numbers, there was a 42 percent increase in certificates awarded to teenagers age 16 to 19, from over 157,000 to over 223,000.33
31 David Boesel, Nabeel Alsalam, and Thomas M. Smith, Educational and Labor Market Performance of GED Recipients, U.S. Department of Education, National Education Library, 1998.
32 Duncan Chaplin, GEDs for Teenagers: Are There Unintended Consequences?, Urban Institute, November 29, 1999.33 Calculated from the statistical reports of the GED program, American Council on Education.

32
Table 4Percentage Point Changes Over the Decade in the Percentage of GED Recipients Who Are Age 16 or 17, 1990 and 2000
State 1990 2000 Change State 1990 2000 Change
Alabama 5.5 9.5 +4.4 Montana 9.0 30.5 +21.5
Alaska 14.7 29.3 +14.6 Nebraska 0 0 0
Arizona 14.1 20.5 +6.4 Nevada -- 22.8 --
Alabama 11.2 31.3 +20.1 New Hampshire 6.2 11.0 +4.8
California -- 10.5 -- New Jersey 6.3 15.0 +8.7
Colorado 13.1 23.0 +9.9 New Mexico 14.3 19.2 +4.9
Connecticut 8.5 2.7 -5.8 New York 11.3 14.4 +3.1
Delaware 4.2 19.5 +15.3 North Carolina 6.3 23.5 +17.2
DC 9.1 12.5 +3.4 North Dakota 1.4 19.5 +18.1
Florida 12.9 11.4 -1.8 Ohio 4.7 10.4 +5.7
Georgia 10.7 16.8 +6.1 Oklahoma 2.0 19.2 +17.2
Hawaii -- 24.2 -- Oregon 14.6 16.2 +1.6
Idaho 0 28.1 +28.1 Pennsylvania 19.9 25.7 +5.8
Illinois -- 7.5 -- Rhode Island 3.1 0 -3.1
Indiana 9.0 8.3 -0.7 South Carolina 15.2 22.0 +6.8
Iowa 16.4 7.7 -8.7 South Dakota 9.5 21.3 +11.8
Kansas 13.1 22.3 +9.2 Tennessee 5.0 23.3 +18.3
Kentucky 0.4 11.7 +11.3 Texas 10.3 21.9 +11.6
Louisiana -- 26.4 -- Utah 7.2 12.0 +4.8
Maine 8.4 12.0 +3.6 Vermont 18.7 29.0 +10.3
Maryland 9.9 14.5 +4.6 Virginia 8.2 20.2 +12.0
Massachusetts 0 19.1 +19.1 Washington 10.2 23.7 +13.5
Michigan 0 0 0 West Virginia -- 15.0 --
Minnesota 5.9 8.8 -2.9 Wisconsin 3.0 6.6 +3.3
Mississippi 14.3 -- -- Wyoming 2.1 7.5 +5.4
Missouri 8.9 19.6 +10.7 US & Territories 7.8 15.8 +8.0
Source: Computed from statistical reports of the American Council on Education.
Most striking is that, in many states, substantial numbers of certificates are now being earned by 16-year-olds. In 1990, there were 30 states where less than 1 percent of GED certificates went to those who were age 16; by 2000, the number of states had dropped to 13. For ages 16 and 17 combined, typical ages of dropping out of high school, there were 26 states in 1990 where less than 10 percent of certificates were awarded at those ages; the number of states fell to 10 in 2000.
The variation among the states is considerable. In 2000, there were still two states where no certificates were awarded to 16- and 17-year-olds, and seven where 25 percent or more of certificates went to individuals in that age group. No state reached 25 percent in 1990. The 1990 and 2000 percentages are shown in Table 4, together with the change between the two years.
33
Among the states reporting in both years, declines occurred in the percentage of certificates awarded to 16- and 17-year-olds in only six states: Connecticut, Florida, Indiana, Iowa, Minnesota, and Rhode Island, ranging from declines of 0.7 percent to 8.7 percent. Two states were unchanged at 0 percent: Michigan and Nebraska. The rest had increases, ranging from 1.1 percentage points in Oregon to 28.1 in Idaho (Idaho was at 0 percent in 1990). Nine states had increases of 15 percentage points or more.
These are very substantial shifts in the award of GED certificates to high school-age youth. However, the reasons for these shifts are not yet pinned down. There has been no expansion of second-chance op-portunities in community-based organizations or in support from the Department of Labor’s workforce training programs; over the past quarter century there has been a large decline in the sources of preparation for the GED.
The number of alternative schools has grown—or at least a lot more is heard about them—over the 10-year period, although they have been surveyed only once, and that in the 2000-2001 school year (see discussion on pages 20–21.) That survey disclosed that 91 percent of these alternative schools were offering a curriculum for regular high school graduation. These percentages varied little, either by poverty concen-tration of the school district or by minority students enrolled in the district. The report on alternative schools is silent about any programs in these public schools where a GED test-preparation program was of-fered instead of a curriculum leading to a high school diploma, although that option is possible.
The speculation is considerable, and there is some evidence that high schools, likely feeling the pressure of the test-based accountability movement and the increased use of exit exams, have diverted students to programs that prepare for the GED.34
An example is Park Lane and two other high schools in New York City. Under orders from the may-or, these schools had to readmit the students who were transferred. Florida schools have been “referring” high
school students who are behind academically to GED programs, according to John Merrow on the Novem-ber 30, 2004, PBS Newshour Program. If students are referred, Merrow says, they are not counted as drop-outs and do not affect the schools’ graduation rates—a measure included in the accountability system. In one high school in Orlando, 445 students were referred in the prior year, of whom 315 were actually enrolled in a GED program, with 135 earning a GED certificate. Across the state, says Merrow, such transfers rose to 17,144 last year, up from 11,615 the prior year.
There is also speculation that more students are, on their own, dropping out under the more intense academic pressure, and some of them may be finding their way to GED preparation programs. There may be multiple reasons for this increase in high school-age youth going into GED programs. It would be desirable to get a clear understanding of what is happening.
The developments in high school completion rates and high-school-age youth entering GED program are, however, compatible. In the above analysis of trends in high school completions from 1990 to 2000, declines occurred in the completion rate in all but five states. However, there is no particular pattern in terms of the magnitude of the changes in youthful GED certificate awards relative to the magnitude of changes in high school completion rates. Of course, any connection between academic standards, school completion, and award of GED certificates would likely be disclosed only through in-depth analysis within individual schools and school districts. Putting aside the unan-swered question of why the award of GED certificates has increased over the decade, here is one clear case where opportunities—or the taking advantage of exist-ing opportunities—have grown for young teenagers who are not enrolled in high school and who are with-out a regular high school diploma. By recent actions of the American Council on Education, described earlier, the GED program has been strengthened. Perhaps it is emerging as a very significant factor in increasing second-chance opportunities at these young ages.
34 See a discussion of this in the recent ETS report Unfinished Business: More Measured Approaches in Standards-Based Reform, Policy Infor-mation Report, Policy Information Center, Educational Testing Service, January 2005.

34
The reasoning and research of Duncan Chaplin, referred to above, offers the possibility that there is an unintended consequence of the GED program. By making it more accessible to high school-age youth than it used to be, it is drawing them out of high school—encouraging them to follow Plan B rather than Plan A. Of course, a number of factors may be involved.
The Job Corps
The Job Corps, based on the concept of the Civilian Conservation Corps of the 1930s, was established in 1964 as part of the Economic Opportunity Act. The Job Corps, originally a residential program designed to remove youth from their negative inner-city en-vironment, is no longer residential for all enrollees. The program is operated through partnerships with corporations, labor organizations, trade associations, and national volunteer groups. Disadvantaged 16- to 24-year-olds enroll to learn a trade, earn a high school diploma or a GED, and get help in finding a job. Stu-dents receive follow-up support for up to 12 months after graduation.
Currently, 119 Job Corps centers serve more than 60,000 new enrollees annually. A number of evalua-tions of Job Corps’ effectiveness over its long life have shown positive results. The latest evaluation was by Mathematica Policy Research, Inc., reported in 2001. Completing Mathematica interviews over 48 months were 6,828 youth who went through the program and 4,485 like them who served as controls. Some of the findings were that Job Corp graduates, compared to controls,
•· Were more likely to be employed;
•· Had higher paying jobs;
•· Received less public assistance;
•· Had lower arrest and conviction rates; and
•· Were more healthy.35
YouthBuild USA
Founded in 1990, YouthBuild USA is primarily funded by the U.S. Department of Housing and Urban Devel-opment, but several other funders are also involved. The program targets unemployed and underemployed young people ages 16 to 25 “who work toward their GED or high school diploma while learning construc-tion skills by building affordable housing for homeless and low-income people.” Strong emphasis is placed on leadership development, community service, and the creation of a positive mini-community of adults and youth committed to each other’s success.
The program has involved more than 40,000 stu-dents who have created more than 12,000 affordable housing units. The components of the program in-clude, among others:
• Academic remediation, including preparation for the GED, high school diploma, or college;
• Skills training, including preparation for construc-tion-related jobs;
• A visible community role in rebuilding communities;
• Personal counseling from respected role models; and
• Support after graduation.
The evaluation is based on a before-and-after com-parison of the same enrollees. The results are shown in Figure 7.
Seventy-five percent of graduates in the study were either in postsecondary education or in jobs averaging $10 an hour. Seventy percent were registered to vote, and nearly half voted.36
35 Information on the evaluation results is drawn from a summary in Child Trends’ Guide to Effective Programs for Children and Youth, www.childtrends.org/lifecourse/programs/jobcorps.htm. See also Job Corps Web site and Mary Silva, “Job Corps” in Making Connections, Marion Pines (ed.), Sar Levitan Center for Social Policy Studies, 1999.
36 The evaluation information used here is from Andrew Hahn and James Earl Davis, Life After YouthBuild, YouthBuild USA, June 2004. The evaluation results are from studies conducted by these authors at Brandeis University and Temple University, in collaboration with Youth Build. See also American Youth Policy Forum, 1998, pp. 91-92.

35
No GED or Diploma
Used hard drugs
Sold hard drugs
Used alcohol
Arrested
Convicted of felony
0 20 40 60 80 100
78
41
30
6
38
9
76
43
56
26
27
9
Before YouthBuildAfter YouthBuild
Percentage
Participant Status:
Figure 7:Results of the YouthBuild Program
Source: Andrew Hahn and James Earl Davis, Life After YouthBuild, YouthBuild USA, June 2004.
The Center for Employment Training (CET)
The Center for Employment Training (CET) traces back to a program established in San Jose, California, in 1967. It is now a national network of 33 vocational education centers and is operating in 12 states. CET is responsible for the training and placement into jobs of more than 100,000 of its enrollees. Over half of the funding is from local, state, and federal governments, and the rest is from the private sector.
CET provides job training, and in this context, pro-vides the necessary educational instruction, tailored to each student’s needs. The program also provides a lot of support services. Enrollees can be from age 17 ½ to 60, and over half are high school dropouts.
CET is unique in many respects. There are no prerequisites for entry, instruction is individualized and self-paced, and there is open entry and open exit. Courses are carefully related to the needs of both the employer and the enrollee. There is no diploma; the focus is on helping enrollees get a job and a first pay-check.37
CET has been evaluated a number of times throughout its history. One significant evaluation was performed by the Manpower Development Research Corporation (MDRC). In its control group-based study of 13 projects, only the CET program showed good re-sults. In a five-year study conducted by the Rockefeller Foundation, CET “was the only one (of the programs studied) to increase employment and wages signifi-cantly.” There are also other positive evaluations.38
37 www.cetweb.org38 Andrew Forbes, “The Center for Employment and Training,” in Making Connections, edited by Marion Pines, the Sar Levitan Center for
Policy Studies, 1999. See also the CET Web site.

36
Youth Corps (Service and Conservation Corps)
These youth corps are descended from the Civil-ian Conservation Corps of the 1930s, which did the work that resulted in many of the parks and public facilities still in use today. A program revival started in 1957, then came the Youth Conservation Corps with enrollment peaking in the mid-1990s at around 32,000 and, later, the Young Adult Conservation Corps, which enrolled some 25,000 each year. Federal budget reductions ended this significant youth second-chance program.39
Starting with California, many individual states continued such efforts. As members of the National Association of Service and Conservation Corps, there are 106 Service and Conservation Corps operating in 31 states and the District of Columbia. They enroll 23,000 youth annually and provide more than 14.5 million hours of service each year. The corps have mo-bilized 129,000 community volunteers in their opera-tion.
While individual corps differ, they will typically provide:
• Introduction to the world of work;
• Job training and job searches;
• Basic remedial education, including study for a GED (using both hands-on learning and traditional classroom education methods); and
• Life-skills training.40
An evaluation by Abt Associates, using control groups, found that corps participants had:
• Significant employment and earnings gains, with positive outcomes particularly striking for African American men;
• Lower arrest rates;
• Fewer out-of-wedlock pregnancies; and
• The generation of $1.60 in immediate benefits for every $1.00 of costs.41
Youth Opportunity Grants
Youth Opportunity Grants is a program under the Workforce Investment Act. These grants have evolved over the many years of the U.S. Department of Labor’s efforts to help high school dropouts and other youth with employment needs—going all the way back to the Manpower Development Act of 1962. According to the Department of Labor’s Web site, 36 youth grants have been awarded to urban, rural, and Native American communities.42
This grant program, not based on a formula, attempts to concentrate resources in specific high-poverty communities. Grants are not based on the income of individual families; all youth who reside in the target areas are eligible. Those served are followed for two years after they leave the program. The goals of the program were comprehensive: to increase the employment rate, high school graduation rate, and college enrollment rate of both in-school and out-of-school youth in 2002. The target for the program was to enroll 44,000 youth, and in the second year of the program, the enrollment had reached 36,000. These programs are still operating in many places, and will continue to do so, until their three-year grants run out. Then the program will disappear.43
39 For a short history, see Kathleen Seltz, “Youth Service and Conservation Corps,” in Making Connections, Marion Pines, Editor, Sar Levitan Center for Social Policy Studies, 1999.
40 American Youth Policy Forum, Some Things Do Make A Difference, 1998, pp. 95-96.41 www.nascc.org42 www.doleta.gov/youth_services/programs_Services.cfm43 This information is taken from a description provided by the American Youth Policy Forum at a program held on January 17, 2002. See
www.aypf.org/forumbriefs/2002/fb011702.htm.
37
The Community College
The community college has a role—a significant one now, and a potentially larger one in the future—in getting high school dropouts through to a high school diploma or a GED. It can also provide educational advancement without such degrees, with students working toward a certificate or degree program. Com-munity colleges are both ubiquitous and flexible; they have become institutions that very often identify needs and set out to meet those needs.44
This author’s views of their potential role in what I called “backstopping the high school” was set forth in 1977. I thought that it would be hard to attract these now older youth back to the high schools they left; and often, the youth would not be welcome there, anyway. Many might, however, be interested in going to a com-munity college to resume and finish their high school education—and perhaps continue on.
Some community colleges were, even then, flex-ible about their educational and age requirements for admission, although I was not able to obtain statistics on such requirements. The proposition was as follows:
Community and junior colleges could design and implement education-experience programs for youth without high school educations, leading toward certification of a high school education… This would be an alternative to regular high school… To the extent the public school decides to compete (to retain or re-admit students) so much the better . . .45
This still makes sense, and statistics on the specif-ics of admissions and enrollment policies still are not uniformly available. We do know that there is a large variation among colleges and among states. California (which has about a fourth of all community college students in the country) allows 19-year-old dropouts to register, depending on a judgment by the college as to whether the student can benefit. Whether a student can get in without a high school diploma may depend on the program; a nursing program, for example, may have higher requirements than some other oc-cupational program. And research shows that stated requirements may be waived, depending on individual circumstances. There are also differences between ad-mission for credit courses, and enrollment in a certifi-cate program, for example.46
Community colleges are already deep into provid-ing high school-level instruction, instruction that the colleges say high schools should have given to the students before they graduated. Of all community college entrants who were 12th graders in 1992, we know, for the year 2000, how many received “remedial instruction” before being eligible to take college credit courses. The percentage receiving such instruction in public two-year colleges is as follows:
• Any remedial reading – 17.8 percent
• Two or fewer courses of remedial mathematics only – 15.5 percent
• Two or more other remedial courses, but no remedial reading – 21 percent
• One remedial course, not reading or mathematics – 7 percent
• No remedial courses – 38.9 percent.47
44 For an overview, see Richard J. Coley, The American Community College Turns 100: A Look at its Students, Programs, and Prospects, Policy Information Report, Policy Information Center, Educational Testing Service, March 2000.
45 Paul E. Barton, Designing Youth Policy: Starting Points, National Manpower Institute, 1977, p. 15.46 Thomas R. Bailey, Director, Community College Research Center, personal communication, October 8, 2004.47 The Condition of Education 2004, page 140.

38
Thus, six out of 10 students took remedial courses. Community colleges know how to teach high school courses, and remedial courses are also taken in four-year colleges, to a lesser but still substantial degree.
Another perspective on community college in-volvement in high school instruction is provided by NELS:88/2000 (the National Educational Longitudinal Study of 1988, conducted by NCES). Of the students in that survey who were scheduled to graduate from high school in 1992, we know that by 1994, over a fourth (26.4 percent) had some postsecondary education experience. This was true for two out of five dropouts who had subsequently obtained a high school diploma (regular or a GED). It was also true of 13.7 percent who by 1994 had not obtained a high school diploma, more than half of whom were enrolled in or completed a certificate program. While it is not possible to sort out from these statistics the precise nature of commu-nity college involvement with dropouts, the involve-ment is clearly already substantial. More data from NELS:88/2000 are provided at the end of this section.
From time to time one sees stories about specific colleges. For example, in June of 2004, The New York Times carried a story about how LaGuardia Com-munity College was “Making GED Programs More Than Test Prep.”48 In the GED program at LaGuardia, students are expected to stay for longer blocks of time than is typical of such programs, and to do homework. Interestingly, the article is also about how City Univer-sity is working to enrich its GED program; four-year colleges are also prospects for high school dropouts.
The Washington Post ran a story about Michael Copeland, who failed to pass all his tests to get his high school diploma, but is still on his way to Garden City Community College. It is a college known for its football team, says the Post, and Copeland, a “stunning running back” in high school, is expected to try out for the team, and expected to major in education. Com-menting on this youth’s experience, President Robert Templin, Jr., of Northern Virginia Community College (NVCC), called such continued preparation at a com-munity college a good option for students like Cope-land. Timplin says NVCC admits anyone older than 18, even those without a high school diploma.
The question is whether it is possible to build upon the programs already showing success by making such opportunities better known, and whether this can evolve toward policies and practices that can get more students their diplomas and enlarge their opportuni-ties to continue.
48 Karen W. Arenson, New York Times, June 16, 2004.

39
Education After Dropping Out: One Cohort’s Experience
From NELS:88/2000, we know a lot about what hap-pened, in terms of further education, for youth who were in the cohort of students to graduate in 1992 but who dropped out before then. A follow-up survey of that cohort of students was conducted in 1994.49 While that survey will not tell us what happened to recent high school graduates or dropouts, there is no reason to expect significant changes in experiences relative to these earlier graduates and dropouts; the general opportunity structure has likely not changed much in these years. These earlier school leavers left school in a weak economy, as did those who left school three or four years ago.
First, the completion of high school was very much associated with socioeconomic status. Almost three-quarters (74 percent) of students whose families were in the highest socioeconomic quartile completed high school. This is in very sharp contrast to the lowest so-cioeconomic quartile, where just 33 percent completed high school. This is consistent with the data presented in this report on the correlates of high school gradua-tion. For dropouts, getting a diploma or a GED certifi-cate also varies with socioeconomic status.
There is educational life after high school for a significant proportion of those who left school with-out earning a diploma; indeed, the prospects are not as bleak as may be generally imagined. Among all the dropouts who would have graduated in 1992, 15.5 percent had somehow earned a regular diploma by 1994, and 28.5 percent had obtained a GED, for a total of 44.0 percent. Further, 23.7 percent reported themselves as still trying to earn a diploma; they still seemed motivated and perhaps likely to take advan-tage of opportunities that may open for them. Even many of these dropouts whose grade point average was D or F during high school were moving on; 35.5 percent had gotten a diploma or a GED—although they were much more likely to get a GED than a diploma.
49 Jennifer Berktold et al., Subsequent Educational Attainment of High School Dropouts, National Center for Education Statistics, NCES 98-085, 1998.

40
Economic Consequences
In the economic structure of the post World War II period, there could be a decent wage-earning life ahead for someone, particularly a male, who did not complete high school, most likely in the relatively well-paying manufacturing sector. Inexorable change has occurred over the decades since, however, with the economy switching toward services and away from manufacturing. And, with this switch, the prospects for those with little education have deteriorated. Here, we will look at where dropouts are found today—or, very often, how they have been lost in the world of employment, or are out of the labor force altogether. Then we will look at the career- and family-launching years of age 25 to 34 to see what has happened to the earning power of this group of individuals.
Lost Travelers?
In 2003, 1.1 million 16- to 19-year-olds and 2.4 million 20- to 25-year-olds did not have a high school diploma and were not enrolled in school, for a total of 3.5 mil-lion.50 Most of these youth, at best, are headed for a life of sporadic employment and low wages. For them, establishing a stable family and raising children who can make it in our society and economy can be prob-lematic, given the long-term decline in the earnings prospects of dropouts, both in absolute and relative terms.
For a very large proportion of these dropouts, their present plight is a harbinger of what is to come. Only four in ten of these 16- to 19-year-olds are employed, as are less than six in ten 20- to 24-year-olds—those in the early marrying and family formation period. Over four in ten of the younger group are not even in the la-bor force; meaning they are not employed and are not looking for work. Of these, some may be discouraged and may have given up looking. This is true also for three in ten 20- to 24-year-olds. Some are single par-ents who are in a welfare support system, and others have found alternative sources of income in a sublegal economy.
Even high school dropouts who are employed, compared to those who are better educated, will be the most affected by future economic slowdowns, the constant change in the structure of the economy, and ever-advancing technology. A steadily expanding young prison population will be drawing disproportionately from this population and will be returning similarly undereducated young people back to society, where they will face the additional employment handicap of having been in prison.
The employment experience of Black youth who are not in school and who do not have a high school diploma is particularly grim. While 57 percent of White youth and 61 percent of Hispanic youth be-tween the ages of 16 and 24 are employed, only 35 percent of Black youth in this age group have jobs (see Figure 8). Forty-five percent of the Black 16- to 24-year-olds report that they are not in the labor force; they are not employed and not looking for work. The rates at which such youth are employed or are not in the labor force has changed little since 1990.
The bleakness should not be overdrawn, however. Through motivation and perseverance, the numbers, if not the percentages, of those who rise up and succeed will likely be considerable. Mobility among the educa-tion and economic strata still exists—in both direc-tions. The number of successes can be increased if op-portunities for second-chance education and training are enlarged, and if current adverse trends discussed in this report are turned around.
These lost youth will wander without a map on the edges of the economy and could be at risk of falling prey to alternatives to earning a living in the regular economy. Without interventions that will change their course, they are likely to father and mother children ill-equipped to do better, thus perpetuating a down-ward cycle of economic or social failure. The youth represented in these numbers have already left school; new retention programs will not help them.
50 Data provided by Teri Morisi of the U.S. Bureau of Labor Statistics, July 14, 2004. The terms “high school graduates” and “high school diplomas” include those who obtained a GED certificate.

41
Earning Power in the Young Adult Years
So far, we have examined the labor force status of 16- to 24-year-olds. How are 25- to 34-year-old dropouts doing in this period of life that is so critical for estab-lishing one’s self in the economy and forming families?
A close look at the position of dropouts aged 25 to 34 over the past three decades reveals an increasingly grim picture.51 That picture is different for male and female dropouts, however, with the earnings of male dropouts plunging much more than the earnings of their female counterparts. While the earnings of fe-male dropouts decreased to a lesser extent than that of male dropouts, they still remain well below the earn-ings of male noncompleters.
Hispanic
White
Black
Black
Hispanic
White
30 40 50 60 70
61
57
35
45
32
31
Employed:
Not in labor force:
Percentage
In 1971, males age 25 to 34 without a diploma earned an average of $35,087 (in 2002 constant dol-lars) for working full time for a full year. Their earn-ings dropped to $22,903 in 2002, a decline of 34.7 percent. By 1992, earnings had already declined to $22,318, and stayed right around that level for the next decade, with the lowest point at $21,571 in 1996.
The comparable annual earnings for females with-out a diploma were $19,888 in 1971—just 57 percent of male earnings. Female earnings stayed steady until 1979, and then began to decline to $15,965 in 1991. With some fluctuations, earnings rose to $17,114 in 2002. The trends for males and females together brought female earnings to 74 percent of male earn-ings in 2002, up from the 57 percent in 1971.
51 Data in this section of the report are from The Condition of Education 2004, National Center for Education Statistics, Table 14-1, 14-2, and 14-3.
Figure 8:Percentage of 16- to 24-Year-Olds Not in School and Without a High School Diploma, October 2003
Source: Unpublished tabulation, U.S. Bureau of Labor Statistics, October 2003, from [email protected], July 14, 2004. Note: “White” and “Black” include Hispanics in these tabulations.

42
The earnings of male high school graduates also dropped between 1971 and 2002 by 27.9 percent, but this was less than the decrease seen for dropouts. While male dropouts had 85.3 percent of the earnings of graduates in 1972, their earnings were just 77.3 percent of graduates in 2002. Female graduates did better in holding up their earnings, with a decline of just 7 percent for the period. Female dropouts also lost ground relative to female high school graduates.
While dropouts clearly earn less and have fared worse than high school graduates, high school gradu-ates also have taken an economic beating over this three-decade period, with earning declines more pronounced for males than for females. But graduates have more paths open to them, since they are qualified for entrance into postsecondary education.
The truth is that the economy and labor market have also been unkind to those 25- to 34-year-olds who have some college. Earnings for males in this group dropped by 20.5 percent, and the earnings of their female counterparts decreased by 6.7 percent. This may come as a surprise to many. This population does, however, have higher average earnings than high school graduates, particularly in the case of males.
It may come as an even greater surprise that the earnings of male 25- to 34-year-olds with bachelor’s degrees or higher also lost ground between 1971 and 2002, with earnings dropping from $51,218 to $48,955, or a decline of 4.4 percent. Females with these de-grees, however, gained ground, with average earnings increasing by 10.9 percent. Their earnings, however, remained substantially below their male counterparts.
In a situation where a very large proportion of those employed have seen diminished earnings, the advantages of getting a diploma, or just some col-lege, have to be expressed on a relative basis; in other words, the earnings of dropouts are declining at the highest rate. This, of course, makes the need to get a high school diploma no less pressing—and getting one is a step toward being able to continue one’s educa-tion.
To put a face on these abstract statistics, where do these average annual earnings for working full time for a full year put one? It should be noted that these are the dropouts who are succeeding; the great majority is doing less well. The $22,903 average earnings for male dropouts is about at the poverty threshold for a five-person family, and about $4,240 above it for a couple with two children. For female dropouts, the average of $17,114 would keep a three-person family out of pov-erty, but not a four-person family. So the average full-time employed dropout in this age group, working full time for a full year, is hovering around poverty-level earnings in terms of supporting a family. Most drop-outs will not reach that level. What is seen in terms of rising family income has, of course, come from more and more second-earner family members, and third and fourth earners as the children in the family go to work. This comparison of earnings and poverty levels is made to relate earnings to what they mean in today’s economy.

43
Taking Stock
This is a story of losing ground. High school comple-tion is in decline. Completion rates vary considerably among the states, from a high of 88 percent to a low of 48 percent. The rates are much lower for minorities, and the consequences are becoming more severe.
The 1990s saw a decline in completion rates in all but seven of the states, in a period where the national focus was on improving student achievement through standards-based reform and test-based accountability. Additionally, the adult GED program has increasingly shifted toward high school-age youth. Yet, no clear pattern emerges that ties standards and tests, declin-ing completion rates, and increasing GEDs at age 16 and 17 together. It is possible, however, that increased availability of the GED to high school-age students is encouraging some to leave school to get their certifi-cate by just taking a test. There is clear evidence that more of the dropping out has shifted down to between the ninth and 10th grades. Dropouts are getting young-er, and, as a result, are even more vulnerable in the economy.
Certain characteristics of parent and student lives underlie conditions for dropping out of school—in-cluding parent income and education, whether a student lives with both parents, and students chang-ing schools frequently. The variation among states in such conditions is statistically very closely tied to the variation in high school completion rates. But as can be seen from the analysis in this report, some states do considerably better than such conditions would pre-dict, and some states do considerably worse. Dropping out is not in some way preordained, and what happens in the school can overcome much. A closer look at the experiences in these states might shed more light on approaches that make a difference.
While it might be thought that school guidance and counseling staff would be strong players in the fight to retain students in school, this analysis concludes that, on the average, at least, this can hardly be the case. There are too few counselors, and they have too many other assignments: helping in the transition to college, dealing with student behavior, administering account-ability testing, and monitoring hallways and cafeterias. These activities consume a very large proportion of the time of guidance and counseling staff. Yet, given enough time, they may be able to help keep more students enrolled, if schools were adequately staffed to allow this to happen.
Beyond guidance and counseling, the report de-scribes several programs that focus on school reten-tion. Evaluated and found to improve retention, they are a rich source of experience for school systems to draw upon. Also, success in raising achievement in the early grades should pay off in more students complet-ing school.
When students do drop out of high school, what opportunities for resuming education and training are there for them to drop into? There is the GED, but either the dropouts study for it on their own or find a second-chance program to enroll in. A considerable number of such programs, such as the Job Corps, YouthBuild, and CET, have been shown to work. Com-munity colleges also have a significant role to play. However, the general situation is one of very limited opportunities, wholly or partially supported by the federal government, no more than 300,000 or so each year for economically disadvantaged 16- to 24-year-olds, and likely no more than 100,000 for teenage dropouts. There has been a steep decline in federal investment, from about $15 billion in the late 1970s down to about $3 billion today. There are also some locally supported programs, but the number of youth they serve is not known, nor is it known whether the numbers served are growing or declining.

44
Our nation guarantees funding of education through grade 12, but there is some fine print in this social contact: It lapses at age 19, 20, or 21, depending on the state. If all youth chose to complete school, the added cost would be many billions of dollars. Could we think of this commitment as money in the bank for dropouts to draw on if they decide to pick up their education again? Those billions—and many more—are being paid out now to deal with the economic and social costs of youth not completing school.
At the same time that the dropout rate is increasing and out-of-school education and training opportuni-ties are dwindling, the economic status of young drop-outs has been in a free fall since the late 1970s. Em-ployment and earnings prospects have declined, with earnings declining in absolute terms and also relative to the incomes of those with more education. And for dropouts now aged 25 to 34, at the period of economic establishment and family formation, earnings of even those who work full time for a full year have dropped steadily—to averages around the poverty line for a family with children.
On the school retention front, the nation is increas-ingly focused on improving the quality of student schooling and raising achievement. The totality of youth preparation for life and for the economy ex-tends also to the third of students not completing high school, whether focused on keeping them in school or on providing second-chance opportunities after leaving.
A strong interest is now emerging in high school reform. So far, the emphasis has been on increasing the readiness of high school graduates to do college-level work, or to go directly into academically demand-ing jobs. Also, there is strong interest in making better use of the 12th grade. As important as these efforts are, they do not get at the dropout problem that occurs earlier in high school.
For those who do drop out, there are some second-chance programs available with good track records. New ways to design programs do not have to be invented; much can be learned from prior successful experiences.
One-third of the nation’s young people is a very considerable proportion. Almost 45 years ago, James Conant said that the dropout problem was “social dynamite.” The explosion has occurred, and will continue to occur. This is seen in growing prison pop- ulations and increasing welfare costs; in ever lower wages; in a limited labor supply for, we are told, an economy with an increasing appetite for educated workers; and in the likelihood of raising a new genera-tion with dim prospects of doing better—and perhaps doing even worse.
The nation has proven it can focus on improving educational achievement while students are in school. In this there is promise that it can also give such fo-cused attention to keeping them in school until graduation.

45
Appendix A
Estimates of High School Completion Rates by States, 1990 and 2000
The approach used is related to the way the NCES esti-mates high school completion rates for the nation in a statistical series going back to the 1880s. While NCES uses a ratio of the number of diplomas awarded to the number of 17-year-olds, this author has used a combi-nation of 17- and 18-year-olds. The proportion of each was based on NAEP data on the age of high school se-niors at the time of the NAEP 12th grade assessment. The data were aged to see how old the students would be at the time of graduation. Ninety percent would be 17 or 18; of the 17- and 18-year-olds, 23.8 percent would be 17 and 76.2 percent would be 18. These pro-portions were applied to census counts of the number of 17- and 18-year-olds in each state in 1990 and 2000, deriving a cohort of those of graduation age in those years.
Diplomas issued were based on statistics from NCES for 1990 and 2000 for public schools. Data for private schools are collected every other year, and this author used data for 1989 and 1999. Private school graduations are about 10 percent of total graduations, and are steady at the national level; there were 289,000 graduates in 1989 and 273,000 in 1999.
Actually, the use of the 17-year-old population will work well to represent the cohort of graduating age, except when there has been a significant change in the birth rate from one year to the next. This author found that this was the case with the 1990 data, when there were many states with a significantly higher number of 18-year-olds than 17-year-olds. This made it necessary to construct a cohort of both 17- and 18-year-olds.

46
Appendix B
Regression Analysis Used for Predicting State High School Completion Rates
The dependent variable was the state high school completion rate for 2000, as estimated by Paul Barton, and explained in the text of this report. There were three independent variables used in combination to represent socioeconomic status: median household in-come, the percentage of persons over 25 with a bach-elor’s degree or higher, and the percentage employed in managerial or professional occupations. The other variables were the percentage of children under 18 in married-couple families, and the percentage of eighth graders who did not change schools over the prior two years. This latter information was from the National
Assessment of Educational Progress, and available for only 36 states. An additional analysis was performed with the only difference being that instead of eighth-grader school changing, immigration into the state was used as a proxy for mobility. This variable was slightly less correlated with the completion rate than with the school changing rate. This second regression analysis was used in the text for the predicted school completion rate for the remaining states.
This analysis was performed by Frederick Cline of Educational Testing Service.
Variables Included in Model
R R2 Adjusted R2
Std. Error of the
Estimate
Change Statistics
R2 Change F Change df Sig. F Change
1 Median household income Percentage of persons over 25 with a bachelors degree or higherPercentage employed in managerial or professional occupations
.368 .135 .057 8.8805 .135 1.722 33 NS
2 + Percentage of children under 18 in married couple families
.701 .492 .428 6.9150 .356 22.426 32 < .01
3 + Percentage of eighth graders who did not change schools over the prior two years
.763 .582 .514 6.3742 .090 6.660 31 < .05
Dependent Variable: State high school completion rate for 2000
Model Summary for 36 States
Variables Unstandardized Coefficients
B Std. Error Beta t Sig.
(Constant) -38.356 22.257 -1.723 .095
Median household income .001 .000 .059 .299 .767
Percentage of persons over 25 with a bachelors degree or higher
.558 .555 .343 1.004 .323
Percentage employed in managerial or professional occupations
-.538 .747 -.268 -.721 .477
Percentage of children under 18 in married couple families
.697 .220 .576 3.176 .003
Percentage of eighth graders who did not change schools over the prior two years
.756 .293 .354 2.581 .015

Policy Information Report
One-Third of a Nation: Rising Dropout Rates and Declining Opportunities
Listening.
Learning.
Leading.
Visit us on the Web at www.ets.org/research
00263-46448 • U25E5
727243
Policy Evaluation and Research Center
Policy Information Center
46448_one_third_cvr.indd 2-346448_one_third_cvr.indd 2-3 1/24/05 9:51:14 AM1/24/05 9:51:14 AM