one sq.km.: a beijing - montreal comparison
TRANSCRIPT
ONESQKMBEIJING&MONTREAL
a comparative study using sustainability criteriaMCGILL SCHOOL OF ARCHITECTUREARCH521 / 2014
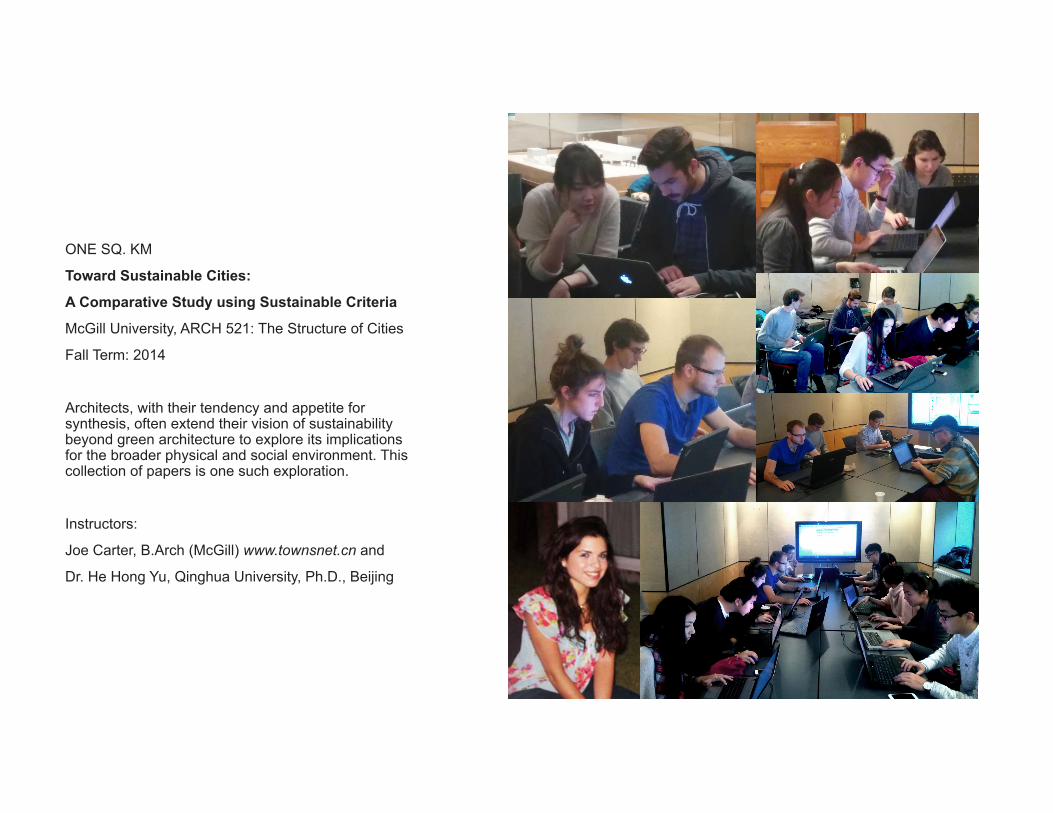
ONE SQ. KM
Toward Sustainable Cities:
A Comparative Study using Sustainable Criteria
McGill University, ARCH 521: The Structure of Cities
Fall Term: 2014
Architects, with their tendency and appetite for synthesis, often extend their vision of sustainability beyond green architecture to explore its implications for the broader physical and social environment. This collection of papers is one such exploration.
Instructors:
Joe Carter, B.Arch (McGill) www.townsnet.cn and
Dr. He Hong Yu, Qinghua University, Ph.D., Beijing
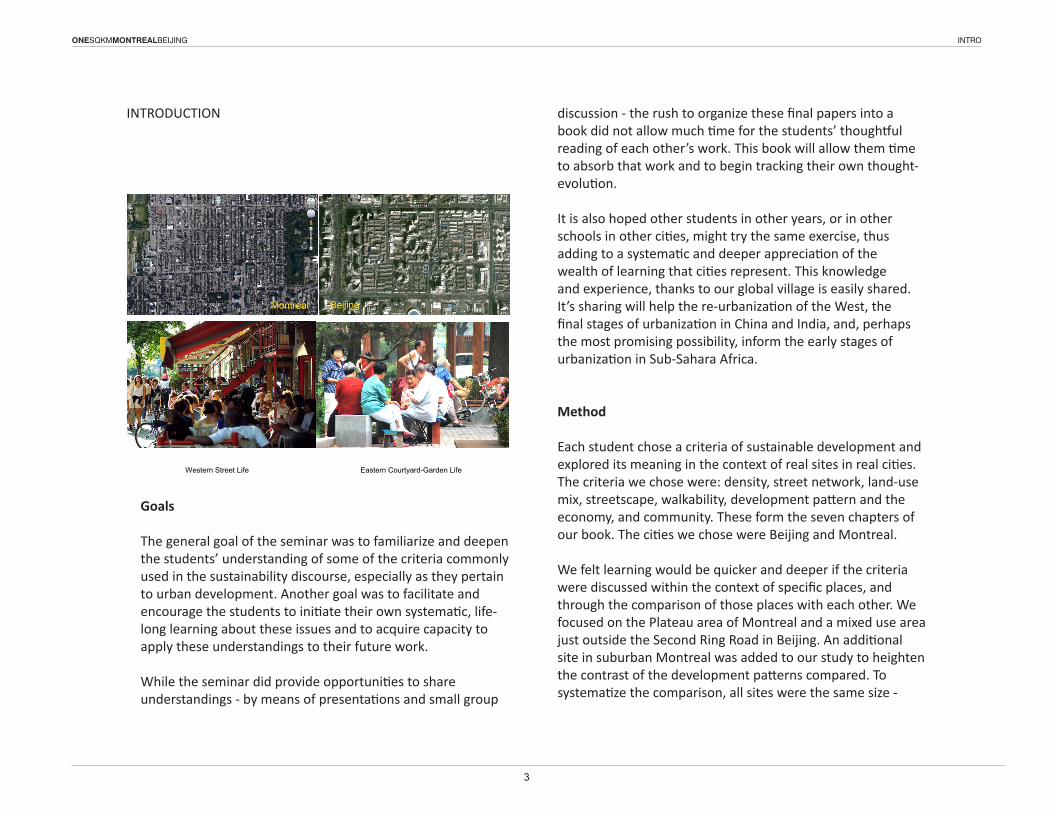
INTRODUCTION
Goals
The general goal of the seminar was to familiarize and deepen the students’ understanding of some of the criteria commonly used in the sustainability discourse, especially as they pertain to urban development. Another goal was to facilitate and encourage the students to initiate their own systematic, life-long learning about these issues and to acquire capacity to apply these understandings to their future work.
While the seminar did provide opportunities to share understandings - by means of presentations and small group
discussion - the rush to organize these final papers into a book did not allow much time for the students’ thoughtful reading of each other’s work. This book will allow them time to absorb that work and to begin tracking their own thought-evolution.
It is also hoped other students in other years, or in other schools in other cities, might try the same exercise, thus adding to a systematic and deeper appreciation of the wealth of learning that cities represent. This knowledge and experience, thanks to our global village is easily shared. It’s sharing will help the re-urbanization of the West, the final stages of urbanization in China and India, and, perhaps the most promising possibility, inform the early stages of urbanization in Sub-Sahara Africa.
Method
Each student chose a criteria of sustainable development and explored its meaning in the context of real sites in real cities. The criteria we chose were: density, street network, land-use mix, streetscape, walkability, development pattern and the economy, and community. These form the seven chapters of our book. The cities we chose were Beijing and Montreal.
We felt learning would be quicker and deeper if the criteria were discussed within the context of specific places, and through the comparison of those places with each other. We focused on the Plateau area of Montreal and a mixed use area just outside the Second Ring Road in Beijing. An additional site in suburban Montreal was added to our study to heighten the contrast of the development patterns compared. To systematize the comparison, all sites were the same size -
INTRODUCTION
western Street Life Eastern Courtyard-Garden Life
Goals The general goal of the seminar was to familiarize and deepen the students’ understanding of some of the criteria commonly used in the sustainability discourse, especially as they pertain to city development. Another goal was to facilitate and encourage the students to initiate their own systematic, life-long learning about these issues and to acquire capacity to apply these understands in their future work. while the seminar did provide opportunities to share understandings, by means of presentations and small group discussion, the rush to organize final papers into a book did not allow much time for thoughtful reading of each other’s work. This book will allow the students to begin tracking their own thought-evolution and allow them time to absorb the work of their fellow students. It is also hoped other student in other years and other cities might try the same exercise, thus adding to a systematic and deeper appreciation of the wealth of learning that cities represent. This knowledge and experience, thanks to our global village is easily shared. It’s sharing will help the re-urbanization of the west, the final stages of urbanization in China and India, and, perhaps the most promising possibility, inform the early stages of urbanization in Sub-Sahara Africa.
ONESQKMMONTREALBEIJING INTRO
3
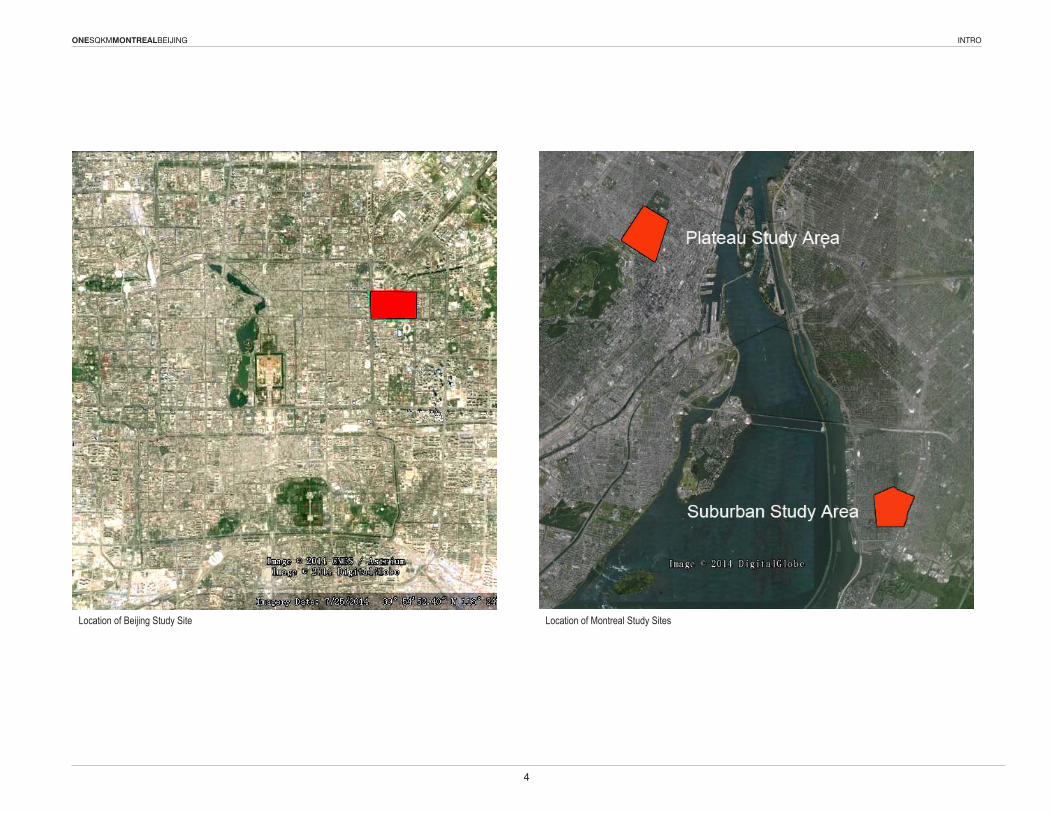
Location of Beijing Study Site Location of Montreal Study Sites
ONESQKMMONTREALBEIJING INTRO
4
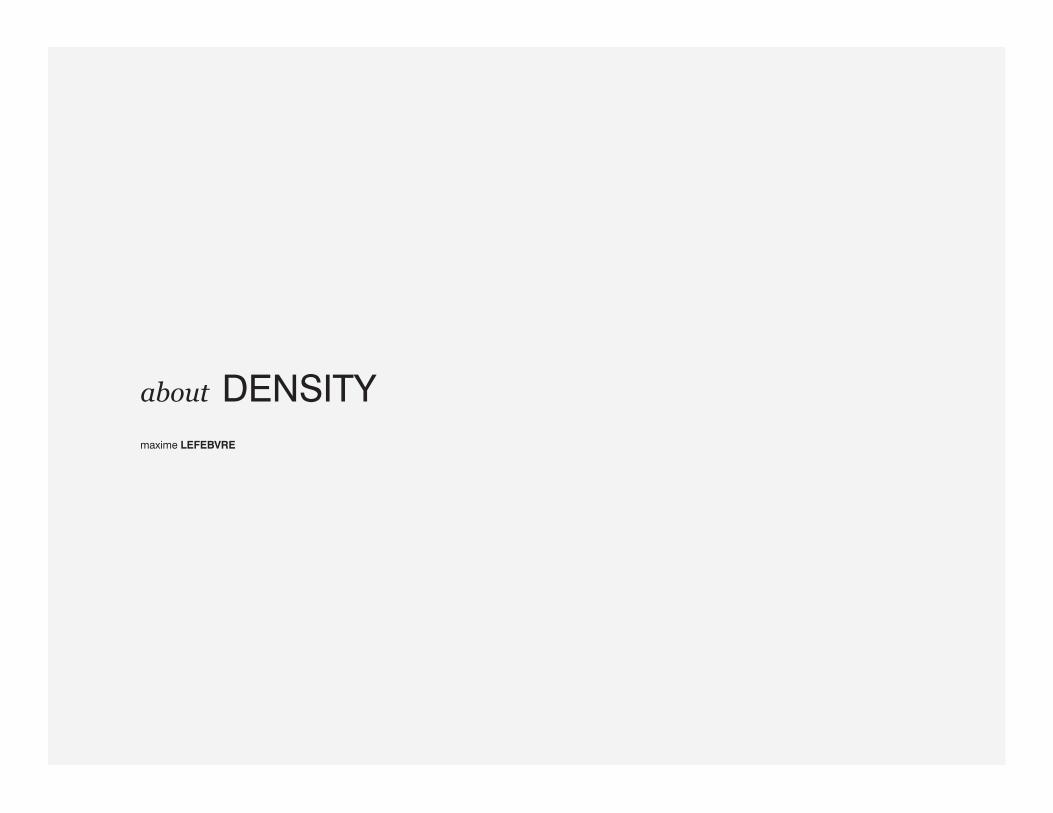
Suburb model
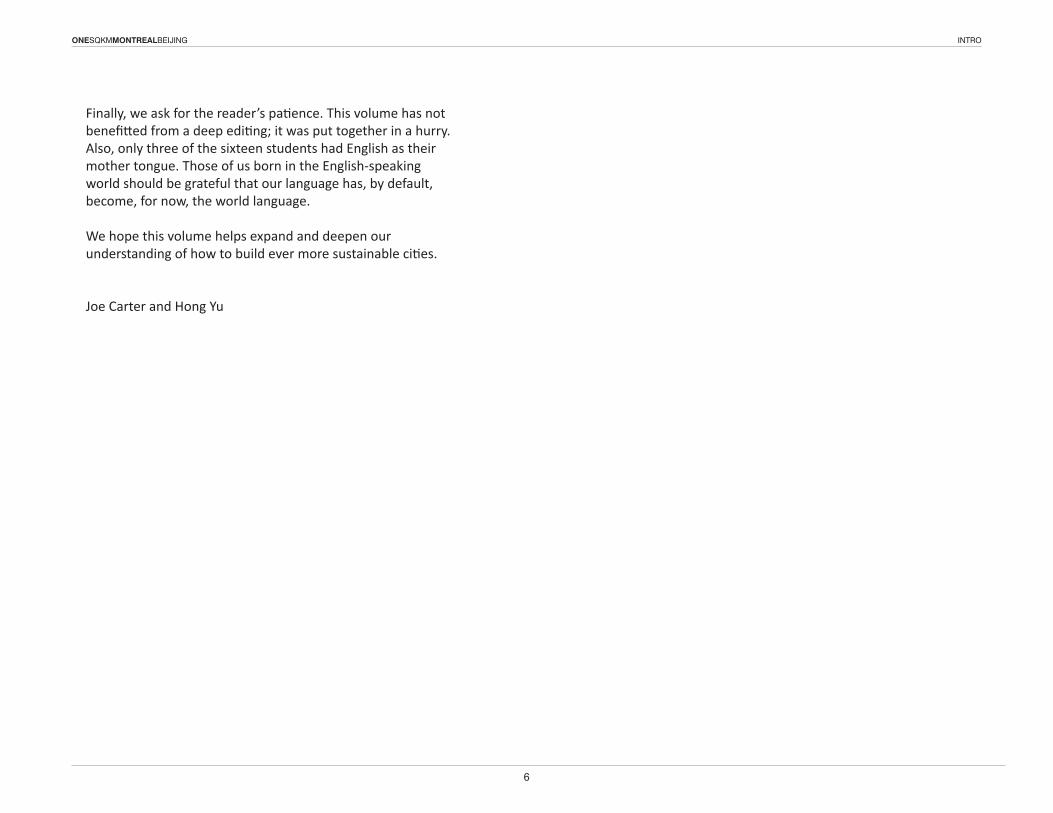
Montreal Plateau model
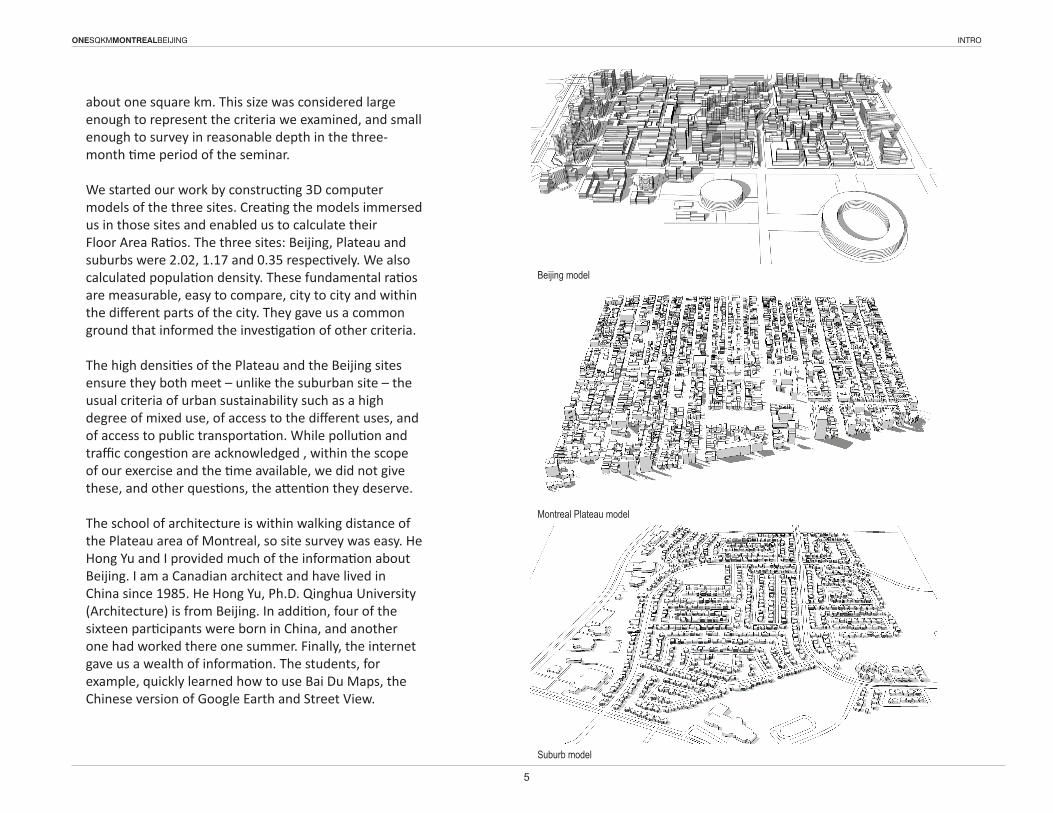
Beijing model
about one square km. This size was considered large enough to represent the criteria we examined, and small enough to survey in reasonable depth in the three-month time period of the seminar.
We started our work by constructing 3D computer models of the three sites. Creating the models immersed us in those sites and enabled us to calculate their Floor Area Ratios. The three sites: Beijing, Plateau and suburbs were 2.02, 1.17 and 0.35 respectively. We also calculated population density. These fundamental ratios are measurable, easy to compare, city to city and within the different parts of the city. They gave us a common ground that informed the investigation of other criteria.
The high densities of the Plateau and the Beijing sites ensure they both meet – unlike the suburban site – the usual criteria of urban sustainability such as a high degree of mixed use, of access to the different uses, and of access to public transportation. While pollution and traffic congestion are acknowledged , within the scope of our exercise and the time available, we did not give these, and other questions, the attention they deserve.
The school of architecture is within walking distance of the Plateau area of Montreal, so site survey was easy. He Hong Yu and I provided much of the information about Beijing. I am a Canadian architect and have lived in China since 1985. He Hong Yu, Ph.D. Qinghua University (Architecture) is from Beijing. In addition, four of the sixteen participants were born in China, and another one had worked there one summer. Finally, the internet gave us a wealth of information. The students, for example, quickly learned how to use Bai Du Maps, the Chinese version of Google Earth and Street View.
ONESQKMMONTREALBEIJING INTRO
5
Finally, we ask for the reader’s patience. This volume has not benefitted from a deep editing; it was put together in a hurry. Also, only three of the sixteen students had English as their mother tongue. Those of us born in the English-speaking world should be grateful that our language has, by default, become, for now, the world language.
We hope this volume helps expand and deepen our understanding of how to build ever more sustainable cities.
Joe Carter and Hong Yu
ONESQKMMONTREALBEIJING INTRO
6


ONESQKMMONTREALBEIJING
8
STUDENT PAPERS
1. DENSITY: MAxIME LEFEBvRE2. STREET NETwORK: SUNGHUN LEE, JUSTIN SPEC3. LAND-USE MIx: xIE JING, PIERRE FANzHU, zHIYAO CHEN4. STREETSCAPE: CATERINA vILLANI, RAzvAN GHETI5. wALKABILITY: LINA SAFRIOUI, TARA HAGAN6. DEvELOPMENT PATTERN AND THE ECONOMY: NAOMI TREMBLAY, PATRICK zHANG7. COMMUNITY: SIMON ST-DENIS, MEI YI CHEN, FRANCOIS-LUC GIRALDEAU, ANITA SONGAPPENDIxAFTERwORD
PAGE
09194380
110136151206209
TABLE OF CONTENTS
about DENSITYmaxime LEFEBVRE
ONESQKMMONTREALBEIJING DENSITY | MAXIME LEFEBVRE
10
Synergos: working together.
In our current quest for sustainability, we often strive for praxis which is maintaining an artificial state of equilibrium. This state of equilibrium needs not to be disturbed if it is to accommodate human occupation over the long term. This tendency of seeing Praxis as something which needs to blend in its environment sanctifies Nature as something which is in itself balanced. However, as pointed by David Ruy, Nature is in itself not stable and is in a constant state of transformation. It is then important to understand sustainability as a concept which is comprehensive with the flux of Nature. Keeping this in mind, we will attempt to define Sustainability as a concept applied to Architecture. Six criterias of sustainability were used in our collective seminar research to form a network of exploration around the same global theme. The themes are Density, Street Network, Land Use Mix, Streetscape, walkability, and Community.
The very first criteria is the generic underlying concept of numericizing the amount of space taken by something in a given space. It is Density. with a capital D.
This essay will therefore try to answer the inquiry which frames Density as a direct concept of Sustainability & Architecture; what are the optimal (both maximum and minimum) density values within which it is sustainable, pleasant and fruitful to live? This will be studied by looking at built density as well as population density while using the other criterias to raise the importance of their relation with Density. we shall compare 4 different cases (urban scenarios) each of 1 kilometer square to narrow the working scope of a concept so vast. The 4 cases are the Montreal Plateau Mont-Royal area, Montreal’s suburban town towns, downtown Beijing and Midtown Manhattan.
In order to first look at built density, it is required to define the universal tool widely used to calculate it, the floor area ratio (FAR). The FAR of a given place (city, country, building lot, or any given space) is the ratio which calculates the gross floor area of a building divided by the size of the land upon which it has been built. As an example, an FAR or 1 means that the building area is equal to the size of its lot while a FAR of 2 means that the building area is twice as big. Simple enough.
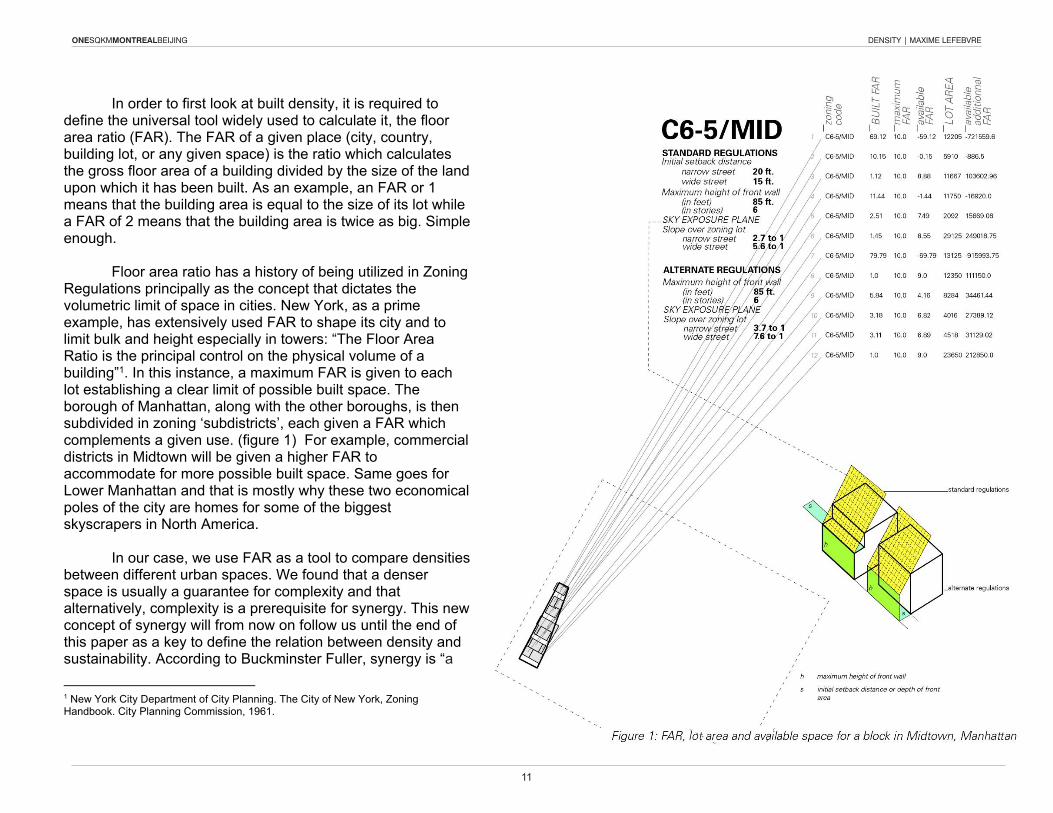
Floor area ratio has a history of being utilized in zoning Regulations principally as the concept that dictates the volumetric limit of space in cities. New York, as a prime example, has extensively used FAR to shape its city and to limit bulk and height especially in towers: “The Floor Area Ratio is the principal control on the physical volume of a building”1. In this instance, a maximum FAR is given to each lot establishing a clear limit of possible built space. The borough of Manhattan, along with the other boroughs, is then subdivided in zoning ‘subdistricts’, each given a FAR which complements a given use. (figure 1) For example, commercial districts in Midtown will be given a higher FAR to accommodate for more possible built space. Same goes for Lower Manhattan and that is mostly why these two economical poles of the city are homes for some of the biggest skyscrapers in North America.
In our case, we use FAR as a tool to compare densities between different urban spaces. we found that a denser space is usually a guarantee for complexity and that alternatively, complexity is a prerequisite for synergy. This new concept of synergy will from now on follow us until the end of this paper as a key to define the relation between density and sustainability. According to Buckminster Fuller, synergy is “a
1 New York City Department of City Planning. The City of New York, zoning Handbook. City Planning Commission, 1961.
ONESQKMMONTREALBEIJING DENSITY | MAXIME LEFEBVRE
11
Synergos: working together.
In our current quest for sustainability, we often strive for praxis which is maintaining an artificial state of equilibrium. This state of equilibrium needs not to be disturbed if it is to accommodate human occupation over the long term. This tendency of seeing Praxis as something which needs to blend in its environment sanctifies Nature as something which is in itself balanced. However, as pointed by David Ruy, Nature is in itself not stable and is in a constant state of transformation. It is then important to understand sustainability as a concept which is comprehensive with the flux of Nature. Keeping this in mind, we will attempt to define Sustainability as a concept applied to Architecture. Six criterias of sustainability were used in our collective seminar research to form a network of exploration around the same global theme. The themes are Density, Street Network, Land Use Mix, Streetscape, walkability, and Community.
The very first criteria is the generic underlying concept of numericizing the amount of space taken by something in a given space. It is Density. with a capital D.
This essay will therefore try to answer the inquiry which frames Density as a direct concept of Sustainability & Architecture; what are the optimal (both maximum and minimum) density values within which it is sustainable, pleasant and fruitful to live? This will be studied by looking at built density as well as population density while using the other criterias to raise the importance of their relation with Density. we shall compare 4 different cases (urban scenarios) each of 1 kilometer square to narrow the working scope of a concept so vast. The 4 cases are the Montreal Plateau Mont-Royal area, Montreal’s suburban town towns, downtown Beijing and Midtown Manhattan.
In order to first look at built density, it is required to define the universal tool widely used to calculate it, the floor area ratio (FAR). The FAR of a given place (city, country, building lot, or any given space) is the ratio which calculates the gross floor area of a building divided by the size of the land upon which it has been built. As an example, an FAR or 1 means that the building area is equal to the size of its lot while a FAR of 2 means that the building area is twice as big. Simple enough.
Floor area ratio has a history of being utilized in zoning Regulations principally as the concept that dictates the volumetric limit of space in cities. New York, as a prime example, has extensively used FAR to shape its city and to limit bulk and height especially in towers: “The Floor Area Ratio is the principal control on the physical volume of a building”1. In this instance, a maximum FAR is given to each lot establishing a clear limit of possible built space. The borough of Manhattan, along with the other boroughs, is then subdivided in zoning ‘subdistricts’, each given a FAR which complements a given use. (figure 1) For example, commercial districts in Midtown will be given a higher FAR to accommodate for more possible built space. Same goes for Lower Manhattan and that is mostly why these two economical poles of the city are homes for some of the biggest skyscrapers in North America.
In our case, we use FAR as a tool to compare densities between different urban spaces. we found that a denser space is usually a guarantee for complexity and that alternatively, complexity is a prerequisite for synergy. This new concept of synergy will from now on follow us until the end of this paper as a key to define the relation between density and sustainability. According to Buckminster Fuller, synergy is “a
1 New York City Department of City Planning. The City of New York, zoning Handbook. City Planning Commission, 1961.
ONESQKMMONTREALBEIJING DENSITY | MAXIME LEFEBVRE
12
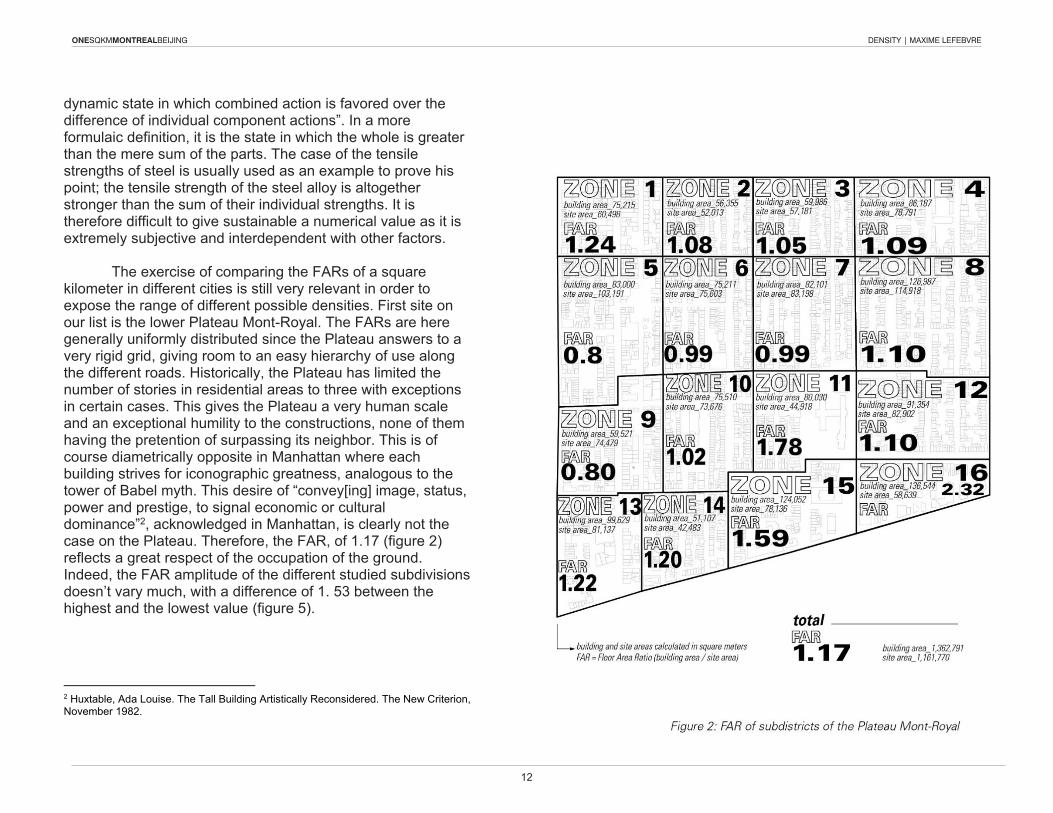
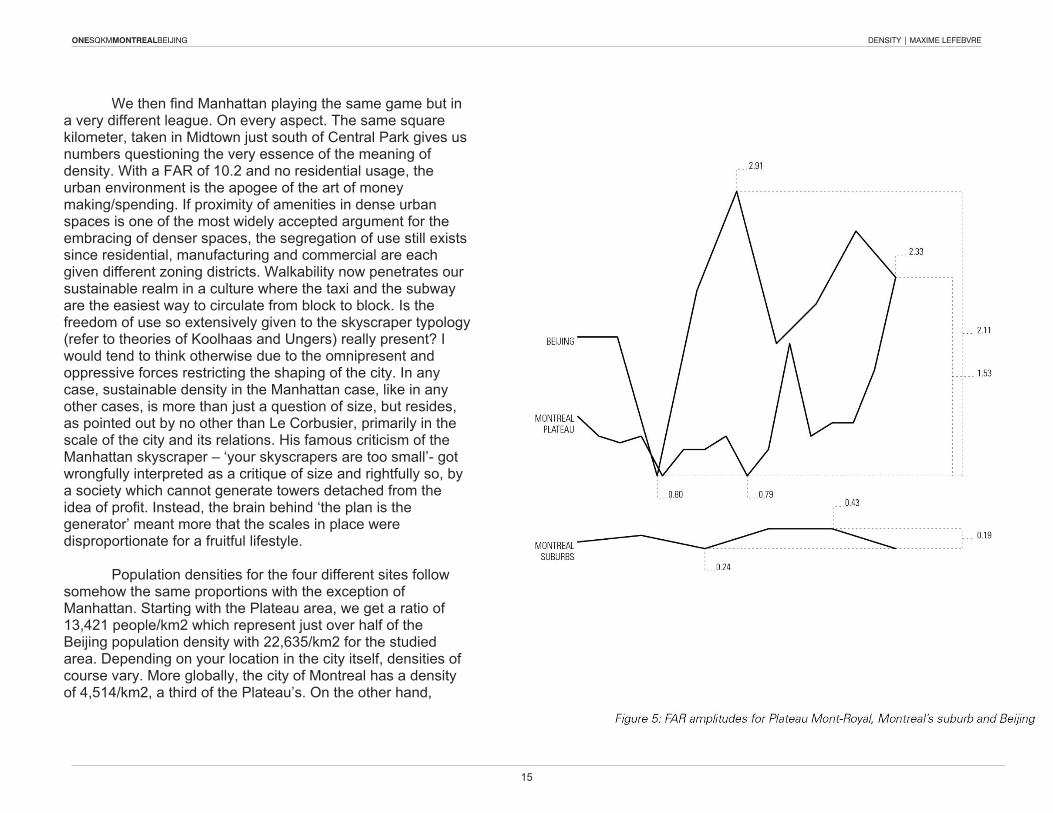
dynamic state in which combined action is favored over the difference of individual component actions”. In a more formulaic definition, it is the state in which the whole is greater than the mere sum of the parts. The case of the tensile strengths of steel is usually used as an example to prove his point; the tensile strength of the steel alloy is altogether stronger than the sum of their individual strengths. It is therefore difficult to give sustainable a numerical value as it is extremely subjective and interdependent with other factors. The exercise of comparing the FARs of a square kilometer in different cities is still very relevant in order to expose the range of different possible densities. First site on our list is the lower Plateau Mont-Royal. The FARs are here generally uniformly distributed since the Plateau answers to a very rigid grid, giving room to an easy hierarchy of use along the different roads. Historically, the Plateau has limited the number of stories in residential areas to three with exceptions in certain cases. This gives the Plateau a very human scale and an exceptional humility to the constructions, none of them having the pretention of surpassing its neighbor. This is of course diametrically opposite in Manhattan where each building strives for iconographic greatness, analogous to the tower of Babel myth. This desire of “convey[ing] image, status, power and prestige, to signal economic or cultural dominance”2, acknowledged in Manhattan, is clearly not the case on the Plateau. Therefore, the FAR, of 1.17 (figure 2) reflects a great respect of the occupation of the ground. Indeed, the FAR amplitude of the different studied subdivisions doesn’t vary much, with a difference of 1. 53 between the highest and the lowest value (figure 5).
2 Huxtable, Ada Louise. The Tall Building Artistically Reconsidered. The New Criterion, November 1982.
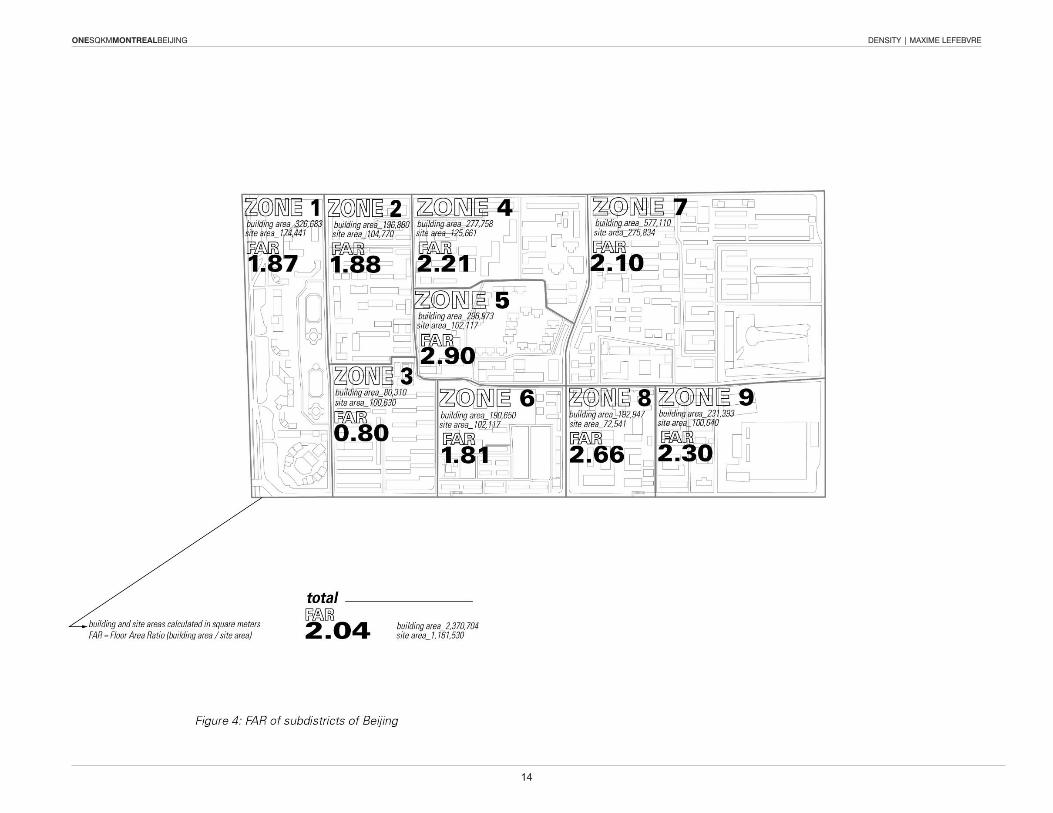
If we now move to Montreal’s suburban site, we notice a drastic drop, characterizing a change in mentality as well as in built form. while the relative uniformity of distribution remains, the occupation of the land decreases and the size of the lots increases proportionally. Suburban sprawl is somewhat colonialist in its development pattern for the individuation of the site promotes individual valorization. Indeed, suburban sprawl is analogous to planting your flag on a new piece of land, as opposed to the collective occupation which characterize urban occupation. This is highly reflected in FAR comparison between the two sites. If the Plateau FAR is 1.17, the one for the same square kilometer size in suburban land is 0.35 (figure 3), 3.3 times lower! The amplitude also varies much less than in urban spaces. If suburban space tends towards uniformity, individual freedom is advocated over a sense of community. Moving on to look at a radically different culture, it becomes evident that density cannot be reduced to shear numerical values. In Beijing, density differs just as much as its definition of community and its city’s hierarchical system and networks. The FAR is thus understood as a tool needed to be framed within cultural identity and its repercussions on our built environment if it is to be given any real meaning. It is in the case of Beijing that we find the biggest variation in FAR amplitude between the highest and lowest rate of the different neighborhoods of the same square kilometer site, with an amplitude of 2.11. Its average tops at 2.04 (figure 4), almost twice as big as Montreal’s Plateau. This is principally due to the height to which constructions are built, being much higher than the 3 story buildings found on the Plateau. That trend gives room for bigger public space situated between the buildings though this space is also shared by a larger quantity of people.

ONESQKMMONTREALBEIJING DENSITY | MAXIME LEFEBVRE
13
dynamic state in which combined action is favored over the difference of individual component actions”. In a more formulaic definition, it is the state in which the whole is greater than the mere sum of the parts. The case of the tensile strengths of steel is usually used as an example to prove his point; the tensile strength of the steel alloy is altogether stronger than the sum of their individual strengths. It is therefore difficult to give sustainable a numerical value as it is extremely subjective and interdependent with other factors. The exercise of comparing the FARs of a square kilometer in different cities is still very relevant in order to expose the range of different possible densities. First site on our list is the lower Plateau Mont-Royal. The FARs are here generally uniformly distributed since the Plateau answers to a very rigid grid, giving room to an easy hierarchy of use along the different roads. Historically, the Plateau has limited the number of stories in residential areas to three with exceptions in certain cases. This gives the Plateau a very human scale and an exceptional humility to the constructions, none of them having the pretention of surpassing its neighbor. This is of course diametrically opposite in Manhattan where each building strives for iconographic greatness, analogous to the tower of Babel myth. This desire of “convey[ing] image, status, power and prestige, to signal economic or cultural dominance”2, acknowledged in Manhattan, is clearly not the case on the Plateau. Therefore, the FAR, of 1.17 (figure 2) reflects a great respect of the occupation of the ground. Indeed, the FAR amplitude of the different studied subdivisions doesn’t vary much, with a difference of 1. 53 between the highest and the lowest value (figure 5).
2 Huxtable, Ada Louise. The Tall Building Artistically Reconsidered. The New Criterion, November 1982.
If we now move to Montreal’s suburban site, we notice a drastic drop, characterizing a change in mentality as well as in built form. while the relative uniformity of distribution remains, the occupation of the land decreases and the size of the lots increases proportionally. Suburban sprawl is somewhat colonialist in its development pattern for the individuation of the site promotes individual valorization. Indeed, suburban sprawl is analogous to planting your flag on a new piece of land, as opposed to the collective occupation which characterize urban occupation. This is highly reflected in FAR comparison between the two sites. If the Plateau FAR is 1.17, the one for the same square kilometer size in suburban land is 0.35 (figure 3), 3.3 times lower! The amplitude also varies much less than in urban spaces. If suburban space tends towards uniformity, individual freedom is advocated over a sense of community. Moving on to look at a radically different culture, it becomes evident that density cannot be reduced to shear numerical values. In Beijing, density differs just as much as its definition of community and its city’s hierarchical system and networks. The FAR is thus understood as a tool needed to be framed within cultural identity and its repercussions on our built environment if it is to be given any real meaning. It is in the case of Beijing that we find the biggest variation in FAR amplitude between the highest and lowest rate of the different neighborhoods of the same square kilometer site, with an amplitude of 2.11. Its average tops at 2.04 (figure 4), almost twice as big as Montreal’s Plateau. This is principally due to the height to which constructions are built, being much higher than the 3 story buildings found on the Plateau. That trend gives room for bigger public space situated between the buildings though this space is also shared by a larger quantity of people.
If we now move to Montreal’s suburban site, we notice a drastic drop, characterizing a change in mentality as well as in built form. while the relative uniformity of distribution remains, the occupation of the land decreases and the size of the lots increases proportionally. Suburban sprawl is somewhat colonialist in its development pattern for the individuation of the site promotes individual valorization. Indeed, suburban sprawl is analogous to planting your flag on a new piece of land, as opposed to the collective occupation which characterize urban occupation. This is highly reflected in FAR comparison between the two sites. If the Plateau FAR is 1.17, the one for the same square kilometer size in suburban land is 0.35 (figure 3), 3.3 times lower! The amplitude also varies much less than in urban spaces. If suburban space tends towards uniformity, individual freedom is advocated over a sense of community. Moving on to look at a radically different culture, it becomes evident that density cannot be reduced to shear numerical values. In Beijing, density differs just as much as its definition of community and its city’s hierarchical system and networks. The FAR is thus understood as a tool needed to be framed within cultural identity and its repercussions on our built environment if it is to be given any real meaning. It is in the case of Beijing that we find the biggest variation in FAR amplitude between the highest and lowest rate of the different neighborhoods of the same square kilometer site, with an amplitude of 2.11. Its average tops at 2.04 (figure 4), almost twice as big as Montreal’s Plateau. This is principally due to the height to which constructions are built, being much higher than the 3 story buildings found on the Plateau. That trend gives room for bigger public space situated between the buildings though this space is also shared by a larger quantity of people.
ONESQKMMONTREALBEIJING DENSITY | MAXIME LEFEBVRE
14
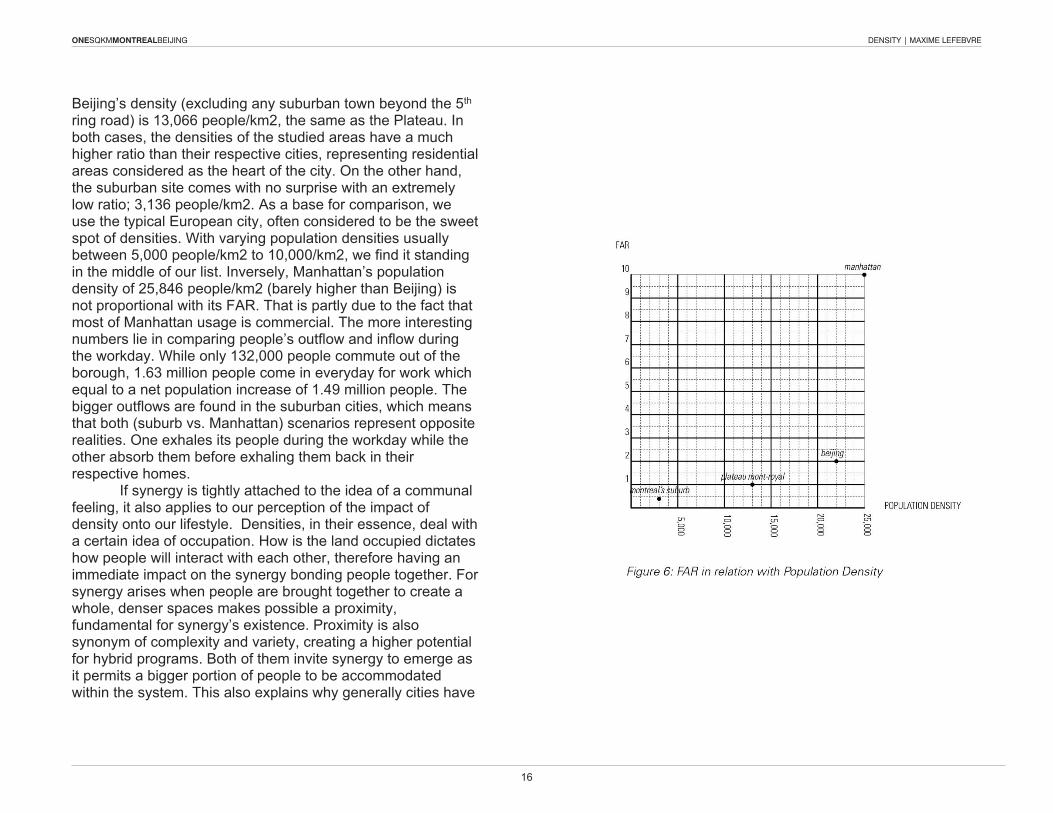
we then find Manhattan playing the same game but in a very different league. On every aspect. The same square kilometer, taken in Midtown just south of Central Park gives us numbers questioning the very essence of the meaning of density. with a FAR of 10.2 and no residential usage, the urban environment is the apogee of the art of money making/spending. If proximity of amenities in dense urban spaces is one of the most widely accepted argument for the embracing of denser spaces, the segregation of use still exists since residential, manufacturing and commercial are each given different zoning districts. walkability now penetrates our sustainable realm in a culture where the taxi and the subway are the easiest way to circulate from block to block. Is the freedom of use so extensively given to the skyscraper typology (refer to theories of Koolhaas and Ungers) really present? I would tend to think otherwise due to the omnipresent and oppressive forces restricting the shaping of the city. In any case, sustainable density in the Manhattan case, like in any other cases, is more than just a question of size, but resides, as pointed out by no other than Le Corbusier, primarily in the scale of the city and its relations. His famous criticism of the Manhattan skyscraper – ‘your skyscrapers are too small’- got wrongfully interpreted as a critique of size and rightfully so, by a society which cannot generate towers detached from the idea of profit. Instead, the brain behind ‘the plan is the generator’ meant more that the scales in place were disproportionate for a fruitful lifestyle. Population densities for the four different sites follow somehow the same proportions with the exception of Manhattan. Starting with the Plateau area, we get a ratio of 13,421 people/km2 which represent just over half of the Beijing population density with 22,635/km2 for the studied area. Depending on your location in the city itself, densities of course vary. More globally, the city of Montreal has a density of 4,514/km2, a third of the Plateau’s. On the other hand,
ONESQKMMONTREALBEIJING DENSITY | MAXIME LEFEBVRE
15
we then find Manhattan playing the same game but in a very different league. On every aspect. The same square kilometer, taken in Midtown just south of Central Park gives us numbers questioning the very essence of the meaning of density. with a FAR of 10.2 and no residential usage, the urban environment is the apogee of the art of money making/spending. If proximity of amenities in dense urban spaces is one of the most widely accepted argument for the embracing of denser spaces, the segregation of use still exists since residential, manufacturing and commercial are each given different zoning districts. walkability now penetrates our sustainable realm in a culture where the taxi and the subway are the easiest way to circulate from block to block. Is the freedom of use so extensively given to the skyscraper typology (refer to theories of Koolhaas and Ungers) really present? I would tend to think otherwise due to the omnipresent and oppressive forces restricting the shaping of the city. In any case, sustainable density in the Manhattan case, like in any other cases, is more than just a question of size, but resides, as pointed out by no other than Le Corbusier, primarily in the scale of the city and its relations. His famous criticism of the Manhattan skyscraper – ‘your skyscrapers are too small’- got wrongfully interpreted as a critique of size and rightfully so, by a society which cannot generate towers detached from the idea of profit. Instead, the brain behind ‘the plan is the generator’ meant more that the scales in place were disproportionate for a fruitful lifestyle. Population densities for the four different sites follow somehow the same proportions with the exception of Manhattan. Starting with the Plateau area, we get a ratio of 13,421 people/km2 which represent just over half of the Beijing population density with 22,635/km2 for the studied area. Depending on your location in the city itself, densities of course vary. More globally, the city of Montreal has a density of 4,514/km2, a third of the Plateau’s. On the other hand,
we then find Manhattan playing the same game but in a very different league. On every aspect. The same square kilometer, taken in Midtown just south of Central Park gives us numbers questioning the very essence of the meaning of density. with a FAR of 10.2 and no residential usage, the urban environment is the apogee of the art of money making/spending. If proximity of amenities in dense urban spaces is one of the most widely accepted argument for the embracing of denser spaces, the segregation of use still exists since residential, manufacturing and commercial are each given different zoning districts. walkability now penetrates our sustainable realm in a culture where the taxi and the subway are the easiest way to circulate from block to block. Is the freedom of use so extensively given to the skyscraper typology (refer to theories of Koolhaas and Ungers) really present? I would tend to think otherwise due to the omnipresent and oppressive forces restricting the shaping of the city. In any case, sustainable density in the Manhattan case, like in any other cases, is more than just a question of size, but resides, as pointed out by no other than Le Corbusier, primarily in the scale of the city and its relations. His famous criticism of the Manhattan skyscraper – ‘your skyscrapers are too small’- got wrongfully interpreted as a critique of size and rightfully so, by a society which cannot generate towers detached from the idea of profit. Instead, the brain behind ‘the plan is the generator’ meant more that the scales in place were disproportionate for a fruitful lifestyle. Population densities for the four different sites follow somehow the same proportions with the exception of Manhattan. Starting with the Plateau area, we get a ratio of 13,421 people/km2 which represent just over half of the Beijing population density with 22,635/km2 for the studied area. Depending on your location in the city itself, densities of course vary. More globally, the city of Montreal has a density of 4,514/km2, a third of the Plateau’s. On the other hand,
ONESQKMMONTREALBEIJING DENSITY | MAXIME LEFEBVRE
16
Beijing’s density (excluding any suburban town beyond the 5th ring road) is 13,066 people/km2, the same as the Plateau. In both cases, the densities of the studied areas have a much higher ratio than their respective cities, representing residential areas considered as the heart of the city. On the other hand, the suburban site comes with no surprise with an extremely low ratio; 3,136 people/km2. As a base for comparison, we use the typical European city, often considered to be the sweet spot of densities. with varying population densities usually between 5,000 people/km2 to 10,000/km2, we find it standing in the middle of our list. Inversely, Manhattan’s population density of 25,846 people/km2 (barely higher than Beijing) is not proportional with its FAR. That is partly due to the fact that most of Manhattan usage is commercial. The more interesting numbers lie in comparing people’s outflow and inflow during the workday. while only 132,000 people commute out of the borough, 1.63 million people come in everyday for work which equal to a net population increase of 1.49 million people. The bigger outflows are found in the suburban cities, which means that both (suburb vs. Manhattan) scenarios represent opposite realities. One exhales its people during the workday while the other absorb them before exhaling them back in their respective homes. If synergy is tightly attached to the idea of a communal feeling, it also applies to our perception of the impact of density onto our lifestyle. Densities, in their essence, deal with a certain idea of occupation. How is the land occupied dictates how people will interact with each other, therefore having an immediate impact on the synergy bonding people together. For synergy arises when people are brought together to create a whole, denser spaces makes possible a proximity, fundamental for synergy’s existence. Proximity is also synonym of complexity and variety, creating a higher potential for hybrid programs. Both of them invite synergy to emerge as it permits a bigger portion of people to be accommodated within the system. This also explains why generally cities have
Beijing’s density (excluding any suburban town beyond the 5th ring road) is 13,066 people/km2, the same as the Plateau. In both cases, the densities of the studied areas have a much higher ratio than their respective cities, representing residential areas considered as the heart of the city. On the other hand, the suburban site comes with no surprise with an extremely low ratio; 3,136 people/km2. As a base for comparison, we use the typical European city, often considered to be the sweet spot of densities. with varying population densities usually between 5,000 people/km2 to 10,000/km2, we find it standing in the middle of our list. Inversely, Manhattan’s population density of 25,846 people/km2 (barely higher than Beijing) is not proportional with its FAR. That is partly due to the fact that most of Manhattan usage is commercial. The more interesting numbers lie in comparing people’s outflow and inflow during the workday. while only 132,000 people commute out of the borough, 1.63 million people come in everyday for work which equal to a net population increase of 1.49 million people. The bigger outflows are found in the suburban cities, which means that both (suburb vs. Manhattan) scenarios represent opposite realities. One exhales its people during the workday while the other absorb them before exhaling them back in their respective homes. If synergy is tightly attached to the idea of a communal feeling, it also applies to our perception of the impact of density onto our lifestyle. Densities, in their essence, deal with a certain idea of occupation. How is the land occupied dictates how people will interact with each other, therefore having an immediate impact on the synergy bonding people together. For synergy arises when people are brought together to create a whole, denser spaces makes possible a proximity, fundamental for synergy’s existence. Proximity is also synonym of complexity and variety, creating a higher potential for hybrid programs. Both of them invite synergy to emerge as it permits a bigger portion of people to be accommodated within the system. This also explains why generally cities have
a tendency to be more multicultural than the far regions of a country. If then a vaster portion of the population can find gloves to their hand, a wider appreciation of the environment stimulates an excitation which increases the desire to live in this urban space. This does not mean synergy cannot happen in a wider space where distances are bigger, but it makes it a lot more difficult to emerge. It would require bigger efforts and a stronger will for its existence. Then again, too dense areas tend towards an overcrowding occupation of the space, which allow anonymity to rise. A prime example of this problem is again Manhattan which has been criticised by many as now being the perfect archipelago city; a city in which towers are insular islands only connected with its oversaturated ground floor. If every building stands on its own, no connection can be made and synergy is lost. In areas with very low densities, like suburbia, anonymity also surfaces for distances reach too great lengths. The amenities are further, therefore bigger and more uniform. Communal identity detaches itself from any physical proximity for it barely exists.
The initial question framing density within sustainable practice finds its answer in its association with the concept of synergy. The numerical minimum and maximum values being impossible to determine, sustainable density exists in the middle zone of the density spectrum within which synergy can exist. A density becomes therefore too low or too high when that synergy which engages and fosters social interactions drops. The fine balance existing between anonymity (individuality) and social groups (collectivity) needs not to be lost if we want synergy to bloom. In other words, density has to maintain that balance and allow for both to coexist in order for the whole to be greater than the sum of its parts. It seems logical then to say that higher density augments the sustainable potential of a given place because of what the repercussions of a higher density are. while this may be true, it doesn’t necessarily mean that higher density automatically refer to sustainability. Other criterias need to come in the equation in order to shed light on the links between sustainability and architecture.
ONESQKMMONTREALBEIJING DENSITY | MAXIME LEFEBVRE
17
a tendency to be more multicultural than the far regions of a country. If then a vaster portion of the population can find gloves to their hand, a wider appreciation of the environment stimulates an excitation which increases the desire to live in this urban space. This does not mean synergy cannot happen in a wider space where distances are bigger, but it makes it a lot more difficult to emerge. It would require bigger efforts and a stronger will for its existence. Then again, too dense areas tend towards an overcrowding occupation of the space, which allow anonymity to rise. A prime example of this problem is again Manhattan which has been criticised by many as now being the perfect archipelago city; a city in which towers are insular islands only connected with its oversaturated ground floor. If every building stands on its own, no connection can be made and synergy is lost. In areas with very low densities, like suburbia, anonymity also surfaces for distances reach too great lengths. The amenities are further, therefore bigger and more uniform. Communal identity detaches itself from any physical proximity for it barely exists.
The initial question framing density within sustainable practice finds its answer in its association with the concept of synergy. The numerical minimum and maximum values being impossible to determine, sustainable density exists in the middle zone of the density spectrum within which synergy can exist. A density becomes therefore too low or too high when that synergy which engages and fosters social interactions drops. The fine balance existing between anonymity (individuality) and social groups (collectivity) needs not to be lost if we want synergy to bloom. In other words, density has to maintain that balance and allow for both to coexist in order for the whole to be greater than the sum of its parts. It seems logical then to say that higher density augments the sustainable potential of a given place because of what the repercussions of a higher density are. while this may be true, it doesn’t necessarily mean that higher density automatically refer to sustainability. Other criterias need to come in the equation in order to shed light on the links between sustainability and architecture.

about STREET NETWORKsunghun LEE justin SPEC
20
ONESQKMMONTREALBEIJING STREET HIERARCHY & BLOCK SIZE | SUNGHUN (LUKE) LEE
STREET HIERARCHY & BLOCK SIZEBEIJING | PLATEAU | BROSSARD | ANYANG
The planning of street network of a city is closely related to the vehicular and pedestrian circulation within the city area. According to the density of population, the scale of the streets are relatively altered in different cities. The size of city blocks, defined by the street network, often varies in different cities for the same issue. Eastern and Western countries tend to show differ-ent characteristics of street network in relation to the size of streets and city blocks. The cities in the East Asian coun-tries, such as China and South Korea, have relatively wid-er roads and streets with more numbers of vehicular lanes than the cities in the Western countries, such as Canada and USA. The size of streets and the blocks crucially affects the convenience of vehicular circulation and the safety of pedestrians and bicycles around the city. Due to the high volume of vehicles, wide roads that are wider than 45 me-ters with many car lanes are considered to contribute to the high level of traffic congestion. The blocks divided and shaped by wide roads are generally called “Superblocks” (Calthorpe 5). Superblocks are, in general, much larger than traditional city blocks of the grid plans found in most Western countries. Many Asian countries, especially China and South Korea, adapted the superblocks for their city planning. The sizes of superblocks are normally found in the range from 300 by 300 meters to 500 by 500 meters or even larger. Having wide arterial and secondary roads surround-ing the superblocks is considered to be prioritizing cars over pedestrians and bicycles; the city becomes more auto-ori-ented as opposed to the cities with smaller city blocks and denser street network. It is speculated that walking and biking become more inconvenient and dangerous by hav-
ing huge volume of fast circulating vehicles around the city blocks. In Peter Calthorpe’s article Low Carbon City Design, the author raises a question about the sustainability of a city. He points out that arterial dominant superblock network planning promotes the more use of vehicles and discourag-es pedestrian activities, whereas the dense street network of smaller blocks prioritizes people over cars and supports pedestrian and economic activities (Calthorpe 5). In order to bring the level of sustainability of a city higher, Calthorpe insists that the road design is suggested to avoid having the superblock oriented street network, so that the city maximiz-es human mobility and reduces the carbon fuel usage. The following analysis of street hierarchy and the road area in relation to the size of blocks of the cities in dif-ferent locations evaluates the level of vehicular dominance of each site in respect of pedestrians and bicycles and re-examines the validity of Calthorpe’s argument as well.
The selected sites for this study are in four different loca-tions:
- Beijing, China - Plateau-Mont-Royal, Montreal, QC, Canada - Brossard, QC, Canada - Anyang, Gyeongi, South Korea Each site of the four locations has different types of city planning context in terms of street network and is cho-sen to deliver a thorough observation for the purpose of this analysis.
21
ONESQKMMONTREALBEIJING STREET HIERARCHY & BLOCK SIZE | SUNGHUN (LUKE) LEE
117.18 ha
119.37 ha
Fig. 1: Beijing, China
Fig. 2: Le Plateau-Mont-Royal, Montreal, QC, Canada
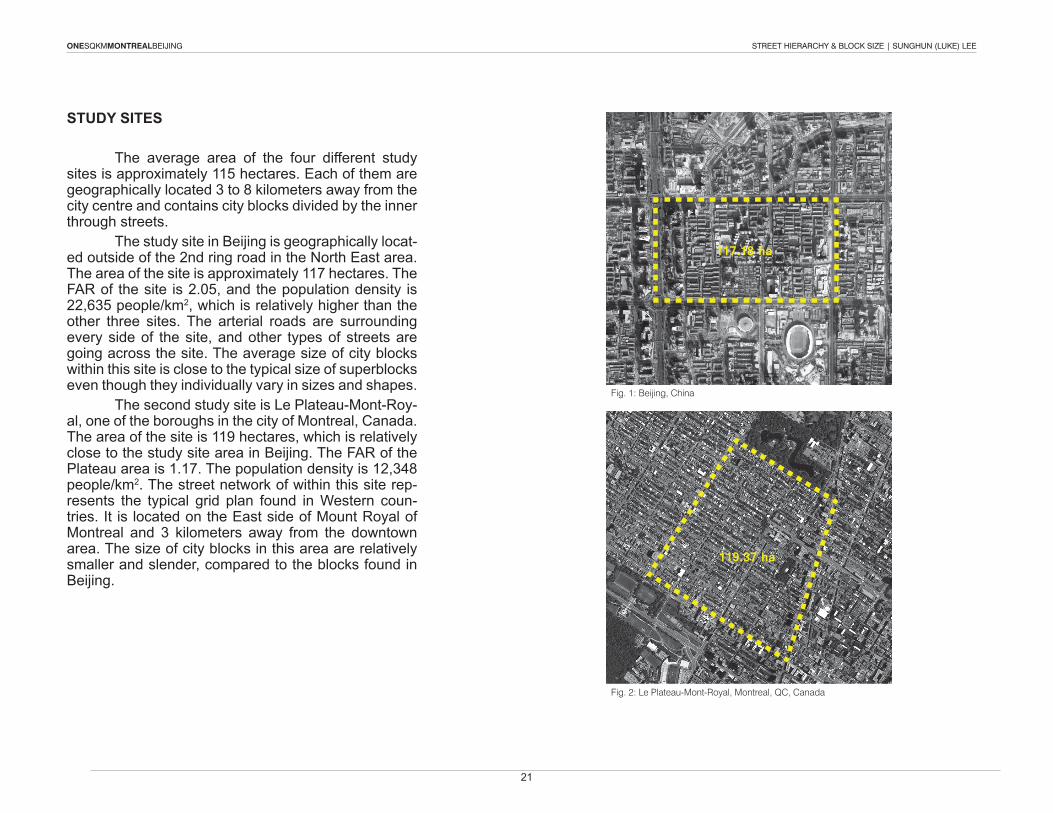
STUDY SITES
The average area of the four different study sites is approximately 115 hectares. Each of them are geographically located 3 to 8 kilometers away from the city centre and contains city blocks divided by the inner through streets. The study site in Beijing is geographically locat-ed outside of the 2nd ring road in the North East area. The area of the site is approximately 117 hectares. The FAR of the site is 2.05, and the population density is 22,635 people/km2, which is relatively higher than the other three sites. The arterial roads are surrounding every side of the site, and other types of streets are going across the site. The average size of city blocks within this site is close to the typical size of superblocks even though they individually vary in sizes and shapes. The second study site is Le Plateau-Mont-Roy-al, one of the boroughs in the city of Montreal, Canada. The area of the site is 119 hectares, which is relatively close to the study site area in Beijing. The FAR of the Plateau area is 1.17. The population density is 12,348 people/km2. The street network of within this site rep-resents the typical grid plan found in Western coun-tries. It is located on the East side of Mount Royal of Montreal and 3 kilometers away from the downtown area. The size of city blocks in this area are relatively smaller and slender, compared to the blocks found in Beijing.
22
ONESQKMMONTREALBEIJING STREET HIERARCHY & BLOCK SIZE | SUNGHUN (LUKE) LEE
114.10 ha
116.60 ha
114.10 ha
Fig. 3: Brossard, QC, Canada
Fig. 4: Anyang, Gyeongi, South Korea
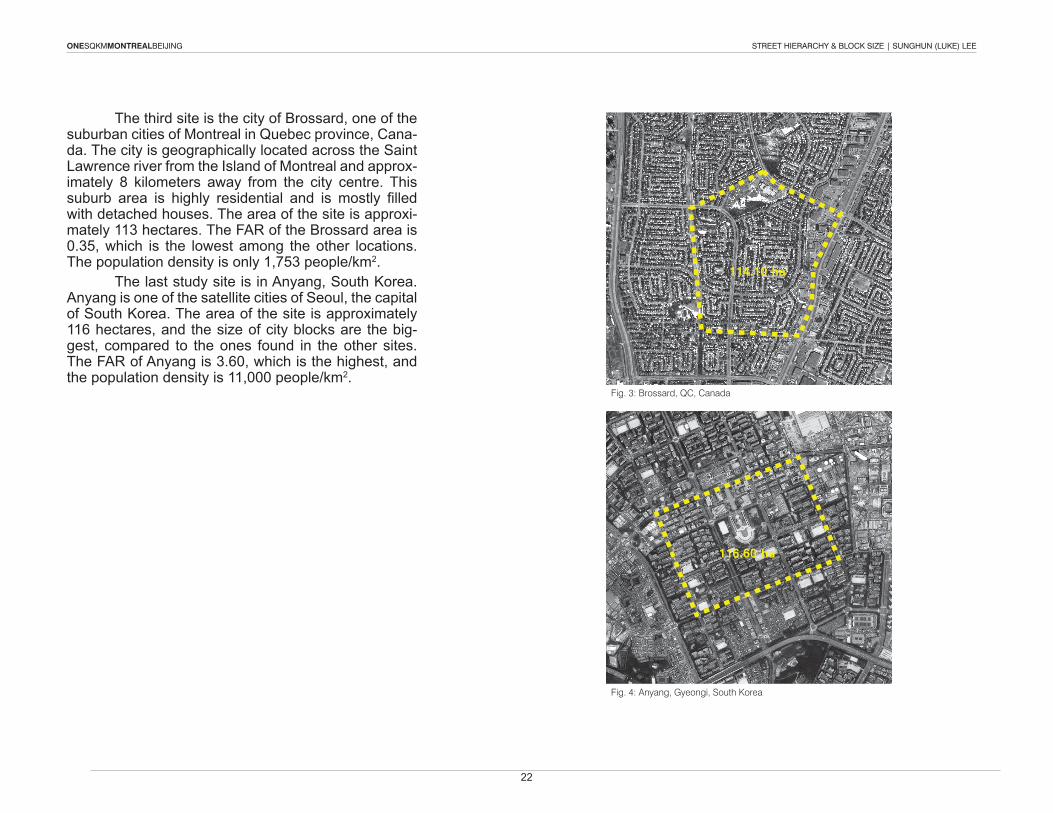
The third site is the city of Brossard, one of the suburban cities of Montreal in Quebec province, Cana-da. The city is geographically located across the Saint Lawrence river from the Island of Montreal and approx-imately 8 kilometers away from the city centre. This suburb area is highly residential and is mostly filled with detached houses. The area of the site is approxi-mately 113 hectares. The FAR of the Brossard area is 0.35, which is the lowest among the other locations. The population density is only 1,753 people/km2. The last study site is in Anyang, South Korea. Anyang is one of the satellite cities of Seoul, the capital of South Korea. The area of the site is approximately 116 hectares, and the size of city blocks are the big-gest, compared to the ones found in the other sites. The FAR of Anyang is 3.60, which is the highest, and the population density is 11,000 people/km2.
23
ONESQKMMONTREALBEIJING STREET HIERARCHY & BLOCK SIZE | SUNGHUN (LUKE) LEE
Fig. 1: City Blocks of Beijing, China
Fig. 4: City Blocks of Anyang, Gyeongi, South Korea
Fig. 3: City Blocks of Brossard, QC, Canada
Fig. 2: City Blocks of Le Plateau-Mont-Royal, Montreal, QC, Canada
CITY BLOCKS
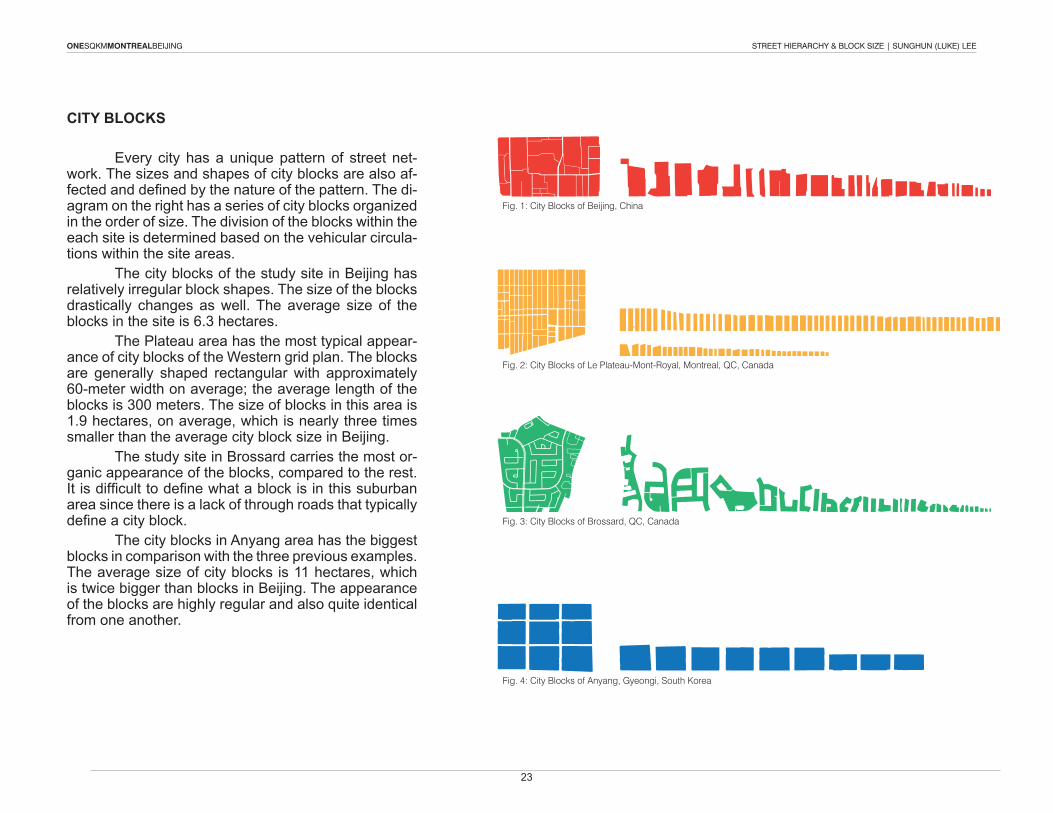
Every city has a unique pattern of street net-work. The sizes and shapes of city blocks are also af-fected and defined by the nature of the pattern. The di-agram on the right has a series of city blocks organized in the order of size. The division of the blocks within the each site is determined based on the vehicular circula-tions within the site areas. The city blocks of the study site in Beijing has relatively irregular block shapes. The size of the blocks drastically changes as well. The average size of the blocks in the site is 6.3 hectares. The Plateau area has the most typical appear-ance of city blocks of the Western grid plan. The blocks are generally shaped rectangular with approximately 60-meter width on average; the average length of the blocks is 300 meters. The size of blocks in this area is 1.9 hectares, on average, which is nearly three times smaller than the average city block size in Beijing. The study site in Brossard carries the most or-ganic appearance of the blocks, compared to the rest. It is difficult to define what a block is in this suburban area since there is a lack of through roads that typically define a city block. The city blocks in Anyang area has the biggest blocks in comparison with the three previous examples. The average size of city blocks is 11 hectares, which is twice bigger than blocks in Beijing. The appearance of the blocks are highly regular and also quite identical from one another.
24
ONESQKMMONTREALBEIJING STREET HIERARCHY & BLOCK SIZE | SUNGHUN (LUKE) LEE
Fig. 1: Beijing, China
Fig. 2: Le Plateau-Mont-Royal, Montreal, QC, Canada
STREET HIERARCHYTHROUGH ROADS
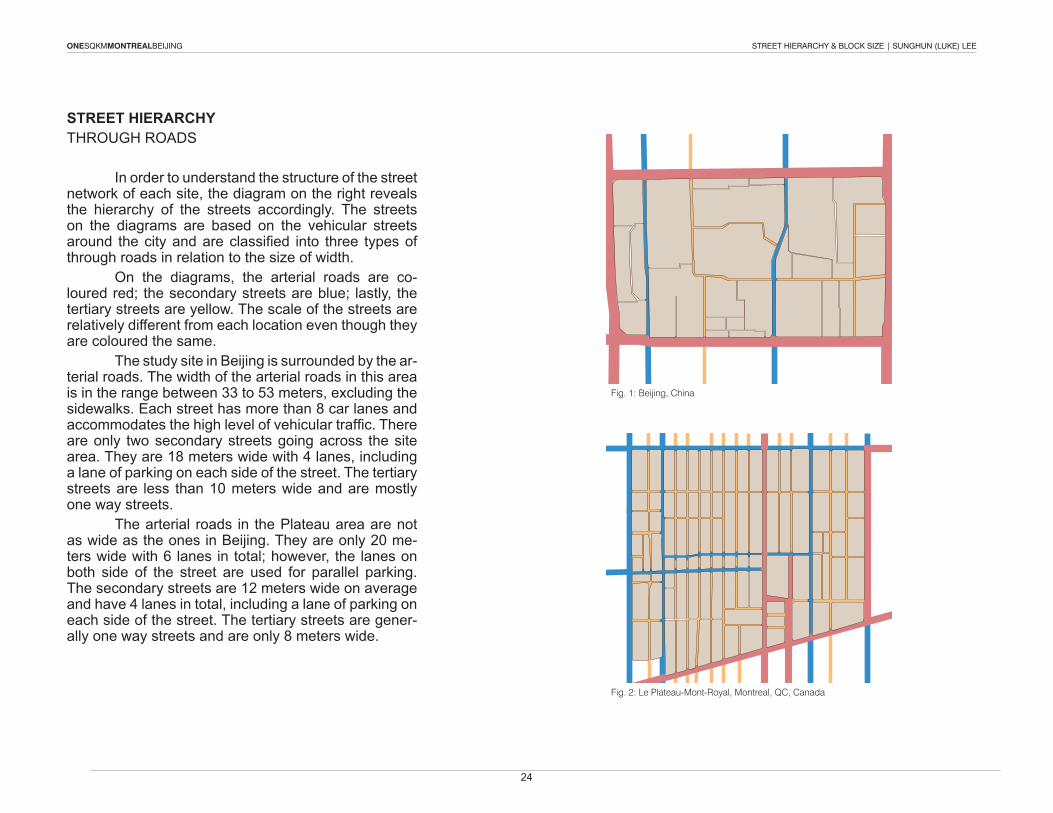
In order to understand the structure of the street network of each site, the diagram on the right reveals the hierarchy of the streets accordingly. The streets on the diagrams are based on the vehicular streets around the city and are classified into three types of through roads in relation to the size of width. On the diagrams, the arterial roads are co-loured red; the secondary streets are blue; lastly, the tertiary streets are yellow. The scale of the streets are relatively different from each location even though they are coloured the same. The study site in Beijing is surrounded by the ar-terial roads. The width of the arterial roads in this area is in the range between 33 to 53 meters, excluding the sidewalks. Each street has more than 8 car lanes and accommodates the high level of vehicular traffic. There are only two secondary streets going across the site area. They are 18 meters wide with 4 lanes, including a lane of parking on each side of the street. The tertiary streets are less than 10 meters wide and are mostly one way streets. The arterial roads in the Plateau area are not as wide as the ones in Beijing. They are only 20 me-ters wide with 6 lanes in total; however, the lanes on both side of the street are used for parallel parking. The secondary streets are 12 meters wide on average and have 4 lanes in total, including a lane of parking on each side of the street. The tertiary streets are gener-ally one way streets and are only 8 meters wide.
25
ONESQKMMONTREALBEIJING STREET HIERARCHY & BLOCK SIZE | SUNGHUN (LUKE) LEE
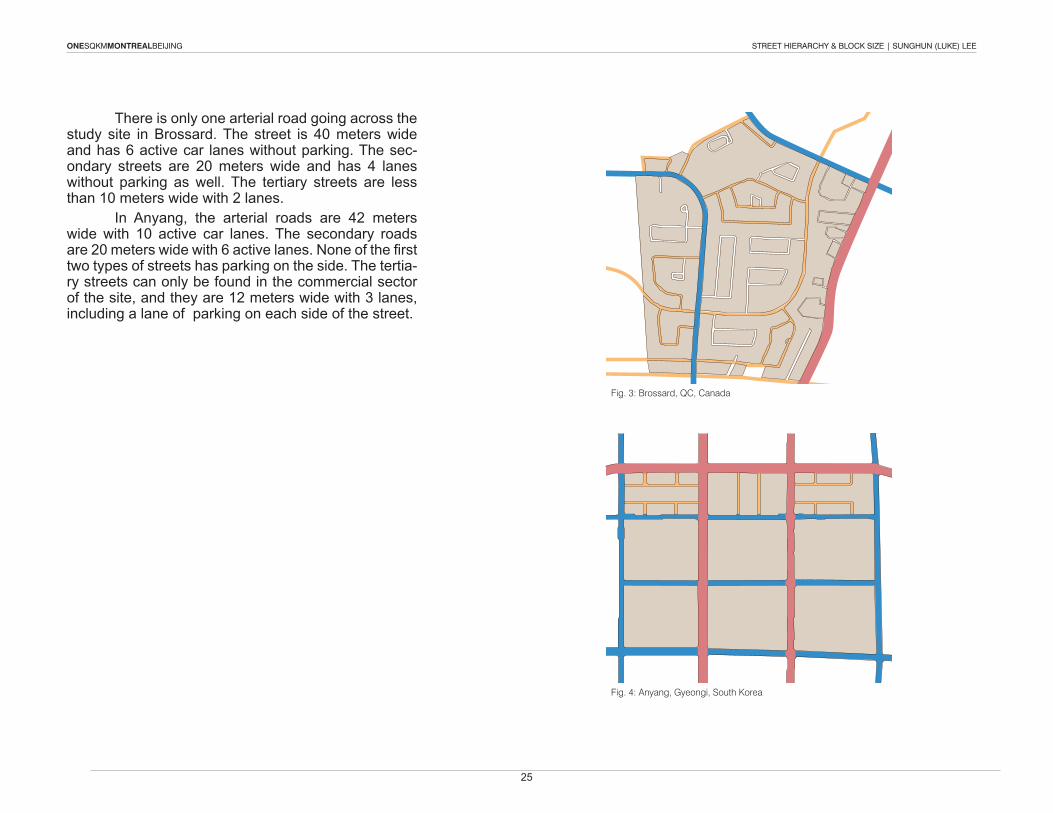
Fig. 3: Brossard, QC, Canada
Fig. 4: Anyang, Gyeongi, South Korea
There is only one arterial road going across the study site in Brossard. The street is 40 meters wide and has 6 active car lanes without parking. The sec-ondary streets are 20 meters wide and has 4 lanes without parking as well. The tertiary streets are less than 10 meters wide with 2 lanes. In Anyang, the arterial roads are 42 meters wide with 10 active car lanes. The secondary roads are 20 meters wide with 6 active lanes. None of the first two types of streets has parking on the side. The tertia-ry streets can only be found in the commercial sector of the site, and they are 12 meters wide with 3 lanes, including a lane of parking on each side of the street.
26
ONESQKMMONTREALBEIJING STREET HIERARCHY & BLOCK SIZE | SUNGHUN (LUKE) LEE
Fig. 1: Beijing, China
Fig. 2: Le Plateau-Mont-Royal, Montreal, QC, Canada
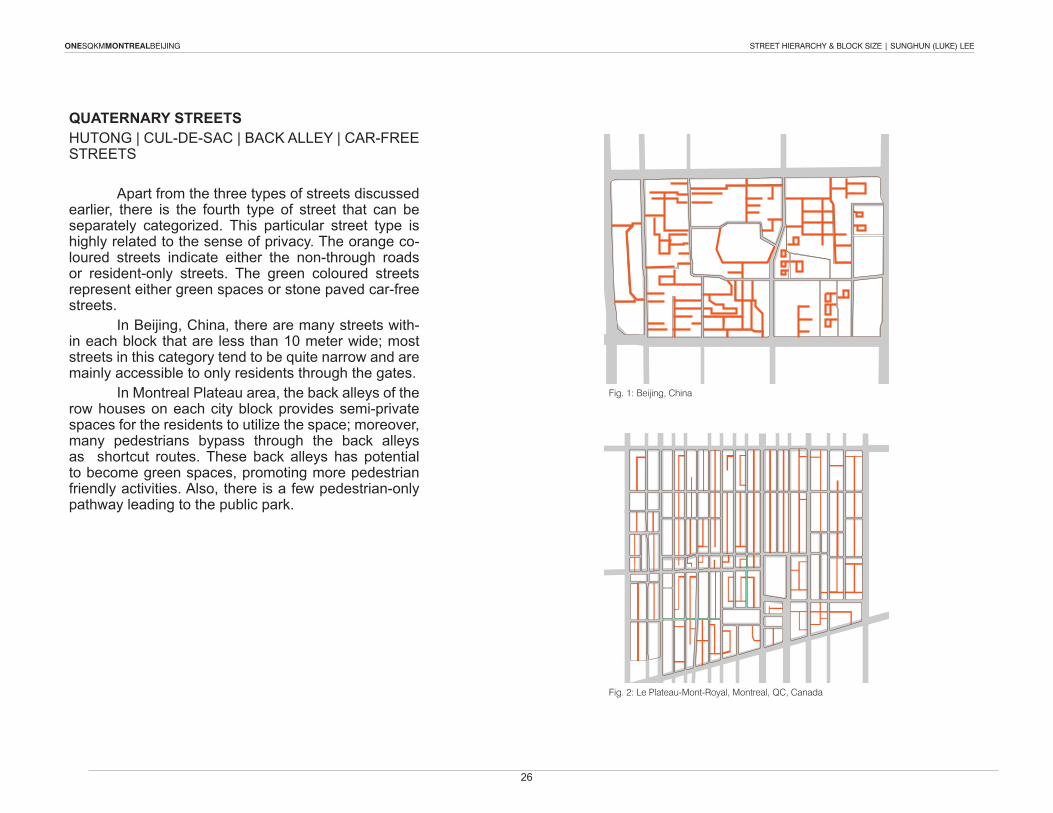
QUATERNARY STREETSHUTONG | CUL-DE-SAC | BACK ALLEY | CAR-FREE STREETS
Apart from the three types of streets discussed earlier, there is the fourth type of street that can be separately categorized. This particular street type is highly related to the sense of privacy. The orange co-loured streets indicate either the non-through roads or resident-only streets. The green coloured streets represent either green spaces or stone paved car-free streets. In Beijing, China, there are many streets with-in each block that are less than 10 meter wide; most streets in this category tend to be quite narrow and are mainly accessible to only residents through the gates. In Montreal Plateau area, the back alleys of the row houses on each city block provides semi-private spaces for the residents to utilize the space; moreover, many pedestrians bypass through the back alleys as shortcut routes. These back alleys has potential to become green spaces, promoting more pedestrian friendly activities. Also, there is a few pedestrian-only pathway leading to the public park.
27
ONESQKMMONTREALBEIJING STREET HIERARCHY & BLOCK SIZE | SUNGHUN (LUKE) LEE
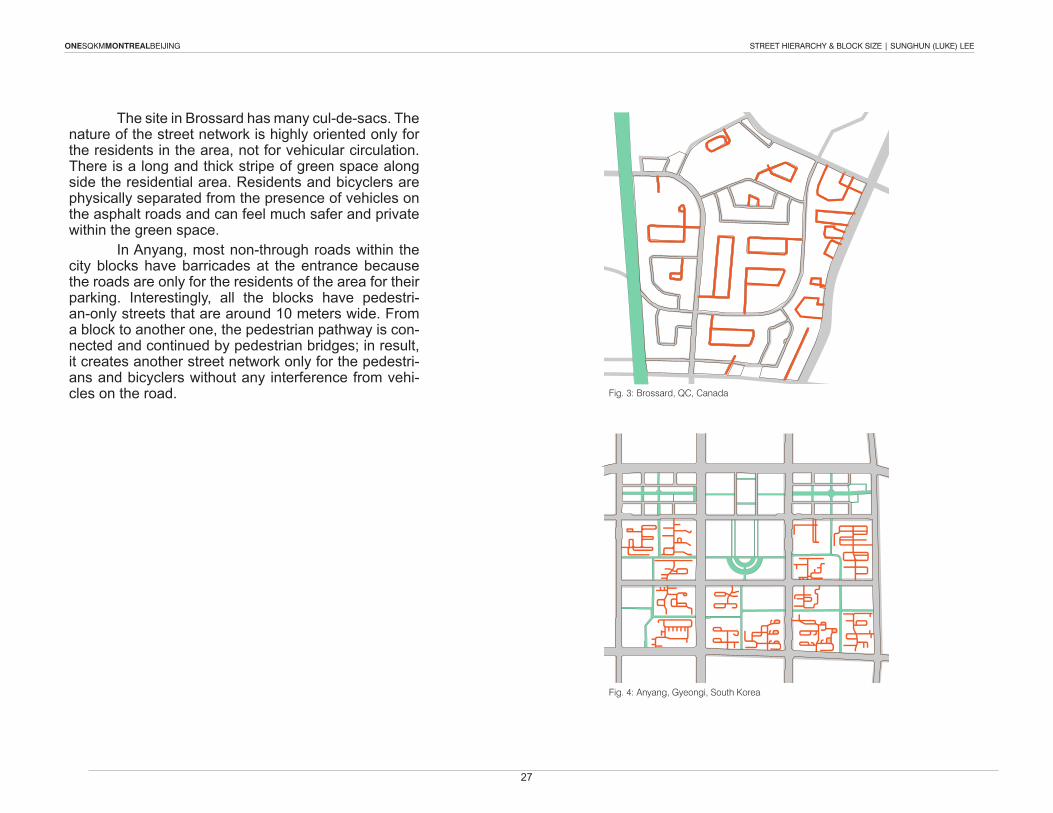
Fig. 3: Brossard, QC, Canada
Fig. 4: Anyang, Gyeongi, South Korea
The site in Brossard has many cul-de-sacs. The nature of the street network is highly oriented only for the residents in the area, not for vehicular circulation. There is a long and thick stripe of green space along side the residential area. Residents and bicyclers are physically separated from the presence of vehicles on the asphalt roads and can feel much safer and private within the green space. In Anyang, most non-through roads within the city blocks have barricades at the entrance because the roads are only for the residents of the area for their parking. Interestingly, all the blocks have pedestri-an-only streets that are around 10 meters wide. From a block to another one, the pedestrian pathway is con-nected and continued by pedestrian bridges; in result, it creates another street network only for the pedestri-ans and bicyclers without any interference from vehi-cles on the road.

28
ONESQKMMONTREALBEIJING STREET HIERARCHY & BLOCK SIZE | SUNGHUN (LUKE) LEE
Beijing Plateau Brossard AnyangArea (ha)Site Area 117.18 119.37 113.96 116.60Road Area 18.70 24.58 17.58 23.43
Road Area (%) 15.96% 20.60% 15.43% 20.09%
Beijing Plateau Brossard AnyangArea (ha)Site Area 117.18 119.37 113.96 116.60Road Area 25.90 36.08 17.58 35.06
Road Area (%) 22.10% 30.23% 15.43% 30.07%
Road Area 25.90 36.08 17.58 35.06
4th type 7.20 11.50 0.00 11.63
Road Area 18.70 24.58 17.58 23.43
Fig. 3: Area Comparison of Through Roads and Resident-Only Roads
BEIJING PLATEAU BROSSARD ANYANG
Fig. 4: Percentage of Resident-Only roads in the Total Road Area
Fig. 1: Road Area Calculation (Through Roads) Fig. 2: Road Area Calculation (Including Resident-Only Roads)
0.00
5.00
10.00
15.00
20.00
25.00
30.00
35.00
40.00Resident-Only Through Roads
0%
20%
40%
60%
80%
100%
0.00
5.00
10.00
15.00
20.00
25.00
30.00
35.00
40.00Resident-Only Through Roads
0%
20%
40%
60%
80%
100%
ROAD AREA
To determine the level of vehicular dominance within the site areas, the percentage of road area is calculated in two different ways. The first calculation indicates the level of traffic derived from vehicular cir-culation on the through roads within the sites. It only includes the first three types of streets: arterial, sec-ondary, and tertiary. Beijing and Brossard have the similar percent-age number which is approximately 16%, and Plateau and Anyang also have the similar number which is 20%. The second calculation represents the percent-age of road area that includes vehicular streets that are limited or accessible to only residents, such as back alleys and non-through roads. In this calculation, Beijing gets 22%. Plateau and Anyang once again get a similar number which is 30%. Since Brossard does not have any particular lim-ited vehicular streets, it is exempted from the calcula-tion. The Figure 3 is the graphical representation of the area comparison of the two types of road area. The yellow dashed line represents the vehicular permeabil-ity to the resident-only roads. The Figure 4 is the graphical representation of the percentage of the resident-only road in the to-tal road area of the each study site. In this graph, the overall percentage of the resident-only roads are quite similar to one another, excluding the Brossard area; the level of privacy in relation to the road area are pro-portionally close to identical.
29
ONESQKMMONTREALBEIJING STREET HIERARCHY & BLOCK SIZE | SUNGHUN (LUKE) LEE
Fig. 1: Combined Graphs of Floor Area Ratio and Total Road Area
BEIJING
PLATEAU BROSSARD ANYANG
Fig. 2: Combined Graphs of Population Density and Total Road Area
2.05
1.17
0.35
3.6
25.90
36.08
17.58
35.06
0.00
5.00
10.00
15.00
20.00
25.00
30.00
35.00
40.00
0
0.5
1
1.5
2
2.5
3
3.5
4
Floor Area RatioTotal Road Area
25.90
36.08
17.58
35.06 22635
12348
1753
11000
0.00
5.00
10.00
15.00
20.00
25.00
30.00
35.00
40.00
0
5000
10000
15000
20000
25000
Density (per km2)Total Road Area
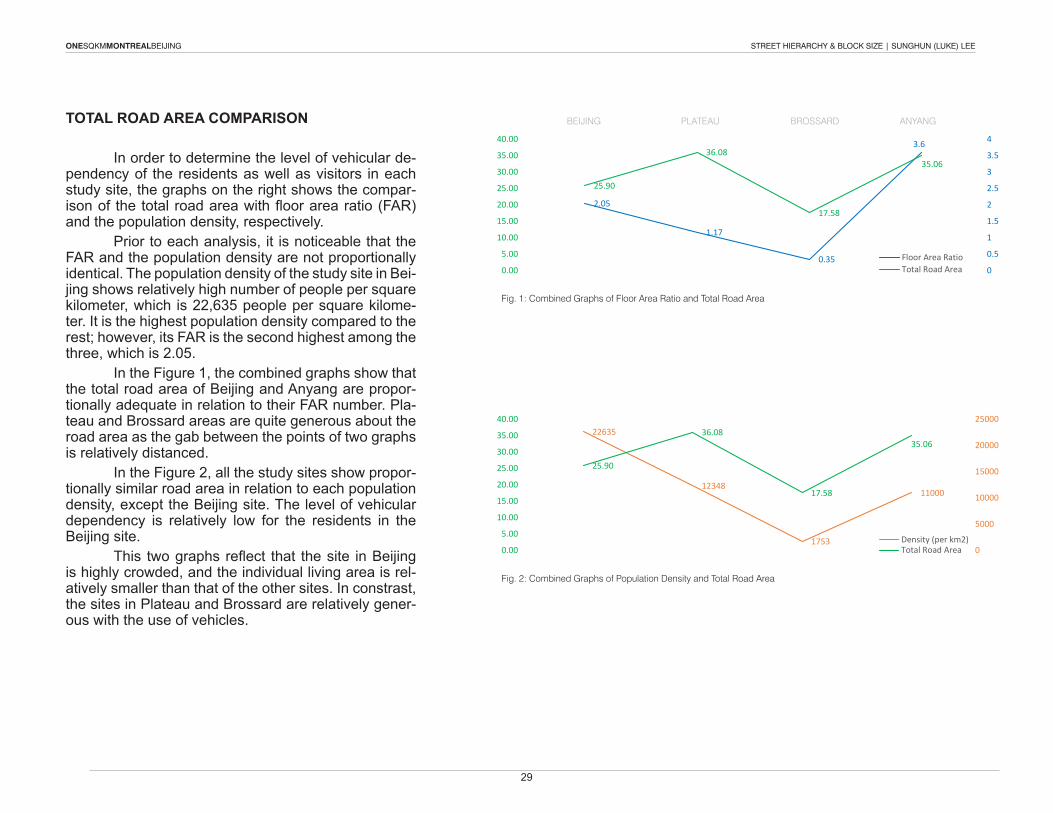
BEIJINGTOTAL ROAD AREA COMPARISON
In order to determine the level of vehicular de-pendency of the residents as well as visitors in each study site, the graphs on the right shows the compar-ison of the total road area with floor area ratio (FAR) and the population density, respectively. Prior to each analysis, it is noticeable that the FAR and the population density are not proportionally identical. The population density of the study site in Bei-jing shows relatively high number of people per square kilometer, which is 22,635 people per square kilome-ter. It is the highest population density compared to the rest; however, its FAR is the second highest among the three, which is 2.05. In the Figure 1, the combined graphs show that the total road area of Beijing and Anyang are propor-tionally adequate in relation to their FAR number. Pla-teau and Brossard areas are quite generous about the road area as the gab between the points of two graphs is relatively distanced. In the Figure 2, all the study sites show propor-tionally similar road area in relation to each population density, except the Beijing site. The level of vehicular dependency is relatively low for the residents in the Beijing site. This two graphs reflect that the site in Beijing is highly crowded, and the individual living area is rel-atively smaller than that of the other sites. In constrast, the sites in Plateau and Brossard are relatively gener-ous with the use of vehicles.
30
ONESQKMMONTREALBEIJING STREET HIERARCHY & BLOCK SIZE | SUNGHUN (LUKE) LEE
ANALYSIS CONCLUSION
In Peter Calthorpe’s article Low Carbon City Design, he argues that “a denser network of narrower streets better optimizes traffic flow while creating more direct routes and improving safety for pedestrians. Road design should maxi-mize human mobility rather than vehicle throughput. Narrow streets that allow one-way motor traffic as well as bicycles and pedestrians will significantly reduce congestion and fuel use in Chinese cities by minimizing signal delays” (Calthor-pe 5). The most suitable example of the ideal city planning type for a sustainable city, according to Calthorpe’s article, is the study site in Le Pleateau-Mont-Royal with its typical Western grid plan. The studies in the previous pages show that his idea does not thoroughly reflect the population den-sity difference in each city; the level of vehicular dependen-cy of the residents is also a crucial factor to reflect the level of sustainability of a city as well. In the studies earlier, Beijing is the only city where the level of vehicular dependency is relatively low, and the pedestrian mobility is less affected by vehicles, compared to the other sites due to the high population density. To achieve a sustainble city planning design, the lev-el of vehicular dominance and pedestrian mobility should balance out in respect of the population density regardless the size of city blocks and street network.
31
ONESQKMMONTREALBEIJING STREET HIERARCHY & BLOCK SIZE | SUNGHUN (LUKE) LEE
Works Cited
Calthorpe, Peter. Low Carbon Cities: Principles and Prac-tices for China’s Next Generation of Growth. ClimateWorks Foundation. USA. Print.

ONESQKMMONTREALBEIJING STREET NETWORK | JUSTIN SPEC
33
MISSED CONNECTIONS: THE STREET NETWORK AND DEVELOPMENT PATTERNS OF CHINA AND MONTREAL This paper initiates an investigation into the street network and development patterns of modern expansion and intensification in Beijing, China to ascertain the influence of the megablock in current trends of urbanization. This analysis will be juxtaposed with two distinct precedents of planning typologies from Montreal, Canada. Current western theories on urban design characteristically dismiss the megablock as an unsustainable method of development. This dissatisfaction is plainly elucidated by Cliff Moughtin, an Emiritus Professor of architecture and planning:
The larger and more homogenous the street block, the greater will be its power to destroy the social, economic, and physical networks of the city. The large-scale, single-use, single-ownership street block is the instrument most influential in the decline of the city: its effect – together with that of its partner the motorcar – are among the real causes of the death of the great city.1
The result of Westerners’ experimentations with modernism and the failure of the ‘building in the park’ typology paved the way to the contemporary ideal: urban villages emphasizing small blocks within a grid layout consisting of a mixture of uses and accessible pedestrian and public transit connections – such as Montreal’s Plateau district. This does not alter the reality that low-density suburban housing in the sprawling
1 Moughtin, Cliff. "The Urban Street Block." Urban Design: Green Dimensions. Oxford: Butterworth Architecture, 1996. 193-216. Print.
periphery of the city is continuously in high demand. In Beijing’s defense, it could be contended that many megablocks realize the prerequisites of an urban village at an altered scale. It is imperative to determine the exact proportions of these megablocks from a Western mindset: are they up-scaled city blocks as we currently state? Or slightly down-scaled urban villages? And what constitutes the difference? The former has a negative connotation, while the latter could contribute to validating aspects of China’s current development trends. This dichotomy can often be decided through analysis of street network patterns and the internal connections each precedent exemplifies. To begin this analysis, it is essential to define several fundamental terminologies: A megablock, or superblock, is a large, usually rectangular parcel of land (the Beijing site being 100 hectares) bordered on all sides by multi-lane, major vehicular arterial roads. The interiors of these blocks are subdivided based on property ownership, not by a city-mandated street grid. Developed from previously uninhabited or low-density areas, there is no gradual evolution of city fabric, but instead each parcel is utilized as a laboratory for large-scale, rapid urban projects. Western mentality specifies a gated community as a privately owned, usually suburban, housing development in which gates or walls stringently limit public access. They are frequently equipped with communal amenity spaces shared amongst residents. Gated communities are often criticized, as instances of segregation, especially those of an economic nature, are largely perceived with a negative stigma.
ONESQKMMONTREALBEIJING STREET NETWORK | JUSTIN SPEC
34
Figure 2 - Example of an urban village. The Plateau, Montreal, Canada. http://www.maps.google.ca/
Figure 3 – Figure-ground diagrams of three varying street network typologies at a consistent scale. From left to right: megablocks in Beijing, the urban village scheme in the Plateau, and suburban development on Montreal's south shore.
One of the consequences of Beijing’s prevalent communal housing blocks resides in their limited access in terms of vehicular and pedestrian connectivity to the remainder of the megablock. Only two or three controlled entrances or exits typically serve each development. These restrictive measures, paired with the lack of coordination between individual private developers, leads to the formation of a haphazard network of
internal streets and lanes within the larger superblock, resembling increasingly suburban street network conditions. This absence of through-connections severely impacts the functionality of each megablock as an urban village. The foremost distinction originates in the previously established infrastructure (roads, water, waste, power, etc) of Western examples that developers are compelled to accommodate. Beijing projects are customarily fashioned from a blank canvas with fewer obligations for street connections or public accessibility.
Figure 4 - Analysis of the walls or barriers of the megablock's community housing developme
Community developments in Beijing (and popular throughout many other rapidly expanding Asian cities) are also housing schemes contained within a set boundary. Typically, public accessibility is less rigid in comparison to their gated Western counterparts, although a certain degree of homogeneity among residents is established. Instead, motivated to establish a sense of community within large-scale residential developments, these projects achieve a level of safety and privacy coveted by many Asian homeowners in quickly intensifying urban settings. The urban village typology will be mentioned on numerous occasions in this text, predominantly in reference to Montreal’s Plateau district. Small, rectangular blocks and a thorough mix of land uses define this neighborhood. Walking and cycling are encouraged, as well as connectivity to the city’s public transit network. There is a cohesive sense of community between residents. Each typology surveyed in this study (megablock, urban village, suburb) has its own particular set of advantages and disadvantages, often beginning with the basic unit of urban development: the block size and therefore the street network. Suburbs will generally produce unwalkable, auto-reliant communities with ample private space and well defined amenity space. Typically, there is a strict division between residential and other land uses such as commercial or institutional. Urban villages contrast these ideals with tight-knit, piecemeal development and an understanding of the street as the public realm. There are scarce instances of private open space. The megablocks synthesize elements from both the suburbs and the urban village. A rigid grid is developed at a large scale and infilled with a relatively suburban street network (ie. cul de sacs, courts, winding roads, etc), albeit at a
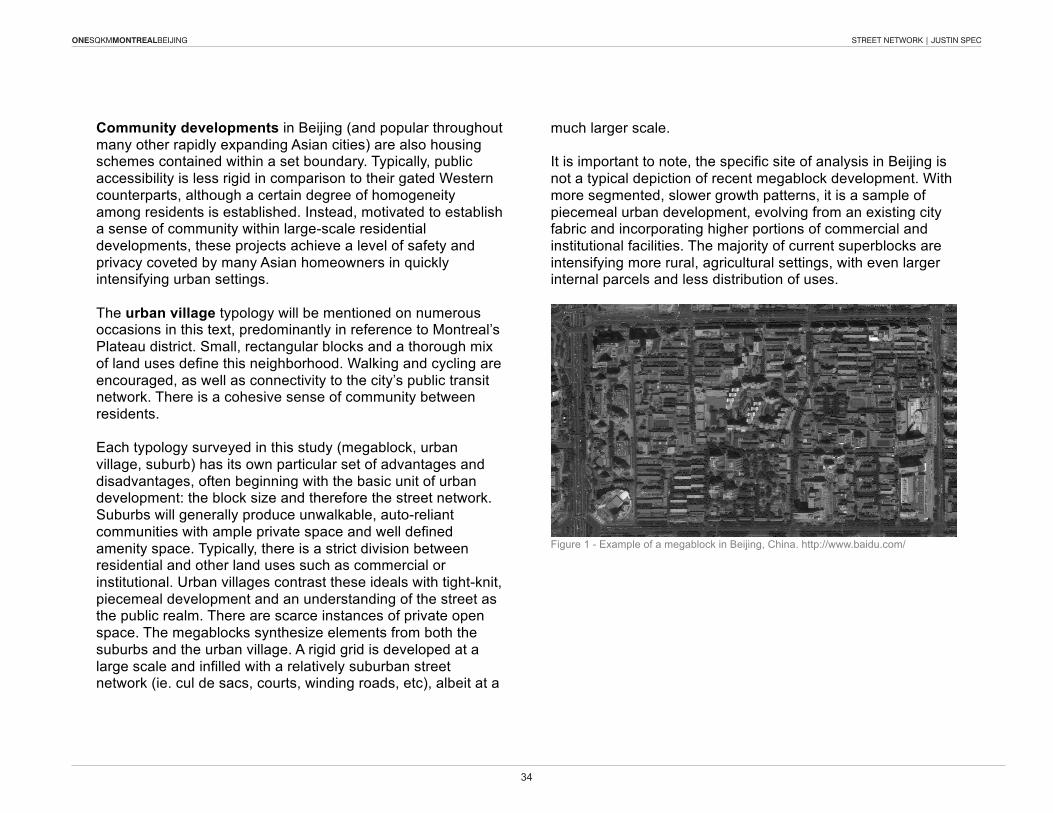
much larger scale. It is important to note, the specific site of analysis in Beijing is not a typical depiction of recent megablock development. With more segmented, slower growth patterns, it is a sample of piecemeal urban development, evolving from an existing city fabric and incorporating higher portions of commercial and institutional facilities. The majority of current superblocks are intensifying more rural, agricultural settings, with even larger internal parcels and less distribution of uses.
Figure 1 - Example of a megablock in Beijing, China. http://www.baidu.com/

ONESQKMMONTREALBEIJING STREET NETWORK | JUSTIN SPEC
35
Figure 2 - Example of an urban village. The Plateau, Montreal, Canada. http://www.maps.google.ca/
Figure 3 – Figure-ground diagrams of three varying street network typologies at a consistent scale. From left to right: megablocks in Beijing, the urban village scheme in the Plateau, and suburban development on Montreal's south shore.
One of the consequences of Beijing’s prevalent communal housing blocks resides in their limited access in terms of vehicular and pedestrian connectivity to the remainder of the megablock. Only two or three controlled entrances or exits typically serve each development. These restrictive measures, paired with the lack of coordination between individual private developers, leads to the formation of a haphazard network of
internal streets and lanes within the larger superblock, resembling increasingly suburban street network conditions. This absence of through-connections severely impacts the functionality of each megablock as an urban village. The foremost distinction originates in the previously established infrastructure (roads, water, waste, power, etc) of Western examples that developers are compelled to accommodate. Beijing projects are customarily fashioned from a blank canvas with fewer obligations for street connections or public accessibility.
Figure 4 - Analysis of the walls or barriers of the megablock's community housing developme
ONESQKMMONTREALBEIJING STREET NETWORK | JUSTIN SPEC
36
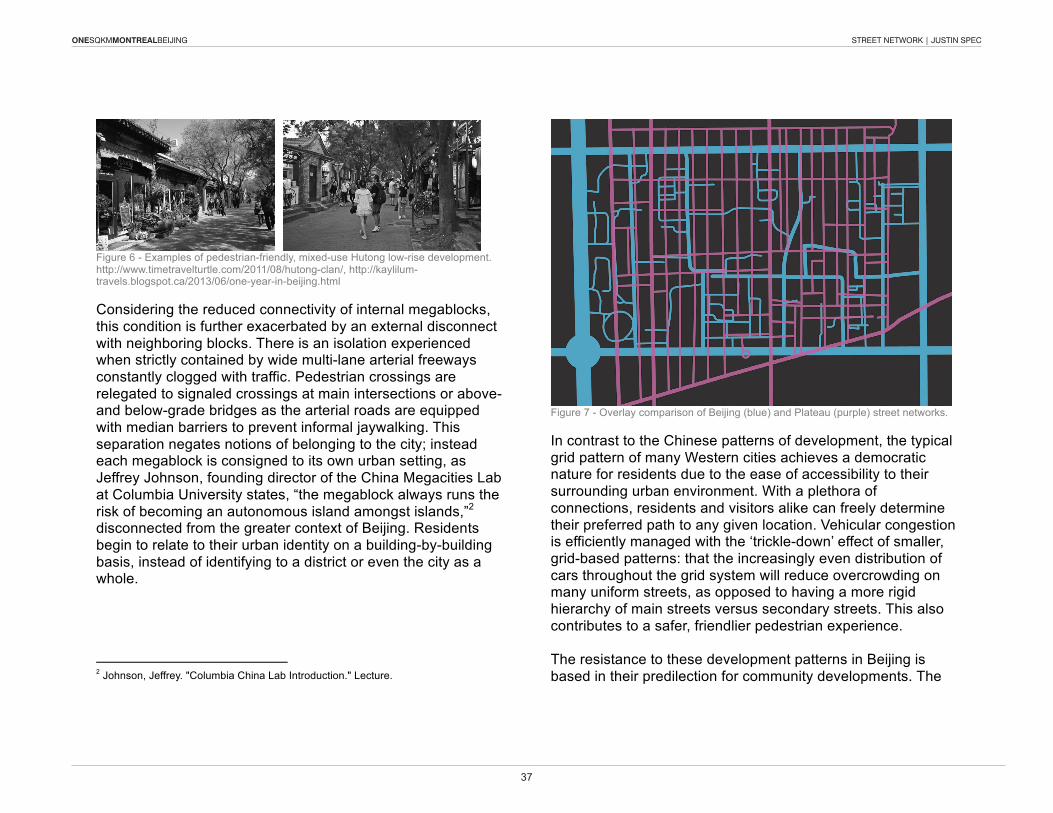
Figure 6 - Examples of pedestrian-friendly, mixed-use Hutong low-rise development. http://www.timetravelturtle.com/2011/08/hutong-clan/, http://kaylilum-travels.blogspot.ca/2013/06/one-year-in-beijing.html
Considering the reduced connectivity of internal megablocks, this condition is further exacerbated by an external disconnect with neighboring blocks. There is an isolation experienced when strictly contained by wide multi-lane arterial freeways constantly clogged with traffic. Pedestrian crossings are relegated to signaled crossings at main intersections or above- and below-grade bridges as the arterial roads are equipped with median barriers to prevent informal jaywalking. This separation negates notions of belonging to the city; instead each megablock is consigned to its own urban setting, as Jeffrey Johnson, founding director of the China Megacities Lab at Columbia University states, “the megablock always runs the risk of becoming an autonomous island amongst islands,”2 disconnected from the greater context of Beijing. Residents begin to relate to their urban identity on a building-by-building basis, instead of identifying to a district or even the city as a whole.
2 Johnson, Jeffrey. "Columbia China Lab Introduction." Lecture.
Figure 7 - Overlay comparison of Beijing (blue) and Plateau (purple) street networks.
In contrast to the Chinese patterns of development, the typical grid pattern of many Western cities achieves a democratic nature for residents due to the ease of accessibility to their surrounding urban environment. With a plethora of connections, residents and visitors alike can freely determine their preferred path to any given location. Vehicular congestion is efficiently managed with the ‘trickle-down’ effect of smaller, grid-based patterns: that the increasingly even distribution of cars throughout the grid system will reduce overcrowding on many uniform streets, as opposed to having a more rigid hierarchy of main streets versus secondary streets. This also contributes to a safer, friendlier pedestrian experience. The resistance to these development patterns in Beijing is based in their predilection for community developments. The
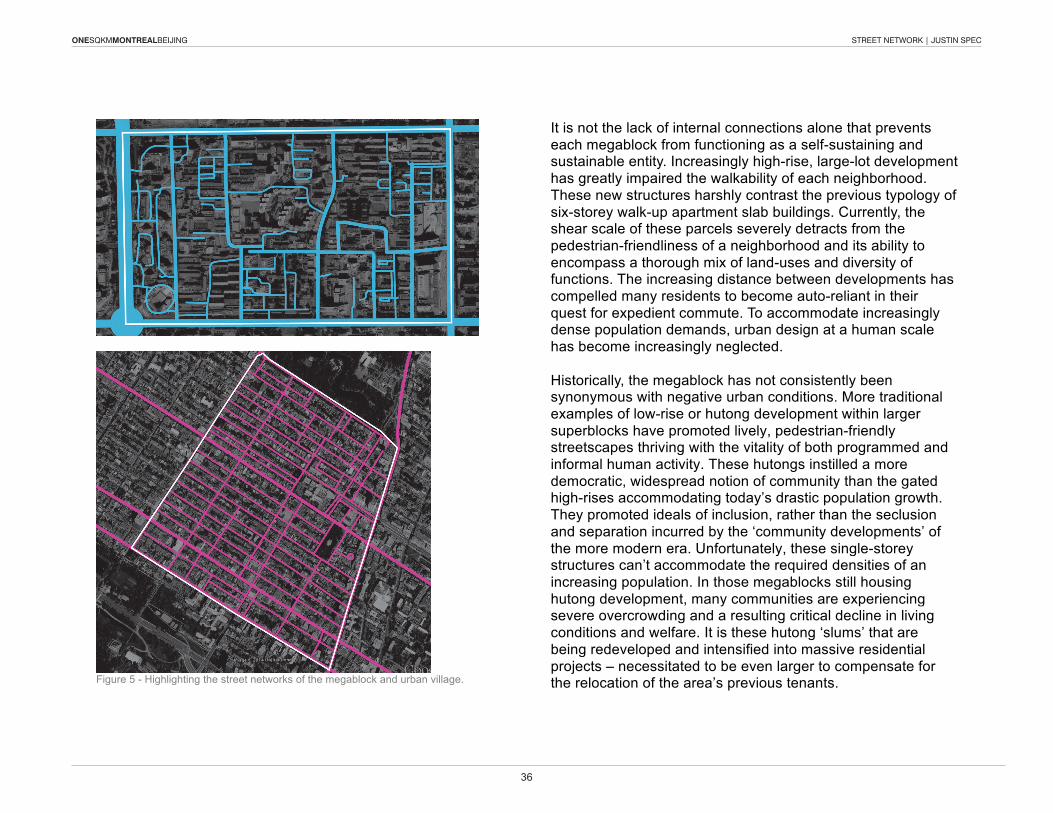
Figure 5 - Highlighting the street networks of the megablock and urban village.
It is not the lack of internal connections alone that prevents each megablock from functioning as a self-sustaining and sustainable entity. Increasingly high-rise, large-lot development has greatly impaired the walkability of each neighborhood. These new structures harshly contrast the previous typology of six-storey walk-up apartment slab buildings. Currently, the shear scale of these parcels severely detracts from the pedestrian-friendliness of a neighborhood and its ability to encompass a thorough mix of land-uses and diversity of functions. The increasing distance between developments has compelled many residents to become auto-reliant in their quest for expedient commute. To accommodate increasingly dense population demands, urban design at a human scale has become increasingly neglected. Historically, the megablock has not consistently been synonymous with negative urban conditions. More traditional examples of low-rise or hutong development within larger superblocks have promoted lively, pedestrian-friendly streetscapes thriving with the vitality of both programmed and informal human activity. These hutongs instilled a more democratic, widespread notion of community than the gated high-rises accommodating today’s drastic population growth. They promoted ideals of inclusion, rather than the seclusion and separation incurred by the ‘community developments’ of the more modern era. Unfortunately, these single-storey structures can’t accommodate the required densities of an increasing population. In those megablocks still housing hutong development, many communities are experiencing severe overcrowding and a resulting critical decline in living conditions and welfare. It is these hutong ‘slums’ that are being redeveloped and intensified into massive residential projects – necessitated to be even larger to compensate for the relocation of the area’s previous tenants.
ONESQKMMONTREALBEIJING STREET NETWORK | JUSTIN SPEC
37
Figure 6 - Examples of pedestrian-friendly, mixed-use Hutong low-rise development. http://www.timetravelturtle.com/2011/08/hutong-clan/, http://kaylilum-travels.blogspot.ca/2013/06/one-year-in-beijing.html
Considering the reduced connectivity of internal megablocks, this condition is further exacerbated by an external disconnect with neighboring blocks. There is an isolation experienced when strictly contained by wide multi-lane arterial freeways constantly clogged with traffic. Pedestrian crossings are relegated to signaled crossings at main intersections or above- and below-grade bridges as the arterial roads are equipped with median barriers to prevent informal jaywalking. This separation negates notions of belonging to the city; instead each megablock is consigned to its own urban setting, as Jeffrey Johnson, founding director of the China Megacities Lab at Columbia University states, “the megablock always runs the risk of becoming an autonomous island amongst islands,”2 disconnected from the greater context of Beijing. Residents begin to relate to their urban identity on a building-by-building basis, instead of identifying to a district or even the city as a whole.
2 Johnson, Jeffrey. "Columbia China Lab Introduction." Lecture.
Figure 7 - Overlay comparison of Beijing (blue) and Plateau (purple) street networks.
In contrast to the Chinese patterns of development, the typical grid pattern of many Western cities achieves a democratic nature for residents due to the ease of accessibility to their surrounding urban environment. With a plethora of connections, residents and visitors alike can freely determine their preferred path to any given location. Vehicular congestion is efficiently managed with the ‘trickle-down’ effect of smaller, grid-based patterns: that the increasingly even distribution of cars throughout the grid system will reduce overcrowding on many uniform streets, as opposed to having a more rigid hierarchy of main streets versus secondary streets. This also contributes to a safer, friendlier pedestrian experience. The resistance to these development patterns in Beijing is based in their predilection for community developments. The
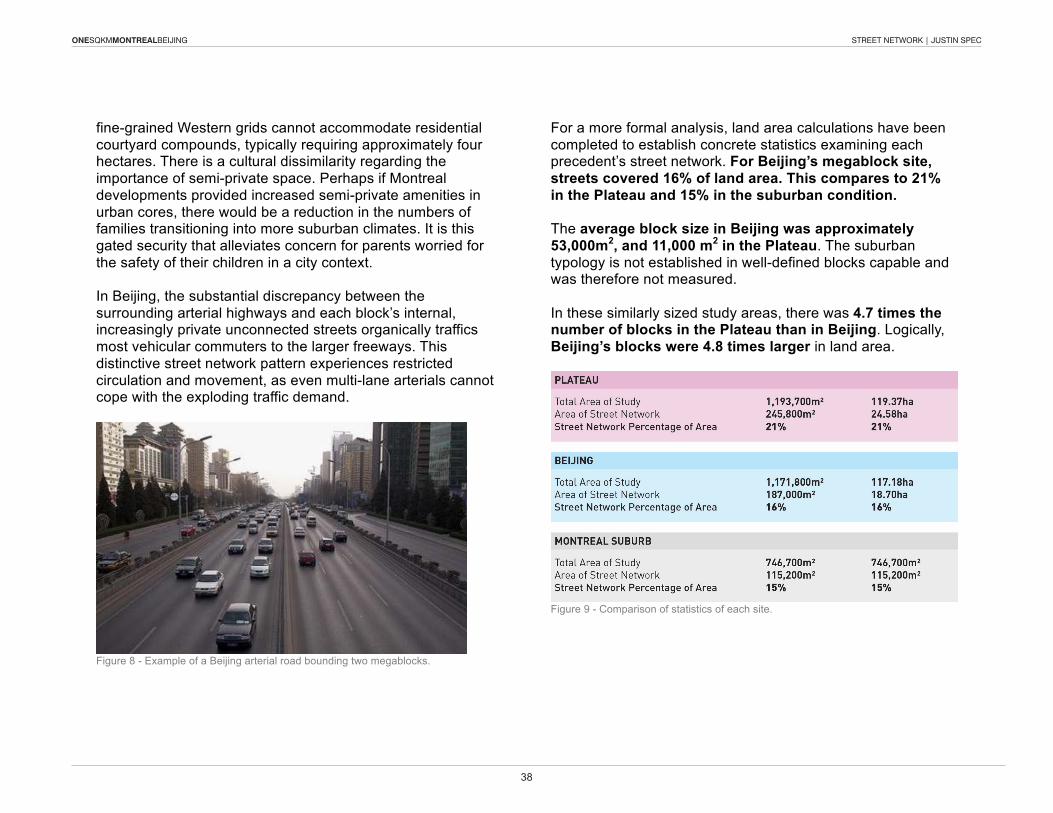
ONESQKMMONTREALBEIJING STREET NETWORK | JUSTIN SPEC
38
Figure 10 - Average block sizes for Beijing megablock and Montreal Plateau: 53,000m2 and 11,000m2 respectively.
This analysis was extended into the realm of possibility, imagining the same statistics if Beijing were to actively connect the internal street networks of the megablock. These numbers
do not represent the condition of a fine grain grid pattern overlaid within the block, but instead depict the potential if private streets were publicized and dead ends and segmented streets were connected similar to Figure 11. This would result in a street network that occupies 26% of the entire site area, instead of the existing 16%. A higher percentage area does not automatically indicate a better urban condition though, as these streets are not a formalized grid pattern, nor necessarily scaled to an adequate pedestrian dimension. It would aid in the vehicular accessibility and congestion issues that plague China’s arterial main streets, providing an array of alternative routes.
Figure 11 - Beijing's unconnected internal street network, depicting where connections would be most valuable.
As with most planning matters, there is no single blanket solution and an interdisciplinary approach must be taken to incorporate social, economic, cultural, and physical factors.
fine-grained Western grids cannot accommodate residential courtyard compounds, typically requiring approximately four hectares. There is a cultural dissimilarity regarding the importance of semi-private space. Perhaps if Montreal developments provided increased semi-private amenities in urban cores, there would be a reduction in the numbers of families transitioning into more suburban climates. It is this gated security that alleviates concern for parents worried for the safety of their children in a city context. In Beijing, the substantial discrepancy between the surrounding arterial highways and each block’s internal, increasingly private unconnected streets organically traffics most vehicular commuters to the larger freeways. This distinctive street network pattern experiences restricted circulation and movement, as even multi-lane arterials cannot cope with the exploding traffic demand.
Figure 8 - Example of a Beijing arterial road bounding two megablocks.
For a more formal analysis, land area calculations have been completed to establish concrete statistics examining each precedent’s street network. For Beijing’s megablock site, streets covered 16% of land area. This compares to 21% in the Plateau and 15% in the suburban condition. The average block size in Beijing was approximately 53,000m2, and 11,000 m2 in the Plateau. The suburban typology is not established in well-defined blocks capable and was therefore not measured. In these similarly sized study areas, there was 4.7 times the number of blocks in the Plateau than in Beijing. Logically, Beijing’s blocks were 4.8 times larger in land area.
Figure 9 - Comparison of statistics of each site.
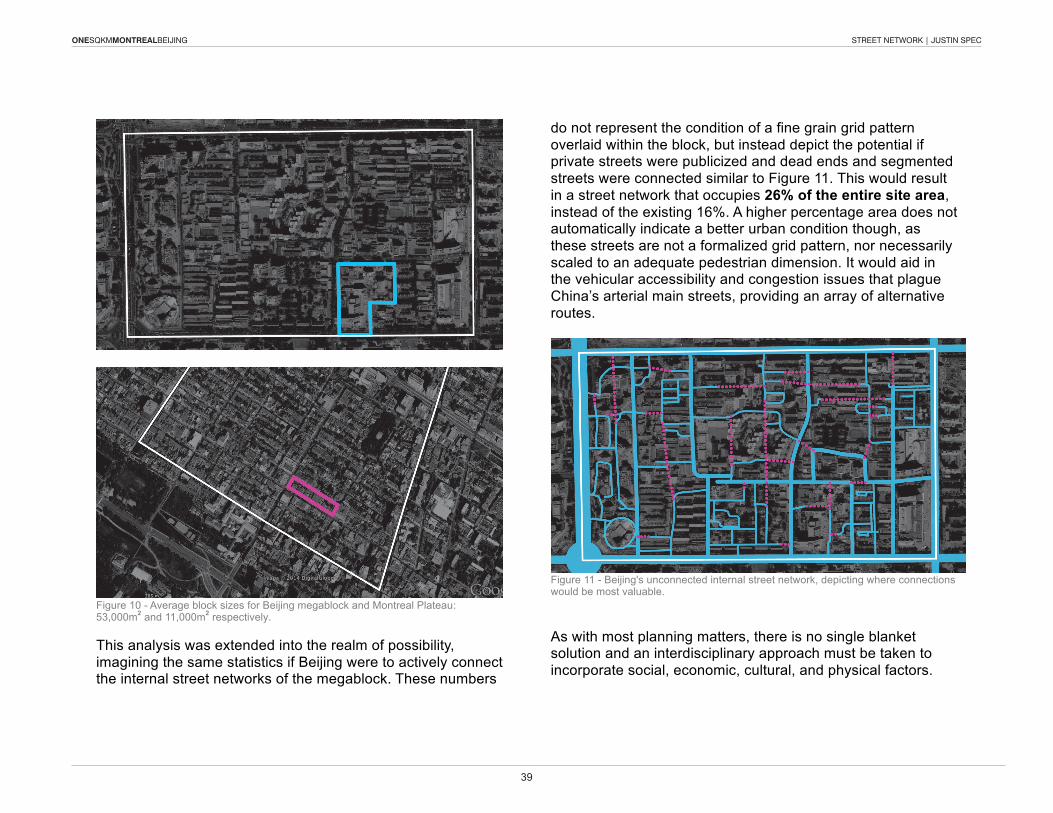
ONESQKMMONTREALBEIJING STREET NETWORK | JUSTIN SPEC
39
Figure 10 - Average block sizes for Beijing megablock and Montreal Plateau: 53,000m2 and 11,000m2 respectively.
This analysis was extended into the realm of possibility, imagining the same statistics if Beijing were to actively connect the internal street networks of the megablock. These numbers
do not represent the condition of a fine grain grid pattern overlaid within the block, but instead depict the potential if private streets were publicized and dead ends and segmented streets were connected similar to Figure 11. This would result in a street network that occupies 26% of the entire site area, instead of the existing 16%. A higher percentage area does not automatically indicate a better urban condition though, as these streets are not a formalized grid pattern, nor necessarily scaled to an adequate pedestrian dimension. It would aid in the vehicular accessibility and congestion issues that plague China’s arterial main streets, providing an array of alternative routes.
Figure 11 - Beijing's unconnected internal street network, depicting where connections would be most valuable.
As with most planning matters, there is no single blanket solution and an interdisciplinary approach must be taken to incorporate social, economic, cultural, and physical factors.
ONESQKMMONTREALBEIJING STREET NETWORK | JUSTIN SPEC
40
The interconnections within the planning process have numerous variables to manage. In Beijing, it might be necessary to alter the public’s predisposition towards car ownership before any amendments to street network patterns can be introduced. Conversely, the determining factor could be the lack of employment centres dispersed throughout the city. If job opportunities were in closer proximity, the demand for automobile ownership could lessen. Maybe Montreal’s urban development patterns require modification to encourage suburban residents back into the city. The megablock is still a fairly recent development in terms of planning ideologies. The current model has the potential to
evolve and adapt to adequately and sustainably satisfy the needs of China’s exploding population. This is not a criticism of the megablock, but rather a questioning of the current development patterns and scale of Beijing’s recent urbanization. It is entirely possible to establish a vital street life and pedestrian friendly streetscape through revisions to the typologies of residential buildings, the implementation of coordinated masterplans, and adjustments to the scale of development. A shift in emphasis must be made from the pure economics of necessity to the vision of well-designed neighborhoods for the people.
ONESQKMMONTREALBEIJING STREET NETWORK | JUSTIN SPEC
41
Bibliography
Calthorpe, Peter, and Martin C. Pedersen. "Q&A: Peter Calthorpe." Metropolis. N.p., 23 July 2013. Web. 8 Nov. 2014. Cole, Raymond, and Richard Lorch. Buildings, Culture and Environment: Informing Local and Global Practices. Oxford, UK:
Blackwell Pub., 2003. Print. Jacobs, Jane. The Death and Life of Great American Cities. N.p.: n.p., n.d. Print. Johnson, Jeffrey. "Columbia China Lab Introduction." Lecture. Krieger, Alex, and William S. Saunders. Urban Design. Minneapolis: U of Minnesota, 2009. Print. Luery, Matt. "Not So Superblocks." URBAN GORILLA. N.p., 21 Oct. 2010. Web. 10 Nov. 2014. Monson, Kjersti. "String Block Vs Superblock Patterns of Dispersal in China." Architectural Design 78.1 (2008): 46-53. Web. Moughtin, Cliff. "The Urban Street Block." Urban Design: Green Dimensions. Oxford: Butterworth Architecture, 1996. 193-216. Print. Niederhauser, Matthew. "Visions of Modernity: China's Gilded Age. Portfolio and Other Works by Matthew Niederhauser. N.p., 2010.
Web. 8 Nov. 2014. Shane, David G. "Block, Superblock and Megablock, A Short History. David Graham Shane." Arcduecitt World Architecture Research
City. N.p., 15 Jan. 2014. Web. 8 Nov. 2014.

about MIXED-LAND USEzhiyao CHEN jing XIE pierre FAN ZHU
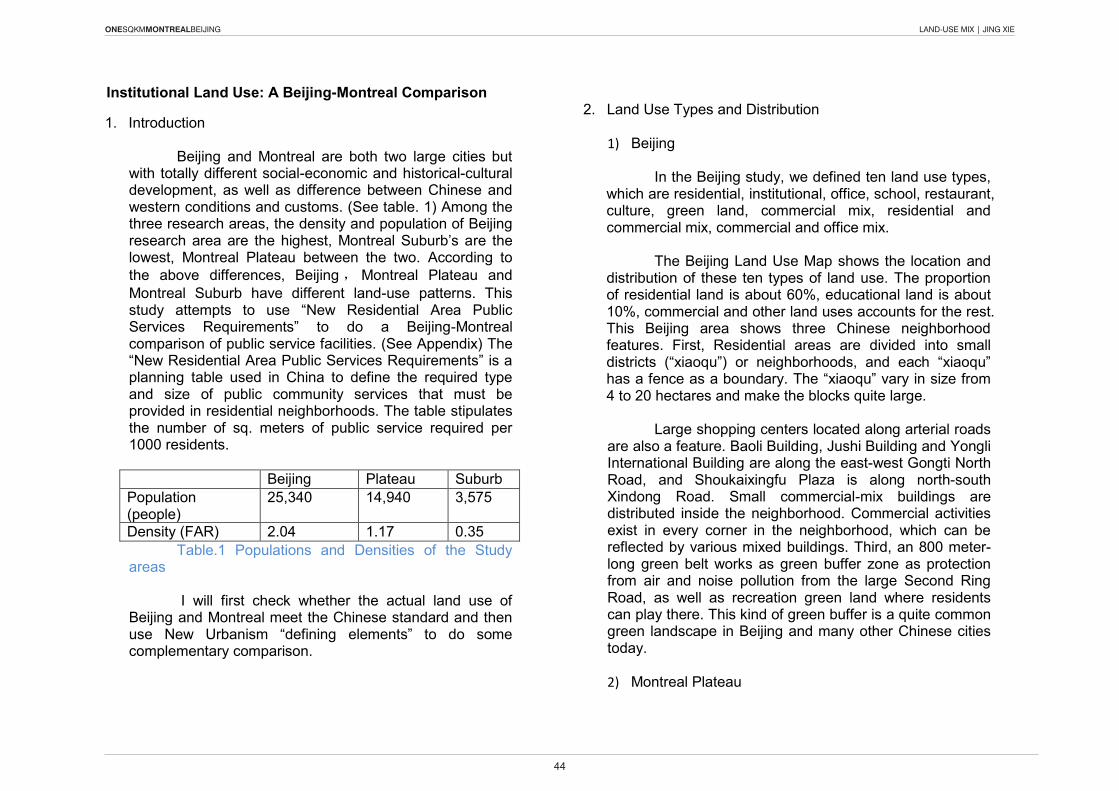
ONESQKMMONTREALBEIJING LAND-USE MIX | JING XIE
44
Institutional Land Use: A Beijing-Montreal Comparison
1. Introduction
Beijing and Montreal are both two large cities but with totally different social-economic and historical-cultural development, as well as difference between Chinese and western conditions and customs. (See table. 1) Among the three research areas, the density and population of Beijing research area are the highest, Montreal Suburb’s are the lowest, Montreal Plateau between the two. According to the above differences, Beijing , Montreal Plateau and Montreal Suburb have different land-use patterns. This study attempts to use “New Residential Area Public Services Requirements” to do a Beijing-Montreal comparison of public service facilities. (See Appendix) The “New Residential Area Public Services Requirements” is a planning table used in China to define the required type and size of public community services that must be provided in residential neighborhoods. The table stipulates the number of sq. meters of public service required per 1000 residents.
Beijing Plateau Suburb Population (people)
25,340 14,940 3,575
Density (FAR) 2.04 1.17 0.35 Table.1 Populations and Densities of the Study
areas I will first check whether the actual land use of
Beijing and Montreal meet the Chinese standard and then use New Urbanism “defining elements” to do some complementary comparison.
2. Land Use Types and Distribution
1) Beijing
In the Beijing study, we defined ten land use types,
which are residential, institutional, office, school, restaurant, culture, green land, commercial mix, residential and commercial mix, commercial and office mix.
The Beijing Land Use Map shows the location and
distribution of these ten types of land use. The proportion of residential land is about 60%, educational land is about 10%, commercial and other land uses accounts for the rest. This Beijing area shows three Chinese neighborhood features. First, Residential areas are divided into small districts (“xiaoqu”) or neighborhoods, and each “xiaoqu” has a fence as a boundary. The “xiaoqu” vary in size from 4 to 20 hectares and make the blocks quite large.
Large shopping centers located along arterial roads are also a feature. Baoli Building, Jushi Building and Yongli International Building are along the east-west Gongti North Road, and Shoukaixingfu Plaza is along north-south xindong Road. Small commercial-mix buildings are distributed inside the neighborhood. Commercial activities exist in every corner in the neighborhood, which can be reflected by various mixed buildings. Third, an 800 meter-long green belt works as green buffer zone as protection from air and noise pollution from the large Second Ring Road, as well as recreation green land where residents can play there. This kind of green buffer is a quite common green landscape in Beijing and many other Chinese cities today.
2) Montreal Plateau
ONESQKMMONTREALBEIJING LAND-USE MIX | JING XIE
45
In the Montreal Plateau study, we define eleven
land use types, residential corner store, restaurant, retail, other commercial, office, school, government, hospital, religious and park green.
From the Montreal Plateau Land Use Map, we can
find it is a very different land-use mix mode from Beijing neighborhood. First, residential land proportion is obviously higher than Beijing, approximately 73%. Most dwellings are townhouses or triplexes. Educational land proportion is lower than Beijing and school sizes are smaller. The most different feature is that there is no big shopping center like in Beijing, but there are various sizes of commercial streets in the Plateau. Four main commercial streets are two parallel east-west Saint Laurent Boulevard and Saint Denis
Street, two adjacent south-north Duluth Avenue East and Rachel Street East. Instead of long green belt, Montreal Plateau has a 1.3 hectare big green square, Saint Louis Square, and nine small green lands.
3) Montreal Suburb
As Montreal Suburb has the lowest population and density among the three neighborhoods, it has a very simple land-use mix mode. we only define four land use types, residential, commercial mix (commercial, office and clinic), education and green space. Dwellings are all detached houses. Commercial activities are all locate along Taschereau Boulevard. There is a secondary school at the intersection between Sorbonne Avenue and Pelletier Boulevard.
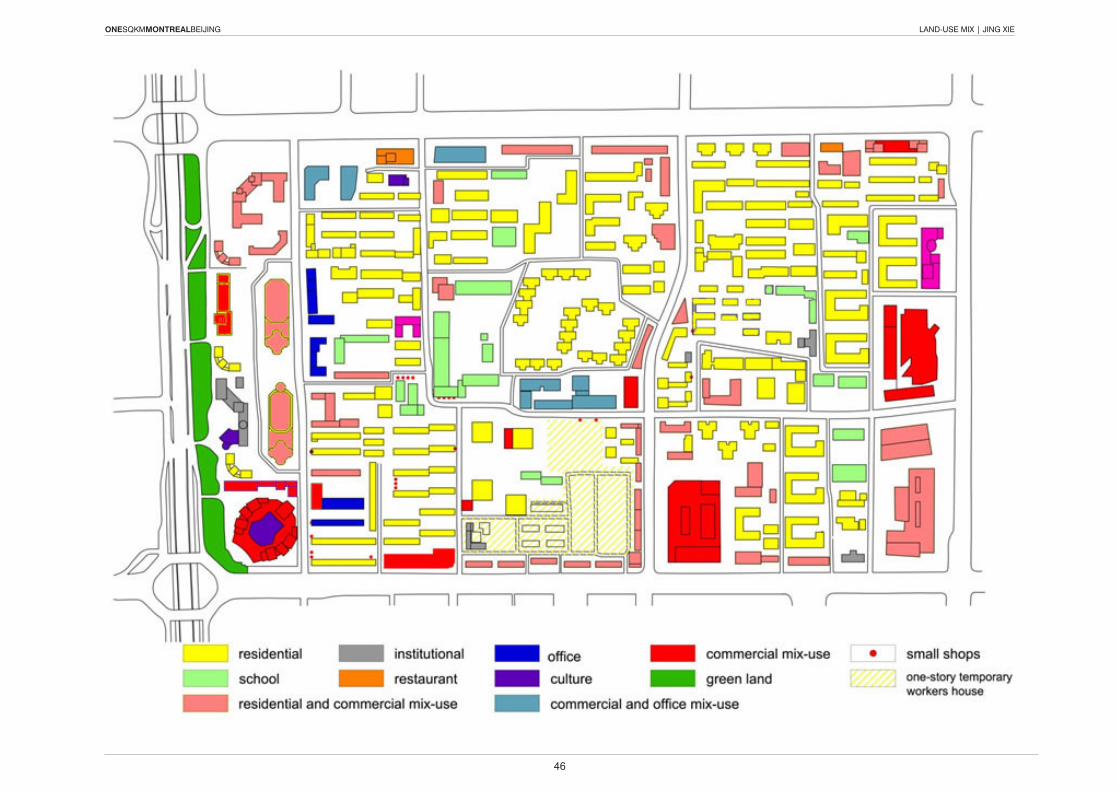
ONESQKMMONTREALBEIJING LAND-USE MIX | JING XIE
46
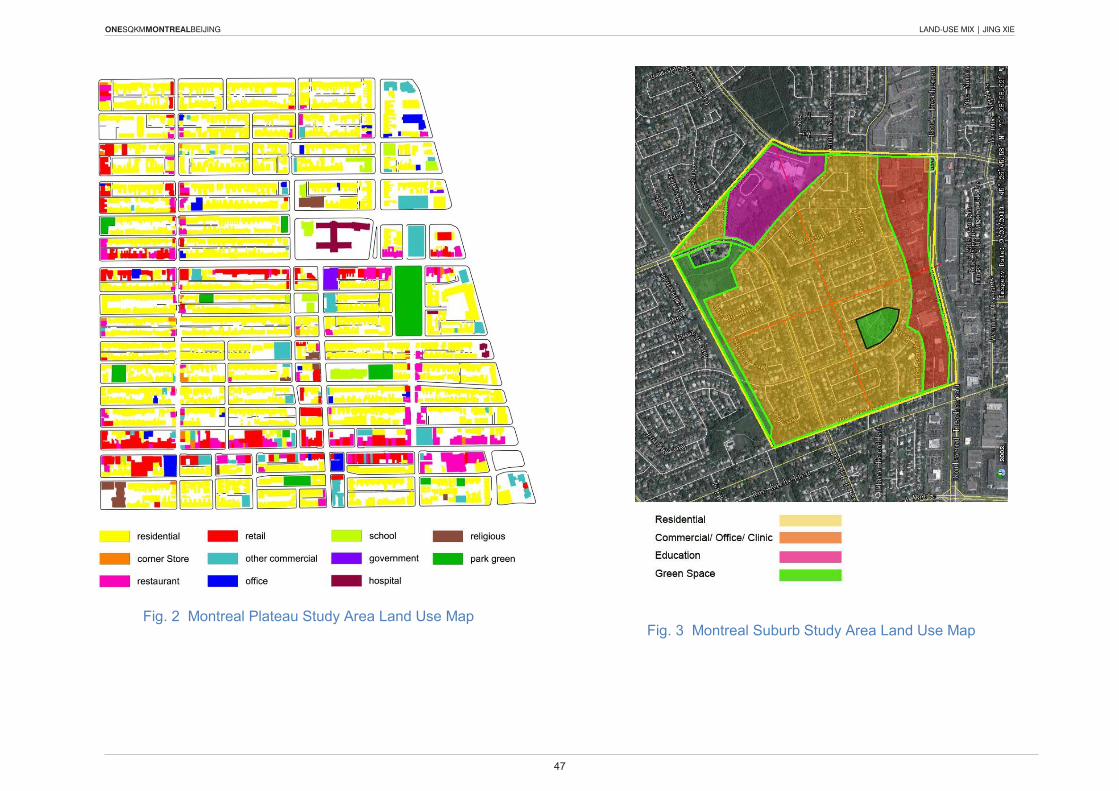
ONESQKMMONTREALBEIJING LAND-USE MIX | JING XIE
47
Fig. 2 Montreal Plateau Study Area Land Use Map
Fig. 3 Montreal Suburb Study Area Land Use Map
ONESQKMMONTREALBEIJING LAND-USE MIX | JING XIE
48
3. Compare Service Facilities Using the Chinese “1000 people standard”
In this part, we mainly compare Beijing and Montreal Plateau because these two sites are both located very close to downtown while Montreal Suburb is very far from downtown outside Montreal Island. Also, the population and land use types of the Montreal Suburb is not really comparable with the other two.
“New Residential Area Public Services
Construction Index” hereinafter referred to as “1000 people standard” because we only use the column from the table called “1000 people standard” in our study. We have the population densities of each study site and the land areas of the two sites. So we multiply density by land area to get population. For example, most of the Beijing study site locates in Doncheng District, whose density is 21,724 people/ km², and the area of Beijing study site is 1.1665 km². Therefore, the population of Beijing study area is about 25,340, and in the same way, the population of Plateau study area is about 14,940.
The following is a land use by use comparison of
the land area required as indicated by the “1000 people standard” table, and the areas actually occurring in the two study areas. There are two tables shown in the Appendix of this paper, One is for “Beijing New Residential Area 40,000 to 60,000 People”, and the other is for “Beijing New Residential Area 10,000 to 20,000 People”. I will use the second table; it’s population range is suitable for our study sites.
1) Education
In this study, we calculate the actual “building area” of Beijing and Montreal Plateau and compared to “1000 people standard”.
a. Beijing
In Beijing study area, there are two kindergartens, four elementary schools, one secondary school and one vocational school. According to the standard, the kindergarten building area should be between 7120 and 7855 m², the actual value is a little bit higher, about 9346 m². The elementary school building area should be between 6943 and 7729 m², while the actual area is very big, 36,307 m². The Secondary school building area should be between 8058 and 9198 m², but the actual value is also very high, 48,938 m².
b. Montreal Plateau
In Montreal Plateau study area, there are seven kindergartens, one elementary school, two secondary schools and the Dance Department of UQAM. According to the 1000 people standard, the kindergarten area should be between 4187 and 4619 m², the actual value is 3080 m², which is lower than standard. Elementary school area should be between 4083 m²and 4545 m², but the actual value is very low, 1302 m². The secondary school area should be between 4738 and 5409 m², the actual value is 3949 m².
From the above data, in the Beijing study area,
educational service building area includes all three levels, kindergarten, elementary school and secondary school. It not only satisfies the required building area to serve local residents but also can serve residents outside the neighborhood. Since our study area is about 1 km², which is a walkable neighborhood, it should be regarded as a walk-to-school neighborhood. However, in the Montreal
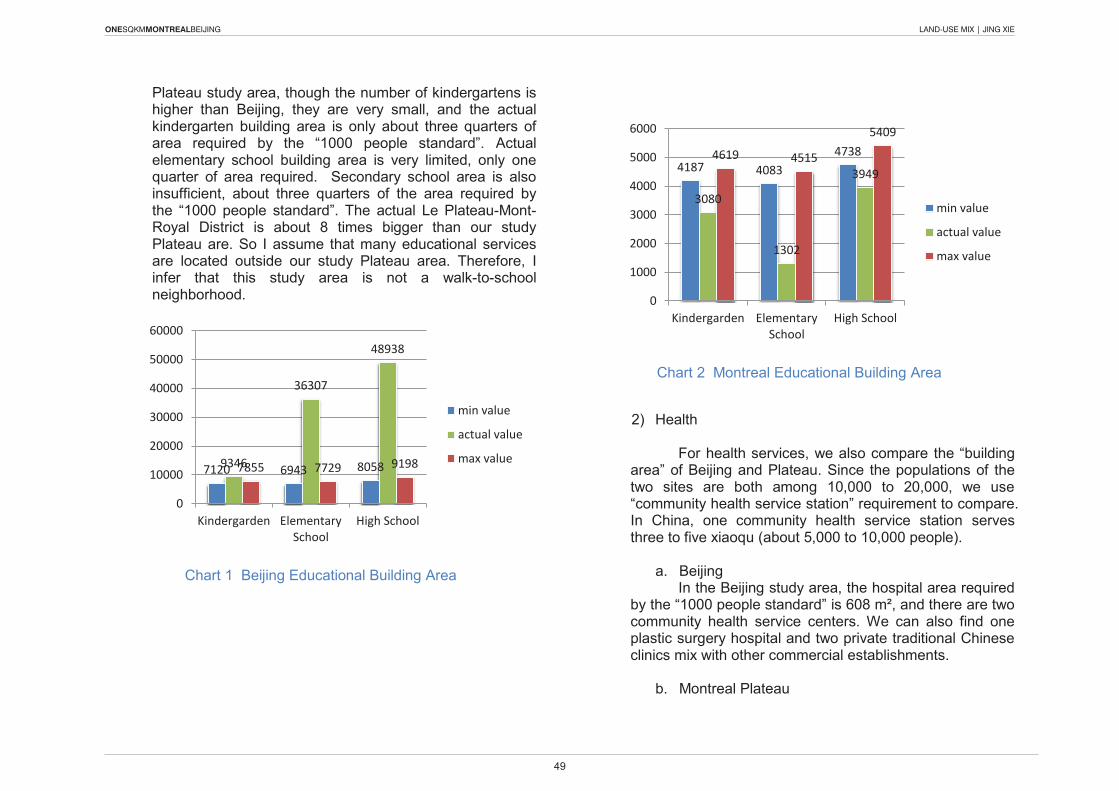
ONESQKMMONTREALBEIJING LAND-USE MIX | JING XIE
49
Plateau study area, though the number of kindergartens is higher than Beijing, they are very small, and the actual kindergarten building area is only about three quarters of area required by the “1000 people standard”. Actual elementary school building area is very limited, only one quarter of area required. Secondary school area is also insufficient, about three quarters of the area required by the “1000 people standard”. The actual Le Plateau-Mont-Royal District is about 8 times bigger than our study Plateau are. So I assume that many educational services are located outside our study Plateau area. Therefore, I infer that this study area is not a walk-to-school neighborhood.
Chart 1 Beijing Educational Building Area
Chart 2 Montreal Educational Building Area
2) Health
For health services, we also compare the “building
area” of Beijing and Plateau. Since the populations of the two sites are both among 10,000 to 20,000, we use “community health service station” requirement to compare. In China, one community health service station serves three to five xiaoqu (about 5,000 to 10,000 people).
a. Beijing
In the Beijing study area, the hospital area required by the “1000 people standard” is 608 m², and there are two community health service centers. we can also find one plastic surgery hospital and two private traditional Chinese clinics mix with other commercial establishments.
b. Montreal Plateau
7120 6943 8058 9346
36307
48938
7855 7729 9198
0
10000
20000
30000
40000
50000
60000
Kindergarden Elementary School
High School
min value
actual value
max value
4187 4083 4738
3080
1302
3949 4619 4515
5409
0
1000
2000
3000
4000
5000
6000
Kindergarden Elementary School
High School
min value
actual value
max value
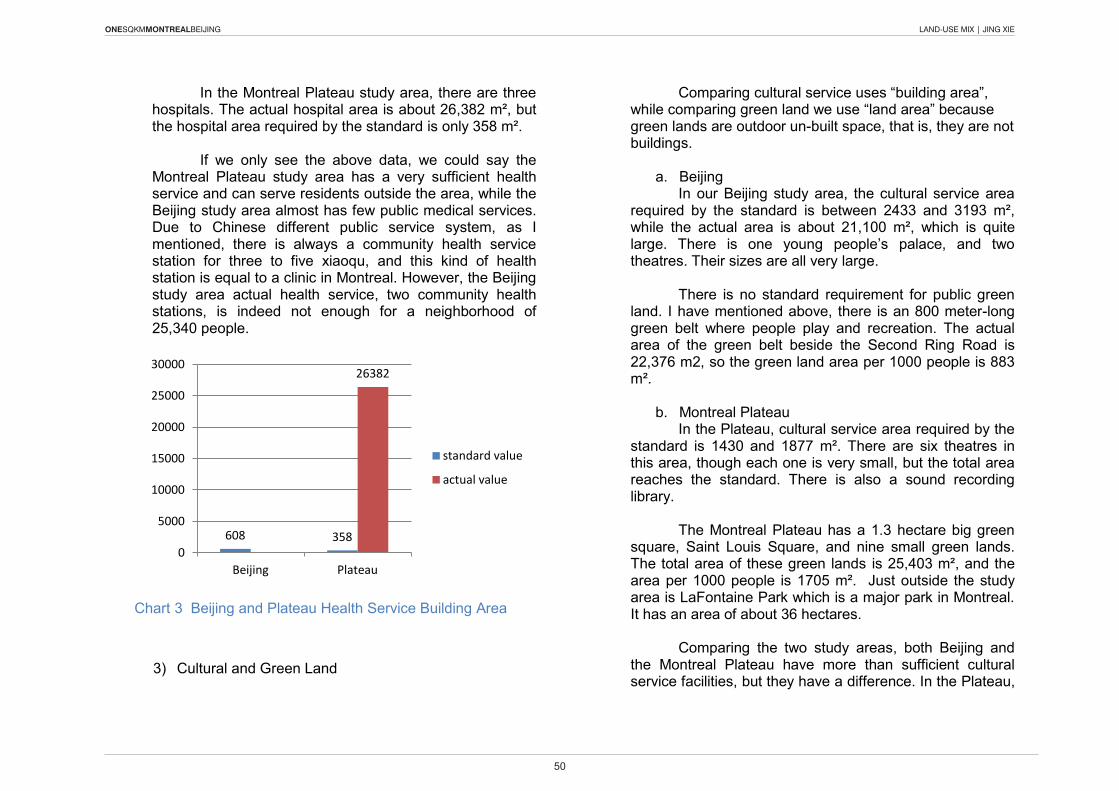
ONESQKMMONTREALBEIJING LAND-USE MIX | JING XIE
50
In the Montreal Plateau study area, there are three hospitals. The actual hospital area is about 26,382 m², but the hospital area required by the standard is only 358 m².
If we only see the above data, we could say the
Montreal Plateau study area has a very sufficient health service and can serve residents outside the area, while the Beijing study area almost has few public medical services. Due to Chinese different public service system, as I mentioned, there is always a community health service station for three to five xiaoqu, and this kind of health station is equal to a clinic in Montreal. However, the Beijing study area actual health service, two community health stations, is indeed not enough for a neighborhood of 25,340 people.
Chart 3 Beijing and Plateau Health Service Building Area
3) Cultural and Green Land
Comparing cultural service uses “building area”, while comparing green land we use “land area” because green lands are outdoor un-built space, that is, they are not buildings.
a. Beijing
In our Beijing study area, the cultural service area required by the standard is between 2433 and 3193 m², while the actual area is about 21,100 m², which is quite large. There is one young people’s palace, and two theatres. Their sizes are all very large.
There is no standard requirement for public green
land. I have mentioned above, there is an 800 meter-long green belt where people play and recreation. The actual area of the green belt beside the Second Ring Road is 22,376 m2, so the green land area per 1000 people is 883 m².
b. Montreal Plateau
In the Plateau, cultural service area required by the standard is 1430 and 1877 m². There are six theatres in this area, though each one is very small, but the total area reaches the standard. There is also a sound recording library.
The Montreal Plateau has a 1.3 hectare big green
square, Saint Louis Square, and nine small green lands. The total area of these green lands is 25,403 m², and the area per 1000 people is 1705 m². Just outside the study area is LaFontaine Park which is a major park in Montreal. It has an area of about 36 hectares.
Comparing the two study areas, both Beijing and
the Montreal Plateau have more than sufficient cultural service facilities, but they have a difference. In the Plateau,
608 358
26382
0
5000
10000
15000
20000
25000
30000
Beijing Plateau
standard value
actual value
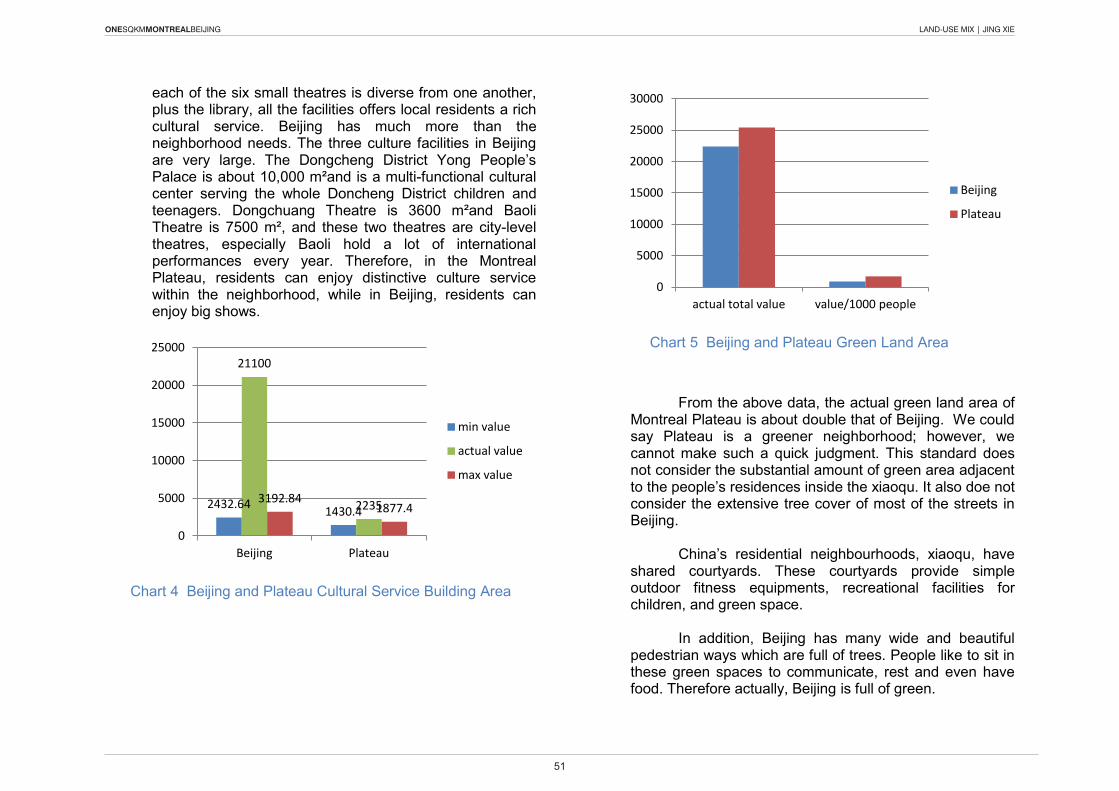
ONESQKMMONTREALBEIJING LAND-USE MIX | JING XIE
51
each of the six small theatres is diverse from one another, plus the library, all the facilities offers local residents a rich cultural service. Beijing has much more than the neighborhood needs. The three culture facilities in Beijing are very large. The Dongcheng District Yong People’s Palace is about 10,000 m²and is a multi-functional cultural center serving the whole Doncheng District children and teenagers. Dongchuang Theatre is 3600 m²and Baoli Theatre is 7500 m², and these two theatres are city-level theatres, especially Baoli hold a lot of international performances every year. Therefore, in the Montreal Plateau, residents can enjoy distinctive culture service within the neighborhood, while in Beijing, residents can enjoy big shows.
Chart 4 Beijing and Plateau Cultural Service Building Area
Chart 5 Beijing and Plateau Green Land Area
From the above data, the actual green land area of Montreal Plateau is about double that of Beijing. we could say Plateau is a greener neighborhood; however, we cannot make such a quick judgment. This standard does not consider the substantial amount of green area adjacent to the people’s residences inside the xiaoqu. It also doe not consider the extensive tree cover of most of the streets in Beijing.
China’s residential neighbourhoods, xiaoqu, have
shared courtyards. These courtyards provide simple outdoor fitness equipments, recreational facilities for children, and green space.
In addition, Beijing has many wide and beautiful
pedestrian ways which are full of trees. People like to sit in these green spaces to communicate, rest and even have food. Therefore actually, Beijing is full of green.
2432.64 1430.4
21100
2235 3192.84 1877.4
0
5000
10000
15000
20000
25000
Beijing Plateau
min value
actual value
max value
0
5000
10000
15000
20000
25000
30000
actual total value value/1000 people
Beijing
Plateau
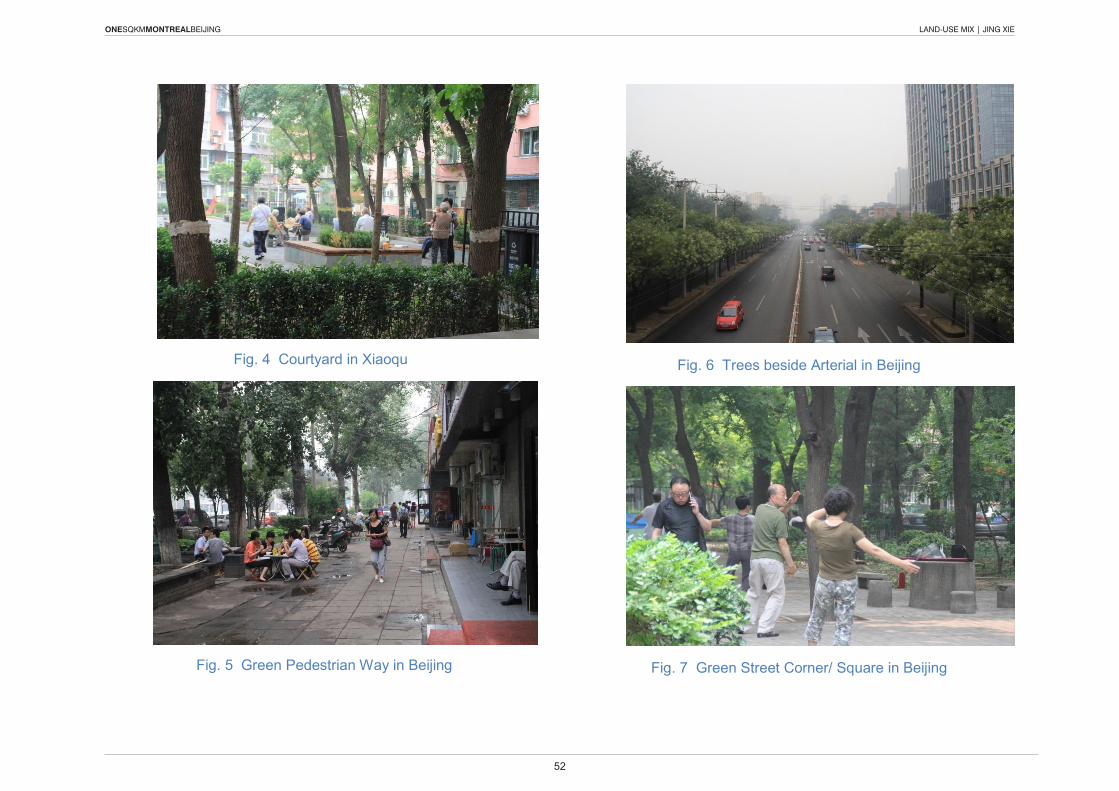
ONESQKMMONTREALBEIJING LAND-USE MIX | JING XIE
52
Fig. 4 Courtyard in xiaoqu
Fig. 5 Green Pedestrian way in Beijing
Fig. 6 Trees beside Arterial in Beijing
Fig. 7 Green Street Corner/ Square in Beijing
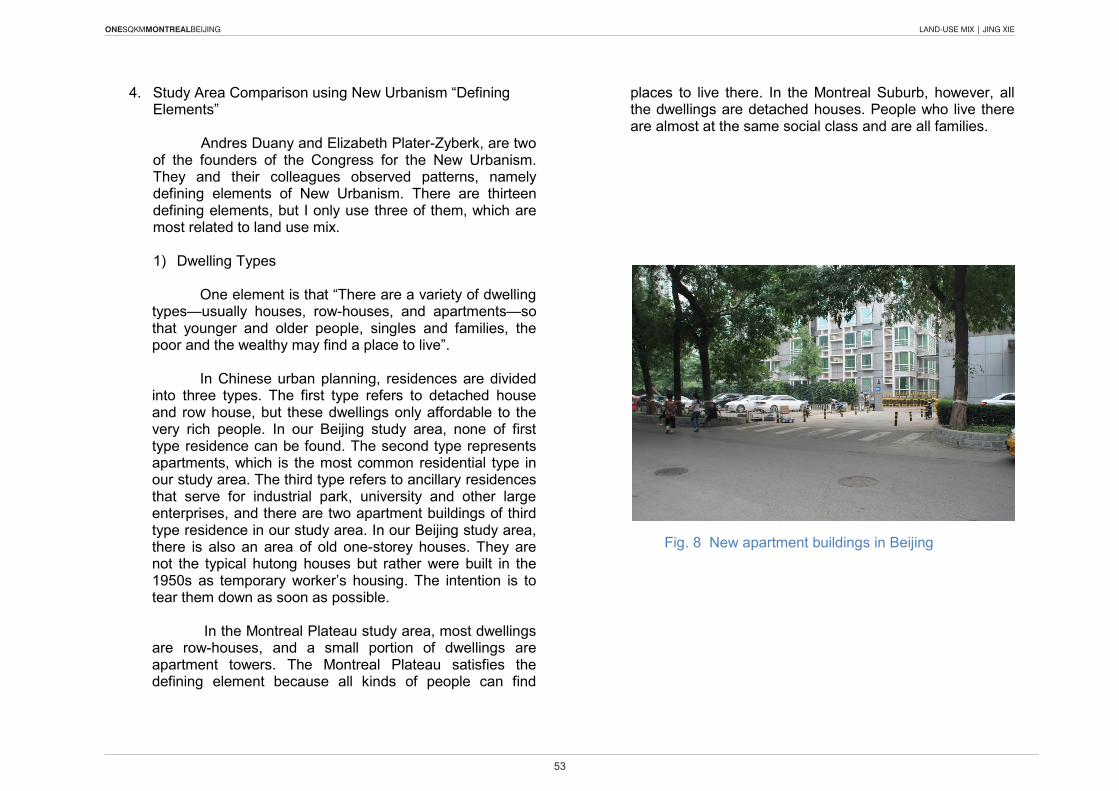
ONESQKMMONTREALBEIJING LAND-USE MIX | JING XIE
53
4. Study Area Comparison using New Urbanism “Defining Elements”
Andres Duany and Elizabeth Plater-zyberk, are two of the founders of the Congress for the New Urbanism. They and their colleagues observed patterns, namely defining elements of New Urbanism. There are thirteen defining elements, but I only use three of them, which are most related to land use mix. 1) Dwelling Types
One element is that “There are a variety of dwelling
types—usually houses, row-houses, and apartments—so that younger and older people, singles and families, the poor and the wealthy may find a place to live”.
In Chinese urban planning, residences are divided
into three types. The first type refers to detached house and row house, but these dwellings only affordable to the very rich people. In our Beijing study area, none of first type residence can be found. The second type represents apartments, which is the most common residential type in our study area. The third type refers to ancillary residences that serve for industrial park, university and other large enterprises, and there are two apartment buildings of third type residence in our study area. In our Beijing study area, there is also an area of old one-storey houses. They are not the typical hutong houses but rather were built in the 1950s as temporary worker’s housing. The intention is to tear them down as soon as possible.
In the Montreal Plateau study area, most dwellings
are row-houses, and a small portion of dwellings are apartment towers. The Montreal Plateau satisfies the defining element because all kinds of people can find
places to live there. In the Montreal Suburb, however, all the dwellings are detached houses. People who live there are almost at the same social class and are all families.
Fig. 8 New apartment buildings in Beijing
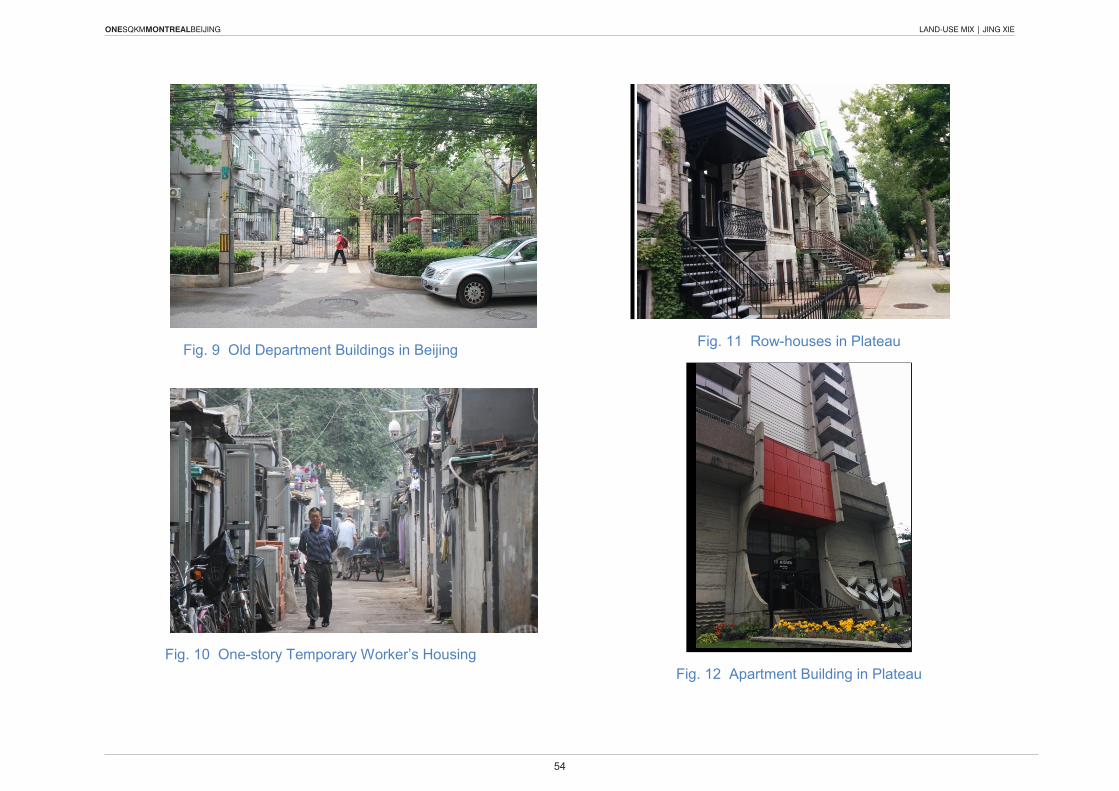
ONESQKMMONTREALBEIJING LAND-USE MIX | JING XIE
54
Fig. 9 Old Department Buildings in Beijing
Fig. 10 One-story Temporary Worker’s Housing
Fig. 11 Row-houses in Plateau
e
Fig. 12 Apartment Building in Plateau
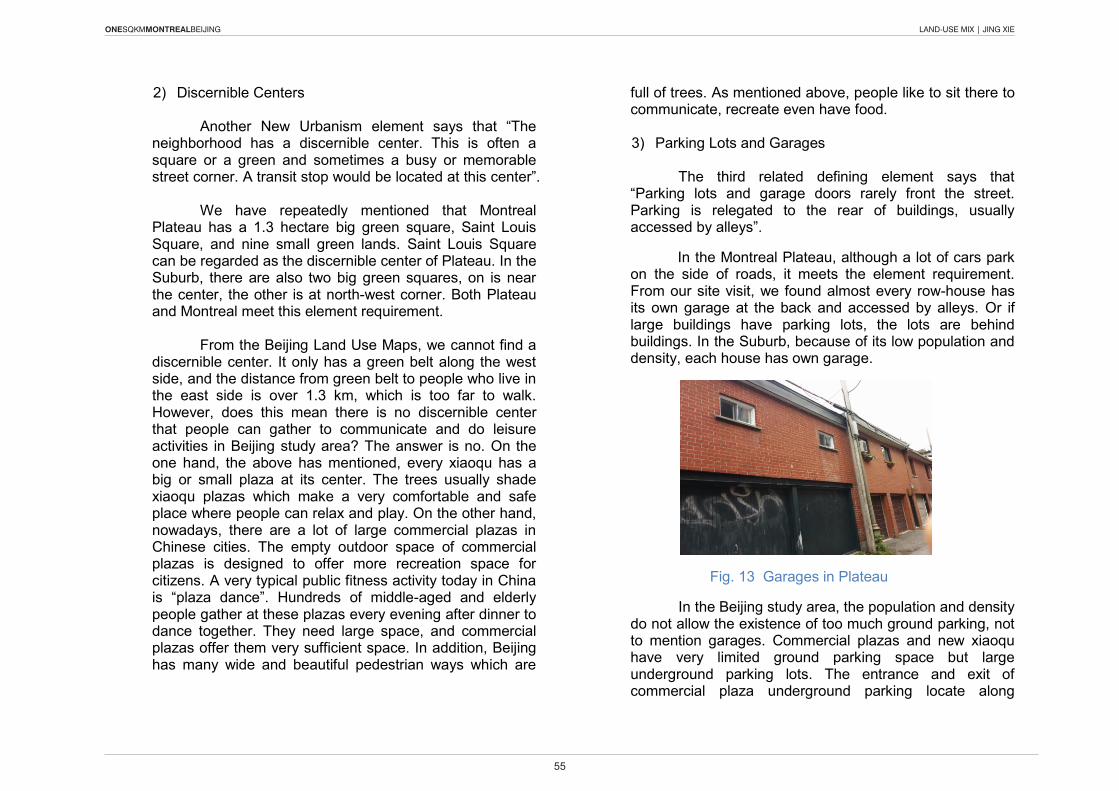
ONESQKMMONTREALBEIJING LAND-USE MIX | JING XIE
55
2) Discernible Centers
Another New Urbanism element says that “The neighborhood has a discernible center. This is often a square or a green and sometimes a busy or memorable street corner. A transit stop would be located at this center”.
we have repeatedly mentioned that Montreal
Plateau has a 1.3 hectare big green square, Saint Louis Square, and nine small green lands. Saint Louis Square can be regarded as the discernible center of Plateau. In the Suburb, there are also two big green squares, on is near the center, the other is at north-west corner. Both Plateau and Montreal meet this element requirement.
From the Beijing Land Use Maps, we cannot find a
discernible center. It only has a green belt along the west side, and the distance from green belt to people who live in the east side is over 1.3 km, which is too far to walk. However, does this mean there is no discernible center that people can gather to communicate and do leisure activities in Beijing study area? The answer is no. On the one hand, the above has mentioned, every xiaoqu has a big or small plaza at its center. The trees usually shade xiaoqu plazas which make a very comfortable and safe place where people can relax and play. On the other hand, nowadays, there are a lot of large commercial plazas in Chinese cities. The empty outdoor space of commercial plazas is designed to offer more recreation space for citizens. A very typical public fitness activity today in China is “plaza dance”. Hundreds of middle-aged and elderly people gather at these plazas every evening after dinner to dance together. They need large space, and commercial plazas offer them very sufficient space. In addition, Beijing has many wide and beautiful pedestrian ways which are
full of trees. As mentioned above, people like to sit there to communicate, recreate even have food.
3) Parking Lots and Garages
The third related defining element says that
“Parking lots and garage doors rarely front the street. Parking is relegated to the rear of buildings, usually accessed by alleys”.
In the Montreal Plateau, although a lot of cars park on the side of roads, it meets the element requirement. From our site visit, we found almost every row-house has its own garage at the back and accessed by alleys. Or if large buildings have parking lots, the lots are behind buildings. In the Suburb, because of its low population and density, each house has own garage.
Fig. 13 Garages in Plateau
In the Beijing study area, the population and density do not allow the existence of too much ground parking, not to mention garages. Commercial plazas and new xiaoqu have very limited ground parking space but large underground parking lots. The entrance and exit of commercial plaza underground parking locate along
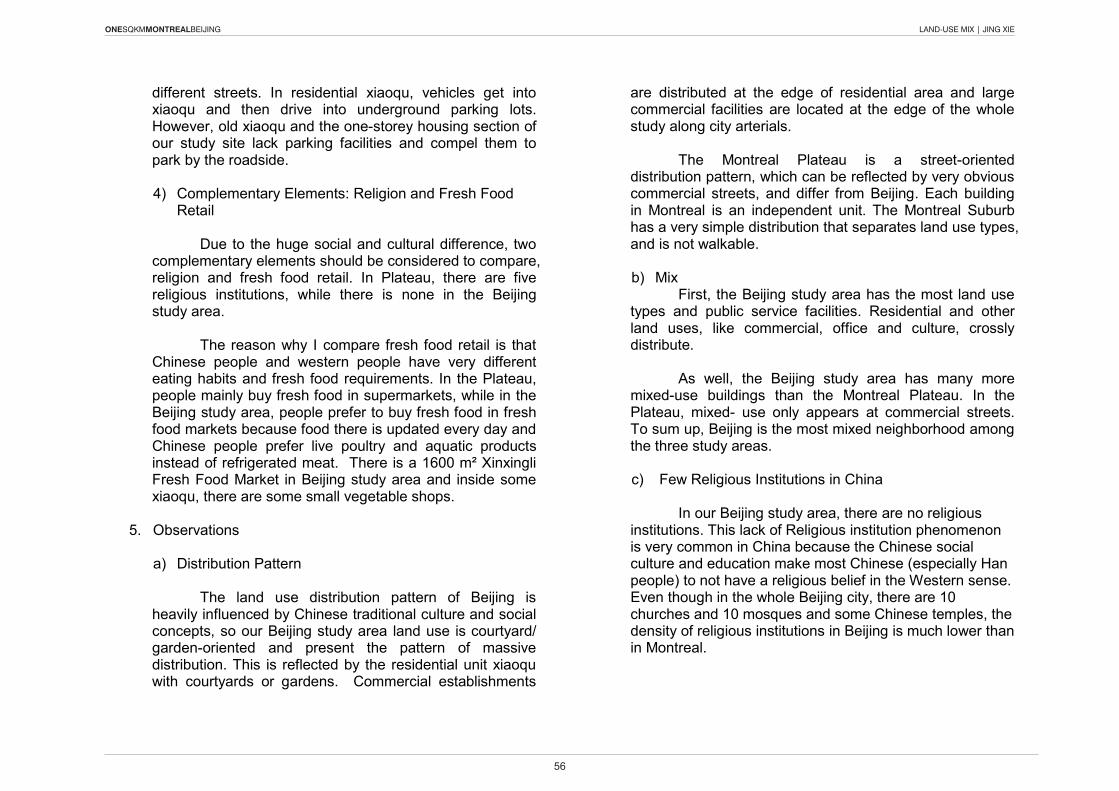
ONESQKMMONTREALBEIJING LAND-USE MIX | JING XIE
56
different streets. In residential xiaoqu, vehicles get into xiaoqu and then drive into underground parking lots. However, old xiaoqu and the one-storey housing section of our study site lack parking facilities and compel them to park by the roadside.
4) Complementary Elements: Religion and Fresh Food
Retail
Due to the huge social and cultural difference, two complementary elements should be considered to compare, religion and fresh food retail. In Plateau, there are five religious institutions, while there is none in the Beijing study area.
The reason why I compare fresh food retail is that
Chinese people and western people have very different eating habits and fresh food requirements. In the Plateau, people mainly buy fresh food in supermarkets, while in the Beijing study area, people prefer to buy fresh food in fresh food markets because food there is updated every day and Chinese people prefer live poultry and aquatic products instead of refrigerated meat. There is a 1600 m² xinxingli Fresh Food Market in Beijing study area and inside some xiaoqu, there are some small vegetable shops.
5. Observations
a) Distribution Pattern
The land use distribution pattern of Beijing is
heavily influenced by Chinese traditional culture and social concepts, so our Beijing study area land use is courtyard/ garden-oriented and present the pattern of massive distribution. This is reflected by the residential unit xiaoqu with courtyards or gardens. Commercial establishments
are distributed at the edge of residential area and large commercial facilities are located at the edge of the whole study along city arterials.
The Montreal Plateau is a street-oriented
distribution pattern, which can be reflected by very obvious commercial streets, and differ from Beijing. Each building in Montreal is an independent unit. The Montreal Suburb has a very simple distribution that separates land use types, and is not walkable.
b) Mix
First, the Beijing study area has the most land use types and public service facilities. Residential and other land uses, like commercial, office and culture, crossly distribute.
As well, the Beijing study area has many more
mixed-use buildings than the Montreal Plateau. In the Plateau, mixed- use only appears at commercial streets. To sum up, Beijing is the most mixed neighborhood among the three study areas.
c) Few Religious Institutions in China
In our Beijing study area, there are no religious
institutions. This lack of Religious institution phenomenon is very common in China because the Chinese social culture and education make most Chinese (especially Han people) to not have a religious belief in the western sense. Even though in the whole Beijing city, there are 10 churches and 10 mosques and some Chinese temples, the density of religious institutions in Beijing is much lower than in Montreal.

ONESQKMMONTREALBEIJING LAND-USE MIX | PIERRE FANZHU
58
Land-use Mix: a comparative studyIntroduction
The issue of sustainability is nowadays colored by the notion that sustainability is not simply a quantifiable measurement, but also has impact in the social and cultural realms. While issues of energy, economy and environment have been always been at the core of sustainability, there is a new influx of literature concerned with providing spaces that are “people-friendly […] [or] good”1. Among the criteria that define a city or space as good and people-friendly is the issue of land-mix. Authors such as Billingham, Cole, and Tibbalds all preach the importance of “mixed-use”2 in a city to develop a community. At the building scale, the emergence of “hybrid buildings”3, qualified by Steven Holl as an “anti-typology”4, mirrors this desire for a high concentration of a variety of uses. The mixed aspect of the hybrid has the capacity to “shape public space […] [containing] living, working, recreation and cultural facilities”5. Yet when dealing with the morphology of different cities or suburbs, this implied cause-effect relationship of ‘high degree of mixed use equals sustainable community’ is disrupted by the fact that social sustainability is not as easily measured as number of different uses. This essay attempts to re-examine three different built environments in order to ascertain whether there are any underlying principles of mixed-use that can be integrated into all kinds of living conditions.
For this study, a roughly one-kilometer square built up area of Beijing, the Plateau-Mont-Royal borough of Montreal, and a typical North American suburb will be examined through the use of mappings and comparative analyses. The land-use of each of these
1 Shaftoe, Henry. Convivial Urban Spaces: Creating Effective Public Places. (London: Earthscan in Association with the International Institute for Environment and Development, 2008), 6.2 Ibid.3 Per, Aurora Fernandez, Javier Mozas, and Javier Arpa. This Is Hybrid: An Analysis of Mixed-use Buildings by a T (Vitoria-Gasteiz, Spain: T Architecture, 2011), 6.4 Ibid.5 Per. This is Hybrid, 8.
areas will be mapped and identified, giving a general overview of how accessible all the different amenities are. Then, a comparative quantitative study will be done by referring to guidelines for institutional buildings published by the Chinese government.
Montreal Plateau
The land use map of the Plateau-Mont-Royal shows the aggregation of most commercial uses on important vertical axes. Uses ranging from restaurants to retail populate the length of Saint-Laurent and Saint-Denis streets. These two commercial streets are intermittently intersected by streets of lesser commercial density, effectively creating a makeshift grid of commercial uses in the Plateau. The cells of this grid are generally filled with two to three storey residential buildings. What is noticeable right away is the fact that it is a less than 500 m walk from the center of any of these cells to its edge. In other words, residents of the Plateau have to walk less than 500 m in order to reach a commercial avenue. Furthermore, in order to further supplement the residents of the Plateau, small corner stores selling a variety of basic amenities can be found dispersed throughout the whole area. Also, the buildings along the main commercial streets often serve more than one use. Due to the Plateau having the unique walk-up type houses, the second floor of these buildings are also commonly used as commercial, office or residential spaces. In this sense, there is a finer degree of mixed-ness in these areas of the Plateau. In addition to the mixed arterial roads, back alleys in the Plateau play an important role in creating leisure space. The small alleys shared between neighbours become a different type of gathering area; not quite as large as a plaza, yet big enough to foster a sense of community. The urban fabric of the Plateau is composed of a detailed mosaic of residential, commercial, mixed use and leisure. Thus, the Plateau-Mont-Royal not only has a variety of amenities, but these amenities are arranged in a manner that is accessible to all the residents of the area.
050
100
200
500METERS
RESIDENTIAL
SCHOOL
RELIGIOUS
HOSPITAL
GOVERNMENT
OFFICE
RESTAURANT
RETAILCORNER STORE
OTHER
MTL PLATEAU . LAND-USE MAP
ARCH521 . STRUCTURES OF CITIES
0 50 100 200 500 METERS
RESIDENTIAL
SCHOOL
RELIGIOUS
HOSPITAL
GOVERNMENT
OFFICE
RESTAURANT
RETAIL
CORNER STORE
OTHER
MTL PLATEAU . LAND-USE MAP
ARCH521 . STRUCTURES OF CITIES
Fig. 1: Land-use map of a roughly 1 square-kilometer area of the Plateau-Mont-Royal.
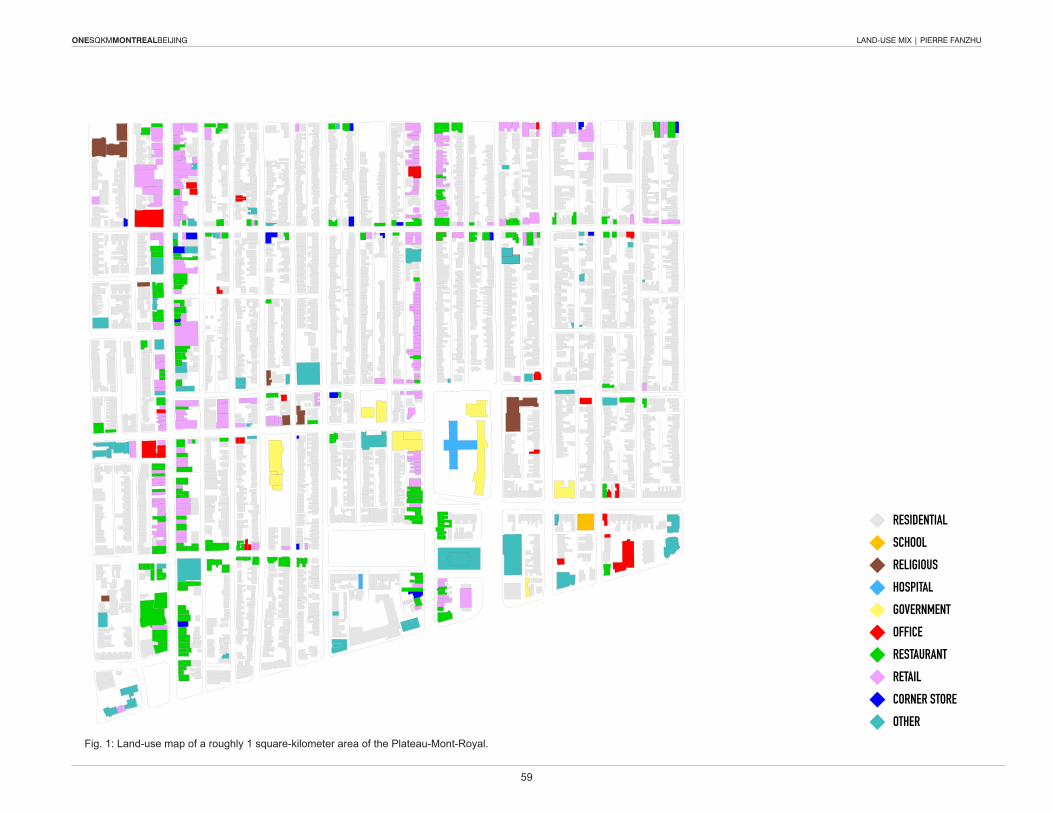
ONESQKMMONTREALBEIJING LAND-USE MIX | PIERRE FANZHU
59
050
100
200
500METERS
RESIDENTIAL
SCHOOL
RELIGIOUS
HOSPITAL
GOVERNMENT
OFFICE
RESTAURANT
RETAILCORNER STORE
OTHER
MTL PLATEAU . LAND-USE MAP
ARCH521 . STRUCTURES OF CITIES
0 50 100 200 500 METERS
RESIDENTIAL
SCHOOL
RELIGIOUS
HOSPITAL
GOVERNMENT
OFFICE
RESTAURANT
RETAIL
CORNER STORE
OTHER
MTL PLATEAU . LAND-USE MAP
ARCH521 . STRUCTURES OF CITIES
Fig. 1: Land-use map of a roughly 1 square-kilometer area of the Plateau-Mont-Royal.
ONESQKMMONTREALBEIJING LAND-USE MIX | PIERRE FANZHU
60
Beijing
The urban morphology of the Beijing site consists of a large block bounded by large arterial roads on its four sides. The block is then further subdivided by secondary circulation that would allow automobiles to pass through. Within these smaller blocks, lots of different shapes or sizes are assigned to a certain function. There seems to be three main categories of building use: residential, mixed use, and education. The mixed use buildings crowd the outer edge of the block, lining the arterial roads. This arrangement is understandable as they contain the bulk of the commercial, office, and cultural spaces. There are a few mixed use buildings within the block; however, the inner area is largely devoted to buildings that fall within the categories of residential and educational. At first glance, the area is seemingly portioned into large blocks of different uses. Due to the size of the partitioning and the larger scale of the buildings, the arrangement of uses conveys the sense of a segregated city; echoing Corbusian principles of urban planning. This understanding of the block is further emphasized by the fact that each lot has its own consistent morphological language internally, but when juxtaposed to the surrounding lots, loses its inherent logic.
However, upon closer examination, the Beijing site is more than an incongruous block. The mapping provides a good general overview, but a general mapping of this residential type leads to some important oversights in Beijing. The residential lots in Beijing are rarely purely residential. In fact, at the ground level, it is permitted to open small shops selling objects that range from general goods, barber shops, to fruits and vegetables. The locations of these small shops within the lots are lined along the secondary roads that run through the block. Similar to how the large mixed use buildings follow the large arterial roads, these smaller amenities follow the smaller roads. Operating in the same way as the corner stores of the plateau, these small informal shops supplement the daily needs of the residents living in the block. In order to counteract the effects
of segregation resulting from the large scale partitioning of the lot, a smaller scale mix of uses is introduced into the block. Consequently, the Beijing block is actually more mixed than it initially seems.
Montreal Suburb
The suburban site is located on the South Shore of Montreal, close to a major boulevard. A few commercial buildings line the major arterial roads while there is only one building that falls into neither of the residential or commercial usage categories. Unlike the previous two sites, the arrangement of residential buildings does not seem to follow any orthogonal grid. Instead, the house are arranged so that the streets form concentric loops with only one entry way. This limited access, loop-like plan has the effect of isolating not only the residential area from the rest of its surrounding, but also the houses of one loop from houses in other loops. In addition, there are no other uses let alone types of residences in this residential area: all the buildings consist of two-storey single family houses. As a result, there is not only a lack of mix, but also a lack of potential for dynamic interactions brought together by mixing various uses. Although there are a few commercial shops that are accessible to the neighbourhood, these amenities also lack variety. Most of the buildings labelled as commercial lining Boulevard Taschereau are actually car dealerships. There is only one supermarket nearby, meaning the residents have to travel further to buy other common items. Due to the isolating arrangement of the streets as well as the lack of diversity in land use, it can be concluded that the idea of isolation is intentional in the suburb.
Fig. 2: Land-use map of a roughly 1 square-kilometer area mega-block of Beijing.
RESIDENTIAL
SCHOOL
GOVERNMENT
OFFICE
RESTAURANT
COMMERCIAL MIX-USE
CORNER STORE
RESIDENTIAL/COMMERCIAL MIX-USE
COMMERCIAL/OFFICE MIX-USE
GREEN SPACE
SMALL SHOPS
RESIDENTIAL
SCHOOL
GOVERNMENT
OFFICE
RESTAURANT
COMMERCIAL MIX-USE
CORNER STORE
RESIDENTIAL/COMMERCIAL MIX-USE
COMMERCIAL/OFFICE MIX-USE
GREEN SPACE
SMALL SHOPS
RESIDENTIAL
SCHOOL
GOVERNMENT
OFFICE
RESTAURANT
COMMERCIAL MIX-USE
CORNER STORE
RESIDENTIAL/COMMERCIAL MIX-USE
COMMERCIAL/OFFICE MIX-USE
GREEN SPACE
SMALL SHOPS
RESIDENTIAL
SCHOOL
GOVERNMENT
OFFICE
RESTAURANT
COMMERCIAL MIX-USE
CORNER STORE
RESIDENTIAL/COMMERCIAL MIX-USE
COMMERCIAL/OFFICE MIX-USE
GREEN SPACE
SMALL SHOPS
RESIDENTIAL
SCHOOL
GOVERNMENT
OFFICE
RESTAURANT
COMMERCIAL MIX-USE
CORNER STORE
RESIDENTIAL/COMMERCIAL MIX-USE
COMMERCIAL/OFFICE MIX-USE
GREEN SPACE
SMALL SHOPS
RESIDENTIAL
SCHOOL
GOVERNMENT
OFFICE
RESTAURANT
COMMERCIAL MIX-USE
CORNER STORE
RESIDENTIAL/COMMERCIAL MIX-USE
COMMERCIAL/OFFICE MIX-USE
GREEN SPACE
SMALL SHOPS
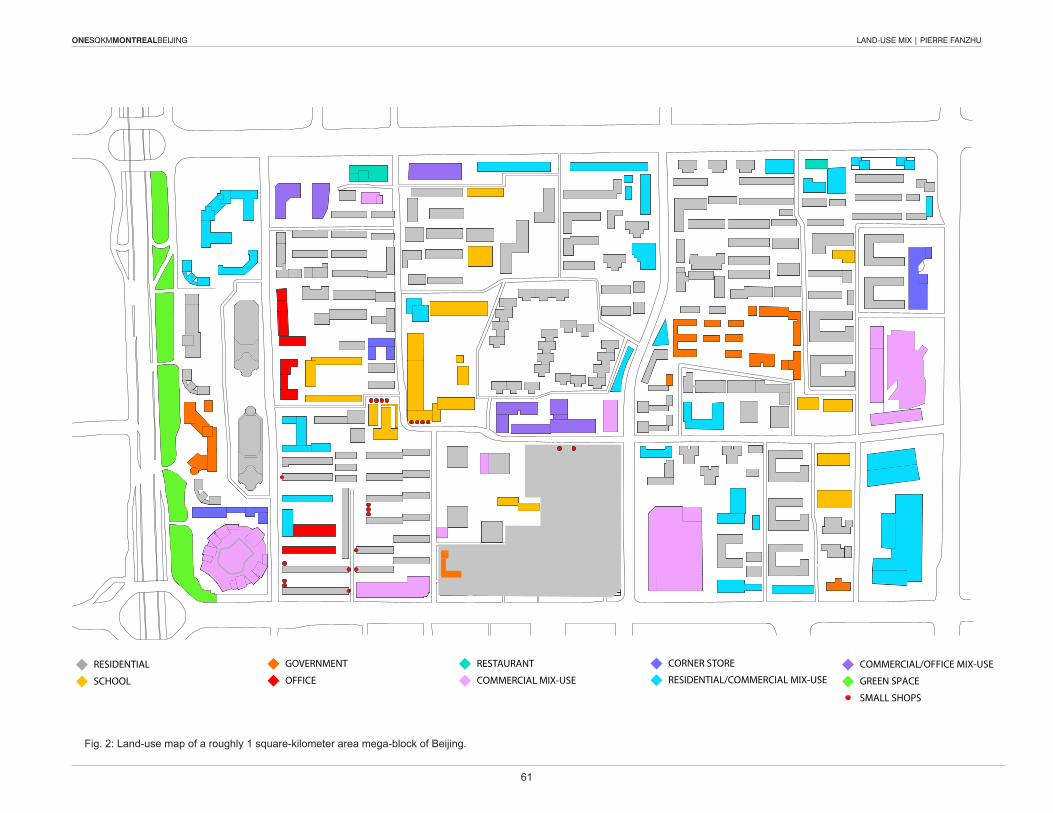
ONESQKMMONTREALBEIJING LAND-USE MIX | PIERRE FANZHU
61
Fig. 2: Land-use map of a roughly 1 square-kilometer area mega-block of Beijing.
RESIDENTIAL
SCHOOL
GOVERNMENT
OFFICE
RESTAURANT
COMMERCIAL MIX-USE
CORNER STORE
RESIDENTIAL/COMMERCIAL MIX-USE
COMMERCIAL/OFFICE MIX-USE
GREEN SPACE
SMALL SHOPS
RESIDENTIAL
SCHOOL
GOVERNMENT
OFFICE
RESTAURANT
COMMERCIAL MIX-USE
CORNER STORE
RESIDENTIAL/COMMERCIAL MIX-USE
COMMERCIAL/OFFICE MIX-USE
GREEN SPACE
SMALL SHOPS
RESIDENTIAL
SCHOOL
GOVERNMENT
OFFICE
RESTAURANT
COMMERCIAL MIX-USE
CORNER STORE
RESIDENTIAL/COMMERCIAL MIX-USE
COMMERCIAL/OFFICE MIX-USE
GREEN SPACE
SMALL SHOPS
RESIDENTIAL
SCHOOL
GOVERNMENT
OFFICE
RESTAURANT
COMMERCIAL MIX-USE
CORNER STORE
RESIDENTIAL/COMMERCIAL MIX-USE
COMMERCIAL/OFFICE MIX-USE
GREEN SPACE
SMALL SHOPS
RESIDENTIAL
SCHOOL
GOVERNMENT
OFFICE
RESTAURANT
COMMERCIAL MIX-USE
CORNER STORE
RESIDENTIAL/COMMERCIAL MIX-USE
COMMERCIAL/OFFICE MIX-USE
GREEN SPACE
SMALL SHOPS
RESIDENTIAL
SCHOOL
GOVERNMENT
OFFICE
RESTAURANT
COMMERCIAL MIX-USE
CORNER STORE
RESIDENTIAL/COMMERCIAL MIX-USE
COMMERCIAL/OFFICE MIX-USE
GREEN SPACE
SMALL SHOPS
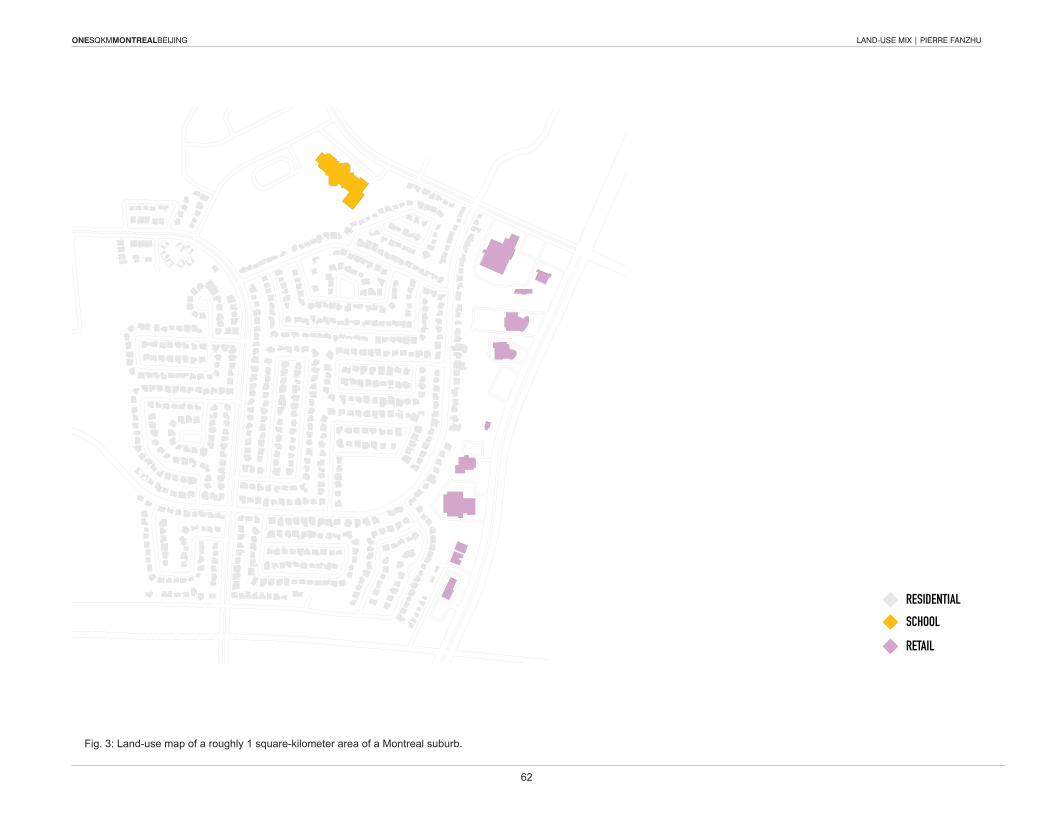
ONESQKMMONTREALBEIJING LAND-USE MIX | PIERRE FANZHU
62
RESIDENTIAL
SCHOOL
RETAIL
RESIDENTIAL
SCHOOL
RETAIL
Fig. 3: Land-use map of a roughly 1 square-kilometer area of a Montreal suburb.
Prescribed Land-use in China
In order to maintain a minimum of land use mix in rapid developments for a large population, the Chinese government has published guidelines for land allocation in terms of land-use for every one thousand people, especially in residential areas. Montreal, on the other hand, does not have similar guidelines, but the population growth and rate of development have never reached the heights that China has been attaining in recent decades. Although both areas have a high degree of variety in terms of land use, it would be interesting to see how the Plateau measures up when compared to the Chinese guidelines. Before the analysis can be done, the guidelines need to be simplified: certain categories need to be regrouped, other omitted altogether either because the data for the plateau is lacking or because the categories have no bearing in a North American context. In the end, educational institutions were divided into 3 different types (kindergarten, elementary school, and high school), commercial space was created by combining categories falling into its scope and the category of hospital was retained.
When looking at the table (see Fig. 4) the Plateau-Mont-Royal falls short in all of the categories except for the commercial and high school building area. The amount of space dedicated to kindergartens is fair when compared to the prescribed building area, but the Plateau does fall incredibly short when it comes to the space dedicated towards elementary schools and hospitals. Comparatively, the Beijing site excels at all of the categories, providing more than enough basic amenities for its residents. However, it is reductive to apply a guideline made for a specific context to a different one. The Plateau does not, nor does it need to or should, conform to the standards set for a vastly different context in terms of economics, culture, and development. Therefore, the only real value of this comparison is the comparison itself: this portion of Beijing has a higher amount of space per amenity per person than the examined portion of the Plateau. The difference in existing building area can be explained by looking at the morphology of both sites.
The Plateau-Mont-Royal is less segregated in terms of the arrangement of land use. All the block sizes and buildings in the Plateau are at a similar scale. There is an expected rhythm when walking along the streets in the plateau and a predictable rhythm of variation in the land use. In addition to this relatable arrangement, the buildings block sizes, and streets are maintained at a human walkable level. Although certain amenities may be found outside of a one kilometer radius, it does not feel as far because the streets are walkable and provide enough variation in land use to keep them interesting. Combined with the bus and metro lines, it is easy to get to and from neighbouring boroughs for work, school, or leisure. For the Plateau, there is no pressure to diversify its land use.
In contrast, the Beijing site is bound by four main arterial roads and each spans a few lanes in each direction. Compared to the Plateau streets, these arterial roads are massive spanning 30 to 50 meters. Pedestrians necessitate overpasses or underpasses in order to cross these streets. As a result, the automobile-heavy roads are hindering pedestrian circulation from one sq.km. block to the other. Although circulation is very fluid within one of these
Montreal PlateauMin per 1000 people Max per 1000 people Min Max Actual Value
Kindergarden 281 310 3484.4 3844 3080.17Elementary School 274 305 3397.6 3782 1301.67High School 134 153 1661.6 1897.2 3948.65Hospital 264 0 3273.6 2620.3
Beijing Min per 1000 people Max per 1000 people Min Max Actual Value
Kindergarden 281 310 7120.54 7855.4 9346Elementary School 274 305 6943.16 7728.7 36307High School 134 153 3395.56 3877.02 57784Hospital 264 6689.76 N/A
Suggested Values (in sq. m)
Suggested Values (in sq. m)
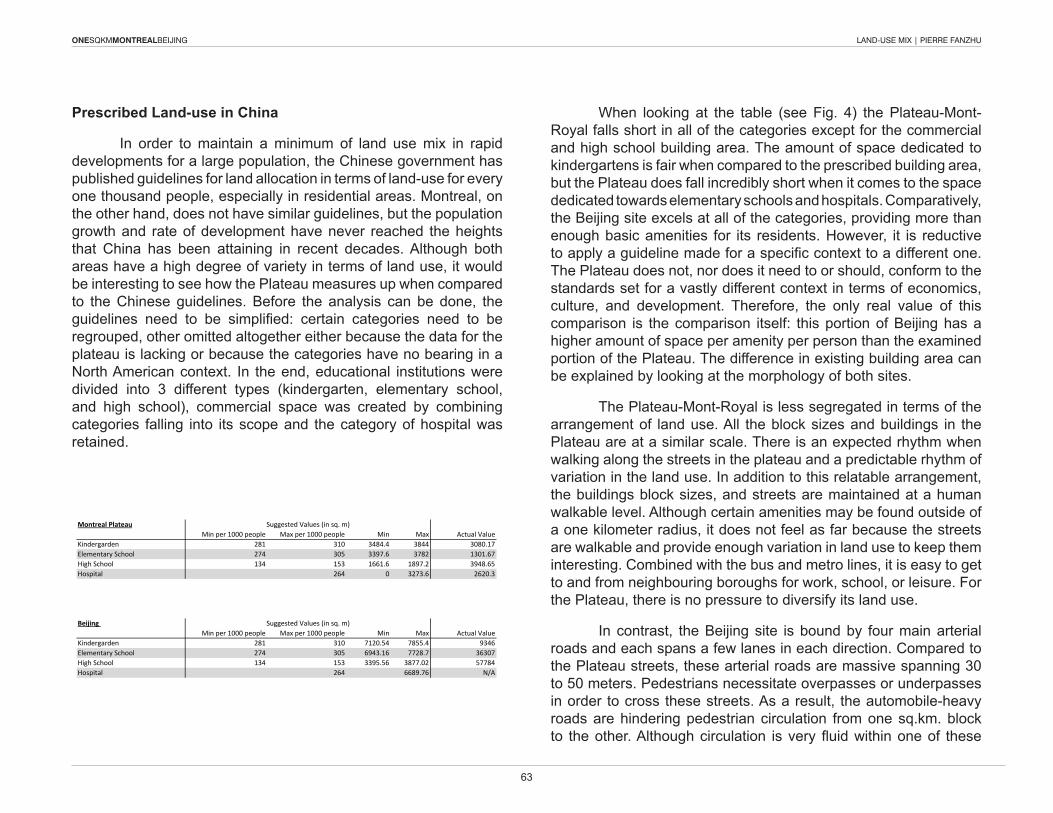
ONESQKMMONTREALBEIJING LAND-USE MIX | PIERRE FANZHU
63
Prescribed Land-use in China
In order to maintain a minimum of land use mix in rapid developments for a large population, the Chinese government has published guidelines for land allocation in terms of land-use for every one thousand people, especially in residential areas. Montreal, on the other hand, does not have similar guidelines, but the population growth and rate of development have never reached the heights that China has been attaining in recent decades. Although both areas have a high degree of variety in terms of land use, it would be interesting to see how the Plateau measures up when compared to the Chinese guidelines. Before the analysis can be done, the guidelines need to be simplified: certain categories need to be regrouped, other omitted altogether either because the data for the plateau is lacking or because the categories have no bearing in a North American context. In the end, educational institutions were divided into 3 different types (kindergarten, elementary school, and high school), commercial space was created by combining categories falling into its scope and the category of hospital was retained.
When looking at the table (see Fig. 4) the Plateau-Mont-Royal falls short in all of the categories except for the commercial and high school building area. The amount of space dedicated to kindergartens is fair when compared to the prescribed building area, but the Plateau does fall incredibly short when it comes to the space dedicated towards elementary schools and hospitals. Comparatively, the Beijing site excels at all of the categories, providing more than enough basic amenities for its residents. However, it is reductive to apply a guideline made for a specific context to a different one. The Plateau does not, nor does it need to or should, conform to the standards set for a vastly different context in terms of economics, culture, and development. Therefore, the only real value of this comparison is the comparison itself: this portion of Beijing has a higher amount of space per amenity per person than the examined portion of the Plateau. The difference in existing building area can be explained by looking at the morphology of both sites.
The Plateau-Mont-Royal is less segregated in terms of the arrangement of land use. All the block sizes and buildings in the Plateau are at a similar scale. There is an expected rhythm when walking along the streets in the plateau and a predictable rhythm of variation in the land use. In addition to this relatable arrangement, the buildings block sizes, and streets are maintained at a human walkable level. Although certain amenities may be found outside of a one kilometer radius, it does not feel as far because the streets are walkable and provide enough variation in land use to keep them interesting. Combined with the bus and metro lines, it is easy to get to and from neighbouring boroughs for work, school, or leisure. For the Plateau, there is no pressure to diversify its land use.
In contrast, the Beijing site is bound by four main arterial roads and each spans a few lanes in each direction. Compared to the Plateau streets, these arterial roads are massive spanning 30 to 50 meters. Pedestrians necessitate overpasses or underpasses in order to cross these streets. As a result, the automobile-heavy roads are hindering pedestrian circulation from one sq.km. block to the other. Although circulation is very fluid within one of these
Montreal PlateauMin per 1000 people Max per 1000 people Min Max Actual Value
Kindergarden 281 310 3484.4 3844 3080.17Elementary School 274 305 3397.6 3782 1301.67High School 134 153 1661.6 1897.2 3948.65Hospital 264 0 3273.6 2620.3
Beijing Min per 1000 people Max per 1000 people Min Max Actual Value
Kindergarden 281 310 7120.54 7855.4 9346Elementary School 274 305 6943.16 7728.7 36307High School 134 153 3395.56 3877.02 57784Hospital 264 6689.76 N/A
Suggested Values (in sq. m)
Suggested Values (in sq. m)
ONESQKMMONTREALBEIJING LAND-USE MIX | PIERRE FANZHU
64
blocks, it is more difficult to walk from one large block to the other. In this sense, the Beijing super-block is like an island marooned in a grid-like sea of concrete paving. Due to this condition of isolation caused by the encouragement of automobile circulation, it becomes necessary for these large-scale blocks in Beijing to accommodate for all types of needs. The development guidelines are required in China to provide a basis of accessible amenities for the residents within a block. It is the reason why building areas for basic necessities like grocery stores, schools, and health services are outlined and prescribed.
As an anti-thesis to the two hybrid environments, the suburbs represent an entirely different perspective. There is almost no diversity in terms of land-use and, although it deserves its due criticism, the suburb is designed to be that way. There is no urge to diversify, not due to the absence of pressure, but due to the desire to remain isolated. Developments in the suburbs are all oriented towards keeping uses segregated: the houses are separated from the shopping malls; cars are the most reliable form of transportation; and the epitome of a high density mix use is a strip mall. The lack of accessibility to all the various uses is what prevents the suburbs from truly becoming a resilient community.
Conclusion
In conclusion, there is no direct causal relationship between the degree of variety in land use and the resilience of a community. Rather, a high degree of mixed uses allows for the potential of these resilient communities to develop. This concept can be seen in the Plateau and the Beijing model: the former’s diversified land use is the result of years of accretional development while the latter’s finer grain of diverse land use is generated as a remediation strategy to the large-scale urban planning schemes. In both cases, the diversity of land use is both contributive and symptomatic to the formation of localized communities; like a feedback loop that continually shifts and adjusts according to the needs of the residents. This continuous adaption is not found in the suburban model, hindering its capacity to be truly resilient. In essence, it is the feedback loop model between community and land use that fosters the sustainability of a community.
Works Cited
Per, Aurora Fernandez, Javier Mozas, and Javier Arpa. This Is Hybrid: An Analysis of Mixed-use Buildings by a T. (Vitoria-Gasteiz, Spain: T Architecture, 2011.
Shaftoe, Henry. Convivial Urban Spaces: Creating Effective Public Places. London: Earthscan in Association with the International Institute for Environment and Development, 2008. Print.
ONESQKMMONTREALBEIJING LAND-USE MIX | PIERRE FANZHU
65
Works Cited
Per, Aurora Fernandez, Javier Mozas, and Javier Arpa. This Is Hybrid: An Analysis of Mixed-use Buildings by a T. (Vitoria-Gasteiz, Spain: T Architecture, 2011.
Shaftoe, Henry. Convivial Urban Spaces: Creating Effective Public Places. London: Earthscan in Association with the International Institute for Environment and Development, 2008. Print.

ONESQKMMONTREALBEIJING LAND-USE MIX | ZHIYAO CHENLAND-USE MIX | ZHIYAO CHEN
In the midst of globalization, one may expect cultures around the world to converge towards a similar lifestyle. Yet, traditions that drove urban planning make those communities quite resilient to change and exhibit distinct differences. Consequently, we may ask ourselves what exactly defines a community in terms of town planning and how this planning, in turn, influences the communal life from one part of the world to another? Behaviors and habits such as buying food, eating, socializing, exercising and raising children are all direct impact on how the land is organized; one may look at a typical street scene and be able immediately to identity the location. Thus in a broader sense, how much of the cultural portrait and way of life of a specific community can be reflected through its local land-use mix?
In order to have a quantitative comparison, we shall study the three location maps color-coded to illustrate the land-use mix as accurately as possible. Respectively, Fig. 1, Fig. 2 and Fig. 3 shows the land-use for Montreal Pla-teau, Beijing and a suburban area on the South Shore of Montreal.
Evidently, the street network layout is the prime driving force for the scattering pattern of mixed-use in all
cases. The grid-like blocks of the Plateau are clearly out-lined by the series of retail units; the main streets - St-Lau-rent, St-Denis, Rachel and Duluth - are also recognizable from the concentration of restaurants and stores among which office spaces are mixed-in. The larger buildings - schools, hospitals, government institutions and religious space - highlight extremities and sometimes one whole block, away from the commercial lanes and the presence of public parks are quite spread out (we will tackle the question of where do the children play later in the text). Thus, flows of circulation are filtered into major categories connecting people’s residence to their destination.
Across the ocean, the mega blocks of Beijing tell a very different visual story: enclosed by four main boule-vards, large commercial and office mix-use buildings stand tall such as city wall facing the busy traffic lanes. Inside the block, another world is revealed with its own sinuous streets and alleys flanked with schools, offices and small commerce. Among those ‘sub-blocks’, compounds, court-yard houses, residential towers share animated public space, sidewalks and yards populated by children playing, people exercising and street food vendors. Another point worth mentioning is despite the apparent lack of small commercial space, there are, in fact, small businesses sell-ing food and providing services below almost every single one of the yellow residential units. On the ground level of these residential compounds, facing the small streets, food
REFLECTIONS OF A LIFESTYLE.
67
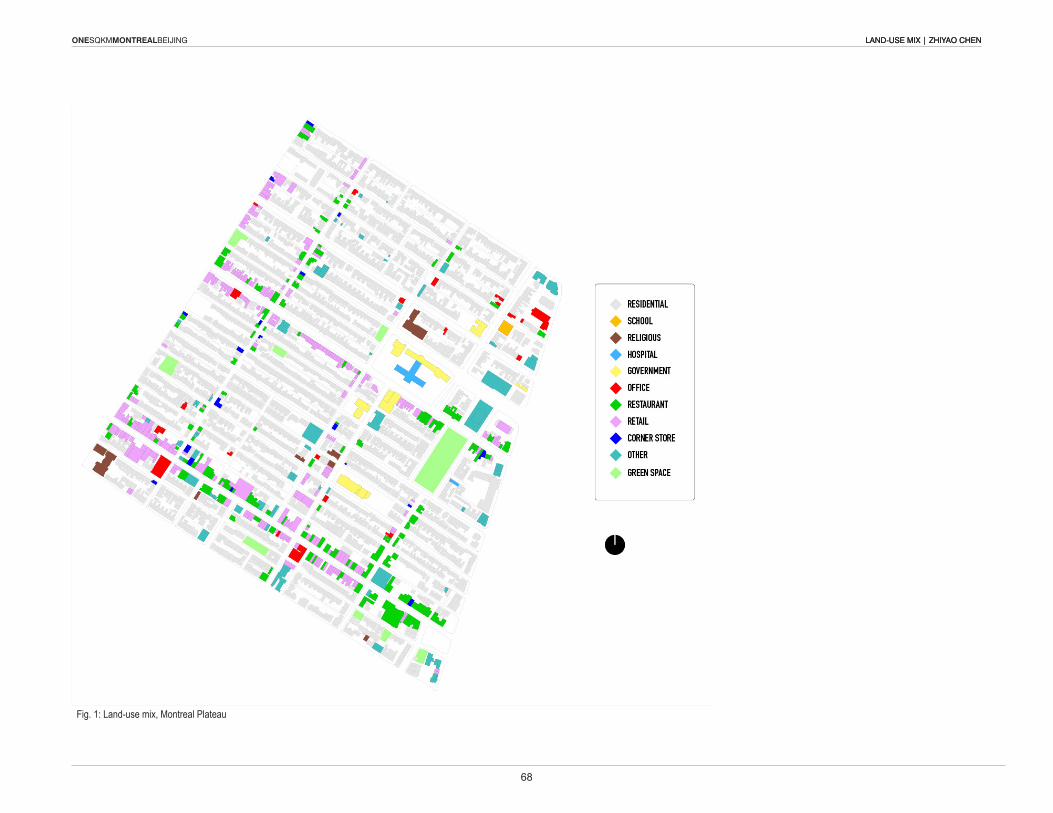
ONESQKMMONTREALBEIJING LAND-USE MIX | ZHIYAO CHENLAND-USE MIX | ZHIYAO CHEN
Fig. 1: Land-use mix, Montreal Plateau
68
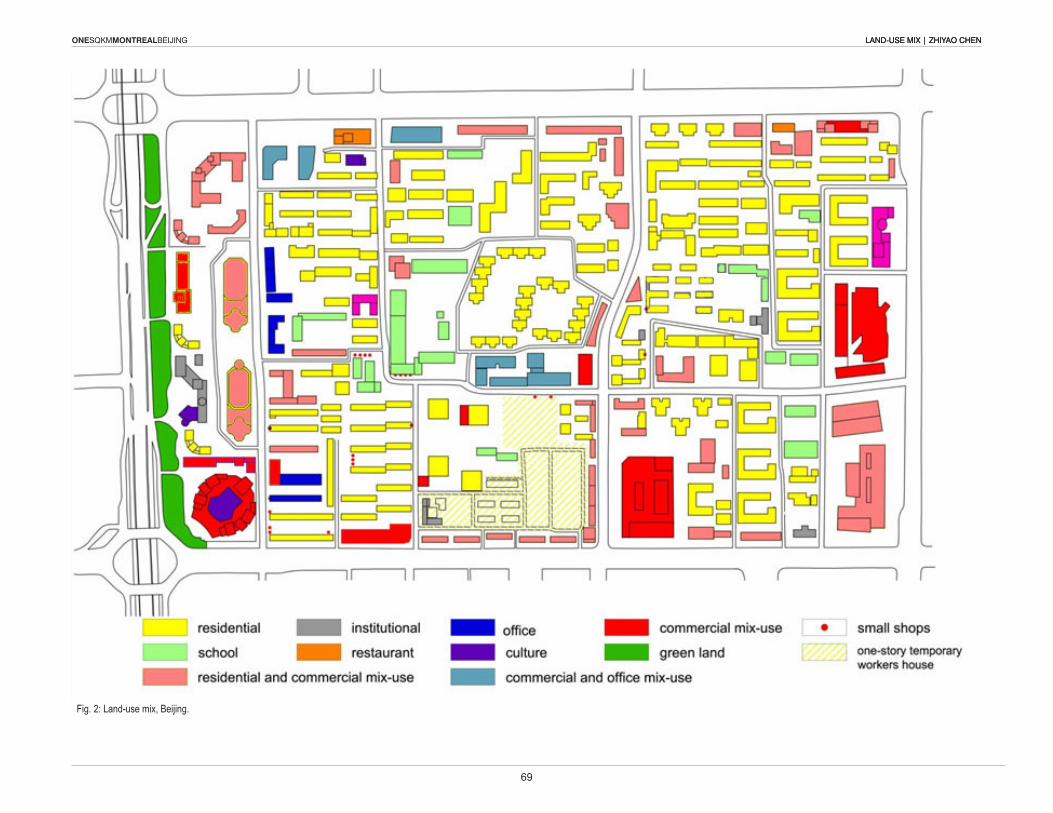
ONESQKMMONTREALBEIJING LAND-USE MIX | ZHIYAO CHENLAND-USE MIX | ZHIYAO CHEN
Fig. 2: Land-use mix, Beijing.
69
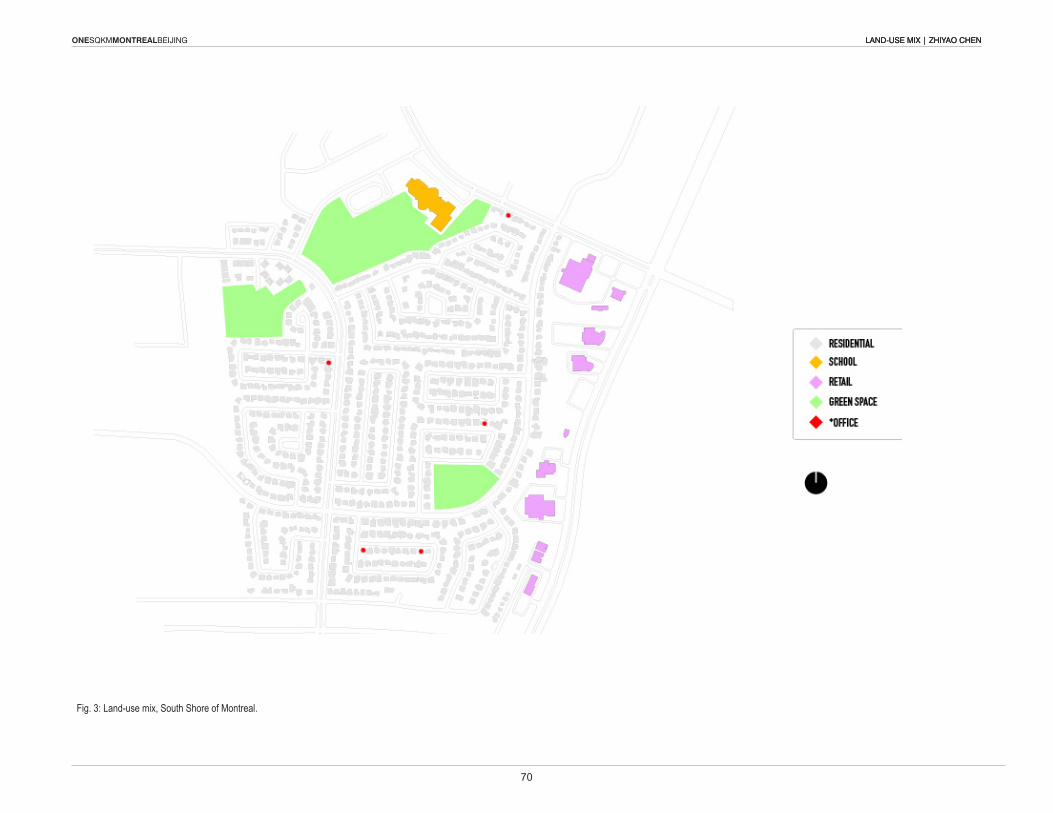
ONESQKMMONTREALBEIJING LAND-USE MIX | ZHIYAO CHENLAND-USE MIX | ZHIYAO CHEN
Fig. 3: Land-use mix, South Shore of Montreal.
70
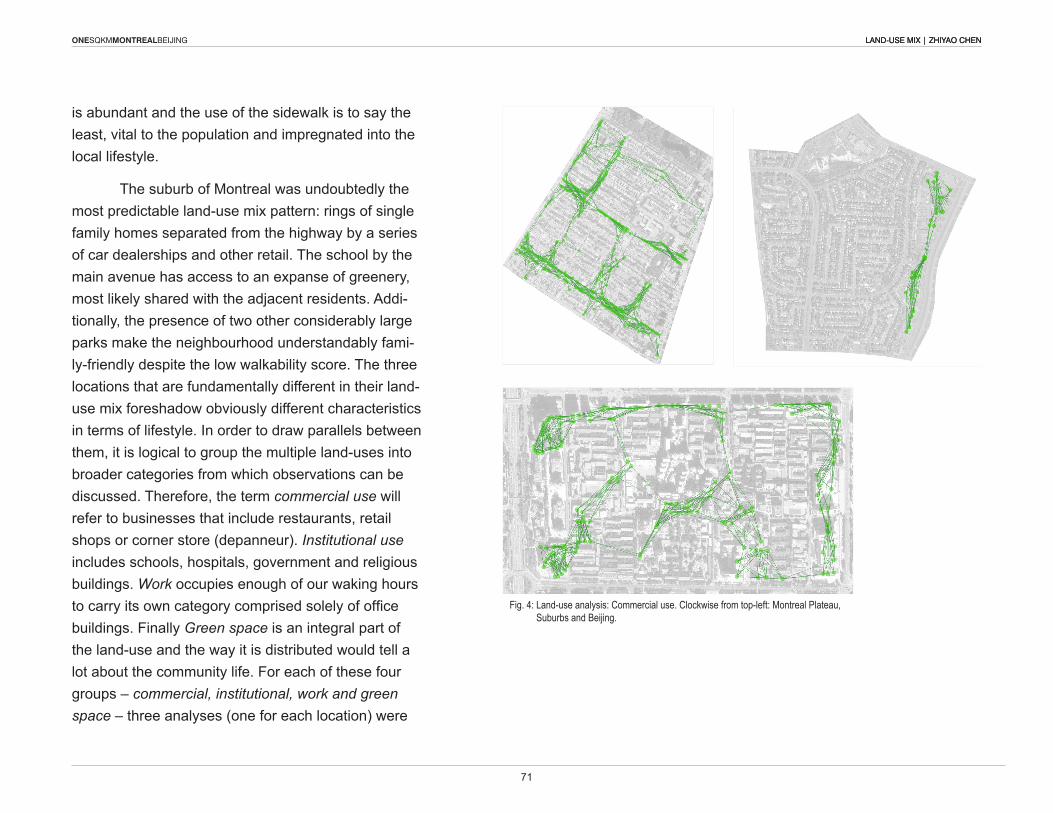
ONESQKMMONTREALBEIJING LAND-USE MIX | ZHIYAO CHENLAND-USE MIX | ZHIYAO CHEN
Fig. 4: Land-use analysis: Commercial use. Clockwise from top-left: Montreal Plateau, Suburbs and Beijing.
is abundant and the use of the sidewalk is to say the least, vital to the population and impregnated into the local lifestyle.
The suburb of Montreal was undoubtedly the most predictable land-use mix pattern: rings of single family homes separated from the highway by a series of car dealerships and other retail. The school by the main avenue has access to an expanse of greenery, most likely shared with the adjacent residents. Addi-tionally, the presence of two other considerably large parks make the neighbourhood understandably fami-ly-friendly despite the low walkability score. The three locations that are fundamentally different in their land-use mix foreshadow obviously different characteristics in terms of lifestyle. In order to draw parallels between them, it is logical to group the multiple land-uses into broader categories from which observations can be discussed. Therefore, the term commercial use will refer to businesses that include restaurants, retail shops or corner store (depanneur). Institutional use includes schools, hospitals, government and religious buildings. Work occupies enough of our waking hours to carry its own category comprised solely of office buildings. Finally Green space is an integral part of the land-use and the way it is distributed would tell a lot about the community life. For each of these four groups – commercial, institutional, work and green space – three analyses (one for each location) were
71
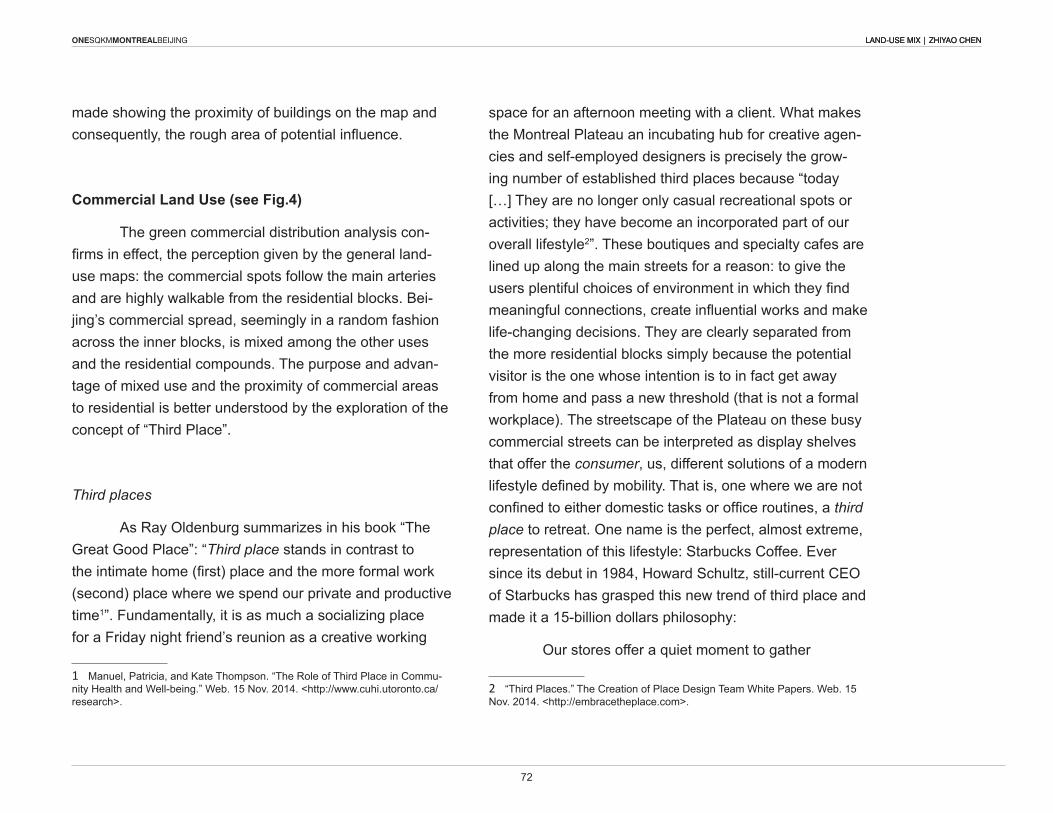
ONESQKMMONTREALBEIJING LAND-USE MIX | ZHIYAO CHENLAND-USE MIX | ZHIYAO CHEN
made showing the proximity of buildings on the map and consequently, the rough area of potential influence.
Commercial Land Use (see Fig.4)
The green commercial distribution analysis con-firms in effect, the perception given by the general land-use maps: the commercial spots follow the main arteries and are highly walkable from the residential blocks. Bei-jing’s commercial spread, seemingly in a random fashion across the inner blocks, is mixed among the other uses and the residential compounds. The purpose and advan-tage of mixed use and the proximity of commercial areas to residential is better understood by the exploration of the concept of “Third Place”.
Third places
As Ray Oldenburg summarizes in his book “The Great Good Place”: “Third place stands in contrast to the intimate home (first) place and the more formal work (second) place where we spend our private and productive time1”. Fundamentally, it is as much a socializing place for a Friday night friend’s reunion as a creative working
1 Manuel, Patricia, and Kate Thompson. “The Role of Third Place in Commu-nity Health and well-being.” web. 15 Nov. 2014. <http://www.cuhi.utoronto.ca/research>.
space for an afternoon meeting with a client. what makes the Montreal Plateau an incubating hub for creative agen-cies and self-employed designers is precisely the grow-ing number of established third places because “today […] They are no longer only casual recreational spots or activities; they have become an incorporated part of our overall lifestyle2”. These boutiques and specialty cafes are lined up along the main streets for a reason: to give the users plentiful choices of environment in which they find meaningful connections, create influential works and make life-changing decisions. They are clearly separated from the more residential blocks simply because the potential visitor is the one whose intention is to in fact get away from home and pass a new threshold (that is not a formal workplace). The streetscape of the Plateau on these busy commercial streets can be interpreted as display shelves that offer the consumer, us, different solutions of a modern lifestyle defined by mobility. That is, one where we are not confined to either domestic tasks or office routines, a third place to retreat. One name is the perfect, almost extreme, representation of this lifestyle: Starbucks Coffee. Ever since its debut in 1984, Howard Schultz, still-current CEO of Starbucks has grasped this new trend of third place and made it a 15-billion dollars philosophy:
Our stores offer a quiet moment to gather
2 “Third Places.” The Creation of Place Design Team white Papers. web. 15 Nov. 2014. <http://embracetheplace.com>.
72
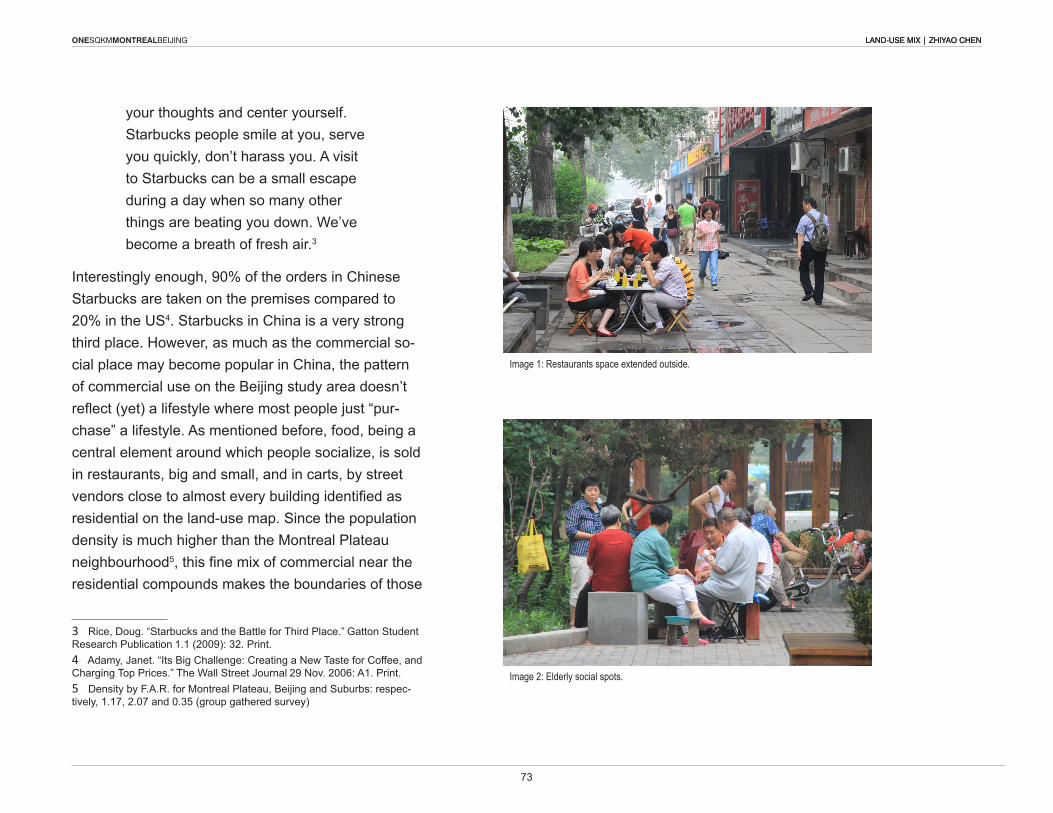
ONESQKMMONTREALBEIJING LAND-USE MIX | ZHIYAO CHENLAND-USE MIX | ZHIYAO CHEN
Image 1: Restaurants space extended outside.
Image 2: Elderly social spots.
your thoughts and center yourself. Starbucks people smile at you, serve you quickly, don’t harass you. A visit to Starbucks can be a small escape during a day when so many other things are beating you down. we’ve become a breath of fresh air.3
Interestingly enough, 90% of the orders in Chinese Starbucks are taken on the premises compared to 20% in the US4. Starbucks in China is a very strong third place. However, as much as the commercial so-cial place may become popular in China, the pattern of commercial use on the Beijing study area doesn’t reflect (yet) a lifestyle where most people just “pur-chase” a lifestyle. As mentioned before, food, being a central element around which people socialize, is sold in restaurants, big and small, and in carts, by street vendors close to almost every building identified as residential on the land-use map. Since the population density is much higher than the Montreal Plateau neighbourhood5, this fine mix of commercial near the residential compounds makes the boundaries of those
3 Rice, Doug. “Starbucks and the Battle for Third Place.” Gatton Student Research Publication 1.1 (2009): 32. Print.4 Adamy, Janet. “Its Big Challenge: Creating a New Taste for Coffee, and Charging Top Prices.” The wall Street Journal 29 Nov. 2006: A1. Print.5 Density by F.A.R. for Montreal Plateau, Beijing and Suburbs: respec-tively, 1.17, 2.07 and 0.35 (group gathered survey)
73
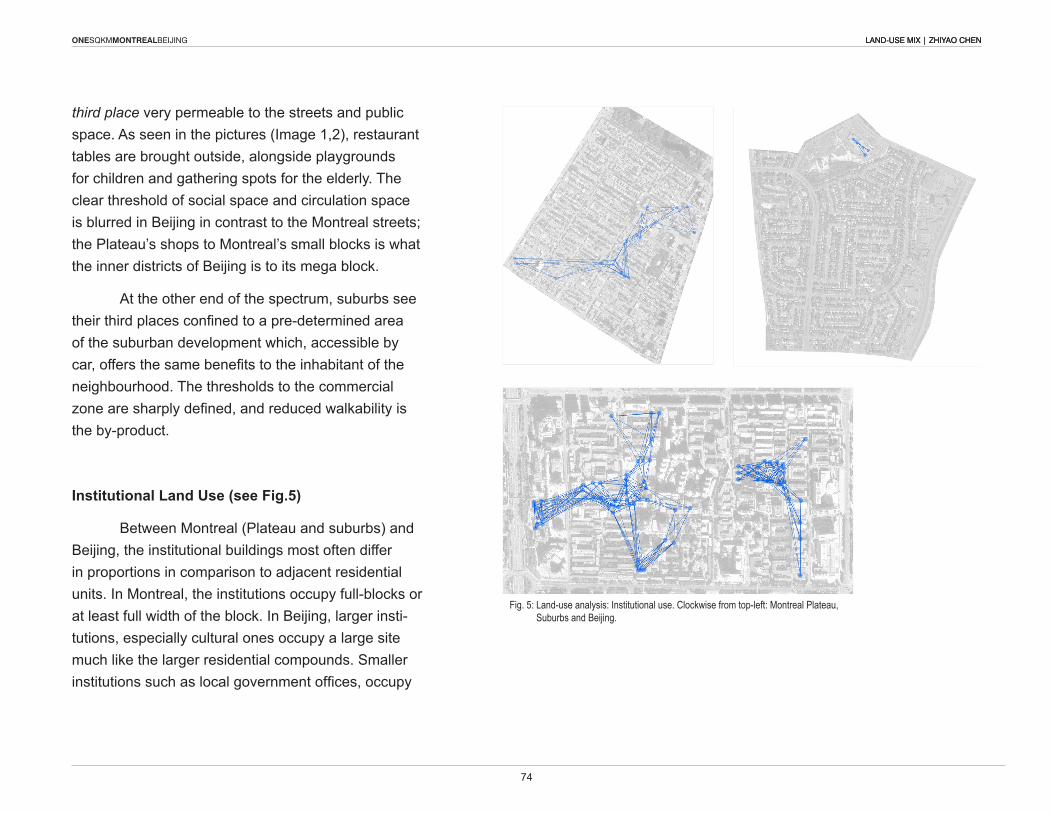
ONESQKMMONTREALBEIJING LAND-USE MIX | ZHIYAO CHENLAND-USE MIX | ZHIYAO CHEN
Fig. 5: Land-use analysis: Institutional use. Clockwise from top-left: Montreal Plateau, Suburbs and Beijing.
third place very permeable to the streets and public space. As seen in the pictures (Image 1,2), restaurant tables are brought outside, alongside playgrounds for children and gathering spots for the elderly. The clear threshold of social space and circulation space is blurred in Beijing in contrast to the Montreal streets; the Plateau’s shops to Montreal’s small blocks is what the inner districts of Beijing is to its mega block.
At the other end of the spectrum, suburbs see their third places confined to a pre-determined area of the suburban development which, accessible by car, offers the same benefits to the inhabitant of the neighbourhood. The thresholds to the commercial zone are sharply defined, and reduced walkability is the by-product.
Institutional Land Use (see Fig.5)
Between Montreal (Plateau and suburbs) and Beijing, the institutional buildings most often differ in proportions in comparison to adjacent residential units. In Montreal, the institutions occupy full-blocks or at least full width of the block. In Beijing, larger insti-tutions, especially cultural ones occupy a large site much like the larger residential compounds. Smaller institutions such as local government offices, occupy
74
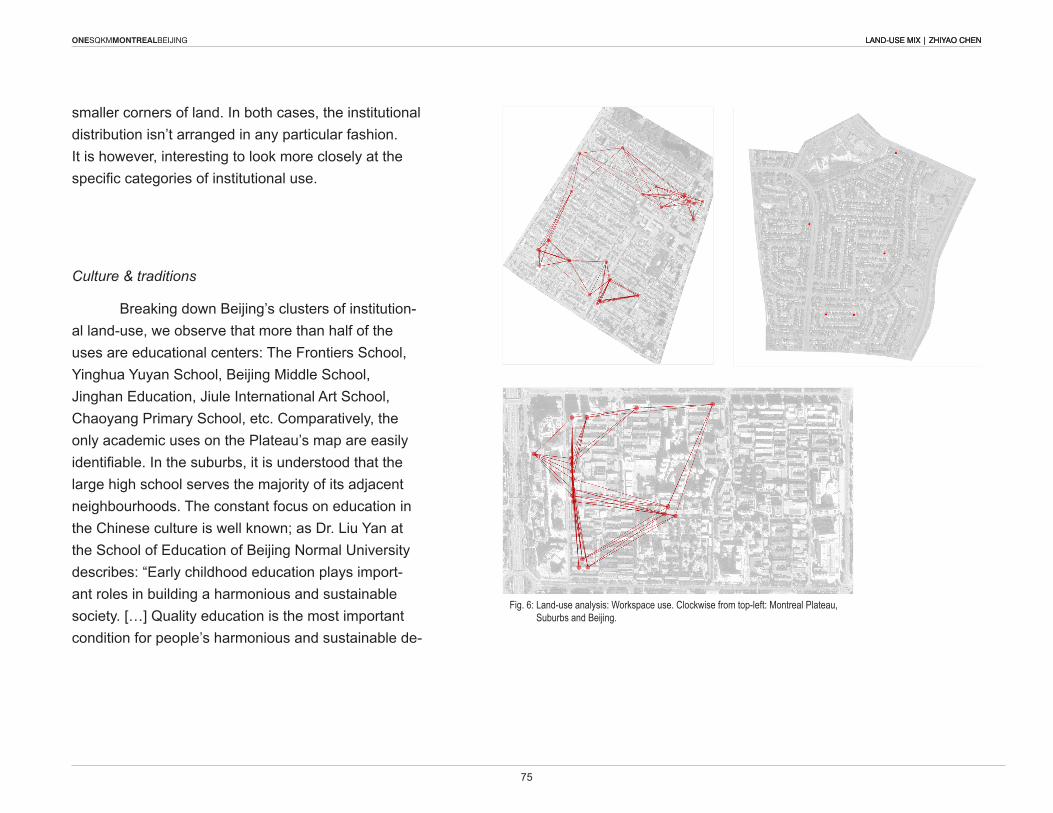
ONESQKMMONTREALBEIJING LAND-USE MIX | ZHIYAO CHENLAND-USE MIX | ZHIYAO CHEN
Fig. 6: Land-use analysis: Workspace use. Clockwise from top-left: Montreal Plateau, Suburbs and Beijing.
smaller corners of land. In both cases, the institutional distribution isn’t arranged in any particular fashion. It is however, interesting to look more closely at the specific categories of institutional use.
Culture & traditions
Breaking down Beijing’s clusters of institution-al land-use, we observe that more than half of the uses are educational centers: The Frontiers School, Yinghua Yuyan School, Beijing Middle School, Jinghan Education, Jiule International Art School, Chaoyang Primary School, etc. Comparatively, the only academic uses on the Plateau’s map are easily identifiable. In the suburbs, it is understood that the large high school serves the majority of its adjacent neighbourhoods. The constant focus on education in the Chinese culture is well known; as Dr. Liu Yan at the School of Education of Beijing Normal University describes: “Early childhood education plays import-ant roles in building a harmonious and sustainable society. […] Quality education is the most important condition for people’s harmonious and sustainable de-
75
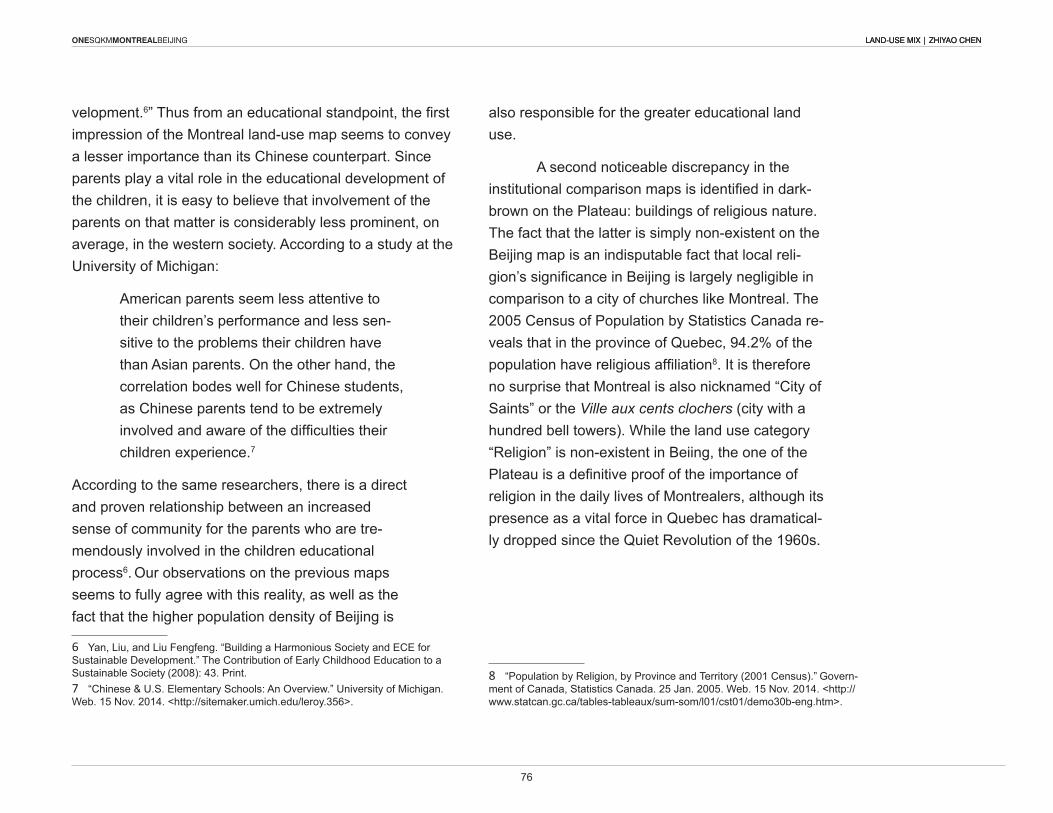
ONESQKMMONTREALBEIJING LAND-USE MIX | ZHIYAO CHENLAND-USE MIX | ZHIYAO CHEN
velopment.6” Thus from an educational standpoint, the first impression of the Montreal land-use map seems to convey a lesser importance than its Chinese counterpart. Since parents play a vital role in the educational development of the children, it is easy to believe that involvement of the parents on that matter is considerably less prominent, on average, in the western society. According to a study at the University of Michigan:
American parents seem less attentive to their children’s performance and less sen-sitive to the problems their children have than Asian parents. On the other hand, the correlation bodes well for Chinese students, as Chinese parents tend to be extremely involved and aware of the difficulties their children experience.7
According to the same researchers, there is a direct and proven relationship between an increased sense of community for the parents who are tre-mendously involved in the children educational process6. Our observations on the previous maps seems to fully agree with this reality, as well as the fact that the higher population density of Beijing is
6 Yan, Liu, and Liu Fengfeng. “Building a Harmonious Society and ECE for Sustainable Development.” The Contribution of Early Childhood Education to a Sustainable Society (2008): 43. Print.7 “Chinese & U.S. Elementary Schools: An Overview.” University of Michigan. web. 15 Nov. 2014. <http://sitemaker.umich.edu/leroy.356>.
also responsible for the greater educational land use.
A second noticeable discrepancy in the institutional comparison maps is identified in dark-brown on the Plateau: buildings of religious nature. The fact that the latter is simply non-existent on the Beijing map is an indisputable fact that local reli-gion’s significance in Beijing is largely negligible in comparison to a city of churches like Montreal. The 2005 Census of Population by Statistics Canada re-veals that in the province of Quebec, 94.2% of the population have religious affiliation8. It is therefore no surprise that Montreal is also nicknamed “City of Saints” or the Ville aux cents clochers (city with a hundred bell towers). while the land use category “Religion” is non-existent in Beiing, the one of the Plateau is a definitive proof of the importance of religion in the daily lives of Montrealers, although its presence as a vital force in Quebec has dramatical-ly dropped since the Quiet Revolution of the 1960s.
8 “Population by Religion, by Province and Territory (2001 Census).” Govern-ment of Canada, Statistics Canada. 25 Jan. 2005. web. 15 Nov. 2014. <http://www.statcan.gc.ca/tables-tableaux/sum-som/l01/cst01/demo30b-eng.htm>.
76
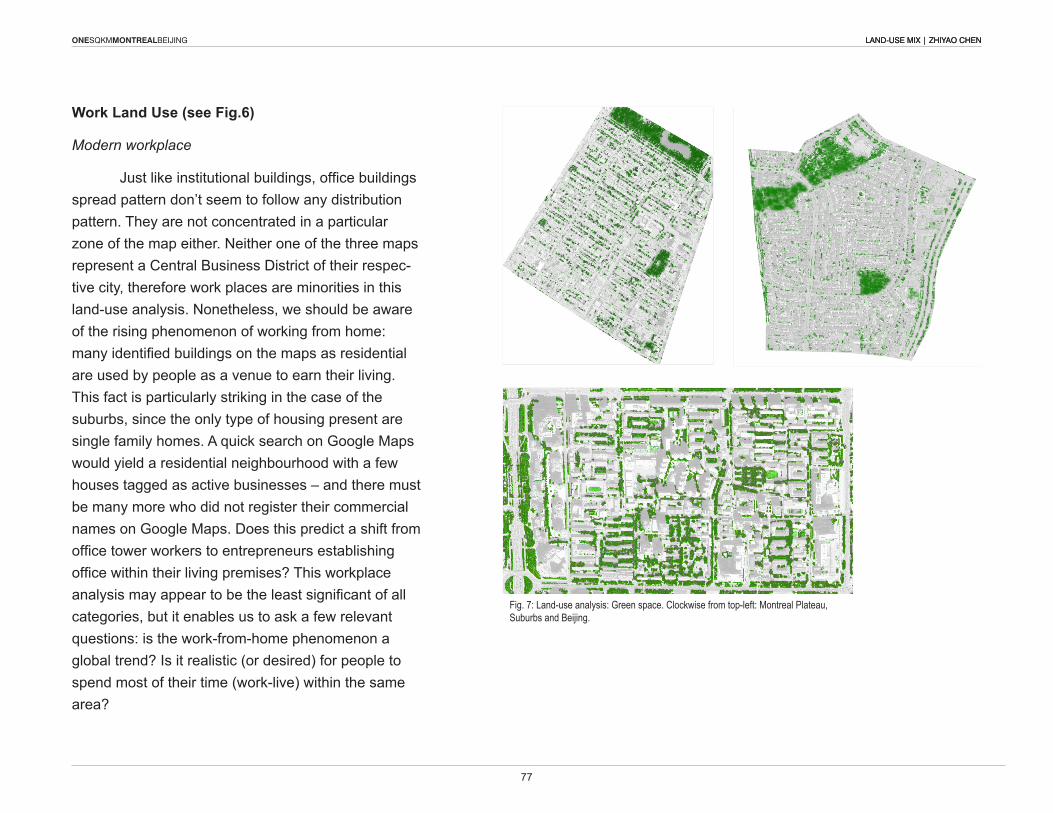
ONESQKMMONTREALBEIJING LAND-USE MIX | ZHIYAO CHENLAND-USE MIX | ZHIYAO CHEN
Fig. 7: Land-use analysis: Green space. Clockwise from top-left: Montreal Plateau, Suburbs and Beijing.
Work Land Use (see Fig.6)
Modern workplace
Just like institutional buildings, office buildings spread pattern don’t seem to follow any distribution pattern. They are not concentrated in a particular zone of the map either. Neither one of the three maps represent a Central Business District of their respec-tive city, therefore work places are minorities in this land-use analysis. Nonetheless, we should be aware of the rising phenomenon of working from home: many identified buildings on the maps as residential are used by people as a venue to earn their living. This fact is particularly striking in the case of the suburbs, since the only type of housing present are single family homes. A quick search on Google Maps would yield a residential neighbourhood with a few houses tagged as active businesses – and there must be many more who did not register their commercial names on Google Maps. Does this predict a shift from office tower workers to entrepreneurs establishing office within their living premises? This workplace analysis may appear to be the least significant of all categories, but it enables us to ask a few relevant questions: is the work-from-home phenomenon a global trend? Is it realistic (or desired) for people to spend most of their time (work-live) within the same area?
77
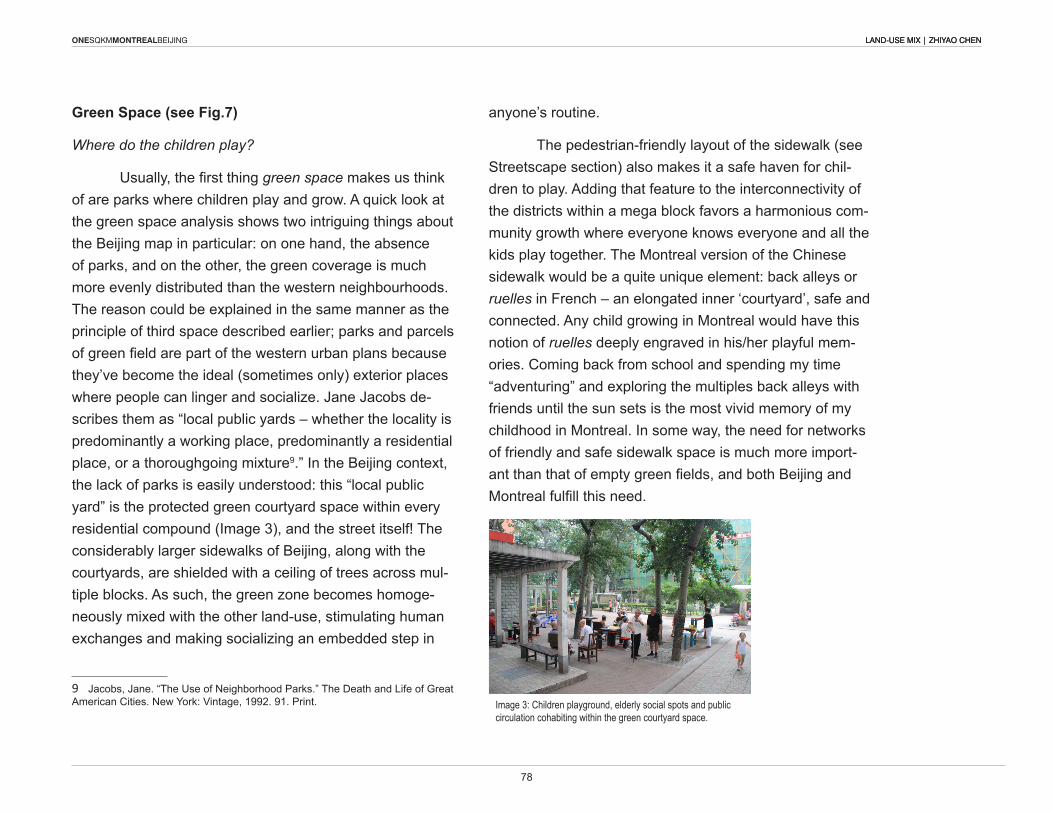
ONESQKMMONTREALBEIJING LAND-USE MIX | ZHIYAO CHENLAND-USE MIX | ZHIYAO CHEN
Image 3: Children playground, elderly social spots and public circulation cohabiting within the green courtyard space.
Green Space (see Fig.7)
Where do the children play?
Usually, the first thing green space makes us think of are parks where children play and grow. A quick look at the green space analysis shows two intriguing things about the Beijing map in particular: on one hand, the absence of parks, and on the other, the green coverage is much more evenly distributed than the western neighbourhoods. The reason could be explained in the same manner as the principle of third space described earlier; parks and parcels of green field are part of the western urban plans because they’ve become the ideal (sometimes only) exterior places where people can linger and socialize. Jane Jacobs de-scribes them as “local public yards – whether the locality is predominantly a working place, predominantly a residential place, or a thoroughgoing mixture9.” In the Beijing context, the lack of parks is easily understood: this “local public yard” is the protected green courtyard space within every residential compound (Image 3), and the street itself! The considerably larger sidewalks of Beijing, along with the courtyards, are shielded with a ceiling of trees across mul-tiple blocks. As such, the green zone becomes homoge-neously mixed with the other land-use, stimulating human exchanges and making socializing an embedded step in
9 Jacobs, Jane. “The Use of Neighborhood Parks.” The Death and Life of Great American Cities. New York: vintage, 1992. 91. Print.
anyone’s routine.
The pedestrian-friendly layout of the sidewalk (see Streetscape section) also makes it a safe haven for chil-dren to play. Adding that feature to the interconnectivity of the districts within a mega block favors a harmonious com-munity growth where everyone knows everyone and all the kids play together. The Montreal version of the Chinese sidewalk would be a quite unique element: back alleys or ruelles in French – an elongated inner ‘courtyard’, safe and connected. Any child growing in Montreal would have this notion of ruelles deeply engraved in his/her playful mem-ories. Coming back from school and spending my time “adventuring” and exploring the multiples back alleys with friends until the sun sets is the most vivid memory of my childhood in Montreal. In some way, the need for networks of friendly and safe sidewalk space is much more import-ant than that of empty green fields, and both Beijing and Montreal fulfill this need.
78

about STREETSCAPEcaterina VILLANI razvan GHETI
ONESQKMMONTREALBEIJING STREETSCAPE | CATERINA VILLANI
81
ONESQKMMONTREALBEIJING STREETSCAPE | CATERINA VILLANI
THE IMAGE OF THE STREET: A COMPARISON
BETWEEN BEIJING, MONTREAL AND VENICE
In 1961 Jane Jacobs wrote: “Think of a city and what comes to mind? Its streets. If the city’s streets look interesting, the city looks interest-ing; if they look dull, the city looks dull.”When we look at a town satellite-image, before recognizing parks, buildings or squares, we distinguish a city because it is a maze or a knot of streets. There is a strong connection between urban form and the density of the street network: where the latter has density, there is not urban space, where there is a close-mesh net, we could imagine to hear the hustle and bustle of the city. Historically, Streets have been the key feature in the taking shape of a city, for example in the Roman city planning, two orthogonal paved streets -Cardo and Decumanus- were the starting point in the town building process (together with the Forum). Streetsareasignificantpartoftheurbanspace,theothersaresquares, plazas, parks and landmarks. However the image of the city is often given by how we perceive its streets, in other words, we cre-ate an image of the city through the experience we have in its streets. KevinLynchclassifies5contentsthatcreatestheImageofthecity,hisdefinitionofPathisrelevantforthepurposeofthisessay: “Paths. Paths are the channels along which the observer customarily, occasionally, or potentially moves. They may be streets, walkways, transit lines, canals, railroads. For many people, these are the predominant elements in their image. People observe the city while moving through it, and along these paths the other environmen-tal elements are arranged and related.” (The Image of the City, Kevin Lynch)What we identify as street is the urban, mainly public space, vertically shaped by building facades, with a directional quality (the direction along the line can be distinguished from the reverse). Elements of the streets are sidewalks, bike paths, car lanes, trees lines and various landscapes.
The urban identity is strongly connected to the streets and the perception of them, somehow it directly resides in this urban space, which is different from city to city. In order to give evidence to this argu-mentitisnecessarytodefinewhatisthestreetscapeandtoanalysedifferent scales of streetscapes from different cities. “Streetscape is a term used to describe the natural and built fabricofthestreet,anddefinedasthedesignqualityofthestreetandits visual effect, particularly how the paved area is laid out and treated. Itincludesbuildings,thestreetsurface,andalsothefixturesandfit-tings that facilitate its use – from bus shelters and signage to planting schemes” (Sustainable streetscape as an effective tool in sustainable urban design, Reeman Mohammed Rehan). In addiction, the streets-cape, because, by its nature, it is related to the physical and non-phys-ical, is one of the most valid tool to understand the urban identity and to visualise the image of the street. This research aims to give an image of the streets, analysing, comparing and drawing observations about three streetscapes from three different cities: Beijing, Montreal and Venice. These cities were selected because of their different scale, age and street system. Re-searchmethodologyisbasedfirstofallonestablishingastreethier-archy in each city, explaining the “set” of street section and elevation, and comparing the streets.
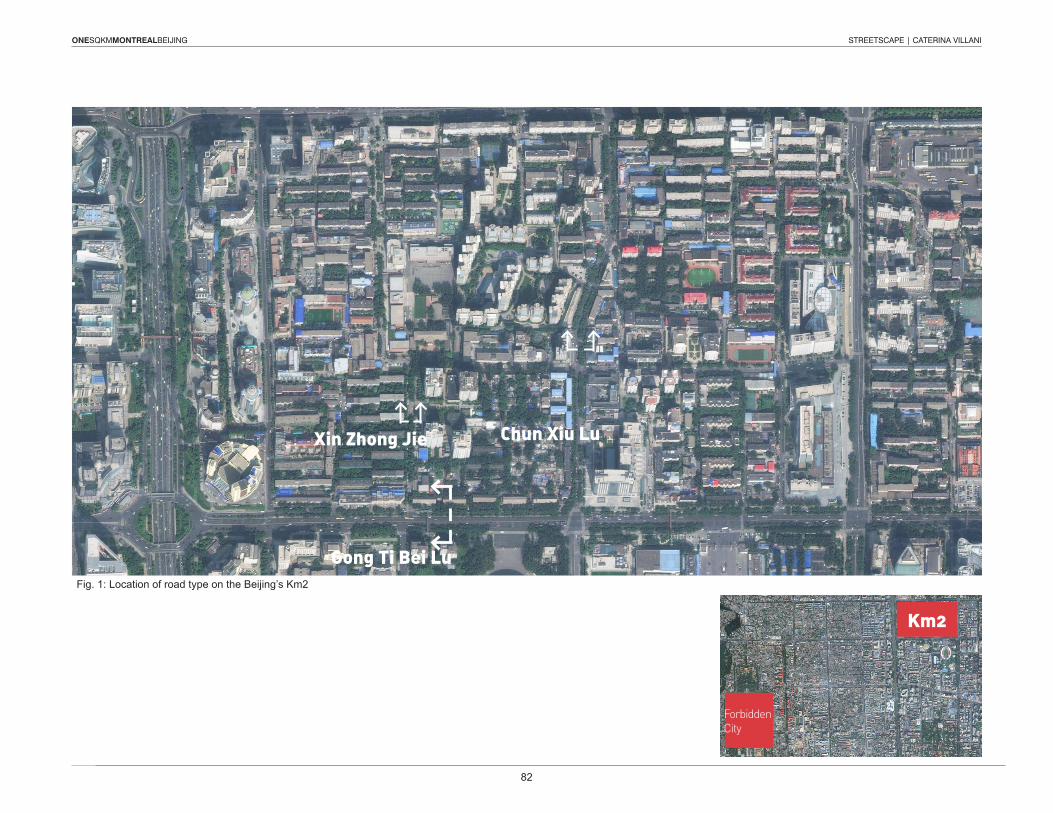
ONESQKMMONTREALBEIJING STREETSCAPE | CATERINA VILLANI
82
ONESQKMMONTREALBEIJING YOUR TOPIC | YOUR NAME
Beijing The three sections represent three very different Beijing streets of the km2 analysed in this book, they are respectively, an arterial road, a secondary road and a neighbourhood smaller road. Gong Ti Bei Lu is anarterialstreet,58.6mwide,withsixcarlanesandtwocarparkinglanes, the orientation is East-West. Chun Xiu Lu is a secondary street, 22 m wide, with two car lanes and two parking lanes, the orientation is North-South. Xin Zhong Jie is the smallest street it is used as neigh-bourhood street, 17 m wide, with two car lanes and one parking lane.The main difference between them is that Gong ti Bei Lu Street delimi-tates the layout of the typical Chinese mega block, while both Chun Xiu Lu and Xin Zhong Jie are streets inside the mega block, so they repre-sent a different gradient of privacy. The streets represent a gradual lay-er of control, in fact on both Chun Xiu Lu and Xin Zhong Jie, the smaller streets, there are the main accesses to the residential buildings. The perimeter of the residential area is surrounded by a fence and the ac-cess is limited to residents.Another main difference between the arterial street and the secondary and neighbourhood street is that typical buildings’ orientation in China, is East-West; therefore the street façade in Gong ti Bei Lu (East-west orientation) is more articulated than Chun Xiu Lu and Xin Zhong Jie’s street façade.It can be clearly seen that in Beijing the gap between an arterial road and a neighbourhood road is striking, consequently, if we compare this street network system with Montreal or Venice’s system, it can be ob-served that Beijing road network is the most hierarchical and clear.
Fig. 2:Chun Xiu Lu: Secondary street1:500
Fig. 2:Gong Ti Bei Lu: Arterial street 1:500
Fig. 3: Xin Zhong Jie: Neighbourhood street1:500
58.6 M
22 M
17 M
ONESQKMMONTREALBEIJING YOUR TOPIC | YOUR NAME
Fig. 1: Location of road type on the Beijing’s Km2
Gong Ti Bei Lu
Chun Xiu LuXin Zhong Jie
Km2
Forbidden City
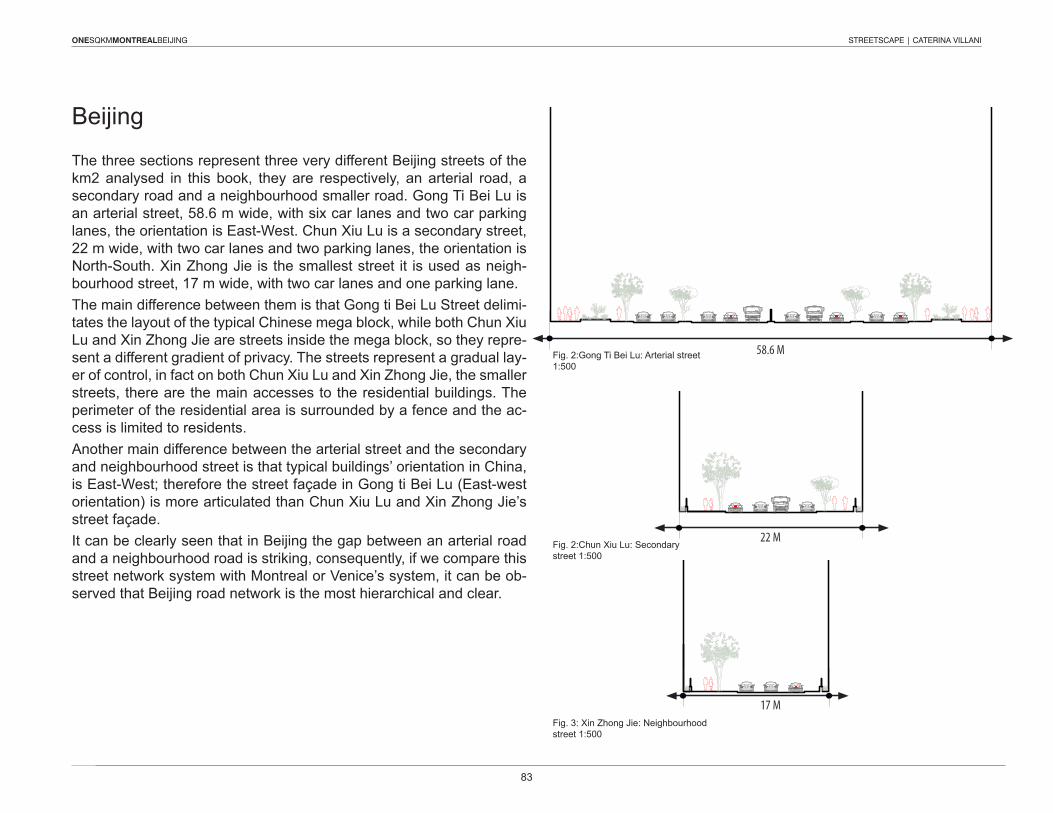
ONESQKMMONTREALBEIJING STREETSCAPE | CATERINA VILLANI
83
ONESQKMMONTREALBEIJING YOUR TOPIC | YOUR NAME
Beijing The three sections represent three very different Beijing streets of the km2 analysed in this book, they are respectively, an arterial road, a secondary road and a neighbourhood smaller road. Gong Ti Bei Lu is anarterialstreet,58.6mwide,withsixcarlanesandtwocarparkinglanes, the orientation is East-West. Chun Xiu Lu is a secondary street, 22 m wide, with two car lanes and two parking lanes, the orientation is North-South. Xin Zhong Jie is the smallest street it is used as neigh-bourhood street, 17 m wide, with two car lanes and one parking lane.The main difference between them is that Gong ti Bei Lu Street delimi-tates the layout of the typical Chinese mega block, while both Chun Xiu Lu and Xin Zhong Jie are streets inside the mega block, so they repre-sent a different gradient of privacy. The streets represent a gradual lay-er of control, in fact on both Chun Xiu Lu and Xin Zhong Jie, the smaller streets, there are the main accesses to the residential buildings. The perimeter of the residential area is surrounded by a fence and the ac-cess is limited to residents.Another main difference between the arterial street and the secondary and neighbourhood street is that typical buildings’ orientation in China, is East-West; therefore the street façade in Gong ti Bei Lu (East-west orientation) is more articulated than Chun Xiu Lu and Xin Zhong Jie’s street façade.It can be clearly seen that in Beijing the gap between an arterial road and a neighbourhood road is striking, consequently, if we compare this street network system with Montreal or Venice’s system, it can be ob-served that Beijing road network is the most hierarchical and clear.
Fig. 2:Chun Xiu Lu: Secondary street1:500
Fig. 2:Gong Ti Bei Lu: Arterial street 1:500
Fig. 3: Xin Zhong Jie: Neighbourhood street1:500
58.6 M
22 M
17 M
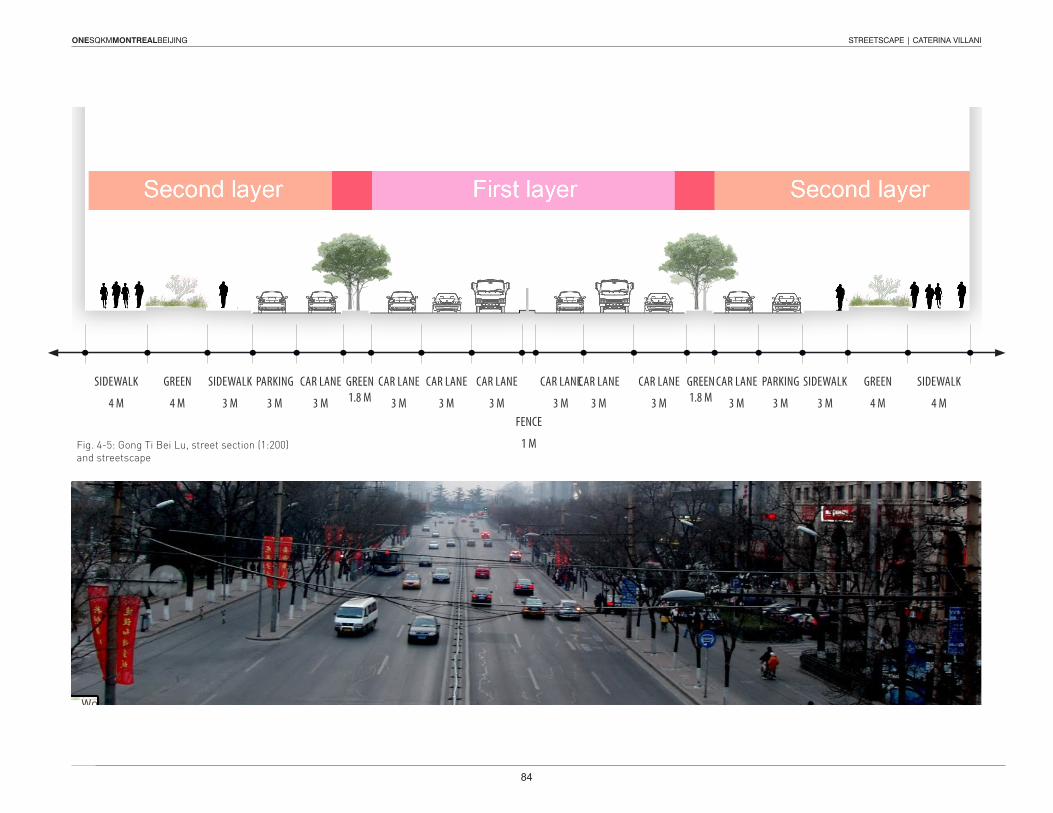
ONESQKMMONTREALBEIJING STREETSCAPE | CATERINA VILLANI
84
ONESQKMMONTREALBEIJING YOUR TOPIC | YOUR NAME
Fig. 6: Gong Ti Bei Lu, street photo elevation (North side)
ONESQKMMONTREALBEIJING YOUR TOPIC | YOUR NAME
SIDEWALK
4 M
SIDEWALK
4 M
GREEN
4 M
GREEN
4 M
SIDEWALK
3 M
SIDEWALK
3 M
PARKING
3 M
PARKING
3 M
CAR LANE
3 M
CAR LANE
3 M
CAR LANE
3 M
CAR LANE
3 M
CAR LANE
3 M
CAR LANE
3 M
CAR LANE
3 M
CAR LANE
3 MFENCE
1 M
GREEN1.8 M
GREEN1.8 M
Fig. 4-5: Gong Ti Bei Lu, street section (1:200) and streetscape
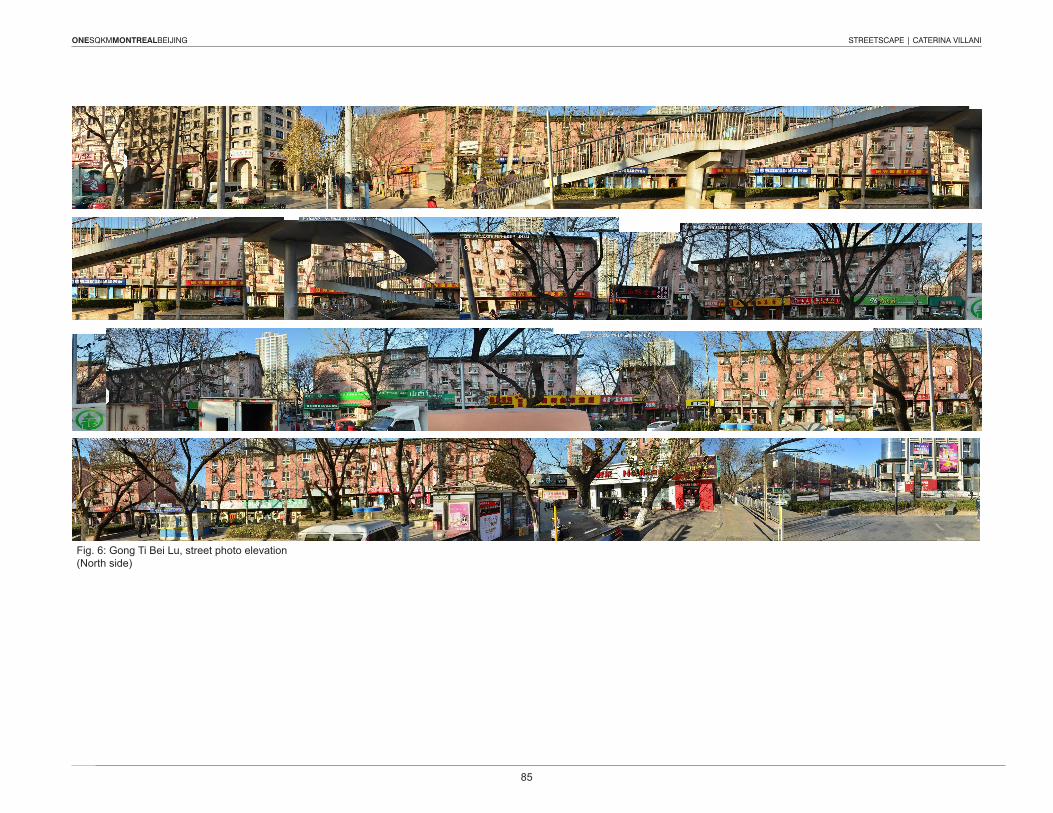
ONESQKMMONTREALBEIJING STREETSCAPE | CATERINA VILLANI
85
ONESQKMMONTREALBEIJING YOUR TOPIC | YOUR NAME
Fig. 6: Gong Ti Bei Lu, street photo elevation (North side)
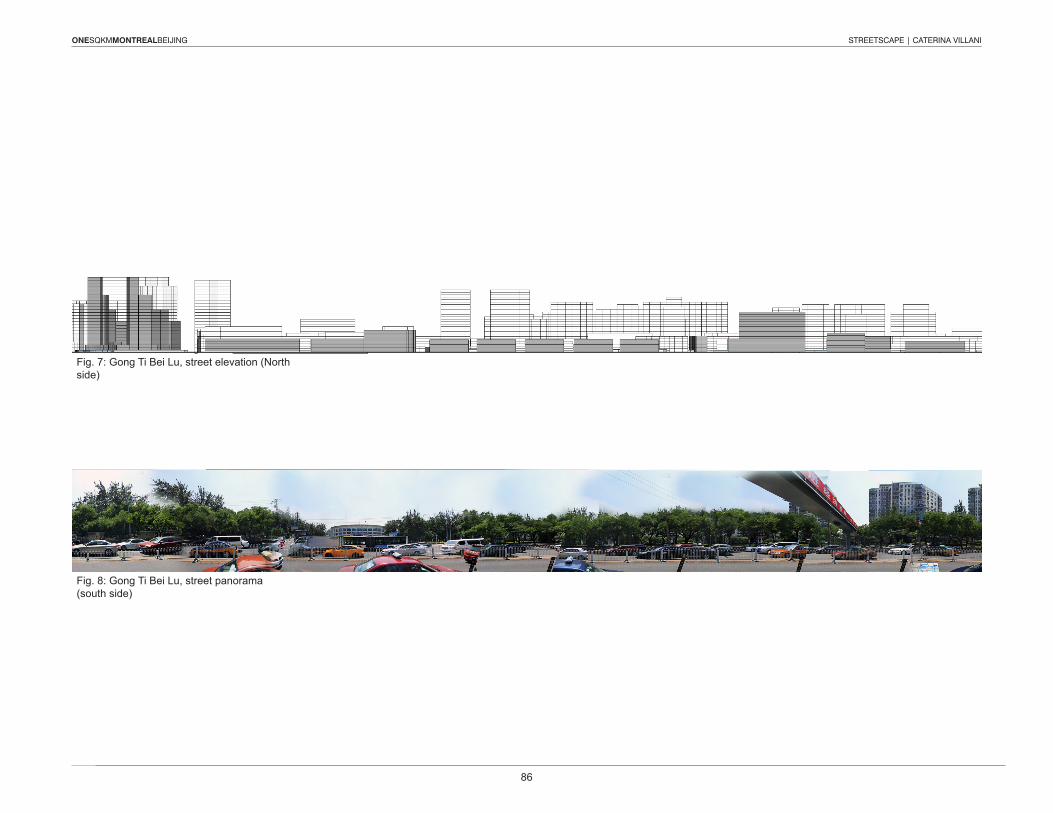
ONESQKMMONTREALBEIJING STREETSCAPE | CATERINA VILLANI
86
ONESQKMMONTREALBEIJING YOUR TOPIC | YOUR NAME
Gong Ti Bei Lu is is located at the north of workers gymnasium and work-ersstadium,itisaverytrafficatedstreetwhichdelimitatesthelayoutofthe typical Chinese mega-block, pedestrians can cross it only at cross walks or using the footbridge. The layout of the street section is clearly organized and based on the users’ main activities and speeds. We could distinguish two major lay-ersinGongTiBeiLustreetsection:thefirstoneisanhighspeedlayer,located in the centre of the street; the second one is a low speed layer, situated near the edges. Thefirst layer is24,6mwide, it consistsof six car lanes, threelanes per direction, separated in the middle by a fence. On the sides of the six lanes, there are rows of trees that give more privacy to the edges of the street, but this layer does not have physical connection to the building façade.The users of this layer are car drivers, who have a perception of the streetat60km/h,theycanseethefacadesofhigherbuildingsandbiggersignage related to hotels or buildings name in general. The second layer is the most articulated, it is 17 m wide for each edge, it consists of one car lane and one car parking lane, 3 m of the side-walkintendedforpedestrianfastercirculation,4mofvegetationbox,finally,4mofsidewalkconnectedtothebuildings.Thecarlaneisaddressedtoaneighbourhood circulation, in fact the speed limit is lower than the central part of the street. In the past, the car-parking lane was mainly used by bi-cycles, but today the number of bicycle users has decreased, so the lane is used for temporary parking. The sidewalk area is 11 m wide and it is the mostsignificantpartoftheChinesestreet,themostrelatedtotheurbanidentity:whilethefirstsidewalk(3m)isusedforpedestriancirculation;thevegetationbox,usedasabench,andthe4msidewalkaremoreanopensocial space than a path. Restaurants and shops have outdoor furniture in this area and it is common to see people gather to play chess on the street. In Beijing, the skyline is shaped by height regulations, buildings do not have elaborated facades, and the difference between main façade and side facades, that can be encountered in western cities, cannot be applied. One reason of this, could be that the role of the façade in relation to the street is less strong or important than in the other cities that will be anal-ysed, in fact in Beijing most of the facades are alineated one to the other and seem less connected to the street.
Fig. 9: Gong Ti Bei Lu, Row trees
Fig.10:GongTiBeiLu,Activitiesonthesidewalknear the buildings
Fig. 11: Gong Ti Bei Lu, Fence inthe middle of the street
ONESQKMMONTREALBEIJING YOUR TOPIC | YOUR NAME
Fig.8:GongTiBeiLu,streetpanorama(south side)
Fig. 7: Gong Ti Bei Lu, street elevation (North side)
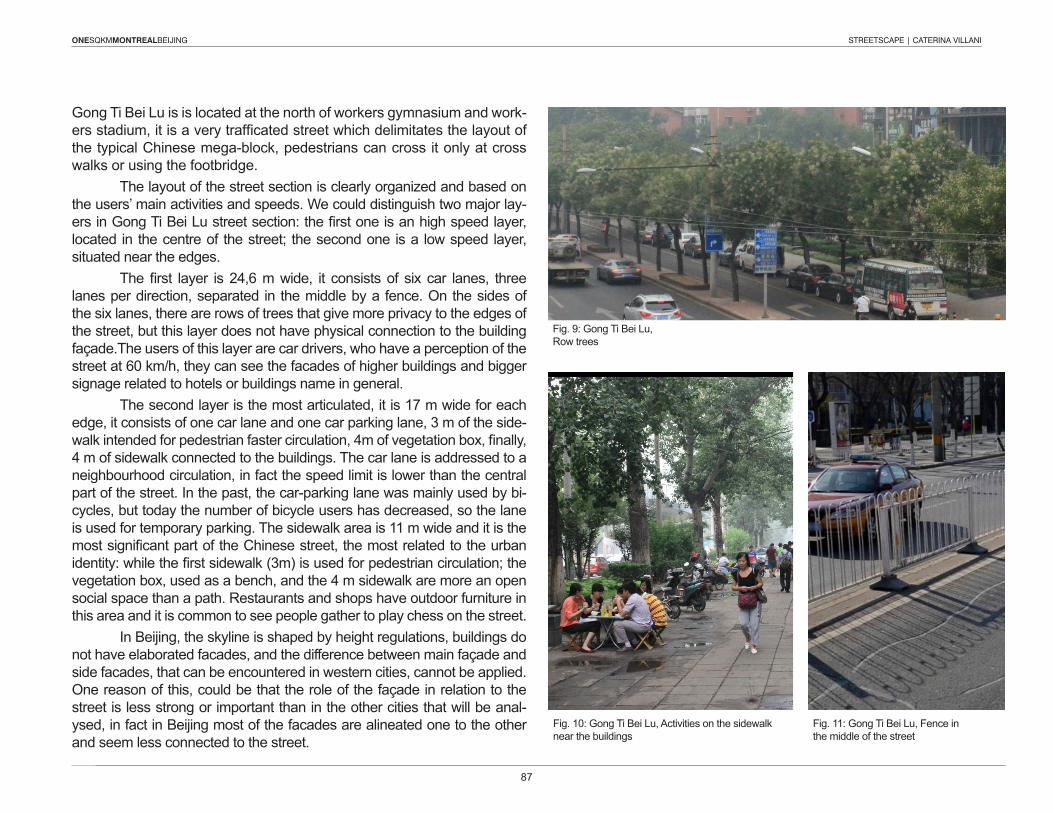
ONESQKMMONTREALBEIJING STREETSCAPE | CATERINA VILLANI
87
ONESQKMMONTREALBEIJING YOUR TOPIC | YOUR NAME
Gong Ti Bei Lu is is located at the north of workers gymnasium and work-ersstadium,itisaverytrafficatedstreetwhichdelimitatesthelayoutofthe typical Chinese mega-block, pedestrians can cross it only at cross walks or using the footbridge. The layout of the street section is clearly organized and based on the users’ main activities and speeds. We could distinguish two major lay-ersinGongTiBeiLustreetsection:thefirstoneisanhighspeedlayer,located in the centre of the street; the second one is a low speed layer, situated near the edges. Thefirst layer is24,6mwide, it consistsof six car lanes, threelanes per direction, separated in the middle by a fence. On the sides of the six lanes, there are rows of trees that give more privacy to the edges of the street, but this layer does not have physical connection to the building façade.The users of this layer are car drivers, who have a perception of the streetat60km/h,theycanseethefacadesofhigherbuildingsandbiggersignage related to hotels or buildings name in general. The second layer is the most articulated, it is 17 m wide for each edge, it consists of one car lane and one car parking lane, 3 m of the side-walkintendedforpedestrianfastercirculation,4mofvegetationbox,finally,4mofsidewalkconnectedtothebuildings.Thecarlaneisaddressedtoaneighbourhood circulation, in fact the speed limit is lower than the central part of the street. In the past, the car-parking lane was mainly used by bi-cycles, but today the number of bicycle users has decreased, so the lane is used for temporary parking. The sidewalk area is 11 m wide and it is the mostsignificantpartoftheChinesestreet,themostrelatedtotheurbanidentity:whilethefirstsidewalk(3m)isusedforpedestriancirculation;thevegetationbox,usedasabench,andthe4msidewalkaremoreanopensocial space than a path. Restaurants and shops have outdoor furniture in this area and it is common to see people gather to play chess on the street. In Beijing, the skyline is shaped by height regulations, buildings do not have elaborated facades, and the difference between main façade and side facades, that can be encountered in western cities, cannot be applied. One reason of this, could be that the role of the façade in relation to the street is less strong or important than in the other cities that will be anal-ysed, in fact in Beijing most of the facades are alineated one to the other and seem less connected to the street.
Fig. 9: Gong Ti Bei Lu, Row trees
Fig.10:GongTiBeiLu,Activitiesonthesidewalknear the buildings
Fig. 11: Gong Ti Bei Lu, Fence inthe middle of the street
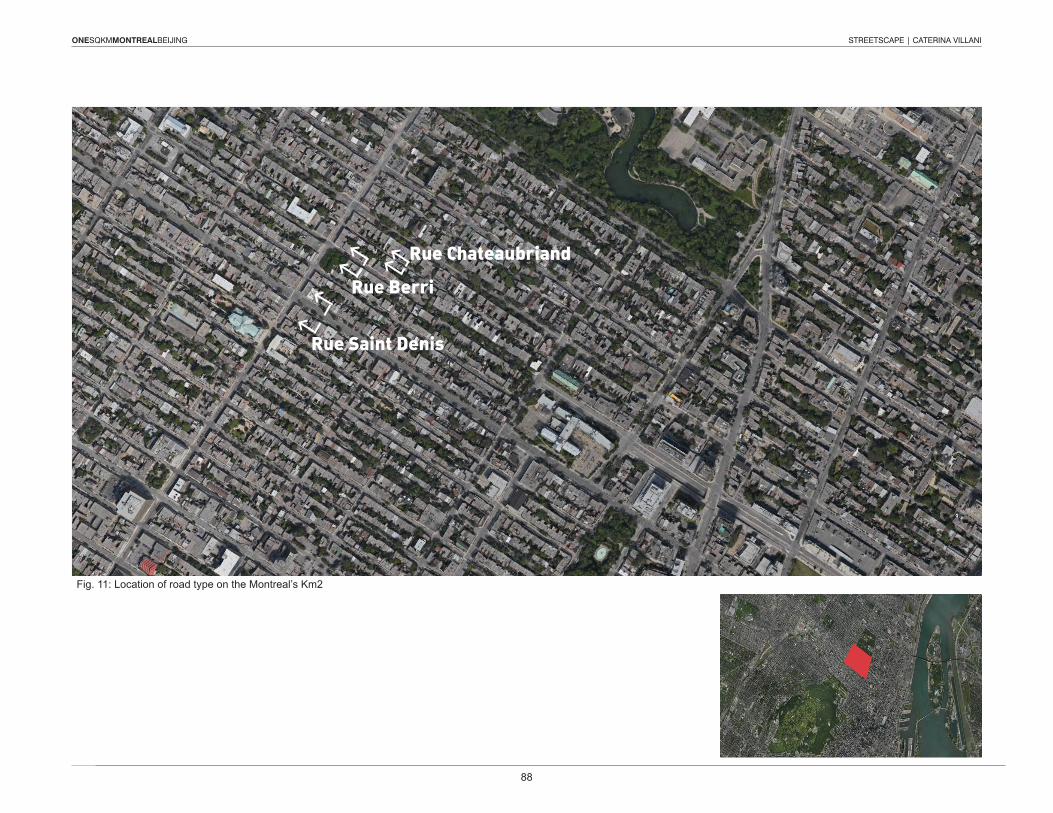
ONESQKMMONTREALBEIJING STREETSCAPE | CATERINA VILLANI
88
ONESQKMMONTREALBEIJING YOUR TOPIC | YOUR NAME
Montreal The Plateau is the neighbourhood of the cultural vitality, in the past it was a working class area, home to artisans and shop keepers. Nowa-days is the attraction pole for the creative class, young professionals from all over the world come to live in there. The Plateau is mainly a residential neighbourhood with low rise buildings, but along the bigger streets there are shops and restaurants, as well as the typical depan-neurs, small grocery shops at the corner of the streets. The three sections represent three types of streets of Montre-al’s Plateau, the difference between the three is less visually recogniz-able than Beijing’s street where there was a clear distinction between arterial street and neighbourhood street. The streets are respectively, Saint Denis, an arterial road, Rue Berri a secondary road and a back alley or ruelle. Saint Denis is a main street, 28mwide,withfourcarlanesandtwocarparkinglanes,theorientationisNorth-WestSouth-East.RueBerriisasecondarystreet,14mwide,with two car lanes and one parking lane, the orientation is North-west South-East. The back alley, Rue Chateaubriand is the smallest street it is public but is used by residents who live in the buildings nearby, the widthis4maverage,ithasthesameorientation.
Fig.12:RueSaintDenis:Arterialstreet1:500
Fig.13:RueBerri:Secondarystreet1:500
Fig.14:RueChateaubriand:Backalley1:500
28 M
14 M
4 M
ONESQKMMONTREALBEIJING YOUR TOPIC | YOUR NAME
Gong Ti Bei Lu
Chun Xiu LuXin Zhong Jie
Km2
Forbidden City
Fig. 11: Location of road type on the Montreal’s Km2
Rue Saint Denis
Rue Berri
Rue Chateaubriand
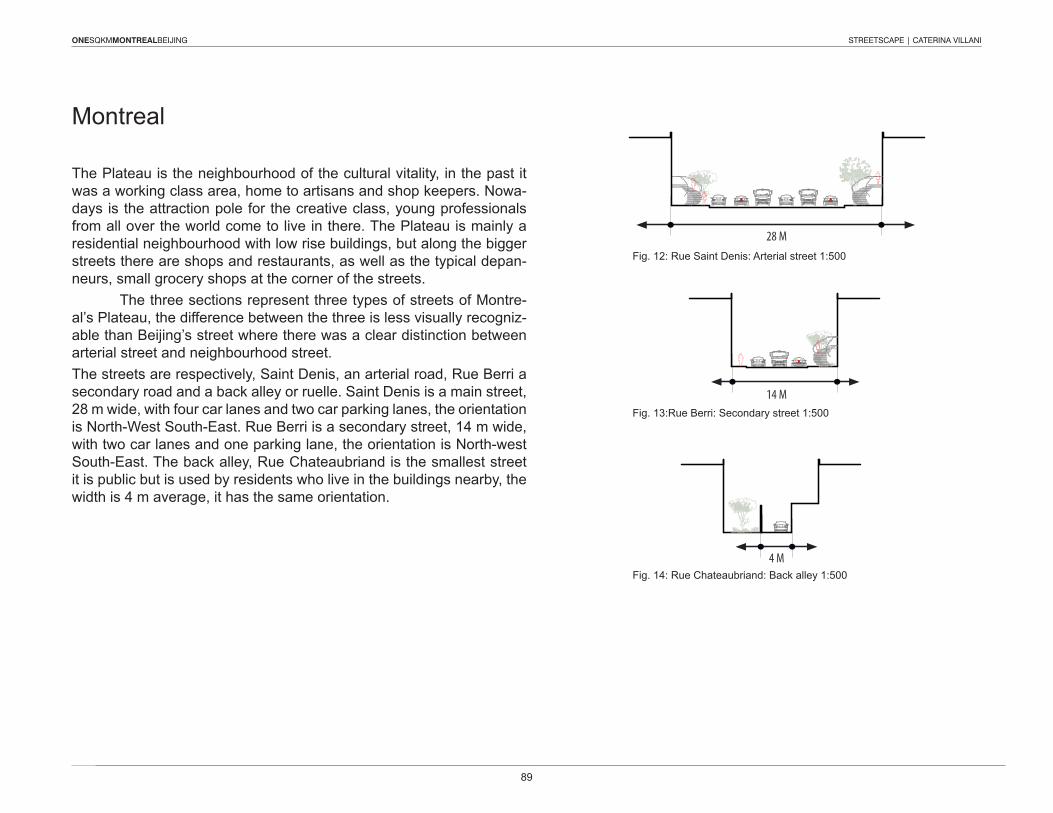
ONESQKMMONTREALBEIJING STREETSCAPE | CATERINA VILLANI
89
ONESQKMMONTREALBEIJING YOUR TOPIC | YOUR NAME
Montreal The Plateau is the neighbourhood of the cultural vitality, in the past it was a working class area, home to artisans and shop keepers. Nowa-days is the attraction pole for the creative class, young professionals from all over the world come to live in there. The Plateau is mainly a residential neighbourhood with low rise buildings, but along the bigger streets there are shops and restaurants, as well as the typical depan-neurs, small grocery shops at the corner of the streets. The three sections represent three types of streets of Montre-al’s Plateau, the difference between the three is less visually recogniz-able than Beijing’s street where there was a clear distinction between arterial street and neighbourhood street. The streets are respectively, Saint Denis, an arterial road, Rue Berri a secondary road and a back alley or ruelle. Saint Denis is a main street, 28mwide,withfourcarlanesandtwocarparkinglanes,theorientationisNorth-WestSouth-East.RueBerriisasecondarystreet,14mwide,with two car lanes and one parking lane, the orientation is North-west South-East. The back alley, Rue Chateaubriand is the smallest street it is public but is used by residents who live in the buildings nearby, the widthis4maverage,ithasthesameorientation.
Fig.12:RueSaintDenis:Arterialstreet1:500
Fig.13:RueBerri:Secondarystreet1:500
Fig.14:RueChateaubriand:Backalley1:500
28 M
14 M
4 M
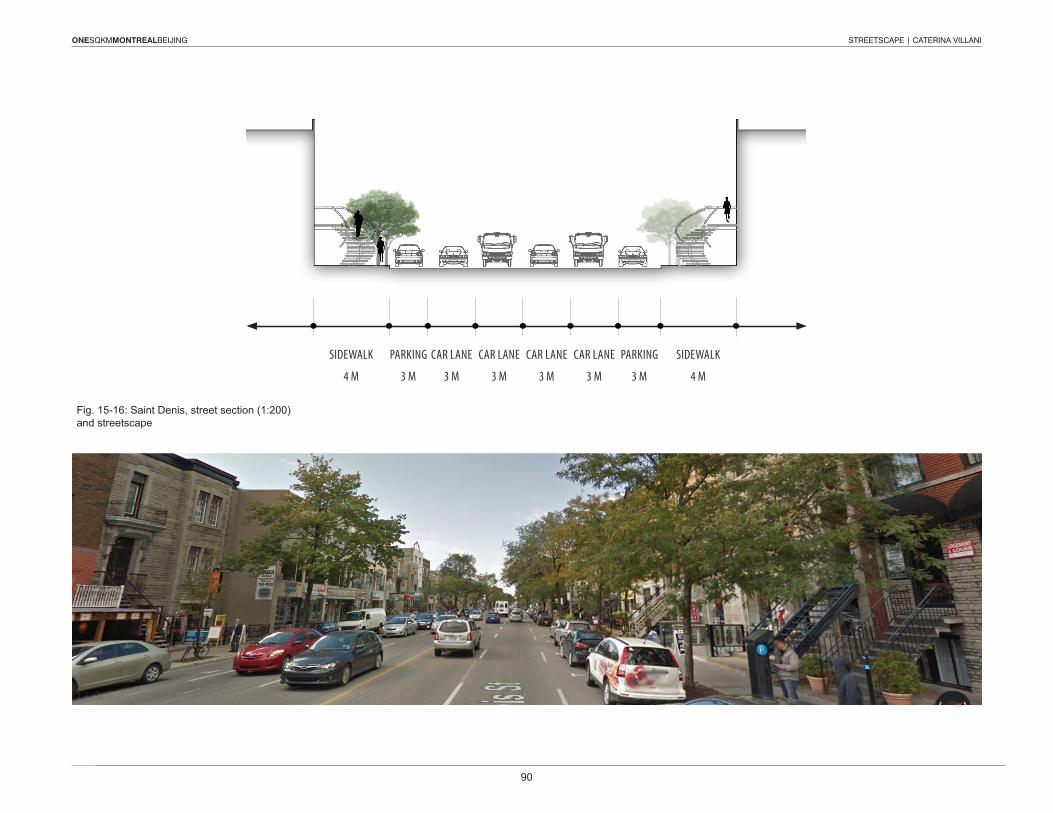
ONESQKMMONTREALBEIJING STREETSCAPE | CATERINA VILLANI
90
ONESQKMMONTREALBEIJING STREETSCAPE | CATERINA VILLANI
Rue Saint Denis
There are not striking differences between Rue Saint Denis and Rue Berri, in both streets face the main facades of the buildings, but they haveadifferentuse:thefirstisacommercialstreet,thelatterisaresidential street. In addiction, another difference is that Rue Saint Denisisamoretrafficcongestedtwowaysstreet,whileRueBerriisa one way street. The back alley brings an element of contradistinc-tion, it is as long as the block of houses on the side of it, so on this small street face the back facades of the buildings. This backspace is public, but the perception of it is of a semi-private space. The ruelle is often used as common backyard, with only pedestrian access. In the last decades, the communities have been more involved in the requalificationof the ruelles, that in somecaseswereabandonedspace. The back alleys or ruelle are a more private type of streets, theyareimportantbecausetheydefineadifferentlayerofprivacy.
All in all, it can be observed that the difference between the front andthebackfaçadesreflectstwodifferenturbanmeaningsandtwolevels of community: the front façade is the public one, it reveals how the community dialogues with the exterior, the back façade suggests a more private layer, it is a space inside the community, for the com-munity.
Saint Denis is a clear example of the Plateau’s urban identity: the section shows that from the sidewalk it can be reached the second floorofthebuildingsusingtheoutdoorstaircases.Inthegroundfloorthere are commercial activities so visitors and residents gather in the 5msidewalk.The layers of the street section is not as clearly organised as Bei-jing’s arterial section. There are four car lanes, two lanes for each direction, twocarparking lanesat thesides, foratotalof18mofasphalt street. Near the buildings’ facades there are small front yard, in this space there is the access to the outdoor staircases, which are a distinctive element of Plateau’s facades.
In order to understand this Idiosyncracy, it is necessary to brieflyexplain the history of the Plateau.Montreal’spopulationquadrupledbetween1880and1915,inorderto accommodate all the newcomers, were built three storey build-ings,dividedintothree,fiveorsixapartements.Todaythemajorityofthe buildings of the Plateau are three storey high, the main facades are different one to the other. The iron staircase led to common bal-conies where each family had its own door, this balcony is the per-fect place to watch life in the neighbourhood. On major streets the groundfloorsareoftengiventoPlateau’stypicalrestaurants,cornerstores and clothing shops.Triplexes give shape and unity to the urban fabric, their façades is its trademark, in those resides the “Image of the City”.
ONESQKMMONTREALBEIJING YOUR TOPIC | YOUR NAME
SIDEWALK
4 M
SIDEWALK
4 M
PARKING
3 M
PARKING
3 M
CAR LANE
3 M
CAR LANE
3 M
CAR LANE
3 M
CAR LANE
3 M
Fig.15-16:SaintDenis,streetsection(1:200)and streetscape
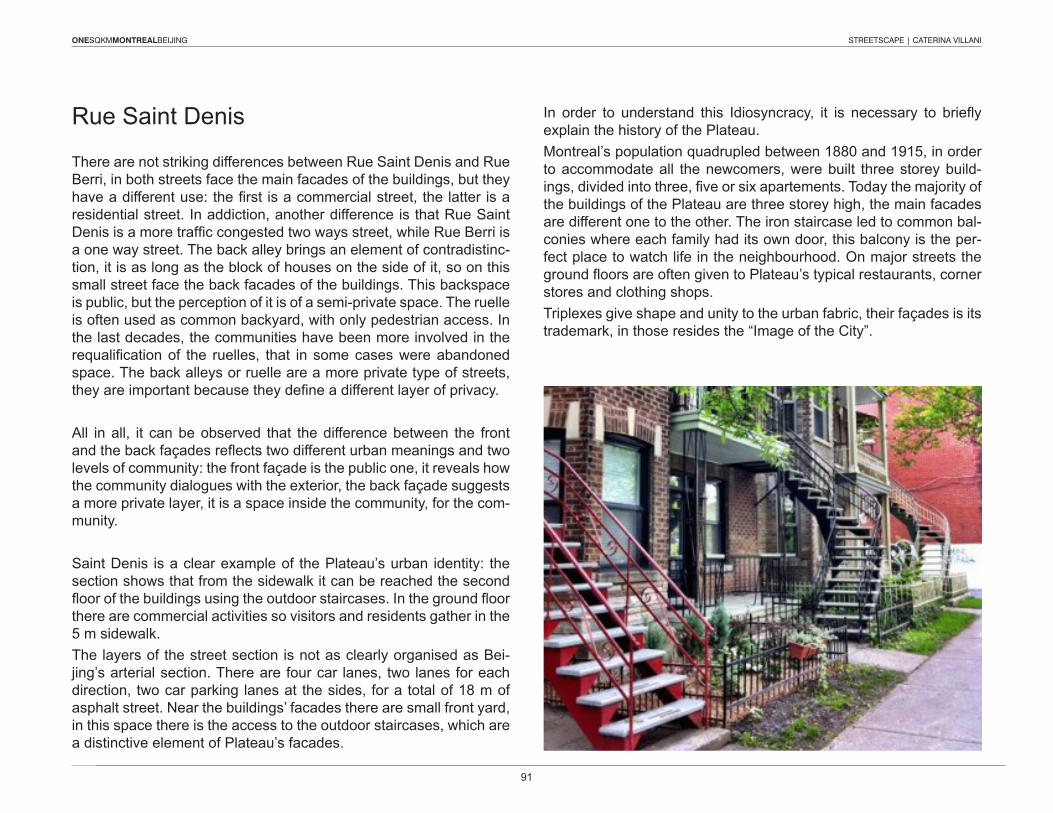
ONESQKMMONTREALBEIJING STREETSCAPE | CATERINA VILLANI
91
ONESQKMMONTREALBEIJING STREETSCAPE | CATERINA VILLANI
Rue Saint Denis
There are not striking differences between Rue Saint Denis and Rue Berri, in both streets face the main facades of the buildings, but they haveadifferentuse:thefirstisacommercialstreet,thelatterisaresidential street. In addiction, another difference is that Rue Saint Denisisamoretrafficcongestedtwowaysstreet,whileRueBerriisa one way street. The back alley brings an element of contradistinc-tion, it is as long as the block of houses on the side of it, so on this small street face the back facades of the buildings. This backspace is public, but the perception of it is of a semi-private space. The ruelle is often used as common backyard, with only pedestrian access. In the last decades, the communities have been more involved in the requalificationof the ruelles, that in somecaseswereabandonedspace. The back alleys or ruelle are a more private type of streets, theyareimportantbecausetheydefineadifferentlayerofprivacy.
All in all, it can be observed that the difference between the front andthebackfaçadesreflectstwodifferenturbanmeaningsandtwolevels of community: the front façade is the public one, it reveals how the community dialogues with the exterior, the back façade suggests a more private layer, it is a space inside the community, for the com-munity.
Saint Denis is a clear example of the Plateau’s urban identity: the section shows that from the sidewalk it can be reached the second floorofthebuildingsusingtheoutdoorstaircases.Inthegroundfloorthere are commercial activities so visitors and residents gather in the 5msidewalk.The layers of the street section is not as clearly organised as Bei-jing’s arterial section. There are four car lanes, two lanes for each direction, twocarparking lanesat thesides, foratotalof18mofasphalt street. Near the buildings’ facades there are small front yard, in this space there is the access to the outdoor staircases, which are a distinctive element of Plateau’s facades.
In order to understand this Idiosyncracy, it is necessary to brieflyexplain the history of the Plateau.Montreal’spopulationquadrupledbetween1880and1915,inorderto accommodate all the newcomers, were built three storey build-ings,dividedintothree,fiveorsixapartements.Todaythemajorityofthe buildings of the Plateau are three storey high, the main facades are different one to the other. The iron staircase led to common bal-conies where each family had its own door, this balcony is the per-fect place to watch life in the neighbourhood. On major streets the groundfloorsareoftengiventoPlateau’stypicalrestaurants,cornerstores and clothing shops.Triplexes give shape and unity to the urban fabric, their façades is its trademark, in those resides the “Image of the City”.
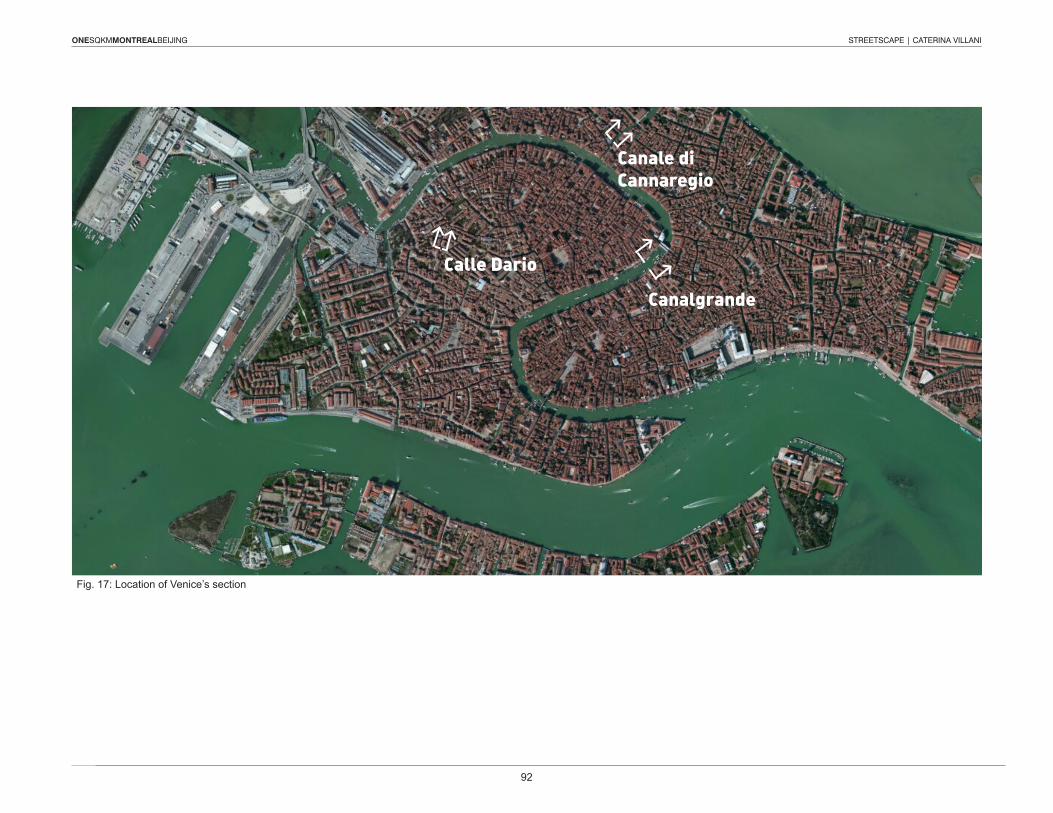
ONESQKMMONTREALBEIJING STREETSCAPE | CATERINA VILLANI
92
ONESQKMMONTREALBEIJING YOUR TOPIC | YOUR NAME
Fig.18:Canalgrandesection 55 M
Fig. 19: Calle di Canaregio section 21 M
Fig.20:CalleDariosection 9 M
ONESQKMMONTREALBEIJING YOUR TOPIC | YOUR NAME
Gong Ti Bei Lu
Chun Xiu LuXin Zhong Jie
Fig. 17: Location of Venice’s section
Canalgrande
Canale di Cannaregio
Calle Dario
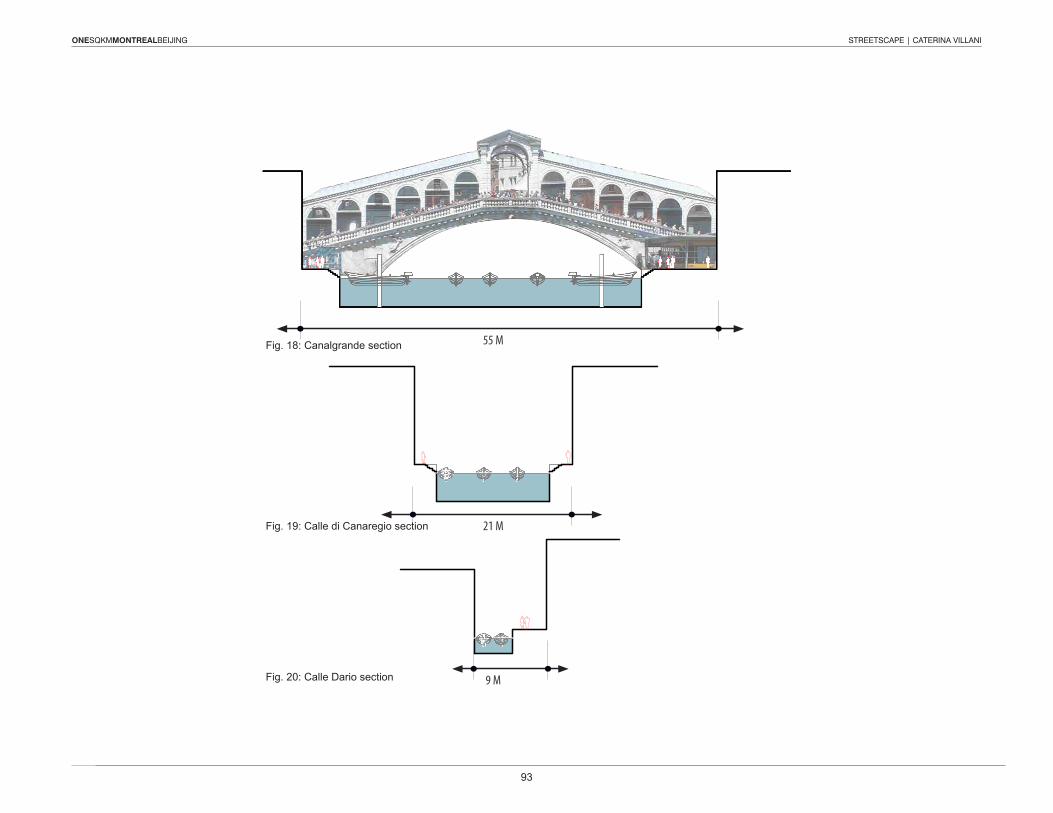
ONESQKMMONTREALBEIJING STREETSCAPE | CATERINA VILLANI
93
ONESQKMMONTREALBEIJING YOUR TOPIC | YOUR NAME
Fig.18:Canalgrandesection 55 M
Fig. 19: Calle di Canaregio section 21 M
Fig.20:CalleDariosection 9 M
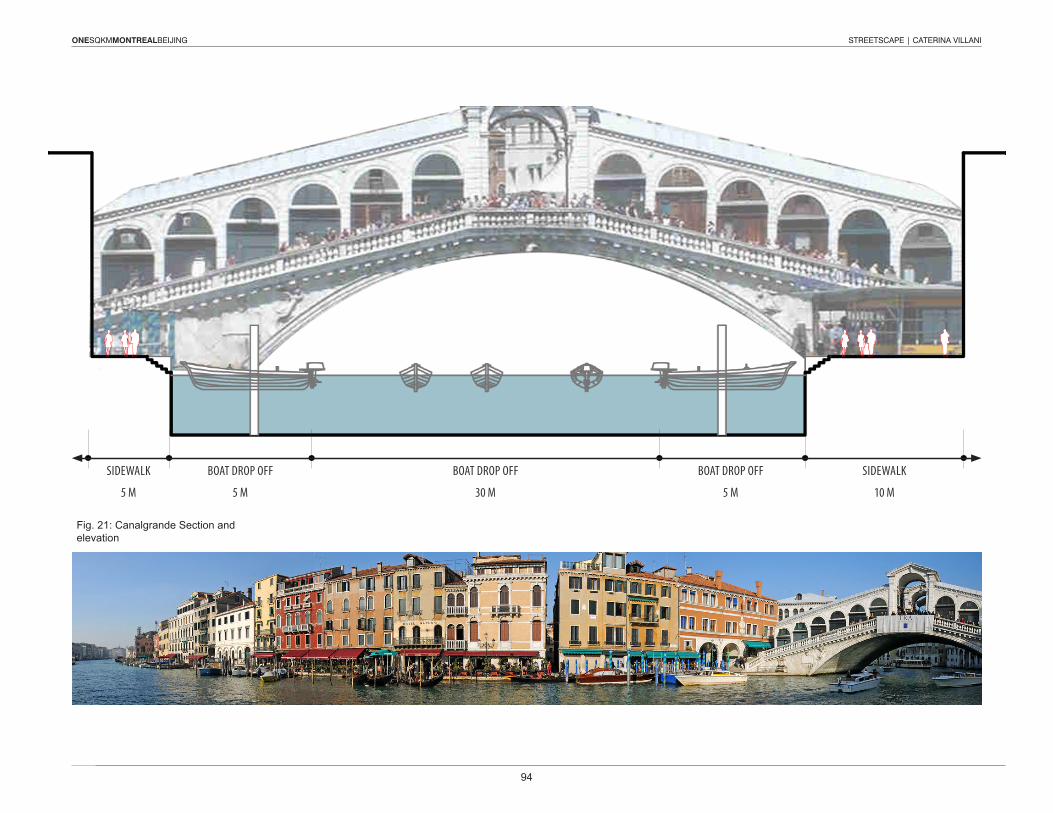
ONESQKMMONTREALBEIJING STREETSCAPE | CATERINA VILLANI
94
ONESQKMMONTREALBEIJING STREETSCAPE | CATERINA VILLANI
Venice “There is still one (city) of which you never speak.’Marco Polo bowed his head.‘Venice,’ the Khan said.Marco smiled. ‘What else do you believe I have been talking to you about?’The emperor did not turn a hair. ‘And yet I have never heard you mention that name.’And Polo said: ‘Every time I describe a city I am saying something about Venice.” (Italo Calvino, Invisible Cities)
In the book “Learning from Las Vegas” Venturi illustrates his study on the perception of the contemporary city. A new car-oriented urban form had evolved in the post–World War. In the case of the contem-porary North American city, the observer tended to see the city from a moving car at heightened speed. The image of the city that results is a Cinematic vision of the urban space. What would be the image of a city without cars?The answer to this question could be found in Venice.This city is an island, it was constucted on an agglomeration of small islands, surrounded by lagoon. The main transportation system was boat, conversely, nowadays it is more common to walk. Some wa-terways naturally existed, other were dug for navigation, as a result, buldingsandalleyshadtofitinsmallspaces.InVenice,thetypicalstreetsectionreflectsthenatureofanislandcrossed by canals: Canalgrande,whichisthemainarterialstreetiswide55m,40mofthis width consists in the canal and the side boat parking.Atthesideofit,therearethesidewalkswicharerespectively5mwideand10mwide.Historically Canalgrande was Venice’s showcase, all the buildings
facing this canal had a decorated facade, the other facades of the buildings were and are simpler.Venice waterways organization is highly hierarchical, but is not clear-lyrecognizableatfirstsight.UsuallyCanalgrande,thewidercanal,can be reached through secondary canals, while smallest canals flowintosecondarycanals.Eventhetrafficisdividedaccordinglytocanals width: Canalgrande can be navigated by ferryboats, power-boats and rowboats. Conversely powerboats and rowboats can sail in secondary canals and only rowboats can navigate the smallest canals. As owning a boat became unaffordable, Venetian sidewalks have been gradually more used, that is the perfect place to watch the busy pace of everyday life. Tourists and residents walk along the sidewalks and they are often an obstacle one to the other.
ONESQKMMONTREALBEIJING YOUR TOPIC | YOUR NAME
Fig. 1: Please DO NOT adjust the width of this caption box. Adjust the height to fit the text if needed.
Fig. 21: Canalgrande Section and elevation
SIDEWALK
5 M
BOAT DROP OFF
5 M
BOAT DROP OFF
30 M
BOAT DROP OFF
5 M
SIDEWALK
10 M

ONESQKMMONTREALBEIJING STREETSCAPE | CATERINA VILLANI
95
ONESQKMMONTREALBEIJING STREETSCAPE | CATERINA VILLANI
Venice “There is still one (city) of which you never speak.’Marco Polo bowed his head.‘Venice,’ the Khan said.Marco smiled. ‘What else do you believe I have been talking to you about?’The emperor did not turn a hair. ‘And yet I have never heard you mention that name.’And Polo said: ‘Every time I describe a city I am saying something about Venice.” (Italo Calvino, Invisible Cities)
In the book “Learning from Las Vegas” Venturi illustrates his study on the perception of the contemporary city. A new car-oriented urban form had evolved in the post–World War. In the case of the contem-porary North American city, the observer tended to see the city from a moving car at heightened speed. The image of the city that results is a Cinematic vision of the urban space. What would be the image of a city without cars?The answer to this question could be found in Venice.This city is an island, it was constucted on an agglomeration of small islands, surrounded by lagoon. The main transportation system was boat, conversely, nowadays it is more common to walk. Some wa-terways naturally existed, other were dug for navigation, as a result, buldingsandalleyshadtofitinsmallspaces.InVenice,thetypicalstreetsectionreflectsthenatureofanislandcrossed by canals: Canalgrande,whichisthemainarterialstreetiswide55m,40mofthis width consists in the canal and the side boat parking.Atthesideofit,therearethesidewalkswicharerespectively5mwideand10mwide.Historically Canalgrande was Venice’s showcase, all the buildings
facing this canal had a decorated facade, the other facades of the buildings were and are simpler.Venice waterways organization is highly hierarchical, but is not clear-lyrecognizableatfirstsight.UsuallyCanalgrande,thewidercanal,can be reached through secondary canals, while smallest canals flowintosecondarycanals.Eventhetrafficisdividedaccordinglytocanals width: Canalgrande can be navigated by ferryboats, power-boats and rowboats. Conversely powerboats and rowboats can sail in secondary canals and only rowboats can navigate the smallest canals. As owning a boat became unaffordable, Venetian sidewalks have been gradually more used, that is the perfect place to watch the busy pace of everyday life. Tourists and residents walk along the sidewalks and they are often an obstacle one to the other.
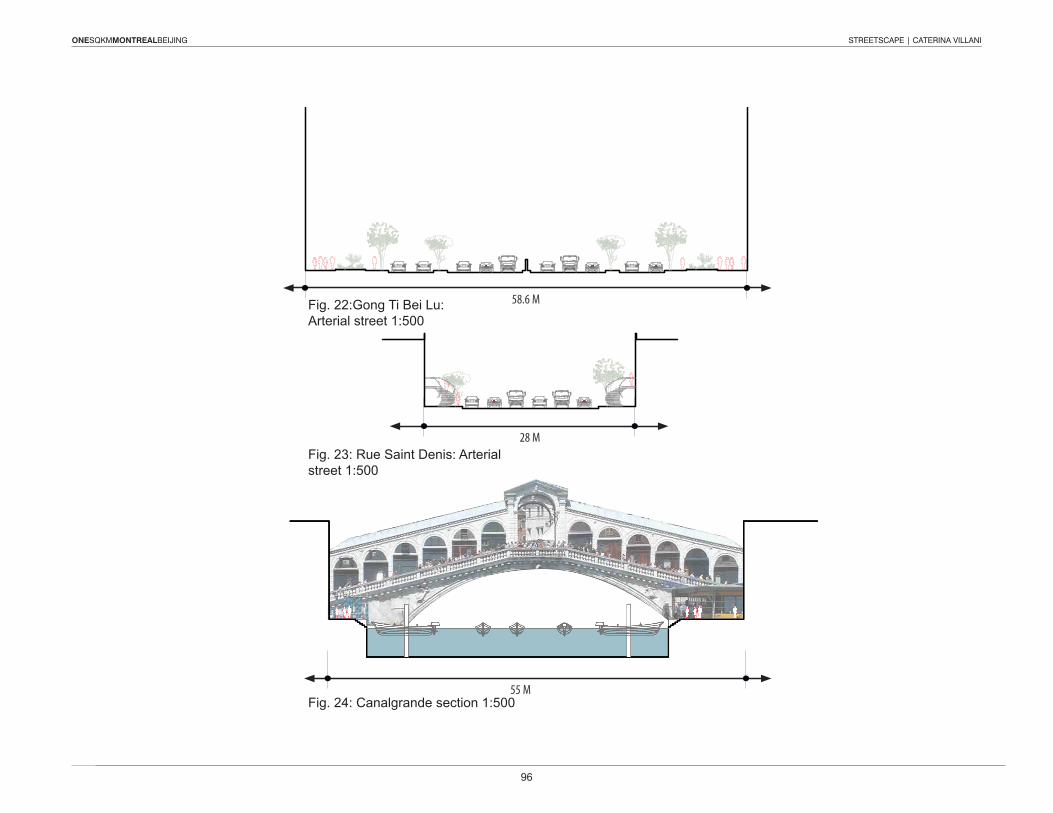
ONESQKMMONTREALBEIJING STREETSCAPE | CATERINA VILLANI
96
ONESQKMMONTREALBEIJING STREETSCAPE | CATERINA VILLANI
Observations
Lastcentury’surbanismhasbeenproven inefficient toresolve thecomplex interrelation between cities and personal social relations.Urban planners have been striving over the last two decades, as the debate on sustainable cities increased in popularity and as the situ-ation worsened with population growth and the rapid sprawl of cities, tofindgoodstrategiestoimprovethelivabilityofanyneighborhood,whether in a city, suburb or village.Knowing the negative effects of isolated living in both cities and in suburbs, the proposed examples of streetsections, although being very different one from the other, could lead to forms of urbanity that optimize social capital of residents, so that citizens can depend on their neighbors and their community.Some positive aspects of Montreal’s streetscape are the connection between façade and street and the façade pattern, while in Venice can be interesting to highlight the semplicity of the lack of fences or obstacles in the streetscape.The quality of walkability and mixed-land use offered by the typi-cal Beijing neighbourhood could be a precendent for new develop-ments, moreover the application of the hierarchical chinese street gridsystemcouldsolveboththetrafficcongestionproblemsandthedivision between pedestrian and non-pedestrian areas.This not only enables the optimization of land use and infrastructure, but also gives the opportunity of social interactions in neighbour-hoods. These principles are the base for the idea of “fused grid”, which pro-pose that street pattern turns neighbourhoods into fully connected pedestrian areas while linking neighbourhoods with roads. Making neighbourhoods car-free increases tranquility and safety, and thus encourages walking and space for recreation. On another level, this permits a mixed-use occupancy in neighbourhoods.
ONESQKMMONTREALBEIJING YOUR TOPIC | YOUR NAME
Fig.24:Canalgrandesection1:50055 M
Fig. 22:Gong Ti Bei Lu: Arterialstreet1:500
58.6 M
Fig. 23: Rue Saint Denis: Arterial street1:500
28 M
ONESQKMMONTREALBEIJING STREETSCAPE | CATERINA VILLANI
97
ONESQKMMONTREALBEIJING STREETSCAPE | CATERINA VILLANI
Observations
Lastcentury’surbanismhasbeenproven inefficient toresolve thecomplex interrelation between cities and personal social relations.Urban planners have been striving over the last two decades, as the debate on sustainable cities increased in popularity and as the situ-ation worsened with population growth and the rapid sprawl of cities, tofindgoodstrategiestoimprovethelivabilityofanyneighborhood,whether in a city, suburb or village.Knowing the negative effects of isolated living in both cities and in suburbs, the proposed examples of streetsections, although being very different one from the other, could lead to forms of urbanity that optimize social capital of residents, so that citizens can depend on their neighbors and their community.Some positive aspects of Montreal’s streetscape are the connection between façade and street and the façade pattern, while in Venice can be interesting to highlight the semplicity of the lack of fences or obstacles in the streetscape.The quality of walkability and mixed-land use offered by the typi-cal Beijing neighbourhood could be a precendent for new develop-ments, moreover the application of the hierarchical chinese street gridsystemcouldsolveboththetrafficcongestionproblemsandthedivision between pedestrian and non-pedestrian areas.This not only enables the optimization of land use and infrastructure, but also gives the opportunity of social interactions in neighbour-hoods. These principles are the base for the idea of “fused grid”, which pro-pose that street pattern turns neighbourhoods into fully connected pedestrian areas while linking neighbourhoods with roads. Making neighbourhoods car-free increases tranquility and safety, and thus encourages walking and space for recreation. On another level, this permits a mixed-use occupancy in neighbourhoods.
ONESQKMMONTREALBEIJING STREETSCAPE | CATERINA VILLANI
98
ONESQKMMONTREALBEIJING STREETSCAPE | CATERINA VILLANI
Bibliography
Robert Venturi and Denise Scott Brown: Learning from Las Vegas. Abingdon:Routledge,2007.
Jacobs, Jane. The Death and Life of Great American Cities. Har-mondsworth:PenguinBooks/JonathanCape,1977.
Lynch, Kevin. The Image of the City. Cambridge, MA: MIT Press, 1960.
Calvino, Italo. Invisible Cities. New York: Harcourt Brace Jovanovich, 1974.
Reeman, Mohammed Rehan, Sustainable streetscape as an effective tool in sustainable urban design, HBRC Journal, Volume 9, Issue 2, August2013

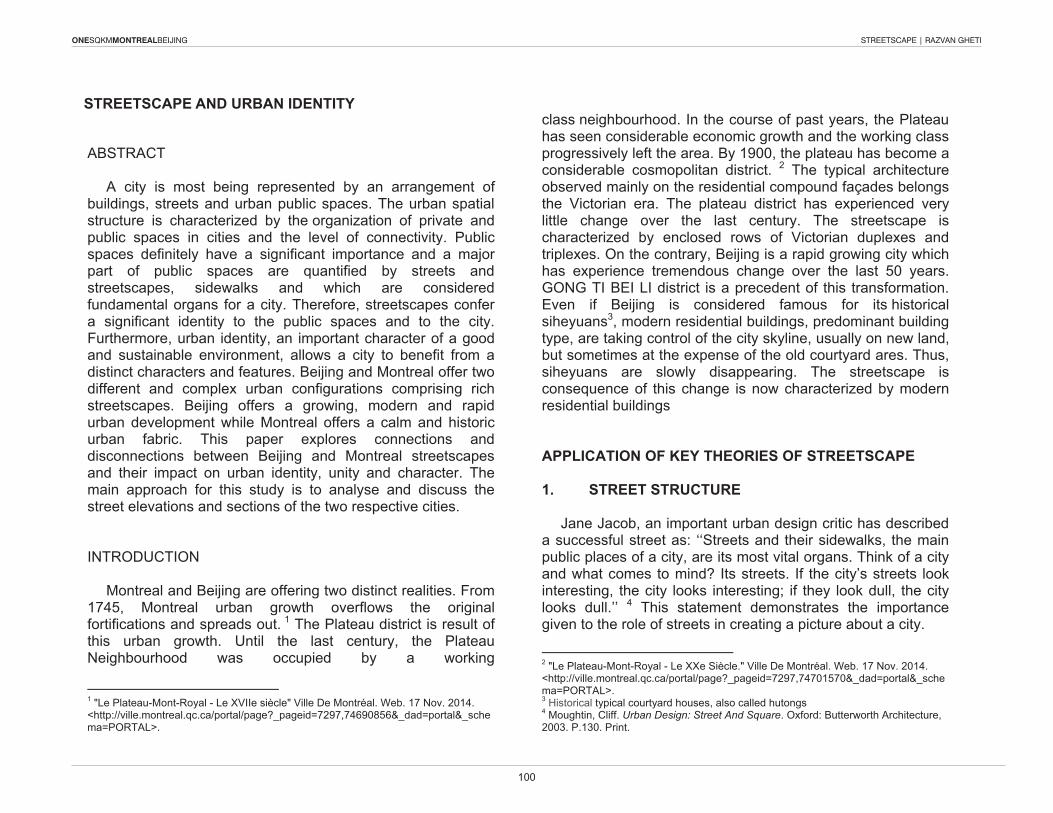
ONESQKMMONTREALBEIJING STREETSCAPE | RAZVAN GHETI
100
ARCH 521 STREETSCAPE AND URBAN IDENTITY | RAZVAN GHETI
STREETSCAPE AND URBAN IDENTITY
ABSTRACT
A city is most being represented by an arrangement of buildings, streets and urban public spaces. The urban spatial structure is characterized by the organization of private and public spaces in cities and the level of connectivity. Public spaces definitely have a significant importance and a major part of public spaces are quantified by streets and streetscapes, sidewalks and which are considered fundamental organs for a city. Therefore, streetscapes confer a significant identity to the public spaces and to the city. Furthermore, urban identity, an important character of a good and sustainable environment, allows a city to benefit from a distinct characters and features. Beijing and Montreal offer two different and complex urban configurations comprising rich streetscapes. Beijing offers a growing, modern and rapid urban development while Montreal offers a calm and historic urban fabric. This paper explores connections and disconnections between Beijing and Montreal streetscapes and their impact on urban identity, unity and character. The main approach for this study is to analyse and discuss the street elevations and sections of the two respective cities.
INTRODUCTION
Montreal and Beijing are offering two distinct realities. From 1745, Montreal urban growth overflows the original fortifications and spreads out. 1 The Plateau district is result of this urban growth. Until the last century, the Plateau Neighbourhood was occupied by a working
1 "Le Plateau-Mont-Royal - Le XVIIe siècle" Ville De Montréal. Web. 17 Nov. 2014. <http://ville.montreal.qc.ca/portal/page?_pageid=7297,74690856&_dad=portal&_schema=PORTAL>.
class neighbourhood. In the course of past years, the Plateau has seen considerable economic growth and the working class progressively left the area. By 1900, the plateau has become a considerable cosmopolitan district. 2 The typical architecture observed mainly on the residential compound façades belongs the Victorian era. The plateau district has experienced very little change over the last century. The streetscape is characterized by enclosed rows of Victorian duplexes and triplexes. On the contrary, Beijing is a rapid growing city which has experience tremendous change over the last 50 years. GONG TI BEI LI district is a precedent of this transformation. Even if Beijing is considered famous for its historical siheyuans3, modern residential buildings, predominant building type, are taking control of the city skyline, usually on new land, but sometimes at the expense of the old courtyard ares. Thus, siheyuans are slowly disappearing. The streetscape is consequence of this change is now characterized by modern residential buildings
APPLICATION OF KEY THEORIES OF STREETSCAPE
1. STREET STRUCTURE
Jane Jacob, an important urban design critic has described a successful street as: ‘‘Streets and their sidewalks, the main public places of a city, are its most vital organs. Think of a city and what comes to mind? Its streets. If the city’s streets look interesting, the city looks interesting; if they look dull, the city looks dull.’’ 4 This statement demonstrates the importance given to the role of streets in creating a picture about a city.
2 "Le Plateau-Mont-Royal - Le XXe Siècle." Ville De Montréal. Web. 17 Nov. 2014. <http://ville.montreal.qc.ca/portal/page?_pageid=7297,74701570&_dad=portal&_schema=PORTAL>. 3 Historical typical courtyard houses, also called hutongs 4 Moughtin, Cliff. Urban Design: Street And Square. Oxford: Butterworth Architecture, 2003. P.130. Print.
ARCH 521 STREETSCAPE AND URBAN IDENTITY | RAZVAN GHETI
Fig. 1: BEIJING ARTERIAL ROAD - GONG TI BEI LU
Fig. 3: BEIJING SECONDARY ROAD - CHUN XIU LU
Fig. 2: MONTREAL (PLATEAU) ARTHERIAL ROAD - SAINT-DENIS
Fig. 4: MONTREAL (PLATEAU) SECONDARY ROAD - BERRI
Fig. 5: BEIJING LOCAL ROAD - XIN ZHONG JIE Fig. 6: MONTREAL (PLATEAU) LOCAL ROAD - DE CHATEAUBRIAND
VEHICULAR LANES
PUBLIC FRONTAGE
PRIVATE FRONTAGE
LEGEND
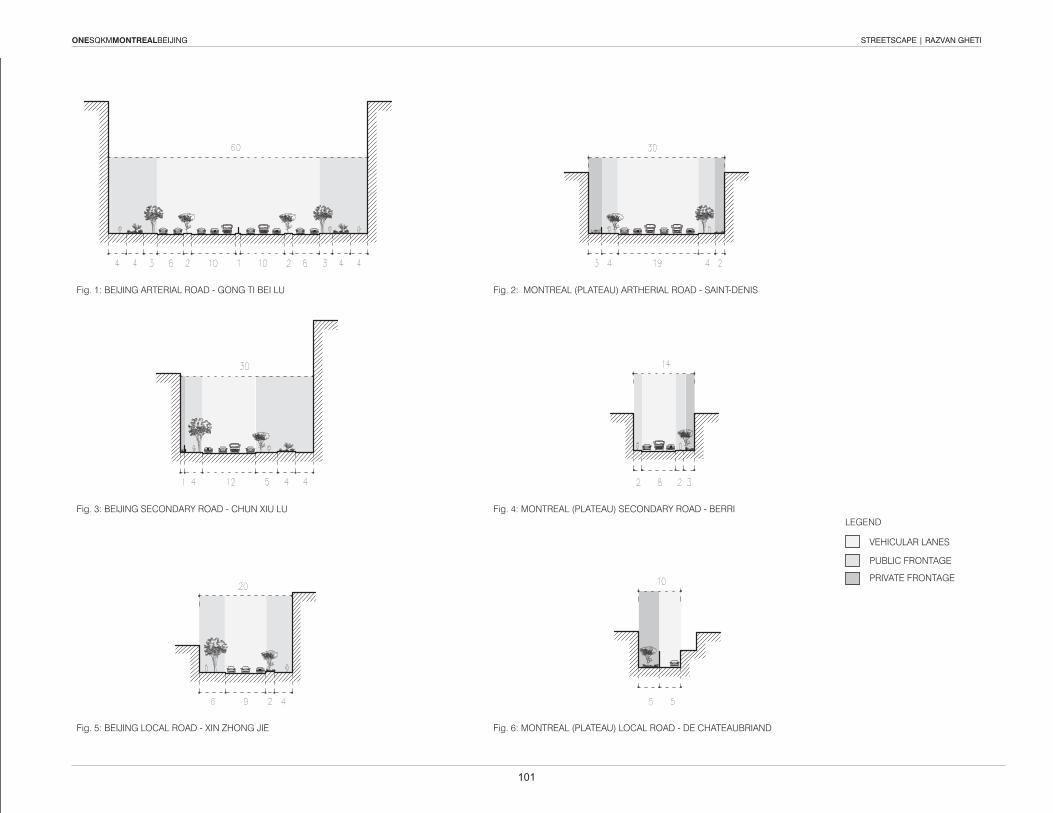
ONESQKMMONTREALBEIJING STREETSCAPE | RAZVAN GHETI
101
ARCH 521 STREETSCAPE AND URBAN IDENTITY | RAZVAN GHETI
STREETSCAPE AND URBAN IDENTITY
ABSTRACT
A city is most being represented by an arrangement of buildings, streets and urban public spaces. The urban spatial structure is characterized by the organization of private and public spaces in cities and the level of connectivity. Public spaces definitely have a significant importance and a major part of public spaces are quantified by streets and streetscapes, sidewalks and which are considered fundamental organs for a city. Therefore, streetscapes confer a significant identity to the public spaces and to the city. Furthermore, urban identity, an important character of a good and sustainable environment, allows a city to benefit from a distinct characters and features. Beijing and Montreal offer two different and complex urban configurations comprising rich streetscapes. Beijing offers a growing, modern and rapid urban development while Montreal offers a calm and historic urban fabric. This paper explores connections and disconnections between Beijing and Montreal streetscapes and their impact on urban identity, unity and character. The main approach for this study is to analyse and discuss the street elevations and sections of the two respective cities.
INTRODUCTION
Montreal and Beijing are offering two distinct realities. From 1745, Montreal urban growth overflows the original fortifications and spreads out. 1 The Plateau district is result of this urban growth. Until the last century, the Plateau Neighbourhood was occupied by a working
1 "Le Plateau-Mont-Royal - Le XVIIe siècle" Ville De Montréal. Web. 17 Nov. 2014. <http://ville.montreal.qc.ca/portal/page?_pageid=7297,74690856&_dad=portal&_schema=PORTAL>.
class neighbourhood. In the course of past years, the Plateau has seen considerable economic growth and the working class progressively left the area. By 1900, the plateau has become a considerable cosmopolitan district. 2 The typical architecture observed mainly on the residential compound façades belongs the Victorian era. The plateau district has experienced very little change over the last century. The streetscape is characterized by enclosed rows of Victorian duplexes and triplexes. On the contrary, Beijing is a rapid growing city which has experience tremendous change over the last 50 years. GONG TI BEI LI district is a precedent of this transformation. Even if Beijing is considered famous for its historical siheyuans3, modern residential buildings, predominant building type, are taking control of the city skyline, usually on new land, but sometimes at the expense of the old courtyard ares. Thus, siheyuans are slowly disappearing. The streetscape is consequence of this change is now characterized by modern residential buildings
APPLICATION OF KEY THEORIES OF STREETSCAPE
1. STREET STRUCTURE
Jane Jacob, an important urban design critic has described a successful street as: ‘‘Streets and their sidewalks, the main public places of a city, are its most vital organs. Think of a city and what comes to mind? Its streets. If the city’s streets look interesting, the city looks interesting; if they look dull, the city looks dull.’’ 4 This statement demonstrates the importance given to the role of streets in creating a picture about a city.
2 "Le Plateau-Mont-Royal - Le XXe Siècle." Ville De Montréal. Web. 17 Nov. 2014. <http://ville.montreal.qc.ca/portal/page?_pageid=7297,74701570&_dad=portal&_schema=PORTAL>. 3 Historical typical courtyard houses, also called hutongs 4 Moughtin, Cliff. Urban Design: Street And Square. Oxford: Butterworth Architecture, 2003. P.130. Print.
ARCH 521 STREETSCAPE AND URBAN IDENTITY | RAZVAN GHETI
Fig. 1: BEIJING ARTERIAL ROAD - GONG TI BEI LU
Fig. 3: BEIJING SECONDARY ROAD - CHUN XIU LU
Fig. 2: MONTREAL (PLATEAU) ARTHERIAL ROAD - SAINT-DENIS
Fig. 4: MONTREAL (PLATEAU) SECONDARY ROAD - BERRI
Fig. 5: BEIJING LOCAL ROAD - XIN ZHONG JIE Fig. 6: MONTREAL (PLATEAU) LOCAL ROAD - DE CHATEAUBRIAND
VEHICULAR LANES
PUBLIC FRONTAGE
PRIVATE FRONTAGE
LEGEND
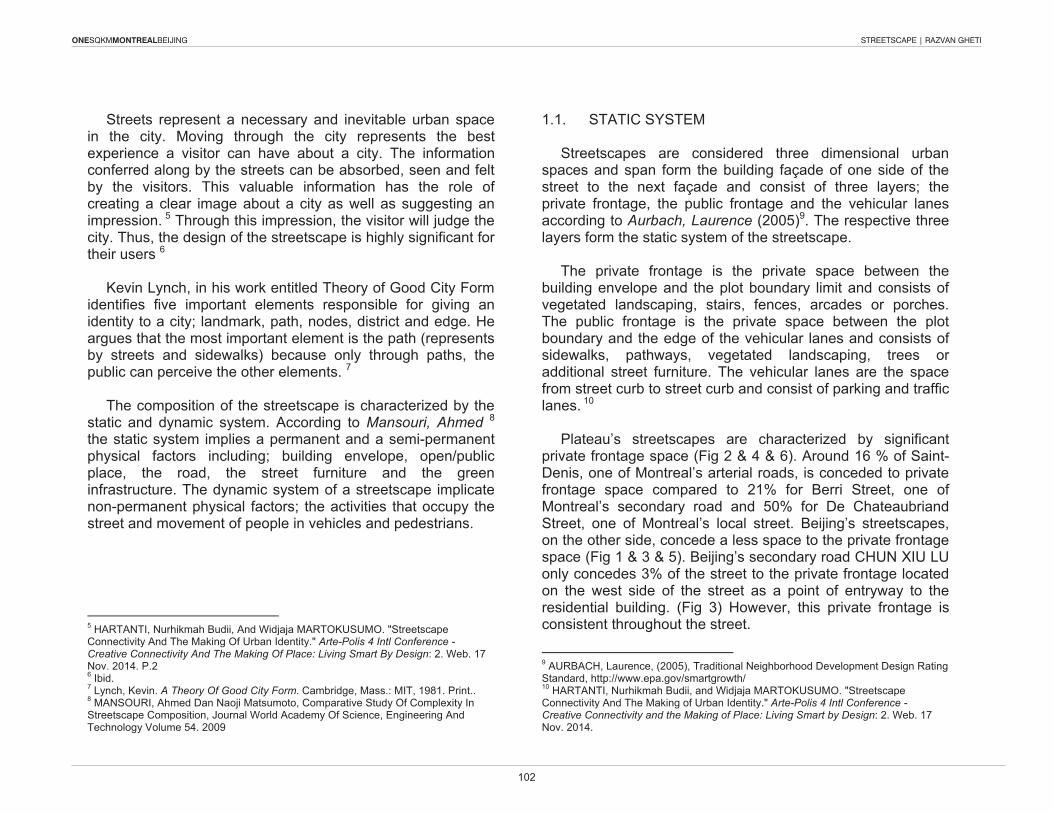
ONESQKMMONTREALBEIJING STREETSCAPE | RAZVAN GHETI
102
ARCH 521 STREETSCAPE AND URBAN IDENTITY | RAZVAN GHETI
Streets represent a necessary and inevitable urban space in the city. Moving through the city represents the best experience a visitor can have about a city. The information conferred along by the streets can be absorbed, seen and felt by the visitors. This valuable information has the role of creating a clear image about a city as well as suggesting an impression. 5 Through this impression, the visitor will judge the city. Thus, the design of the streetscape is highly significant for their users 6
Kevin Lynch, in his work entitled Theory of Good City Form identifies five important elements responsible for giving an identity to a city; landmark, path, nodes, district and edge. He argues that the most important element is the path (represents by streets and sidewalks) because only through paths, the public can perceive the other elements. 7
The composition of the streetscape is characterized by the static and dynamic system. According to Mansouri, Ahmed 8
the static system implies a permanent and a semi-permanent physical factors including; building envelope, open/public place, the road, the street furniture and the green infrastructure. The dynamic system of a streetscape implicate non-permanent physical factors; the activities that occupy the street and movement of people in vehicles and pedestrians.
5 HARTANTI, Nurhikmah Budii, And Widjaja MARTOKUSUMO. "Streetscape Connectivity And The Making Of Urban Identity." Arte-Polis 4 Intl Conference - Creative Connectivity And The Making Of Place: Living Smart By Design: 2. Web. 17 Nov. 2014. P.2 6 Ibid. 7 Lynch, Kevin. A Theory Of Good City Form. Cambridge, Mass.: MIT, 1981. Print.. 8 MANSOURI, Ahmed Dan Naoji Matsumoto, Comparative Study Of Complexity In Streetscape Composition, Journal World Academy Of Science, Engineering And Technology Volume 54. 2009
1.1. STATIC SYSTEM
Streetscapes are considered three dimensional urban spaces and span form the building façade of one side of the street to the next façade and consist of three layers; the private frontage, the public frontage and the vehicular lanes according to Aurbach, Laurence (2005)9. The respective three layers form the static system of the streetscape.
The private frontage is the private space between the building envelope and the plot boundary limit and consists of vegetated landscaping, stairs, fences, arcades or porches. The public frontage is the private space between the plot boundary and the edge of the vehicular lanes and consists of sidewalks, pathways, vegetated landscaping, trees or additional street furniture. The vehicular lanes are the space from street curb to street curb and consist of parking and traffic lanes. 10
Plateau’s streetscapes are characterized by significant private frontage space (Fig 2 & 4 & 6). Around 16 % of Saint-Denis, one of Montreal’s arterial roads, is conceded to private frontage space compared to 21% for Berri Street, one of Montreal’s secondary road and 50% for De Chateaubriand Street, one of Montreal’s local street. Beijing’s streetscapes, on the other side, concede a less space to the private frontage space (Fig 1 & 3 & 5). Beijing’s secondary road CHUN XIU LU only concedes 3% of the street to the private frontage located on the west side of the street as a point of entryway to the residential building. (Fig 3) However, this private frontage is consistent throughout the street.
9 AURBACH, Laurence, (2005), Traditional Neighborhood Development Design Rating Standard, http://www.epa.gov/smartgrowth/ 10 HARTANTI, Nurhikmah Budii, and Widjaja MARTOKUSUMO. "Streetscape Connectivity And The Making of Urban Identity." Arte-Polis 4 Intl Conference - Creative Connectivity and the Making of Place: Living Smart by Design: 2. Web. 17 Nov. 2014.
ARCH 521 STREETSCAPE AND URBAN IDENTITY | RAZVAN GHETI
When it comes to public frontage, GONG TI BEI LI11
streetscapes are characterized by generous public frontage space (Fig. 1 & 3 & 5). CHUN XIU LU Street concedes 56% of the street to sidewalks, vegetated landscaping, trees and street furniture. (Fig. 3) compared to 60 % for XIN ZHONG JIE, one of Beijing’s local road and 36% for GONG TI BEI LU, one of Beijing’s arterial road. Montreal’s streetscapes allow less space to the public frontage space. Saint-Denis- concedes 26% of the street to public frontage compared to 28% for Berri Street and no space for De Chateaubriand Street.
In most cases, the vehicular lanes acquire around 50% of the entire street space. This affirmation is confirmed by all the figures expect Fig 1, representing GONG TI BEI LU, arterial road, which acquires 61%, slightly more due to the complexity of the vehicular lanes system represented by two main roads of three lanes and two service roads serving as parking and transition.
The ratio of height of building facades to width of street is important for a good street design.12 Also, a wide street encourages traffic and discourages interaction and it is unsuitable for retail and shopping. 13 For example, the sense of space enclosure is lost in the case of Saint-Denis Street and GONG TI BEI LU, respective arterial roads , which represented in section, are wide street with two-level to five-level buildings. However, the trees help to soften this ratio and to relieve monotony throughout the street.
11 Beijing studied district 12 Moughtin, Cliff. Urban Design: Street and Square. Oxford: Butterworth Architecture, 2003. Print. P. 141 13 Ibid
On the reverse, the sense of space enclosure and completeness can be better felt in the case of CHUN XIU LU, which adopts the same width as Saint-Denis Street, where the building facades are higher and can reach five floors on the west side and eight floors on the east side. A narrow pedestrianized street with continuous enclosing facades higher than street width is more successful as walkable environments as well as being more attractive places for interaction. Narrow streets also facilitate interaction as the movement from side to side of the street is obstructed 14
1.2. DYNAMIC SYSTEM
The principal objective of streets is to link buildings and cities via vehicular and pedestrian lanes. Streets facilitate the flow of vehicles, the flow of pedestrians and occasionally the transportation of commercial goods and objects. 15 The street is also an important urban space promoting interaction between people. As such, street adopts an expressive function in becoming a space for conversation, recreation, and entertainment16 known as the dynamic system of a streetscape.
Street activity is encouraged when pedestrians find the opportunity to use the street in a variety of ways. A lively and livable street needs to adopt a proper balance between privacy, defensible space, access for the car and safe pedestrian sidewalks. In Beijing and Montreal, the arterial streets function as the vehicular networks within a neighbourhood area. It is important to notice that in both cities, considerable amount of place reserved for diverse pedestrian 14 Moughtin, Cliff. Urban Design: Street and Square. Oxford: Butterworth Architecture, 2003. Print. P. 141 15 Moughtin, Cliff. Urban Design: Street and Square. Oxford: Butterworth Architecture, 2003. Print. P. 129. 16 Ibid
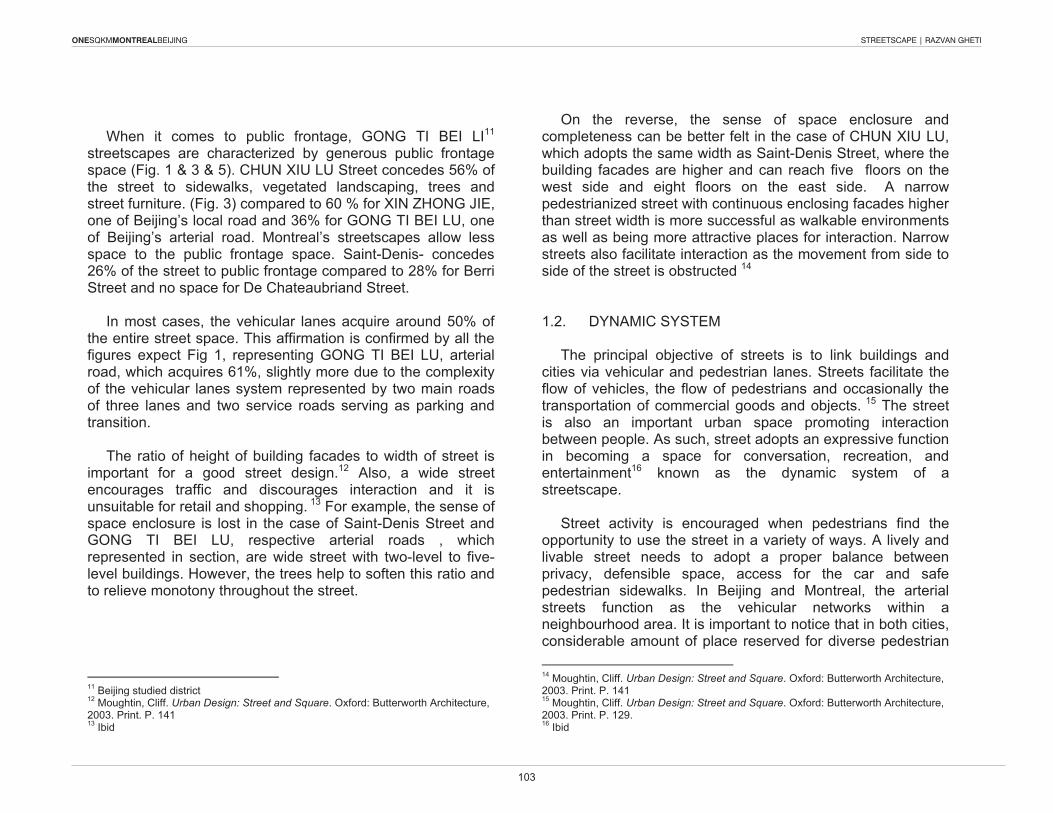
ONESQKMMONTREALBEIJING STREETSCAPE | RAZVAN GHETI
103
ARCH 521 STREETSCAPE AND URBAN IDENTITY | RAZVAN GHETI
Streets represent a necessary and inevitable urban space in the city. Moving through the city represents the best experience a visitor can have about a city. The information conferred along by the streets can be absorbed, seen and felt by the visitors. This valuable information has the role of creating a clear image about a city as well as suggesting an impression. 5 Through this impression, the visitor will judge the city. Thus, the design of the streetscape is highly significant for their users 6
Kevin Lynch, in his work entitled Theory of Good City Form identifies five important elements responsible for giving an identity to a city; landmark, path, nodes, district and edge. He argues that the most important element is the path (represents by streets and sidewalks) because only through paths, the public can perceive the other elements. 7
The composition of the streetscape is characterized by the static and dynamic system. According to Mansouri, Ahmed 8
the static system implies a permanent and a semi-permanent physical factors including; building envelope, open/public place, the road, the street furniture and the green infrastructure. The dynamic system of a streetscape implicate non-permanent physical factors; the activities that occupy the street and movement of people in vehicles and pedestrians.
5 HARTANTI, Nurhikmah Budii, And Widjaja MARTOKUSUMO. "Streetscape Connectivity And The Making Of Urban Identity." Arte-Polis 4 Intl Conference - Creative Connectivity And The Making Of Place: Living Smart By Design: 2. Web. 17 Nov. 2014. P.2 6 Ibid. 7 Lynch, Kevin. A Theory Of Good City Form. Cambridge, Mass.: MIT, 1981. Print.. 8 MANSOURI, Ahmed Dan Naoji Matsumoto, Comparative Study Of Complexity In Streetscape Composition, Journal World Academy Of Science, Engineering And Technology Volume 54. 2009
1.1. STATIC SYSTEM
Streetscapes are considered three dimensional urban spaces and span form the building façade of one side of the street to the next façade and consist of three layers; the private frontage, the public frontage and the vehicular lanes according to Aurbach, Laurence (2005)9. The respective three layers form the static system of the streetscape.
The private frontage is the private space between the building envelope and the plot boundary limit and consists of vegetated landscaping, stairs, fences, arcades or porches. The public frontage is the private space between the plot boundary and the edge of the vehicular lanes and consists of sidewalks, pathways, vegetated landscaping, trees or additional street furniture. The vehicular lanes are the space from street curb to street curb and consist of parking and traffic lanes. 10
Plateau’s streetscapes are characterized by significant private frontage space (Fig 2 & 4 & 6). Around 16 % of Saint-Denis, one of Montreal’s arterial roads, is conceded to private frontage space compared to 21% for Berri Street, one of Montreal’s secondary road and 50% for De Chateaubriand Street, one of Montreal’s local street. Beijing’s streetscapes, on the other side, concede a less space to the private frontage space (Fig 1 & 3 & 5). Beijing’s secondary road CHUN XIU LU only concedes 3% of the street to the private frontage located on the west side of the street as a point of entryway to the residential building. (Fig 3) However, this private frontage is consistent throughout the street.
9 AURBACH, Laurence, (2005), Traditional Neighborhood Development Design Rating Standard, http://www.epa.gov/smartgrowth/ 10 HARTANTI, Nurhikmah Budii, and Widjaja MARTOKUSUMO. "Streetscape Connectivity And The Making of Urban Identity." Arte-Polis 4 Intl Conference - Creative Connectivity and the Making of Place: Living Smart by Design: 2. Web. 17 Nov. 2014.
ARCH 521 STREETSCAPE AND URBAN IDENTITY | RAZVAN GHETI
When it comes to public frontage, GONG TI BEI LI11
streetscapes are characterized by generous public frontage space (Fig. 1 & 3 & 5). CHUN XIU LU Street concedes 56% of the street to sidewalks, vegetated landscaping, trees and street furniture. (Fig. 3) compared to 60 % for XIN ZHONG JIE, one of Beijing’s local road and 36% for GONG TI BEI LU, one of Beijing’s arterial road. Montreal’s streetscapes allow less space to the public frontage space. Saint-Denis- concedes 26% of the street to public frontage compared to 28% for Berri Street and no space for De Chateaubriand Street.
In most cases, the vehicular lanes acquire around 50% of the entire street space. This affirmation is confirmed by all the figures expect Fig 1, representing GONG TI BEI LU, arterial road, which acquires 61%, slightly more due to the complexity of the vehicular lanes system represented by two main roads of three lanes and two service roads serving as parking and transition.
The ratio of height of building facades to width of street is important for a good street design.12 Also, a wide street encourages traffic and discourages interaction and it is unsuitable for retail and shopping. 13 For example, the sense of space enclosure is lost in the case of Saint-Denis Street and GONG TI BEI LU, respective arterial roads , which represented in section, are wide street with two-level to five-level buildings. However, the trees help to soften this ratio and to relieve monotony throughout the street.
11 Beijing studied district 12 Moughtin, Cliff. Urban Design: Street and Square. Oxford: Butterworth Architecture, 2003. Print. P. 141 13 Ibid
On the reverse, the sense of space enclosure and completeness can be better felt in the case of CHUN XIU LU, which adopts the same width as Saint-Denis Street, where the building facades are higher and can reach five floors on the west side and eight floors on the east side. A narrow pedestrianized street with continuous enclosing facades higher than street width is more successful as walkable environments as well as being more attractive places for interaction. Narrow streets also facilitate interaction as the movement from side to side of the street is obstructed 14
1.2. DYNAMIC SYSTEM
The principal objective of streets is to link buildings and cities via vehicular and pedestrian lanes. Streets facilitate the flow of vehicles, the flow of pedestrians and occasionally the transportation of commercial goods and objects. 15 The street is also an important urban space promoting interaction between people. As such, street adopts an expressive function in becoming a space for conversation, recreation, and entertainment16 known as the dynamic system of a streetscape.
Street activity is encouraged when pedestrians find the opportunity to use the street in a variety of ways. A lively and livable street needs to adopt a proper balance between privacy, defensible space, access for the car and safe pedestrian sidewalks. In Beijing and Montreal, the arterial streets function as the vehicular networks within a neighbourhood area. It is important to notice that in both cities, considerable amount of place reserved for diverse pedestrian 14 Moughtin, Cliff. Urban Design: Street and Square. Oxford: Butterworth Architecture, 2003. Print. P. 141 15 Moughtin, Cliff. Urban Design: Street and Square. Oxford: Butterworth Architecture, 2003. Print. P. 129. 16 Ibid
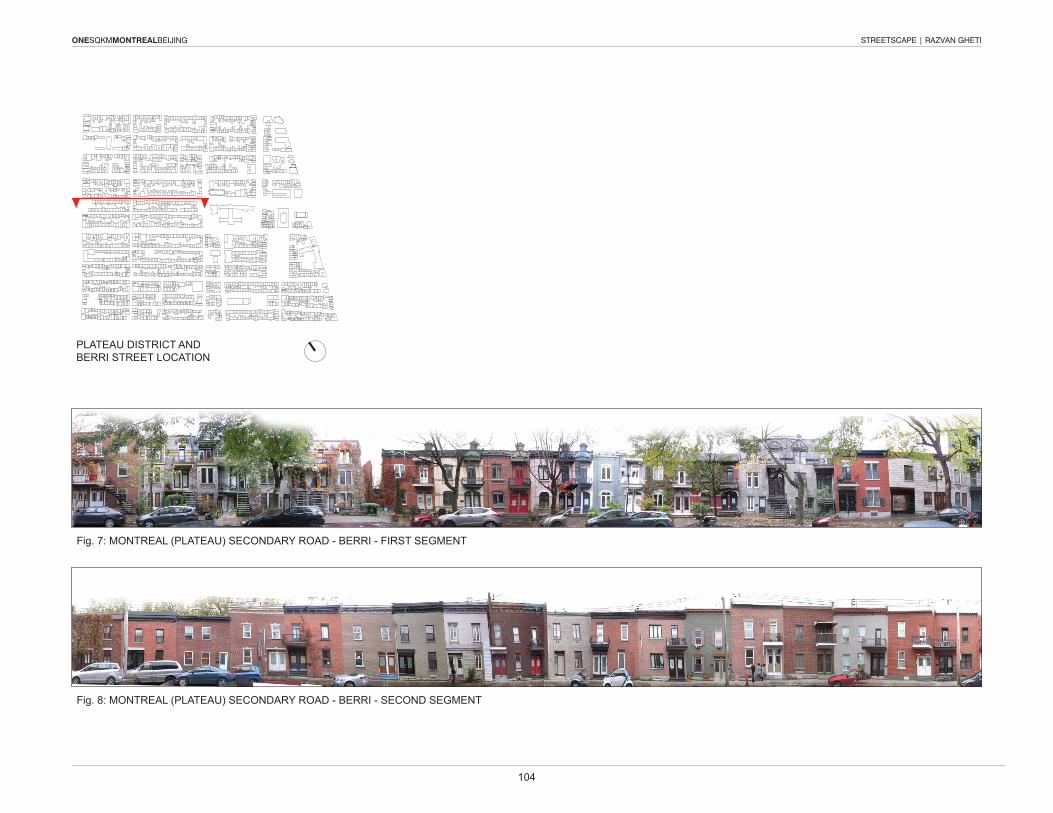
ONESQKMMONTREALBEIJING STREETSCAPE | RAZVAN GHETI
104
ARCH 521 STREETSCAPE AND URBAN IDENTITY | RAZVAN GHETI
Fig. 7: MONTREAL (PLATEAU) SECONDARY ROAD - BERRI - FIRST SEGMENT
Fig. 8: MONTREAL (PLATEAU) SECONDARY ROAD - BERRI - SECOND SEGMENT
60,1
54,2
58.3
PLATEAU DISTRICT AND BERRI STREET LOCATION
ARCH 521 STREETSCAPE AND URBAN IDENTITY | RAZVAN GHETI
Fig. 9: BEIJING SECONDARY ROAD - CHUN XIU LU - FIRST SEGMENT
Fig. 10: BEIJING SECONDARY ROAD - CHUN XIU LU - SECOND SEGMENT
60,1
54,2
58.3
GONG TI BEI LI DISTRICTCHUN XIU LU STREET LOCATION
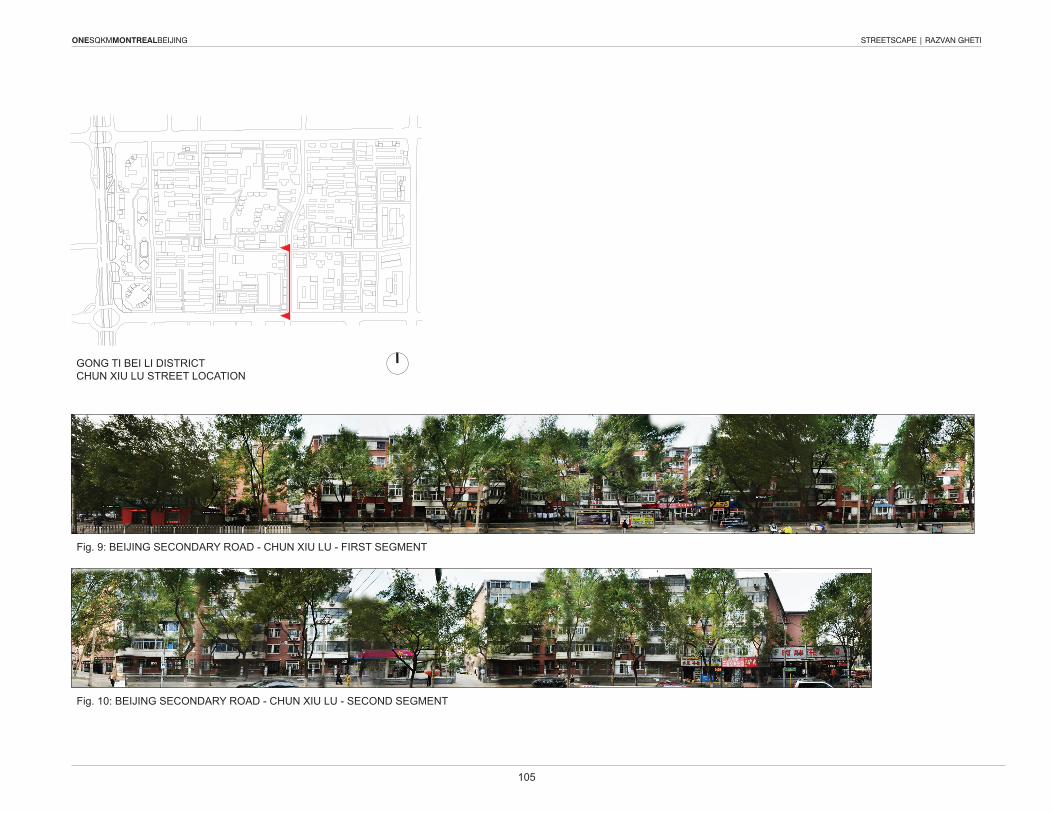
ONESQKMMONTREALBEIJING STREETSCAPE | RAZVAN GHETI
105
ARCH 521 STREETSCAPE AND URBAN IDENTITY | RAZVAN GHETI
Fig. 7: MONTREAL (PLATEAU) SECONDARY ROAD - BERRI - FIRST SEGMENT
Fig. 8: MONTREAL (PLATEAU) SECONDARY ROAD - BERRI - SECOND SEGMENT
60,1
54,2
58.3
PLATEAU DISTRICT AND BERRI STREET LOCATION
ARCH 521 STREETSCAPE AND URBAN IDENTITY | RAZVAN GHETI
Fig. 9: BEIJING SECONDARY ROAD - CHUN XIU LU - FIRST SEGMENT
Fig. 10: BEIJING SECONDARY ROAD - CHUN XIU LU - SECOND SEGMENT
60,1
54,2
58.3
GONG TI BEI LI DISTRICTCHUN XIU LU STREET LOCATION
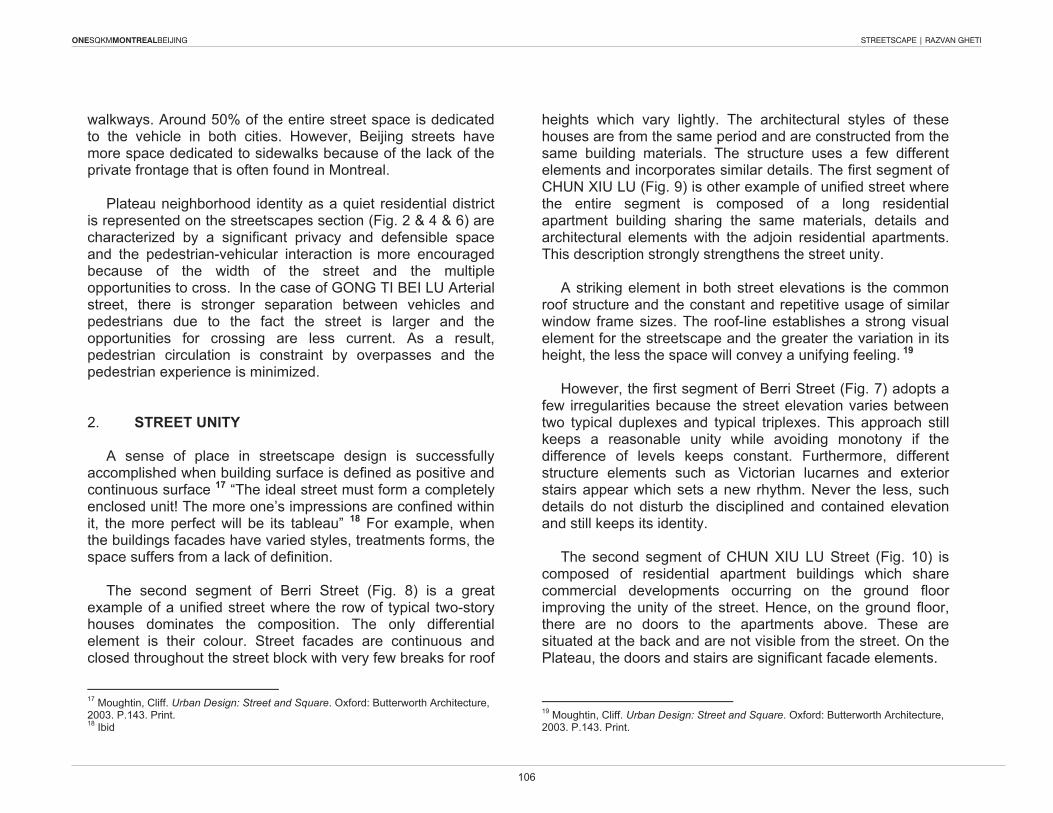
ONESQKMMONTREALBEIJING STREETSCAPE | RAZVAN GHETI
106
ARCH 521 STREETSCAPE AND URBAN IDENTITY | RAZVAN GHETI
walkways. Around 50% of the entire street space is dedicated to the vehicle in both cities. However, Beijing streets have more space dedicated to sidewalks because of the lack of the private frontage that is often found in Montreal.
Plateau neighborhood identity as a quiet residential district is represented on the streetscapes section (Fig. 2 & 4 & 6) are characterized by a significant privacy and defensible space and the pedestrian-vehicular interaction is more encouraged because of the width of the street and the multiple opportunities to cross. In the case of GONG TI BEI LU Arterial street, there is stronger separation between vehicles and pedestrians due to the fact the street is larger and the opportunities for crossing are less current. As a result, pedestrian circulation is constraint by overpasses and the pedestrian experience is minimized.
2. STREET UNITY
A sense of place in streetscape design is successfully accomplished when building surface is defined as positive and continuous surface 17 “The ideal street must form a completely enclosed unit! The more one’s impressions are confined within it, the more perfect will be its tableau” 18 For example, when the buildings facades have varied styles, treatments forms, the space suffers from a lack of definition.
The second segment of Berri Street (Fig. 8) is a great example of a unified street where the row of typical two-story houses dominates the composition. The only differential element is their colour. Street facades are continuous and closed throughout the street block with very few breaks for roof
17 Moughtin, Cliff. Urban Design: Street and Square. Oxford: Butterworth Architecture, 2003. P.143. Print. 18 Ibid
heights which vary lightly. The architectural styles of these houses are from the same period and are constructed from the same building materials. The structure uses a few different elements and incorporates similar details. The first segment of CHUN XIU LU (Fig. 9) is other example of unified street where the entire segment is composed of a long residential apartment building sharing the same materials, details and architectural elements with the adjoin residential apartments. This description strongly strengthens the street unity.
A striking element in both street elevations is the common roof structure and the constant and repetitive usage of similar window frame sizes. The roof-line establishes a strong visual element for the streetscape and the greater the variation in its height, the less the space will convey a unifying feeling. 19
However, the first segment of Berri Street (Fig. 7) adopts a few irregularities because the street elevation varies between two typical duplexes and typical triplexes. This approach still keeps a reasonable unity while avoiding monotony if the difference of levels keeps constant. Furthermore, different structure elements such as Victorian lucarnes and exterior stairs appear which sets a new rhythm. Never the less, such details do not disturb the disciplined and contained elevation and still keeps its identity.
The second segment of CHUN XIU LU Street (Fig. 10) is composed of residential apartment buildings which share commercial developments occurring on the ground floor improving the unity of the street. Hence, on the ground floor, there are no doors to the apartments above. These are situated at the back and are not visible from the street. On the Plateau, the doors and stairs are significant facade elements.
19 Moughtin, Cliff. Urban Design: Street and Square. Oxford: Butterworth Architecture, 2003. P.143. Print.
ARCH 521 STREETSCAPE AND URBAN IDENTITY | RAZVAN GHETI
HOSPITAL
GREEN SPACE
RESTAURANT
RETAIL
OFFICE/ COMMER.
OFFICE
RESIDENTIAL
OTHER
Fig. 11: BERRI STREET - SECOND SEGMENT Fig. 13: XIN ZHONG JIE STREET
Fig. 12: XIN ZHONG JIE STREET ELEVATION OUTLINE
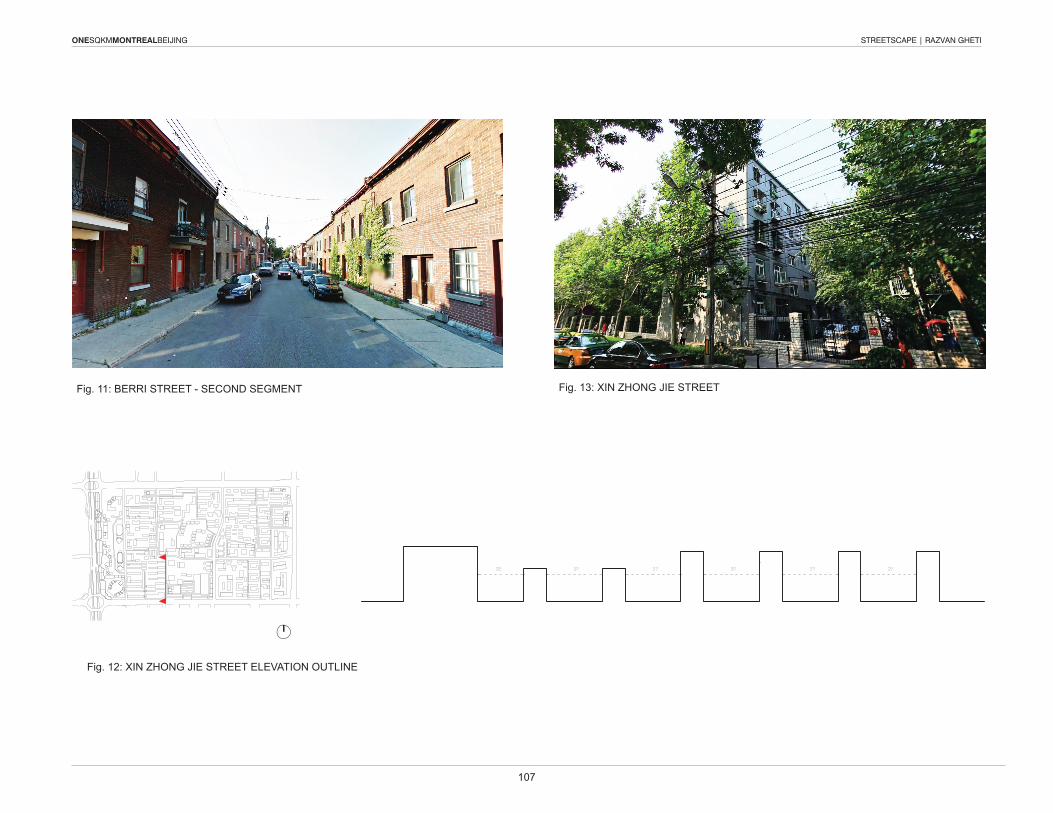
ONESQKMMONTREALBEIJING STREETSCAPE | RAZVAN GHETI
107
ARCH 521 STREETSCAPE AND URBAN IDENTITY | RAZVAN GHETI
walkways. Around 50% of the entire street space is dedicated to the vehicle in both cities. However, Beijing streets have more space dedicated to sidewalks because of the lack of the private frontage that is often found in Montreal.
Plateau neighborhood identity as a quiet residential district is represented on the streetscapes section (Fig. 2 & 4 & 6) are characterized by a significant privacy and defensible space and the pedestrian-vehicular interaction is more encouraged because of the width of the street and the multiple opportunities to cross. In the case of GONG TI BEI LU Arterial street, there is stronger separation between vehicles and pedestrians due to the fact the street is larger and the opportunities for crossing are less current. As a result, pedestrian circulation is constraint by overpasses and the pedestrian experience is minimized.
2. STREET UNITY
A sense of place in streetscape design is successfully accomplished when building surface is defined as positive and continuous surface 17 “The ideal street must form a completely enclosed unit! The more one’s impressions are confined within it, the more perfect will be its tableau” 18 For example, when the buildings facades have varied styles, treatments forms, the space suffers from a lack of definition.
The second segment of Berri Street (Fig. 8) is a great example of a unified street where the row of typical two-story houses dominates the composition. The only differential element is their colour. Street facades are continuous and closed throughout the street block with very few breaks for roof
17 Moughtin, Cliff. Urban Design: Street and Square. Oxford: Butterworth Architecture, 2003. P.143. Print. 18 Ibid
heights which vary lightly. The architectural styles of these houses are from the same period and are constructed from the same building materials. The structure uses a few different elements and incorporates similar details. The first segment of CHUN XIU LU (Fig. 9) is other example of unified street where the entire segment is composed of a long residential apartment building sharing the same materials, details and architectural elements with the adjoin residential apartments. This description strongly strengthens the street unity.
A striking element in both street elevations is the common roof structure and the constant and repetitive usage of similar window frame sizes. The roof-line establishes a strong visual element for the streetscape and the greater the variation in its height, the less the space will convey a unifying feeling. 19
However, the first segment of Berri Street (Fig. 7) adopts a few irregularities because the street elevation varies between two typical duplexes and typical triplexes. This approach still keeps a reasonable unity while avoiding monotony if the difference of levels keeps constant. Furthermore, different structure elements such as Victorian lucarnes and exterior stairs appear which sets a new rhythm. Never the less, such details do not disturb the disciplined and contained elevation and still keeps its identity.
The second segment of CHUN XIU LU Street (Fig. 10) is composed of residential apartment buildings which share commercial developments occurring on the ground floor improving the unity of the street. Hence, on the ground floor, there are no doors to the apartments above. These are situated at the back and are not visible from the street. On the Plateau, the doors and stairs are significant facade elements.
19 Moughtin, Cliff. Urban Design: Street and Square. Oxford: Butterworth Architecture, 2003. P.143. Print.
ARCH 521 STREETSCAPE AND URBAN IDENTITY | RAZVAN GHETI
HOSPITAL
GREEN SPACE
RESTAURANT
RETAIL
OFFICE/ COMMER.
OFFICE
RESIDENTIAL
OTHER
Fig. 11: BERRI STREET - SECOND SEGMENT Fig. 13: XIN ZHONG JIE STREET
Fig. 12: XIN ZHONG JIE STREET ELEVATION OUTLINE
ONESQKMMONTREALBEIJING STREETSCAPE | RAZVAN GHETI
108
ARCH 521 STREETSCAPE AND URBAN IDENTITY | RAZVAN GHETI
The Plateau district benefits from a rare quality where the building facades on both sides of the street facing each other are related essentially as reflections in a mirror. (Fig. 11) Thus, this strategy conveys additional rigour and discipline to the streetscape enhancing its identity. In this particular case, additional emphasis is put on the complete street scenery rather than individual buildings. Therefore, the street gives higher significance to the city’s identity than individual display.
On the contrary, XIN ZHONG JIE Street presents a peculiar condition as a result of sun light access regulations (Fig. 12); the north street elevation is very open and non-continuous. Approximately 27 meters of open free space separates the buildings. This elevation facade has a considerable impact on the unity of the street; buildings appear as separated masses rather than as a continuous surface. The pedestrian experience scene is dominated by building masses and the visual sequence is disrupted. (Fig. 13).
CONCLUSION
Streets represent a necessary and inevitable urban space in the city and are major influencing elements of urban identity. Moving through the city‘s streets represents the best experience a visitor can have about a city and has an important role in shaping a city’s identity. The visual composition defined through the notions of static and dynamic system displays the distinct character of each city and their contribution to the place identity. Beijing identity as a significant traffic-oriented city is obviously shown on the streetscapes sections which are characterized by large arterial and secondary streets. Alternatively, Montreal Plateau identity is characterised by a more confined, less traffic oriented and more residential oriented district. In comparison with Beijing, the Plateau offers a more human scale neighborhood; buildings are usually constraint by three stories and the
vehicular lanes are restrained. Streetscape unity refers notably to the visual connectivity and continuity of the street elevation formed by physical building along a side of the streets. Montreal street elevations are often closed as a result of the block arrangement and attached row duplexes or triplexes. This condition enhances the visual experience and improves the urban character. In contrast, Beijing street elevation offer two conditions; the south / north street elevations are often closed and visually connected and the west / east elevations are very open as a consequence of the building master planning according to sunlight regulation. Ultimately, these aspects have a substantial contribution in creating urban identity.

about WALKABILITYlina SAFRIOUI tara HAGAN
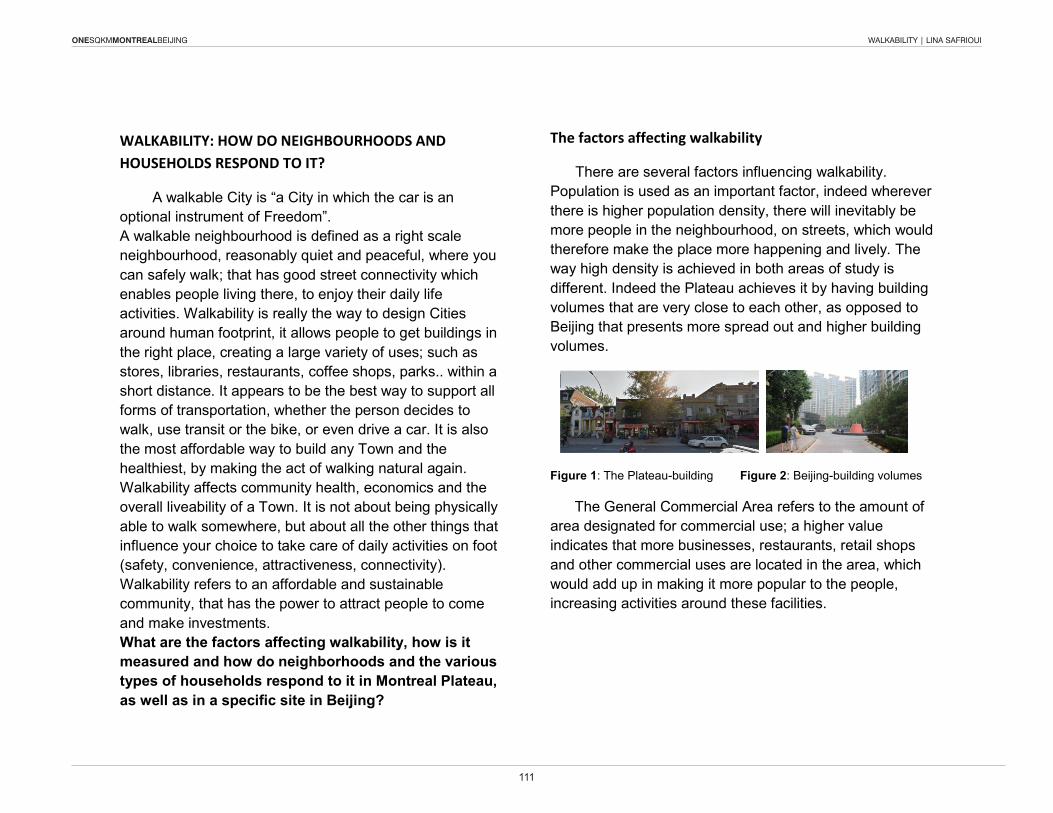
ONESQKMMONTREALBEIJING WALKABILITY | LINA SAFRIOUI
111
1
WALKABILITY: HOW DO NEIGHBOURHOODS AND HOUSEHOLDS RESPOND TO IT?
A walkable City is “a City in which the car is an optional instrument of Freedom”. A walkable neighbourhood is defined as a right scale neighbourhood, reasonably quiet and peaceful, where you can safely walk; that has good street connectivity which enables people living there, to enjoy their daily life activities. walkability is really the way to design Cities around human footprint, it allows people to get buildings in the right place, creating a large variety of uses; such as stores, libraries, restaurants, coffee shops, parks.. within a short distance. It appears to be the best way to support all forms of transportation, whether the person decides to walk, use transit or the bike, or even drive a car. It is also the most affordable way to build any Town and the healthiest, by making the act of walking natural again. walkability affects community health, economics and the overall liveability of a Town. It is not about being physically able to walk somewhere, but about all the other things that influence your choice to take care of daily activities on foot (safety, convenience, attractiveness, connectivity). walkability refers to an affordable and sustainable community, that has the power to attract people to come and make investments. What are the factors affecting walkability, how is it measured and how do neighborhoods and the various types of households respond to it in Montreal Plateau, as well as in a specific site in Beijing?
The factors affecting walkability
There are several factors influencing walkability. Population is used as an important factor, indeed wherever there is higher population density, there will inevitably be more people in the neighbourhood, on streets, which would therefore make the place more happening and lively. The way high density is achieved in both areas of study is different. Indeed the Plateau achieves it by having building volumes that are very close to each other, as opposed to Beijing that presents more spread out and higher building volumes.
Figure 1: The Plateau-building Figure 2: Beijing-building volumes
The General Commercial Area refers to the amount of area designated for commercial use; a higher value indicates that more businesses, restaurants, retail shops and other commercial uses are located in the area, which would add up in making it more popular to the people, increasing activities around these facilities.
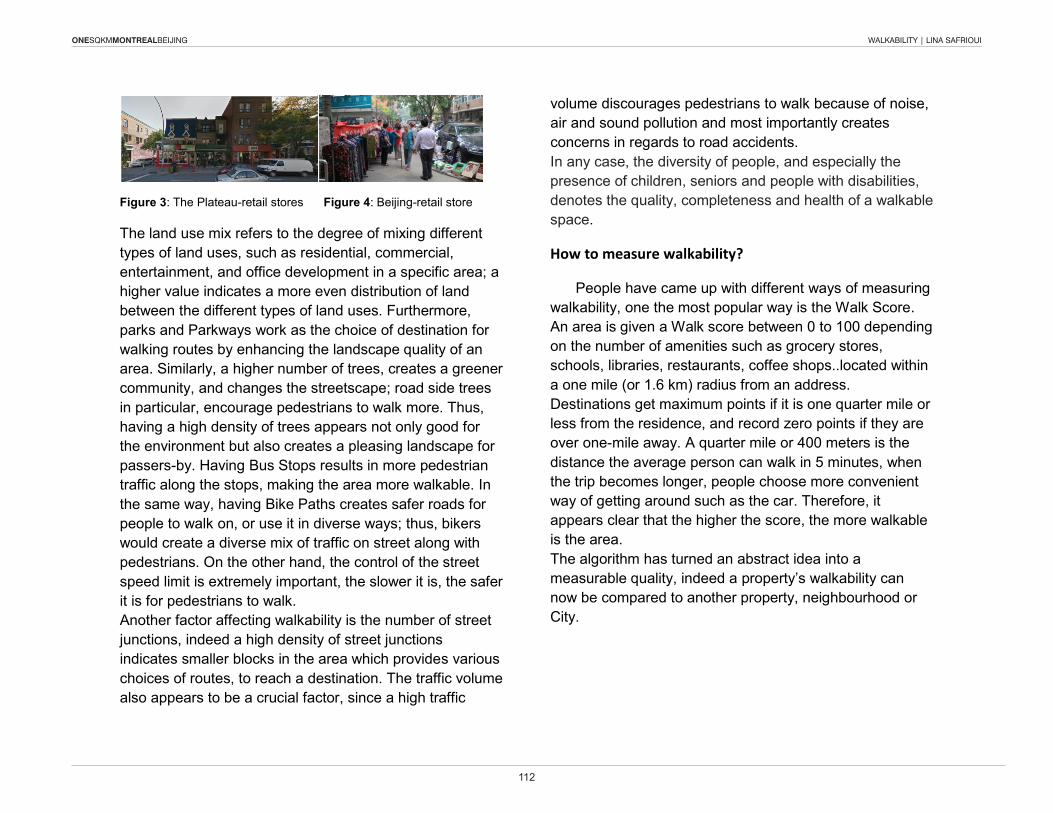
ONESQKMMONTREALBEIJING WALKABILITY | LINA SAFRIOUI
112
2
Figure 3: The Plateau-retail stores Figure 4: Beijing-retail store
The land use mix refers to the degree of mixing different types of land uses, such as residential, commercial, entertainment, and office development in a specific area; a higher value indicates a more even distribution of land between the different types of land uses. Furthermore, parks and Parkways work as the choice of destination for walking routes by enhancing the landscape quality of an area. Similarly, a higher number of trees, creates a greener community, and changes the streetscape; road side trees in particular, encourage pedestrians to walk more. Thus, having a high density of trees appears not only good for the environment but also creates a pleasing landscape for passers-by. Having Bus Stops results in more pedestrian traffic along the stops, making the area more walkable. In the same way, having Bike Paths creates safer roads for people to walk on, or use it in diverse ways; thus, bikers would create a diverse mix of traffic on street along with pedestrians. On the other hand, the control of the street speed limit is extremely important, the slower it is, the safer it is for pedestrians to walk. Another factor affecting walkability is the number of street junctions, indeed a high density of street junctions indicates smaller blocks in the area which provides various choices of routes, to reach a destination. The traffic volume also appears to be a crucial factor, since a high traffic
volume discourages pedestrians to walk because of noise, air and sound pollution and most importantly creates concerns in regards to road accidents. In any case, the diversity of people, and especially the presence of children, seniors and people with disabilities, denotes the quality, completeness and health of a walkable space.
How to measure walkability?
People have came up with different ways of measuring walkability, one the most popular way is the walk Score. An area is given a walk score between 0 to 100 depending on the number of amenities such as grocery stores, schools, libraries, restaurants, coffee shops..located within a one mile (or 1.6 km) radius from an address. Destinations get maximum points if it is one quarter mile or less from the residence, and record zero points if they are over one-mile away. A quarter mile or 400 meters is the distance the average person can walk in 5 minutes, when the trip becomes longer, people choose more convenient way of getting around such as the car. Therefore, it appears clear that the higher the score, the more walkable is the area. The algorithm has turned an abstract idea into a measurable quality, indeed a property’s walkability can now be compared to another property, neighbourhood or City.
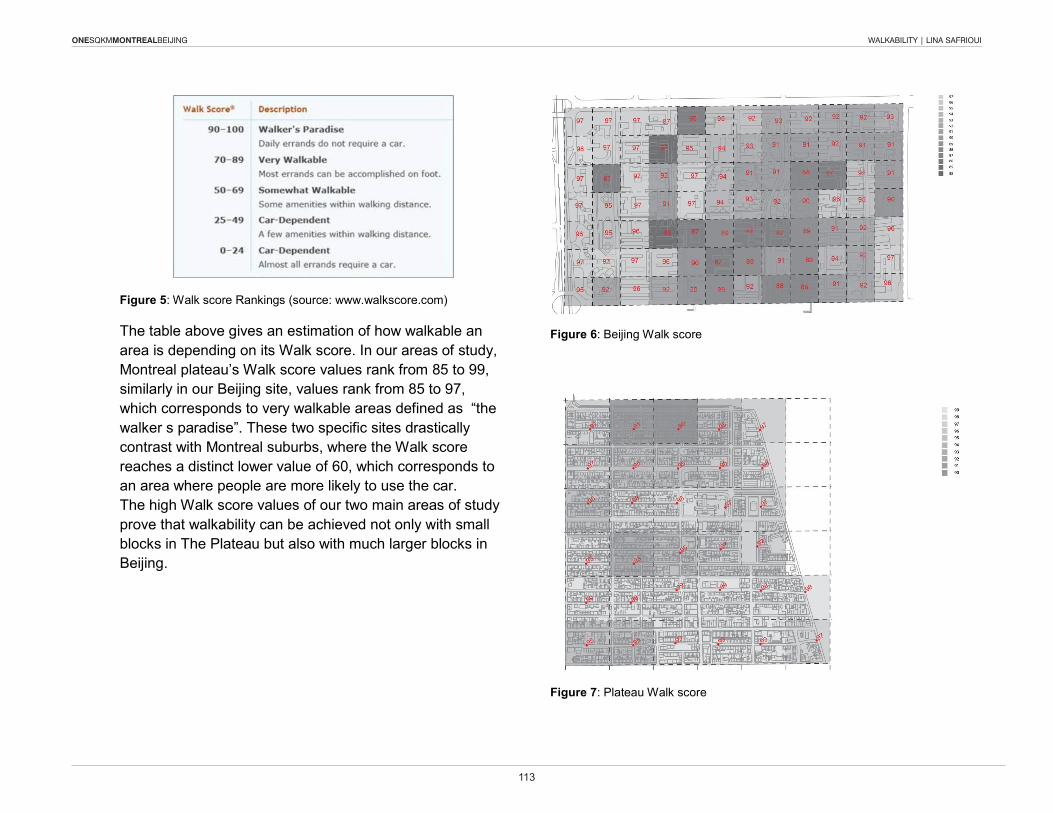
ONESQKMMONTREALBEIJING WALKABILITY | LINA SAFRIOUI
113
3
Figure 5: walk score Rankings (source: www.walkscore.com)
The table above gives an estimation of how walkable an area is depending on its walk score. In our areas of study, Montreal plateau’s walk score values rank from 85 to 99, similarly in our Beijing site, values rank from 85 to 97, which corresponds to very walkable areas defined as “the walker s paradise”. These two specific sites drastically contrast with Montreal suburbs, where the walk score reaches a distinct lower value of 60, which corresponds to an area where people are more likely to use the car. The high walk score values of our two main areas of study prove that walkability can be achieved not only with small blocks in The Plateau but also with much larger blocks in Beijing.
Figure 6: Beijing walk score
Figure 7: Plateau walk score
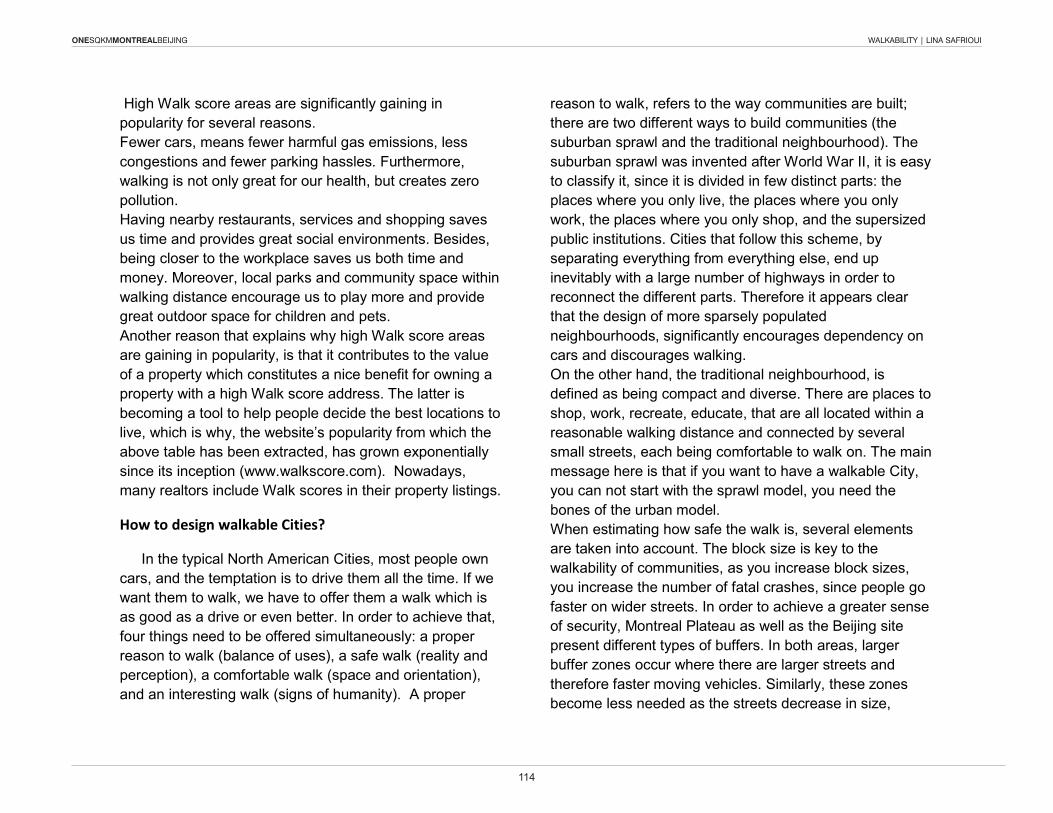
ONESQKMMONTREALBEIJING WALKABILITY | LINA SAFRIOUI
114
4
High walk score areas are significantly gaining in popularity for several reasons. Fewer cars, means fewer harmful gas emissions, less congestions and fewer parking hassles. Furthermore, walking is not only great for our health, but creates zero pollution. Having nearby restaurants, services and shopping saves us time and provides great social environments. Besides, being closer to the workplace saves us both time and money. Moreover, local parks and community space within walking distance encourage us to play more and provide great outdoor space for children and pets. Another reason that explains why high walk score areas are gaining in popularity, is that it contributes to the value of a property which constitutes a nice benefit for owning a property with a high walk score address. The latter is becoming a tool to help people decide the best locations to live, which is why, the website’s popularity from which the above table has been extracted, has grown exponentially since its inception (www.walkscore.com). Nowadays, many realtors include walk scores in their property listings.
How to design walkable Cities?
In the typical North American Cities, most people own cars, and the temptation is to drive them all the time. If we want them to walk, we have to offer them a walk which is as good as a drive or even better. In order to achieve that, four things need to be offered simultaneously: a proper reason to walk (balance of uses), a safe walk (reality and perception), a comfortable walk (space and orientation), and an interesting walk (signs of humanity). A proper
reason to walk, refers to the way communities are built; there are two different ways to build communities (the suburban sprawl and the traditional neighbourhood). The suburban sprawl was invented after world war II, it is easy to classify it, since it is divided in few distinct parts: the places where you only live, the places where you only work, the places where you only shop, and the supersized public institutions. Cities that follow this scheme, by separating everything from everything else, end up inevitably with a large number of highways in order to reconnect the different parts. Therefore it appears clear that the design of more sparsely populated neighbourhoods, significantly encourages dependency on cars and discourages walking. On the other hand, the traditional neighbourhood, is defined as being compact and diverse. There are places to shop, work, recreate, educate, that are all located within a reasonable walking distance and connected by several small streets, each being comfortable to walk on. The main message here is that if you want to have a walkable City, you can not start with the sprawl model, you need the bones of the urban model. when estimating how safe the walk is, several elements are taken into account. The block size is key to the walkability of communities, as you increase block sizes, you increase the number of fatal crashes, since people go faster on wider streets. In order to achieve a greater sense of security, Montreal Plateau as well as the Beijing site present different types of buffers. In both areas, larger buffer zones occur where there are larger streets and therefore faster moving vehicles. Similarly, these zones become less needed as the streets decrease in size,
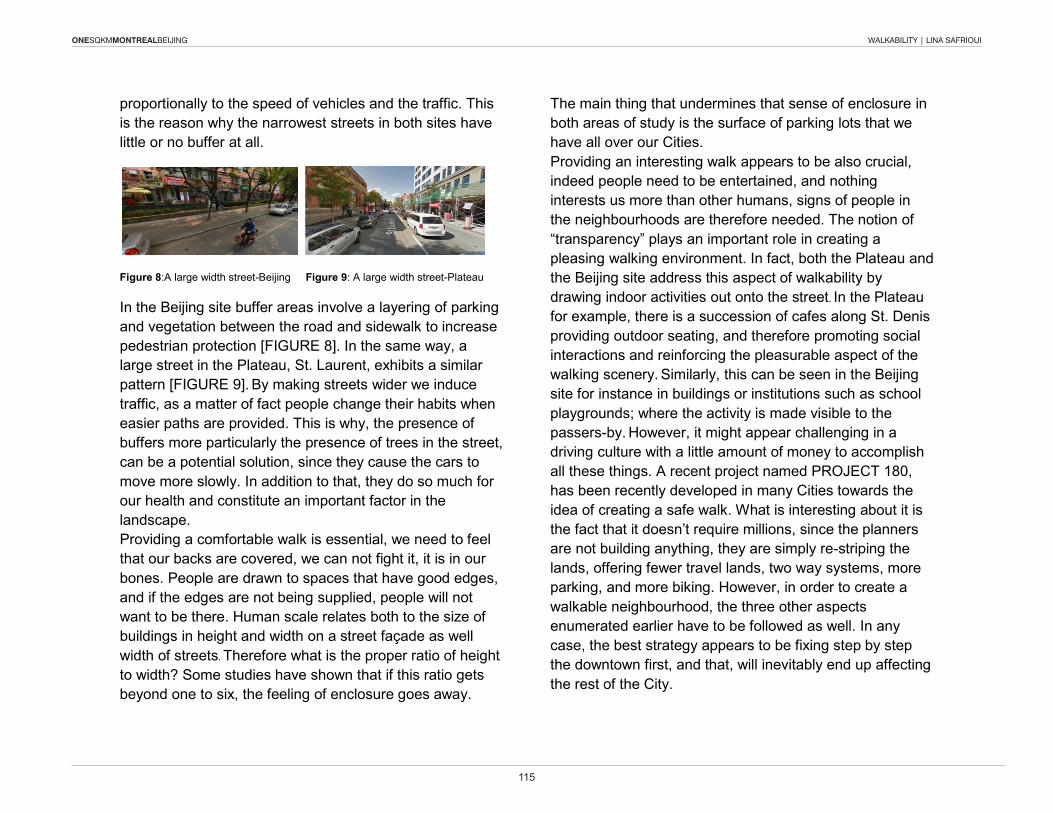
ONESQKMMONTREALBEIJING WALKABILITY | LINA SAFRIOUI
115
5
proportionally to the speed of vehicles and the traffic. This is the reason why the narrowest streets in both sites have little or no buffer at all.
Figure 8:A large width street-Beijing Figure 9: A large width street-Plateau
In the Beijing site buffer areas involve a layering of parking and vegetation between the road and sidewalk to increase pedestrian protection [FIGURE 8]. In the same way, a large street in the Plateau, St. Laurent, exhibits a similar pattern [FIGURE 9]. By making streets wider we induce traffic, as a matter of fact people change their habits when easier paths are provided. This is why, the presence of buffers more particularly the presence of trees in the street, can be a potential solution, since they cause the cars to move more slowly. In addition to that, they do so much for our health and constitute an important factor in the landscape. Providing a comfortable walk is essential, we need to feel that our backs are covered, we can not fight it, it is in our bones. People are drawn to spaces that have good edges, and if the edges are not being supplied, people will not want to be there. Human scale relates both to the size of buildings in height and width on a street façade as well width of streets. Therefore what is the proper ratio of height to width? Some studies have shown that if this ratio gets beyond one to six, the feeling of enclosure goes away.
The main thing that undermines that sense of enclosure in both areas of study is the surface of parking lots that we have all over our Cities. Providing an interesting walk appears to be also crucial, indeed people need to be entertained, and nothing interests us more than other humans, signs of people in the neighbourhoods are therefore needed. The notion of “transparency” plays an important role in creating a pleasing walking environment. In fact, both the Plateau and the Beijing site address this aspect of walkability by drawing indoor activities out onto the street. In the Plateau for example, there is a succession of cafes along St. Denis providing outdoor seating, and therefore promoting social interactions and reinforcing the pleasurable aspect of the walking scenery. Similarly, this can be seen in the Beijing site for instance in buildings or institutions such as school playgrounds; where the activity is made visible to the passers-by. However, it might appear challenging in a driving culture with a little amount of money to accomplish all these things. A recent project named PROJECT 180, has been recently developed in many Cities towards the idea of creating a safe walk. what is interesting about it is the fact that it doesn’t require millions, since the planners are not building anything, they are simply re-striping the lands, offering fewer travel lands, two way systems, more parking, and more biking. However, in order to create a walkable neighbourhood, the three other aspects enumerated earlier have to be followed as well. In any case, the best strategy appears to be fixing step by step the downtown first, and that, will inevitably end up affecting the rest of the City.
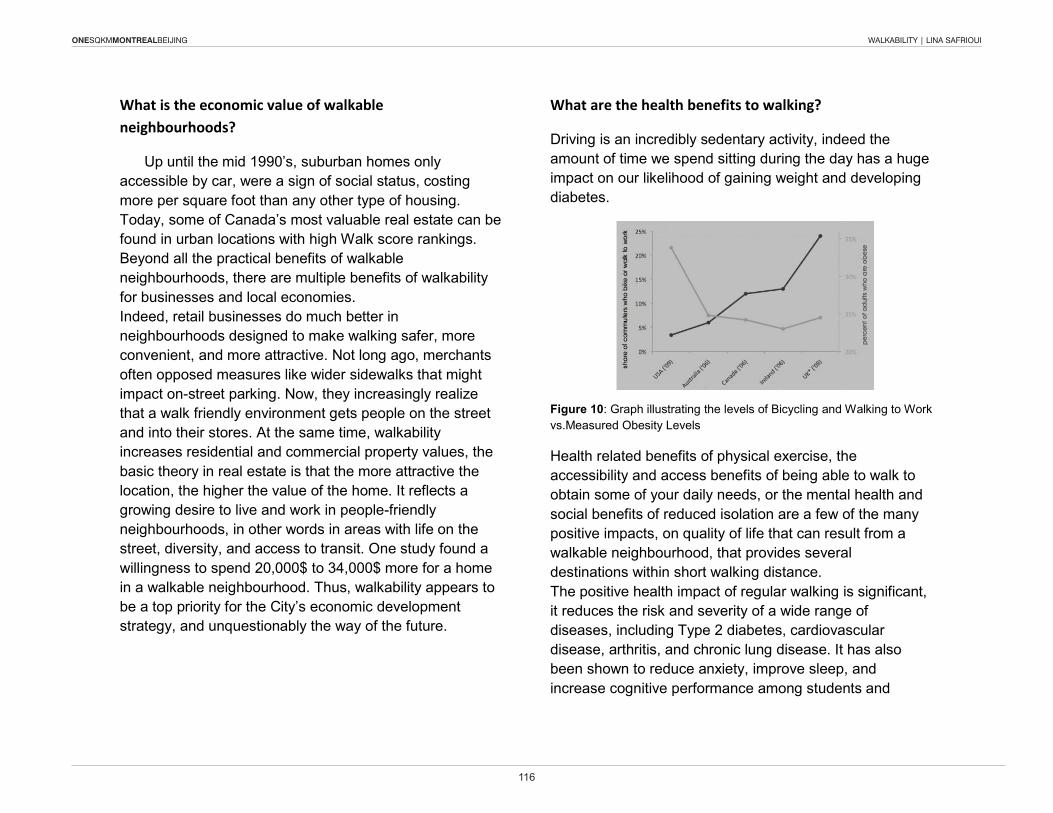
ONESQKMMONTREALBEIJING WALKABILITY | LINA SAFRIOUI
116
6
What is the economic value of walkable neighbourhoods?
Up until the mid 1990’s, suburban homes only accessible by car, were a sign of social status, costing more per square foot than any other type of housing. Today, some of Canada’s most valuable real estate can be found in urban locations with high walk score rankings. Beyond all the practical benefits of walkable neighbourhoods, there are multiple benefits of walkability for businesses and local economies. Indeed, retail businesses do much better in neighbourhoods designed to make walking safer, more convenient, and more attractive. Not long ago, merchants often opposed measures like wider sidewalks that might impact on-street parking. Now, they increasingly realize that a walk friendly environment gets people on the street and into their stores. At the same time, walkability increases residential and commercial property values, the basic theory in real estate is that the more attractive the location, the higher the value of the home. It reflects a growing desire to live and work in people-friendly neighbourhoods, in other words in areas with life on the street, diversity, and access to transit. One study found a willingness to spend 20,000$ to 34,000$ more for a home in a walkable neighbourhood. Thus, walkability appears to be a top priority for the City’s economic development strategy, and unquestionably the way of the future.
What are the health benefits to walking?
Driving is an incredibly sedentary activity, indeed the amount of time we spend sitting during the day has a huge impact on our likelihood of gaining weight and developing diabetes.
Figure 10: Graph illustrating the levels of Bicycling and walking to work vs.Measured Obesity Levels
Health related benefits of physical exercise, the accessibility and access benefits of being able to walk to obtain some of your daily needs, or the mental health and social benefits of reduced isolation are a few of the many positive impacts, on quality of life that can result from a walkable neighbourhood, that provides several destinations within short walking distance. The positive health impact of regular walking is significant, it reduces the risk and severity of a wide range of diseases, including Type 2 diabetes, cardiovascular disease, arthritis, and chronic lung disease. It has also been shown to reduce anxiety, improve sleep, and increase cognitive performance among students and
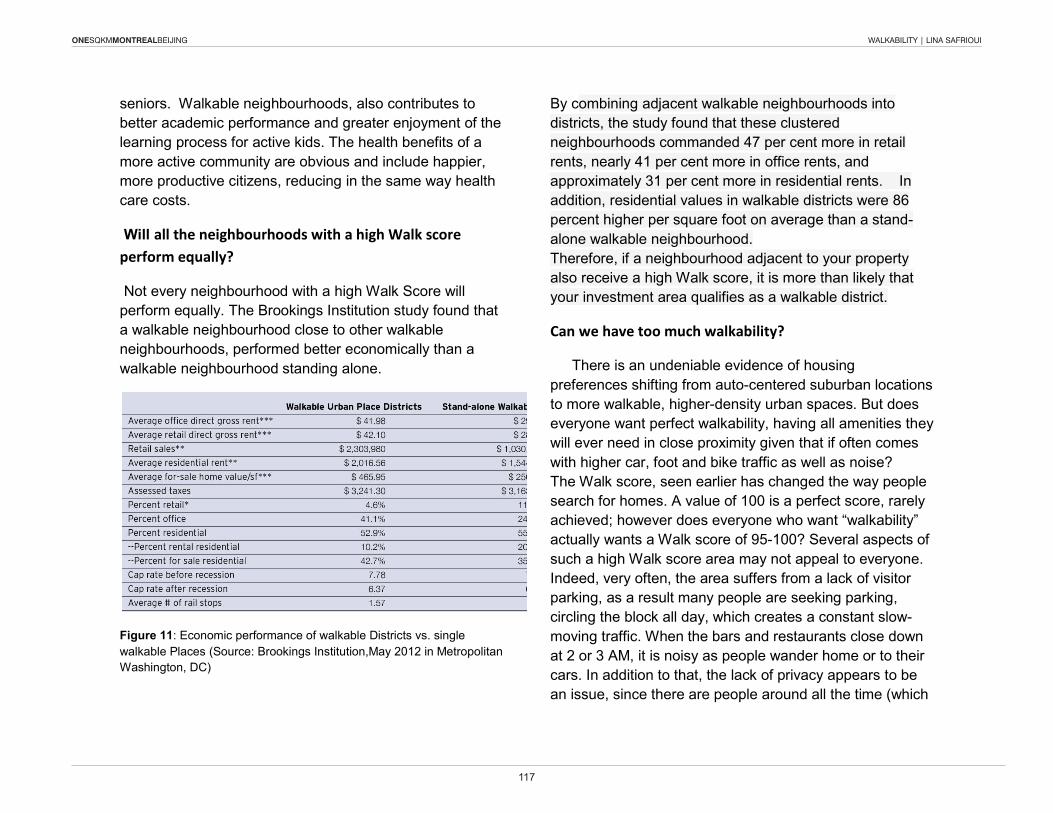
ONESQKMMONTREALBEIJING WALKABILITY | LINA SAFRIOUI
117
7
seniors. walkable neighbourhoods, also contributes to better academic performance and greater enjoyment of the learning process for active kids. The health benefits of a more active community are obvious and include happier, more productive citizens, reducing in the same way health care costs.
Will all the neighbourhoods with a high Walk score perform equally?
Not every neighbourhood with a high walk Score will perform equally. The Brookings Institution study found that a walkable neighbourhood close to other walkable neighbourhoods, performed better economically than a walkable neighbourhood standing alone.
Figure 11: Economic performance of walkable Districts vs. single walkable Places (Source: Brookings Institution,May 2012 in Metropolitan washington, DC)
By combining adjacent walkable neighbourhoods into districts, the study found that these clustered neighbourhoods commanded 47 per cent more in retail rents, nearly 41 per cent more in office rents, and approximately 31 per cent more in residential rents. In addition, residential values in walkable districts were 86 percent higher per square foot on average than a stand-alone walkable neighbourhood. Therefore, if a neighbourhood adjacent to your property also receive a high walk score, it is more than likely that your investment area qualifies as a walkable district.
Can we have too much walkability?
There is an undeniable evidence of housing preferences shifting from auto-centered suburban locations to more walkable, higher-density urban spaces. But does everyone want perfect walkability, having all amenities they will ever need in close proximity given that if often comes with higher car, foot and bike traffic as well as noise? The walk score, seen earlier has changed the way people search for homes. A value of 100 is a perfect score, rarely achieved; however does everyone who want “walkability” actually wants a walk score of 95-100? Several aspects of such a high walk score area may not appeal to everyone. Indeed, very often, the area suffers from a lack of visitor parking, as a result many people are seeking parking, circling the block all day, which creates a constant slow-moving traffic. when the bars and restaurants close down at 2 or 3 AM, it is noisy as people wander home or to their cars. In addition to that, the lack of privacy appears to be an issue, since there are people around all the time (which
ONESQKMMONTREALBEIJING WALKABILITY | LINA SAFRIOUI
118
8
is however good for deterring crime).Thereby it appears clear, that some people might consider that this is too much walkability. How about some 85 scoring homes? If we run a walk score 2-3 blocks east of our home, further away from the main shopping-urban space, the score drops to 85. However, 2-3 blocks away feels like another world, indeed the streets are quieter in terms of cars and people, and there are no shoppers from outside the neighbourhood seeking parking. Yet are these 85 walkscore homes really that much “less walkable” than the 95-100 scoring ones? Do two blocks make that much difference? To some people yes, but for many others, not really. A couple decades ago, few people wanted walkability, they wanted the quiet and the perceived security of auto-centered life. Today, many want the opposite, but maybe we Perhaps even more people would embrace an urban life with an 85 walk score.
Both Montreal Plateau and the Beijing site offer a very pleasing walking environment in different manners. Improving walkability is a vital part of creating a sustainable future for all Cities. People of all ages want to live in communities that provide easy connection to amenities, employment, and to each other. well-connected walkable communities are not only beneficial to citizens, but can also deliver real economic rewards to businesses and local governments. while sustainable urban planning is an important part of the way forward for cities, many communities have safe, walkable routes already present within existing infrastructure and design. By identifying existing routes that simply require reconnection, cities can quickly improve their walkability
and boost community vitality.
ONESQKMMONTREALBEIJING WALKABILITY | LINA SAFRIOUI
119
9
Bibliography
Frank LD. (2004). Economic determinants of urban form. Resulting trade-offs between active and sedentary forms of travel. American Journal of Preventive Medicine, 27(3S), 146-153.
Frank LD, Engelke PO, & Schmid TL. (2003). Health and community design.The impact of the built environment on physical activity. washington: Island Press.
C3 Collaborating for Health (2012) The benefits of regular walking for health, well-being and the environment.
Ria Hutabarat Loa (2009) “Walkability: What Is It?” Journal of Urbanism: International Research on Placemaking and Urban Sustainability, 2(2): 145-166
Kevin M. Leyden (2003) “Social Capital and the Built Environment: The Importance of walkable Neighborhoods,”American Journal of Public Health, 93(9): 1546-1551.
Christopher B. Leinberger and Mariela Alfonzo (2012) Walk this Way: The Economic Promise of Walkable
Places in Metropolitan Washington, D.C., washington, DC: The Brookings Institution. ABw (2010), Bicycling and walking in the U.S.: 2010 Benchmarking Report, Alliance for Biking & walking, (www.peoplepoweredmovement.org); at www.peoplepoweredmovement.org/site/index.php/site/memberservices/C529.
Joseph Cortright (2009), walking the walk: How walkability Raises Housing values in U.S. Cities, CEOs for Cities (www.ceosforcities.org); www.ceosforcities.org/files/walkingThewalk_CEOsforCities1.pdf.
The General Theory of walkability: Jeff Speck https://www.youtube.com/watch?v=uEkgM9P2C5U

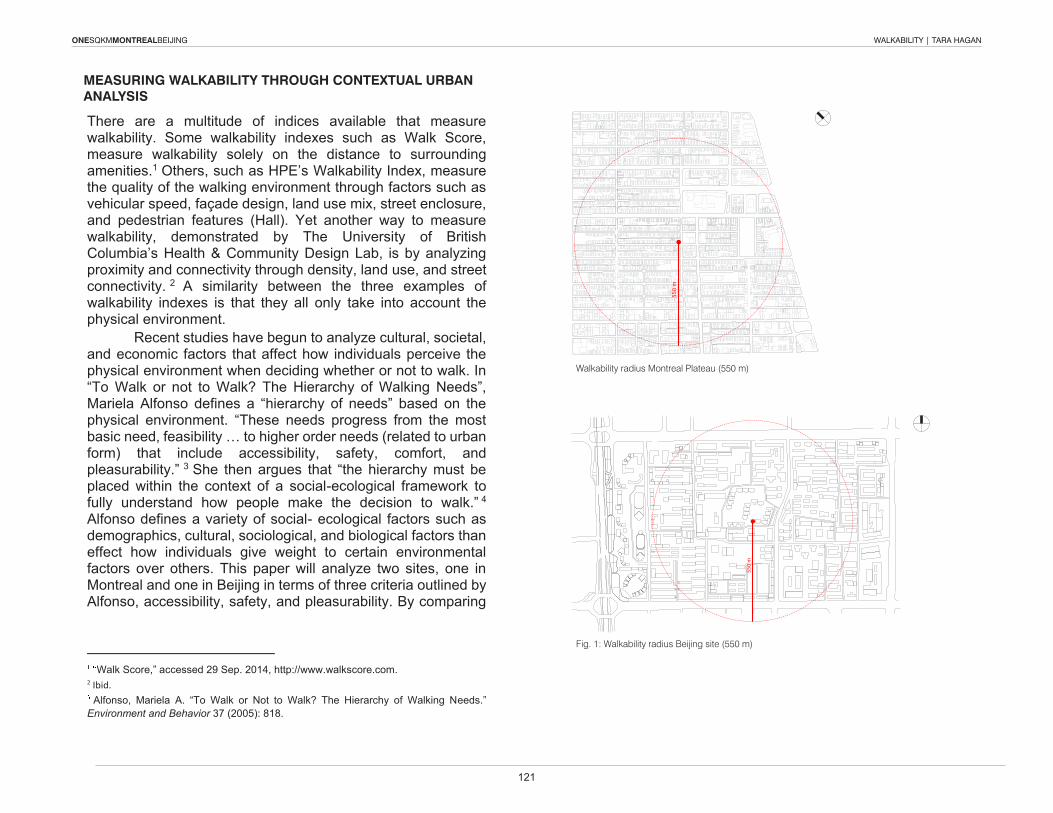
121
ONESQKMMONTREALBEIJING WALKABILITY | TARA HAGAN
MEASURING WALKABILITY THROUGH CONTEXTUAL URBAN ANALYSIS
There are a multitude of indices available that measure walkability. Some walkability indexes such as Walk Score, measure walkability solely on the distance to surrounding amenities.1 Others, such as HPE’s Walkability Index, measure the quality of the walking environment through factors such as vehicular speed, façade design, land use mix, street enclosure, and pedestrian features (Hall). Yet another way to measure walkability, demonstrated by The University of British Columbia’s Health & Community Design Lab, is by analyzing proximity and connectivity through density, land use, and street connectivity. 2 A similarity between the three examples of walkability indexes is that they all only take into account the physical environment. Recent studies have begun to analyze cultural, societal, and economic factors that affect how individuals perceive the physical environment when deciding whether or not to walk. In “To Walk or not to Walk? The Hierarchy of Walking Needs”, Mariela Alfonso defines a “hierarchy of needs” based on the physical environment. “These needs progress from the most basic need, feasibility … to higher order needs (related to urban form) that include accessibility, safety, comfort, and pleasurability.” 3 She then argues that “the hierarchy must be placed within the context of a social-ecological framework to fully understand how people make the decision to walk.” 4 Alfonso defines a variety of social- ecological factors such as demographics, cultural, sociological, and biological factors than effect how individuals give weight to certain environmental factors over others. This paper will analyze two sites, one in Montreal and one in Beijing in terms of three criteria outlined by Alfonso, accessibility, safety, and pleasurability. By comparing
Walk Score,” accessed 29 Sep. 2014, http://www.walkscore.com.
2 Ibid. Alfonso, Mariela A. “To Walk or Not to Walk? The Hierarchy of Walking Needs.”
Environment and Behavior 37 (2005): 818.
how each site addresses these issues, cultural and societal factors also emerge. Accessibility The first and primary factor required for a walkable environment is accessibility, or in other words, is it feasible for a person to walk from point A to point B. The level of accessibility is influenced by “ two key land use variables: density, or compactness of land use; and, land use mix (the degree of heterogeneity with which functionally different uses are co-located in space). The more compact and intermixed an urban environment is, the shorter the distances between destinations.” 5 It is also important to note that what is considered accessible differs from person to person. Jose Cert establishes 400-700 m as a walkable radius, while Calthorpe 360 m. For this paper an average of the three values, 490 m will be used. As seen in FIGURE 1 from the center point of both sites almost all surrounding areas on the site can be considered accessible by walking. In order to analyze both sites in terms of accessibility via land use mix, starting points will be considered as residential areas, and target locations as all other land uses such as offices, retail, schools, and green spaces. Areas on both sites that would be considered more accessible are those that have a greater mix between residential and other land uses. In the Plateau, commercial, office, and other land uses are located primarily on streets running east/west, and on 2 major south/ north orientated streets, St. Laurent and St. Denis. Residential areas surrounding these streets could be considered more walkable under this criteria, and residential areas located further
4 Ibid. Leslie, Eva et al. “Walkability of local communities: Using Geographic information
systems to objectively assess relevant environmental attributes.” Health & Place. 13 (2007): 113.
Walkability radius Montreal Plateau (550 m)
Fig. 1: Walkability radius Beijing site (550 m)
SCHOOL
HOSPITAL
GREEN SPACE
RESTAURANT
RETAIL
RESID./ COMMER.
OFFICE/ COMMER.
OFFICE
RESIDENTIAL
OTHER
550
m
550
m
SCHOOL
HOSPITAL
CORNER STORE
RESTAURANT
RETAIL
RELIGIOUS
GOVERNMENT
OFFICE
RESIDENTIAL
OTHER
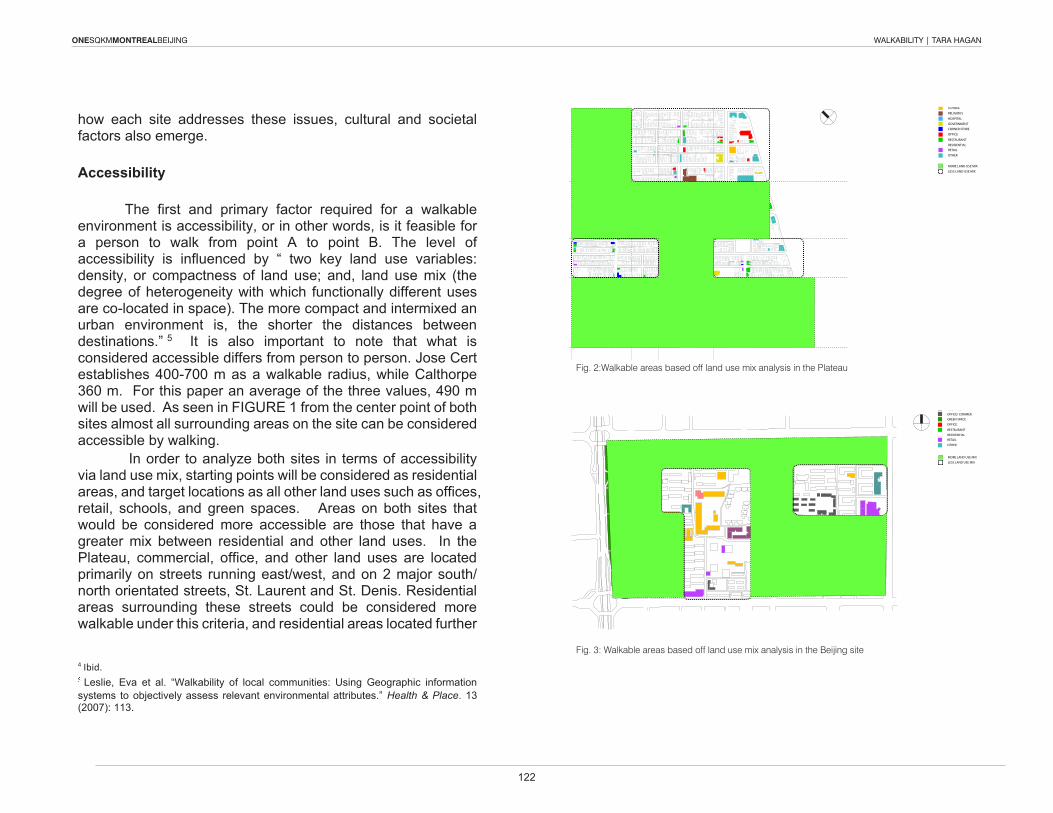
122
ONESQKMMONTREALBEIJING WALKABILITY | TARA HAGAN
Fig. 4: Large width street - Beijing
ROAD
VEGETATION
PARKING
SIDEWALK
SIDEWALK VEGETATION PARKING SIDEWALK VEG. SIDEWALK ROAD VEG.PARKING SIDEWALK SIDEWALK
VEGETATION SIDEWALKPARKING PARKING ROAD - LOWER SPEED VEGETATION ROAD - HIGHER SPEED VEGETATION ROAD - LOWER SPEED PARKING PARKINGVEGETATION/SIDEWALK
PARKING
ROADLOWER SPEED
VEGETATION
VEG. SIDEWALK/ PATIO
PARKINGSIDEWALKROAD/ SIDEWALKPARKINGVEG.SIDEWALK
ROAD/ PEDESTRIAN WALKWAY
SIDEWALK/CAR PARKING
ROAD/ PEDESTRIAN WALKWAY
SIDEWALK/CAR PARKING
Fig. 5: Medium width street - Beijing Fig. 6: Medium width street - Beijing Fig. 7: Small width street - Beijing
ONESQKMMONTREALBEIJING WALKABILITY | TARA HAGAN
There are a multitude of indices available that measure walkability. Some walkability indexes such as Walk Score, measure walkability solely on the distance to surrounding amenities.1 Others, such as HPE’s Walkability Index, measure the quality of the walking environment through factors such as vehicular speed, façade design, land use mix, street enclosure, and pedestrian features (Hall). Yet another way to measure walkability, demonstrated by The University of British Columbia’s Health & Community Design Lab, is by analyzing proximity and connectivity through density, land use, and street connectivity. 2 A similarity between the three examples of walkability indexes is that they all only take into account the physical environment. Recent studies have begun to analyze cultural, societal, and economic factors that affect how individuals perceive the physical environment when deciding whether or not to walk. In “To Walk or not to Walk? The Hierarchy of Walking Needs”, Mariela Alfonso defines a “hierarchy of needs” based on the physical environment. “These needs progress from the most basic need, feasibility … to higher order needs (related to urban form) that include accessibility, safety, comfort, and pleasurability.” 3 She then argues that “the hierarchy must be placed within the context of a social-ecological framework to fully understand how people make the decision to walk.” 4 Alfonso defines a variety of social- ecological factors such as demographics, cultural, sociological, and biological factors than effect how individuals give weight to certain environmental factors over others. This paper will analyze two sites, one in Montreal and one in Beijing in terms of three criteria outlined by Alfonso, accessibility, safety, and pleasurability. By comparing
Walk Score,” accessed 29 Sep. 2014, http://www.walkscore.com.
2 Ibid. Alfonso, Mariela A. “To Walk or Not to Walk? The Hierarchy of Walking Needs.”
Environment and Behavior 37 (2005): 818.
how each site addresses these issues, cultural and societal factors also emerge. Accessibility The first and primary factor required for a walkable environment is accessibility, or in other words, is it feasible for a person to walk from point A to point B. The level of accessibility is influenced by “ two key land use variables: density, or compactness of land use; and, land use mix (the degree of heterogeneity with which functionally different uses are co-located in space). The more compact and intermixed an urban environment is, the shorter the distances between destinations.” 5 It is also important to note that what is considered accessible differs from person to person. Jose Cert establishes 400-700 m as a walkable radius, while Calthorpe 360 m. For this paper an average of the three values, 490 m will be used. As seen in FIGURE 1 from the center point of both sites almost all surrounding areas on the site can be considered accessible by walking. In order to analyze both sites in terms of accessibility via land use mix, starting points will be considered as residential areas, and target locations as all other land uses such as offices, retail, schools, and green spaces. Areas on both sites that would be considered more accessible are those that have a greater mix between residential and other land uses. In the Plateau, commercial, office, and other land uses are located primarily on streets running east/west, and on 2 major south/ north orientated streets, St. Laurent and St. Denis. Residential areas surrounding these streets could be considered more walkable under this criteria, and residential areas located further
4 Ibid. Leslie, Eva et al. “Walkability of local communities: Using Geographic information
systems to objectively assess relevant environmental attributes.” Health & Place. 13 (2007): 113.
Fig. 2:Walkable areas based off land use mix analysis in the Plateau
Fig. 3: Walkable areas based off land use mix analysis in the Beijing site
SCHOOL
HOSPITAL
GREEN SPACE
RESTAURANT
RETAIL
RESID./ COMMER.
OFFICE/ COMMER.
OFFICE
RESIDENTIAL
OTHER
MORE LAND USE MIX
LESS LAND USE MIX
MORE LAND USE MIX
LESS LAND USE MIX
SCHOOL
HOSPITAL
CORNER STORE
RESTAURANT
RETAIL
RELIGIOUS
GOVERNMENT
OFFICE
RESIDENTIAL
OTHER
SCHOOL
HOSPITAL
GREEN SPACE
RESTAURANT
RETAIL
RESID./ COMMER.
OFFICE/ COMMER.
OFFICE
RESIDENTIAL
OTHER
MORE LAND USE MIX
LESS LAND USE MIX
MORE LAND USE MIX
LESS LAND USE MIX
SCHOOL
HOSPITAL
CORNER STORE
RESTAURANT
RETAIL
RELIGIOUS
GOVERNMENT
OFFICE
RESIDENTIAL
OTHER
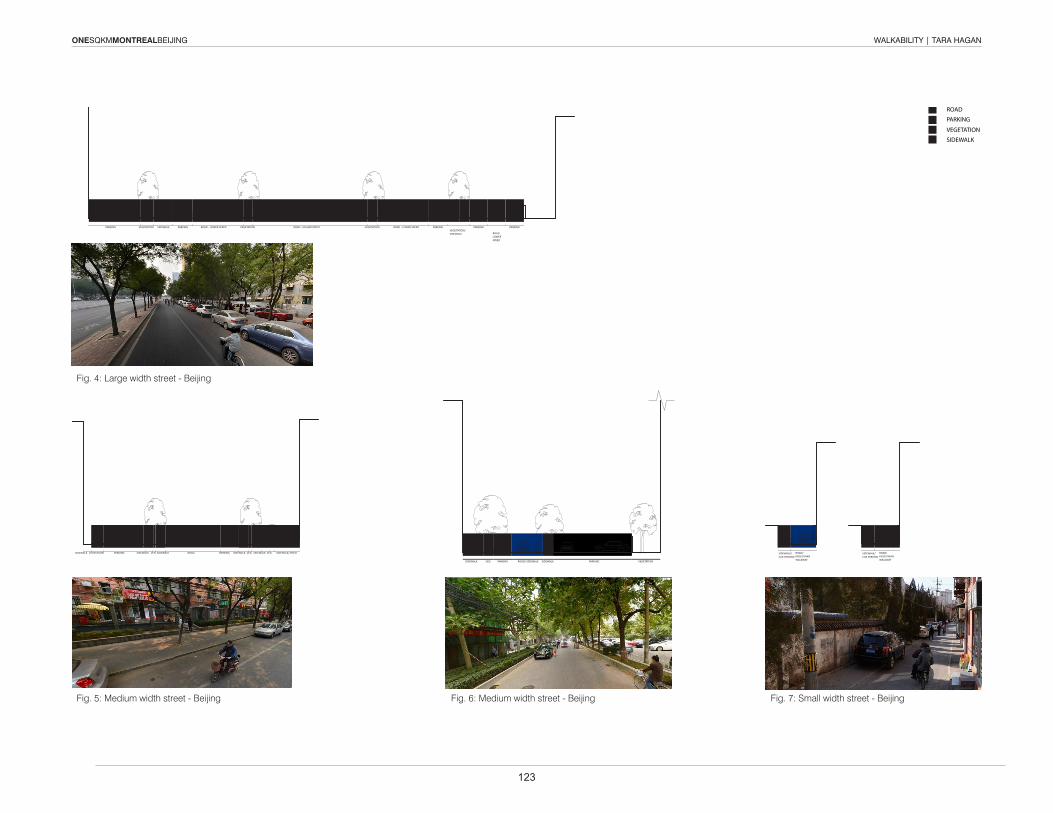
123
ONESQKMMONTREALBEIJING WALKABILITY | TARA HAGAN
Fig. 4: Large width street - Beijing
ROAD
VEGETATION
PARKING
SIDEWALK
SIDEWALK VEGETATION PARKING SIDEWALK VEG. SIDEWALK ROAD VEG.PARKING SIDEWALK SIDEWALK
VEGETATION SIDEWALKPARKING PARKING ROAD - LOWER SPEED VEGETATION ROAD - HIGHER SPEED VEGETATION ROAD - LOWER SPEED PARKING PARKINGVEGETATION/SIDEWALK
PARKING
ROADLOWER SPEED
VEGETATION
VEG. SIDEWALK/ PATIO
PARKINGSIDEWALKROAD/ SIDEWALKPARKINGVEG.SIDEWALK
ROAD/ PEDESTRIAN WALKWAY
SIDEWALK/CAR PARKING
ROAD/ PEDESTRIAN WALKWAY
SIDEWALK/CAR PARKING
ROAD
VEGETATION
PARKING
SIDEWALK
SIDEWALK VEGETATION PARKING SIDEWALK VEG. SIDEWALK ROAD VEG.PARKING SIDEWALK SIDEWALK
VEGETATION SIDEWALKPARKING PARKING ROAD - LOWER SPEED VEGETATION ROAD - HIGHER SPEED VEGETATION ROAD - LOWER SPEED PARKING PARKINGVEGETATION/SIDEWALK
PARKING
ROADLOWER SPEED
VEGETATION
VEG. SIDEWALK/ PATIO
PARKINGSIDEWALKROAD/ SIDEWALKPARKINGVEG.SIDEWALK
ROAD/ PEDESTRIAN WALKWAY
SIDEWALK/CAR PARKING
ROAD/ PEDESTRIAN WALKWAY
SIDEWALK/CAR PARKING
ROAD
VEGETATION
PARKING
SIDEWALK
SIDEWALK VEGETATION PARKING SIDEWALK VEG. SIDEWALK ROAD VEG.PARKING SIDEWALK SIDEWALK
VEGETATION SIDEWALKPARKING PARKING ROAD - LOWER SPEED VEGETATION ROAD - HIGHER SPEED VEGETATION ROAD - LOWER SPEED PARKING PARKINGVEGETATION/SIDEWALK
PARKING
ROADLOWER SPEED
VEGETATION
VEG. SIDEWALK/ PATIO
PARKINGSIDEWALKROAD/ SIDEWALKPARKINGVEG.SIDEWALK
ROAD/ PEDESTRIAN WALKWAY
SIDEWALK/CAR PARKING
ROAD/ PEDESTRIAN WALKWAY
SIDEWALK/CAR PARKING
Fig. 5: Medium width street - Beijing Fig. 6: Medium width street - Beijing Fig. 7: Small width street - Beijing
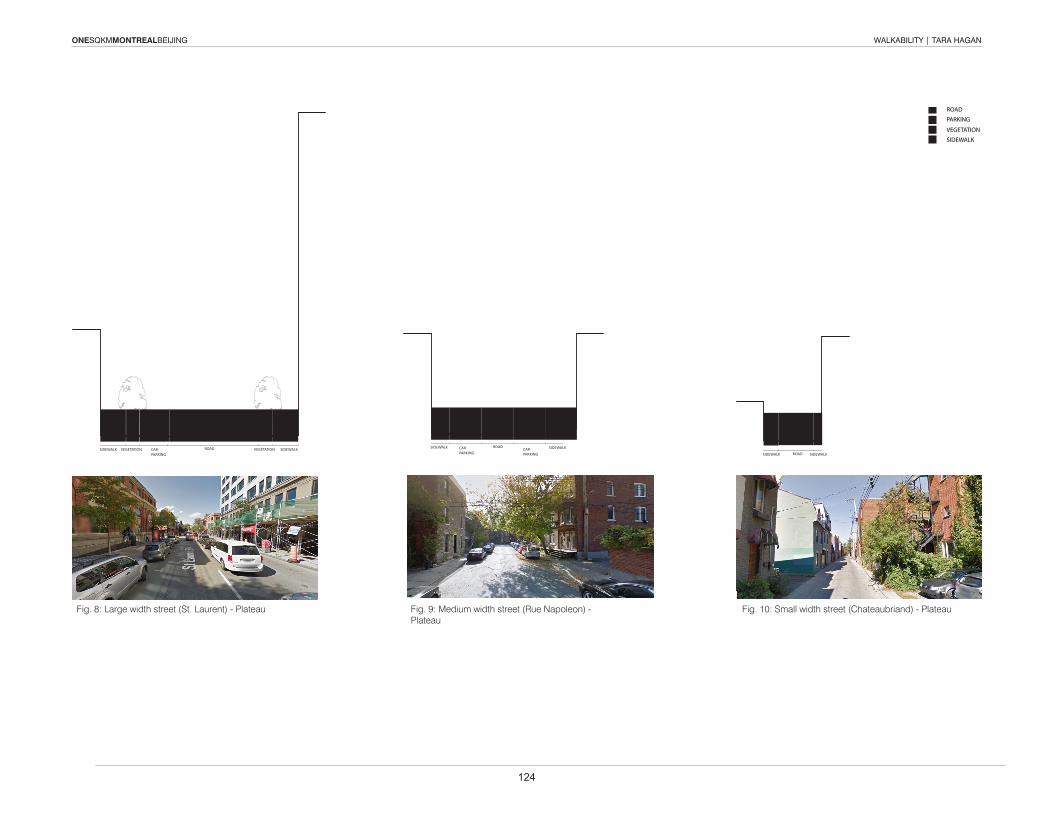
124
ONESQKMMONTREALBEIJING
Fig. 12:Tree Cover Analysis
Fig. 13: Human Scale - Beijing Site
147
m
147 m
Fig. 14: Human Scale - Plateau
Fig. 11:Site Elevations
Montreal
Beijing
from these streets could be considered less walkable [FIGURE 2]. The Beijing site is organized much differently in terms of land use patterns. Residential land use and other land uses are more evenly distributed across the site. Areas that could be said to have high levels land use mix in the Beijing site occur where there are greater levels of buildings that share both uses [FIGURE 3]. Density, or compactness is also very different in both sites. The Plateau, with a gross FAR of 1.17, achieves density by having building volumes that are very close to each other, and not by higher building heights. The Beijing site, with a gross FAR of 2.02, has more spread out building volumes, but each volume is on average much higher than in the Plateau. These two different approaches show how increased walkability through land use mix can be achieved with smaller blocks in the Plateau and larger blocks in the Beijing site. Safety A second factor that can effect walkability is safety. “Speeding motor vehicles are the most common concern of walkers on local and arterial streets.” 6 Safety can thus be investigated in terms of the transition from road to sidewalk. By introducing different types of buffers between these two elements a greater sense of security can be achieved. In both the Beijing site and in the Plateau, larger buffer zones occur where there are larger streets and faster moving vehicles. The buffer zones become less needed as the streets decrease in size, since the speed and volume of vehicles is also less. Take for instance a larger street in Beijing [FIGURE 4]. The road has been separated into five separate arteries with faster moving traffic towards the center, and slower local traffic towards the edge. Vegetation and parking provides an additional buffer
Washington State Department of Health. Enhance the safety and perceived safety of
communities to improve walkability and bikeability. Web. 11 Nov. 2014. <http://depts.washington.edu/waaction/plan/pa3/rec_c.html>.
protecting pedestrians from vehicles, creating a gradient of separation. Moving towards a slightly smaller street in the Beijing site, buffer areas also involve a layering of parking and vegetation to increase pedestrian protection [FIGURE 5]. A larger street in the Plateau, St. Laurent, exhibits a similar pattern [FIGURE 8]. A layer of parking and trees exists between the road and sidewalk. A slightly smaller street Rue Napoleon [FIGURE 9] requires less buffer, and has a layer of parking but no vegetation present. The narrowest streets in both sites have little or no buffers. In the Beijing site, smaller streets not only lack buffers, the roadway and sidewalk become interchangeable. In FIGURE 7, the sidewalk is being used for parking, and the roadway becomes an avenue for both cars and pedestrians. FIGURE 6 also shows a street with shared vehicular and pedestrian use, as one side of the street lacks a sidewalk. In the Plateau site, streets such as Chateaubriand [FIGURE 10] have a very narrow sidewalk with no buffer between cars and pedestrians. Pleasurability Once safety and accessibility have been satisfied, pleasurability can be considered when determining how walkable an area is. Numerous factors can contribute to a pleasurable walking environment. For instance, “enclosure, or the outdoor room, is, perhaps, the most powerful, the most obvious, of all the devices to instill a sense of position, of identity with the surroundings ... it embodies the idea of hereness.”7 By analyzing the vegetative cover in both sites, different approaches to enclosure emerge. In the Plateau, building facades create a continuous wall on most streets [FIGURE 11].
Alexander, C., Ishikawa, S. & Silverstein, M. A Pattern Language – Towns Buildings
Construction. (New York: Oxford University Press, 1977), 106.
WALKABILITY | TARA HAGANONESQKMMONTREALBEIJING
ST. LAURENT RUE NAPOLEON
SIDEWALK CARPARKING
ROAD CARPARKING
SIDEWALK
SIDEWALKSIDEWALK ROAD
AVENUE DE CHATEAUBRIAND
CARPARKING
SIDEWALK VEGETATION ROAD VEGETATION SIDEWALK
ROAD
VEGETATION
PARKING
SIDEWALK
SIDEWALK VEGETATION PARKING SIDEWALK VEG. SIDEWALK ROAD VEG.PARKING SIDEWALK SIDEWALK
VEGETATION SIDEWALKPARKING PARKING ROAD - LOWER SPEED VEGETATION ROAD - HIGHER SPEED VEGETATION ROAD - LOWER SPEED PARKING PARKINGVEGETATION/SIDEWALK
PARKING
ROADLOWER SPEED
VEGETATION
VEG. SIDEWALK/ PATIO
PARKINGSIDEWALKROAD/ SIDEWALKPARKINGVEG.SIDEWALK
ROAD/ PEDESTRIAN WALKWAY
SIDEWALK/CAR PARKING
ROAD/ PEDESTRIAN WALKWAY
SIDEWALK/CAR PARKING
ST. LAURENT RUE NAPOLEON
SIDEWALK CARPARKING
ROAD CARPARKING
SIDEWALK
SIDEWALKSIDEWALK ROAD
AVENUE DE CHATEAUBRIAND
CARPARKING
SIDEWALK VEGETATION ROAD VEGETATION SIDEWALK
ST. LAURENT RUE NAPOLEON
SIDEWALK CARPARKING
ROAD CARPARKING
SIDEWALK
SIDEWALKSIDEWALK ROAD
AVENUE DE CHATEAUBRIAND
CARPARKING
SIDEWALK VEGETATION ROAD VEGETATION SIDEWALK
Fig. 8: Large width street (St. Laurent) - Plateau Fig. 9: Medium width street (Rue Napoleon) - Plateau
Fig. 10: Small width street (Chateaubriand) - Plateau
WALKABILITY | TARA HAGAN
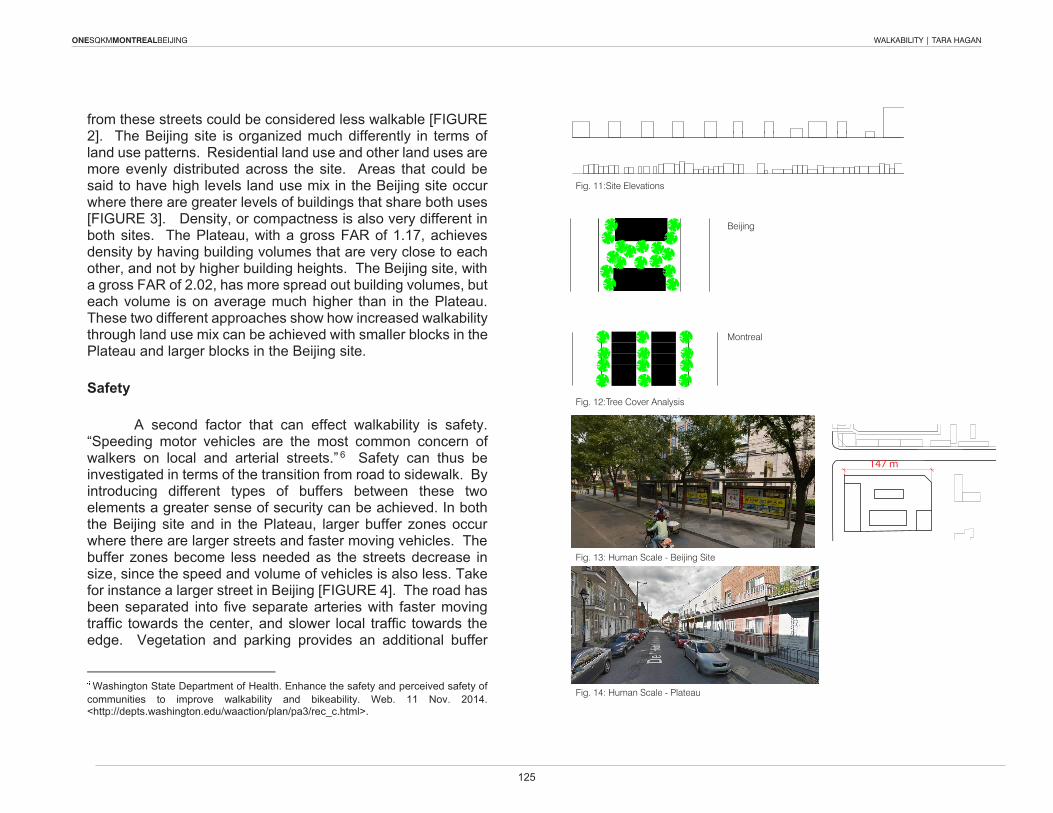
125
ONESQKMMONTREALBEIJING
Fig. 12:Tree Cover Analysis
Fig. 13: Human Scale - Beijing Site
147
m147 m
Fig. 14: Human Scale - Plateau
Fig. 11:Site Elevations
Montreal
Beijing
from these streets could be considered less walkable [FIGURE 2]. The Beijing site is organized much differently in terms of land use patterns. Residential land use and other land uses are more evenly distributed across the site. Areas that could be said to have high levels land use mix in the Beijing site occur where there are greater levels of buildings that share both uses [FIGURE 3]. Density, or compactness is also very different in both sites. The Plateau, with a gross FAR of 1.17, achieves density by having building volumes that are very close to each other, and not by higher building heights. The Beijing site, with a gross FAR of 2.02, has more spread out building volumes, but each volume is on average much higher than in the Plateau. These two different approaches show how increased walkability through land use mix can be achieved with smaller blocks in the Plateau and larger blocks in the Beijing site. Safety A second factor that can effect walkability is safety. “Speeding motor vehicles are the most common concern of walkers on local and arterial streets.” 6 Safety can thus be investigated in terms of the transition from road to sidewalk. By introducing different types of buffers between these two elements a greater sense of security can be achieved. In both the Beijing site and in the Plateau, larger buffer zones occur where there are larger streets and faster moving vehicles. The buffer zones become less needed as the streets decrease in size, since the speed and volume of vehicles is also less. Take for instance a larger street in Beijing [FIGURE 4]. The road has been separated into five separate arteries with faster moving traffic towards the center, and slower local traffic towards the edge. Vegetation and parking provides an additional buffer
Washington State Department of Health. Enhance the safety and perceived safety of
communities to improve walkability and bikeability. Web. 11 Nov. 2014. <http://depts.washington.edu/waaction/plan/pa3/rec_c.html>.
protecting pedestrians from vehicles, creating a gradient of separation. Moving towards a slightly smaller street in the Beijing site, buffer areas also involve a layering of parking and vegetation to increase pedestrian protection [FIGURE 5]. A larger street in the Plateau, St. Laurent, exhibits a similar pattern [FIGURE 8]. A layer of parking and trees exists between the road and sidewalk. A slightly smaller street Rue Napoleon [FIGURE 9] requires less buffer, and has a layer of parking but no vegetation present. The narrowest streets in both sites have little or no buffers. In the Beijing site, smaller streets not only lack buffers, the roadway and sidewalk become interchangeable. In FIGURE 7, the sidewalk is being used for parking, and the roadway becomes an avenue for both cars and pedestrians. FIGURE 6 also shows a street with shared vehicular and pedestrian use, as one side of the street lacks a sidewalk. In the Plateau site, streets such as Chateaubriand [FIGURE 10] have a very narrow sidewalk with no buffer between cars and pedestrians. Pleasurability Once safety and accessibility have been satisfied, pleasurability can be considered when determining how walkable an area is. Numerous factors can contribute to a pleasurable walking environment. For instance, “enclosure, or the outdoor room, is, perhaps, the most powerful, the most obvious, of all the devices to instill a sense of position, of identity with the surroundings ... it embodies the idea of hereness.”7 By analyzing the vegetative cover in both sites, different approaches to enclosure emerge. In the Plateau, building facades create a continuous wall on most streets [FIGURE 11].
Alexander, C., Ishikawa, S. & Silverstein, M. A Pattern Language – Towns Buildings
Construction. (New York: Oxford University Press, 1977), 106.
WALKABILITY | TARA HAGAN
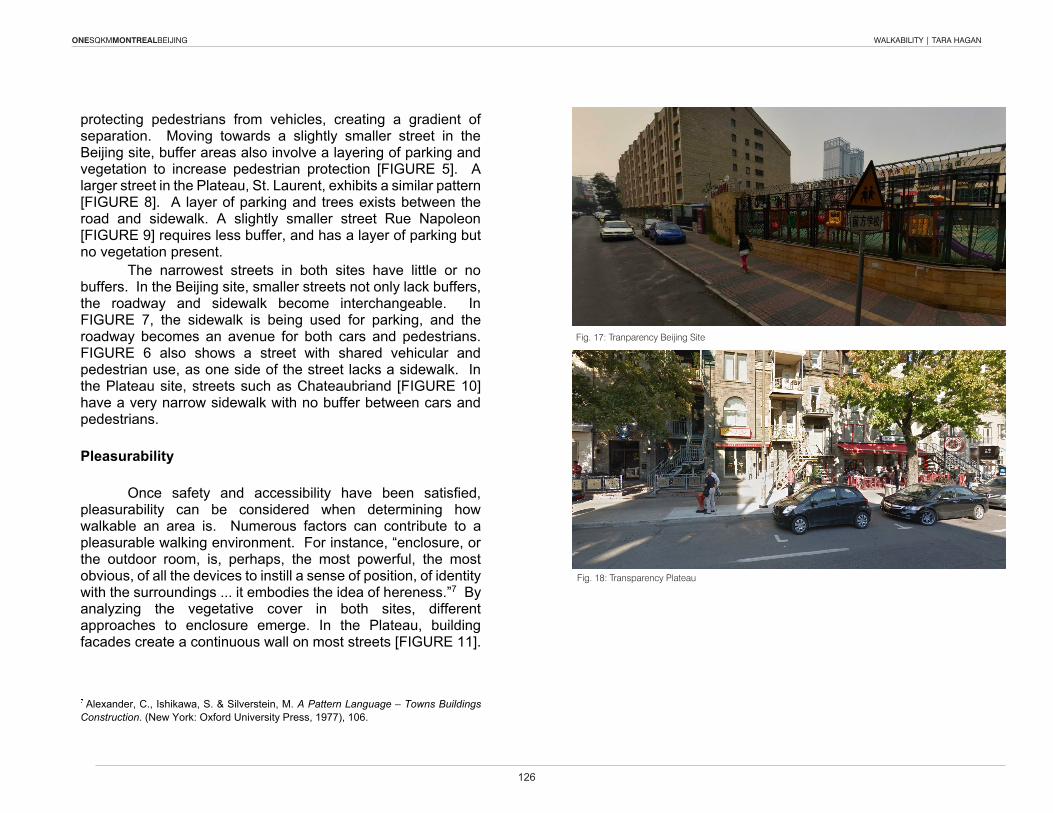
126
ONESQKMMONTREALBEIJING
Fig. 15: Tree Cover Plateau
WALKABILITY | TARA HAGANONESQKMMONTREALBEIJING
from these streets could be considered less walkable [FIGURE 2]. The Beijing site is organized much differently in terms of land use patterns. Residential land use and other land uses are more evenly distributed across the site. Areas that could be said to have high levels land use mix in the Beijing site occur where there are greater levels of buildings that share both uses [FIGURE 3]. Density, or compactness is also very different in both sites. The Plateau, with a gross FAR of 1.17, achieves density by having building volumes that are very close to each other, and not by higher building heights. The Beijing site, with a gross FAR of 2.02, has more spread out building volumes, but each volume is on average much higher than in the Plateau. These two different approaches show how increased walkability through land use mix can be achieved with smaller blocks in the Plateau and larger blocks in the Beijing site. Safety A second factor that can effect walkability is safety. “Speeding motor vehicles are the most common concern of walkers on local and arterial streets.” 6 Safety can thus be investigated in terms of the transition from road to sidewalk. By introducing different types of buffers between these two elements a greater sense of security can be achieved. In both the Beijing site and in the Plateau, larger buffer zones occur where there are larger streets and faster moving vehicles. The buffer zones become less needed as the streets decrease in size, since the speed and volume of vehicles is also less. Take for instance a larger street in Beijing [FIGURE 4]. The road has been separated into five separate arteries with faster moving traffic towards the center, and slower local traffic towards the edge. Vegetation and parking provides an additional buffer
Washington State Department of Health. Enhance the safety and perceived safety of
communities to improve walkability and bikeability. Web. 11 Nov. 2014. <http://depts.washington.edu/waaction/plan/pa3/rec_c.html>.
protecting pedestrians from vehicles, creating a gradient of separation. Moving towards a slightly smaller street in the Beijing site, buffer areas also involve a layering of parking and vegetation to increase pedestrian protection [FIGURE 5]. A larger street in the Plateau, St. Laurent, exhibits a similar pattern [FIGURE 8]. A layer of parking and trees exists between the road and sidewalk. A slightly smaller street Rue Napoleon [FIGURE 9] requires less buffer, and has a layer of parking but no vegetation present. The narrowest streets in both sites have little or no buffers. In the Beijing site, smaller streets not only lack buffers, the roadway and sidewalk become interchangeable. In FIGURE 7, the sidewalk is being used for parking, and the roadway becomes an avenue for both cars and pedestrians. FIGURE 6 also shows a street with shared vehicular and pedestrian use, as one side of the street lacks a sidewalk. In the Plateau site, streets such as Chateaubriand [FIGURE 10] have a very narrow sidewalk with no buffer between cars and pedestrians. Pleasurability Once safety and accessibility have been satisfied, pleasurability can be considered when determining how walkable an area is. Numerous factors can contribute to a pleasurable walking environment. For instance, “enclosure, or the outdoor room, is, perhaps, the most powerful, the most obvious, of all the devices to instill a sense of position, of identity with the surroundings ... it embodies the idea of hereness.”7 By analyzing the vegetative cover in both sites, different approaches to enclosure emerge. In the Plateau, building facades create a continuous wall on most streets [FIGURE 11].
Alexander, C., Ishikawa, S. & Silverstein, M. A Pattern Language – Towns Buildings
Construction. (New York: Oxford University Press, 1977), 106.
Fig. 17: Tranparency Beijing Site
Fig. 18: Transparency Plateau
WALKABILITY | TARA HAGAN
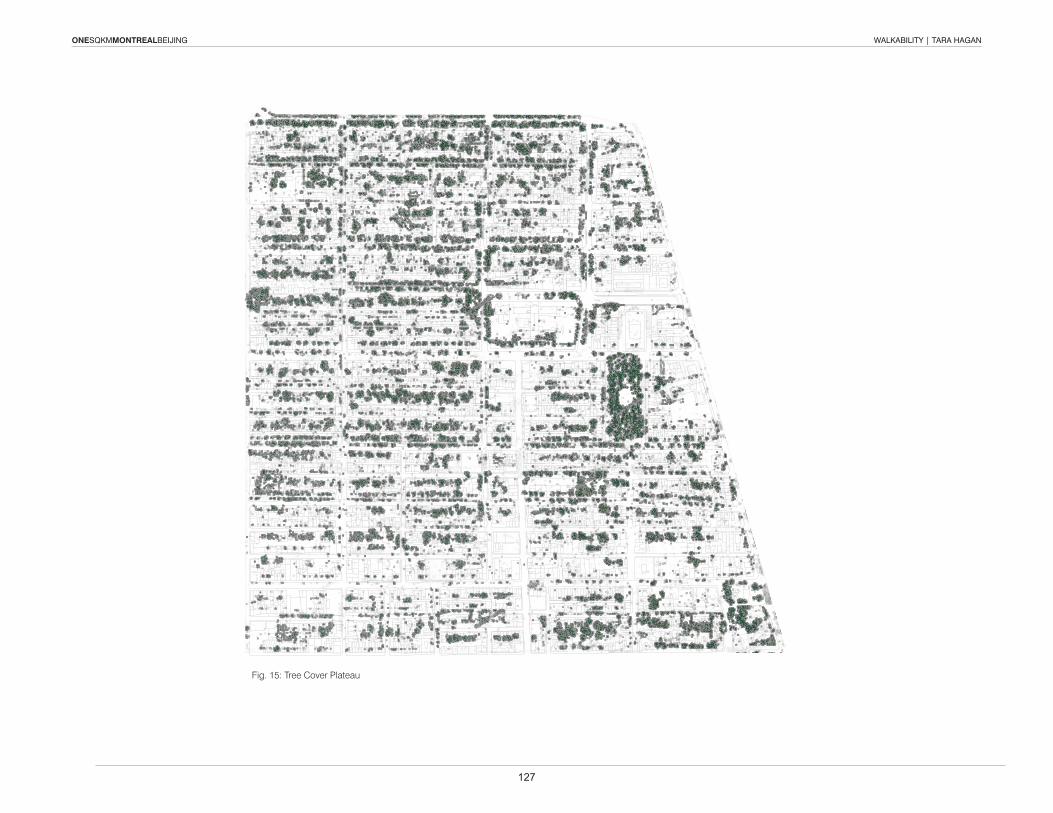
127
ONESQKMMONTREALBEIJING
Fig. 15: Tree Cover Plateau
WALKABILITY | TARA HAGAN
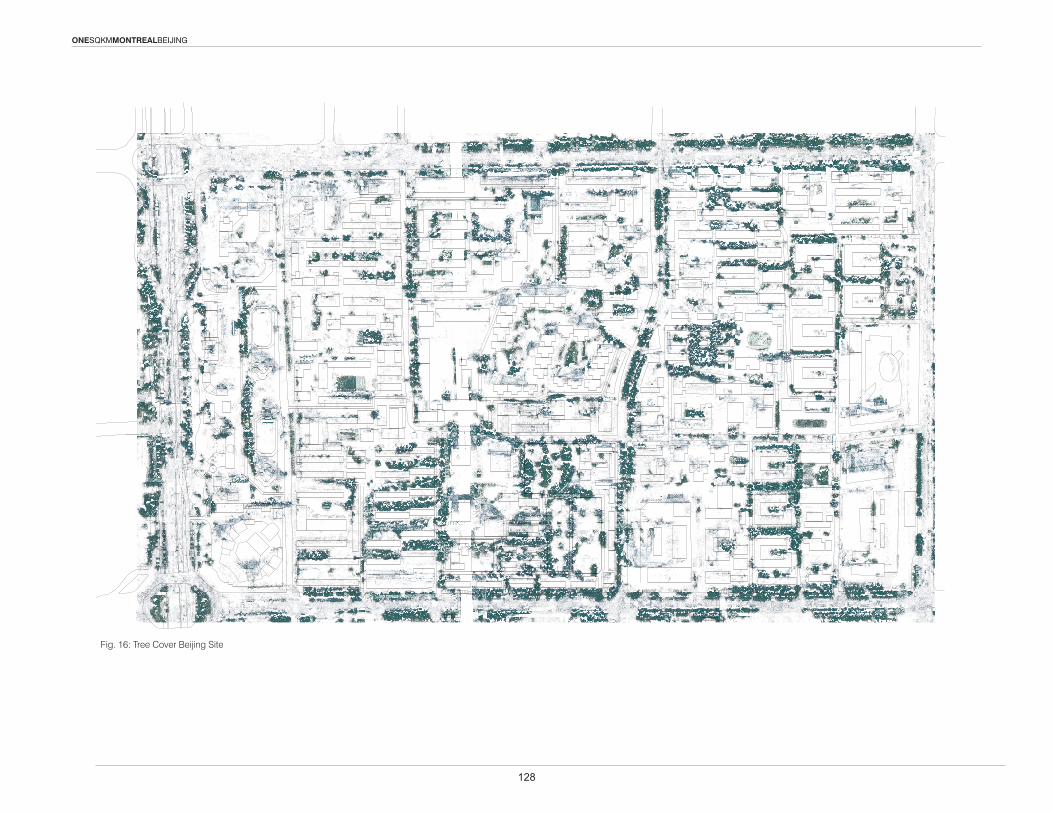
128
ONESQKMMONTREALBEIJING
Trees located on these streets provide additional enclosure from above. Buildings typically will have vegetation in front and back but not on either sides creating alternating strips of trees and buildings [FIGURE 12 + 15]. In the Beijing site, [FIGURE 12 + 16] buildings are for the most part placed at a distance from their neighbors on all sides. Vegetation completely surrounds buildings on all four sides, creating a continuous sense of enclosure that is not present in the arrangement of built forms. Another measure of a pleasurable walking environment is human scale. Human scale relates both to the size of buildings in height and width on a street façade as well width of streets. To compensate for large heights and widths of buildings in a street façade, tree canopies, street furniture, and paving can address issues of human scale.8 Comparing the two sites [FIGURE 11] based solely on building volumes, the Beijing site would appear as a less desirable walking environment as the buildings are at a much larger scale. However, there are many other ways to create a sense of human scale beyond building size. FIGURE 13 in plan shows a street in the Beijing site dominated by a large 147 m wide building that creates a disproportionate human scale as a result of its width. Viewing the street in more detail however one can see that use of a smaller paving pattern, planters with integrated benches, bus shelters with canopies, and abundant vegetation has completely transformed the large scale of the building behind. A street in the Plateau, in contrast [FIGURE 14] reveals a lack of vegetative cover, street furniture, and sidewalk paving other than typical tiling. Instead, human scale is provided through smaller building volumes and the resultant articulation of balconies, openings, and materiality at a smaller scale. A third measure of a pleasurable walking environment is transparency. “Transparency refers to the degree to which
Ewing, Reid, and Susan Handy. “Measuring the Unmeasurable: Urban Design
Qualities Related to Walkability.” Journal of Urban Design. 14.1 (2009): 65-84. Web. 14 Nov. 2014.
people can see or perceive what lies beyond the edge of a street and, more specifically, the degree to which people can see or perceive human activity beyond the edge of a street.”9 This can be achieved via glazing, buildings that reveal their programmatic function such as school and churches, and areas in which indoor activities are brought out onto the street such as cafes. Both the Plateau and the Beijing site address this aspect of walkability by drawing indoor activity out onto the street. In the Beijing site this can be seen for instance where a school playground is adjacent to the street [FIGURE 17]. Activity within the school is made visible these same characteristics influence the other two criteria as well. Both the Plateau and the Beijing site achieve accessibility, safety, and a pleasurable walking environment in vastly different manners. This brings into question how walkability can be measured, and if there is a universal scoring system that can be used to rate all cities with a similar algorithm. Both sites are considered very walkable environments by WalkScore receiving high scores, the Beijing site 85-98 and the Plateau 90-99. In order to compare analysis on land use mix and tree cover to WalkScore data, each site was divided into a grid, and a Walkscore calculated for each square in order to visual which portions of the sites are more or less walkable. The resulting comparisons can be seen in FIGURES 19-21. In both sites, areas that were identified as less mixed in terms of land use fall in some instances within the areas of lower WalkScores, but a complete synchronization is not achieved. Similarly, areas of greater tree cover do not correspond with higher scores in either of the two sites nor do smaller building volumes which would create a sense of human scale. Algorithms such as WalkScore may be capable of identifying broader areas of
Ibid.
WALKABILITY | TARA HAGANONESQKMMONTREALBEIJING
Fig. 16: Tree Cover Beijing Site
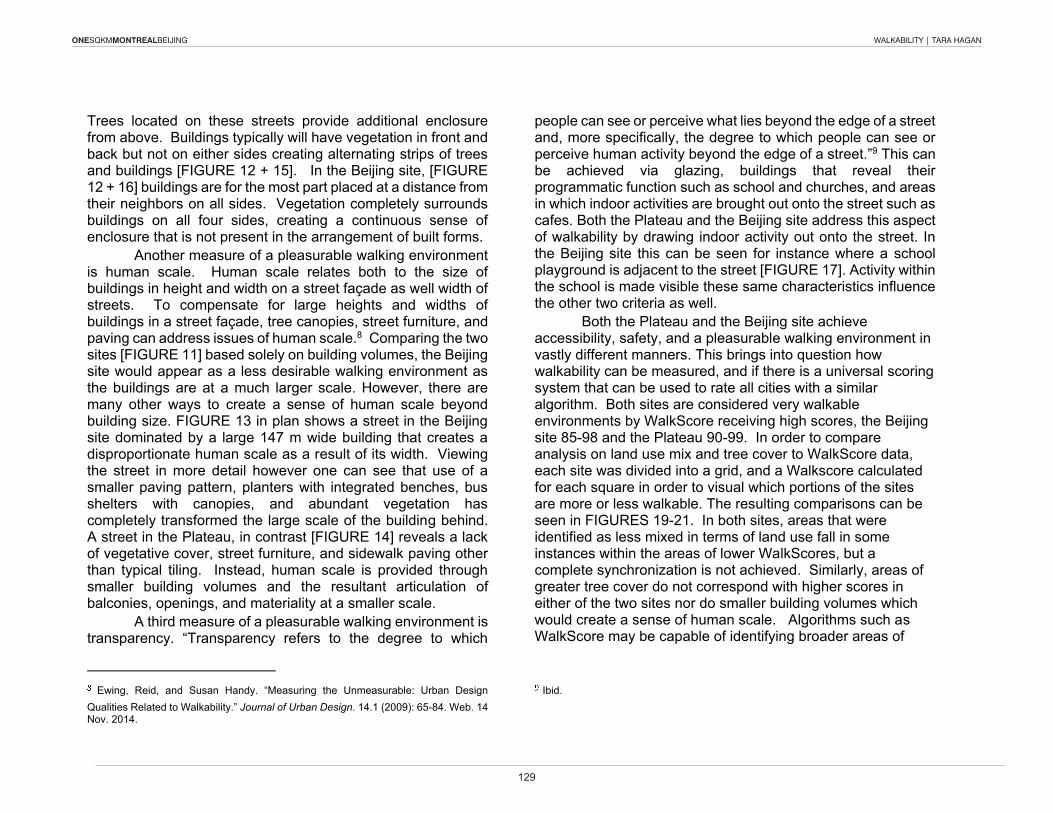
129
ONESQKMMONTREALBEIJING
Trees located on these streets provide additional enclosure from above. Buildings typically will have vegetation in front and back but not on either sides creating alternating strips of trees and buildings [FIGURE 12 + 15]. In the Beijing site, [FIGURE 12 + 16] buildings are for the most part placed at a distance from their neighbors on all sides. Vegetation completely surrounds buildings on all four sides, creating a continuous sense of enclosure that is not present in the arrangement of built forms. Another measure of a pleasurable walking environment is human scale. Human scale relates both to the size of buildings in height and width on a street façade as well width of streets. To compensate for large heights and widths of buildings in a street façade, tree canopies, street furniture, and paving can address issues of human scale.8 Comparing the two sites [FIGURE 11] based solely on building volumes, the Beijing site would appear as a less desirable walking environment as the buildings are at a much larger scale. However, there are many other ways to create a sense of human scale beyond building size. FIGURE 13 in plan shows a street in the Beijing site dominated by a large 147 m wide building that creates a disproportionate human scale as a result of its width. Viewing the street in more detail however one can see that use of a smaller paving pattern, planters with integrated benches, bus shelters with canopies, and abundant vegetation has completely transformed the large scale of the building behind. A street in the Plateau, in contrast [FIGURE 14] reveals a lack of vegetative cover, street furniture, and sidewalk paving other than typical tiling. Instead, human scale is provided through smaller building volumes and the resultant articulation of balconies, openings, and materiality at a smaller scale. A third measure of a pleasurable walking environment is transparency. “Transparency refers to the degree to which
Ewing, Reid, and Susan Handy. “Measuring the Unmeasurable: Urban Design
Qualities Related to Walkability.” Journal of Urban Design. 14.1 (2009): 65-84. Web. 14 Nov. 2014.
people can see or perceive what lies beyond the edge of a street and, more specifically, the degree to which people can see or perceive human activity beyond the edge of a street.”9 This can be achieved via glazing, buildings that reveal their programmatic function such as school and churches, and areas in which indoor activities are brought out onto the street such as cafes. Both the Plateau and the Beijing site address this aspect of walkability by drawing indoor activity out onto the street. In the Beijing site this can be seen for instance where a school playground is adjacent to the street [FIGURE 17]. Activity within the school is made visible these same characteristics influence the other two criteria as well. Both the Plateau and the Beijing site achieve accessibility, safety, and a pleasurable walking environment in vastly different manners. This brings into question how walkability can be measured, and if there is a universal scoring system that can be used to rate all cities with a similar algorithm. Both sites are considered very walkable environments by WalkScore receiving high scores, the Beijing site 85-98 and the Plateau 90-99. In order to compare analysis on land use mix and tree cover to WalkScore data, each site was divided into a grid, and a Walkscore calculated for each square in order to visual which portions of the sites are more or less walkable. The resulting comparisons can be seen in FIGURES 19-21. In both sites, areas that were identified as less mixed in terms of land use fall in some instances within the areas of lower WalkScores, but a complete synchronization is not achieved. Similarly, areas of greater tree cover do not correspond with higher scores in either of the two sites nor do smaller building volumes which would create a sense of human scale. Algorithms such as WalkScore may be capable of identifying broader areas of
Ibid.
WALKABILITY | TARA HAGAN
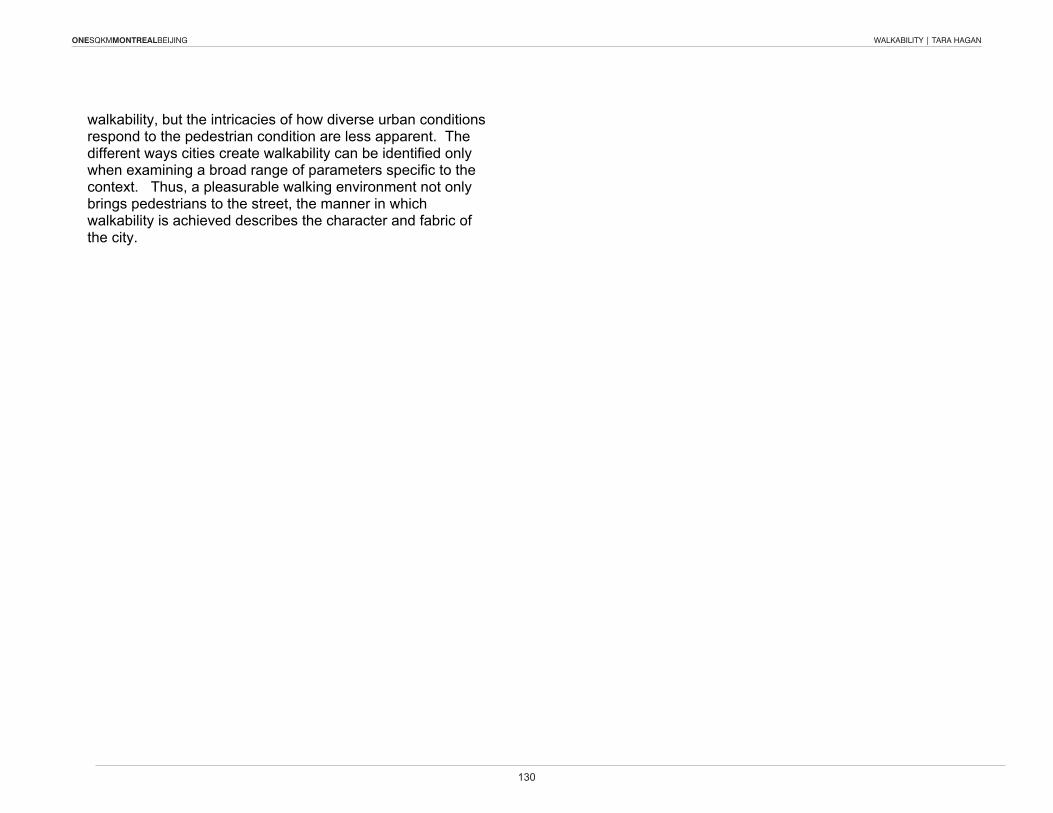
130
ONESQKMMONTREALBEIJING
97
96
91
90
91
9392
91
95
95
92
92
969291
94
91
96
87
92
9292
91
88
90
89
89
8888
91
87
92
91
91
9392
93
91
93
87
89
9289
87
89
94
94
94
9595
95
97
97
87
90
9092
96
85
91
92
85
8797
97
97
97
96
97
9692
97
95
97
95
87
97
97
98
97
96
97
95
99
97
95
93
91
98
96
94
92
90
97
97
97
95
99
99
95 95
99
93
98
95
91 90 95 97
989695
98
97 97
97
9998
999999
9999
9597
Fig. 19: Walkscores
Beijing Montreal
WALKABILITY | TARA HAGANONESQKMMONTREALBEIJING
walkability, but the intricacies of how diverse urban conditions respond to the pedestrian condition are less apparent. The different ways cities create walkability can be identified only when examining a broad range of parameters specific to the context. Thus, a pleasurable walking environment not only brings pedestrians to the street, the manner in which walkability is achieved describes the character and fabric of the city.
WALKABILITY | TARA HAGAN
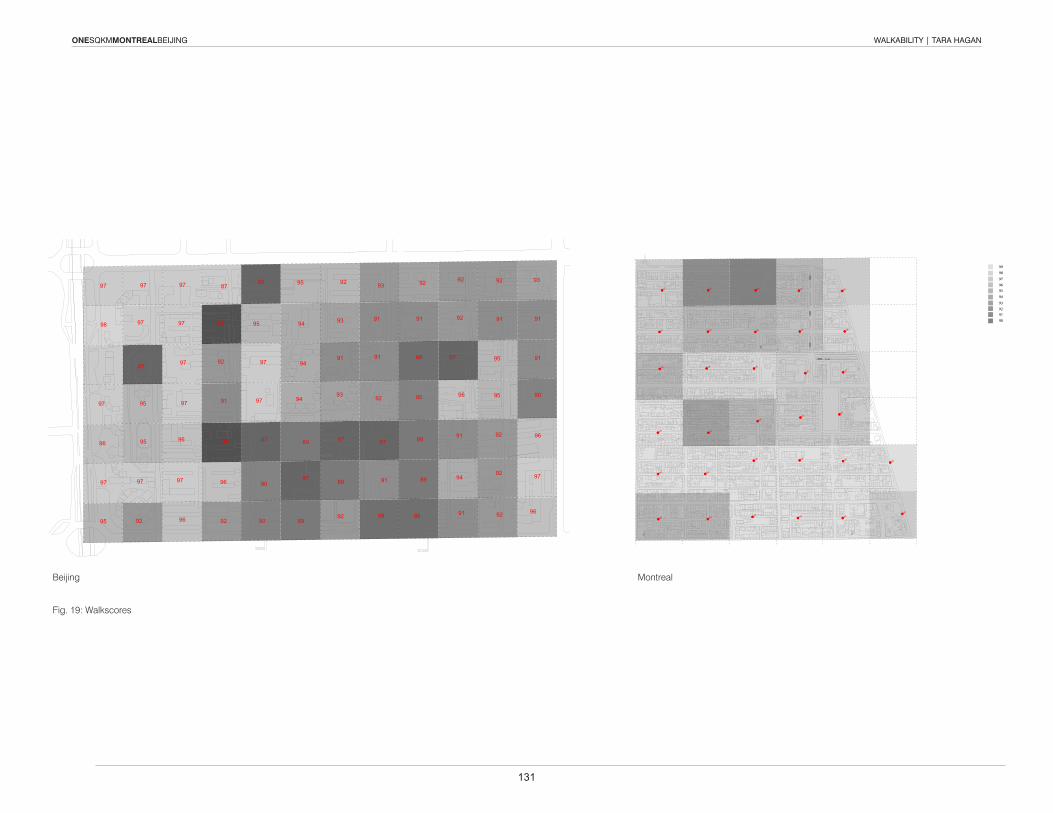
131
ONESQKMMONTREALBEIJING
97
96
91
90
91
9392
91
95
95
92
92
969291
94
91
96
87
92
9292
91
88
90
89
89
8888
91
87
92
91
91
9392
93
91
93
87
89
9289
87
89
94
94
94
9595
95
97
97
87
90
9092
96
85
91
92
85
8797
97
97
97
96
97
9692
97
95
97
95
87
97
97
98
97
96
97
95
99
97
95
93
91
98
96
94
92
90
97
97
97
95
99
99
95 95
99
93
98
95
91 90 95 97
989695
98
97 97
97
9998
999999
9999
9597
Fig. 19: Walkscores
Beijing Montreal
WALKABILITY | TARA HAGAN
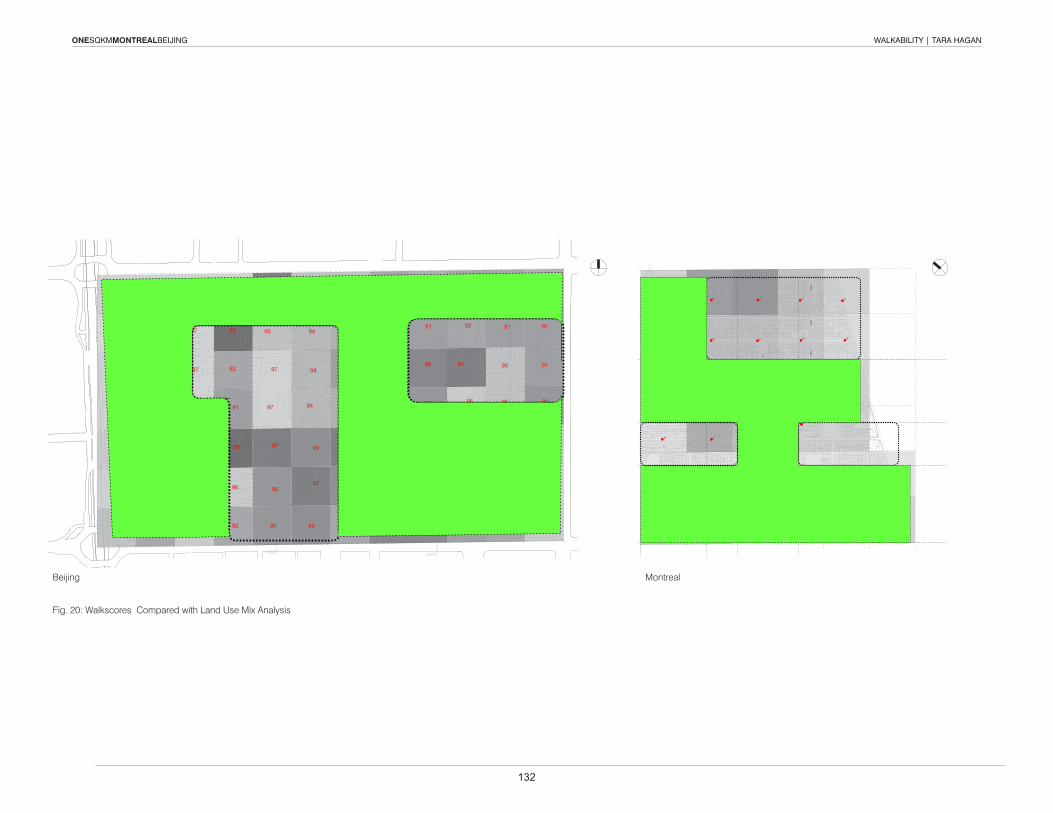
132
ONESQKMMONTREALBEIJING
97
96
91
90
91
9392
91
95
95
92
92
969291
94
91
96
87
92
9292
91
88
90
89
89
8888
91
87
92
91
91
9392
93
91
93
87
89
9289
87
89
94
94
94
9595
95
97
97
87
90
9092
96
85
91
92
85
8797
97
97
97
96
97
9692
97
95
97
95
87
97
97
98
97
96
97
95
97
96
91
90
91
9392
91
95
95
92
92
969291
94
91
96
87
92
9292
91
88
90
89
89
8888
91
87
92
91
91
9392
93
91
93
87
89
9289
87
89
94
94
94
9595
95
97
97
87
90
9092
96
85
91
92
85
8797
97
97
97
96
97
9692
97
95
97
95
87
97
97
98
97
96
97
95
97
97
97
95
99
99
95 95
99
93
98
95
91 90 95 97
989695
98
97 97
97
9998
999999
9999
9597
Fig. 21: Walkscores Compared with Tree Cover
Beijing Montreal
WALKABILITY | TARA HAGANONESQKMMONTREALBEIJING
Fig. 20: Walkscores Compared with Land Use Mix Analysis
Beijing Montreal
97
96
91
90
91
9392
91
95
95
92
92
969291
94
91
96
87
92
9292
91
88
90
89
89
8888
91
87
92
91
91
9392
93
91
93
87
89
9289
87
89
94
94
94
9595
95
97
97
87
90
9092
96
85
91
92
85
8797
97
97
97
96
97
9692
97
95
97
95
87
97
97
98
97
96
97
95
SCHOOL
HOSPITAL
GREEN SPACE
RESTAURANT
RETAIL
RESID./ COMMER.
OFFICE/ COMMER.
OFFICE
RESIDENTIAL
OTHER
MORE LAND USE MIX
LESS LAND USE MIX
97
97
97
95
99
99
95 95
99
93
98
95
91 90 95 97
989695
98
97 97
97
9998
999999
9999
9597
SCHOOL
HOSPITAL
CORNER STORE
RESTAURANT
RETAIL
RELIGIOUS
GOVERNMENT
OFFICE
RESIDENTIAL
OTHER
WALKABILITY | TARA HAGAN
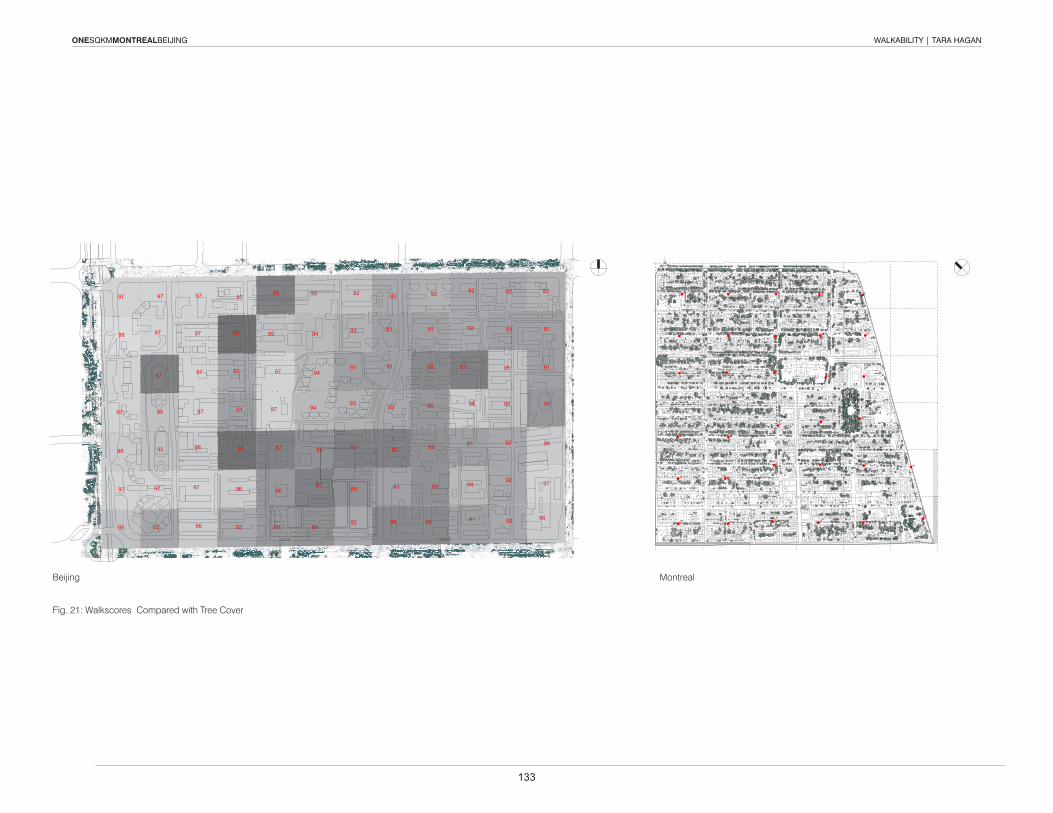
133
ONESQKMMONTREALBEIJING
97
96
91
90
91
9392
91
95
95
92
92
969291
94
91
96
87
92
9292
91
88
90
89
89
8888
91
87
92
91
91
9392
93
91
93
87
89
9289
87
89
94
94
94
9595
95
97
97
87
90
9092
96
85
91
92
85
8797
97
97
97
96
97
9692
97
95
97
95
87
97
97
98
97
96
97
95
97
96
91
90
91
9392
91
95
95
92
92
969291
94
91
96
87
92
9292
91
88
90
89
89
8888
91
87
92
91
91
9392
93
91
93
87
89
9289
87
89
94
94
94
9595
95
97
97
87
90
9092
96
85
91
92
85
8797
97
97
97
96
97
9692
97
95
97
95
87
97
97
98
97
96
97
95
97
97
97
95
99
99
95 95
99
93
98
95
91 90 95 97
989695
98
97 97
97
9998
999999
9999
9597
Fig. 21: Walkscores Compared with Tree Cover
Beijing Montreal
WALKABILITY | TARA HAGAN
134
ONESQKMMONTREALBEIJING
SOURCES Alexander, C., Ishikawa, S. & Silverstein, M. A Pattern Language – Towns Buildings Construction, 106. Alfonso, Mariela A. “To Walk or Not to Walk? The Hierarchy of Walking Needs,” 808- 836. Ewing, Reid, and Susan Handy. “Measuring the Unmeasurable: Urban Design Qualities Related to Walkability,” 65-84. Hall, Richard A. “HPE’s Walkability Index – Quantifying the Pedestrian Experience,” www.hpe-inc.com/walkability-index.html. Leslie, Eva et al. “Walkability of local communities: Using Geographic information systems to objectively assess relevant environmental attributes,” 111-122. “Walk Score,” http://www.walkscore.com. The University of British Columbia Health & Community Design Lab. “Walkability Index,” http://health-design.spph.ubc.ca/tools/walkability-index/. Washington State Department of Health. “Enhance the safety and perceived safety of communities to improve walkability and bikeability,” http://depts.washington.edu/waaction/plan/pa3/rec_c.html.
WALKABILITY | TARA HAGAN

about DEVELOPMENT PATTERN AND ECONOMYnaomi TREMBLAY patrick ZHANG
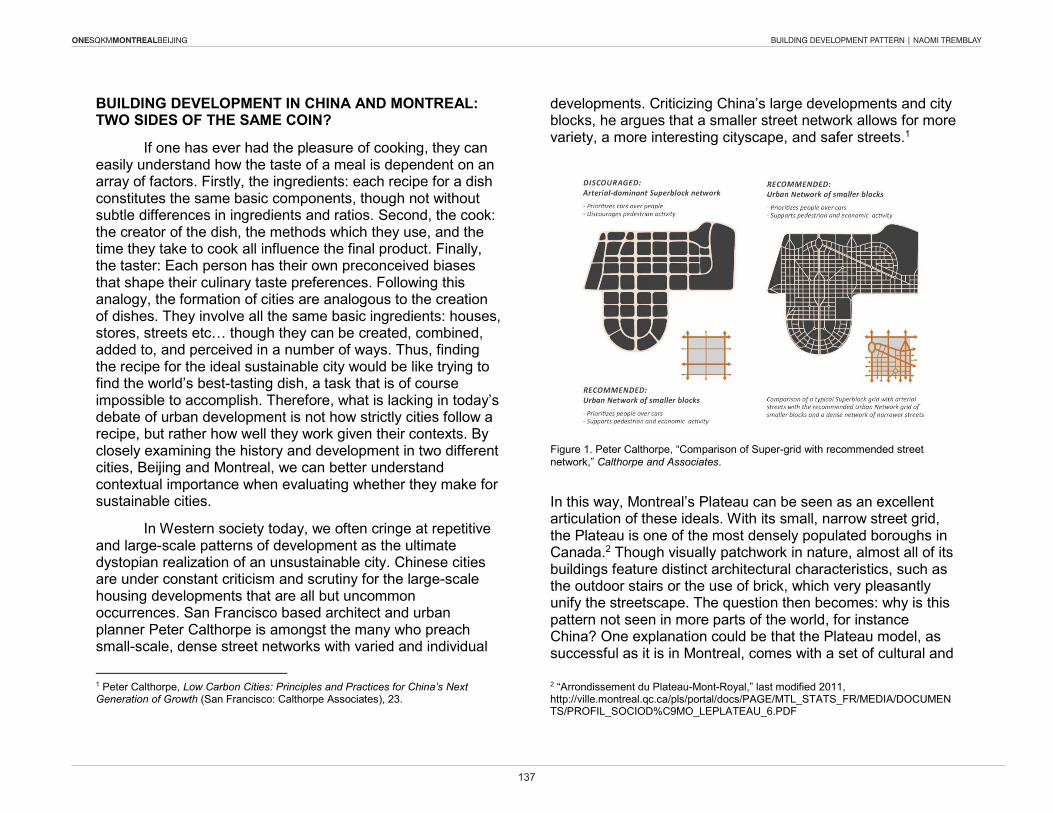
ONESQKMMONTREALBEIJING BUILDING DEVELOPMENT PATTERN | NAOMI TREMBLAY
137
BUILDING DEVELOPMENT IN CHINA AND MONTREAL: TWO SIDES OF THE SAME COIN?
If one has ever had the pleasure of cooking, they can easily understand how the taste of a meal is dependent on an array of factors. Firstly, the ingredients: each recipe for a dish constitutes the same basic components, though not without subtle differences in ingredients and ratios. Second, the cook: the creator of the dish, the methods which they use, and the time they take to cook all influence the final product. Finally, the taster: Each person has their own preconceived biases that shape their culinary taste preferences. Following this analogy, the formation of cities are analogous to the creation of dishes. They involve all the same basic ingredients: houses, stores, streets etc… though they can be created, combined, added to, and perceived in a number of ways. Thus, finding the recipe for the ideal sustainable city would be like trying to find the world’s best-tasting dish, a task that is of course impossible to accomplish. Therefore, what is lacking in today’s debate of urban development is not how strictly cities follow a recipe, but rather how well they work given their contexts. By closely examining the history and development in two different cities, Beijing and Montreal, we can better understand contextual importance when evaluating whether they make for sustainable cities.
In western society today, we often cringe at repetitive and large-scale patterns of development as the ultimate dystopian realization of an unsustainable city. Chinese cities are under constant criticism and scrutiny for the large-scale housing developments that are all but uncommon occurrences. San Francisco based architect and urban planner Peter Calthorpe is amongst the many who preach small-scale, dense street networks with varied and individual
1 Peter Calthorpe, Low Carbon Cities: Principles and Practices for China’s Next Generation of Growth (San Francisco: Calthorpe Associates), 23.
developments. Criticizing China’s large developments and city blocks, he argues that a smaller street network allows for more variety, a more interesting cityscape, and safer streets.1
In this way, Montreal’s Plateau can be seen as an excellent articulation of these ideals. with its small, narrow street grid, the Plateau is one of the most densely populated boroughs in Canada.2 Though visually patchwork in nature, almost all of its buildings feature distinct architectural characteristics, such as the outdoor stairs or the use of brick, which very pleasantly unify the streetscape. The question then becomes: why is this pattern not seen in more parts of the world, for instance China? One explanation could be that the Plateau model, as successful as it is in Montreal, comes with a set of cultural and
2 “Arrondissement du Plateau-Mont-Royal,” last modified 2011, http://ville.montreal.qc.ca/pls/portal/docs/PAGE/MTL_STATS_FR/MEDIA/DOCUMENTS/PROFIL_SOCIOD%C9MO_LEPLATEAU_6.PDF
Figure 1. Peter Calthorpe, “Comparison of Super-grid with recommended street network,” Calthorpe and Associates.
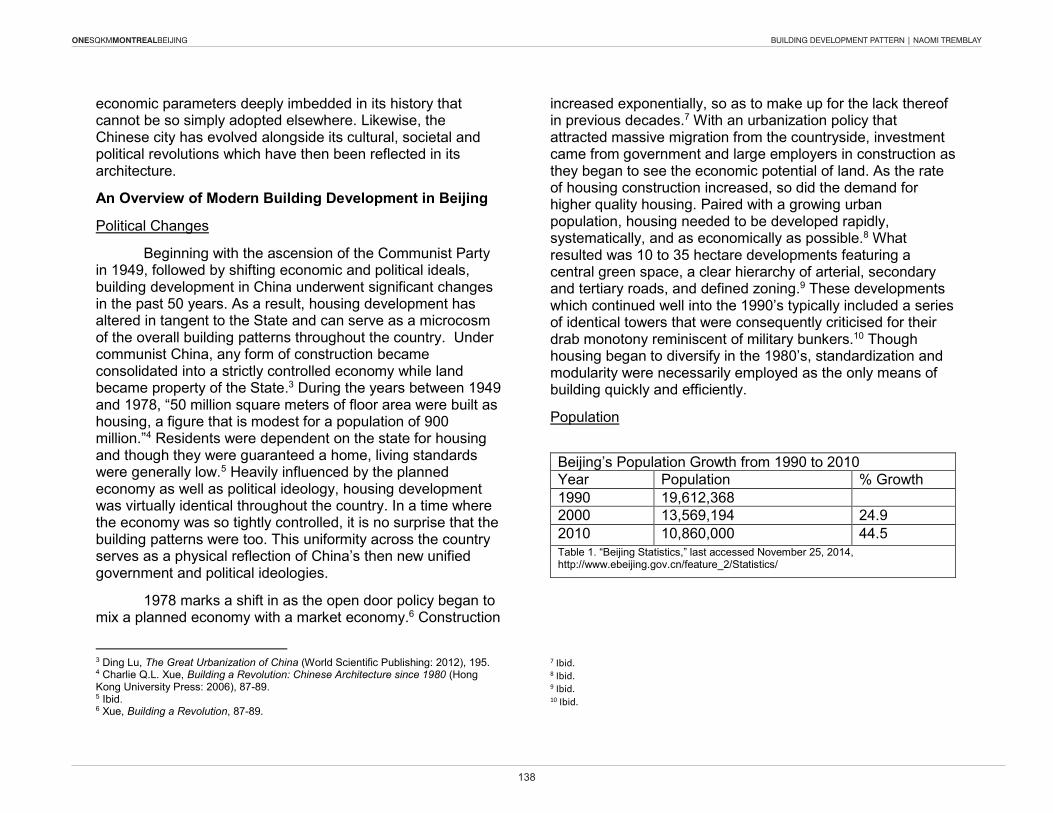
ONESQKMMONTREALBEIJING BUILDING DEVELOPMENT PATTERN | NAOMI TREMBLAY
138
economic parameters deeply imbedded in its history that cannot be so simply adopted elsewhere. Likewise, the Chinese city has evolved alongside its cultural, societal and political revolutions which have then been reflected in its architecture.
An Overview of Modern Building Development in Beijing
Political Changes
Beginning with the ascension of the Communist Party in 1949, followed by shifting economic and political ideals, building development in China underwent significant changes in the past 50 years. As a result, housing development has altered in tangent to the State and can serve as a microcosm of the overall building patterns throughout the country. Under communist China, any form of construction became consolidated into a strictly controlled economy while land became property of the State.3 During the years between 1949 and 1978, “50 million square meters of floor area were built as housing, a figure that is modest for a population of 900 million.”4 Residents were dependent on the state for housing and though they were guaranteed a home, living standards were generally low.5 Heavily influenced by the planned economy as well as political ideology, housing development was virtually identical throughout the country. In a time where the economy was so tightly controlled, it is no surprise that the building patterns were too. This uniformity across the country serves as a physical reflection of China’s then new unified government and political ideologies.
1978 marks a shift in as the open door policy began to mix a planned economy with a market economy.6 Construction
3 Ding Lu, The Great Urbanization of China (world Scientific Publishing: 2012), 195. 4 Charlie Q.L. xue, Building a Revolution: Chinese Architecture since 1980 (Hong Kong University Press: 2006), 87-89. 5 Ibid. 6 xue, Building a Revolution, 87-89.
increased exponentially, so as to make up for the lack thereof in previous decades.7 with an urbanization policy that attracted massive migration from the countryside, investment came from government and large employers in construction as they began to see the economic potential of land. As the rate of housing construction increased, so did the demand for higher quality housing. Paired with a growing urban population, housing needed to be developed rapidly, systematically, and as economically as possible.8 what resulted was 10 to 35 hectare developments featuring a central green space, a clear hierarchy of arterial, secondary and tertiary roads, and defined zoning.9 These developments which continued well into the 1990’s typically included a series of identical towers that were consequently criticised for their drab monotony reminiscent of military bunkers.10 Though housing began to diversify in the 1980’s, standardization and modularity were necessarily employed as the only means of building quickly and efficiently.
Population
Beijing’s Population Growth from 1990 to 2010 Year Population % Growth 1990 19,612,368 2000 13,569,194 24.9 2010 10,860,000 44.5 Table 1. “Beijing Statistics,” last accessed November 25, 2014, http://www.ebeijing.gov.cn/feature_2/Statistics/
7 Ibid. 8 Ibid. 9 Ibid. 10 Ibid.
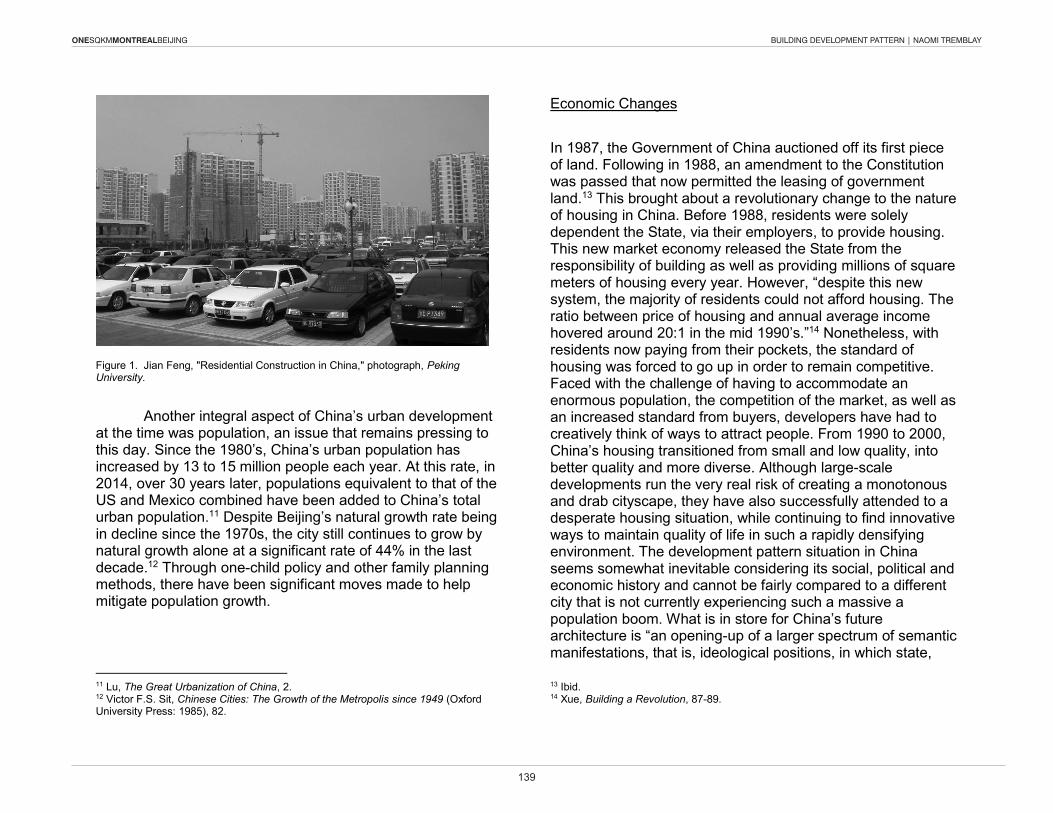
ONESQKMMONTREALBEIJING BUILDING DEVELOPMENT PATTERN | NAOMI TREMBLAY
139
Another integral aspect of China’s urban development at the time was population, an issue that remains pressing to this day. Since the 1980’s, China’s urban population has increased by 13 to 15 million people each year. At this rate, in 2014, over 30 years later, populations equivalent to that of the US and Mexico combined have been added to China’s total urban population.11 Despite Beijing’s natural growth rate being in decline since the 1970s, the city still continues to grow by natural growth alone at a significant rate of 44% in the last decade.12 Through one-child policy and other family planning methods, there have been significant moves made to help mitigate population growth.
11 Lu, The Great Urbanization of China, 2. 12 victor F.S. Sit, Chinese Cities: The Growth of the Metropolis since 1949 (Oxford University Press: 1985), 82.
Economic Changes
In 1987, the Government of China auctioned off its first piece of land. Following in 1988, an amendment to the Constitution was passed that now permitted the leasing of government land.13 This brought about a revolutionary change to the nature of housing in China. Before 1988, residents were solely dependent the State, via their employers, to provide housing. This new market economy released the State from the responsibility of building as well as providing millions of square meters of housing every year. However, “despite this new system, the majority of residents could not afford housing. The ratio between price of housing and annual average income hovered around 20:1 in the mid 1990’s.”14 Nonetheless, with residents now paying from their pockets, the standard of housing was forced to go up in order to remain competitive. Faced with the challenge of having to accommodate an enormous population, the competition of the market, as well as an increased standard from buyers, developers have had to creatively think of ways to attract people. From 1990 to 2000, China’s housing transitioned from small and low quality, into better quality and more diverse. Although large-scale developments run the very real risk of creating a monotonous and drab cityscape, they have also successfully attended to a desperate housing situation, while continuing to find innovative ways to maintain quality of life in such a rapidly densifying environment. The development pattern situation in China seems somewhat inevitable considering its social, political and economic history and cannot be fairly compared to a different city that is not currently experiencing such a massive a population boom. What is in store for China’s future architecture is “an opening-up of a larger spectrum of semantic manifestations, that is, ideological positions, in which state,
13 Ibid. 14 xue, Building a Revolution, 87-89.
Figure 1. Jian Feng, "Residential Construction in China," photograph, Peking University.
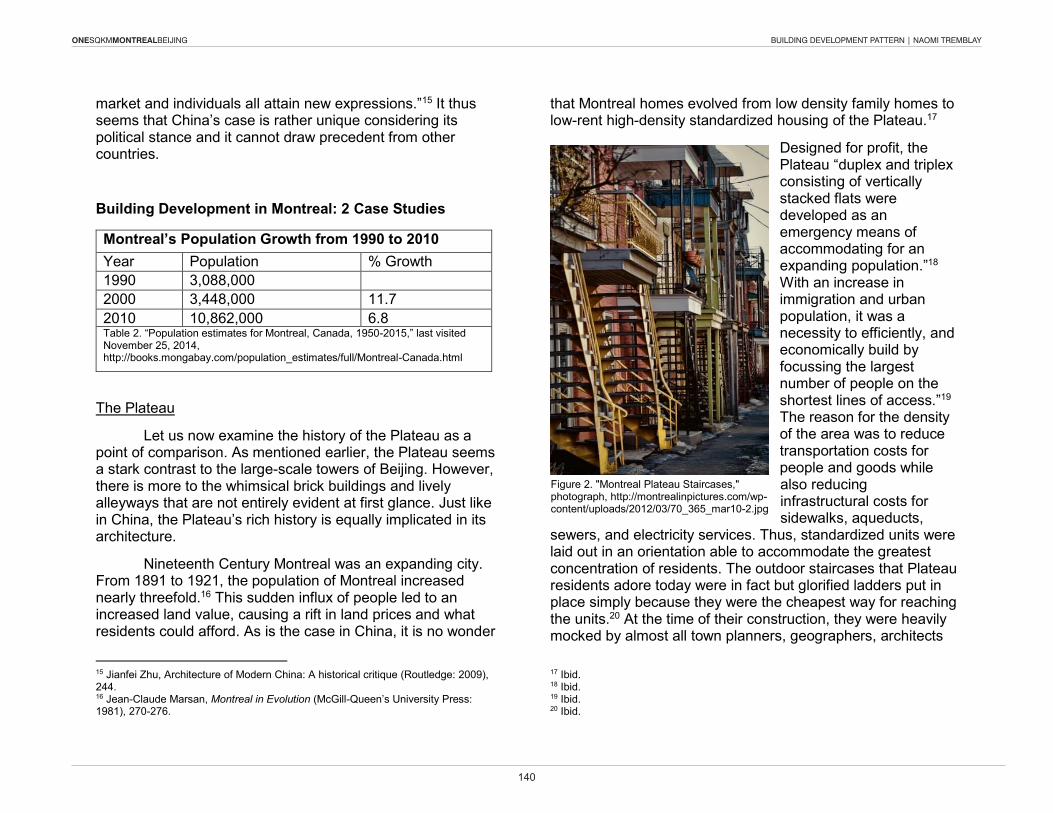
ONESQKMMONTREALBEIJING BUILDING DEVELOPMENT PATTERN | NAOMI TREMBLAY
140
market and individuals all attain new expressions.”15 It thus seems that China’s case is rather unique considering its political stance and it cannot draw precedent from other countries.
Building Development in Montreal: 2 Case Studies
The Plateau
Let us now examine the history of the Plateau as a point of comparison. As mentioned earlier, the Plateau seems a stark contrast to the large-scale towers of Beijing. However, there is more to the whimsical brick buildings and lively alleyways that are not entirely evident at first glance. Just like in China, the Plateau’s rich history is equally implicated in its architecture.
Nineteenth Century Montreal was an expanding city. From 1891 to 1921, the population of Montreal increased nearly threefold.16 This sudden influx of people led to an increased land value, causing a rift in land prices and what residents could afford. As is the case in China, it is no wonder
15 Jianfei zhu, Architecture of Modern China: A historical critique (Routledge: 2009), 244. 16 Jean-Claude Marsan, Montreal in Evolution (McGill-Queen’s University Press: 1981), 270-276.
that Montreal homes evolved from low density family homes to low-rent high-density standardized housing of the Plateau.17
Designed for profit, the Plateau “duplex and triplex consisting of vertically stacked flats were developed as an emergency means of accommodating for an expanding population.”18 with an increase in immigration and urban population, it was a necessity to efficiently, and economically build by focussing the largest number of people on the shortest lines of access.”19 The reason for the density of the area was to reduce transportation costs for people and goods while also reducing infrastructural costs for sidewalks, aqueducts,
sewers, and electricity services. Thus, standardized units were laid out in an orientation able to accommodate the greatest concentration of residents. The outdoor staircases that Plateau residents adore today were in fact but glorified ladders put in place simply because they were the cheapest way for reaching the units.20 At the time of their construction, they were heavily mocked by almost all town planners, geographers, architects
17 Ibid. 18 Ibid. 19 Ibid. 20 Ibid.
Montreal’s Population Growth from 1990 to 2010 Year Population % Growth 1990 3,088,000 2000 3,448,000 11.7 2010 10,862,000 6.8 Table 2. “Population estimates for Montreal, Canada, 1950-2015,” last visited November 25, 2014, http://books.mongabay.com/population_estimates/full/Montreal-Canada.html
Figure 2. "Montreal Plateau Staircases," photograph, http://montrealinpictures.com/wp-content/uploads/2012/03/70_365_mar10-2.jpg
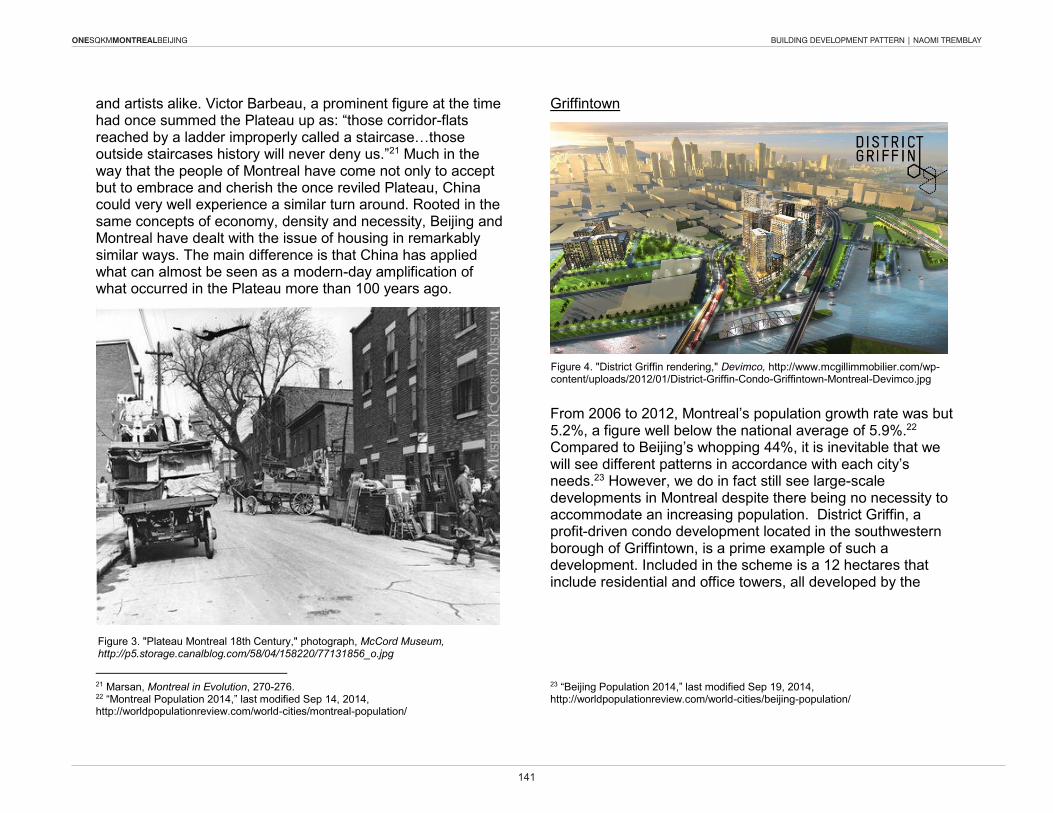
ONESQKMMONTREALBEIJING BUILDING DEVELOPMENT PATTERN | NAOMI TREMBLAY
141
and artists alike. victor Barbeau, a prominent figure at the time had once summed the Plateau up as: “those corridor-flats reached by a ladder improperly called a staircase…those outside staircases history will never deny us.”21 Much in the way that the people of Montreal have come not only to accept but to embrace and cherish the once reviled Plateau, China could very well experience a similar turn around. Rooted in the same concepts of economy, density and necessity, Beijing and Montreal have dealt with the issue of housing in remarkably similar ways. The main difference is that China has applied what can almost be seen as a modern-day amplification of what occurred in the Plateau more than 100 years ago.
21 Marsan, Montreal in Evolution, 270-276. 22 “Montreal Population 2014,” last modified Sep 14, 2014, http://worldpopulationreview.com/world-cities/montreal-population/
Griffintown
From 2006 to 2012, Montreal’s population growth rate was but 5.2%, a figure well below the national average of 5.9%.22 Compared to Beijing’s whopping 44%, it is inevitable that we will see different patterns in accordance with each city’s needs.23 However, we do in fact still see large-scale developments in Montreal despite there being no necessity to accommodate an increasing population. District Griffin, a profit-driven condo development located in the southwestern borough of Griffintown, is a prime example of such a development. Included in the scheme is a 12 hectares that include residential and office towers, all developed by the
23 “Beijing Population 2014,” last modified Sep 19, 2014, http://worldpopulationreview.com/world-cities/beijing-population/
Figure 3. "Plateau Montreal 18th Century," photograph, McCord Museum, http://p5.storage.canalblog.com/58/04/158220/77131856_o.jpg
Figure 4. "District Griffin rendering," Devimco, http://www.mcgillimmobilier.com/wp-content/uploads/2012/01/District-Griffin-Condo-Griffintown-Montreal-Devimco.jpg
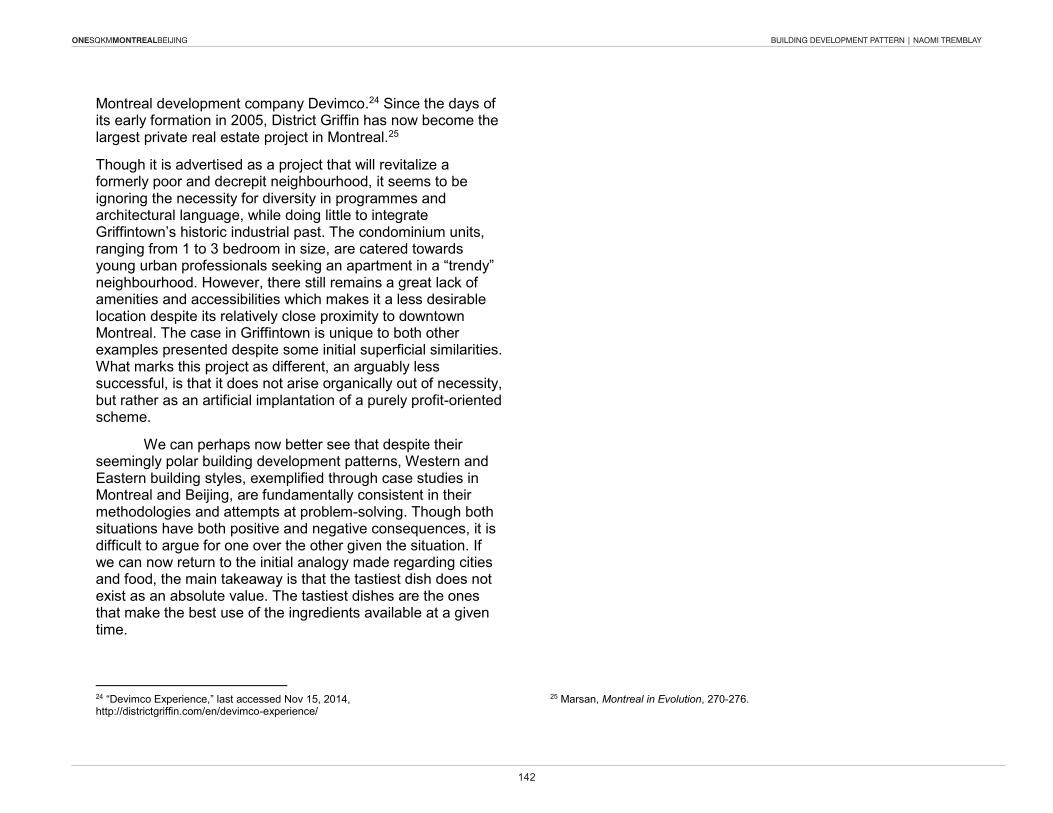
ONESQKMMONTREALBEIJING BUILDING DEVELOPMENT PATTERN | NAOMI TREMBLAY
142
Montreal development company Devimco.24 Since the days of its early formation in 2005, District Griffin has now become the largest private real estate project in Montreal.25
Though it is advertised as a project that will revitalize a formerly poor and decrepit neighbourhood, it seems to be ignoring the necessity for diversity in programmes and architectural language, while doing little to integrate Griffintown’s historic industrial past. The condominium units, ranging from 1 to 3 bedroom in size, are catered towards young urban professionals seeking an apartment in a “trendy” neighbourhood. However, there still remains a great lack of amenities and accessibilities which makes it a less desirable location despite its relatively close proximity to downtown Montreal. The case in Griffintown is unique to both other examples presented despite some initial superficial similarities. what marks this project as different, an arguably less successful, is that it does not arise organically out of necessity, but rather as an artificial implantation of a purely profit-oriented scheme.
we can perhaps now better see that despite their seemingly polar building development patterns, western and Eastern building styles, exemplified through case studies in Montreal and Beijing, are fundamentally consistent in their methodologies and attempts at problem-solving. Though both situations have both positive and negative consequences, it is difficult to argue for one over the other given the situation. If we can now return to the initial analogy made regarding cities and food, the main takeaway is that the tastiest dish does not exist as an absolute value. The tastiest dishes are the ones that make the best use of the ingredients available at a given time.
24 “Devimco Experience,” last accessed Nov 15, 2014, http://districtgriffin.com/en/devimco-experience/
25 Marsan, Montreal in Evolution, 270-276.
ONESQKMMONTREALBEIJING BUILDING DEVELOPMENT PATTERN | NAOMI TREMBLAY
143
References
Calthorpe, Peter. Low Carbon Cities: Principles and Practices for China’s Next Generation of Growth. San Francisco: Calthorpe Associates.
Devimco. “Devimco Experience.” Last accessed Nov 15, 2014. http://districtgriffin.com/en/devimco-experience/ Lu, Ding. The Great Urbanization of China. Singapore: world Scientific Publishing, 2012. Marsan, Jean-Claude. Montreal in Evolution. Montreal: McGill-Queen’s University Press, 1981. Sit, victor F.S. Chinese Cities: The Growth of the Metropolis since 1949. Oxford: Oxford University Press, 1985. Ville de Montreal. “Arrondissement du Plateau-Mont-Royal.” Last modified 2011. http://ville.montreal.qc.ca/pls/portal/docs/PAGE/MTL_STATS_FR/MEDIA/DOCUMENTS/PROFIL_SOCIOD%C9MO_LEPLATEAU_6.PDF
World Population Review. “Montreal Population 2014.” Last modified Sep 14, 2014. http://worldpopulationreview.com/world-cities/montreal-population/
World Population Review. “Beijing Population 2014.” Last modified Sep 19, 2014. http://worldpopulationreview.com/world-cities/beijing-population/ xue, Charlie Q.L. Building a Revolution: Chinese Architecture since 1980. Hong Kong: Hong Kong University Press, 2006.
zhu, Jianfei. Architecture of Modern China: A historical critique. Oxfordshire: Routledge, 2009.

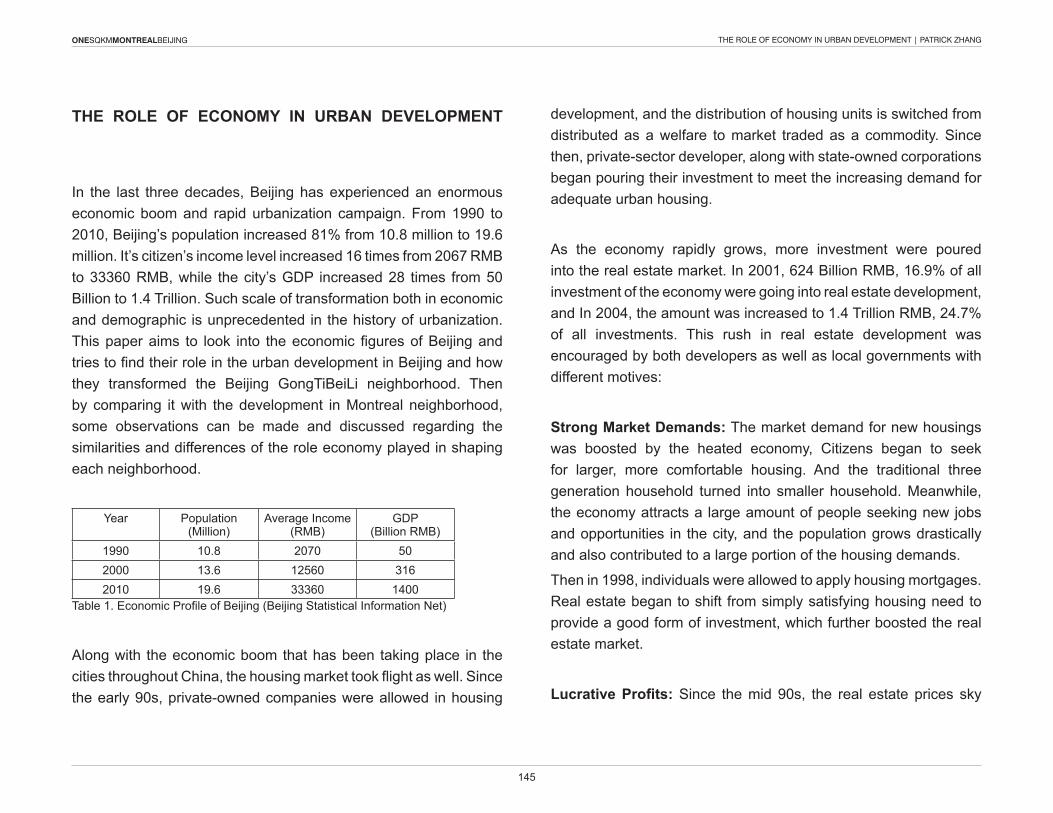
145
ONESQKMMONTREALBEIJING THE ROLE OF ECONOMY IN URBAN DEVELOPMENT | PATRICK ZHANG
The Role of economy in URban DevelopmenT
In the last three decades, Beijing has experienced an enormous economic boom and rapid urbanization campaign. From 1990 to 2010, Beijing’s population increased 81% from 10.8 million to 19.6 million. It’s citizen’s income level increased 16 times from 2067 RMB to 33360 RMB, while the city’s GDP increased 28 times from 50 Billion to 1.4 Trillion. Such scale of transformation both in economic and demographic is unprecedented in the history of urbanization. This paper aims to look into the economic figures of Beijing and tries to find their role in the urban development in Beijing and how they transformed the Beijing GongTiBeiLi neighborhood. Then by comparing it with the development in Montreal neighborhood, some observations can be made and discussed regarding the similarities and differences of the role economy played in shaping each neighborhood.
Year Population (Million)
Average Income (RMB)
GDP(Billion RMB)
1990 10.8 2070 502000 13.6 12560 3162010 19.6 33360 1400
Table 1. Economic Profile of Beijing (Beijing Statistical Information Net)
Along with the economic boom that has been taking place in the cities throughout China, the housing market took flight as well. Since the early 90s, private-owned companies were allowed in housing
development, and the distribution of housing units is switched from distributed as a welfare to market traded as a commodity. Since then, private-sector developer, along with state-owned corporations began pouring their investment to meet the increasing demand for adequate urban housing.
As the economy rapidly grows, more investment were poured into the real estate market. In 2001, 624 Billion RMB, 16.9% of all investment of the economy were going into real estate development, and In 2004, the amount was increased to 1.4 Trillion RMB, 24.7% of all investments. This rush in real estate development was encouraged by both developers as well as local governments with different motives:
Strong market Demands: The market demand for new housings was boosted by the heated economy, Citizens began to seek for larger, more comfortable housing. And the traditional three generation household turned into smaller household. Meanwhile, the economy attracts a large amount of people seeking new jobs and opportunities in the city, and the population grows drastically and also contributed to a large portion of the housing demands.
Then in 1998, individuals were allowed to apply housing mortgages. Real estate began to shift from simply satisfying housing need to provide a good form of investment, which further boosted the real estate market.
Lucrative Profits: Since the mid 90s, the real estate prices sky
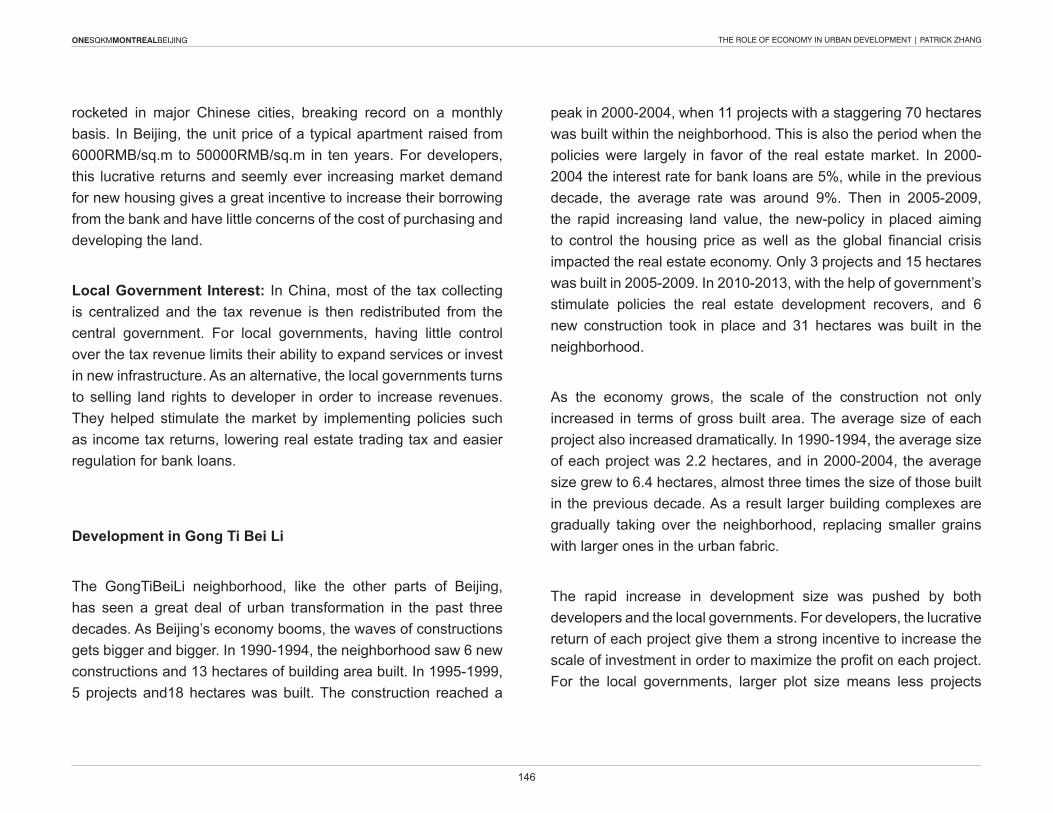
146
ONESQKMMONTREALBEIJING THE ROLE OF ECONOMY IN URBAN DEVELOPMENT | PATRICK ZHANG
1990 1995
Built area in GongTiBeiLi
Interest Rate
Policy In favour of real estate investment
90-9413 Hectares
95-9918 Hectares
00-0470 Hectares
05-0915 Hectares
10-1331 Hectares
2000 2005 2010
70
5%
10%
60
50
40
30
20
10
Built Area (Hectares)
Interest Rate
Policy neutral to real estate investment
Policy to suppress real estate investment
Fig. 1: Development in GongtiBeiLi
to oversee, less need for road infrastructure to be built and thus increase their efficiency in the mass urbanization campaign. FAR restriction is also pushed to a higher limit to stimulate higher bidding price for each land parcel.
This rapid urban transformation brings profound demographic impact to the neighborhood. Before mid 1990, GongTiBeiLi was a working class neighborhood with most residence employee of some state-owned enterprises. As new residential complex gets built, each comes with a higher price tag than the previous ones. Higher income residents start to moving in. Resulting a mixed demographics with a wide range of incomes. The large amount of new residents in those complexes, having little relationship with their new neighbors, also found themselves lost a traditional sense of community. As year goes, however, the bonding between neighbors begin to form, and the sense of community becomes stronger.
Area (hectares) 90-94 95-99 00-04 05-09 10-13
Total Constructed Area 13 18 70 15 31
Average Development Size 2.2 3.7 6.4 5.1 5.2
Table 2. Development In GongTiBeiLi in Five-year Cycles
ONESQKMMONTREALBEIJING THE ROLE OF ECONOMY IN URBAN DEVELOPMENT | PATRICK ZHANG
rocketed in major Chinese cities, breaking record on a monthly basis. In Beijing, the unit price of a typical apartment raised from 6000RMB/sq.m to 50000RMB/sq.m in ten years. For developers, this lucrative returns and seemly ever increasing market demand for new housing gives a great incentive to increase their borrowing from the bank and have little concerns of the cost of purchasing and developing the land.
local Government interest: In China, most of the tax collecting is centralized and the tax revenue is then redistributed from the central government. For local governments, having little control over the tax revenue limits their ability to expand services or invest in new infrastructure. As an alternative, the local governments turns to selling land rights to developer in order to increase revenues. They helped stimulate the market by implementing policies such as income tax returns, lowering real estate trading tax and easier regulation for bank loans.
Development in Gong Ti bei li
The GongTiBeiLi neighborhood, like the other parts of Beijing, has seen a great deal of urban transformation in the past three decades. As Beijing’s economy booms, the waves of constructions gets bigger and bigger. In 1990-1994, the neighborhood saw 6 new constructions and 13 hectares of building area built. In 1995-1999, 5 projects and18 hectares was built. The construction reached a
peak in 2000-2004, when 11 projects with a staggering 70 hectares was built within the neighborhood. This is also the period when the policies were largely in favor of the real estate market. In 2000-2004 the interest rate for bank loans are 5%, while in the previous decade, the average rate was around 9%. Then in 2005-2009, the rapid increasing land value, the new-policy in placed aiming to control the housing price as well as the global financial crisis impacted the real estate economy. Only 3 projects and 15 hectares was built in 2005-2009. In 2010-2013, with the help of government’s stimulate policies the real estate development recovers, and 6 new construction took in place and 31 hectares was built in the neighborhood.
As the economy grows, the scale of the construction not only increased in terms of gross built area. The average size of each project also increased dramatically. In 1990-1994, the average size of each project was 2.2 hectares, and in 2000-2004, the average size grew to 6.4 hectares, almost three times the size of those built in the previous decade. As a result larger building complexes are gradually taking over the neighborhood, replacing smaller grains with larger ones in the urban fabric.
The rapid increase in development size was pushed by both developers and the local governments. For developers, the lucrative return of each project give them a strong incentive to increase the scale of investment in order to maximize the profit on each project. For the local governments, larger plot size means less projects
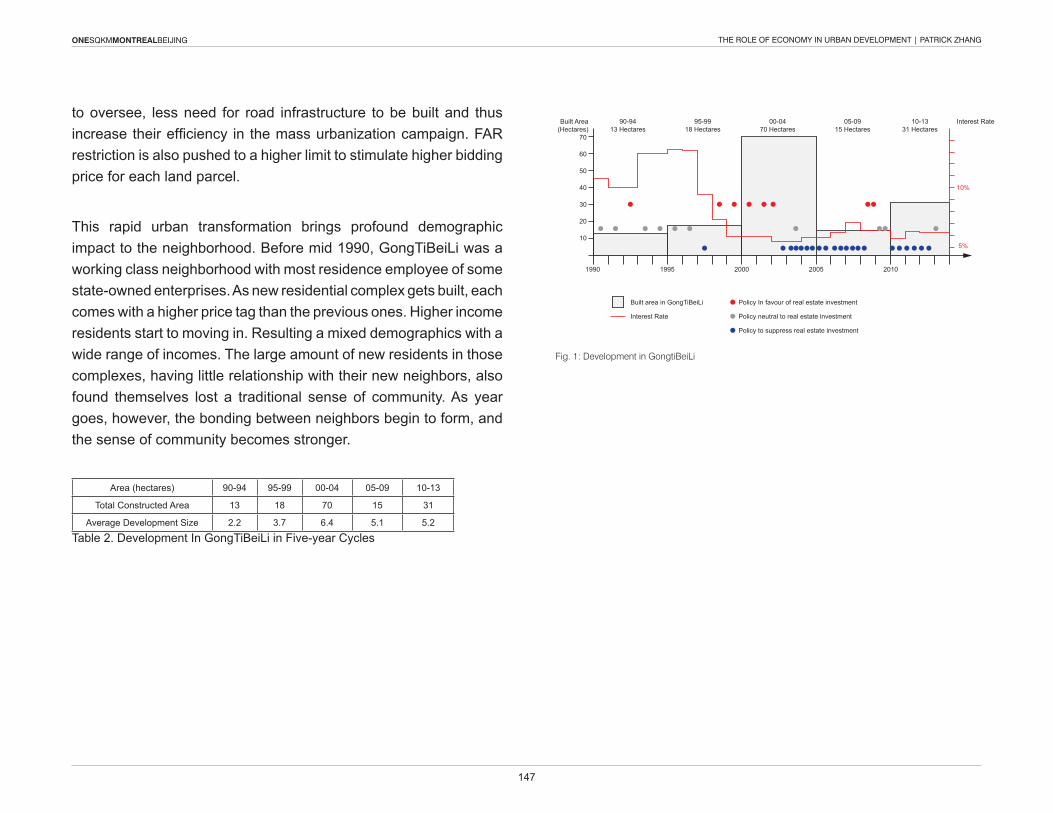
147
ONESQKMMONTREALBEIJING THE ROLE OF ECONOMY IN URBAN DEVELOPMENT | PATRICK ZHANG
1990 1995
Built area in GongTiBeiLi
Interest Rate
Policy In favour of real estate investment
90-9413 Hectares
95-9918 Hectares
00-0470 Hectares
05-0915 Hectares
10-1331 Hectares
2000 2005 2010
70
5%
10%
60
50
40
30
20
10
Built Area (Hectares)
Interest Rate
Policy neutral to real estate investment
Policy to suppress real estate investment
Fig. 1: Development in GongtiBeiLi
to oversee, less need for road infrastructure to be built and thus increase their efficiency in the mass urbanization campaign. FAR restriction is also pushed to a higher limit to stimulate higher bidding price for each land parcel.
This rapid urban transformation brings profound demographic impact to the neighborhood. Before mid 1990, GongTiBeiLi was a working class neighborhood with most residence employee of some state-owned enterprises. As new residential complex gets built, each comes with a higher price tag than the previous ones. Higher income residents start to moving in. Resulting a mixed demographics with a wide range of incomes. The large amount of new residents in those complexes, having little relationship with their new neighbors, also found themselves lost a traditional sense of community. As year goes, however, the bonding between neighbors begin to form, and the sense of community becomes stronger.
Area (hectares) 90-94 95-99 00-04 05-09 10-13
Total Constructed Area 13 18 70 15 31
Average Development Size 2.2 3.7 6.4 5.1 5.2
Table 2. Development In GongTiBeiLi in Five-year Cycles
148
ONESQKMMONTREALBEIJING THE ROLE OF ECONOMY IN URBAN DEVELOPMENT | PATRICK ZHANG
Development in plateau
The Plateau district in Montreal, in contrast, had a much slower development in the last 3 decade. The district’s population, has maintained a stable level of 100,000 since 1991. Although the total population remains stable, the neighborhood is experiencing a gentrification. A younger generation of residents, mostly from the cultural and financial industries is slowly replacing the traditional blue-collar community and post-war immigrant community. However the process of gentrification is slow and the economic change of the neighborhood is small, result in little new housing projects to be built in the neighborhood in recent years. The slow gentrification process also means that the sense of community is largely kept intact by the gentle flowing in of the people.
Year Population (Thousand)
Average Income (CAD)
1991 100.4 235002001 101.4 292902011 100.4 37044
Table 3. Economic Profile of Plateau (Montreal City Portal)
In the late 19th century, Plateau has seen its own period of massive construction. The neighborhood is widely zoned, and then built by individual companies in small scale. The scale of the development was limited by the economic scale and productivity of that time: the size of financing is relatively limited, the construction on site is more labor intensive and the construction supply chain was not yet fully
industrialized and standardized.
In the post-war era, the focus of urbanization and development was shifted to the suburbs, marking the beginning a fully industrialized housing market. Consumerism economics provide affluent financing to the developer, the standardized timber frame construction allows an unprecedented high-productivity for constructing low-rise buildings. As a result, a single developer was able to develop a huge parcel of land in low-density within a short period of time, while easily securing a fund for developing in a large scale.
In recent years, Montreal’s Griffintown neighborhood, a former industrial site just to the south of downtown, became the next target site for massive development scheme. This time, fueled by post financial crisis stimulus policy (Canadian interest rate dropped from 2008’s 4% to 0.5% in 2009 ), as well as high housing value expectancy, the scale of development was unprecedented in Montreal. A handful of Montreal’s biggest developers, was able to secure a large site for themselves to develop high rise condos complex which will be built in 3 or 4 phases.
By comparing the three different era of mass development that took place in Montreal, it is not difficult to find out that as the economy grows, money supply gets easier and productivity increases, the scale of individual housing project expands accordingly. The development size is more controlled by the hands of the market, than the hands of urban planners. Fig.2 shows how the 2008 financial crisis hit the real estate construction in Canada, and how the stimulus
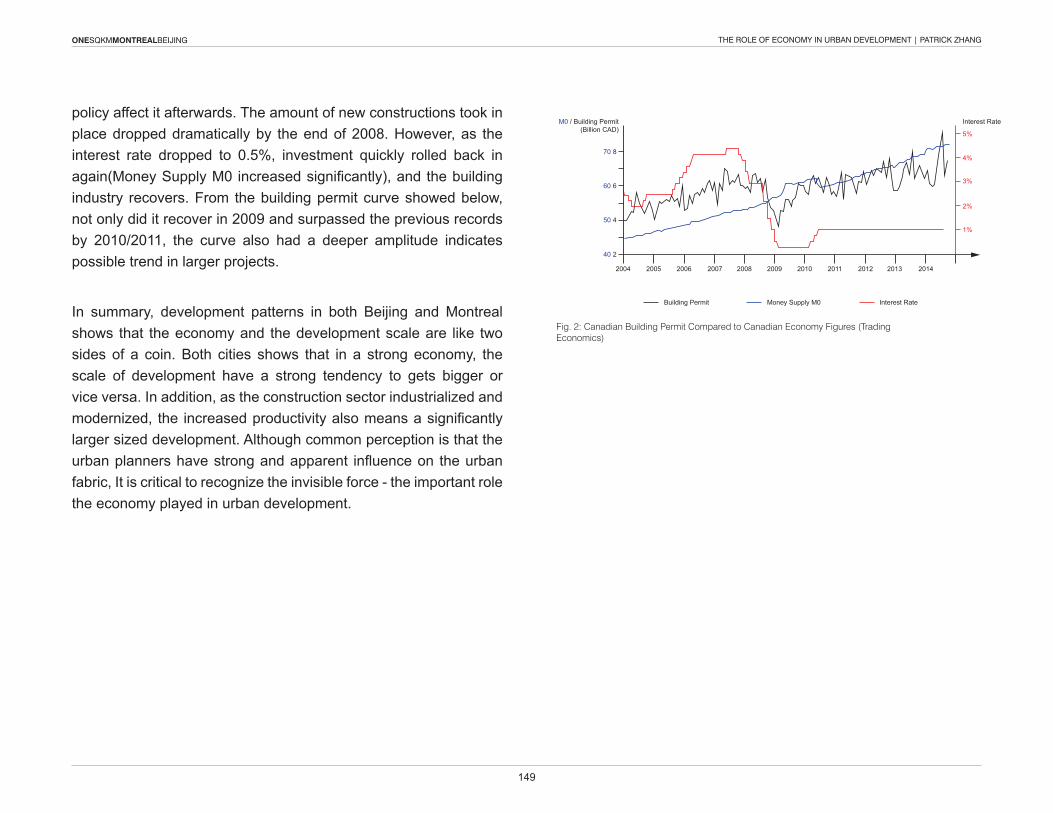
149
ONESQKMMONTREALBEIJING THE ROLE OF ECONOMY IN URBAN DEVELOPMENT | PATRICK ZHANG
Fig. 2: Canadian Building Permit Compared to Canadian Economy Figures (Trading Economics)
Interest Rate
2004 2005 2006 2007
Building Permit
2008 2009 2010 2011 2012 2013 2014
4%
5%
3%
2%
1%
8
6
4
240
50
60
70
M0 / Building Permit(Billion CAD)
Money Supply M0 Interest Rate
policy affect it afterwards. The amount of new constructions took in place dropped dramatically by the end of 2008. However, as the interest rate dropped to 0.5%, investment quickly rolled back in again(Money Supply M0 increased significantly), and the building industry recovers. From the building permit curve showed below, not only did it recover in 2009 and surpassed the previous records by 2010/2011, the curve also had a deeper amplitude indicates possible trend in larger projects.
In summary, development patterns in both Beijing and Montreal shows that the economy and the development scale are like two sides of a coin. Both cities shows that in a strong economy, the scale of development have a strong tendency to gets bigger or vice versa. In addition, as the construction sector industrialized and modernized, the increased productivity also means a significantly larger sized development. Although common perception is that the urban planners have strong and apparent influence on the urban fabric, It is critical to recognize the invisible force - the important role the economy played in urban development.

about COMMUNITYsimon ST-DENIS mei yi CHEN francois-luc GIRALDEAU anita SONG
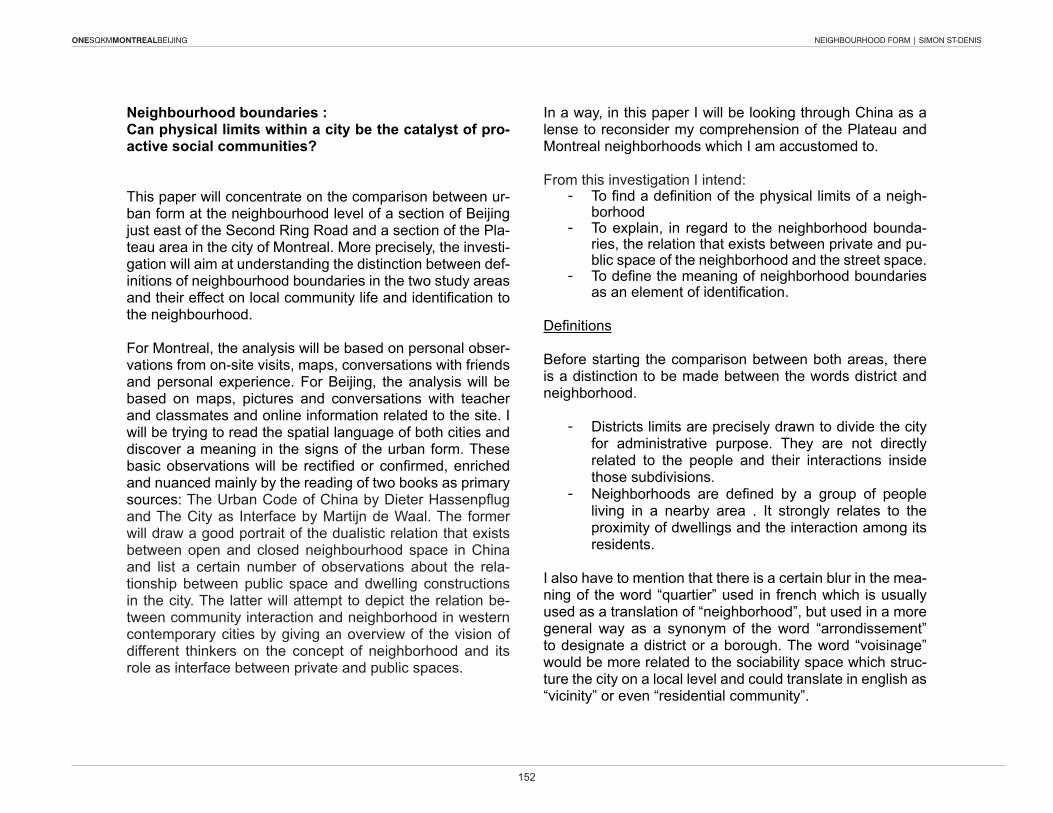
ONESQKMMONTREALBEIJING NEIGHBOURHOOD FORM | SIMON ST-DENIS
152
ONESQKMMONTREALBEIJING
Neighbourhood boundaries : Can physical limits within a city be the catalyst of pro-active social communities?
This paper will concentrate on the comparison between ur-ban form at the neighbourhood level of a section of Beijing just east of the Second Ring Road and a section of the Pla-teau area in the city of Montreal. More precisely, the investi-gation will aim at understanding the distinction between def-initions of neighbourhood boundaries in the two study areas and their effect on local community life and identification to the neighbourhood.
For Montreal, the analysis will be based on personal obser-vations from on-site visits, maps, conversations with friends and personal experience. For Beijing, the analysis will be based on maps, pictures and conversations with teacher and classmates and online information related to the site. I will be trying to read the spatial language of both cities and discover a meaning in the signs of the urban form. These basic observations will be rectified or confirmed, enriched and nuanced mainly by the reading of two books as primary sources: The Urban Code of China by Dieter Hassenpflug and The City as Interface by Martijn de Waal. The former will draw a good portrait of the dualistic relation that exists between open and closed neighbourhood space in China and list a certain number of observations about the rela-tionship between public space and dwelling constructions in the city. The latter will attempt to depict the relation be-tween community interaction and neighborhood in western contemporary cities by giving an overview of the vision of different thinkers on the concept of neighborhood and its role as interface between private and public spaces.
In a way, in this paper I will be looking through China as a lense to reconsider my comprehension of the Plateau and Montreal neighborhoods which I am accustomed to.
From this investigation I intend:- To find a definition of the physical limits of a neigh-
borhood - To explain, in regard to the neighborhood bounda-
ries, the relation that exists between private and pu-blic space of the neighborhood and the street space.
- To define the meaning of neighborhood boundaries as an element of identification.
Definitions
Before starting the comparison between both areas, there is a distinction to be made between the words district and neighborhood.
- Districts limits are precisely drawn to divide the city for administrative purpose. They are not directly related to the people and their interactions inside those subdivisions.
- Neighborhoods are defined by a group of people living in a nearby area . It strongly relates to the proximity of dwellings and the interaction among its residents.
I also have to mention that there is a certain blur in the mea-ning of the word “quartier” used in french which is usually used as a translation of “neighborhood”, but used in a more general way as a synonym of the word “arrondissement” to designate a district or a borough. The word “voisinage” would be more related to the sociability space which struc-ture the city on a local level and could translate in english as “vicinity” or even “residential community”.
ONESQKMMONTREALBEIJING
Fig. 1
Fig. 2
BeijingIntroverted, sense of group
PlateauExtroverted, individualised
Public(Street)
Beijing
Montreal
Semi-public(courtyard)
Private(Home)
Threshold(Gate)
Public(Street)Private
(Home)
Threshold(Door)
Semi-private(backyard)
Semi-public(front garden)
Personal observations and statements on neighborhood boundaries
After a first overview of Beijing and Montreal neighborhood form, a very different pattern appears in each site. In Bei-jing, the courtyard housing typologies and property divisions suggest a more enclosed and inward looking neighborhood logic, giving a sense of group to every residential compound. In Montreal, the open street grid with linear city block hou-sing typology suggests a more extroverted logic, as well as an individualised subdivision of properies. (Fig. 1)
Also, in China, since shared space is usually included inside of the property limits, the boundary between inside and out-side of the compound is usually clearly established and can be defined as the neighborhood limit. A more complex rela-tion exists between public open space, semi-public commun space and private space than in the Plateau. In Montreal, since there are usually no common space inside the pro-perty limits, the boundary of space dedicated to social inte-raction is not clearly established. A more simple distinction exists between very private (home) and very public (street) space. In other words, the threshold between private and public (semi-public and semi-private) is located on a dif-ferent layer of the space hierarchy in both cases. (Fig. 2)
Beijing’s Neighborhood Boundaries The western part of our study site belongs to Dong Cheng District and the estern part belongs to Chao Yang district. The site covers an area of 470 km2. I can imagine that this subdivision of space has very little meaning of identification for people living in it. However, there is probably a variation in how the sense of community is defined depending on the distance of each neighborhood from the centre of the city and its density population (Fig. 3).
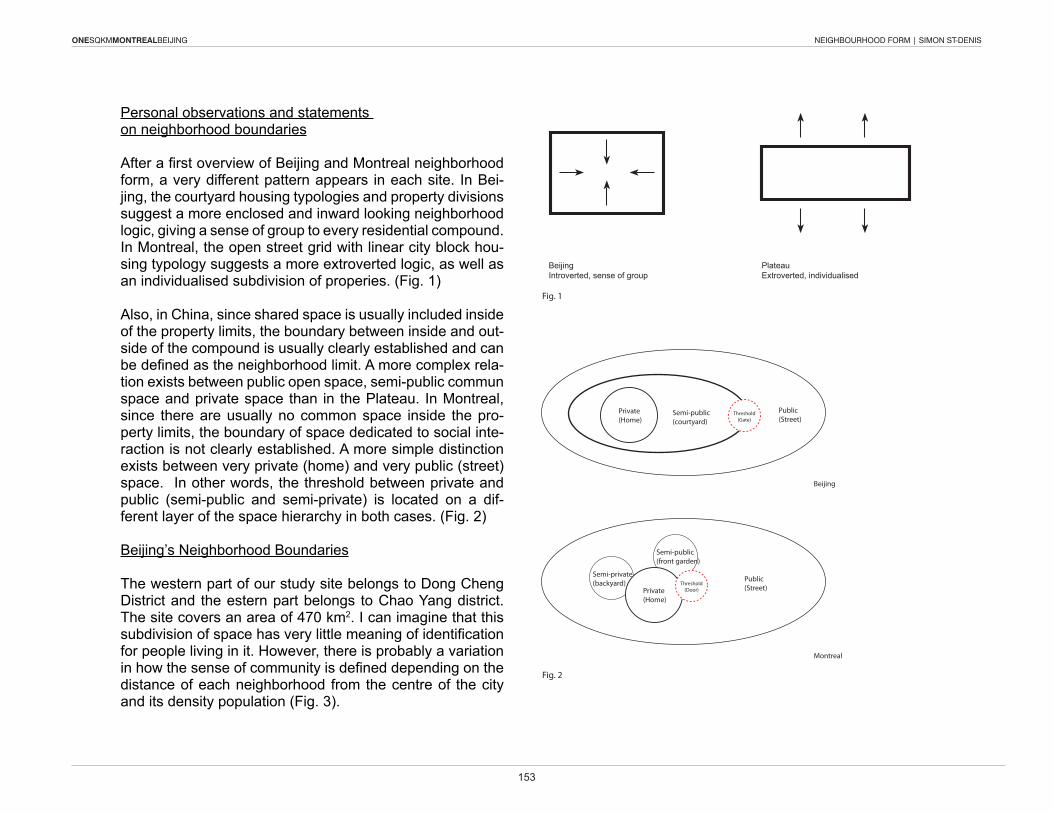
ONESQKMMONTREALBEIJING NEIGHBOURHOOD FORM | SIMON ST-DENIS
153
ONESQKMMONTREALBEIJING
Fig. 1
Fig. 2
BeijingIntroverted, sense of group
PlateauExtroverted, individualised
Public(Street)
Beijing
Montreal
Semi-public(courtyard)
Private(Home)
Threshold(Gate)
Public(Street)Private
(Home)
Threshold(Door)
Semi-private(backyard)
Semi-public(front garden)
Personal observations and statements on neighborhood boundaries
After a first overview of Beijing and Montreal neighborhood form, a very different pattern appears in each site. In Bei-jing, the courtyard housing typologies and property divisions suggest a more enclosed and inward looking neighborhood logic, giving a sense of group to every residential compound. In Montreal, the open street grid with linear city block hou-sing typology suggests a more extroverted logic, as well as an individualised subdivision of properies. (Fig. 1)
Also, in China, since shared space is usually included inside of the property limits, the boundary between inside and out-side of the compound is usually clearly established and can be defined as the neighborhood limit. A more complex rela-tion exists between public open space, semi-public commun space and private space than in the Plateau. In Montreal, since there are usually no common space inside the pro-perty limits, the boundary of space dedicated to social inte-raction is not clearly established. A more simple distinction exists between very private (home) and very public (street) space. In other words, the threshold between private and public (semi-public and semi-private) is located on a dif-ferent layer of the space hierarchy in both cases. (Fig. 2)
Beijing’s Neighborhood Boundaries The western part of our study site belongs to Dong Cheng District and the estern part belongs to Chao Yang district. The site covers an area of 470 km2. I can imagine that this subdivision of space has very little meaning of identification for people living in it. However, there is probably a variation in how the sense of community is defined depending on the distance of each neighborhood from the centre of the city and its density population (Fig. 3).
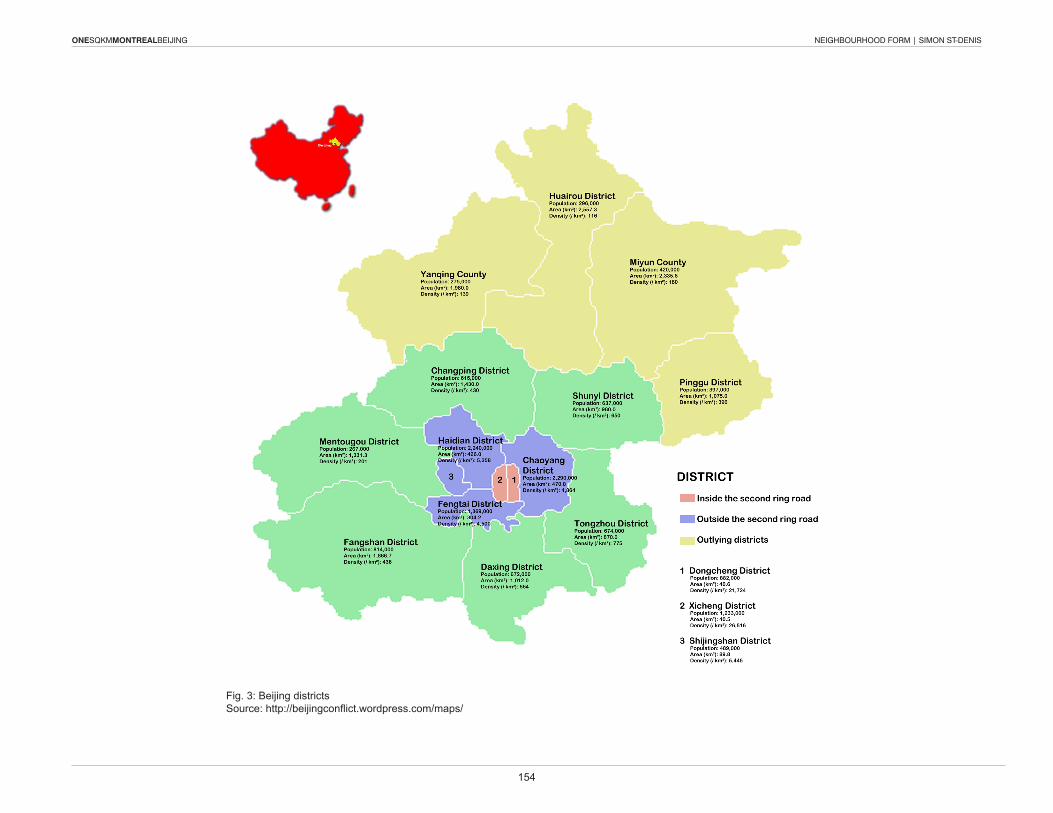
ONESQKMMONTREALBEIJING NEIGHBOURHOOD FORM | SIMON ST-DENIS
154
ONESQKMMONTREALBEIJING
Fig. 3: Beijing districts Source: http://beijingconflict.wordpress.com/maps/
ONESQKMMONTREALBEIJING
First of all, to have a better understanding of the neighbo-rhood form and the strong boundaries of Beijing’s residential areas, we have to go back in time and look at the evolution of the housing typologies. To begin, the traditionnal courtyard houses are the historic precedent of the enclosed cellular living unit which was hierarchically subdivided according to the status of each family living inside the wall-houses (Fig. 4). Later, this logic of independant, self-sufficient compo-nents was transposed in production logic to constitute the city as a collection of work units (danwei) regrouping in the same urban block residential, industrial, institutional and commercial functions (Fig. 5). Finally, in modern chinese urban development, cities are mainly expanding through the construction of high density residential housing that we can categorize as the compound type. Compounds usually consist of a mega-block property. Towers and/or slabs are either scattered among or disposed around a garden (green communal space). This semi-public space is often separa-ted from the public space by a wall or a fence accessible through gates (Fig.6). By looking at these configurations, we can see that the articulation of urban space based on social ties has been persistent throughout Beijing’s history, creating clearly limited places for common identification.
If we take a closer look at our study area, we can see that this pattern affects all the residential use areas. Each property is clearly defined and its boundary is physicaly expressed, re-ducing the access to a limited number of entrances. These common properties are usually given names, allowing clear identification of the space as an entity and in that way, al-lowing a greater sense of belonging to the neighbourhood. Although a distinction can be made between housing ty-pologies built in the 1970s-1980s and in the 2000s, build-ings are, in all cases, disposed on a property with generous pedestrian garden space between them and with a loose relation to the street. Only the commercial buildings, delimit-
Fig. 4: Traditionnal courtyard houseSource: Yuwei Wang, The Chinese Unit: Per-sistence of Collective Urban Model in Beijing, Projective Cities
Fig. 5: Work Unit (Danwei)Source: Yuwei Wang, The Chinese Unit: Persistence of Collective Urban Model in Beijing, Projective Cities
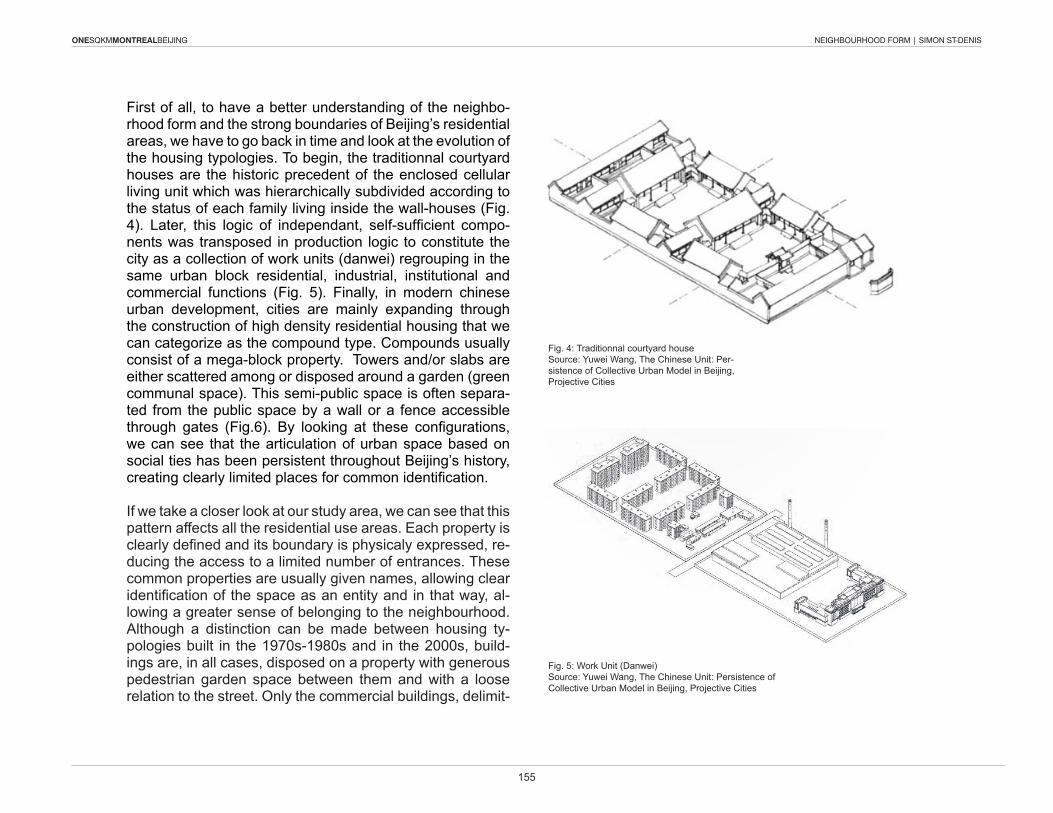
ONESQKMMONTREALBEIJING NEIGHBOURHOOD FORM | SIMON ST-DENIS
155
ONESQKMMONTREALBEIJING
First of all, to have a better understanding of the neighbo-rhood form and the strong boundaries of Beijing’s residential areas, we have to go back in time and look at the evolution of the housing typologies. To begin, the traditionnal courtyard houses are the historic precedent of the enclosed cellular living unit which was hierarchically subdivided according to the status of each family living inside the wall-houses (Fig. 4). Later, this logic of independant, self-sufficient compo-nents was transposed in production logic to constitute the city as a collection of work units (danwei) regrouping in the same urban block residential, industrial, institutional and commercial functions (Fig. 5). Finally, in modern chinese urban development, cities are mainly expanding through the construction of high density residential housing that we can categorize as the compound type. Compounds usually consist of a mega-block property. Towers and/or slabs are either scattered among or disposed around a garden (green communal space). This semi-public space is often separa-ted from the public space by a wall or a fence accessible through gates (Fig.6). By looking at these configurations, we can see that the articulation of urban space based on social ties has been persistent throughout Beijing’s history, creating clearly limited places for common identification.
If we take a closer look at our study area, we can see that this pattern affects all the residential use areas. Each property is clearly defined and its boundary is physicaly expressed, re-ducing the access to a limited number of entrances. These common properties are usually given names, allowing clear identification of the space as an entity and in that way, al-lowing a greater sense of belonging to the neighbourhood. Although a distinction can be made between housing ty-pologies built in the 1970s-1980s and in the 2000s, build-ings are, in all cases, disposed on a property with generous pedestrian garden space between them and with a loose relation to the street. Only the commercial buildings, delimit-
Fig. 4: Traditionnal courtyard houseSource: Yuwei Wang, The Chinese Unit: Per-sistence of Collective Urban Model in Beijing, Projective Cities
Fig. 5: Work Unit (Danwei)Source: Yuwei Wang, The Chinese Unit: Persistence of Collective Urban Model in Beijing, Projective Cities
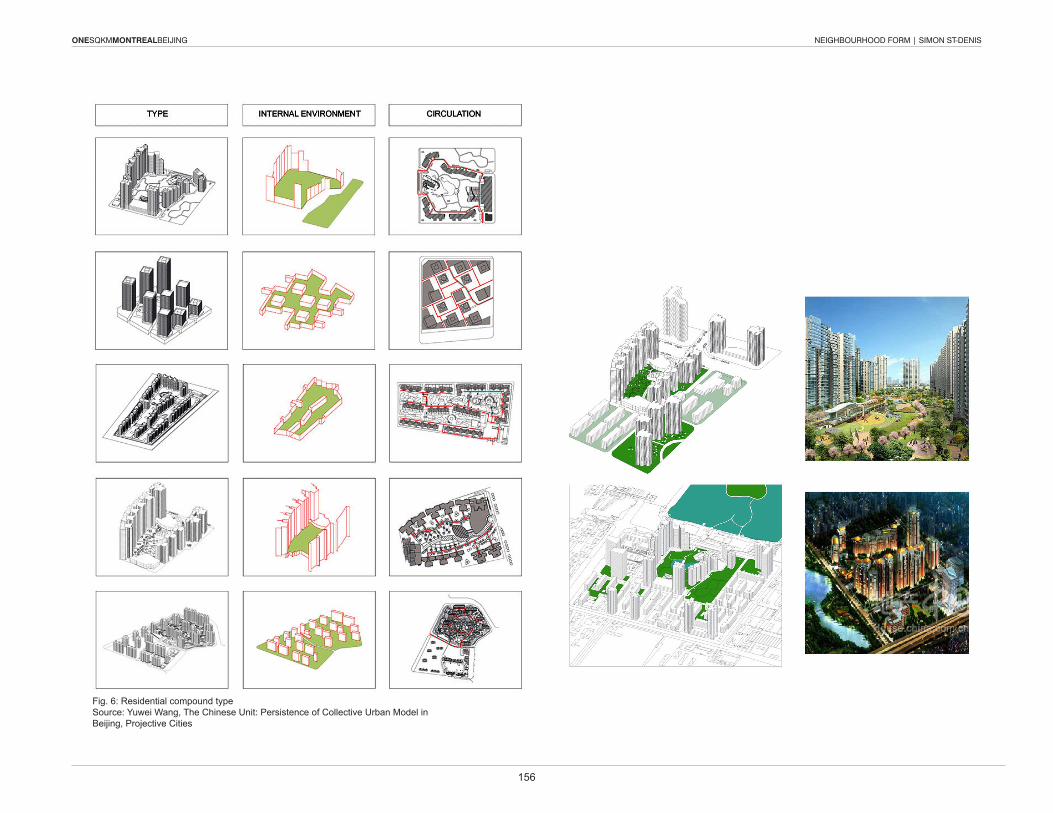
ONESQKMMONTREALBEIJING NEIGHBOURHOOD FORM | SIMON ST-DENIS
156
ONESQKMMONTREALBEIJING
Fig. 6: Residential compound typeSource: Yuwei Wang, The Chinese Unit: Persistence of Collective Urban Model in Beijing, Projective Cities
ONESQKMMONTREALBEIJING
ing the periphery of the mega-block, follow a logic of street alignment (Fig. 7-8). Thereby, we can state that there is a duality between resi-dential compound and open city space in Beijing. The resi-dential compound can be described as a “precisely defi-ned areas [...] with exact borders [...] and clear separation of interior and exterior”1. Moreover, an effect of the clear neighborhood boundary that separates enclosed semi-public and open public space seems to be that Chinese people rely a lot more on semi-public space as a place for social and familial interaction on the local level. Open space (public street) outside of those community cocoon are then more used as functional commercial, mobility and civic space (noble place) and less used as a space of inte-raction on a community level. So we could conclude that street space outside of the residential compound is not part of neighborhood space.
Nonetheless, given the fact that most modern citizen’s spheres of activities now extend outside of the residen-tial community space, making social interactions inside the mega-block less necessary, what is the real effect of such a strong physical definition of neighbourhoods on the community life and its relation with the city ? Is there an decreasing amount of social interaction within the residen-tial blocks and is the well-defined residential compound still relevant today as catalyst of community life? 2 For sure, semi-public spaces allow residents to take a rest from the crowded and busy commercial streets without being with-drawn to an entirely private space. By looking at pictures of human activity inside those property spaces it is possi-ble notice many social interactions. People group together
1 Dieter Hassenpflug, The Urban Code of China, Basel: Birkhauser, 20102 Yuwei Wang, The Chinese Unit: Persistence of Collective Urban Model in Beijing, Projective Cities (MPhil in Architecture), Architectural Association School of Architecture, Design-and-written dissertation, June 2013
to chat, play games, dance, do exercise etc. (Fig. 9) Yet, most of them seem to involve older people and families with kids. Safer common space allows the extension of in-terior private space into a public space that can be shared on an extended time basis with close neighbors. This really increases the quality of life in a very dense city for fami-lies with young kids and older wanting to meet in a friendly place. Also, since these kind of common spaces are a continuation of cultural values, they seem to be much more used to their full capacity for social interaction than western courtyard and gated spaces.
While, the distinct organization of urban space into residen-tial compounds that subdividespace in more or less independant groups of dwelling pro-vide a certain resiliency to the communitites, the social pat-terns represented by these neighbourhoods may limit the flexibility of communities. Since community space is inside of property space, sense of belonging toward the courtyard space provides respect from the residents, valorisation of this space and stronger identity. This segmentation of iden-tity in “cellular landscapes of partial space”3 gives a possi-bility of stronger community at a small scale, but probably a weaker relation to the city as a whole and thus to the public space of the street.
But this duality is not all black and white. There is a certain relationship between open public space and enclosed dwel-ling space. There is a variation of control in gated access to neighborhoods depending on socio-economic situation. Obvioulsy, high-end compound tend to be more exclusive, whereas other areas are more porous and allow a free ac-cess through the gates. Only 30% of neighborhoods have a strict control of access.4 So there is a certain permeability 3 Dieter Hassenpflug, The Urban Code of China, Basel: Birkhauser, 20104 Dieter Hassenpflug, The Urban Code of China, Basel: Birkhauser, 2010
ONESQKMMONTREALBEIJING NEIGHBOURHOOD FORM | SIMON ST-DENIS
157
ONESQKMMONTREALBEIJING
ing the periphery of the mega-block, follow a logic of street alignment (Fig. 7-8). Thereby, we can state that there is a duality between resi-dential compound and open city space in Beijing. The resi-dential compound can be described as a “precisely defi-ned areas [...] with exact borders [...] and clear separation of interior and exterior”1. Moreover, an effect of the clear neighborhood boundary that separates enclosed semi-public and open public space seems to be that Chinese people rely a lot more on semi-public space as a place for social and familial interaction on the local level. Open space (public street) outside of those community cocoon are then more used as functional commercial, mobility and civic space (noble place) and less used as a space of inte-raction on a community level. So we could conclude that street space outside of the residential compound is not part of neighborhood space.
Nonetheless, given the fact that most modern citizen’s spheres of activities now extend outside of the residen-tial community space, making social interactions inside the mega-block less necessary, what is the real effect of such a strong physical definition of neighbourhoods on the community life and its relation with the city ? Is there an decreasing amount of social interaction within the residen-tial blocks and is the well-defined residential compound still relevant today as catalyst of community life? 2 For sure, semi-public spaces allow residents to take a rest from the crowded and busy commercial streets without being with-drawn to an entirely private space. By looking at pictures of human activity inside those property spaces it is possi-ble notice many social interactions. People group together
1 Dieter Hassenpflug, The Urban Code of China, Basel: Birkhauser, 20102 Yuwei Wang, The Chinese Unit: Persistence of Collective Urban Model in Beijing, Projective Cities (MPhil in Architecture), Architectural Association School of Architecture, Design-and-written dissertation, June 2013
to chat, play games, dance, do exercise etc. (Fig. 9) Yet, most of them seem to involve older people and families with kids. Safer common space allows the extension of in-terior private space into a public space that can be shared on an extended time basis with close neighbors. This really increases the quality of life in a very dense city for fami-lies with young kids and older wanting to meet in a friendly place. Also, since these kind of common spaces are a continuation of cultural values, they seem to be much more used to their full capacity for social interaction than western courtyard and gated spaces.
While, the distinct organization of urban space into residen-tial compounds that subdividespace in more or less independant groups of dwelling pro-vide a certain resiliency to the communitites, the social pat-terns represented by these neighbourhoods may limit the flexibility of communities. Since community space is inside of property space, sense of belonging toward the courtyard space provides respect from the residents, valorisation of this space and stronger identity. This segmentation of iden-tity in “cellular landscapes of partial space”3 gives a possi-bility of stronger community at a small scale, but probably a weaker relation to the city as a whole and thus to the public space of the street.
But this duality is not all black and white. There is a certain relationship between open public space and enclosed dwel-ling space. There is a variation of control in gated access to neighborhoods depending on socio-economic situation. Obvioulsy, high-end compound tend to be more exclusive, whereas other areas are more porous and allow a free ac-cess through the gates. Only 30% of neighborhoods have a strict control of access.4 So there is a certain permeability 3 Dieter Hassenpflug, The Urban Code of China, Basel: Birkhauser, 20104 Dieter Hassenpflug, The Urban Code of China, Basel: Birkhauser, 2010
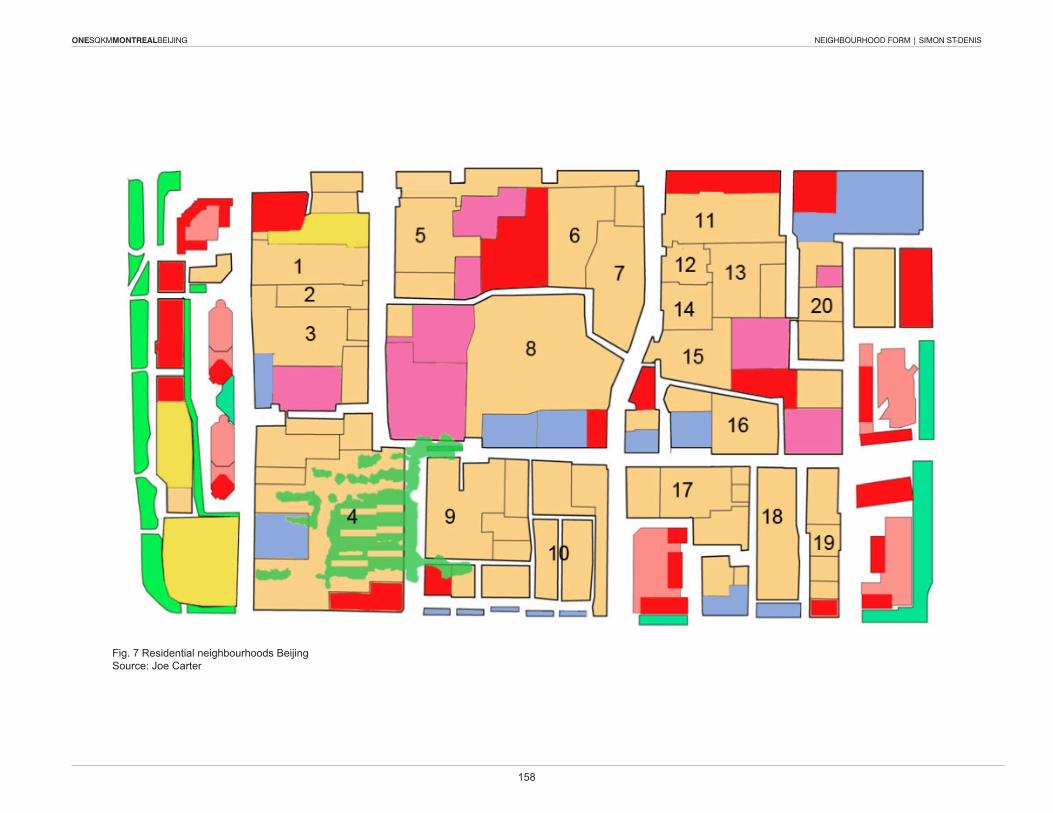
ONESQKMMONTREALBEIJING NEIGHBOURHOOD FORM | SIMON ST-DENIS
158
ONESQKMMONTREALBEIJING
Fig. 7 Residential neighbourhoods BeijingSource: Joe Carter
ONESQKMMONTREALBEIJING
Fig. 8 Property Blocks, Landuse and construction datesSource: Joe Carter
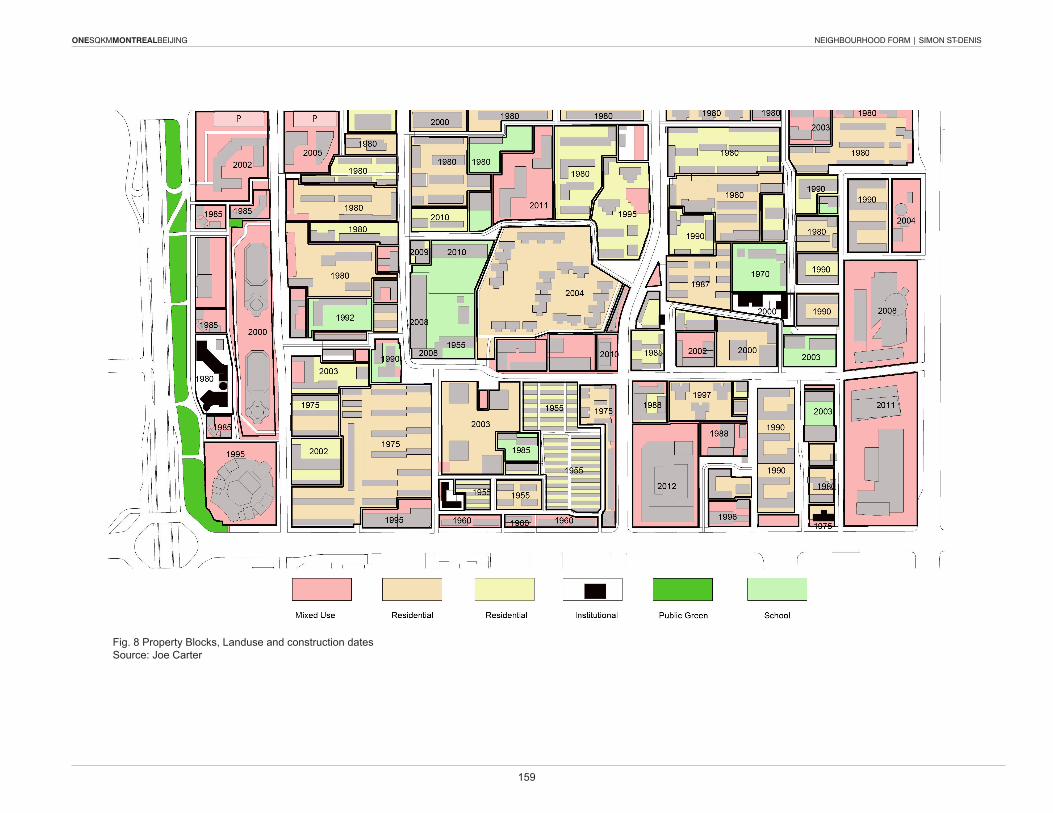
ONESQKMMONTREALBEIJING NEIGHBOURHOOD FORM | SIMON ST-DENIS
159
ONESQKMMONTREALBEIJING
Fig. 8 Property Blocks, Landuse and construction datesSource: Joe Carter
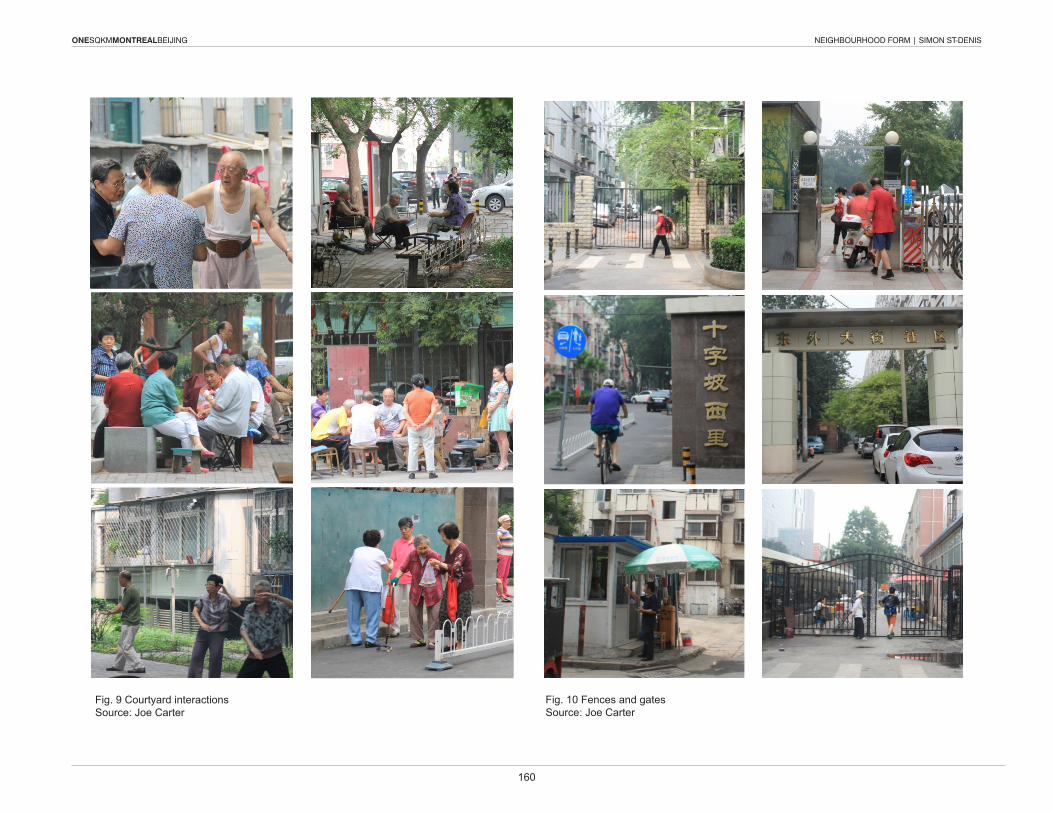
ONESQKMMONTREALBEIJING NEIGHBOURHOOD FORM | SIMON ST-DENIS
160
ONESQKMMONTREALBEIJING
Fig. 9 Courtyard interactions Source: Joe Carter
Fig. 10 Fences and gates Source: Joe Carter
ONESQKMMONTREALBEIJING
of compound border which welcomes passerby in protec-ted common space outside of busy streets. (Fig. 10) There is also an interaction between the residential compound and the commercial perimeter strip where a lot of social en-counter can also occur. Music in the public greenspace and sidewalk clothelines are good examples of a “transgression of the border that separates private, personal space from the open urban theatre stage”5 A mix of retail, small scale service, green space and residential use at the border of the mega-block provide a connection between inside and outside.
Finally, this idea of a well definded neighborhood identity is now used as a way of residential branding on a com-mercial level. Since compounds are focused on internal space, facades on the public streets are treated with less expression of cultural meaning and tend to follow com-mercial purposes. European styles are used as an exotic distinction image to catalyse identification. The facade is extensively used in the public space as commercial attrac-tor and is less related to a local community scale. Maybe a certain extroversion outside of introverted facade meaning can develop through expressive media facades ?
Montreal’s Overlapping Communities
Given the particular example of Beijing that displays strong neighborhood boundaries, there is an opportunity to ques-tion the concept of neighborhood as an element of common identification in the western world and to tackle its definition with a new angle.The Plateau is geographically delimited by the mountain towards west, by the railroad towards north and east and by Sherbrooke Street before the slope to downtown toward the south. It is subdivided in 3 subdistricts by two main ar-5 Idem
teries (Mont-Royal and Christophe-Colomb). These geo-graphical elements become important landmarks that sur-round the district and give it an identity, but they do not act as proper neighborhood boundaries on a local interaction scale. (Fig. 11) The different cultural areas in the Plateau can give us a hint of how local communities group together. For instance, the Portugese community has a lot of shops, restaurants, churches and gathering places between Mont-Royal, St-Laurent, Sherbrooke and Parc. Also, a massive immigration of young French people have started to live in the central south area of the Plateau near Parc Lafontaine. These definitions of areas establish a cultural sense of be-longing, but are not exclusive or specific and thus do not define a neighbourhood boundary.
The main housing typologies in the Plateau are duplexes and triplexes with party walls, aligned with a small green space in front or no setback from the sidewalk. Private backyard at the back (sometimes shared) and a back al-ley in the middle are found in most cases. This layout of the city strongly related to the street grid and the open city block, offers a close relationship between dwellings and the street as the main social space. This continuous field of open space does not seem to show a clear limit between distinct neighborhoods inside the district. (Fig. 12) Thereby, “the organisation, use and experience of the urban public sphere can […] be seen as an indication of how a city func-tions as a community”6.
On a closer level, the relation between outward looking fa-cade on the street and inward looking facade on the court-yard and back-alley are pretty much the opposite than in China. Front façade have a much more articulated and for-mal ornamentation. They also display balconies and out-
6 Martjin de Waal, The City as Interface: How New Media Are Changing the City, Rotterdam: reflect #10, nai010 publishers, 2014, p.12
ONESQKMMONTREALBEIJING NEIGHBOURHOOD FORM | SIMON ST-DENIS
161
ONESQKMMONTREALBEIJING
of compound border which welcomes passerby in protec-ted common space outside of busy streets. (Fig. 10) There is also an interaction between the residential compound and the commercial perimeter strip where a lot of social en-counter can also occur. Music in the public greenspace and sidewalk clothelines are good examples of a “transgression of the border that separates private, personal space from the open urban theatre stage”5 A mix of retail, small scale service, green space and residential use at the border of the mega-block provide a connection between inside and outside.
Finally, this idea of a well definded neighborhood identity is now used as a way of residential branding on a com-mercial level. Since compounds are focused on internal space, facades on the public streets are treated with less expression of cultural meaning and tend to follow com-mercial purposes. European styles are used as an exotic distinction image to catalyse identification. The facade is extensively used in the public space as commercial attrac-tor and is less related to a local community scale. Maybe a certain extroversion outside of introverted facade meaning can develop through expressive media facades ?
Montreal’s Overlapping Communities
Given the particular example of Beijing that displays strong neighborhood boundaries, there is an opportunity to ques-tion the concept of neighborhood as an element of common identification in the western world and to tackle its definition with a new angle.The Plateau is geographically delimited by the mountain towards west, by the railroad towards north and east and by Sherbrooke Street before the slope to downtown toward the south. It is subdivided in 3 subdistricts by two main ar-5 Idem
teries (Mont-Royal and Christophe-Colomb). These geo-graphical elements become important landmarks that sur-round the district and give it an identity, but they do not act as proper neighborhood boundaries on a local interaction scale. (Fig. 11) The different cultural areas in the Plateau can give us a hint of how local communities group together. For instance, the Portugese community has a lot of shops, restaurants, churches and gathering places between Mont-Royal, St-Laurent, Sherbrooke and Parc. Also, a massive immigration of young French people have started to live in the central south area of the Plateau near Parc Lafontaine. These definitions of areas establish a cultural sense of be-longing, but are not exclusive or specific and thus do not define a neighbourhood boundary.
The main housing typologies in the Plateau are duplexes and triplexes with party walls, aligned with a small green space in front or no setback from the sidewalk. Private backyard at the back (sometimes shared) and a back al-ley in the middle are found in most cases. This layout of the city strongly related to the street grid and the open city block, offers a close relationship between dwellings and the street as the main social space. This continuous field of open space does not seem to show a clear limit between distinct neighborhoods inside the district. (Fig. 12) Thereby, “the organisation, use and experience of the urban public sphere can […] be seen as an indication of how a city func-tions as a community”6.
On a closer level, the relation between outward looking fa-cade on the street and inward looking facade on the court-yard and back-alley are pretty much the opposite than in China. Front façade have a much more articulated and for-mal ornamentation. They also display balconies and out-
6 Martjin de Waal, The City as Interface: How New Media Are Changing the City, Rotterdam: reflect #10, nai010 publishers, 2014, p.12
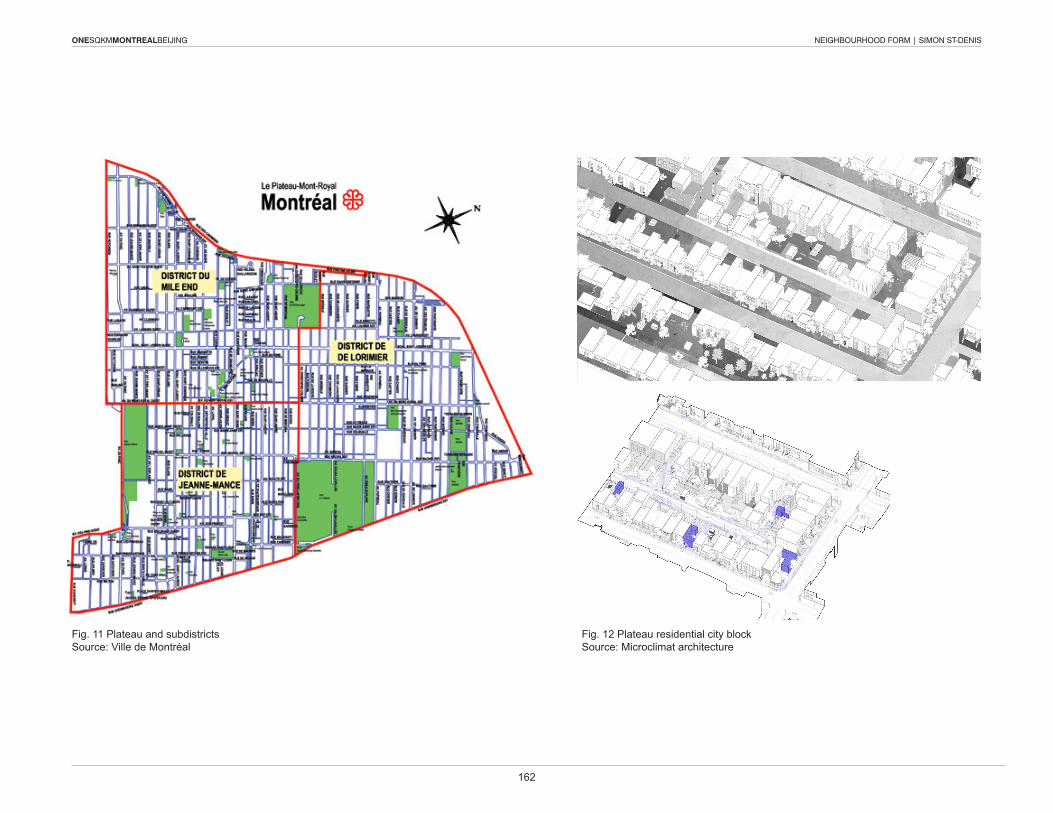
ONESQKMMONTREALBEIJING NEIGHBOURHOOD FORM | SIMON ST-DENIS
162
ONESQKMMONTREALBEIJING YOUR TOPIC | YOUR NAME
Fig. 11 Plateau and subdistrictsSource: Ville de Montréal
Fig. 12 Plateau residential city blockSource: Microclimat architecture
ONESQKMMONTREALBEIJING
side staircases that really play a role in giving a buffer zone between really private space of the house where the door is a hermetic threshold not to trespass and really public space of the street. These stairs can also act as a structure that allows closer interaction between door neighbours. On the other hand, inside the block, facades are way simpler and often less maintained. Fences are also widely used to separate private backyards and the public alley.
In that way, I would argue that the identification of a per-son to a community rather relates on multiple overlapping networks that we can define as “networked individualism”7. A person creates his own identity based on a collection of communities (work, friends, school, sport, etc.) not neces-sarily tied up to the dwelling area. On a local level, I would state that personal boundaries of a neighborhood or vicinity are defined by repeated travels on a reasonable distance to daily activities and services. Through the accumulation of many little public “sidewalk contacts” at the local level, a web of public respect is established. A relation of trust be-tween “familiar strangers” of a vicinity is thus created. This opened and more informal neighborhood sociability allows a more heterogeneous and flexible community network.8
We can introduce here the concept of “parochial sphere”9 that buffers the crude seperation between private space of the house and urban domain of the street. The parochial domain defines groups of people with similar lifestyles, so-cial class and culture that cohabitate in districts of the city and makes the sense of collectivity easier to accomplish. However, even there, with the increase in mobility and indi-vidualisation of lifestyles as stated by Prof. Shearmur, pa-rochial and public domains are blending together and not clear-cut. 7 Martjin de Waal, The City as Interface: How New Media Are Changing the City, Rotterdam: reflect #10, nai010 publishers, 2014,8 Idem9 Idem
Since, the neighbourhood division is seamless and so hard to define physicaly in Montreal I will investigate the defini-tion of neighborhood and urban collectivity from different thinkers to find out what elements give a consistency to the community and defines its specific identity. First, A.Bos describes the neighborhood as “an environnement that can be a framework for people and communities, providing op-portunities for personnal development and inviting people, as it were, to enter into many different forms of coopera-tion and community”10. According to him, “the city must not become a collection of ‘urban villages’ […]”, but “the com-plexity, the strangeness, the unfamiliarity that characterize the modern metropolis can only captivate and enrapture if the city also provides its residents with an orderly and fami-liar environment”. In other words, the open public space gains interest if, as a counterpart, people can rely on a strong local community.
On the other hand, J. Jacobs defines togetherness in the city as a group of residents which find recognition of their own neighborhood through minimal interactions. She also gives importance to geographical difference between resi-dents and “visitors from outside” emphisizing a good ba-lance of strangers and owners in an area and between pri-vate and public spaces (suffocating social control can be as bad as homogeneity and individualism). T. Blokland goes further by using the term ‘Public familiarity’ describing the neighborhood as an everyday life spatial process of identity formation.11 Distinction of different groups of people in the neighborhood and identification to one or many in which people recognise themselves. According to him, “the neigh-borhood did not automatically develop into a community. Not all neighborhood residents were part of the same com-munities and vice versa, communities present in the neigh-10 Martjin de Waal, The City as Interface: How New Media Are Changing the City, Rotterdam: reflect #10, nai010 publishers, 2014 p.3111 Martjin de Waal, The City as Interface: How New Media Are Changing the City, Rotterdam: reflect #10, nai010 publishers, 2014 p.55
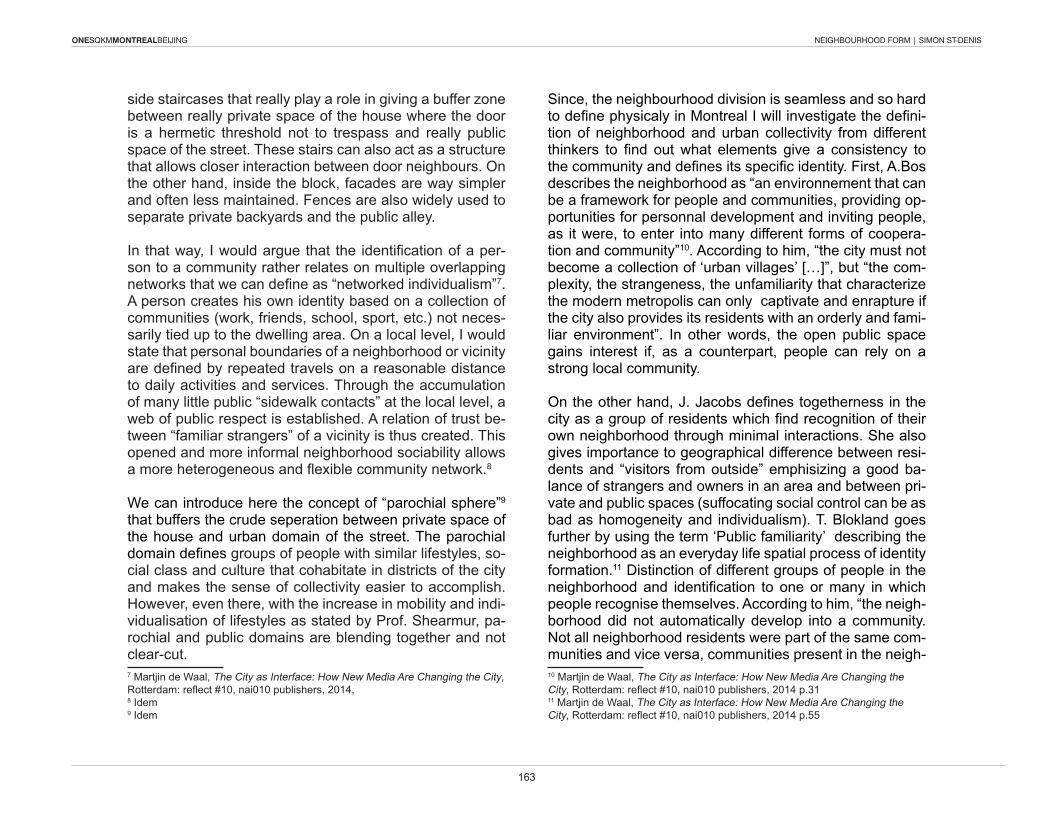
ONESQKMMONTREALBEIJING NEIGHBOURHOOD FORM | SIMON ST-DENIS
163
ONESQKMMONTREALBEIJING
side staircases that really play a role in giving a buffer zone between really private space of the house where the door is a hermetic threshold not to trespass and really public space of the street. These stairs can also act as a structure that allows closer interaction between door neighbours. On the other hand, inside the block, facades are way simpler and often less maintained. Fences are also widely used to separate private backyards and the public alley.
In that way, I would argue that the identification of a per-son to a community rather relates on multiple overlapping networks that we can define as “networked individualism”7. A person creates his own identity based on a collection of communities (work, friends, school, sport, etc.) not neces-sarily tied up to the dwelling area. On a local level, I would state that personal boundaries of a neighborhood or vicinity are defined by repeated travels on a reasonable distance to daily activities and services. Through the accumulation of many little public “sidewalk contacts” at the local level, a web of public respect is established. A relation of trust be-tween “familiar strangers” of a vicinity is thus created. This opened and more informal neighborhood sociability allows a more heterogeneous and flexible community network.8
We can introduce here the concept of “parochial sphere”9 that buffers the crude seperation between private space of the house and urban domain of the street. The parochial domain defines groups of people with similar lifestyles, so-cial class and culture that cohabitate in districts of the city and makes the sense of collectivity easier to accomplish. However, even there, with the increase in mobility and indi-vidualisation of lifestyles as stated by Prof. Shearmur, pa-rochial and public domains are blending together and not clear-cut. 7 Martjin de Waal, The City as Interface: How New Media Are Changing the City, Rotterdam: reflect #10, nai010 publishers, 2014,8 Idem9 Idem
Since, the neighbourhood division is seamless and so hard to define physicaly in Montreal I will investigate the defini-tion of neighborhood and urban collectivity from different thinkers to find out what elements give a consistency to the community and defines its specific identity. First, A.Bos describes the neighborhood as “an environnement that can be a framework for people and communities, providing op-portunities for personnal development and inviting people, as it were, to enter into many different forms of coopera-tion and community”10. According to him, “the city must not become a collection of ‘urban villages’ […]”, but “the com-plexity, the strangeness, the unfamiliarity that characterize the modern metropolis can only captivate and enrapture if the city also provides its residents with an orderly and fami-liar environment”. In other words, the open public space gains interest if, as a counterpart, people can rely on a strong local community.
On the other hand, J. Jacobs defines togetherness in the city as a group of residents which find recognition of their own neighborhood through minimal interactions. She also gives importance to geographical difference between resi-dents and “visitors from outside” emphisizing a good ba-lance of strangers and owners in an area and between pri-vate and public spaces (suffocating social control can be as bad as homogeneity and individualism). T. Blokland goes further by using the term ‘Public familiarity’ describing the neighborhood as an everyday life spatial process of identity formation.11 Distinction of different groups of people in the neighborhood and identification to one or many in which people recognise themselves. According to him, “the neigh-borhood did not automatically develop into a community. Not all neighborhood residents were part of the same com-munities and vice versa, communities present in the neigh-10 Martjin de Waal, The City as Interface: How New Media Are Changing the City, Rotterdam: reflect #10, nai010 publishers, 2014 p.3111 Martjin de Waal, The City as Interface: How New Media Are Changing the City, Rotterdam: reflect #10, nai010 publishers, 2014 p.55
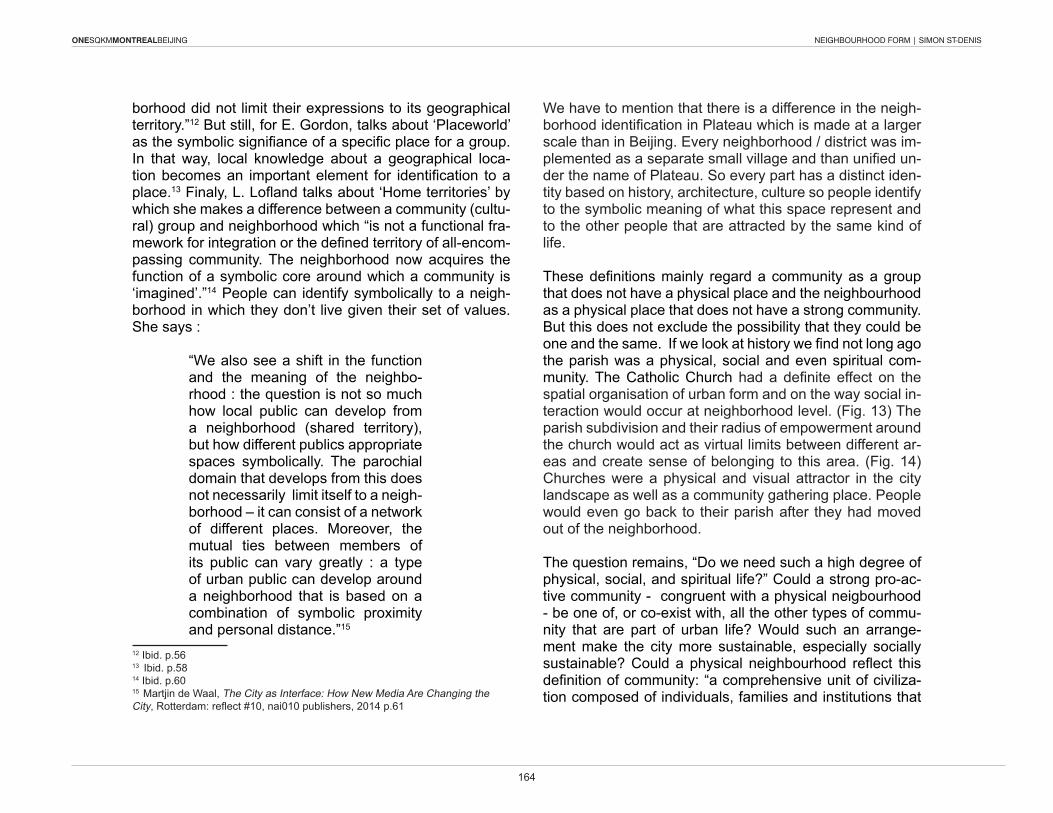
ONESQKMMONTREALBEIJING NEIGHBOURHOOD FORM | SIMON ST-DENIS
164
ONESQKMMONTREALBEIJING
borhood did not limit their expressions to its geographical territory.”12 But still, for E. Gordon, talks about ‘Placeworld’ as the symbolic signifiance of a specific place for a group. In that way, local knowledge about a geographical loca-tion becomes an important element for identification to a place.13 Finaly, L. Lofland talks about ‘Home territories’ by which she makes a difference between a community (cultu-ral) group and neighborhood which “is not a functional fra-mework for integration or the defined territory of all-encom-passing community. The neighborhood now acquires the function of a symbolic core around which a community is ‘imagined’.”14 People can identify symbolically to a neigh-borhood in which they don’t live given their set of values. She says :
“We also see a shift in the function and the meaning of the neighbo-rhood : the question is not so much how local public can develop from a neighborhood (shared territory), but how different publics appropriate spaces symbolically. The parochial domain that develops from this does not necessarily limit itself to a neigh-borhood – it can consist of a network of different places. Moreover, the mutual ties between members of its public can vary greatly : a type of urban public can develop around a neighborhood that is based on a combination of symbolic proximity and personal distance.”15
12 Ibid. p.5613 Ibid. p.5814 Ibid. p.6015 Martjin de Waal, The City as Interface: How New Media Are Changing the City, Rotterdam: reflect #10, nai010 publishers, 2014 p.61
We have to mention that there is a difference in the neigh-borhood identification in Plateau which is made at a larger scale than in Beijing. Every neighborhood / district was im-plemented as a separate small village and than unified un-der the name of Plateau. So every part has a distinct iden-tity based on history, architecture, culture so people identify to the symbolic meaning of what this space represent and to the other people that are attracted by the same kind of life.
These definitions mainly regard a community as a group that does not have a physical place and the neighbourhood as a physical place that does not have a strong community. But this does not exclude the possibility that they could be one and the same. If we look at history we find not long ago the parish was a physical, social and even spiritual com-munity. The Catholic Church had a definite effect on the spatial organisation of urban form and on the way social in-teraction would occur at neighborhood level. (Fig. 13) The parish subdivision and their radius of empowerment around the church would act as virtual limits between different ar-eas and create sense of belonging to this area. (Fig. 14) Churches were a physical and visual attractor in the city landscape as well as a community gathering place. People would even go back to their parish after they had moved out of the neighborhood.
The question remains, “Do we need such a high degree of physical, social, and spiritual life?” Could a strong pro-ac-tive community - congruent with a physical neigbourhood - be one of, or co-exist with, all the other types of commu-nity that are part of urban life? Would such an arrange-ment make the city more sustainable, especially socially sustainable? Could a physical neighbourhood reflect this definition of community: “a comprehensive unit of civiliza-tion composed of individuals, families and institutions that
ONESQKMMONTREALBEIJING
Fig. 13 Parish subdivisions of the PlateauSource: Archives de la Vile de Montréal
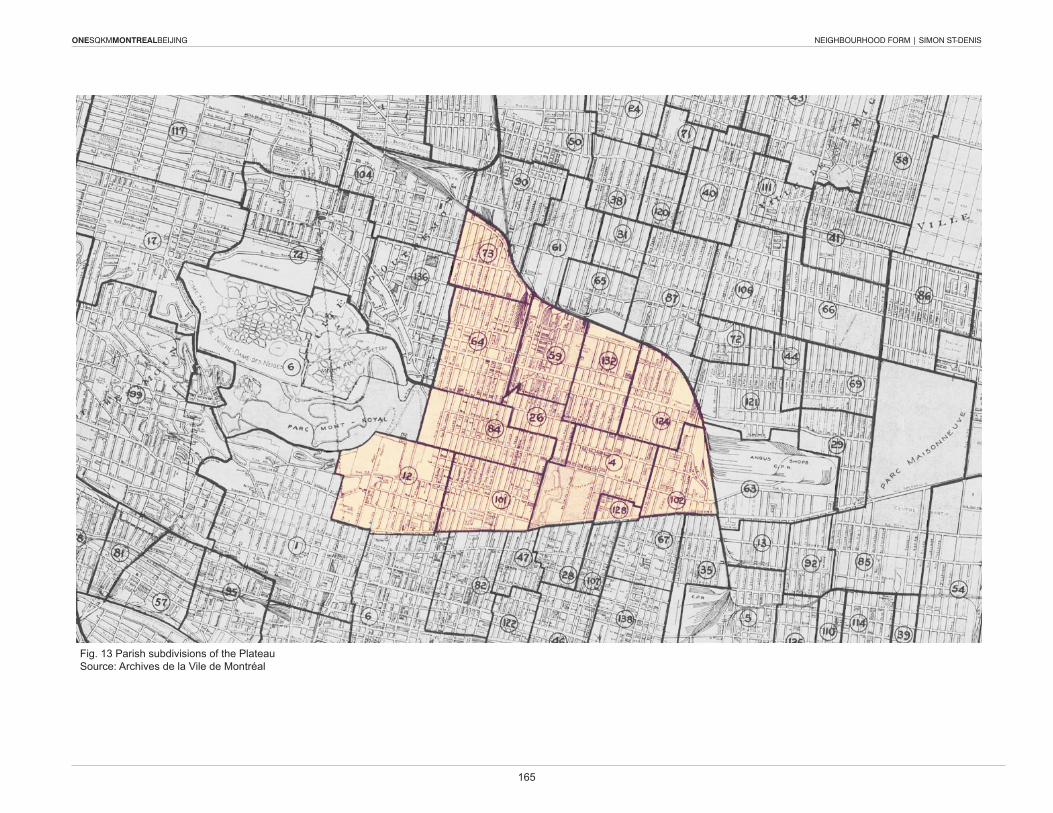
ONESQKMMONTREALBEIJING NEIGHBOURHOOD FORM | SIMON ST-DENIS
165
ONESQKMMONTREALBEIJING
Fig. 13 Parish subdivisions of the PlateauSource: Archives de la Vile de Montréal

ONESQKMMONTREALBEIJING NEIGHBOURHOOD FORM | SIMON ST-DENIS
166
ONESQKMMONTREALBEIJING
are originators and encouragers of systems, agencies and organizations working together with a common purpose for the welfare of people both within and beyond its borders; it is a composition of diverse, interacting participants that are achieving unity in an unremitting quest for spiritual and social progress.”16?
Nowadays, churches don’t act as gathering place as much, so what are the current attractors of small scale neighbor-hood interaction? This leads to the subject of the back al-ley as a mean of community space. They are a network of lanes parallel to the street grid. (Fig. 17) This internal public space can be seen as the semi-public “courtyard” of the city block, but is often disregarded. Even if, as stated before, community seems to be based on multiple layers of inter-action disconnected from a specific physical area or from the dwelling space, we can see an upsurge for the need of local community space for families living in vicinity inside a densely constructed area. This can be seen in growing de-mand for Ruelles Vertes (Green Alleys) spreading all over the Plateau and in other surrounding neighborhoods like Rosemont. (Fig. 18) In these alleys, people living in one city block decide in a mutual agreement to revegetate and take care of their section of the linear space. This becomes a common project bringing together people of a street block working as a group to have a more interesting space for the kids to play. (Fig. 19)
“La ruelle est un espace social typique-ment Montréalais. Lieu commun, la ru-elle devient espace social par les pra-tiques quotidiennes qui l’animent et les évènements extraordinaires la dévoilent comme face cachée de la ville. C’est dans la ruelle que nous nous rencon-
16 The Universal House of Justice, The Four Year Plan, pp.34-35
Fig. 14 Montreal green alleysSource: http://ruellewurteleflorian.blogspot.ca/p/ruelle-verte.html
Fig. 15 Green alleysSource: http://www.convercite.org/5-ruelles-vertes-a-decouvrir-a-montreal/
ONESQKMMONTREALBEIJING
Fig. 16 Montreal back alleysSource: Emily Young, Thomas-Bernard Kenniff et Claudia Delisle.
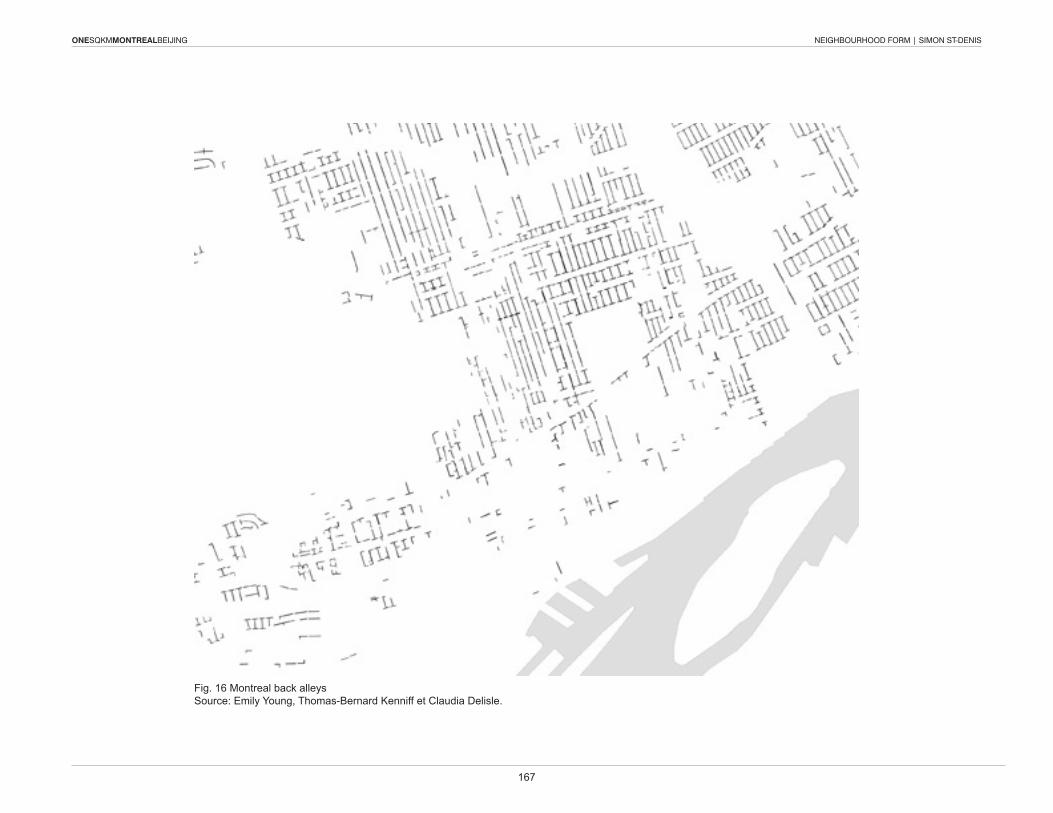
ONESQKMMONTREALBEIJING NEIGHBOURHOOD FORM | SIMON ST-DENIS
167
ONESQKMMONTREALBEIJING
Fig. 16 Montreal back alleysSource: Emily Young, Thomas-Bernard Kenniff et Claudia Delisle.
ONESQKMMONTREALBEIJING NEIGHBOURHOOD FORM | SIMON ST-DENIS
168
ONESQKMMONTREALBEIJING
trons pour jouer. C’est par la ruelle que nous prenons des raccourcis. C’est souvent dans ces passages sans nom, plutôt que sur les rues, que les voisins se côtoient et que la proximité de la ville se négocie. Par sa nature ambigüe, autant publique que privée, autant visible que secrète, la ruelle est possiblement l’un des espaces sociaux les plus significatifs de Montréal.”17
We can see that this “trend” is typical of a certain group of people. By example, in my neighborhood (Villeray) more and more young and wealthy young families start to move in the area and a demand for those kind of space follows. One green alley in the block next to mine has been inau-gurated this year and a project to do one in my back al-ley is being developed at the moment. By taking part in the process of this project, it is very interesting to see how it can regroup the concerns of many families for sustain-ability, security and comfort. Already, just the process of meeting in each other’s backyard has the effect of creating links between people living on opposite side of the block that wouldn’t usually meet. Even if many restrictions limit the possibilities of action, small and effective gesture can be made to reduce speed of the cars going through and reduce the heat islands during summer time. Most of the concerns aim at giving a better environment for kids to play. This group reflection about our section of the city also leads to give an identity to our space. We were encouraged to find a theme for the alley based on its history or simply by a visual identity from the type of plants used in the land-scaping or some paintings on the ground and wall. As an effect of this identification, people tend to replace higher fences by lower and less opaque ones and replace small 17 Emily Young, Thomas-Bernard Kenniff et Claudia Delisle, Nos ruelles, <http://tbkenniff.com/blog/2013/08/nos-ruelles/>
door by large sliding doors that allows an interconnection of the backyard to the alley. New people to the area feel more welcome. Some people had to take a certain initiative to spark this process and I think the communication needed to organise such a project is more important to the commu-nity life that the alley landscaping itself. So in a way, each of these city blocks around back alleys with their specific identity, even displaying entrance signage, become small distinct and inclusive neighborhoods.
However, in contrast to the situation in China were people often take great care of their courtyard, we can see that back alley are not well adapted and were not designed for a common gathering. Planned as mainly functional lanes, people try to transform them in more friendly space, often in a clumsy and unconvincing way. Even if the Plateau of-fers a very dynamic and enjoyable street life, a real lack of common family friendly space can be observed. Almost no semi-public shared space, little pedestrian street and mostly narrow sidewalks are problematic compared to China.
Whether these new efforts at neighbourhood organization will result in a closer marriage of community and neigh-bourhood physical form remains to be seen. In the mean-time, there are “attractors” that help sustain a degree of local community and identity. I would say from personal experience and from conversation with families and friends that neighborhood attractors are often related to commer-cial uses. People see the limit of their area according to the closest grocery store, café, corner store, etc. Public spaces, parks and cultural space also act as important ele-ments of identification to a neighborhood. Very simple and trivial spaces can act as attractors of community encoun-ters. For example, the corner store with a 45 degree angled facade, extending the area of the side walk at the corner of
ONESQKMMONTREALBEIJING
the street can become an important open space in a very dense neighborhood. (Fig. 16) Others coulb be, a park where people meet for picnic and family meal in public with space for kids to play and park house for community gathering and activities of all age groups. Subway stations and transportation facilities are also important attractors that serves as identification of areas.
Although the enclosed and well-defined courtyard gardens of China’s residential compounds provide space for neighbourhood interaction, most of these compounds are relatively new and the process of “social” community-building has barely begun. Some would argue it should not begin; anonymity is better. It will take more time before we know whether China’s strong physical defi-nition of neighbourhood is also an assistance or an impetus to the creation of pro-active social communities.
Residential compound
Beijing
Montreal
Gate, wall, fence
Inward looking, urban village
Open city block
Row houses, backyard,front balconies
Individualism, networked sociability
Fig. 17 Organization of Neighbourhood Boundaries
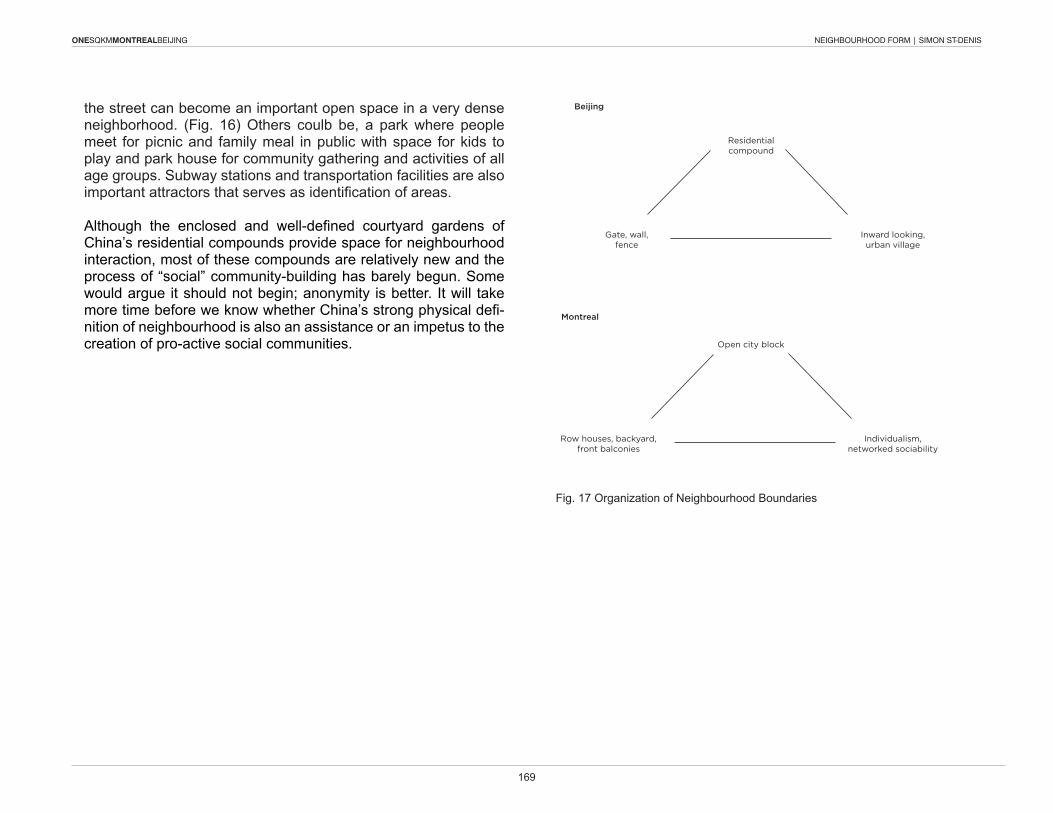
ONESQKMMONTREALBEIJING NEIGHBOURHOOD FORM | SIMON ST-DENIS
169
ONESQKMMONTREALBEIJING
the street can become an important open space in a very dense neighborhood. (Fig. 16) Others coulb be, a park where people meet for picnic and family meal in public with space for kids to play and park house for community gathering and activities of all age groups. Subway stations and transportation facilities are also important attractors that serves as identification of areas.
Although the enclosed and well-defined courtyard gardens of China’s residential compounds provide space for neighbourhood interaction, most of these compounds are relatively new and the process of “social” community-building has barely begun. Some would argue it should not begin; anonymity is better. It will take more time before we know whether China’s strong physical defi-nition of neighbourhood is also an assistance or an impetus to the creation of pro-active social communities.
Residential compound
Beijing
Montreal
Gate, wall, fence
Inward looking, urban village
Open city block
Row houses, backyard,front balconies
Individualism, networked sociability
Fig. 17 Organization of Neighbourhood Boundaries
ONESQKMMONTREALBEIJING NEIGHBOURHOOD FORM | SIMON ST-DENIS
170
ONESQKMMONTREALBEIJING
Bibliography
Primary sources
- Dieter Hassenpflug, The Urban Code of China, Ba-sel: Birkhauser, 2010, 175 p.
- Martjin de Waal, The City as Interface: How New Media Are Changing the City, Rotterdam: reflect #10, nai010 publishers, 2014, 208p.
Secondary sources
- Yuwei Wang, The Chinese Unit: Persistence of Collective Urban Model in Beijing, Projective Cities (MPhil in Architecture), Architectural Association School of Architecture, Design-and-written disser-tation, June 2013, 111 p.
- Maryse Leduc, Denys Marchand, Les maisons de Montreal, Mémoires pour l’an 2000, Montréal: Uni-versité de Montréal, 1992, 40p.
- Michèle Benoît, Roger Gratton, Les villages du Plateau: Le patrimoine de Montréal, Montréal: Col-lection Pignon sur rue, Guérin, 40 p.
- Neville Mars and Adrian Hornsby, The Chinese Dream: A Society Under Construction, Q10 Pub-lishers, 2009, 200 p.
- Emily Young, Thomas-Bernard Kenniff et Clau-dia Delisle, Nos ruelles, <http://tbkenniff.com/blog/2013/08/nos-ruelles/>

ONESQKMMONTREALBEIJING COMMUNITY | MEI YI CHEN
172
NEIGHBORHOOD FORMATION & SOCIAL COHESION BEIJING- MONTREAL
For many years, much research has been done to explore how the living condition influences the individual's health and behavior. However the work which focuses on the association of living environment with the collective well-being and social interaction is not well developed. This paper will analyze how local environment fosters social interaction and creates a sense of community in the neighborhood. Two cities will be used as reference to explore this topic. The first site is a flourishing area located to the east of the Second Ring Road in Beijing and the second one is the Plateau Mont-Royal of Montreal. we will begin with an analysis on the development pattern followed by the neighborhood formation of these two sites. we will study the development speed, neighborhood scale and architectural qualities of the two district. After examining the neighborhood formation, we will then discuss on how the development pattern affects the promotion of social cohesion and sense of community. Sense of Community within Neighborhood
Before analyzing the neighborhood formation and the sense of community, we should have a clear definition of the word neighborhood. “A neighborhood is a collection of people who share services and some level of cohesion in a geographically bounded place.” 1 There are three significant terms that define a neighborhood —people, place, and cohesion. Among them, place is the most noticeable word that
1 Park, Yunmi. & Rogers, George. Neighborhood planning theory, guidelines, and research. Can Area, population, and boundary guide conceptual frame? (Journal of Planning Literature, 2014), 2.
distinguishes neighborhood from the concept of community. Community refers to a group of individuals that share common interest, value, belief and cultural background regardless of geographical boundary. Therefore neighborhood is merely a tangible and geographical concept.1. These two concepts have similar literal meanings but in fact they are very different. In today’s society, people tend to be more introverted, they indulge in their own world and are reluctant to interact with their surroundings. If neighbors refuse to communicate with each other, how can they share their common interest and value? This is not a rare phenomenon, many neighborhoods are lacking a sense of community due to residents’ introversion.
Sense of community is very essential in a neighborhood
and in individual’s daily life. Firstly, social interactions with surrounding can reduce ones loneliness and prevent them from breakdowns caused by the detachment from others. In addition, having a sense of community will guaranty the security and reduce the crime rate within the neighborhood as all residents will keep an eye on their neighbors’ properties and report immediately for any suspicious behavior. The fundamental purpose of a strong community is to provide a sense of belonging for all individuals and unites all residents together to achieve a common goal. The following is a description of a harmonious neighborhood: “a comprehensive unit of civilization composed of individuals, families and institutions that are originators and encouragers of systems, agencies and organizations working together with a common purpose for the welfare of people both within and beyond its borders; it is a composition of diverse, interacting participants that are
ONESQKMMONTREALBEIJING COMMUNITY | MEI YI CHEN
173
achieving unity in an unremitting quest for spiritual and social progress.”2 This statement is actually an idealized concept, it describes an active mode, in which the individual and the neighborhood are creative, responsible protagonists, eager to participate in, and even originate community activity. while this level of maturity is rare, at least so far, and most residents are still in passive mode, a good neighborhood aspires to achieve a harmonious community. Social Cohesion
In order to achieve a harmonious community, public spaces and services that promote social cohesion are necessary in the neighborhood. Cohesion is another key term that has been used to define a neighborhood, it refers to “the willingness of members of a society to cooperate with each other in order to prosper.”3 Such a simple definition implies a lot of input on the social interaction in the neighborhood. In order to make a resident willing to participle in community activity, this neighborhood should provide a place where neighbors can interact. Also, the willingness of each members should be based on the confidence in the community and the trust for other members. The following are five characteristics that a neighborhood should have to promote social cohesion and to improve itself toward a harmonious community.
1- The neighborhood was set within a framework that defines
its relationship with neighboring communities and the city or region.
2- The neighborhood should have a focus where the residents could interact at street level in person; this typically includes
2 The Four Year Plan: Messages of the Universal House of Justice, 34-35.
3 Stanley, Dick. What Do We Know about Social Cohesion: The Research Perspective of the Federal Government's Social Cohesion Research Network (The Canadian Journal of Sociology 2003) 5.
a public square of forum with some mixed used facilities common to all residents.
3- The neighborhood should have infrastructure in balance with its needs.
4- The neighborhood should have an identity, whether a parish council or residents’ association.4
5- The neighborhood should have some community activity organized by the residents’ association.
The first four characteristics were cited from Alec Hay’s article «How will history remember us? » In this article, these characteristic were used to measure the level of resiliency of the neighborhood which is defined as the ability of recovery from catastrophe. They can also be used to assess the level of social cohesion, because they evaluate the solidarity of the neighborhoods and how the residents are connected with one another. we will now use these aspects to measure resiliency-cohesion capacity of our study sites. Neighborhoods analysis Beijing
Our fist site is a prosperous area on the second ring road
of Beijing city. (Figure 1) This area contains houses from different periods, they are residential compounds that has been recently erected and the one-storey houses dated from the 50s. Chinese contemporary urban development is very fast. The old, backward China has been literally demolished and replaced by a new, glittering country. In western countries, most urban
4 Hay, Alec. How Will History Remember Us? (ReNew Canada The infrastructure magazine, 2014) 6.
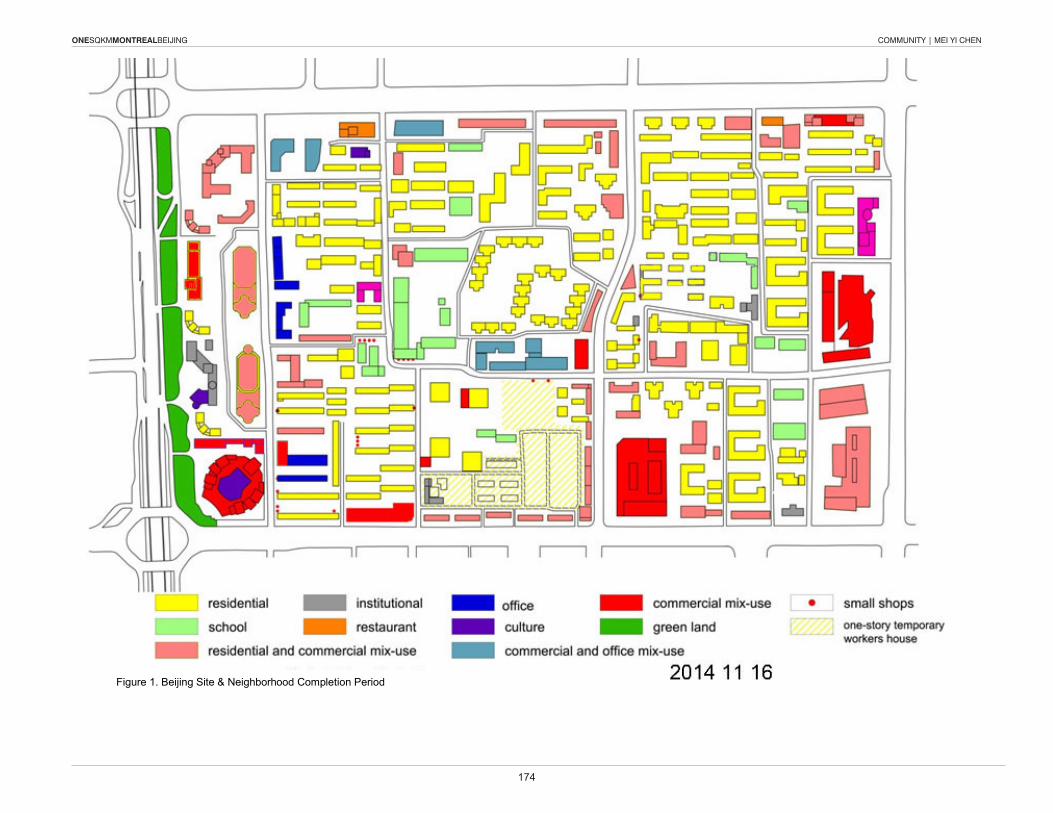
ONESQKMMONTREALBEIJING COMMUNITY | MEI YI CHEN
174
Figure 1. Beijing Site & Neighborhood Completion Period

ONESQKMMONTREALBEIJING COMMUNITY | MEI YI CHEN
175
spaces still maintain their original developed appearance whereas in China, the concept of rebuilding a new urban space is so strong that many lands have undergone repeatedly constructions and demolitions for several times. On our site, we can see that the one-storey houses built in 1955 are a good example of those “to-be-demolished” land. (Figure 2) The neighborhoods built after 2000 are the outcome of glittering development. There were also few neighborhoods built between 1970 to 1990. (Figure 3) These neighborhoods give us a nice visual illustration of the contemporary urban development of China. Antiquated look, but still habitable, those neighborhoods might be torn down in the future if new projects to rebuild the land are proposed.
To have a better understanding of the Chinese
neighborhood formation, we will begin with a brief introduction of its development pattern. In the beginning of the planning stage, the Chinese government will try to collect all the land that could be demolished and convene a construction bidding to sell the collected land to the developer. During the bidding a specific land-use program is proposed and as soon as the developer bought the land the construction work will begin. The development period for a residential neighborhood in Beijing is very fast as the construction work from the planning stage to the actual completion only takes two to five years. Since the urban development pattern of modern China is dominated by the language “large-scale single-use, single-ownership street block.” 5 we often see a single residential compound occupies a large portion of the street block. On our study site, the average size of the street block is about 6.8 hectare and the size of the largest neighborhood is about 4 hectare. Due to the high density of the downtown area, the neighborhoods sizes in our study site 5 Hassenpflug, Dieter. The Urban Code of China. (Basel: Birkhauser, 2010.) 48-67.
Figure 2. One-storey houses built in 1955
Figure 3. Neighborhood built 1975.
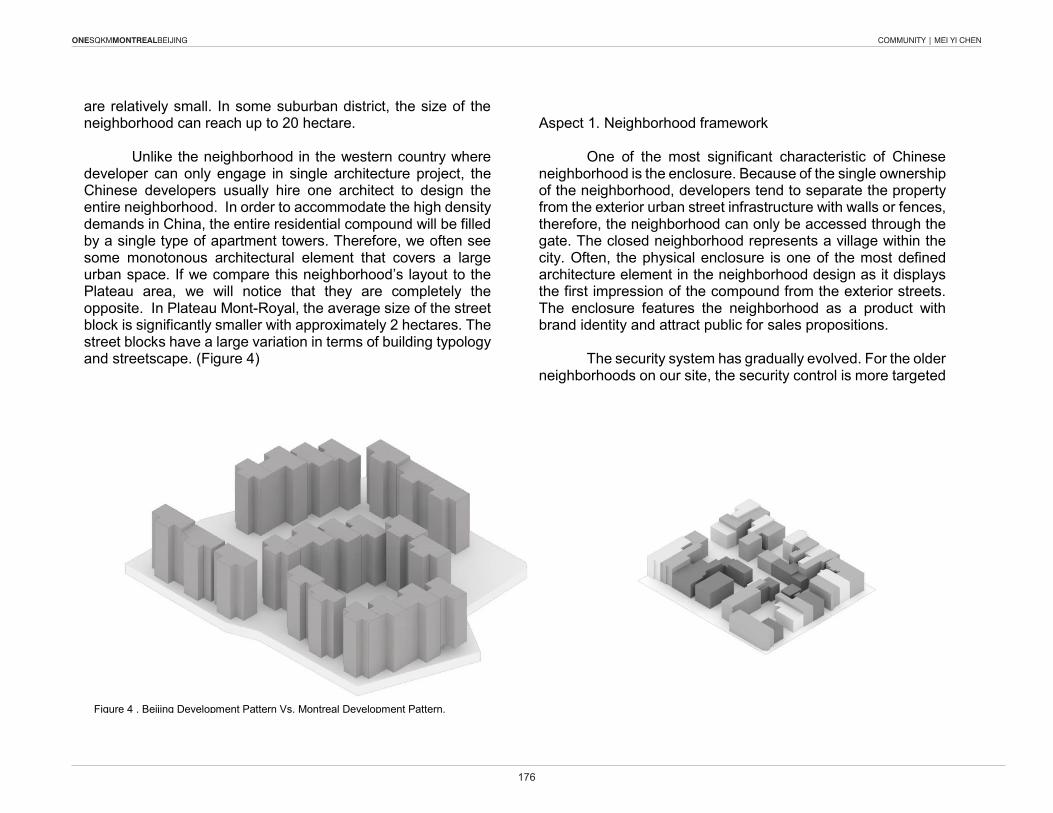
ONESQKMMONTREALBEIJING COMMUNITY | MEI YI CHEN
176
are relatively small. In some suburban district, the size of the neighborhood can reach up to 20 hectare.
Unlike the neighborhood in the western country where
developer can only engage in single architecture project, the Chinese developers usually hire one architect to design the entire neighborhood. In order to accommodate the high density demands in China, the entire residential compound will be filled by a single type of apartment towers. Therefore, we often see some monotonous architectural element that covers a large urban space. If we compare this neighborhood’s layout to the Plateau area, we will notice that they are completely the opposite. In Plateau Mont-Royal, the average size of the street block is significantly smaller with approximately 2 hectares. The street blocks have a large variation in terms of building typology and streetscape. (Figure 4)
Aspect 1. Neighborhood framework
One of the most significant characteristic of Chinese
neighborhood is the enclosure. Because of the single ownership of the neighborhood, developers tend to separate the property from the exterior urban street infrastructure with walls or fences, therefore, the neighborhood can only be accessed through the gate. The closed neighborhood represents a village within the city. Often, the physical enclosure is one of the most defined architecture element in the neighborhood design as it displays the first impression of the compound from the exterior streets. The enclosure features the neighborhood as a product with brand identity and attract public for sales propositions.
The security system has gradually evolved. For the older
neighborhoods on our site, the security control is more targeted
Figure 4 . Beijing Development Pattern vs. Montreal Development Pattern.
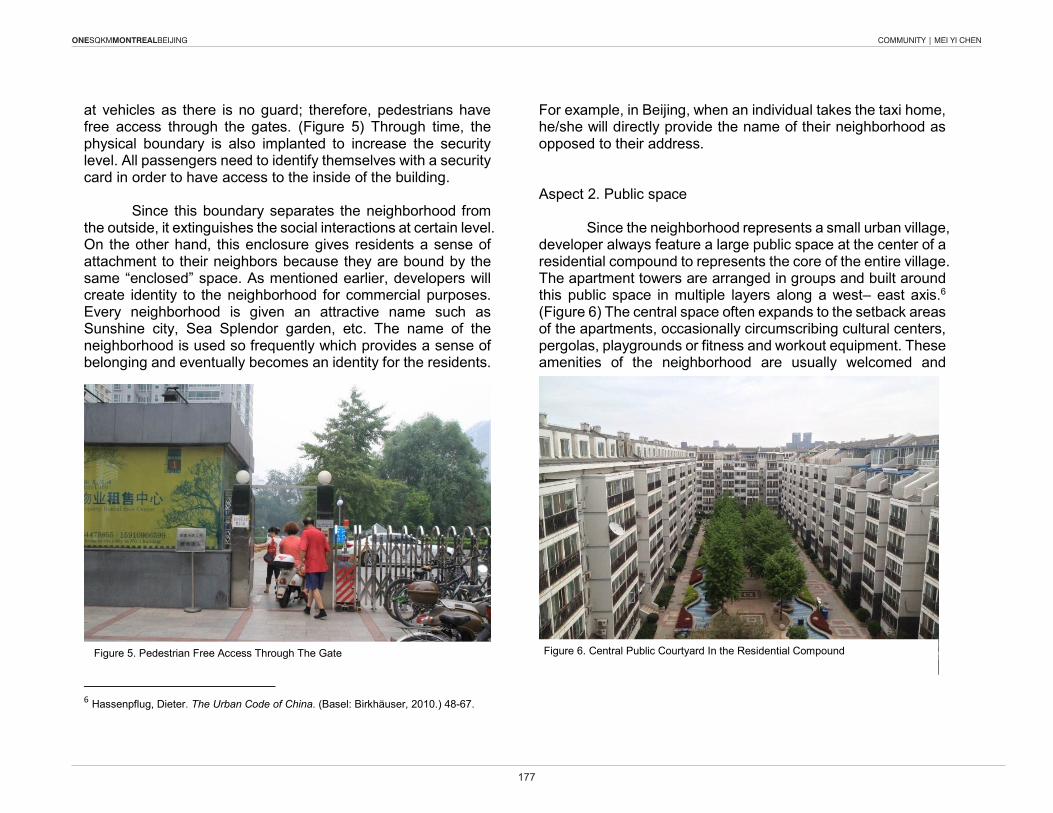
ONESQKMMONTREALBEIJING COMMUNITY | MEI YI CHEN
177
at vehicles as there is no guard; therefore, pedestrians have free access through the gates. (Figure 5) Through time, the physical boundary is also implanted to increase the security level. All passengers need to identify themselves with a security card in order to have access to the inside of the building.
Since this boundary separates the neighborhood from the outside, it extinguishes the social interactions at certain level. On the other hand, this enclosure gives residents a sense of attachment to their neighbors because they are bound by the same “enclosed” space. As mentioned earlier, developers will create identity to the neighborhood for commercial purposes. Every neighborhood is given an attractive name such as Sunshine city, Sea Splendor garden, etc. The name of the neighborhood is used so frequently which provides a sense of belonging and eventually becomes an identity for the residents.
6 Hassenpflug, Dieter. The Urban Code of China. (Basel: Birkhauser, 2010.) 48-67.
For example, in Beijing, when an individual takes the taxi home, he/she will directly provide the name of their neighborhood as opposed to their address.
Aspect 2. Public space
Since the neighborhood represents a small urban village, developer always feature a large public space at the center of a residential compound to represents the core of the entire village. The apartment towers are arranged in groups and built around this public space in multiple layers along a west– east axis.6 (Figure 6) The central space often expands to the setback areas of the apartments, occasionally circumscribing cultural centers, pergolas, playgrounds or fitness and workout equipment. These amenities of the neighborhood are usually welcomed and
Figure 5. Pedestrian Free Access Through The Gate Figure 6. Central Public Courtyard In the Residential Compound
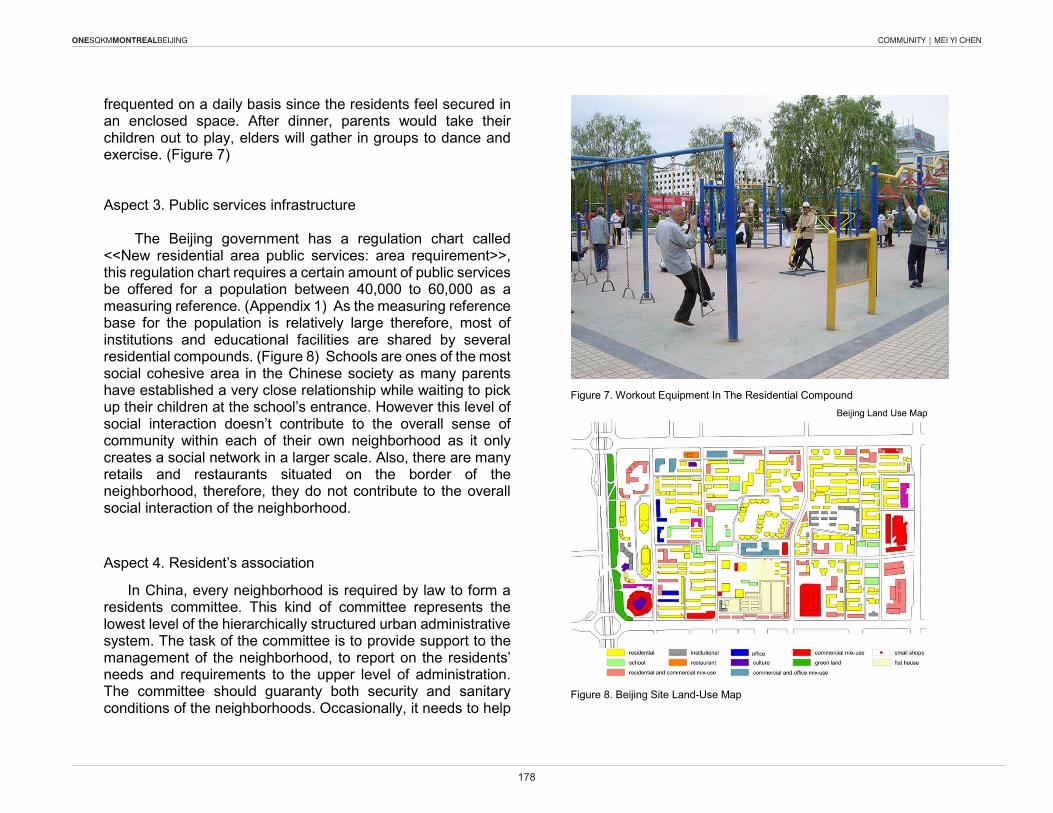
ONESQKMMONTREALBEIJING COMMUNITY | MEI YI CHEN
178
frequented on a daily basis since the residents feel secured in an enclosed space. After dinner, parents would take their children out to play, elders will gather in groups to dance and exercise. (Figure 7) Aspect 3. Public services infrastructure
The Beijing government has a regulation chart called <<New residential area public services: area requirement>>, this regulation chart requires a certain amount of public services be offered for a population between 40,000 to 60,000 as a measuring reference. (Appendix 1) As the measuring reference base for the population is relatively large therefore, most of institutions and educational facilities are shared by several residential compounds. (Figure 8) Schools are ones of the most social cohesive area in the Chinese society as many parents have established a very close relationship while waiting to pick up their children at the school’s entrance. However this level of social interaction doesn’t contribute to the overall sense of community within each of their own neighborhood as it only creates a social network in a larger scale. Also, there are many retails and restaurants situated on the border of the neighborhood, therefore, they do not contribute to the overall social interaction of the neighborhood.
Aspect 4. Resident’s association
In China, every neighborhood is required by law to form a residents committee. This kind of committee represents the lowest level of the hierarchically structured urban administrative system. The task of the committee is to provide support to the management of the neighborhood, to report on the residents’ needs and requirements to the upper level of administration. The committee should guaranty both security and sanitary conditions of the neighborhoods. Occasionally, it needs to help
Figure 8. Beijing Site Land-Use Map
Figure 7. workout Equipment In The Residential Compound
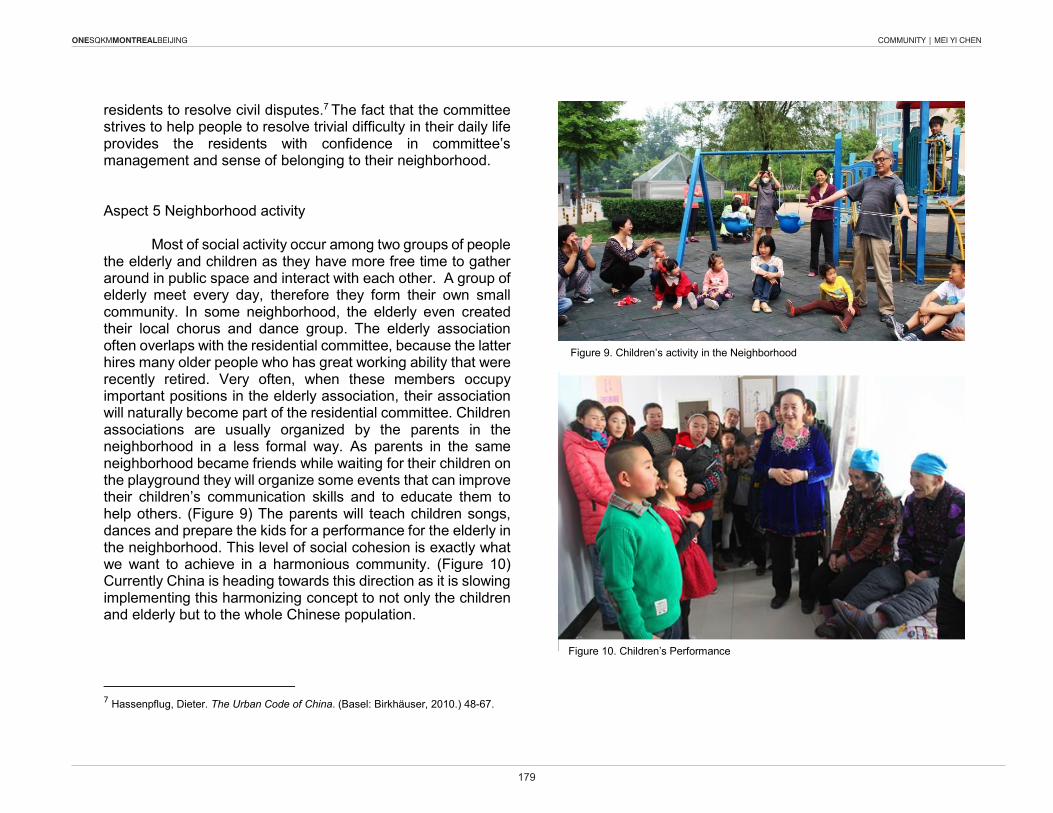
ONESQKMMONTREALBEIJING COMMUNITY | MEI YI CHEN
179
residents to resolve civil disputes.7 The fact that the committee strives to help people to resolve trivial difficulty in their daily life provides the residents with confidence in committee’s management and sense of belonging to their neighborhood.
Aspect 5 Neighborhood activity
Most of social activity occur among two groups of people the elderly and children as they have more free time to gather around in public space and interact with each other. A group of elderly meet every day, therefore they form their own small community. In some neighborhood, the elderly even created their local chorus and dance group. The elderly association often overlaps with the residential committee, because the latter hires many older people who has great working ability that were recently retired. very often, when these members occupy important positions in the elderly association, their association will naturally become part of the residential committee. Children associations are usually organized by the parents in the neighborhood in a less formal way. As parents in the same neighborhood became friends while waiting for their children on the playground they will organize some events that can improve their children’s communication skills and to educate them to help others. (Figure 9) The parents will teach children songs, dances and prepare the kids for a performance for the elderly in the neighborhood. This level of social cohesion is exactly what we want to achieve in a harmonious community. (Figure 10) Currently China is heading towards this direction as it is slowing implementing this harmonizing concept to not only the children and elderly but to the whole Chinese population. 7 Hassenpflug, Dieter. The Urban Code of China. (Basel: Birkhauser, 2010.) 48-67.
Figure 9. Children’s activity in the Neighborhood
Figure 10. Children’s Performance
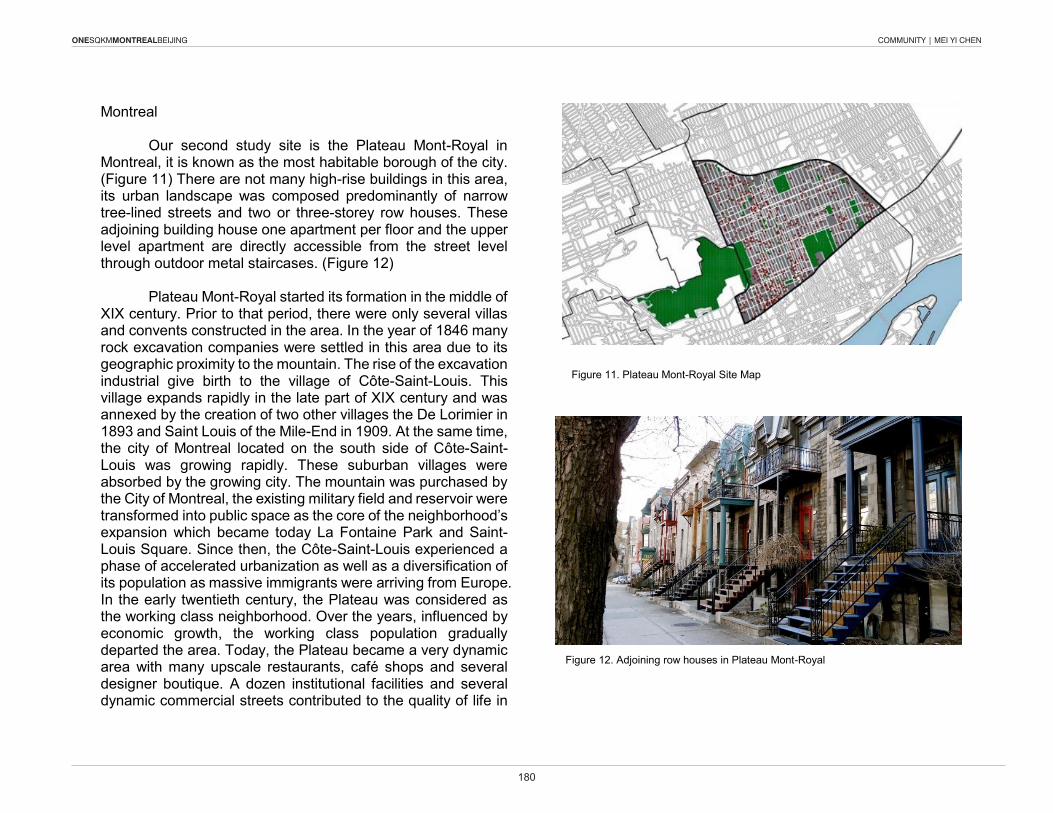
ONESQKMMONTREALBEIJING COMMUNITY | MEI YI CHEN
180
Montreal
Our second study site is the Plateau Mont-Royal in Montreal, it is known as the most habitable borough of the city. (Figure 11) There are not many high-rise buildings in this area, its urban landscape was composed predominantly of narrow tree-lined streets and two or three-storey row houses. These adjoining building house one apartment per floor and the upper level apartment are directly accessible from the street level through outdoor metal staircases. (Figure 12)
Plateau Mont-Royal started its formation in the middle of xIx century. Prior to that period, there were only several villas and convents constructed in the area. In the year of 1846 many rock excavation companies were settled in this area due to its geographic proximity to the mountain. The rise of the excavation industrial give birth to the village of Côte-Saint-Louis. This village expands rapidly in the late part of xIx century and was annexed by the creation of two other villages the De Lorimier in 1893 and Saint Louis of the Mile-End in 1909. At the same time, the city of Montreal located on the south side of Côte-Saint-Louis was growing rapidly. These suburban villages were absorbed by the growing city. The mountain was purchased by the City of Montreal, the existing military field and reservoir were transformed into public space as the core of the neighborhood’s expansion which became today La Fontaine Park and Saint- Louis Square. Since then, the Côte-Saint-Louis experienced a phase of accelerated urbanization as well as a diversification of its population as massive immigrants were arriving from Europe. In the early twentieth century, the Plateau was considered as the working class neighborhood. Over the years, influenced by economic growth, the working class population gradually departed the area. Today, the Plateau became a very dynamic area with many upscale restaurants, café shops and several designer boutique. A dozen institutional facilities and several dynamic commercial streets contributed to the quality of life in
Figure 11. Plateau Mont-Royal Site Map
Figure 12. Adjoining row houses in Plateau Mont-Royal
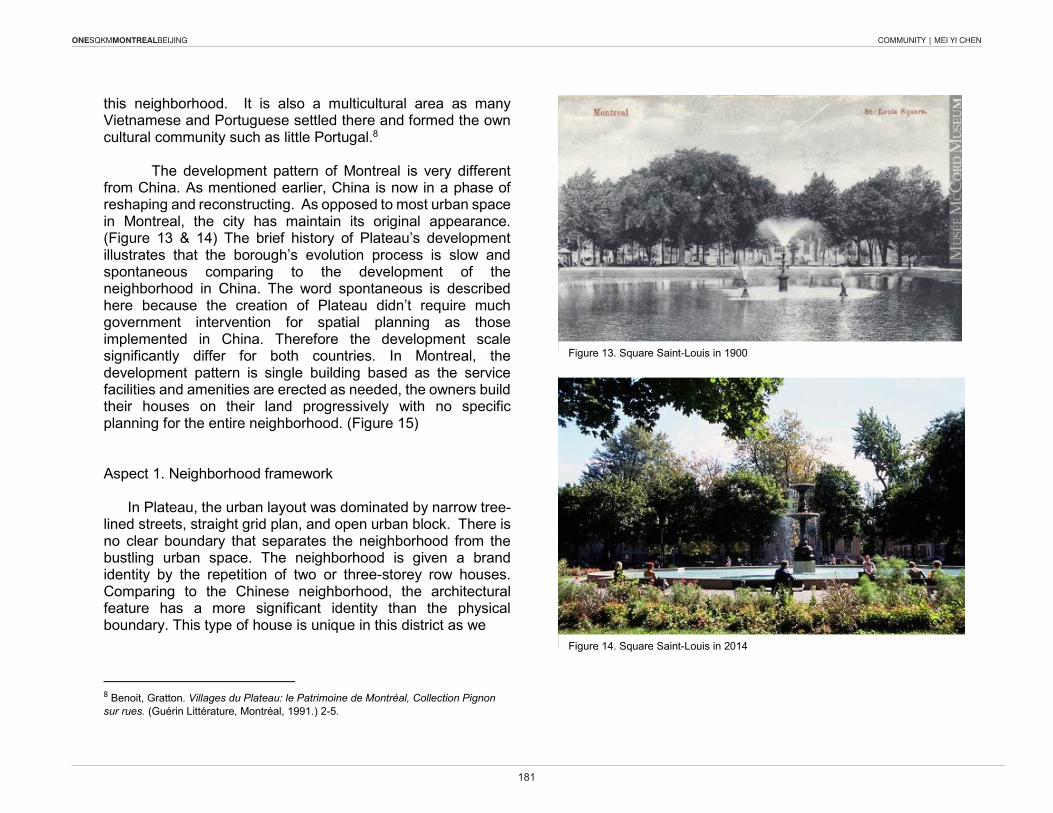
ONESQKMMONTREALBEIJING COMMUNITY | MEI YI CHEN
181
this neighborhood. It is also a multicultural area as many vietnamese and Portuguese settled there and formed the own cultural community such as little Portugal.8
The development pattern of Montreal is very different from China. As mentioned earlier, China is now in a phase of reshaping and reconstructing. As opposed to most urban space in Montreal, the city has maintain its original appearance. (Figure 13 & 14) The brief history of Plateau’s development illustrates that the borough’s evolution process is slow and spontaneous comparing to the development of the neighborhood in China. The word spontaneous is described here because the creation of Plateau didn’t require much government intervention for spatial planning as those implemented in China. Therefore the development scale significantly differ for both countries. In Montreal, the development pattern is single building based as the service facilities and amenities are erected as needed, the owners build their houses on their land progressively with no specific planning for the entire neighborhood. (Figure 15)
Aspect 1. Neighborhood framework
In Plateau, the urban layout was dominated by narrow tree-lined streets, straight grid plan, and open urban block. There is no clear boundary that separates the neighborhood from the bustling urban space. The neighborhood is given a brand identity by the repetition of two or three-storey row houses. Comparing to the Chinese neighborhood, the architectural feature has a more significant identity than the physical boundary. This type of house is unique in this district as we
8 Benoit, Gratton. Villages du Plateau: le Patrimoine de Montréal, Collection Pignon sur rues. (Guérin Littérature, Montréal, 1991.) 2-5.
Figure 13. Square Saint-Louis in 1900
Figure 14. Square Saint-Louis in 2014
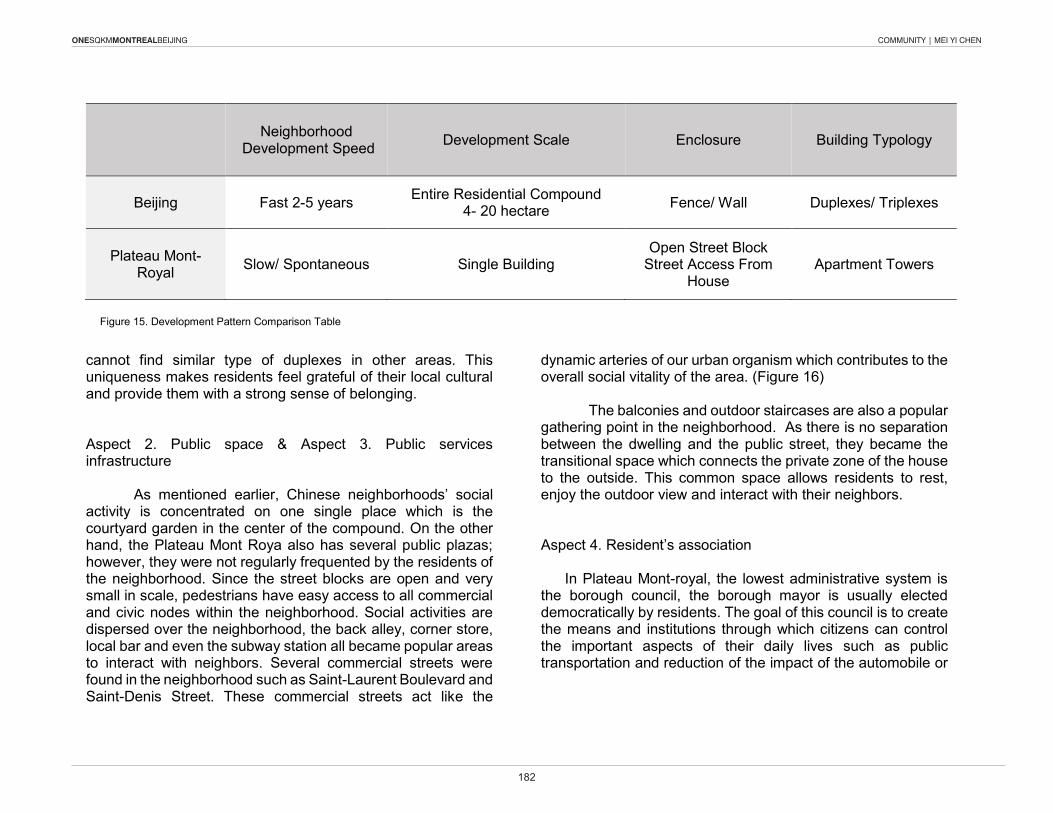
ONESQKMMONTREALBEIJING COMMUNITY | MEI YI CHEN
182
cannot find similar type of duplexes in other areas. This uniqueness makes residents feel grateful of their local cultural and provide them with a strong sense of belonging. Aspect 2. Public space & Aspect 3. Public services infrastructure
As mentioned earlier, Chinese neighborhoods’ social activity is concentrated on one single place which is the courtyard garden in the center of the compound. On the other hand, the Plateau Mont Roya also has several public plazas; however, they were not regularly frequented by the residents of the neighborhood. Since the street blocks are open and very small in scale, pedestrians have easy access to all commercial and civic nodes within the neighborhood. Social activities are dispersed over the neighborhood, the back alley, corner store, local bar and even the subway station all became popular areas to interact with neighbors. Several commercial streets were found in the neighborhood such as Saint-Laurent Boulevard and Saint-Denis Street. These commercial streets act like the
dynamic arteries of our urban organism which contributes to the overall social vitality of the area. (Figure 16)
The balconies and outdoor staircases are also a popular
gathering point in the neighborhood. As there is no separation between the dwelling and the public street, they became the transitional space which connects the private zone of the house to the outside. This common space allows residents to rest, enjoy the outdoor view and interact with their neighbors. Aspect 4. Resident’s association
In Plateau Mont-royal, the lowest administrative system is
the borough council, the borough mayor is usually elected democratically by residents. The goal of this council is to create the means and institutions through which citizens can control the important aspects of their daily lives such as public transportation and reduction of the impact of the automobile or
Neighborhood Development Speed Development Scale Enclosure Building Typology
Beijing Fast 2-5 years Entire Residential Compound 4- 20 hectare Fence/ wall Duplexes/ Triplexes
Plateau Mont-Royal Slow/ Spontaneous Single Building
Open Street Block Street Access From
House Apartment Towers
Figure 15. Development Pattern Comparison Table
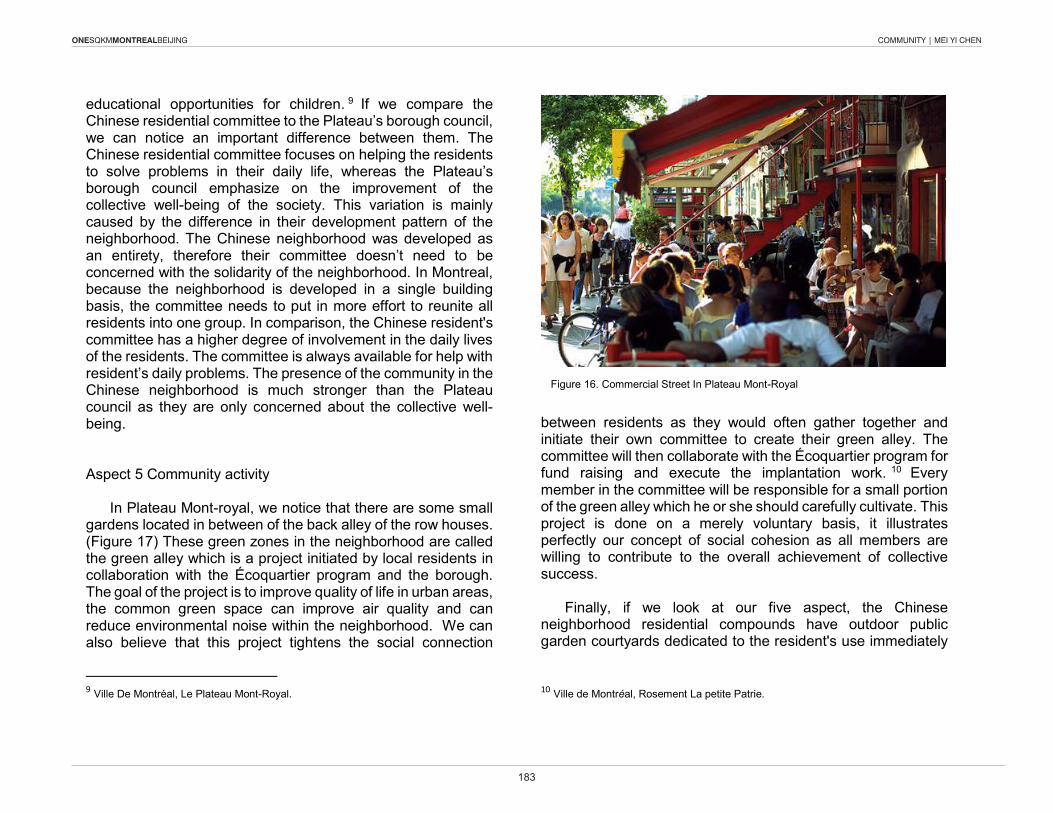
ONESQKMMONTREALBEIJING COMMUNITY | MEI YI CHEN
183
educational opportunities for children. 9 If we compare the Chinese residential committee to the Plateau’s borough council, we can notice an important difference between them. The Chinese residential committee focuses on helping the residents to solve problems in their daily life, whereas the Plateau’s borough council emphasize on the improvement of the collective well-being of the society. This variation is mainly caused by the difference in their development pattern of the neighborhood. The Chinese neighborhood was developed as an entirety, therefore their committee doesn’t need to be concerned with the solidarity of the neighborhood. In Montreal, because the neighborhood is developed in a single building basis, the committee needs to put in more effort to reunite all residents into one group. In comparison, the Chinese resident's committee has a higher degree of involvement in the daily lives of the residents. The committee is always available for help with resident’s daily problems. The presence of the community in the Chinese neighborhood is much stronger than the Plateau council as they are only concerned about the collective well-being.
Aspect 5 Community activity
In Plateau Mont-royal, we notice that there are some small gardens located in between of the back alley of the row houses. (Figure 17) These green zones in the neighborhood are called the green alley which is a project initiated by local residents in collaboration with the Écoquartier program and the borough. The goal of the project is to improve quality of life in urban areas, the common green space can improve air quality and can reduce environmental noise within the neighborhood. we can also believe that this project tightens the social connection
9 ville De Montréal, Le Plateau Mont-Royal.
between residents as they would often gather together and initiate their own committee to create their green alley. The committee will then collaborate with the Écoquartier program for fund raising and execute the implantation work. 10 Every member in the committee will be responsible for a small portion of the green alley which he or she should carefully cultivate. This project is done on a merely voluntary basis, it illustrates perfectly our concept of social cohesion as all members are willing to contribute to the overall achievement of collective success.
Finally, if we look at our five aspect, the Chinese neighborhood residential compounds have outdoor public garden courtyards dedicated to the resident's use immediately
10 ville de Montréal, Rosement La petite Patrie.
Figure 16. Commercial Street In Plateau Mont-Royal
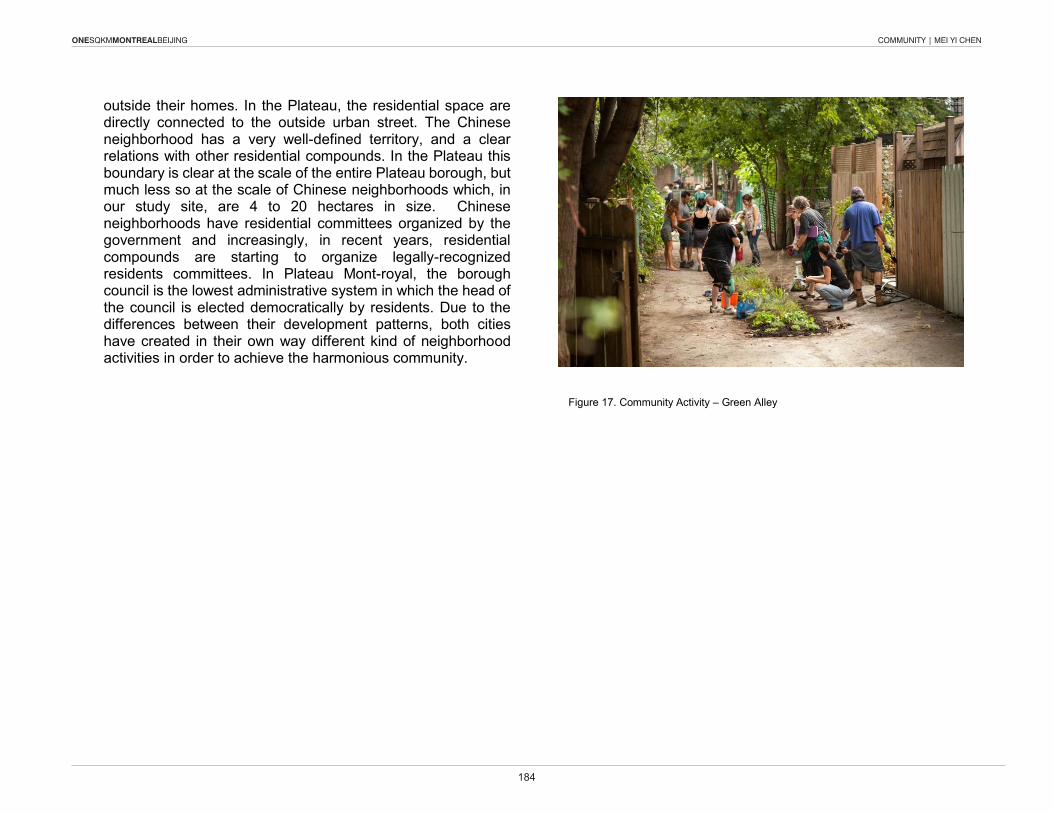
ONESQKMMONTREALBEIJING COMMUNITY | MEI YI CHEN
184
outside their homes. In the Plateau, the residential space are directly connected to the outside urban street. The Chinese neighborhood has a very well-defined territory, and a clear relations with other residential compounds. In the Plateau this boundary is clear at the scale of the entire Plateau borough, but much less so at the scale of Chinese neighborhoods which, in our study site, are 4 to 20 hectares in size. Chinese neighborhoods have residential committees organized by the government and increasingly, in recent years, residential compounds are starting to organize legally-recognized residents committees. In Plateau Mont-royal, the borough council is the lowest administrative system in which the head of the council is elected democratically by residents. Due to the differences between their development patterns, both cities have created in their own way different kind of neighborhood activities in order to achieve the harmonious community.
Figure 17. Community Activity – Green Alley
ONESQKMMONTREALBEIJING COMMUNITY | MEI YI CHEN
185
Bibliography
Park, Rogers. “Neighborhood planning theory, guidelines, and research. Can Area, population, and boundary guide conceptual frame?” Journal of Planning Literature October 9, 2014. Print. P2.
The Universal House of Justice, The Four Year Plan, pp.34-35
Stanley. “What Do We Know about Social Cohesion: The Research Perspective of the Federal Government's Social Cohesion Research Network” The Canadian Journal of Sociology / Cahiers canadiens de sociologie, Vol. 28, No. 1, Winter, 2003. Print. p5. Hay. “How will history remember us?” ReNew Canada The infrastructure magazine, May/June 2014. Print. P6.
Hassenpflug, Dieter. Birkhäuser Generalstandingorder : The Urban Code of China. Basel, CHE: Birkhäuser, 2010, p48-67. Benoit, Gratton. Villages du Plateau: le Patrimoine de Montréal, Collection Pignon sur rues. Guérin Littérature, Montréal, 1991. P2-5. ville de Montréal, Le Plateau Mont-Royal. web November 18 2014. <http://ville.montreal.qc.ca/portal/page?_pageid=7297,84229642&_dad=portal&_schema=PORTAL>
ville de Montréal, Rosement La petite Patrie. web November 22 2014.
<http://ville.montreal.qc.ca/portal/page?_pageid=7357,114005570&_dad=portal&_schema=PORTAL>

ONESQKMMONTREALBEIJING COMMUNITY | FRANÇOIS-LUC GIRALDEAU & ANITA SONG
187
THE SENSE OF COMMUNITY: THE CASE OF MONTREAL AND BEIJING 01 – INTRODUCTION AND ASSESSMENTS Neighbourhood, public space, community and identity are concepts that tend to be commonly used interchangeably by a broad spectrum of the population to refer to both a collection of people geographically bound by some physical or official designation and a group of associated people defined by a shared domain of interest, or a common heritage. The main purpose of this research paper is, as a first step, to put these similar terms side by side and sort out their subtle yet significant differences. This text proposes a systematic information framework for defining a clear understanding of the terms – some being more social in nature and others being more physical – within the context of regions. Something we deemed necessary to do, for all the differences (and similarities) in the dynamics of cultures, societies, economies, political systems, physical landscapes and the (built) environment across Montreal and Beijing. Basically, this paper strives to identify whether or not western (Canada) and Eastern (China) countries define neighbourhood, public space, community and identity the same way? If not, how do they differ? The text aims at exploring what it means to people to “come from” different areas as a way of understanding issues of belonging and attachment to these particular places. It attempts to figure out how community identity is constructed within different localized settings but more specifically, it seeks clarification on the decline of such a notion
as a response to ever-increasing individualism in our contemporary society. Is the increasing anonymity of community life the emotional cost of globalization? Does it affect us all to the same extent? These are some of the questions this paper endeavours to answer. Although much has been written about community – and neighbourhood-related topics – there remains remarkably little explication of what it means to be a neighbour, or how everyday neighbour relationships and neighbouring activities are actually managed. This study explores the ways in which neighbourhood identity is formed and tends to focus on the experience of community rather than its physical structure.
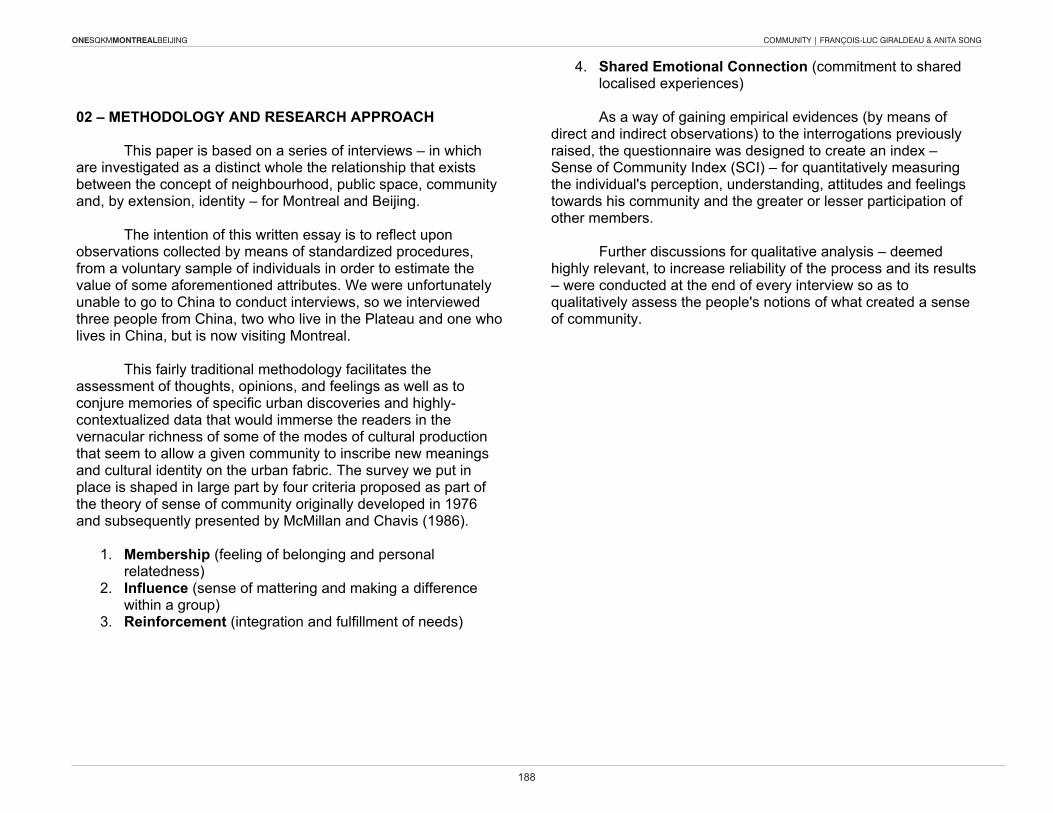
ONESQKMMONTREALBEIJING COMMUNITY | FRANÇOIS-LUC GIRALDEAU & ANITA SONG
188
02 – METHODOLOGY AND RESEARCH APPROACH This paper is based on a series of interviews – in which are investigated as a distinct whole the relationship that exists between the concept of neighbourhood, public space, community and, by extension, identity – for Montreal and Beijing. The intention of this written essay is to reflect upon observations collected by means of standardized procedures, from a voluntary sample of individuals in order to estimate the value of some aforementioned attributes. we were unfortunately unable to go to China to conduct interviews, so we interviewed three people from China, two who live in the Plateau and one who lives in China, but is now visiting Montreal. This fairly traditional methodology facilitates the assessment of thoughts, opinions, and feelings as well as to conjure memories of specific urban discoveries and highly-contextualized data that would immerse the readers in the vernacular richness of some of the modes of cultural production that seem to allow a given community to inscribe new meanings and cultural identity on the urban fabric. The survey we put in place is shaped in large part by four criteria proposed as part of the theory of sense of community originally developed in 1976 and subsequently presented by McMillan and Chavis (1986).
1. Membership (feeling of belonging and personal relatedness)
2. Influence (sense of mattering and making a difference within a group)
3. Reinforcement (integration and fulfillment of needs)
4. Shared Emotional Connection (commitment to shared localised experiences)
As a way of gaining empirical evidences (by means of direct and indirect observations) to the interrogations previously raised, the questionnaire was designed to create an index – Sense of Community Index (SCI) – for quantitatively measuring the individual's perception, understanding, attitudes and feelings towards his community and the greater or lesser participation of other members. Further discussions for qualitative analysis – deemed highly relevant, to increase reliability of the process and its results – were conducted at the end of every interview so as to qualitatively assess the people's notions of what created a sense of community.
ONESQKMMONTREALBEIJING COMMUNITY | FRANÇOIS-LUC GIRALDEAU & ANITA SONG
189
03 [A] – FIRST RESPONDENT (MONTREAL) Demographic Information
Age – 26 Sex – Female Occupation – Student Place of residence – Plateau-Mont-Royal (Milton Parc) Living situation – Single (lives with roommates) Annual income – Between $0 and $12 999
was born in Japan and lived in various Canadian cities over the past few years. She has just moved to Montreal for school and decided to settle on the Plateau-Mont-Royal because of its cultural richness and its closeness to the McGill campus. Quantitative and Qualitative Measure of Sense of Community To share a sense of community with other members is not as important as school. Her current needs comprise of the following: a good studying atmosphere and an adequate framework within which she can get a taste of the local culture. Her place within the school community has allowed for her needs to be easily met. She is someone eager to learn, accept challenges and make an impact on others around her. She needs to be surrounded by motivated people who share commitment around a common purpose. She generally feels like she can trust other members of her community. That being said, she believes that the quality of her answer would gain from a more precise definition of the term. She certainly doesn’t trust her colleagues the same way she trusts her neighbours. when asked if whether or not she would be able to recognize most of the members of her community, she
started to refer to her school club as another community that she feels a part of. She then went on to say that her school community has certain symbols of membership that people can recognize (how members dress and their aesthetic sensibility). She tries to put a lot of time and effort into being part of her community and fit in as much as possible. Being a member of this community is part of her identity, as a student and as a Montrealer. She referred to other members as “friends” but also as “colleagues”. She feels like everyone on the Plateau is very open-minded. This would perhaps be explained by the fact that everyone seems to have already been through the same process of “being accepted”. She cares about what other community members think of her but comfort and safety are often quoted as what is “most important”. She stated that she prefers to lay out her patterns of thought and action by herself. when asked if the community has good leaders, the respondent made a difference between her school club (where everyone is participating) and her neighbourhood (where the building manager takes on the leading role). It thus seemed like the type of leader could be an indicator of the size of the community. Surprisingly (given her tendency to move around a lot), she expects to be part of the Montreal community for a long time, which she qualifies as “very inclusive” and “conducive to catalyzing diverse relationships”. Although no one has made a comment about it, she still feels the need to learn French in order to become fully part of the Montreal community.
ONESQKMMONTREALBEIJING COMMUNITY | FRANÇOIS-LUC GIRALDEAU & ANITA SONG
190
03 [B] – SECOND RESPONDENT (MONTREAL) Demographic Information
Age – 36 Sex – Male Occupation – Lawyer Place of residence – Plateau-Mont-Royal (Mile End) Living situation – Married with one child Annual income – Between $51 000 and $99 000
A Native of Montreal, he was raised in Outremont and is an only child. He has lived his whole life in Montreal, although he spent three years studying in Los Angeles. Has been living on the Plateau with his wife and child for a certain number of years now. Quantitative and Qualitative Measure of Sense of Community As an attorney, the respondent specializes in cases involving social security issues and is a strong supporter of pro bono legal services. He tries to share his passion for helping the less fortunate, the marginalized and struggling families with other locals. He makes no difference between his place of residence and place of work (dedicated to improve the neighbourhood life through his work). He thinks that overall, the community has been successful in getting the needs of its member yet but points out that there is always room for improvement. He is proud to be taking part in various initiatives that are meant to discuss any local issues members of the local community (his neighbourhood) might be concerned about or interested in, and in which locals’ opinions are valued and highly considered. The municipality and local councillors are very understanding and open to engaging in dialogue with young
people at a local level. The respondent mentioned that he has to remain somewhat neutral with the population given his status of “leader” and “problem solver” within the community. He believes in a strong correlation between diversity (whether it is economic or ethnic) and high neighbourhood quality of life. He was first attracted by the fact that on the Plateau, it is “impossible to share everything with everyone” and “everyone can learn from each other”. when asked whether or not he could trust other members of his community, the respondent answered by saying that he would feel comfortable giving a next-door neighbour a key to his house (something he would have never done when he was living in Los Angeles). He mentioned that his neighbourhood community has certain symbols of membership may sometimes reinforce a superficial caricature of the locals’ values, lifestyle patterns and habits. Most community members know him because of his involvement in various social activities (he tries to put as much time and effort as he can into being part of his community. He encourages young people to do the same). Because of the Plateau’s rapid pace of urban evolution, it does attract hip young professionals and is certainly perceived as one of the trendiest area of the city. However, it also allows for young parents who want to provide their children with an open and stimulating environment, where they can constantly make new discoveries. His job allows him to make sure everyone fits into the community. He tries to set a good example and works to make the Plateau a model that other neighbourhood can learn from. Its population is globally very involved and rather optimistic. He feels very thankful to other members of the community for what he had
ONESQKMMONTREALBEIJING COMMUNITY | FRANÇOIS-LUC GIRALDEAU & ANITA SONG
191
the chance to learn from them (culture, traditions etc.). It is important to him that as many members trust him as much as he trust them. when questioned about whether or not he is influenced by what the community is like, the respondent kept referring to his job as means for improving the neighbourhood’s quality of life. Everyone seems to be leading or at least actively participating in initiatives meant to improve and develop the neighbourhood. Strangely enough, he mentioned that although he would like to live in the area longer, he would not exclude the idea of moving if his interests or needs change. He shares concerns about the neighbourhood’s ability to adapt itself to his shifting interests and evolving situation. Although he feels hopeful about the future of his community, he thinks it is important to keep working on improving every aspect of it (never-ending process). He concluded by noting that the ever-increasing anonymity within the community might become a problem.
ONESQKMMONTREALBEIJING COMMUNITY | FRANÇOIS-LUC GIRALDEAU & ANITA SONG
192
03 [C] – THIRD RESPONDENT (MONTREAL) Demographic Information
Age – 85 Sex – Female Occupation – Retired Place of residence – Plateau-Mont-Royal (Mile End) Living situation – Married with five children Annual income – N/A
A native of Poland, has been living in the United States for a few years before moving to Montreal in order to establish her family with her late husband. She has always been living on the Plateau and is not planning on moving. For many years, she was considered to be a highly valued part of her local church. She tries to continue to be actively involved in the church’s activities but her mobility has become somewhat limited. Quantitative and Qualitative Measure of Sense of Community She does not feel a sense of community with other members is as important anymore while getting older. It is not as easy for her to meet with the others as often anymore. She meets them once or twice a week more for leisure. Her limited physical capacity reduces the community activities she can be involved. Church is her main community but a number of people involved are deceased, and the scale of the community is reduced. She has a hard time finding a connection to other church communities. New technologies involved with the communities keep distances from her. Since she is not from a generation familiar with computers, the new communities more focused and
involved with technologies do not appear as attractive as her church community which is more about human interaction. Her church community is important not only because the church members are religiously connected, but also church becomes where people gather and communicate. More time she spends at church, more expectations she builds how they can achieve the same goal together. when it goes different directions than she expects, she loses her interest in participating. Now she sees less people sharing the same value in the new church communities. while church becomes more of cultural symbol in Montreal and less people go to church these days, her church also has financial difficulties. Less funding reduces public events and activities shared. Church used to be her everyday life and she could not focus on career. She used to attend the church’s regular meeting to discuss ways of helping people coming to the church and in the neighbourhood. Churches in Montreal have clear geometry boundaries. So similar social groups are created from each church. She trusts people because she likes to help others based on what she believes. All church members know each other because the church is small and all the residents attending the church have lived in the same neighbourhood for a long time. She explained herself that she is very generous, giving person that community appreciates and encourages to pass over the good sprit to the next generation and the others. Her church used to be more open to everyone regarding of their age, religion, and social status. Her church wanted to offer what they had from Catholicism. They have been trying to bring good influence over the other surrounding communities without judging them.
ONESQKMMONTREALBEIJING COMMUNITY | FRANÇOIS-LUC GIRALDEAU & ANITA SONG
193
She was more actively involved and reached a level of leader of her church community. The leader’s position is to organize the activities; the church members are encouraged to be equally distributed to the activities. Everyone has right to make a voice to speak out their opinions on what the community is responsible for. Sharing common events was very important before. Her church used to host fundraising events to finance the church and other local community activities as well as gather the neighbours and visitors to allow them to talk and interact. However, the changes in social involvement in churches in general makes her church runs down. It saddens her but she tries to face reality. Now she is less encouraged to worry about her community but worry about her own health.
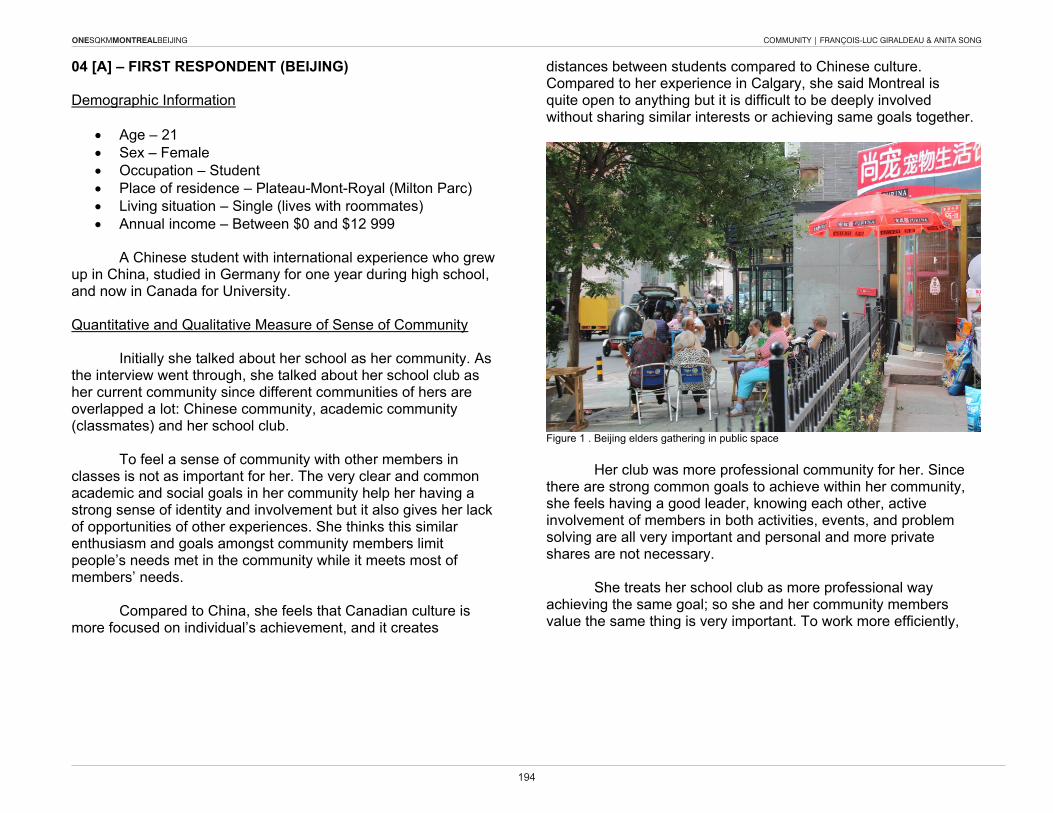
ONESQKMMONTREALBEIJING COMMUNITY | FRANÇOIS-LUC GIRALDEAU & ANITA SONG
194
04 [A] – FIRST RESPONDENT (BEIJING) Demographic Information
Age – 21 Sex – Female Occupation – Student Place of residence – Plateau-Mont-Royal (Milton Parc) Living situation – Single (lives with roommates) Annual income – Between $0 and $12 999
A Chinese student with international experience who grew up in China, studied in Germany for one year during high school, and now in Canada for University. Quantitative and Qualitative Measure of Sense of Community Initially she talked about her school as her community. As the interview went through, she talked about her school club as her current community since different communities of hers are overlapped a lot: Chinese community, academic community (classmates) and her school club. To feel a sense of community with other members in classes is not as important for her. The very clear and common academic and social goals in her community help her having a strong sense of identity and involvement but it also gives her lack of opportunities of other experiences. She thinks this similar enthusiasm and goals amongst community members limit people’s needs met in the community while it meets most of members’ needs. Compared to China, she feels that Canadian culture is more focused on individual’s achievement, and it creates
distances between students compared to Chinese culture. Compared to her experience in Calgary, she said Montreal is quite open to anything but it is difficult to be deeply involved without sharing similar interests or achieving same goals together.
Figure 1 . Beijing elders gathering in public space Her club was more professional community for her. Since there are strong common goals to achieve within her community, she feels having a good leader, knowing each other, active involvement of members in both activities, events, and problem solving are all very important and personal and more private shares are not necessary. She treats her school club as more professional way achieving the same goal; so she and her community members value the same thing is very important. To work more efficiently,
ONESQKMMONTREALBEIJING COMMUNITY | FRANÇOIS-LUC GIRALDEAU & ANITA SONG
195
problem solving in the community is very important to her. She feels it is needed to trust people to process a goal. She expects to have the relationship with her school club for a long term through online and social connection amongst members, although she does not see its future as a school club is very stable and long last since it is still in the boundary of another bigger community, school, that they cannot control. Her living experience in the Plateau and Montreal has been only focused on her school activities and studies. Her neighbourhood and place to live are used as a method to have and to be involved in the school club. She cares less about where she is living; during the interview she never mentioned about the Plateau as her community. To her, physical boundary matters less to define a community. She talked about her past experiences in China, her high school experience for a couple of times as a comparison. She also talked about the different life styles in China, Calgary and Plateau in Montreal; Chinese tends to do everything in groups, residences in Calgary are more about working individually but localized at the same time while Plateau residences are very diversity especially at school. She said, the differences in the life style gave her different sense of belongings to communities. She said, having a common goal in a group helps people to interact with each other and actively involved but also at the same time it limits the boundary too tight and gives lack of diversity of experience; it narrows the level of trust amongst people.
ONESQKMMONTREALBEIJING COMMUNITY | FRANÇOIS-LUC GIRALDEAU & ANITA SONG
196
04 [B] – SECOND RESPONDENT (BEIJING) Demographic Information
Age – 22 Sex – Female Occupation – Student Place of residence – Plateau-Mont-Royal (Mile End) Living situation – Single (lives with roommates) Annual income – Between $0 and $12 999
Born in China, immigrated with her parents to vancouver at young age, came to Montreal for school, and has lived in the Plateau for the last 3 years. Mixture of both culture, Chinese and Canadian, hybrid personality, not belonged to either. It was difficult to balance both for the teenage years, but now feel more comfortable to live in both cultures. Quantitative and Qualitative Measure of Sense of Community Her definition of community varies based on how she indicates her situation. She differs her basic standards in Montreal, in vancouver, and in China. She feels the strongest sense of community in China, her hometown, where she is born and spends the most of her time. She used to live right next to a University. There were full of street vendors, noise, and busy passengers throughout the day. And the intertwined active movements made her deeply related to the neighbourhood with the neighbours. She feels the least strong sense of community in vancouver. Since it was not her choice of living there and facing a new environment without speaking the language frustrated her for
a long time. She has the mix feeling but it ended up grown the second home. The sense of community in Montreal is weaker than in China and stronger than in vancouver. It was the town she decided to move, and she feels more independent. when she lived in school residence, she feels more attached to the school community as surrounded by students going to the same school. Since she lives alone, even though she still lives close to school, now she feel more less attached to her school community and it added her other activities outside the school community As she grows up she feels more responsible to be a part of her neighbourhood community. She does not expect to have the same value with the neighbours but having people sharing similarities in any sorts of way makes her stronger belongings. Although she never thinks about how other neighbours or students meet their needs in the neighbourhood or school, she likes to talk to them. During the interview she realized that she cares less about her community members’ individual needs. She is from a wealthy family that everyone used to pay too much attention when she was in China. Since then she does not enjoy people’s attention. She likes to keep some distance from her communities she has been involved, so she can keep her privacy. After she moved to vancouver, she started to acknowledge sensitive environments such as financial. Then she started to divide what to share and what not to share with her neighbours. She talks about her stories only to selective people, but when it is related to work, she becomes very open and talkative about her opinion. Her basic needs in her community, neighbourhood are security and safety. She likes to keep safe distances from her neighbours so she can trust them that they are safe to her meanwhile she can spend her privacy for her own
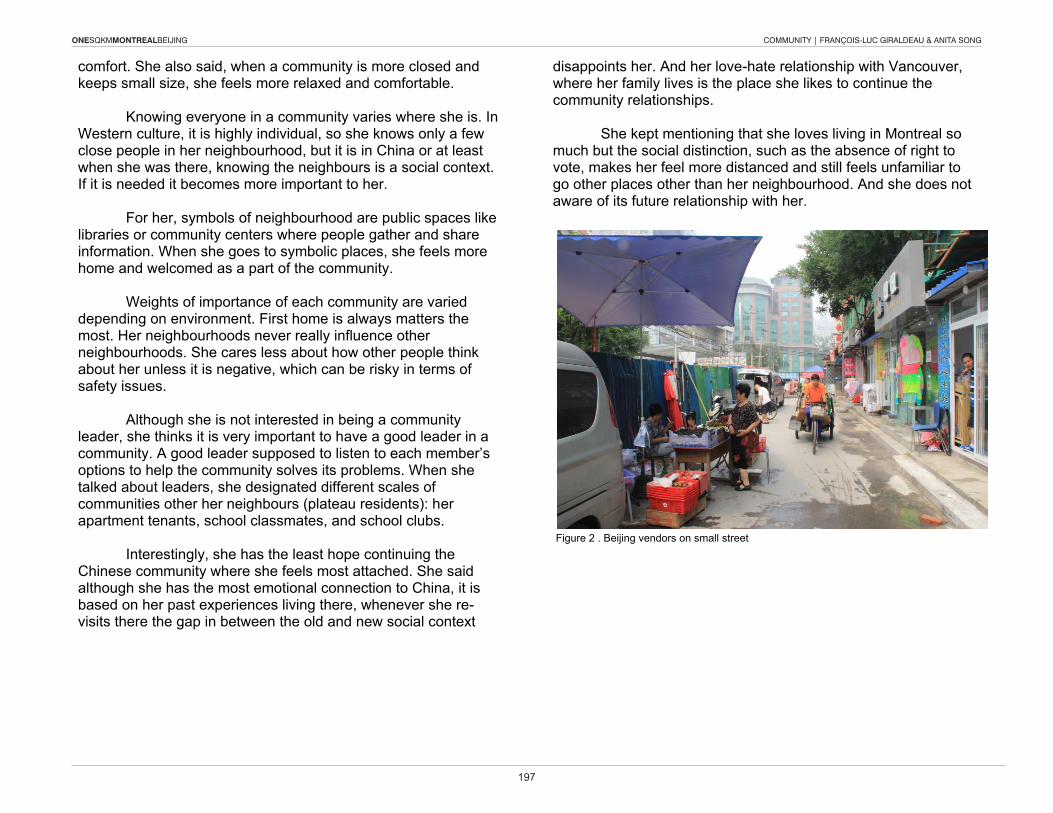
ONESQKMMONTREALBEIJING COMMUNITY | FRANÇOIS-LUC GIRALDEAU & ANITA SONG
197
comfort. She also said, when a community is more closed and keeps small size, she feels more relaxed and comfortable. Knowing everyone in a community varies where she is. In western culture, it is highly individual, so she knows only a few close people in her neighbourhood, but it is in China or at least when she was there, knowing the neighbours is a social context. If it is needed it becomes more important to her. For her, symbols of neighbourhood are public spaces like libraries or community centers where people gather and share information. when she goes to symbolic places, she feels more home and welcomed as a part of the community. weights of importance of each community are varied depending on environment. First home is always matters the most. Her neighbourhoods never really influence other neighbourhoods. She cares less about how other people think about her unless it is negative, which can be risky in terms of safety issues. Although she is not interested in being a community leader, she thinks it is very important to have a good leader in a community. A good leader supposed to listen to each member’s options to help the community solves its problems. when she talked about leaders, she designated different scales of communities other her neighbours (plateau residents): her apartment tenants, school classmates, and school clubs. Interestingly, she has the least hope continuing the Chinese community where she feels most attached. She said although she has the most emotional connection to China, it is based on her past experiences living there, whenever she re-visits there the gap in between the old and new social context
disappoints her. And her love-hate relationship with vancouver, where her family lives is the place she likes to continue the community relationships. She kept mentioning that she loves living in Montreal so much but the social distinction, such as the absence of right to vote, makes her feel more distanced and still feels unfamiliar to go other places other than her neighbourhood. And she does not aware of its future relationship with her.
Figure 2 . Beijing vendors on small street
ONESQKMMONTREALBEIJING COMMUNITY | FRANÇOIS-LUC GIRALDEAU & ANITA SONG
198
04 [C] – THIRD RESPONDENT (BEIJING) Demographic Information
Age – 59 Sex – Female Occupation – Entrepreneur Place of residence – China (Beijing) Living situation – Married with one child Annual income – Between $50 000 and $150 000
Born in China, a mother of one child studying abroad. She has been married for over twenty years. She has been working since graduating from university. Quantitative and Qualitative Measure of Sense of Community Having a sense of community with others is very important. It measures how good environment her family lives. She lives in the same area where her colleagues live, so her community is her neighbourhood and workspace, as well as her family. Her different communities interact a lot, and the community members are like a big family, helping each other when it’s needed. She thinks her important needs are met in the neighbourhood because her family and work satisfy her personal and career needs. To make a better community and keep the current standards are important, but not everything can be pursued at the same time, and not everyone’s needs are met. She thinks everyone in her neighbourhood and her work try hard to keep the good community in the way they wanted.
Having a sense of belonging is very important for herself and her family. Sometimes there are no clear people in charge in the community. It might be hard to solve some problems due to bureaucratic complexity. The neighbours have similar needs, priorities and goals because they are the features why people moved to this neighbourhood. Although she trusts people, she shares her personal stories only with selective people. Fraud and corruption have increased in China over the past decades. Old neighbours all know each other, but she does not know new members if the community. The neighbourhood itself and its name are the symbols of the community. These days, she tends to spend more time with her family. And it decreases the amount of time spent for the neighbourhood and especially for work. Being a part of this community is a big part of her identity, and fitting into the community is very important for her. It does not matter how her neighbourhood influences other neighbourhood because she is not thinking about leaving anytime soon. It more matters whether the community members care about each other, which how it is now. Overall relationship is more important than individuals’ comments about her. It is hard to gather people voluntarily. when there is a problem in the community, “street office” or building management will deal with the problems to solve it. However, it is hard to tell if there is a particularly position for a leader.
ONESQKMMONTREALBEIJING COMMUNITY | FRANÇOIS-LUC GIRALDEAU & ANITA SONG
199
Everyone must be able to participate to make a good community, but if they have a good stable person leading the meetings, that would be more helpful. Since her neighbours are her colleagues, they have a relatively better community management and leaders. Because she is busy working and dealing with family, she’s short with time spending with the other neighbours and assumes the same for the others. There used to be more shared events within the neighbourhood in the past, but social structure has been changed. Now they don’t spend extra time together other than working together at work unless they are personal friends. She used to have more hopeful for the community, but things have been changed for the last ten years. She cannot predict the same as before.
ONESQKMMONTREALBEIJING COMMUNITY | FRANÇOIS-LUC GIRALDEAU & ANITA SONG
200
05 – OBSERVATIONS AND PRELIMINARY ANALYSIS while the terms can be defined in a number of ways, they also evoke different thoughts from one person to the other. It thus seemed more appropriate to consider developing our very own definitions based on the information we collected through out the interviews we conducted with local residents. Embracing a more western outlook on the subject, the Montreal respondents were defining a community as a social entity that shares interests and values, and have a common history. within the framework of our investigation, people seemed to refer to their community as a relatively small-scale social existence that extends beyond immediate genealogical ties and remains valuable to their identity. we came to realize that the concept of community has rather weak geographical constraints. Urban structures and the location of daily activities have become somehow vestigial concepts and ideas, something we consider to be a very clear consequence of our increased virtual mobility. And that brings us to talk about the concepts of neighbourhood and public space. The differentiation between the territorial and relational dimensions of a community has also come up a few times. The relational dimension of community has to do with the nature and quality of relationships in that community, and some communities may even have no discernible territorial demarcation. Other communities may seem to be defined primarily according to territory, as in the case of neighbourhoods – which
set the boundaries for belonging – but even in such cases, proximity or shared territory cannot by itself constitute a community. Nevertheless, the neighbourhood refers to a geographically localised body within a larger area, registering face-to-face interaction among residents and defined functionally as a set of social networks. within a neighbourhood, proximity is very important, though the boundaries of these neighbourhoods are often relative. A neighbourhood is likely to change as your perception of it becomes more complex and coloured with recognition of this or that local bar or restaurant. In Montreal, boundaries rather define the logistical time and place settings for a group to act as an actual group. As for the sense of Community, it is seen as a feeling of belonging together, a feeling that there is an authority structure in which the members can put their faith, and that every individual can benefit from interacting with other members. The term underlies that cultural production comes from shared experiences. Being a member of a given community allows most of the respondents to develop a form of emotional safety that encourages self-disclosure and intimacy. The need for connections to others in order to express unique aspects of their personality seems to be indispensable. That being said, some of the more "community-aware" respondents tended to believe that the study of the evolution of territorial and non-territorial communities, the tangible supports and networks that develop within various communities, the
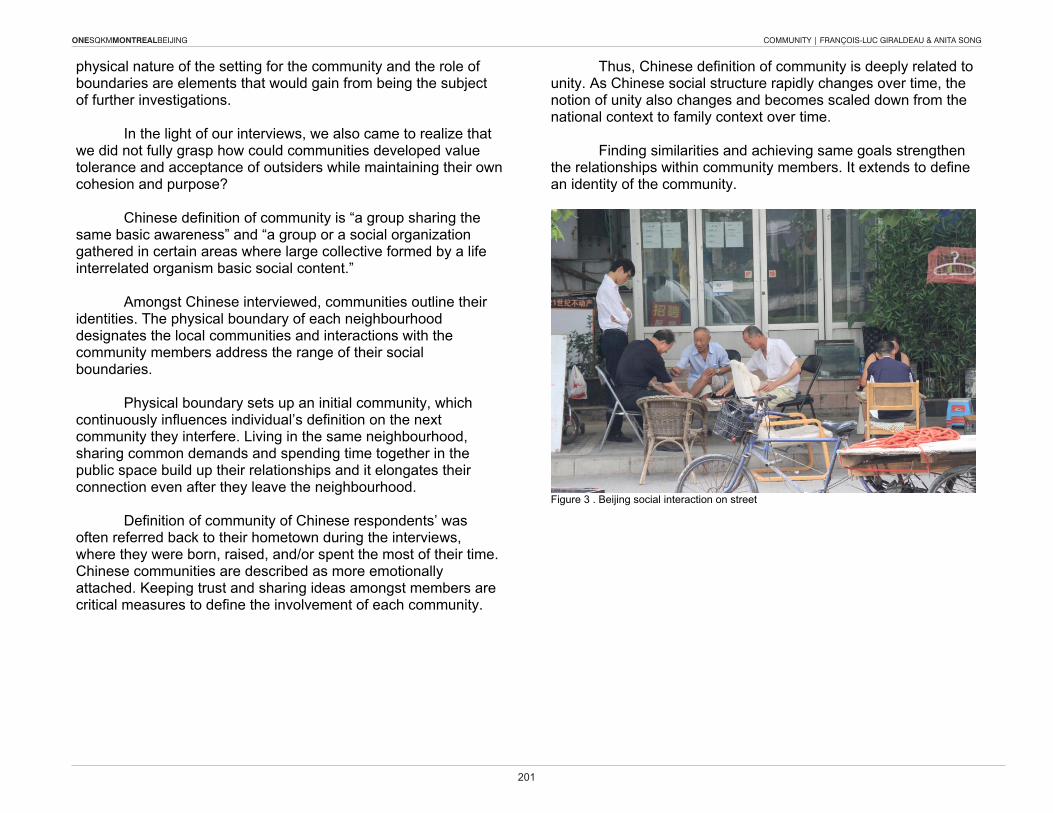
ONESQKMMONTREALBEIJING COMMUNITY | FRANÇOIS-LUC GIRALDEAU & ANITA SONG
201
physical nature of the setting for the community and the role of boundaries are elements that would gain from being the subject of further investigations. In the light of our interviews, we also came to realize that we did not fully grasp how could communities developed value tolerance and acceptance of outsiders while maintaining their own cohesion and purpose? Chinese definition of community is “a group sharing the same basic awareness” and “a group or a social organization gathered in certain areas where large collective formed by a life interrelated organism basic social content.” Amongst Chinese interviewed, communities outline their identities. The physical boundary of each neighbourhood designates the local communities and interactions with the community members address the range of their social boundaries. Physical boundary sets up an initial community, which continuously influences individual’s definition on the next community they interfere. Living in the same neighbourhood, sharing common demands and spending time together in the public space build up their relationships and it elongates their connection even after they leave the neighbourhood. Definition of community of Chinese respondents’ was often referred back to their hometown during the interviews, where they were born, raised, and/or spent the most of their time. Chinese communities are described as more emotionally attached. Keeping trust and sharing ideas amongst members are critical measures to define the involvement of each community.
Thus, Chinese definition of community is deeply related to unity. As Chinese social structure rapidly changes over time, the notion of unity also changes and becomes scaled down from the national context to family context over time. Finding similarities and achieving same goals strengthen the relationships within community members. It extends to define an identity of the community.
Figure 3 . Beijing social interaction on street
ONESQKMMONTREALBEIJING COMMUNITY | FRANÇOIS-LUC GIRALDEAU & ANITA SONG
202
06 – COMPARISONS AND CONCLUSION we observed that most Montreal respondents, once they share similar goals with a certain group of people, they tend to be significantly more involved in the community and take pride all the more in their collective achievements as a group. The strongest relationships, within a community, are largely based on social activities and everyday social practices. As the members engage in more collective pursuits and undertake various group projects, the level of trust tends to be very high and the communication extremely open. The second Montreal respondent addressed the Plateau neighborhood, a physically defined community, is where he lives with his family, works for living, and spends time and effort for its better future. Depending on the nature and the scale of a given community, the definition of trust (depending on whether it has grown within the personal or professional realm) may vary, fluctuating in meaning and intensity. That being said, it remains prevalent in most – if not all – cases we analyzed throughout the research. Regardless of the individuals’ initial level of involvement in the community, once it feels stable and safe – often when members understand that they have people like them they can turn to, the respondent seemed more inclined to acknowledge its influence on his or her identity and overall well-being. we were also able to note that communities, through an array of collective – and yet very subtle – behavioural patterns are able to influence other communities alike. It is a phenomenon, which, according to our observations, happens unconsciously and without consideration of what is actually being done.
Nevertheless, the Montreal respondents’ identity seemed to be globally rooted in more individual endeavours. Chinese respondents, on the other hand, defined themselves as individuals who are part of a larger group, and that they are responsible for their health and social well-being. The belonging to a community was automatically and systematically implied. Most of the projects undertook by an individual, required the medium and long-term participation of at least one other member of the group of people he or she felt more attached to. Chinese respondents were outspoken advocate of a culture of sharing and living through depending on each other. But it seemed like Beijing was so developed that the contrast with Montreal was not optimal, at least for the purpose of this paper. We have been told on multiple occasions that this “local culture” was further testified – and apparently even stronger – in rural and more traditional settings. As a matter of fact, most of the Chinese respondents we interviewed were generally referring to their hometown (areas not as developed as Beijing) to support their stories with examples. The “Chinese” definition of community relates largely to the concept of spiritual unity and emotional fulfilment. The social networks within the community were fed by deep and committed relationships that will stand the test of time and physical strains. For Montrealers, social contexts and structures are changed as they are carried over to the next generation while Chinese have these changes during a generation. This difference between cultural flow makes differences in speed of community involvement and behaviour toward problem solving. Chinese are more flexible with adopting imperfection of a community and accept the difference between the members. Montrealers tend to
ONESQKMMONTREALBEIJING COMMUNITY | FRANÇOIS-LUC GIRALDEAU & ANITA SONG
203
keep the traditions of community more in the same way, and have more time and effort to fix problems in their communities. It was interesting to hear the Chinese respondents stating that the traditional definition of community usually refers to spatial and administrative considerations. In China, community is also called residential unit, residential quarter and sometimes, simply neighbourhood or residential community. Originally, other members of your community could have a very different set of interests and experiences (based on their individual characteristics). Communities had homogeneous characteristics in their social composition. For that matter, the participation of the members of a community was measured in terms of the level of residents’ participation in state organized residential compounds (or community buildings).
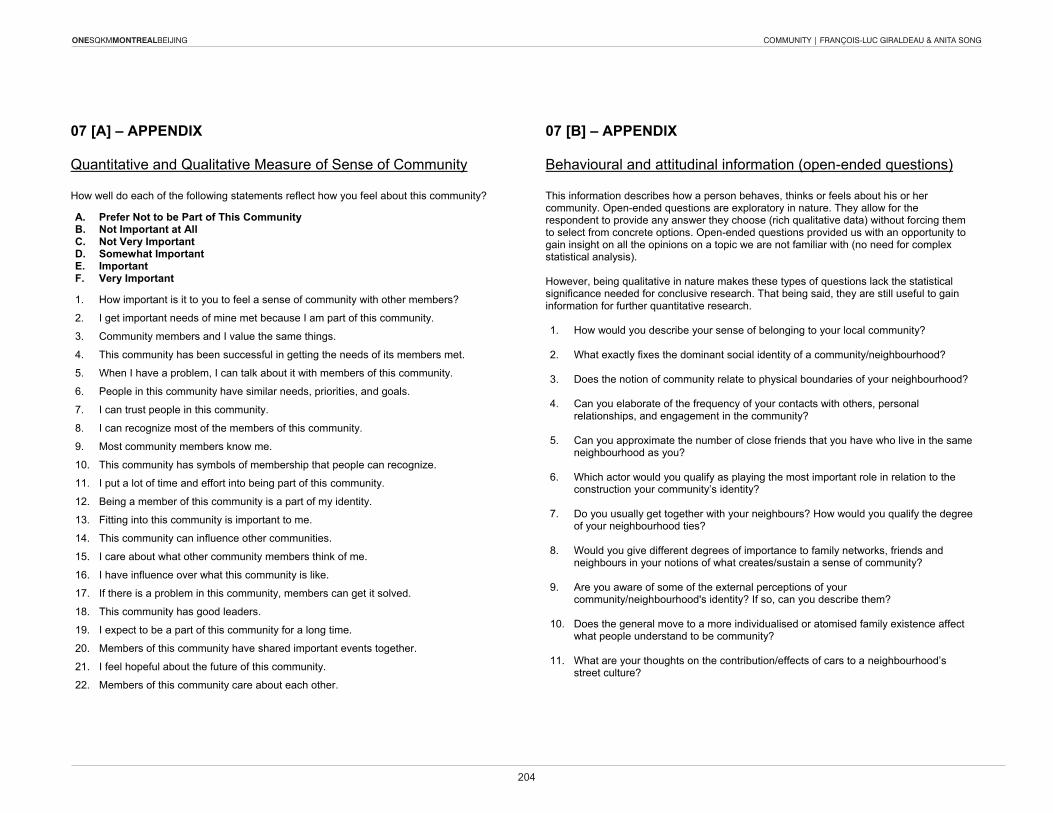
ONESQKMMONTREALBEIJING COMMUNITY | FRANÇOIS-LUC GIRALDEAU & ANITA SONG
204
07 [A] – APPENDIX Quantitative and Qualitative Measure of Sense of Community How well do each of the following statements reflect how you feel about this community? A. Prefer Not to be Part of This Community B. Not Important at All C. Not Very Important D. Somewhat Important E. Important F. Very Important
1. How important is it to you to feel a sense of community with other members?
2. I get important needs of mine met because I am part of this community.
3. Community members and I value the same things.
4. This community has been successful in getting the needs of its members met.
5. when I have a problem, I can talk about it with members of this community.
6. People in this community have similar needs, priorities, and goals.
7. I can trust people in this community.
8. I can recognize most of the members of this community.
9. Most community members know me.
10. This community has symbols of membership that people can recognize.
11. I put a lot of time and effort into being part of this community.
12. Being a member of this community is a part of my identity.
13. Fitting into this community is important to me.
14. This community can influence other communities.
15. I care about what other community members think of me.
16. I have influence over what this community is like.
17. If there is a problem in this community, members can get it solved.
18. This community has good leaders.
19. I expect to be a part of this community for a long time.
20. Members of this community have shared important events together.
21. I feel hopeful about the future of this community.
22. Members of this community care about each other.
07 [B] – APPENDIX Behavioural and attitudinal information (open-ended questions) This information describes how a person behaves, thinks or feels about his or her community. Open-ended questions are exploratory in nature. They allow for the respondent to provide any answer they choose (rich qualitative data) without forcing them to select from concrete options. Open-ended questions provided us with an opportunity to gain insight on all the opinions on a topic we are not familiar with (no need for complex statistical analysis). However, being qualitative in nature makes these types of questions lack the statistical significance needed for conclusive research. That being said, they are still useful to gain information for further quantitative research. 1. How would you describe your sense of belonging to your local community?
2. what exactly fixes the dominant social identity of a community/neighbourhood?
3. Does the notion of community relate to physical boundaries of your neighbourhood?
4. Can you elaborate of the frequency of your contacts with others, personal
relationships, and engagement in the community?
5. Can you approximate the number of close friends that you have who live in the same neighbourhood as you?
6. which actor would you qualify as playing the most important role in relation to the construction your community’s identity?
7. Do you usually get together with your neighbours? How would you qualify the degree of your neighbourhood ties?
8. would you give different degrees of importance to family networks, friends and neighbours in your notions of what creates/sustain a sense of community?
9. Are you aware of some of the external perceptions of your community/neighbourhood's identity? If so, can you describe them?
10. Does the general move to a more individualised or atomised family existence affect what people understand to be community?
11. what are your thoughts on the contribution/effects of cars to a neighbourhood’s street culture?

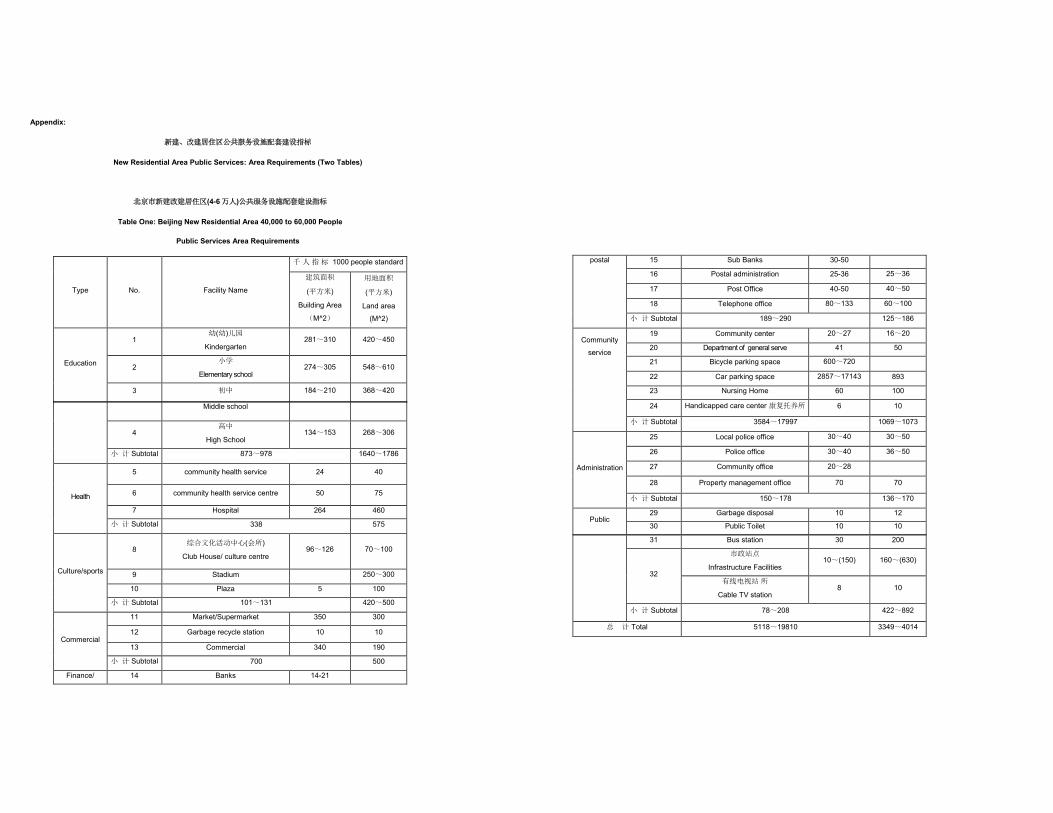
Appendix:
新建、改建居住区公共服务设施配套建设指标
New Residential Area Public Services: Area Requirements (Two Tables)
北京市新建改建居住区(4-6 万人)公共服务设施配套建设指标
Table One: Beijing New Residential Area 40,000 to 60,000 People
Public Services Area Requirements
Type No. Facility Name
千 人 指 标 1000 people standard
建筑面积
(平方米)
Building Area
(M^2)
用地面积
(平方米)
Land area
(M^2)
Education
1 幼(幼)儿园
Kindergarten 281~310 420~450
2 小学
Elementary school 274~305 548~610
3 初中 184~210 368~420
Middle school
4 高中
High School 134~153 268~306
小 计 Subtotal 873~978 1640~1786
Health
5 community health service 24 40
6 community health service centre 50 75
7 Hospital 264 460
小 计 Subtotal 338 575
Culture/sports
8 综合文化活动中心(会所)
Club House/ culture centre 96~126 70~100
9 Stadium
250~300
10 Plaza 5 100
小 计 Subtotal 101~131 420~500
Commercial
11 Market/Supermarket 350 300
12 Garbage recycle station 10 10
13 Commercial 340 190
小 计 Subtotal 700 500
Finance/ 14 Banks 14-21
postal 15 Sub Banks 30-50
16 Postal administration 25-36 25~36
17 Post Office 40-50 40~50
18 Telephone office 80~133 60~100
小 计 Subtotal 189~290 125~186
Community
service
19 Community center 20~27 16~20
20 Department of general serve 41 50
21 Bicycle parking space 600~720
22 Car parking space 2857~17143 893
23 Nursing Home 60 100
24 Handicapped care center 康复托养所 6 10
小 计 Subtotal 3584~17997 1069~1073
Administration
25 Local police office 30~40 30~50
26 Police office 30~40 36~50
27 Community office 20~28
28 Property management office 70 70
小 计 Subtotal 150~178 136~170
Public 29 Garbage disposal 10 12
30 Public Toilet 10 10
31 Bus station 30 200
32
市政站点
Infrastructure Facilities 10~(150) 160~(630)
有线电视站 所
Cable Tv station 8 10
小 计 Subtotal 78~208 422~892
总 计 Total 5118~19810 3349~4014
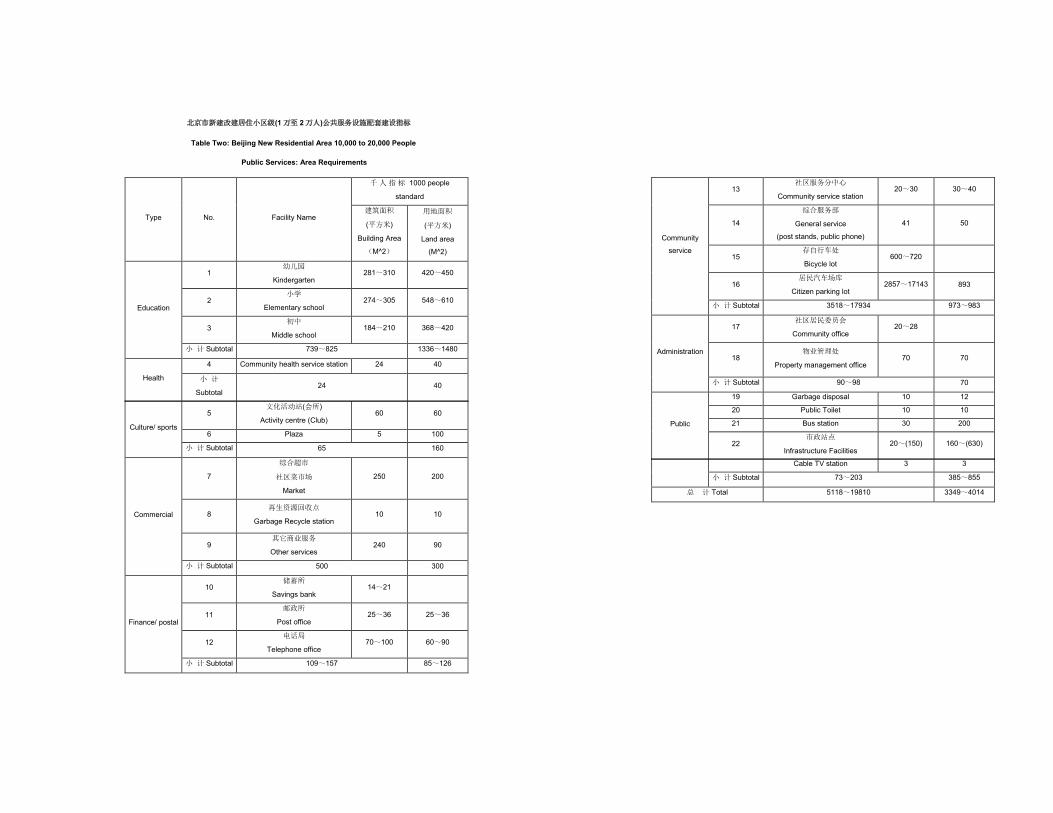
北京市新建改建居住小区级(1 万至 2 万人)公共服务设施配套建设指标
Table Two: Beijing New Residential Area 10,000 to 20,000 People
Public Services: Area Requirements
Type No. Facility Name
千 人 指 标 1000 people
standard
建筑面积
(平方米)
Building Area
(M^2)
用地面积
(平方米)
Land area
(M^2)
Education
1 幼儿园
Kindergarten 281~310 420~450
2 小学
Elementary school 274~305 548~610
3 初中
Middle school 184~210 368~420
小 计 Subtotal 739~825 1336~1480
Health
4 Community health service station 24 40
小 计
Subtotal 24 40
Culture/ sports
5 文化活动站(会所)
Activity centre (Club) 60 60
6 Plaza 5 100
小 计 Subtotal 65 160
Commercial
7
综合超市
社区菜市场
Market
250 200
8 再生资源回收点
Garbage Recycle station 10 10
9 其它商业服务
Other services 240 90
小 计 Subtotal 500 300
Finance/ postal
10 储蓄所
Savings bank 14~21
11 邮政所
Post office 25~36 25~36
12 电话局
Telephone office 70~100 60~90
小 计 Subtotal 109~157 85~126
Community
service
13 社区服务分中心
Community service station 20~30 30~40
14
综合服务部
General service
(post stands, public phone)
41 50
15 存自行车处
Bicycle lot 600~720
16 居民汽车场库
Citizen parking lot 2857~17143 893
小 计 Subtotal 3518~17934 973~983
Administration
17 社区居民委员会
Community office 20~28
18 物业管理处
Property management office 70 70
小 计 Subtotal 90~98 70
Public
19 Garbage disposal 10 12
20 Public Toilet 10 10
21 Bus station 30 200
22 市政站点
Infrastructure Facilities 20~(150) 160~(630)
Cable Tv station 3 3
小 计 Subtotal 73~203 385~855
总 计 Total 5118~19810 3349~4014

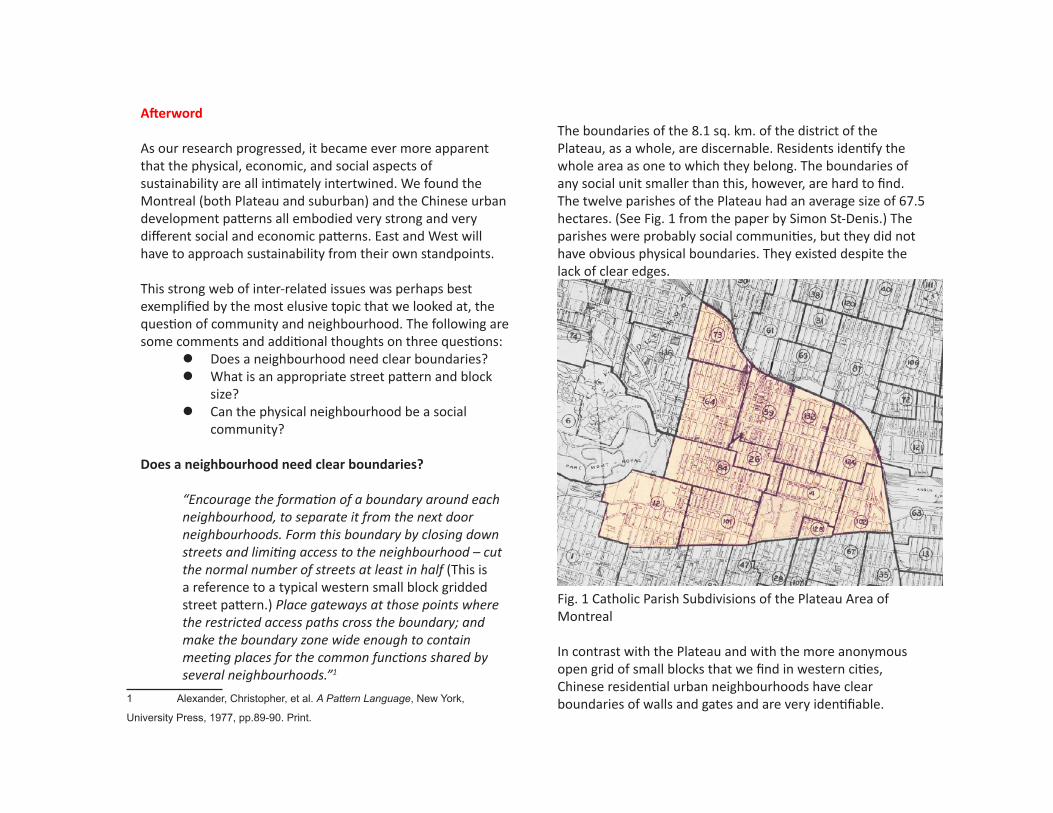
Afterword
As our research progressed, it became ever more apparent that the physical, economic, and social aspects of sustainability are all intimately intertwined. We found the Montreal (both Plateau and suburban) and the Chinese urban development patterns all embodied very strong and very different social and economic patterns. East and West will have to approach sustainability from their own standpoints.
This strong web of inter-related issues was perhaps best exemplified by the most elusive topic that we looked at, the question of community and neighbourhood. The following are some comments and additional thoughts on three questions:
Does a neighbourhood need clear boundaries? What is an appropriate street pattern and block
size? Can the physical neighbourhood be a social
community?
Does a neighbourhood need clear boundaries?
“Encourage the formation of a boundary around each neighbourhood, to separate it from the next door neighbourhoods. Form this boundary by closing down streets and limiting access to the neighbourhood – cut the normal number of streets at least in half (This is a reference to a typical western small block gridded street pattern.) Place gateways at those points where the restricted access paths cross the boundary; and make the boundary zone wide enough to contain meeting places for the common functions shared by several neighbourhoods.”1
1 Alexander, Christopher, et al. A Pattern Language, New York,
University Press, 1977, pp.89-90. Print.
The boundaries of the 8.1 sq. km. of the district of the Plateau, as a whole, are discernable. Residents identify the whole area as one to which they belong. The boundaries of any social unit smaller than this, however, are hard to find. The twelve parishes of the Plateau had an average size of 67.5 hectares. (See Fig. 1 from the paper by Simon St-Denis.) The parishes were probably social communities, but they did not have obvious physical boundaries. They existed despite the lack of clear edges.
Fig. 1 Catholic Parish Subdivisions of the Plateau Area of Montreal
In contrast with the Plateau and with the more anonymous open grid of small blocks that we find in western cities, Chinese residential urban neighbourhoods have clear boundaries of walls and gates and are very identifiable.
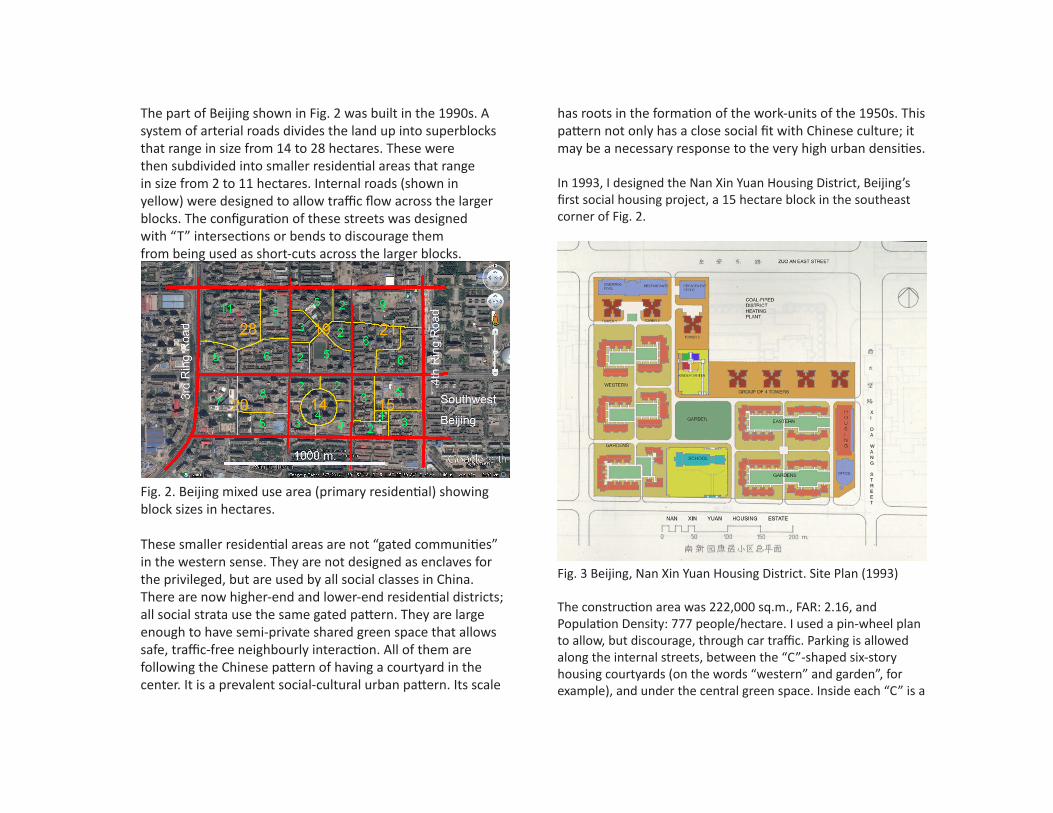
The part of Beijing shown in Fig. 2 was built in the 1990s. A system of arterial roads divides the land up into superblocks that range in size from 14 to 28 hectares. These were then subdivided into smaller residential areas that range in size from 2 to 11 hectares. Internal roads (shown in yellow) were designed to allow traffic flow across the larger blocks. The configuration of these streets was designed with “T” intersections or bends to discourage them from being used as short-cuts across the larger blocks.
Fig. 2. Beijing mixed use area (primary residential) showing block sizes in hectares.
These smaller residential areas are not “gated communities” in the western sense. They are not designed as enclaves for the privileged, but are used by all social classes in China. There are now higher-end and lower-end residential districts; all social strata use the same gated pattern. They are large enough to have semi-private shared green space that allows safe, traffic-free neighbourly interaction. All of them are following the Chinese pattern of having a courtyard in the center. It is a prevalent social-cultural urban pattern. Its scale
has roots in the formation of the work-units of the 1950s. This pattern not only has a close social fit with Chinese culture; it may be a necessary response to the very high urban densities.
In 1993, I designed the Nan Xin Yuan Housing District, Beijing’s first social housing project, a 15 hectare block in the southeast corner of Fig. 2.
Fig. 3 Beijing, Nan Xin Yuan Housing District. Site Plan (1993)
The construction area was 222,000 sq.m., FAR: 2.16, and Population Density: 777 people/hectare. I used a pin-wheel plan to allow, but discourage, through car traffic. Parking is allowed along the internal streets, between the “C”-shaped six-story housing courtyards (on the words “western” and garden”, for example), and under the central green space. Inside each “C” is a
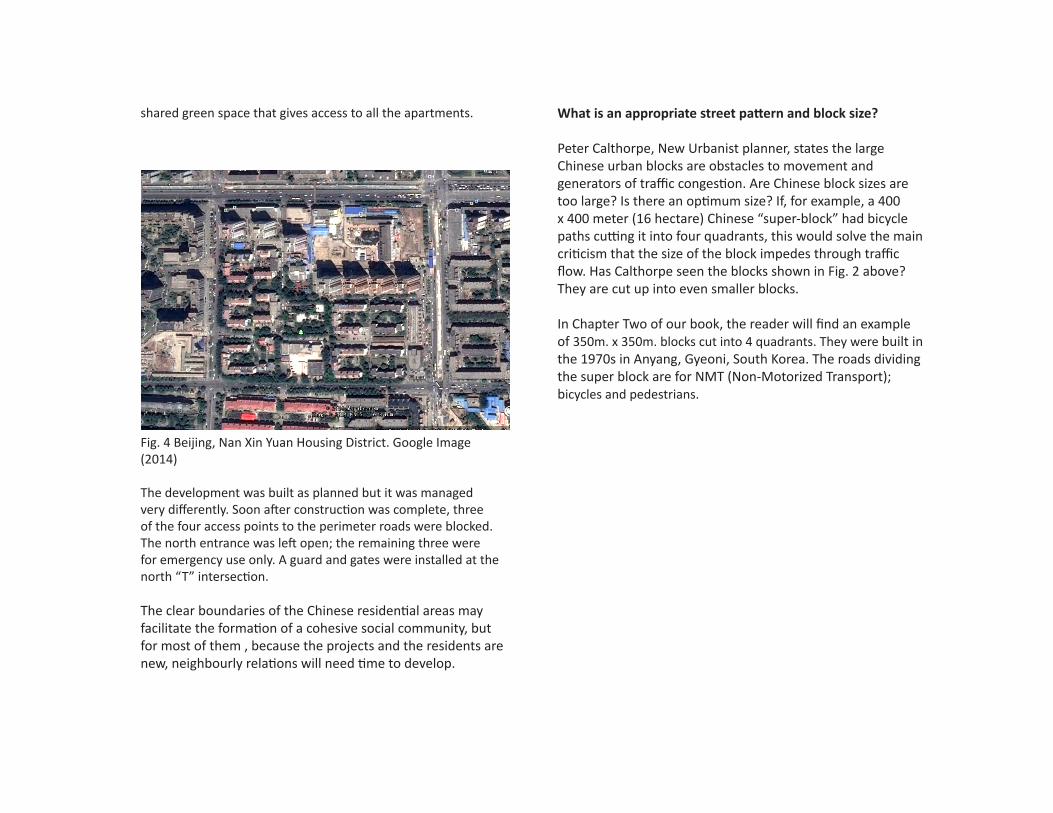
shared green space that gives access to all the apartments.
Fig. 4 Beijing, Nan Xin Yuan Housing District. Google Image (2014)
The development was built as planned but it was managed very differently. Soon after construction was complete, three of the four access points to the perimeter roads were blocked. The north entrance was left open; the remaining three were for emergency use only. A guard and gates were installed at the north “T” intersection.
The clear boundaries of the Chinese residential areas may facilitate the formation of a cohesive social community, but for most of them , because the projects and the residents are new, neighbourly relations will need time to develop.
What is an appropriate street pattern and block size?
Peter Calthorpe, New Urbanist planner, states the large Chinese urban blocks are obstacles to movement and generators of traffic congestion. Are Chinese block sizes are too large? Is there an optimum size? If, for example, a 400 x 400 meter (16 hectare) Chinese “super-block” had bicycle paths cutting it into four quadrants, this would solve the main criticism that the size of the block impedes through traffic flow. Has Calthorpe seen the blocks shown in Fig. 2 above? They are cut up into even smaller blocks.
In Chapter Two of our book, the reader will find an example of 350m. x 350m. blocks cut into 4 quadrants. They were built in the 1970s in Anyang, Gyeoni, South Korea. The roads dividing the super block are for NMT (Non-Motorized Transport); bicycles and pedestrians.
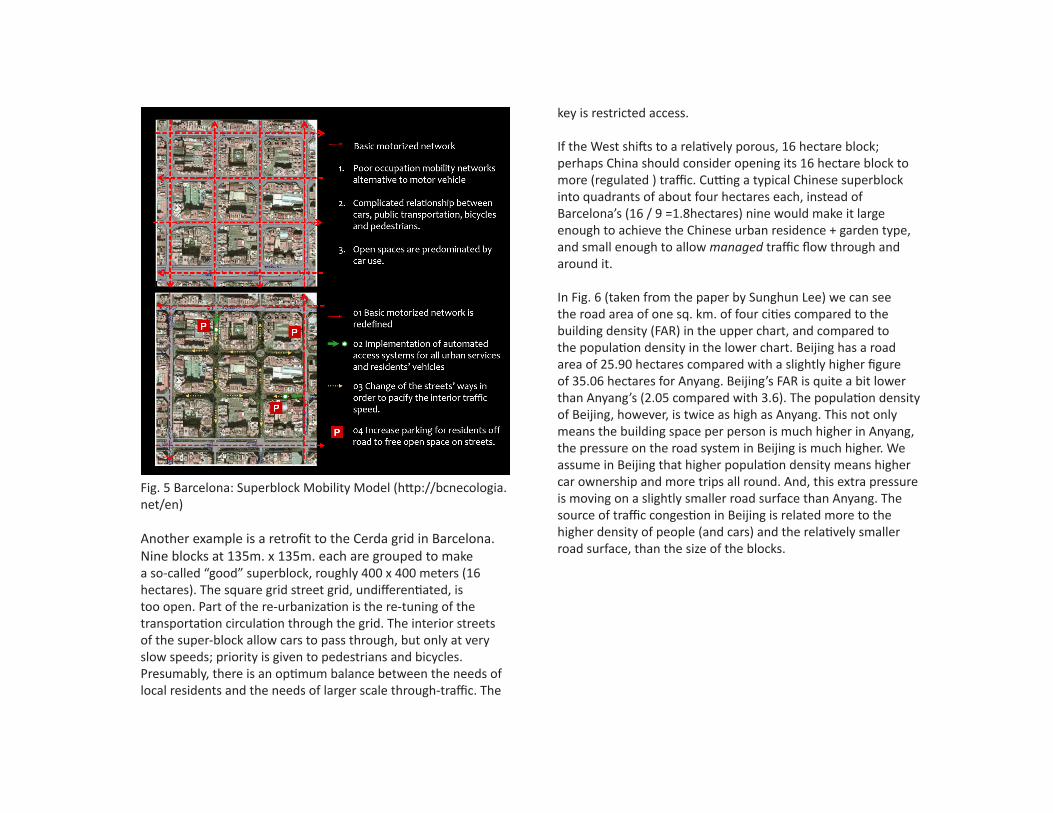
Fig. 5 Barcelona: Superblock Mobility Model (http://bcnecologia.net/en)
Another example is a retrofit to the Cerda grid in Barcelona. Nine blocks at 135m. x 135m. each are grouped to make a so-called “good” superblock, roughly 400 x 400 meters (16 hectares). The square grid street grid, undifferentiated, is too open. Part of the re-urbanization is the re-tuning of the transportation circulation through the grid. The interior streets of the super-block allow cars to pass through, but only at very slow speeds; priority is given to pedestrians and bicycles. Presumably, there is an optimum balance between the needs of local residents and the needs of larger scale through-traffic. The
key is restricted access.
If the West shifts to a relatively porous, 16 hectare block; perhaps China should consider opening its 16 hectare block to more (regulated ) traffic. Cutting a typical Chinese superblock into quadrants of about four hectares each, instead of Barcelona’s (16 / 9 =1.8hectares) nine would make it large enough to achieve the Chinese urban residence + garden type, and small enough to allow managed traffic flow through and around it.
In Fig. 6 (taken from the paper by Sunghun Lee) we can see the road area of one sq. km. of four cities compared to the building density (FAR) in the upper chart, and compared to the population density in the lower chart. Beijing has a road area of 25.90 hectares compared with a slightly higher figure of 35.06 hectares for Anyang. Beijing’s FAR is quite a bit lower than Anyang’s (2.05 compared with 3.6). The population density of Beijing, however, is twice as high as Anyang. This not only means the building space per person is much higher in Anyang, the pressure on the road system in Beijing is much higher. We assume in Beijing that higher population density means higher car ownership and more trips all round. And, this extra pressure is moving on a slightly smaller road surface than Anyang. The source of traffic congestion in Beijing is related more to the higher density of people (and cars) and the relatively smaller road surface, than the size of the blocks.
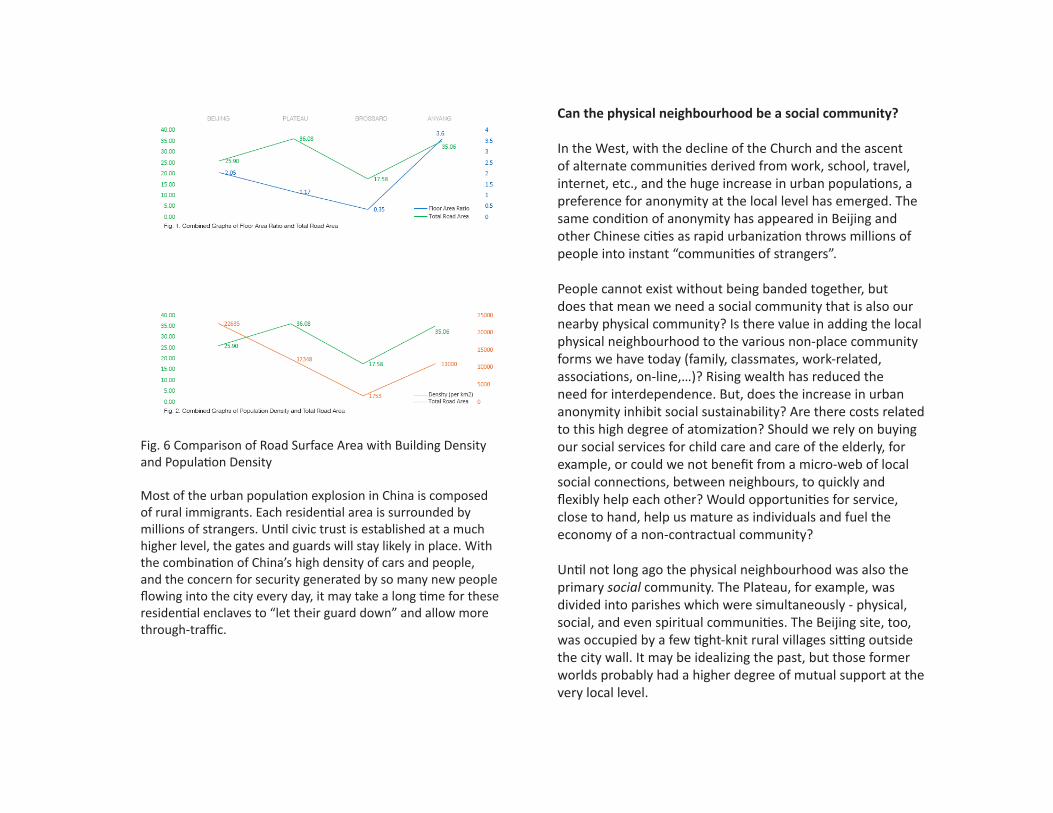
Fig. 6 Comparison of Road Surface Area with Building Density and Population Density
Most of the urban population explosion in China is composed of rural immigrants. Each residential area is surrounded by millions of strangers. Until civic trust is established at a much higher level, the gates and guards will stay likely in place. With the combination of China’s high density of cars and people, and the concern for security generated by so many new people flowing into the city every day, it may take a long time for these residential enclaves to “let their guard down” and allow more through-traffic.
Can the physical neighbourhood be a social community?
In the West, with the decline of the Church and the ascent of alternate communities derived from work, school, travel, internet, etc., and the huge increase in urban populations, a preference for anonymity at the local level has emerged. The same condition of anonymity has appeared in Beijing and other Chinese cities as rapid urbanization throws millions of people into instant “communities of strangers”.
People cannot exist without being banded together, but does that mean we need a social community that is also our nearby physical community? Is there value in adding the local physical neighbourhood to the various non-place community forms we have today (family, classmates, work-related, associations, on-line,…)? Rising wealth has reduced the need for interdependence. But, does the increase in urban anonymity inhibit social sustainability? Are there costs related to this high degree of atomization? Should we rely on buying our social services for child care and care of the elderly, for example, or could we not benefit from a micro-web of local social connections, between neighbours, to quickly and flexibly help each other? Would opportunities for service, close to hand, help us mature as individuals and fuel the economy of a non-contractual community?
Until not long ago the physical neighbourhood was also the primary social community. The Plateau, for example, was divided into parishes which were simultaneously - physical, social, and even spiritual communities. The Beijing site, too, was occupied by a few tight-knit rural villages sitting outside the city wall. It may be idealizing the past, but those former worlds probably had a higher degree of mutual support at the very local level.
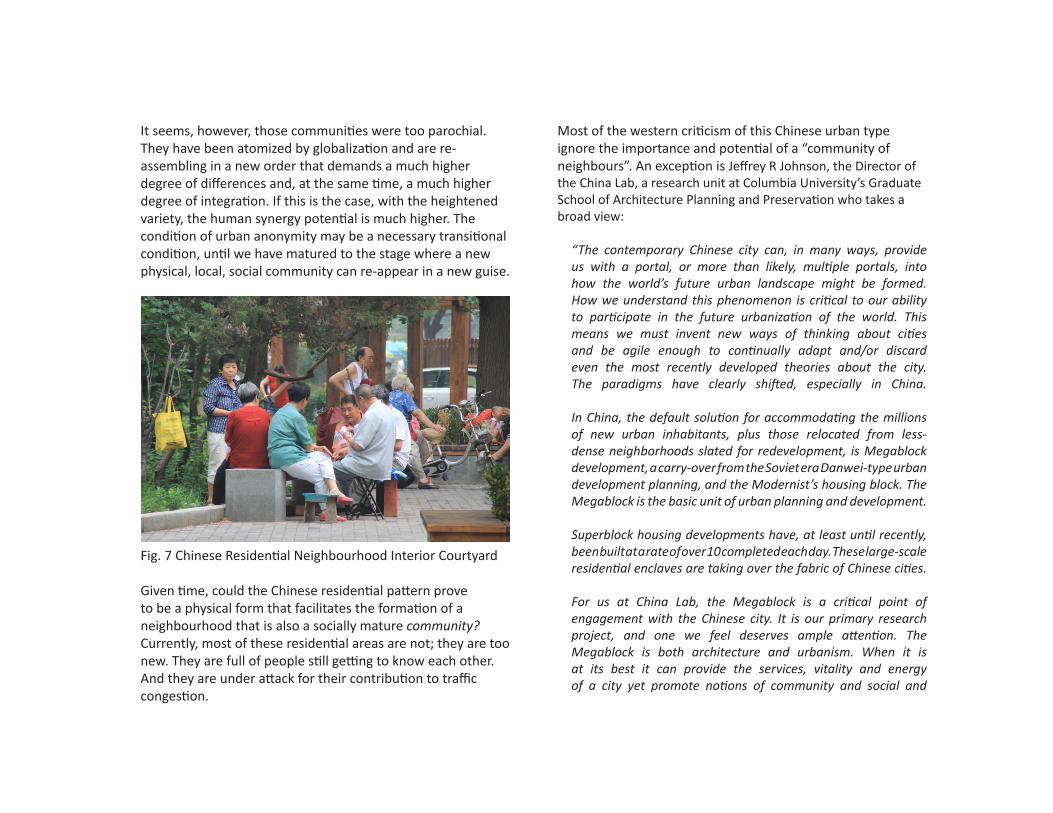
It seems, however, those communities were too parochial. They have been atomized by globalization and are re-assembling in a new order that demands a much higher degree of differences and, at the same time, a much higher degree of integration. If this is the case, with the heightened variety, the human synergy potential is much higher. The condition of urban anonymity may be a necessary transitional condition, until we have matured to the stage where a new physical, local, social community can re-appear in a new guise.
Fig. 7 Chinese Residential Neighbourhood Interior Courtyard
Given time, could the Chinese residential pattern prove to be a physical form that facilitates the formation of a neighbourhood that is also a socially mature community? Currently, most of these residential areas are not; they are too new. They are full of people still getting to know each other. And they are under attack for their contribution to traffic congestion.
Most of the western criticism of this Chinese urban type ignore the importance and potential of a “community of neighbours”. An exception is Jeffrey R Johnson, the Director of the China Lab, a research unit at Columbia University’s Graduate School of Architecture Planning and Preservation who takes a broad view:
“The contemporary Chinese city can, in many ways, provide us with a portal, or more than likely, multiple portals, into how the world’s future urban landscape might be formed. How we understand this phenomenon is critical to our ability to participate in the future urbanization of the world. This means we must invent new ways of thinking about cities and be agile enough to continually adapt and/or discard even the most recently developed theories about the city. The paradigms have clearly shifted, especially in China. In China, the default solution for accommodating the millions of new urban inhabitants, plus those relocated from less-dense neighborhoods slated for redevelopment, is Megablock development, a carry-over from the Soviet era Danwei-type urban development planning, and the Modernist’s housing block. The Megablock is the basic unit of urban planning and development. Superblock housing developments have, at least until recently, been built at a rate of over 10 completed each day. These large-scale residential enclaves are taking over the fabric of Chinese cities. For us at China Lab, the Megablock is a critical point of engagement with the Chinese city. It is our primary research project, and one we feel deserves ample attention. The Megablock is both architecture and urbanism. When it is at its best it can provide the services, vitality and energy of a city yet promote notions of community and social and
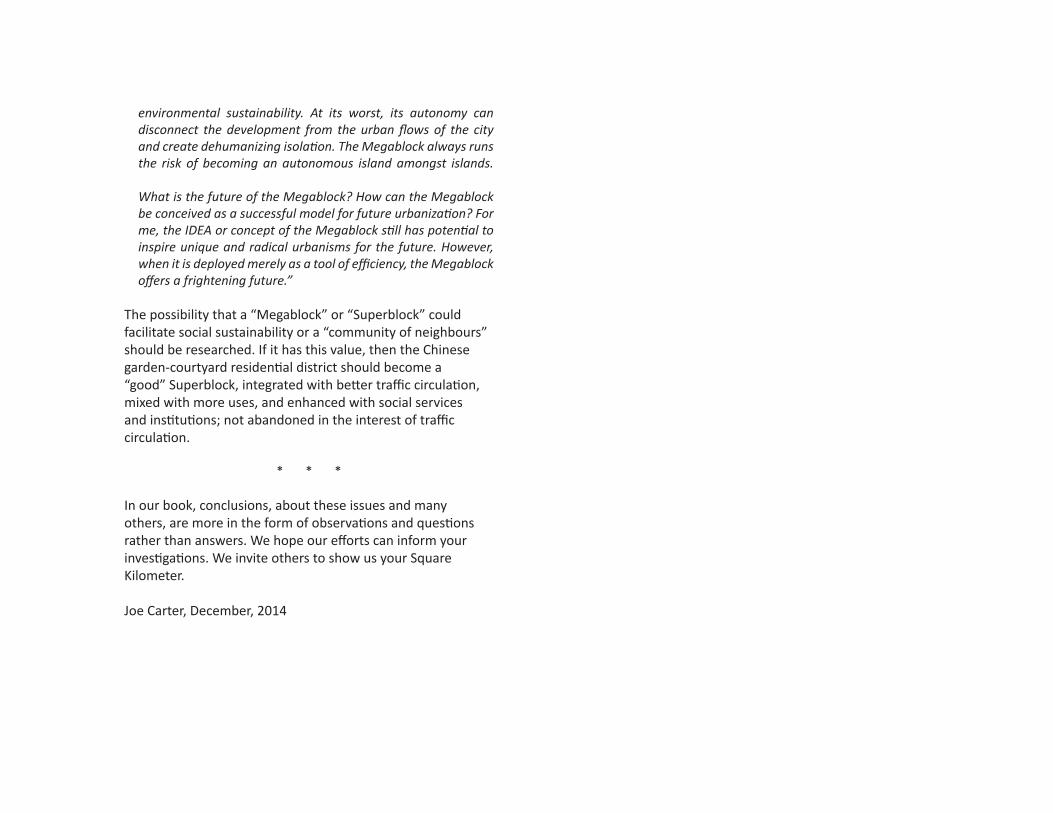
environmental sustainability. At its worst, its autonomy can disconnect the development from the urban flows of the city and create dehumanizing isolation. The Megablock always runs the risk of becoming an autonomous island amongst islands. What is the future of the Megablock? How can the Megablock be conceived as a successful model for future urbanization? For me, the IDEA or concept of the Megablock still has potential to inspire unique and radical urbanisms for the future. However, when it is deployed merely as a tool of efficiency, the Megablock offers a frightening future.”
The possibility that a “Megablock” or “Superblock” could facilitate social sustainability or a “community of neighbours” should be researched. If it has this value, then the Chinese garden-courtyard residential district should become a “good” Superblock, integrated with better traffic circulation, mixed with more uses, and enhanced with social services and institutions; not abandoned in the interest of traffic circulation.
* * *
In our book, conclusions, about these issues and many others, are more in the form of observations and questions rather than answers. We hope our efforts can inform your investigations. We invite others to show us your Square Kilometer.
Joe Carter, December, 2014

BOOK DESIGN : zHIYAO CHEN

