one diffusion and osmosis
TRANSCRIPT
ONE DIFFUSION AND OSMOSIS
OVERVIEW In this lab you will:
1. investigate the processes of diffusion and osmosis in a model membrane system, and
2. investigate the effect of solute concentration on water potential as it relates to living plant tissues.
OBJECTIVES Before doing this lab you should understand:
It the mechanisms of diffusion and osmosis and their importance to cells;
• the effects of solute size and concentration gradients on diffusion across selectively permeable membranes;
.. the effects of a selectively permeable membrane on diffusion and osmosis between two solutions separated by the membrane;
It the concept of water potential;
• the relationship between solute concentration and pressure potential and the water potential of a solution; and
.. the concept of molarity and its relationship to osmotic concentration.
After doing this lab you should be able to:
It measure the water potential of a solution in a controlled experiment;
It determine the osmotic concentration of living tissue or an unknown solution from experimental data;
It describe the effects of water gain or loss in animal and plant cells; and
.. relate osmotic potential to solute concentration and water potential.
DUCTION Many aspects of the life of a cell depend on the fact that atoms and molecules have kinetic energy and are constantly in motion. This kinetic energy causes molecules to bump into each other and move in new directions. One result of this molecular motion is the process of diffusion.
Diffusion is the random movement of molecules from an area of higher concentration of those molecules to an area of lower concentration. For example, if one were to open a bottle of hydrogen sulfide (H
2S has the odor of rotten eggs) in one corner of a room, it would not be
long before someone in the opposite corner would perceive the smell of rotten eggs. The bottle contains a higher concentration of H
2S molecules than the room does and therefore the H
2S gas
diffuses from the area of higher concentration to the area of lower concentration. Eventually, a dynamic equilibrium will be reached; the concentration of H
2S will be approximately equal
throughout the room and no net movement of H2S will occur from one area to the other.
Osmosis is a special case of diffusion. Osmosis is the diffusion of water through a selectively permeable membrane (a membrane that allows for diffusion of certain solutes and water) from a region of higher water potential to a region of lower water potential. Water potential is the measure of free energy of water in a solution.
Diffusion and osmosis do not entirely explain the movement of ions or molecules into and out of cells. One property of a living system is active transport. This process uses energy from ATP to move substances through the cell membrane. Active transport usually moves substances against a concentration gradient, from regions of low concentration of that substance into regions of higher concentration.

EXERCISE 1A: Diffusion
In this experiment you will measure diffusion of small molecules through dialysis tubing, an example of a selectively permeable membrane. Small solute molecules and water molecules can move freely through a selectively permeable membrane, but larger molecules will pass through more slowly, or perhaps not at all. The movement of a solute through a selectively permeable membrane is called dialysis. The size of the minute pores in the dialysis tubing determines which substances can pass through the membrane.
A solution of glucose and starch will be placed inside a bag of dialysis tubing. Distilled water will be placed in a beaker, outside the dialysis bag. After 30 minutes have passed, the solution inside the dialysis tubing and the solution in the beaker will be tested for glucose and starch. The presence of glucose will be tested with Benedict's solution, Testape®, or Clinistix®. The presence of starch will be tested with Lugol's solution (Iodine Potassium-Iodide, or IKI).
Procedure
1. Obtain a 30-cm piece of 2.5-cm dialysis tubing that has been soaking in water. Tie off one end of the tubing to form a bag. To open the other end of the bag, rub the end between your fingers until the edges separate.
2. Test the 15% glucose/1 % starch solution for the presence of glucose. Your teacher may have you do a Benedict's test or use glucose Testape® or Clinistix®. Record the results in Table l.l.
3. Place 15 mL of the 15% glucose/1 % starch solution in the bag. Tie off the other end of the bag, leaving sufficient space for the expansion of the contents in the bag. Record the color of the solution in Table 1.1.
4. Fill a 250-mL beaker or cup two-thirds full with distilled water. Add approximately 4 mL of Lugol' s solution to the distilled water and record the color of the solution in Table 1.1. Test this solution for glucose and record the results in Table 1.1.
S. Immerse the bag in the beaker of solution.
6. Allow your setup to stand for approximately 30 minutes or until you see a distinct color change in the bag or in the beaker. Record the final color of the solution in the bag, and of the solution in the beaker, in Table 1.1.
7. Test the liquid in the beaker and in the bag for the presence of glucose. Record the results in Table l.l.
Table 1.1
Initial Solution Color Presence of Glucose Contents Initial Final Initial Final
Bag 15% glucose & 1% starch
Beaker H20 & IKI
Analysis of Results
1. Which substance(s) are entering the bag and which are leaving the bag? What experimental evidence supports your answer?
2. Explain the results you obtained. Include the concentration differences and membrane pore size in your discussion.
3. Quantitative data uses numbers to measure observed changes. How could this experiment be modified so that quantitative data could be collected to show that water diffused into the dialysis bag?
4. Based on your observations, rank the following by relative size, beginning with the smallest: glucose molecules, water molecules, IKI molecules, membrane pores, starch molecules.

5. What results would you expect if the experiment started with a glucose and IKI solution inside the bag and only starch and water outside? Why?
EXERCISE 18: Osmosis
In this experiment you will use dialysis tubing to investigate the relationship between solute concentration and the movement of water through a selectively permeable membrane by the process of osmosis.
When two solutions have the same concentration of solutes, they are said to be isotonic to each other (iso- means same, -ton means condition, -ic means pertaining to). If the two solutions are separated by a selectively permeable membrane, water will move between the two solutions, but there will be no net change in the amount of water in either solution.
If two solutions differ in the concentration of solutes that each has, the one with more solute is hypertonic to the one with less solute (hyper- means over, or more than). The solution that has less solute is hypotonic to the one with more solute (hypo- means under, or less than). These words can only be used to compare solutions.
Now consider two solutions separated by a selectively permeable membrane. The solution that is hypertonic to the other must have more solute and therefore less water. At standard atmospheric pressure, the water potential of the hypertonic solution is less than the water potential of the hypotonic solution, so the net movement of water will be from the hypotonic solution into the hypertonic solution.
Label the sketch in Figure 1.1 to indicate which solution is hypertonic and which is hypotonic, and use arrows to show the initial net movement of water.
Figure 1.1
SemipermeableMembrane
Distilled Water

Procedure
1. Obtain six 30-cm strips of presoaked dialysis tubing.
2. Tie a knot in one end of each piece of dialysis tubing to form 6 bags. Pour approximately 15-25 mL of each of the following solutions into separate bags:
a) distilled water b) 0.2 M sucrose c) 0.4 M sucrose d) 0.6 M sucrose e) 0.8 M sucrose f) 1.0 M sucrose
Remove most of the air from each bag by drawing the dialysis bag between two fingers. Tie off the other end of the bag. Leave sufficient space for the expansion of the contents in the bag. (The solution should fill only about one-third to one-half of the piece of tubing.)
3. Rinse each bag gently with distilled water to remove any sucrose spilled during the filling.
4. Carefully blot the outside of each bag and record in Table 1.2 the initial mass of each bag, expressed in grams.
5. Place each bag in an empty 250-mL beaker or cup and label the beaker to indicate the molarity of the solution in the dialysis bag.
6. Now fill each beaker two-thirds full with distilled water. Be sure to completely submerge each bag.
7. Let them stand for 30 minutes.
8. At the end of 30 minutes remove the bags from the water. Carefully blot and determine the mass of each bag.
9. Record your group's data in Table 1.2. Obtain data from the other lab groups in your class to complete Table 1.3 on page 6.
Table 1.2: Dialysis Bag Results-Group Data
Contents In Initial Final Mass Percent Change Dialysis Bag Mass Mass Difference in Mass*
a) 0.0 M Distilled Water
b) 0.2 M Sucrose
c) 0.4 M Sucrose
d) 0.6 M Sucrose
e) O.S M Sucrose
f) 1.0 M Sucrose
* To calculate: Percent Change in Mass = Final Mass - Initial Mass
Initial Mass X 100

Table 1.3: Dialysis Bag Results-Class Data
Percent Change in Mass of Dialysis Bags Class
Group 1 Group 2 Group 3 Group 4 Group 5 Group 6 Group 7 Group 8 Total Average
0.0 M Distilled Water
0.2 M Sucrose
0.4 M Sucrose
0.6 M Sucrose
0.8 M Sucrose
1.0 M Sucrose
10. Graph the results for both your individual data and the class average on Graph 1.1. *
For this graph you will need to determine the following:
a. The independent variable: ______________ _ Use this to label the horizontal (x) axis.
b. The dependent variable: Use this to label the vertical (y) axis
1.1 Title:
* See Appendix II for information on graphing.

Analysis of Results
1. Explain the relationship between the change in mass and the molarity of sucrose within the dialysis bags.
2. Predict what would happen to the mass of each bag in this experiment if all the bags were placed in a 0.4 M sucrose solution instead of distilled water. Explain your response.
3. Why did you calculate the percent change in mass rather than simply using the change in mass?
4. A dialysis bag is filled with distilled water and then placed in a sucrose solution. The bag's initial mass is 20 g and its final mass is 18 g. Calculate the percent change of mass, showing your calculations here.

5. The sucrose solution in the beaker would have been ______ to the distilled water in the bag. (Circle the word that best completes the sentence.)
isotonic hypertonic hypotonic
EXERCISE 1C: Water Potential
In this part of the exercise you will use potato cores placed in different molar concentrations of sucrose in order to determine the water potential of potato cells. First, however, we will explore what is meant by the term "water potential."
Botanists use the term water potential when predicting the movement of water into or out of plant cells. Water potential is abbreviated by the Greek letter psi (\jf) and it has two components: a physical pressure component (pressure potential \jf ) and the effects of solutes (solute potential \jfJ P
Water potential
Pressure potential
+
+ Solute potential
Water will always move from an area of higher water potential (higher free energy; more water molecules) to an area of lower water potential (lower free energy; fewer water molecules). Water potential, then, measures the tendency of water to leave one place in favor of another place. You can picture the water diffusing "down" a water potential gradient.
Water potential is affected by two physical factors. One factor is the addition of solute which lowers the water potential. The other factor is pressure potential (physical pressure). An increase in pressure raises the water potential. By convention, the water potential of pure water at atmospheric pressure is defined as being zero (\jf = 0). For instance, it can be calculated that a O.l-M solution of sucrose at atmospheric pressure (\jf = 0) has a water potential of -2.3 bars
P due to the solute (\jf = - 2.3). *
Movement of H20 into and out of a cell is influenced by the solute potential (relative
concentration of solute) on either side of the cell membrane. If water moves out of the cell, the cell will shrink. If water moves into an animal cell, it will swell and may even burst. In plant cells, the presence of a cell wall prevents cells from bursting as water enters the cells, but pressure eventually builds up inside the cell and affects the net movement of water. As water enters a dialysis bag or a cell with a cell wall, pressure will develop inside the bag or cell as water pushes against the bag or cell wall. The pressure would cause, for example, the water to rise in an osmometer tube or increase the pressure on a cell wall. It is important to realize that water potential and solute concentration are inversely related. The addition of solutes lowers the water potential of the system. In summary, solute potential is the effect that solutes have on a solution's overall water potential.
Movement of H20 into and out of a cell is also influenced by the pressure potential (physical
pressure) on either side of the cell membrane. Water movement is directly proportional to the pressure on a system. For example, pressing on the plunger of a water-filled syringe causes the water to exit via any opening. In plant cells this physical pressure can be exerted by the cell pressing against the partially elastic cell wall. Pressure potential is usually positive in living cells; in dead xylem elements it is often negative.
* A bar is a metric measure of pressure, measured with a barometer, that is about the same as 1 atmosphere. Another measure of pressure is the megapascal (MPa). [1 MPa = 10 bars.]
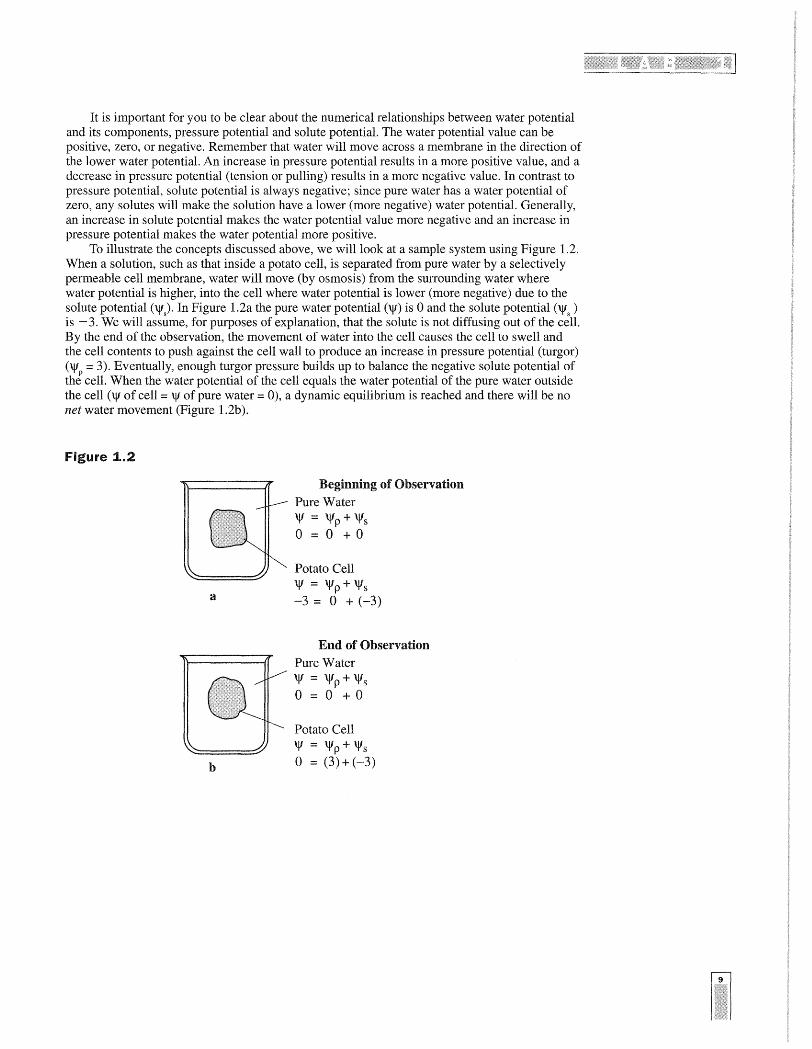
It is important for you to be clear about the numerical relationships between water potential and its components, pressure potential and solute potential. The water potential value can be positive, zero, or negative. Remember that water will move across a membrane in the direction of the lower water potential. An increase in pressure potential results in a more positive value, and a decrease in pressure potential (tension or pulling) results in a more negative value. In contrast to pressure potential, solute potential is always negative; since pure water has a water potential of zero, any solutes will make the solution have a lower (more negative) water potential. Generally, an increase in solute potential makes the water potential value more negative and an increase in pressure potential makes the water potential more positive.
To illustrate the concepts discussed above, we will look at a sample system using Figure 1.2. When a solution, such as that inside a potato cell, is separated from pure water by a selectively permeable cell membrane, water will move (by osmosis) from the surrounding water where water potential is higher, into the cell where water potential is lower (more negative) due to the solute potential (\If ). In Figure 1.2a the pure water potential (\If) is 0 and the solute potential ('" ) is -3. We will ass~me, for purposes of explanation, that the solute is not diffusing out of the c~ll. By the end of the observation, the movement of water into the cell causes the cell to swell and the cell contents to push against the cell wall to produce an increase in pressure potential (turgor) ('" = 3). Eventually, enough turgor pressure builds up to balance the negative solute potential of thl cell. When the water potential of the cell equals the water potential of the pure water outside the cell (\If of cell = '" of pure water = 0), a dynamic equilibrium is reached and there will be no net water movement (Figure 1.2b).
Figure 1.2
a
b
Beginning of Observation Pure Water
'" = "'p + "'s o = 0 + 0
Potato Cell \jI = \jIp + \jIs -3 = 0 + (-3)
End of Observation Pure Water \jI = \jIp + \jIs o = 0 + 0
Potato Cell
'" \jI p + \jI s o = (3) + (-3)

If you were to add solute to the water outside the potato cells, the water potential of the solution surrounding the cells would decrease. It is possible to add just enough solute to the water so that the water potential outside the cell is the same as the water potential inside the cell. In this case, there will be no net movement of water. This does not mean, however, that the solute concentrations inside and outside the cell are equal, because water potential inside the cell results from the combination of both pressure potential and solute potential (Figure 1.3).
figure 1.3
Solute in Water
'" = '" p + "'s -12 = 0 + (-12)
Potato Cell
'" = '" p + "'s -12 = 3 + (-15)
If enough solute is added to the water outside the cells, water will leave the cells, moving from an area of higher water potential to an area of lower water potential. The loss of water from the cells will cause the cells to lose turgor. A continued loss of water will eventually cause the cell membrane to shrink away from the cell wall (plasmolysis).
Procedure
Work in groups. You will be assigned one or more of the beaker contents listed in Table 104. For each of these, do the following:
1. Pour 100 mL of the assigned solution into a labeled 250-mL beaker. Slice a potato into discs that are approximately 3 em thick (see Figure 104).
Figure 1.4
2. Use a cork borer (approximately 5 mm in inner diameter) to cut four potato cylinders. Do not include any skin on the cylinders. You need four potato cylinders for each beaker.
3. Keep your potato cylinders in a covered beaker until it is your tum to use the balance.
4. Determine the mass of the four cylinders together and record the mass in Table 104. Put the four cylinders into the beaker of sucrose solution.
5. Cover the beaker with plastic wrap to prevent evaporation.
6. Let it stand overnight.
7. Remove the cores from the beakers, blot them gently on a paper towel, and determine their total mass.
8. Record the final mass in Table 104 and record class data in Table 1.5. Calculate the percentage change as you did in Exercise lB. Do this for both your individual results and the class average.
9. Graph both your individual data and the class average for the percentage change in mass in Table 104.

Table 1.4: Potato Core-Individual Data
Contents in Initial Final Mass Percent Class Average Percent Beaker Mass Mass Difference Change in Mass Change in Mass
a) 0.0 M Distilled Water
b) 0.2 M Sucrose
c) 0.4 M Sucrose
d) 0.6 M Sucrose
e) 0.8 M Sucrose
f) 1.0 M Sucrose
Table 1.5: Potato Core Results-Class Data
Contents Percent Change in Mass of Potato Cores in Beaker Class
Group 1 Group 2 Group 3 Group 4 Group 5 Group 6 Group 7 Group 8 Total Average
0.0 M Distilled Water
0.2 M Sucrose
0.4 M Sucrose
0.6 M Sucrose
0.8 M Sucrose
1.0 M Sucrose

Graph 1.2: Percent Change in Mass of Potato Cores at Different Molarities of Sucrose
% Increase in Mass of Potato Cores
% Decrease in Mass of Potato Cores
Sucrose Molarity within Beaker
10. Determine the molar concentration of the potato core. This would be the sucrose molarity in which the mass of the potato core does not change. To find this, follow your teacher's directions to draw the straight line on Graph 1.2 that best fits your data. The point at which this line crosses the x-axis represents the molar concentration of sucrose with a water potential that is equal to the potato tissue water potential. At this concentration there is no net gain or loss of water from the tissue. Indicate this concentration of sucrose in the space provided below.
Molar concentration of sucrose = ______ M
1.0

EXERCISE :1D: Calculation of Water Potential from Experimental Data
1. The solute potential of this sucrose solution can be calculated using the following formula:
\lis = - iCRT
where i = Ionization constant (for sucrose this is 1.0 because sucrose does not ionize in water)
C = Molar concentration (determined above)
R = Pressure constant (R = 0.0831 liter bars/mole OK)
T = Temperature OK (273 + °C of solution)
The units of measure will cancel as in the following example:
A 1.0 M sugar solution at 22°C under standard atmospheric conditions
\lis = -i X C X R X T
\lis = -(1)(1.0 mole/liter)(0.0831 liter bar/mole °K)(295 OK) \lis = -24.51 bars
2. Knowing the solute potential of the solution (\lis) and knowing that the pressure potential of the solution is zero (\II = 0) allows you to calculate the water potential of the solution. The water potential will tfe equal to the solute potential of the solution.
The water potential of the solution at equilibrium will be equal to the water potential of the potato cells. What is the water potential of the potato cells? Show your calculations here:
3. Water potential values are useful because they allow us to predict the direction of the flow of water. Recall from the discussion that water flows from an area of higher water potential to an area of lower water potential.
For the sake of discussion, suppose that a student calculates that the water potential of a solution inside a bag is -6.25 bar (\lis = -6.25, \II = 0) and the water potential of a solution surrounding the bag is -3.25 bar (\lis = -3.25, \11:=0). In which direction will the water flow?
Water will flow into the bag. This occurs because there are more solute molecules inside the bag (therefore a value further away from zero) than outside in the solution.

Questions
1. If a potato core is allowed to dehydrate by sitting in the open air, would the water potential of the potato cells decrease or increase? Why?
2. If a plant cell has a lower water potential than its surrounding environment and if pressure is equal to zero, is the cell hypertonic (in terms of solute concentration) or hypotonic to its environment? Will the cell gain water or lose water? Explain your response.
Figure 1.5
Initial Values Beaker Contents
(0.4% sucrose solution) "'s = (-)4
Dialysis Bag (with 0.1 % sucrose solution)
"'S = (-)1, "'p = 0
3. In Figure 1.5 the beaker is open to the atmosphere. What is the pressure potential ('Jfp) of the system?
4. In Figure 1.5 where is the greatest water potential? (Circle one.)
beaker dialysis bag
5. Water will diffuse _____ (circle one) the bag. Why?
into out of
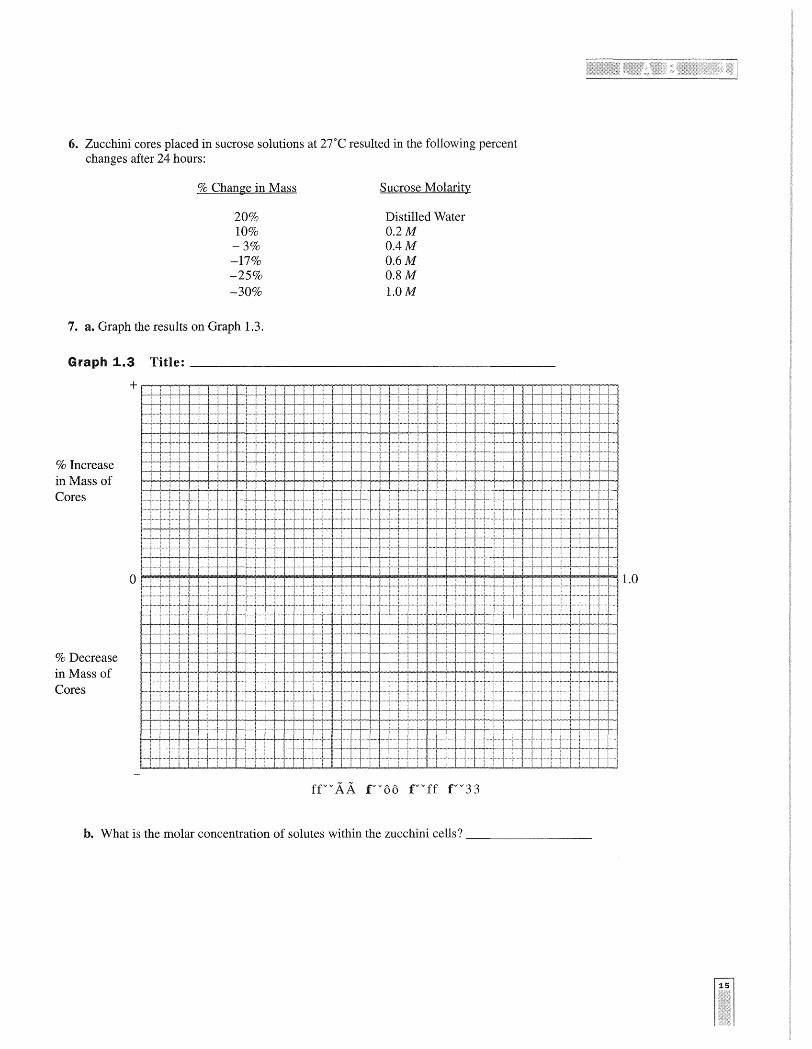
6. Zucchini cores placed in sucrose solutions at 2TC resulted in the following percent changes after 24 hours:
% Change in Mass
20% 10% -3% -17% -25% -30%
7. a. Graph the results on Graph 1.3.
Sucrose Molarity
Distilled Water O.2M OAM 0.6M 0.8M 1.0M
Graph 1.3 Title: ______________________ _
% Increase in Mass of Cores
% Decrease in Mass of Cores
+~~_r~_r~~rT~rT~_r~_r~_rrT~rT7I_,TI_r~
b. What is the molar concentration of solutes within the zucchini cells? ________ _

8. Refer to the procedure for calculating water potential from experimental data (page 13).
a. Calculate solute potential ('Vs
) of the sucrose solution in which the mass of the zucchini cores does not change. Show your work here:
b. Calculate the water potential ('V) of the solutes within the zucchini cores. Show your work here:
9. What effect does adding solute have on the solute potential component ('Vs
) of that solution?
Why?
10. Consider what would happen to a red blood cell (RBC) placed in distilled water:
a. Which would have the higher concentration of water molecules? (Circle one.)
b. Which would have the higher water potential? (Circle one.)
c. What would happen to the red blood cell? Why?

EXERCISE 1E: Onion Cell Plasmolysis
Plasmolysis is the shrinking of the cytoplasm of a plant cell in response to diffusion of water out of the cell and into a hypertonic solution (high solute concentration) surrounding the cell as shown in Figure 1.6. During plasmolysis the cellular membrane pulls away from the cell wall. In the next lab exercise you will examine the details of the effects of highly concentrated solutions on diffusion and cellular contents.
Figure 1.6
Hypotonic Solution
Procedure
Cell Wall
Cytoplasm
Isotonic Solution Hypertonic Solution
1. Prepare a wet mount of a small piece of the epidermis of an onion. Observe under 100X magnification. Sketch and describe the appearance of the onion cells.
2. Add 2 or 3 drops of 15% NaCl to one edge of the cover slip. Draw this salt solution across the slide by touching a piece of paper towel to the fluid under the opposite edge of the cover slip. Sketch and describe the onion cells. Explain what has happened.
3. Remove the cover slip and flood the onion epidermis with fresh water. Observe under 100X. Describe and explain what happened.
Analysis of Results
1. What is plasmolysis?
2. Why did the onion cells plasmolyze?
3. In the winter, grass often dies near roads that have been salted to remove ice. What causes this to happen?